
Multi-Scale Wake Characteristics of the Flow over a Cylinder with Different V-Groove Numbers
School of Mechanical Engineering, Jiangsu University of Science and Technology, Zhenjiang 212000, China
*
Authors to whom correspondence should be addressed.
Water 2023, 15(4), 805; https://doi.org/10.3390/w15040805
Submission received: 17 January 2023
/
Revised: 14 February 2023
/
Accepted: 15 February 2023
/
Published: 18 February 2023
(This article belongs to the Section Hydraulics and Hydrodynamics)
Abstract
:The near-wake structure resulting from the interaction between the water and the cylinder is researched. The wake characteristics for the smooth cylinder and the cylinder with different numbers of grooves are measured by high-speed particle image velocimetry (PIV) at a Reynolds number of 7400. From the measured data, it is observed that the v-groove increases the Reynolds shear stress and the turbulent kinetic energy; thus, the formation of the Karman-like vortices is prevented and the recirculation region is reduced. The number of grooves has a limited effect on the wake characteristics. In addition, a one-dimensional orthogonal wavelet decomposes the fluctuation velocities in the cylindrical wake region to study the multi-scale wake characteristics behind the v-groove cylinders. The large-scale structures show that the Karman-like vortices of the grooved cylinder are closer to the trailing edge of the cylinder. The intermediate-scale structures show more vortices behind the 32-groove cylinder. The small-scale structures show that the phase difference between the upper and lower oscillation positions has become smaller. Meanwhile, the large-, intermediate- and small-scale Reynolds shear stress distributions suggest that the shear layer instability in the near-wake region creates vortices, which increase the turbulent kinetic energy and narrow the wake region.
1. Introduction
Flow-around cylinders are commonly found in nature and marine engineering projects such as marine risers, offshore pipelines, and tension leg platforms. In order to provide a detailed description of the wake characteristics of cylinders with different roughnesses, it is necessary to compare their multi-scale wake characteristics with different v-groove numbers. Therefore, it is highly desirable to investigate the wake characteristics of cylinders with different surface roughnesses.
Microgrooves not only reduce the drag force but also hinder the growth of parasites such as algae and barnacles. In contrast to rigid splitter plates [1,2], helical strakes [3], and wavy surfaces [4], grooves have been the most effective and commonly used eddy suppression devices in the past. Some studies on longitudinal-grooved cylinders are summarized in Table 1, where h/d is the ratio between the groove depth (h) and the cylinder diameter (d), N is the number of grooves, and Re is the Reynolds number. Ying et al. [5] investigated the wake characteristics of the Saguaro cacti. The results indicate that the v-groove cavity delays the formation of eddy current shedding and its depth affects the drag force. Yamagishi and Oki [6] numerically analyzed the mean drag coefficient and pressure distribution to compare the drag force, which was measured using a hot-wire anemometer. The results showed that the drag force decreases at a lower Reynolds number due to an increased number of grooves. In addition, the drag reduction performance of the number and depth of the grooves was tested using the cross-flow experimental approach [7]. It was found that the minimum drag coefficient decreases with the increase in the grooved area. The influence of the depth of the grooves on the wake region was recently studied by our team [8]. However, these previous studies only studied the resistance reduction performance for different groove areas and did not perform a mechanical analysis of the v-groove cylinder wake region. For the flow around the cylinder, the wake is susceptible to vortex shedding, the three-dimensional wake transition, and the selected wake characteristics. Whilliamson [9] proved that the instability of the vortex-forming region is the reason the flow becomes turbulent and three-dimensional. NaghibLahouti [10] found that the secondary wake flow instability is influenced not only by the structure but also by the Reynolds number. Arnab [11] inspected both planar and span-wise shear flows and found a delay in the laminar–turbulent transition for the span-wise shear flow. This paper will further analyze the characteristics of cylinders with varying numbers of v-grooves in the wake region. As turbulence is always a multi-scale signal, the multi-scale wake characteristics of the circular cylinder with a v-groove need to be analyzed.
Additionally, it is important to observe the statistical characteristics of each characteristic at the appropriate scale. Wavelet transform has been widely used in turbulence research because it allows the analysis of turbulence signals at various scales. For example, wavelet transform was used to extract the position characteristics and conduct a statistical turbulence analysis of channel wake [14]. A discrete wavelet basis matrix was obtained through the orthogonal discrete wavelet transformation and the wake vortex structure of the flow around a cylinder was analyzed using this technology [15]. In addition, wavelet analysis has provided a potent tool for extracting multi-scale structures and measuring the in-plane flow hiatus. A turbulent structure was divided into subsets related to the turbulence scale using 1D and 2D wavelet multiresolution techniques [16]. Recently, the power spectrum of the flow velocity was decomposed into different scales based on its central frequency. Then, three wavelet components were chosen to represent the small, intermediate, and large scales [17]. As discussed above, the orthogonal wavelet decomposition can extract coherent structures at different vortex-shedding frequencies. It should be applied to extract mainly vortex-shedding frequencies and compare the variations in the wake characteristics between smooth and v-groove surfaces.
This study aims to measure the flow-field velocities in the stream-wise and span-wise planes of a smooth cylinder and a v-groove cylinder with varying numbers of grooves using particle image velocimetry (PIV) technology. This study focuses on using a one-dimensional orthogonal wavelet to extract coherent structures at different vortex-shedding frequencies, and the multi-scale turbulent structures of the smooth and 32-groove cylinders are investigated in terms of vorticity and Reynolds shear stress.
2. Experimental Methods
2.1. Experimental Models
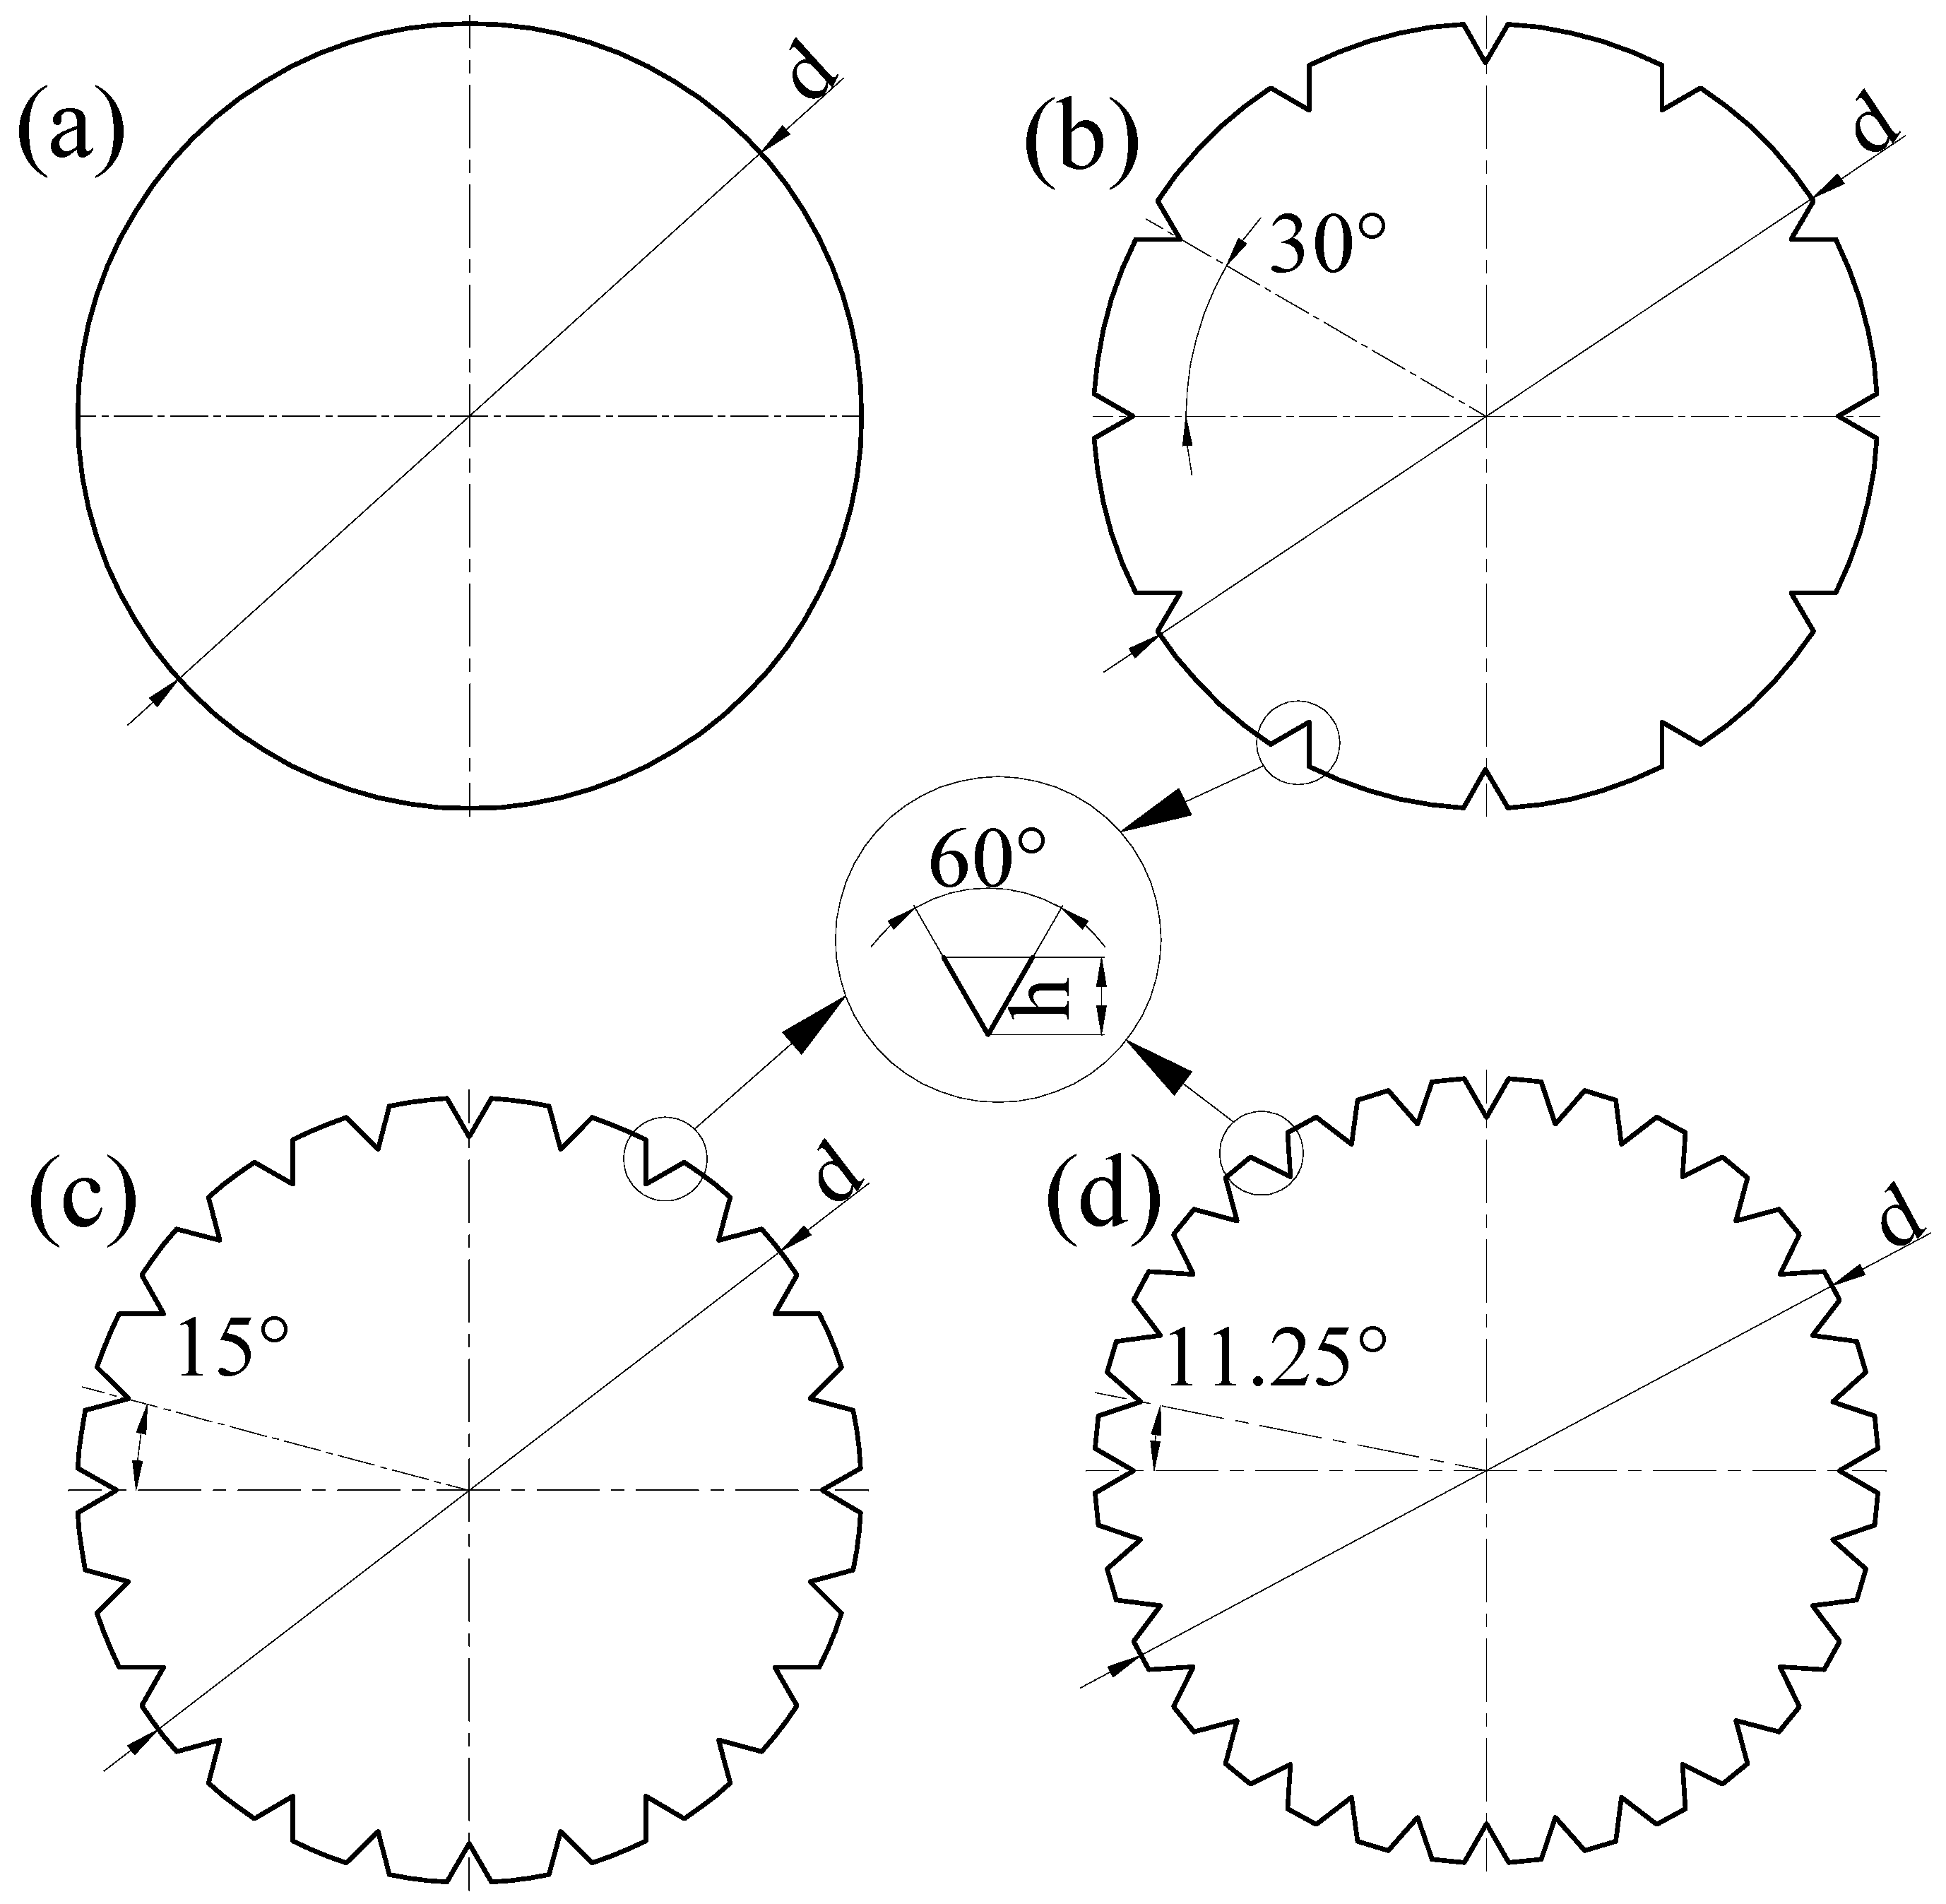
Figure 1 shows the experimental model, which was made of PVC material. Figure 1a shows the smooth cylinder with a diameter (d) of 20mm and a length of L = 300 mm. Figure 1b–d show the 12-, 24-, and 32-groove cylinders, respectively, which were placed evenly at 30°, 15°, and 11.25° intervals along the surface of the cylinder. The angle of each groove was 60°. These cylinders were selected based on the mean drag coefficient [7], which showed that the drag force decreased at a lower Reynolds number due to the increased number of grooves. Furthermore, the groove depth was selected according to Qi [10], which indicated that the v-groove with a large h/d = 0.05 yielded a more significant drag reduction rate of 34.4%.
2.2. High-Speed PIV Measurement
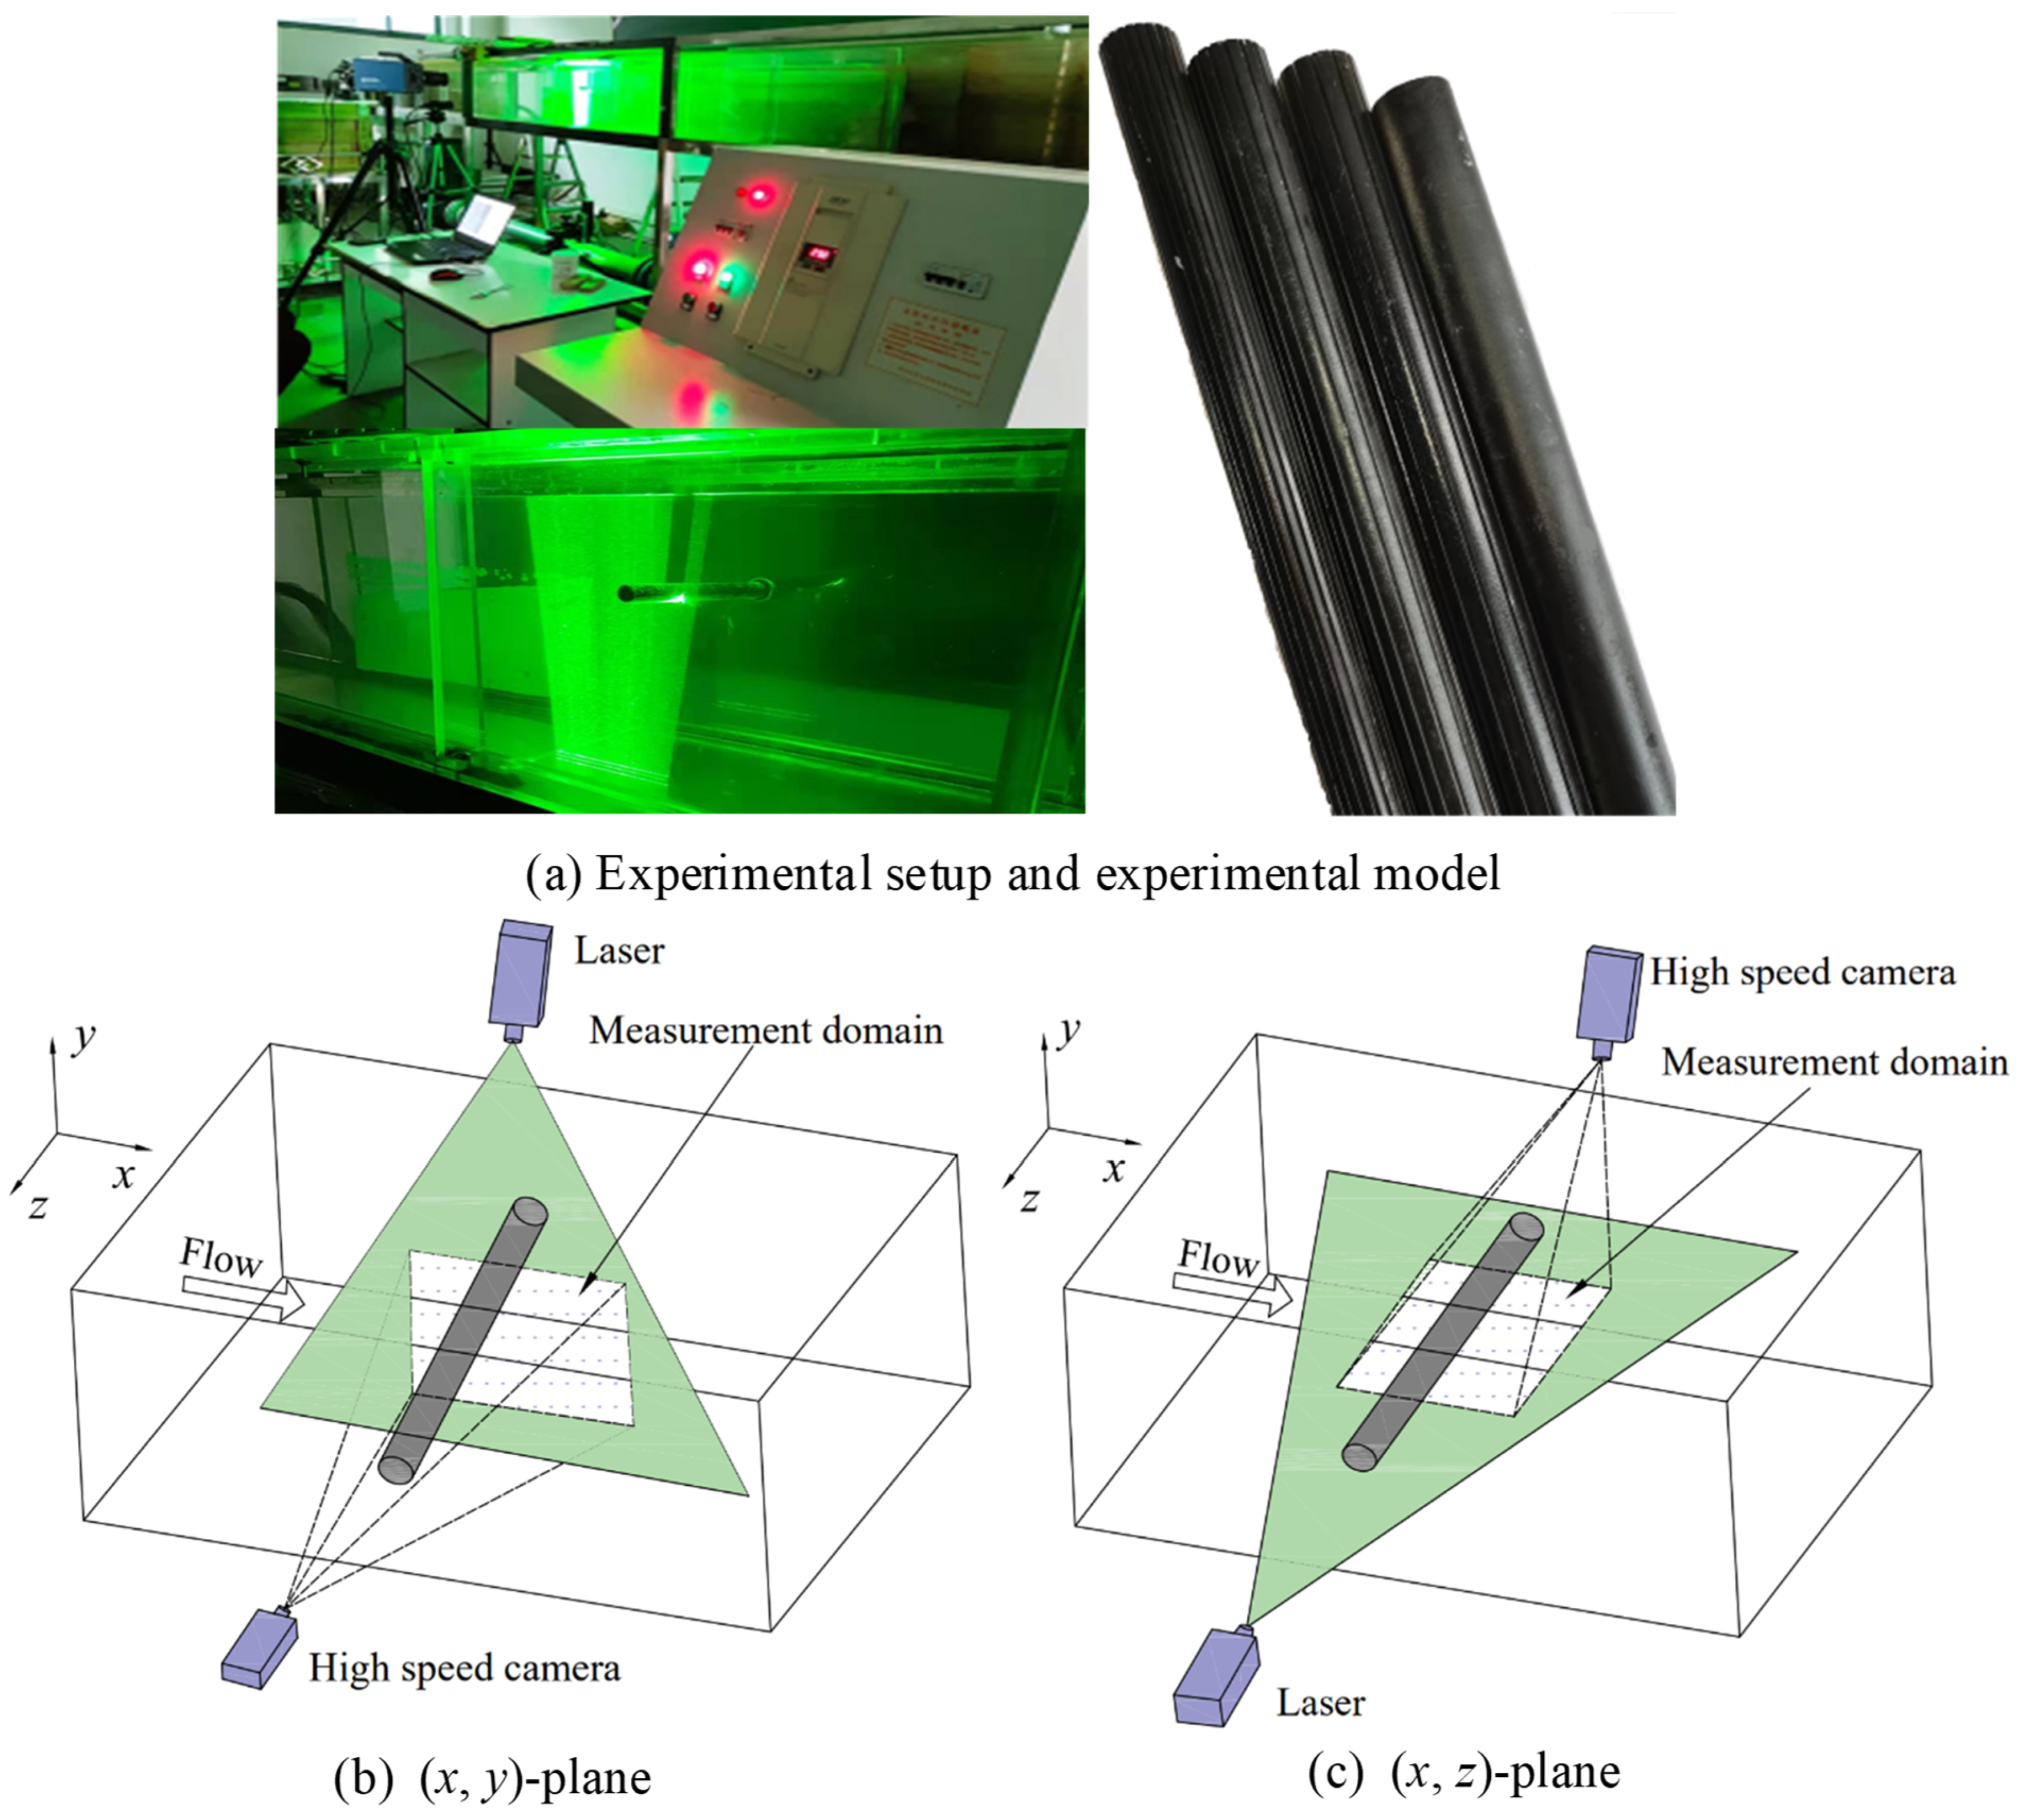
The experimental setup is shown in Figure 2a. The velocity fields of the four models were measured using particle image velocimetry (PIV). The experimental model was placed in the middle depth of the channel and its length was equal to the width of the aqueduct. The test section of the water channel was 0.3 m × 0.4 m × 1 m (width × height × length) and its wall thickness was 0.01 m. The two side walls of the circulating water channel were transparent glass plates to allow for laser illumination and visual assessment of the PIV measurements. A rectifier grid was fitted before the test section to ensure flow homogeneity. The free-stream turbulence intensity was less than 0.5%. The water flow velocity () in each case was recorded by a flow meter and calculated for the test section (where Q = 160 m3/h is the flow quantity and S = 0.12 m2 is the area of the cross-section). The free-stream velocity was fixed () in the PIV experiment corresponding to a Reynolds number of Re = 7400 based on the experimental model.
In addition, the high-speed camera used in this study (PCO.dimax S1) had a maximum spatial resolution of 1008 × 1008 pixels and a full frame rate of 4000 fps. Silica particles with diameters of 5–20µm were used as the PIV tracers in the flow loop. The laser sheet had an output power of 2 w, a wavelength of 532 nm, and a thickness of 1.0 mm. A Nikkor 2485 mm f/2.8 lens was used, and the interval between two consecutive images was 0.5 ms. The instantaneous velocity vector field was generated using the cross-correlation technique of MicroVec PIV, with an interrogation window size of 32 × 32 pixels, a calculated step size of 8×8 pixels, and a spatial resolution of the velocity vectors of about 1.4 mm.
2.3. Orthogonal Wavelet Multi-Resolution Procedure
The instantaneous horizontal (), longitudinal (), and wall-normal () velocities in the directions were divided into mean and fluctuating parts as follows:
where and are the time-averaged and fluctuating velocities in the location of The length of is The wavelet coefficient matrix (S), composed of N−3 different wavelet coefficient components (), can be written as:
The wavelet analysis matrix can be obtained through where and are the wavelet basis matrix and permutation matrices. The matrix M is based on a Daubechies wavelet basis matrix of order 8. The level 1 wavelet component (minimum frequency) is constructed by the low-frequency coefficients and written as , whereas the level 2 wavelet component is constructed by the high-frequency coefficients and is written as .
According to the frequency characteristics of each coefficient component in the wavelet coefficient matrix, we decomposed the wavelet coefficients into the sum of the various components and reconstructed each component as:
Here, the first term to the eighth term represent the wavelet component levels 1 to 8. It is clear that the fluctuation velocity is equal to the sum of all wavelet components.
3. Experimental Results and Discussion
3.1. Profiles of Mean Velocity
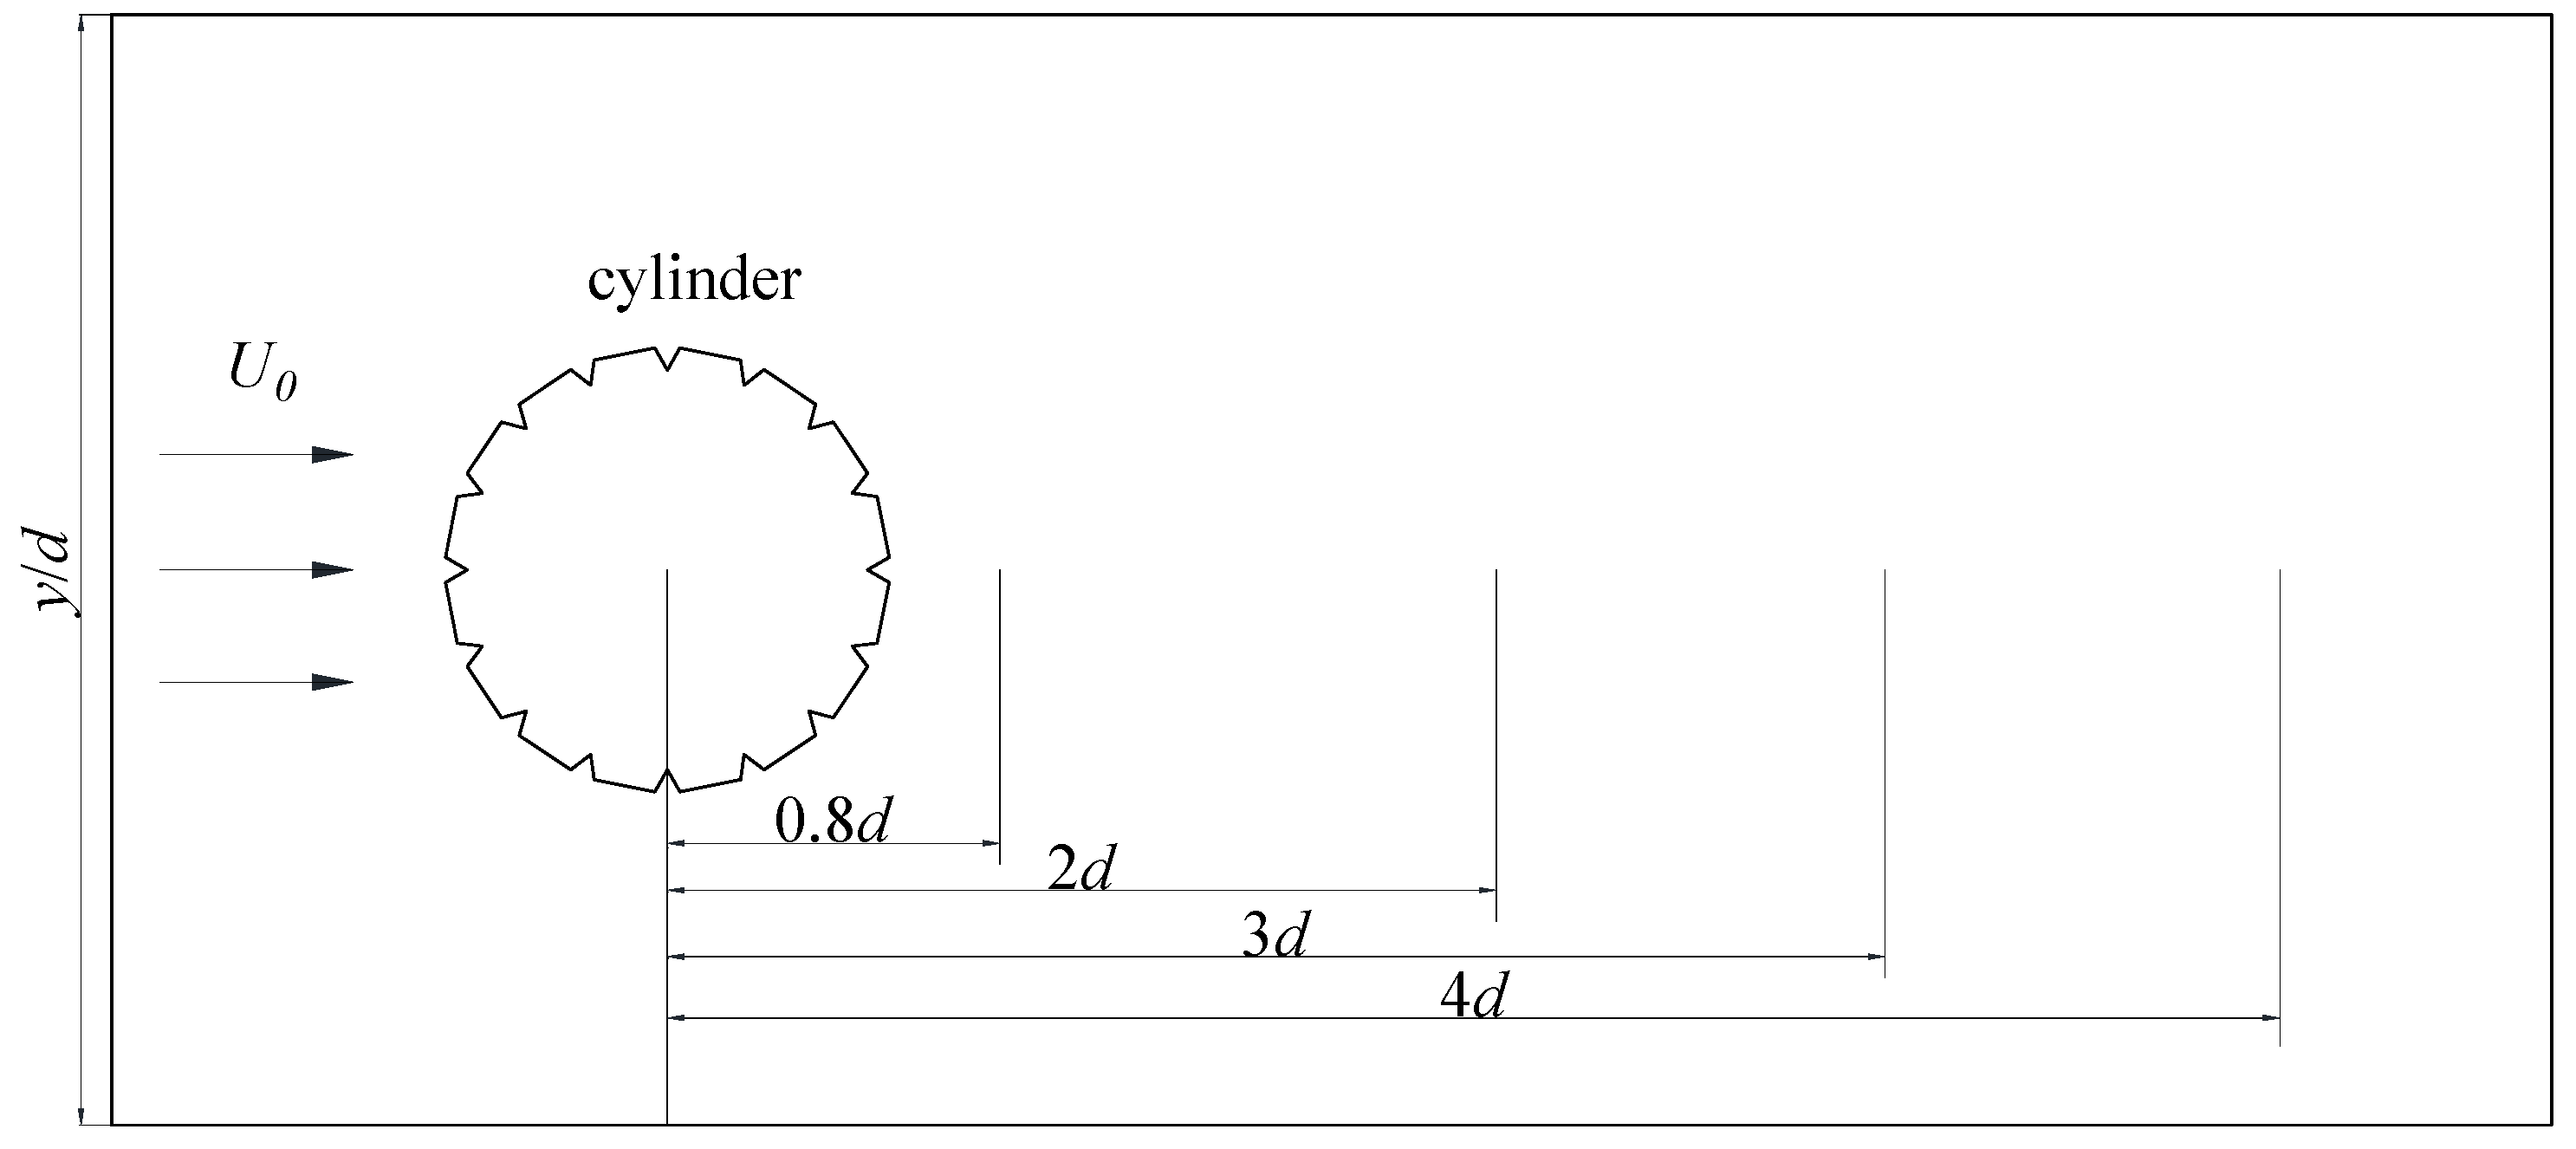
Figure 3 illustrates the four extraction positions (x/d = 0.8, 2.0, 3.0, and 4.0) for the time-averaged stream-wise velocity profiles. Half of the time-averaged velocity is plotted in the (x, y)-plane due to its symmetric distribution about the center line of y/d= 0.
Figure 4 plots the time-averaged stream-wise velocity profiles of the smooth, 12-groove, 24-groove, and 32-groove cylinders in the (x, y)-plane at four locations (x/d = 0.8, 2.0, 3.0, and 4.0). Note the change in the velocity distribution in the wake from ‘U’ to ‘V.’ The velocity distributions at the four locations clearly express the velocity variations in the wake region.
At the location of x/d = 0.8 (Figure 4a), the velocity gradient of the smooth cylinder is more significant than that of the three grooved cylinders. The velocity profiles in the y-direction can be divided into reflux, shear-velocity, and stable sections. The reflux section is part of and the stable section is where the velocity gradients are nearly zero. Furthermore, the shear-velocity section is the transition between the low- and high-speed parts. The widths of the stable sections of the four cases are the same. The widths of the reflux sections of the three grooved cylinders are reduced. This indicates that the surface of the v-groove reduces the reflux section.
At x/d = 2.0 (Figure 4b) and x/d = 3.0 (Figure 4c), the velocity profiles in the y-direction can be divided into shear and stable sections. The velocity gradients in the shear-velocity section become more prominent as the number of grooves increases. Further downstream at the location of x/d = 4 (Figure 4d), the four cylinders have the same flow velocities in the far-wake region. The v-groove shape and number do not affect the wake in the far-flow-field region.
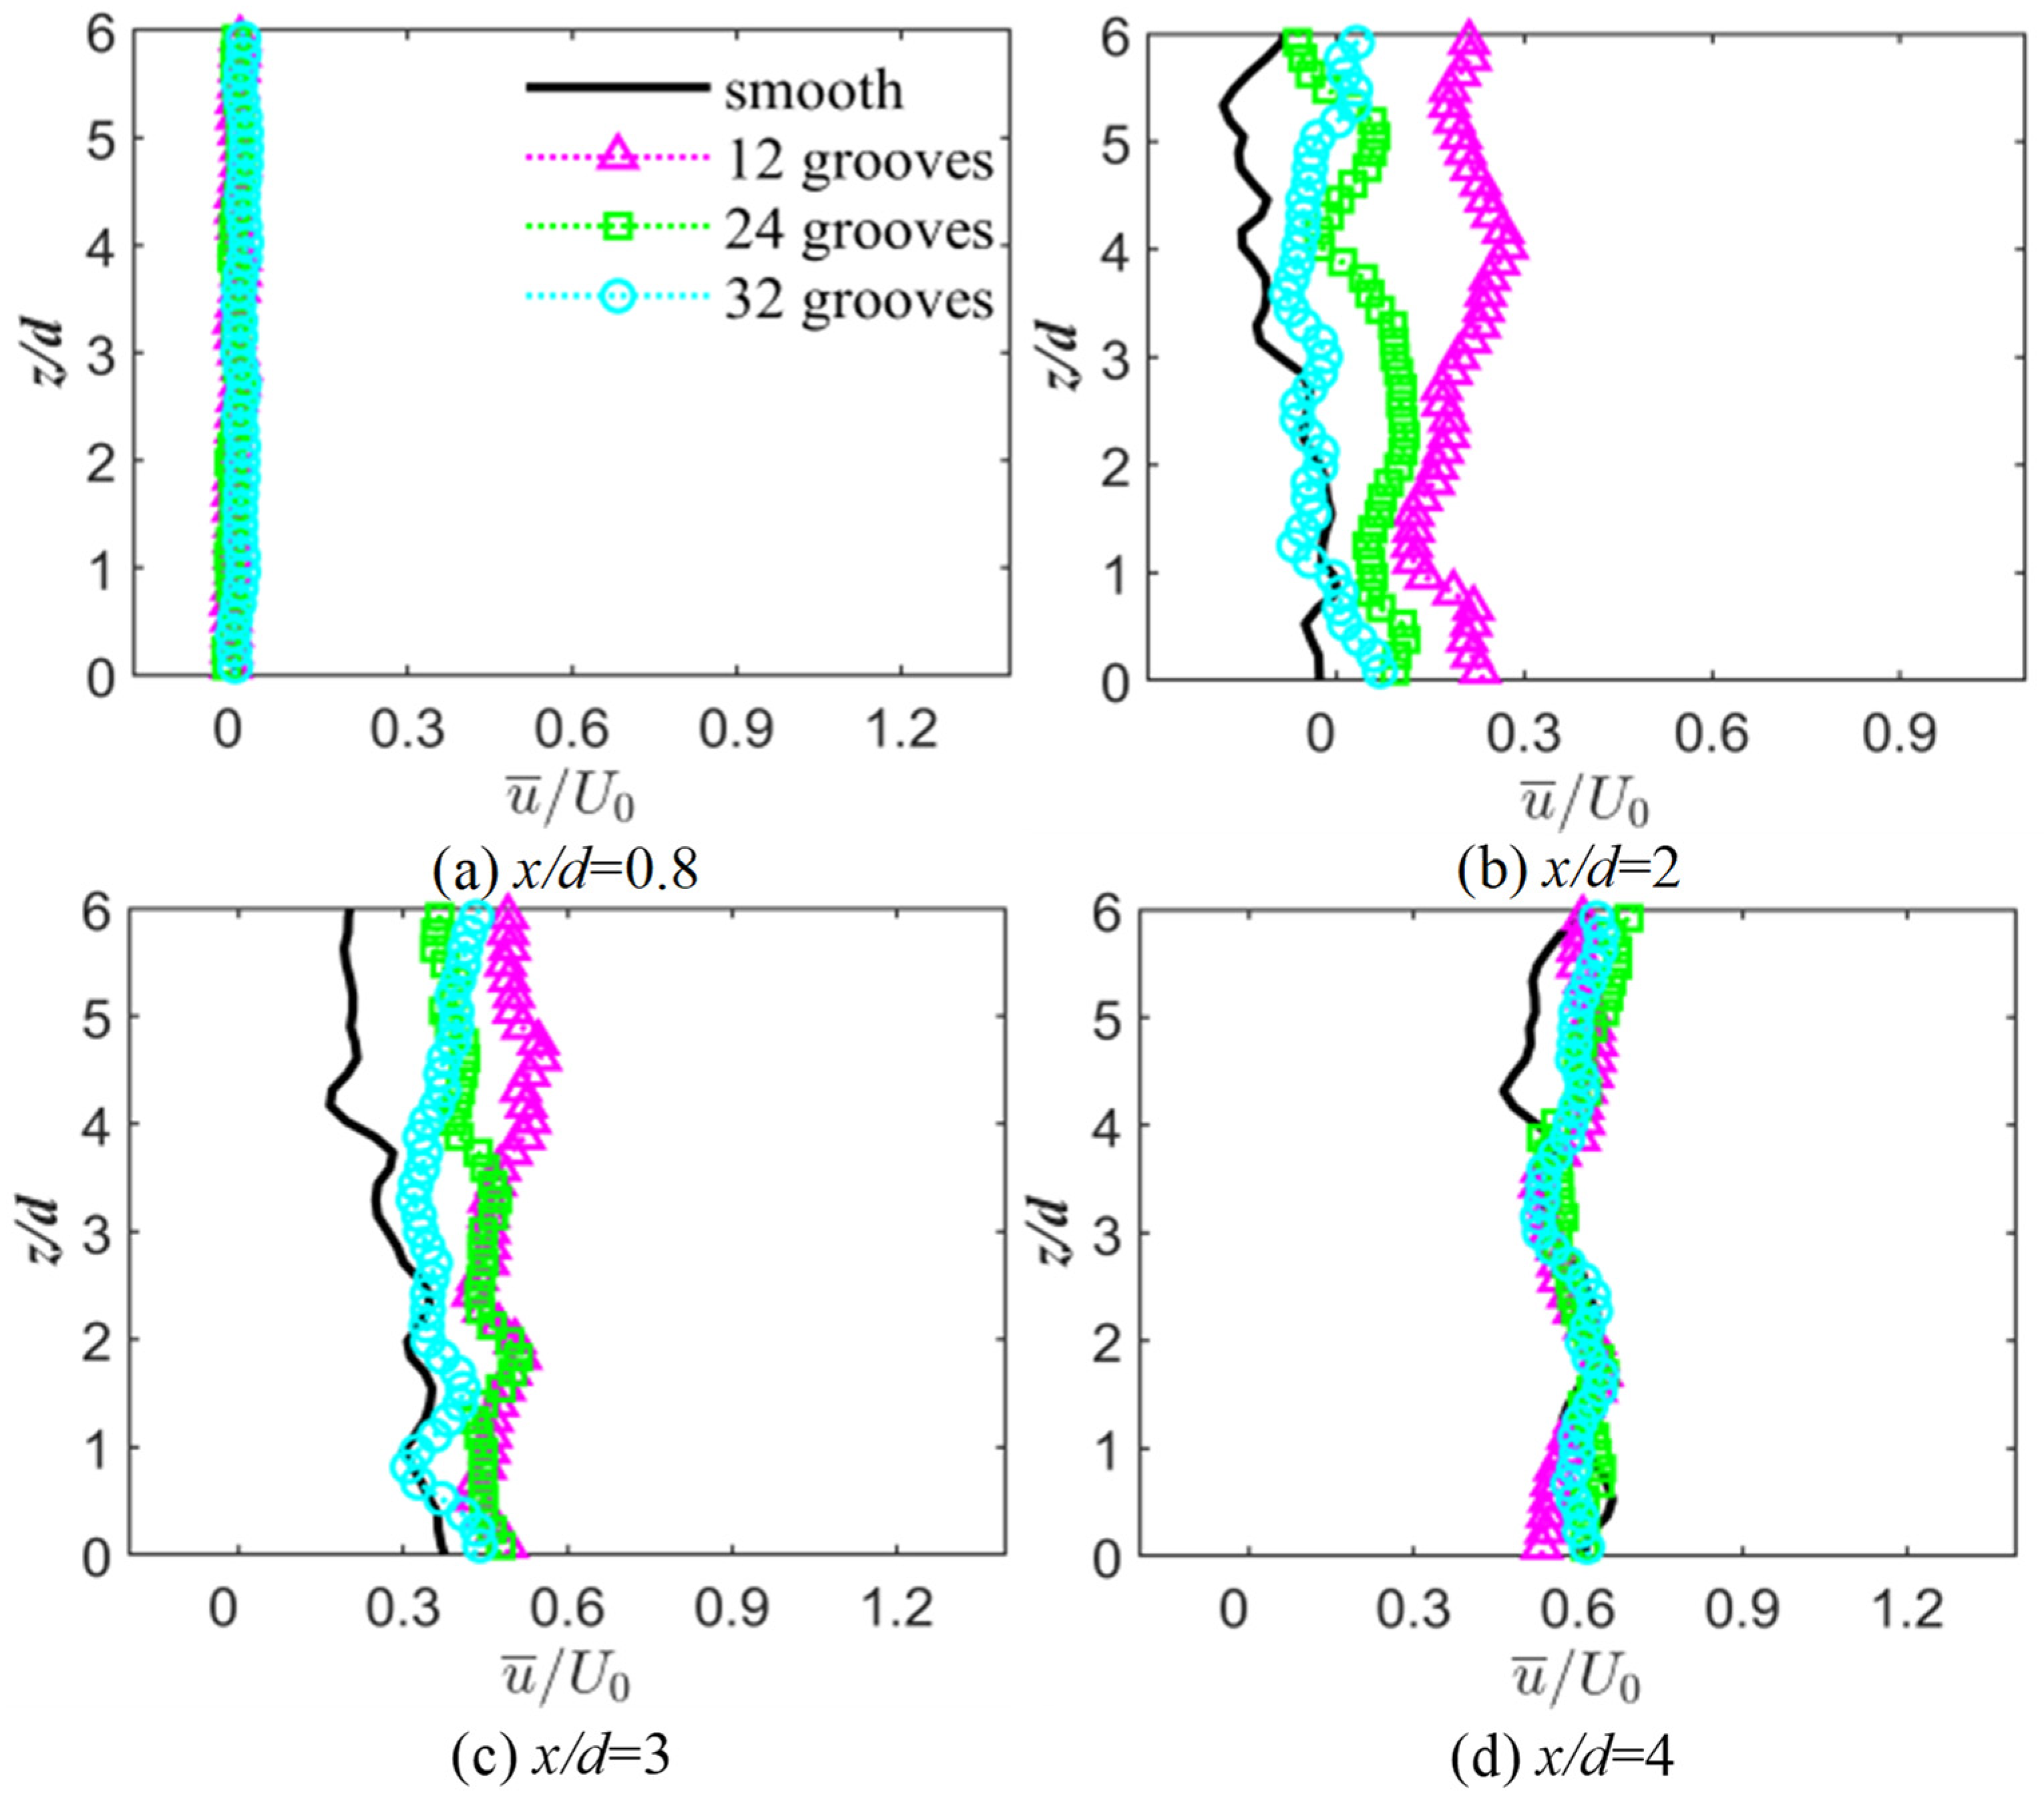
The velocity profile in the (x, z)-plane (Figure 5) indicates the velocity fluctuations in the z-direction. At x/d=0.8, the velocity of the smooth cylinder is equal to the velocity of the three v-groove cylinders, all with . It is worth noting that the velocity profile has a certain velocity fluctuation in the direction of spreading, which is irregular. Downstream at x/d = 4, of the four different cylinders are all about 0.5, which is equal to the flow speed, indicating that the v-groove cylinders did not affect the far-wake region.
The results of the time-averaged velocity profile show that the v-groove can reduce the width of the reflux section and the velocity gradient. In addition, it is important to compare the recirculation regions of the smooth and the v-groove cylinders according to the streamlines.
3.2. Time-Averaged Streamlines and Recirculation Region
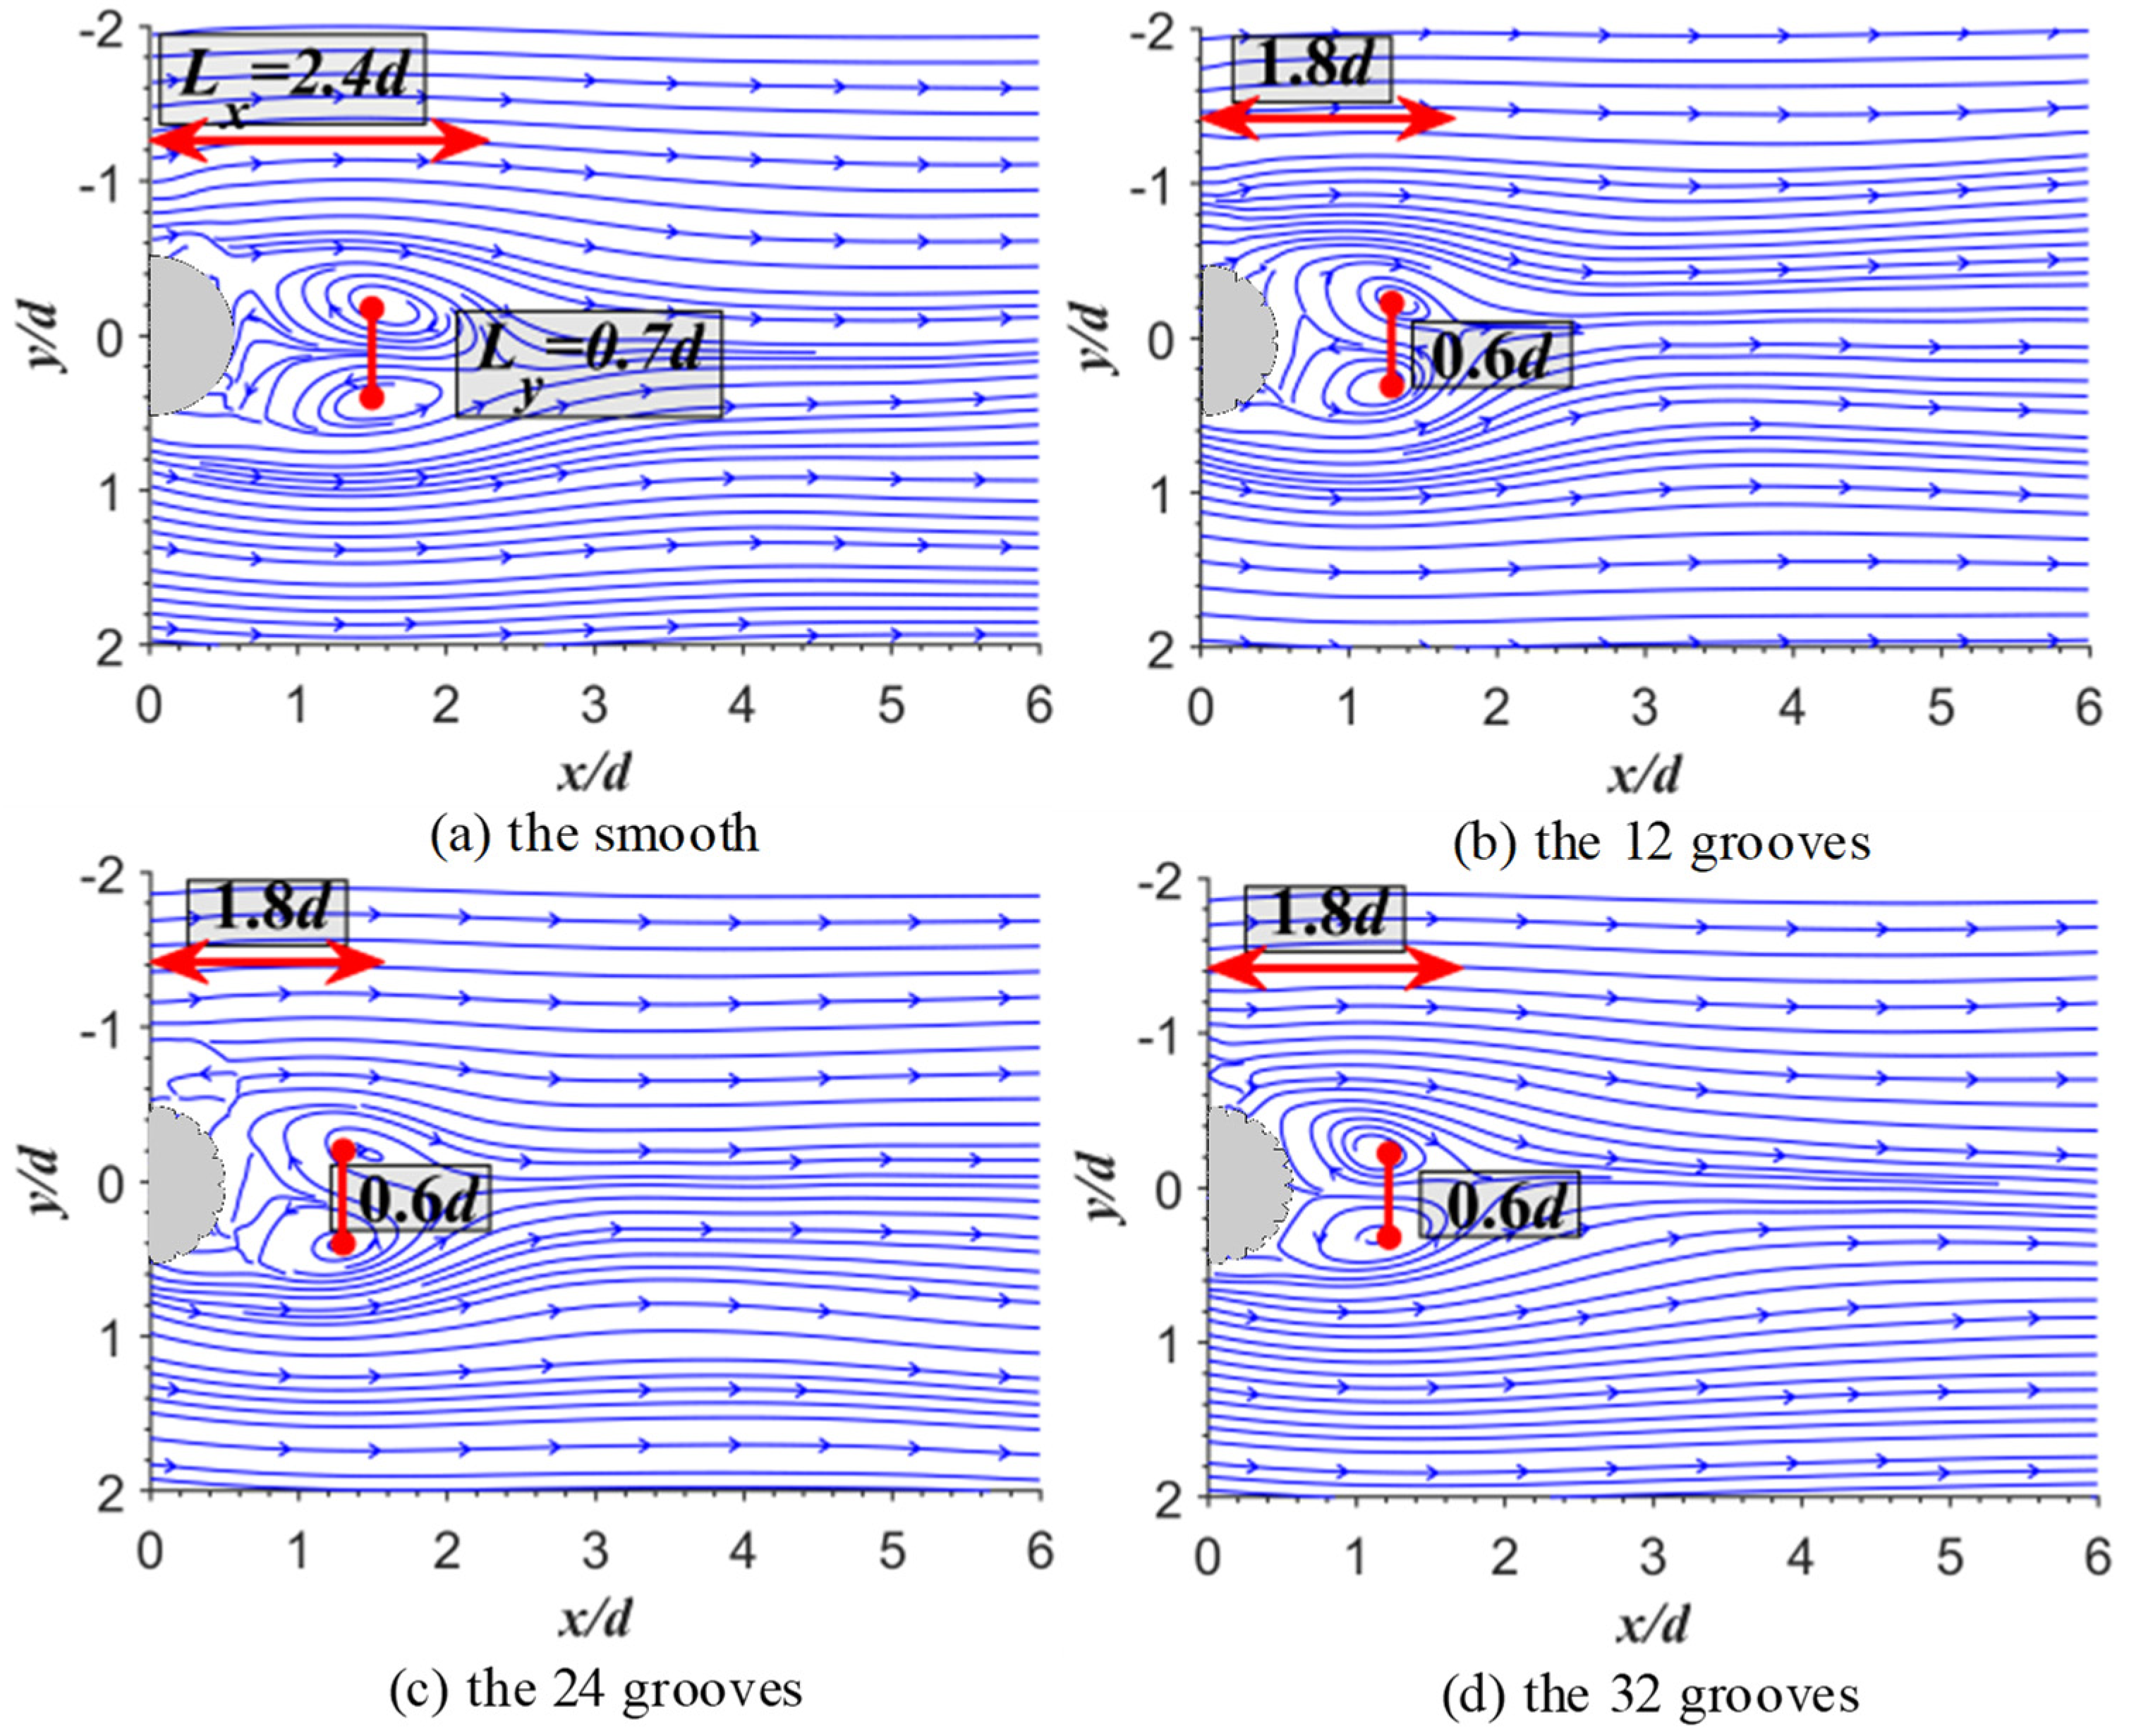
In the present study, the time-averaged streamlines were calculated by averaging over 8000 instantaneous velocity vector fields. For the time-averaged streamlines in the (x, y)-plane (Figure 6), the sizes of the recirculation regions were compared. The size of the recirculation region was obtained from the velocity flow diagram, which was symmetric about y/d =0. The wake circulation region can be described by the values of (length from the center of the cylinder to the saddle point) and (the width between the two foci points) [18,19]. The widths of the two vortices in the three v-groove cylinders were all 0.1d shorter than that in the smooth cylinder, and the of the three v-groove cylinders were all reduced by about 25%. The vortex formation region of the v-groove cylinder decreased, as did that of the longitudinal U-groove cylinders [20]. However, the change in the number of grooves did not affect the size of the recirculation region.
The variation of and in the stream-wise plane for the smooth and v-groove cylinders suggests that the v-groove surface can reduce the size of the recirculation region. However, the number of grooves did not affect the size of the recirculation region. Furthermore, the Reynolds shear stress and turbulent kinetic energy were plotted to find out why the velocity gradient in the near-wall region decreased.
3.3. Reynolds Stress and Turbulent Kinetic Energy
The Reynolds shear stress (Figure 7 and Figure 8) and turbulent kinetic energy (Figure 9 and Figure 10) were plotted to investigate the turbulent instability of the wake flow field with different v-groove numbers on the cylindrical surface. Figure 7 shows that the normalized Reynolds stress was symmetrically distributed about y/d = 0 and was of a similar magnitude and an opposite direction. As shown in Figure 7a, the maxima and minima values of the Reynolds shear stress in the wake region were 0.056 and . As shown in Figure 7b–d, the maximum values of the 12-, 24-, and 32-groove cylinders were 0.1, 0.1, and 0.08, which were more prominent than the values of the smooth cylinder. It can be seen that the v-groove surface increased the Reynolds stress in the near wake of the cylinder but the number of grooves had a limited effect on the Reynolds stress. In addition, two larger lobes were located at x/d = 2.5 and y/d = near the smooth cylinder’s wake, while the v-groove cylinder shift the location of the two larger lobes toward the cylinder. So, the wake circulation regions of the grooved cylinders were compressed.
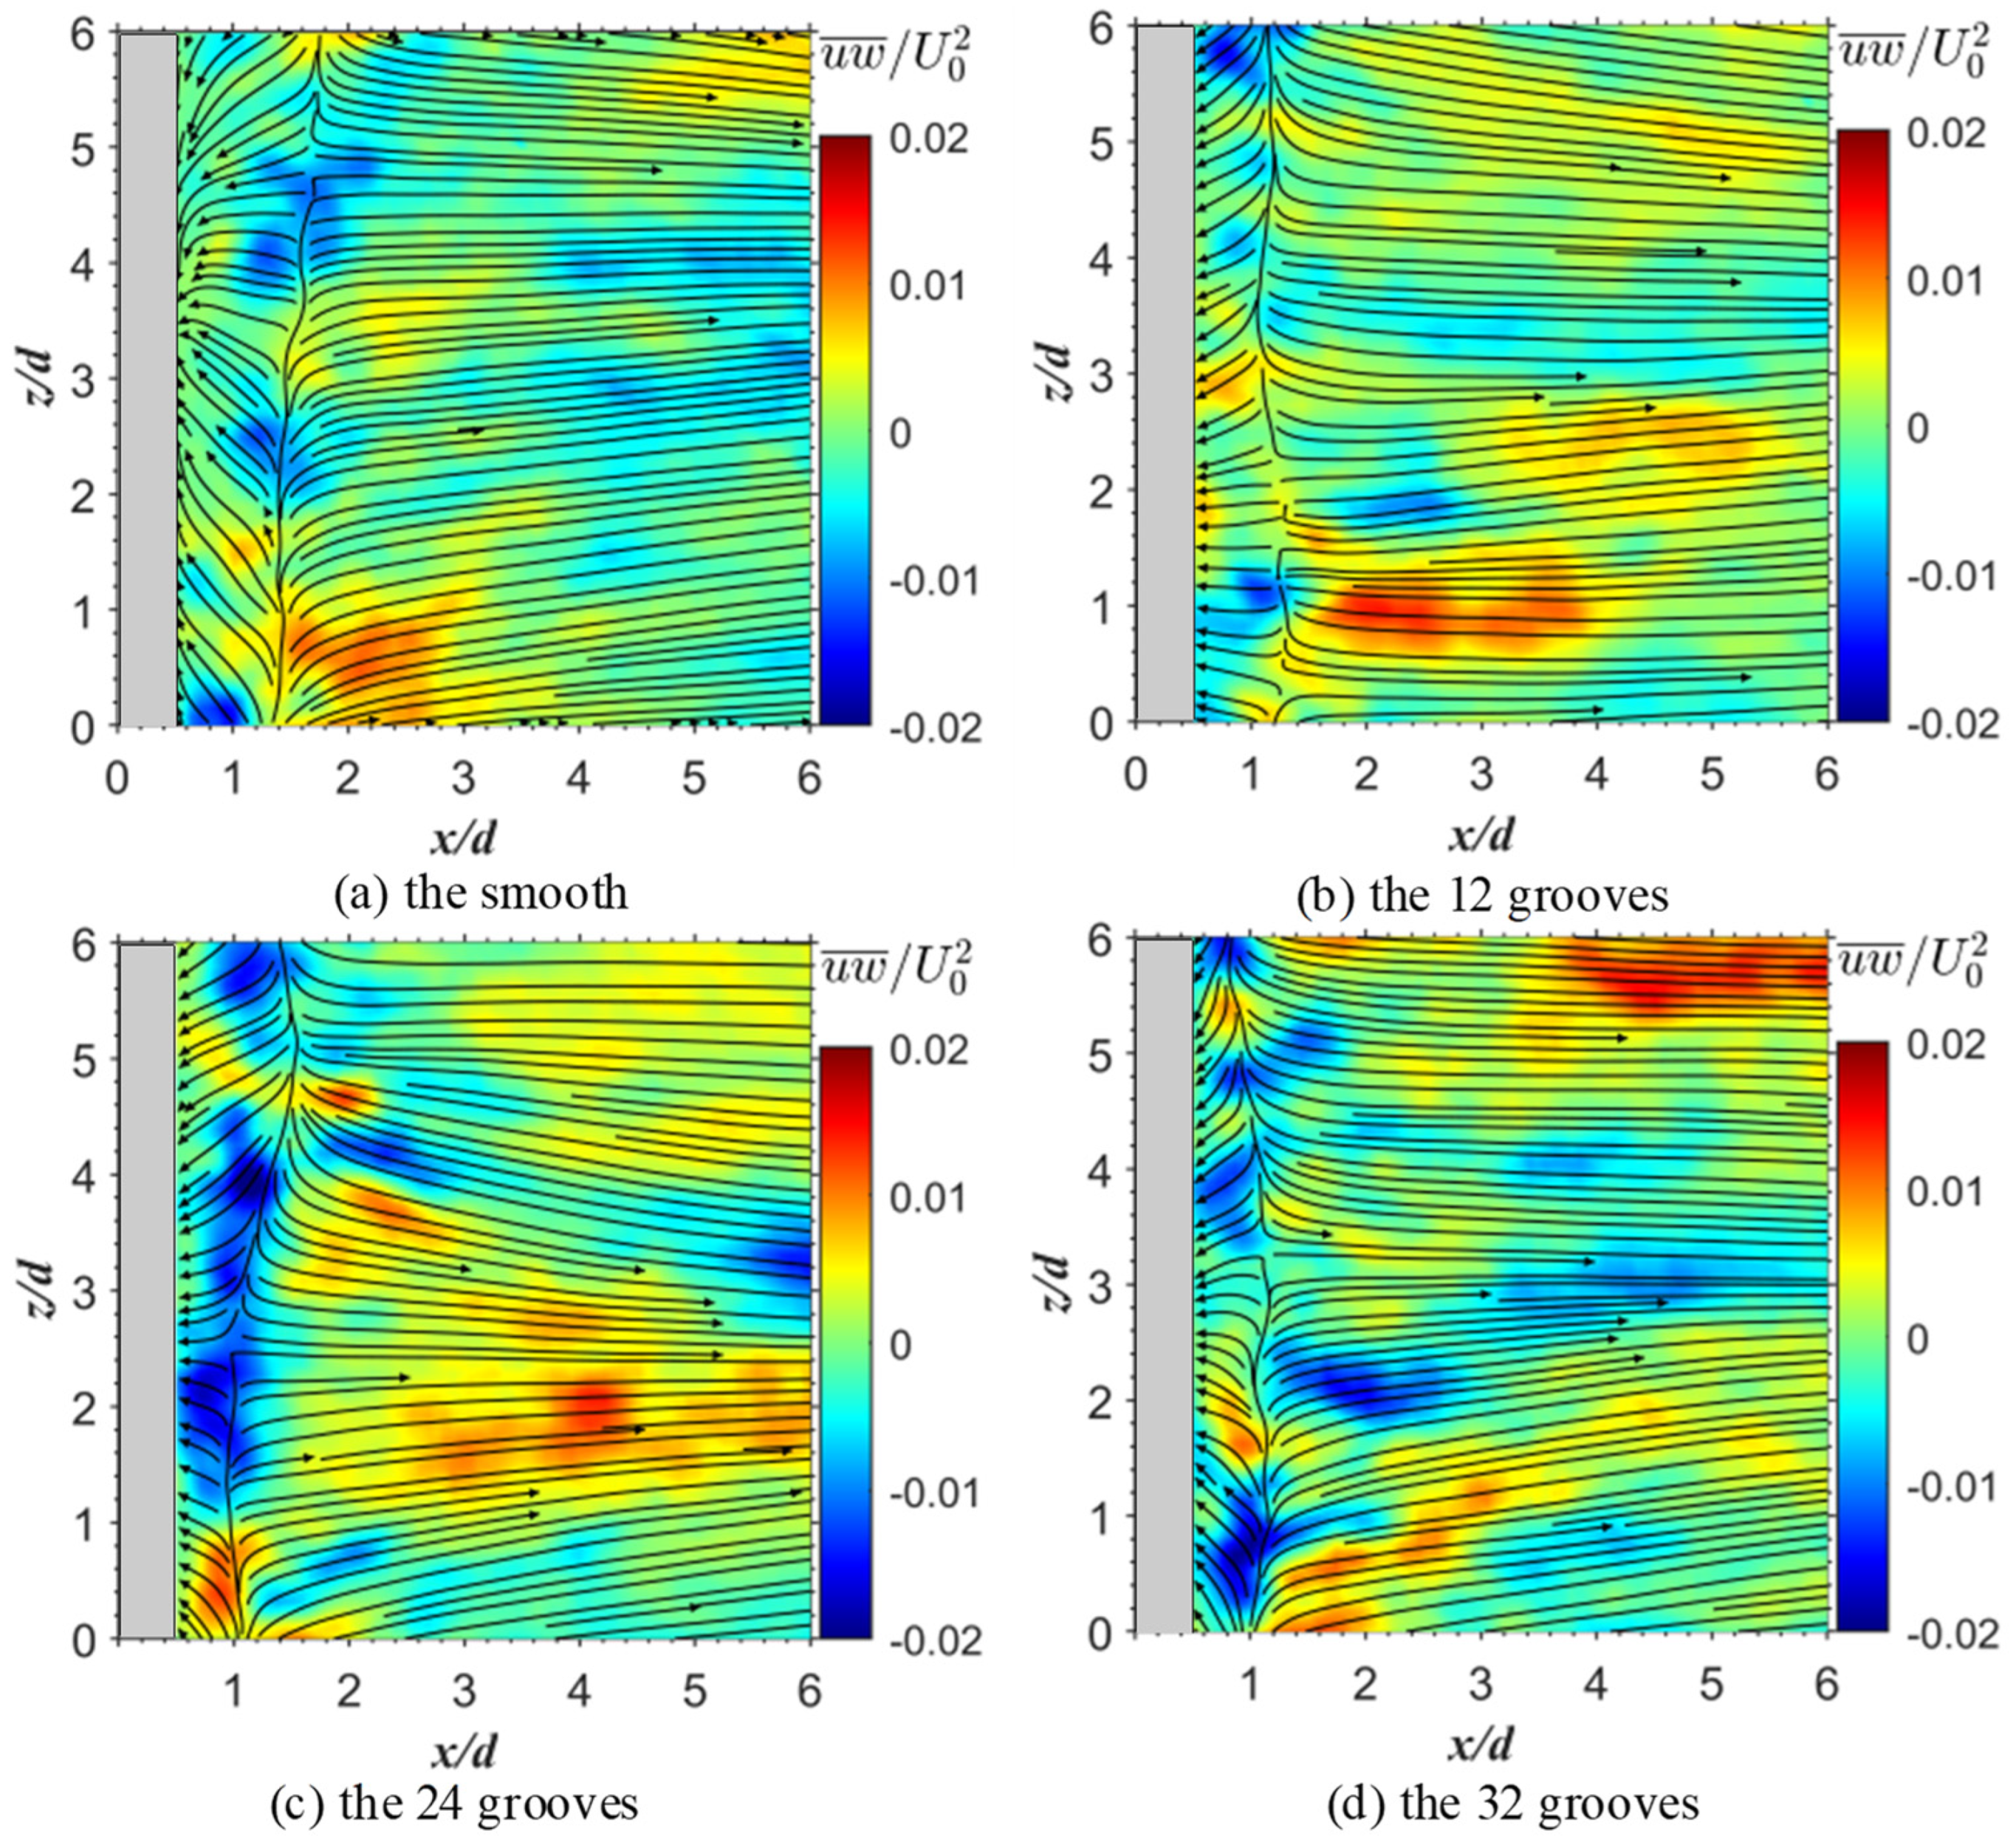
Furthermore, Figure 8 shows the time-averaged streamlines and normalized Reynolds stress () in the (x, z)-plane. The minimum length of the reflux region of the smooth cylinder was about 1.4d, whereas the minimum lengths of the reflux regions of the 12-, 24-, and 32-groove cylinders were about d, 0.8d, and 0.4d. The above phenomenon indicates that the v-groove surface increased the disturbance at the boundary layer so the length of the reflux region was reduced. This result is consistent with the streamline diagrams shown in Figure 6.
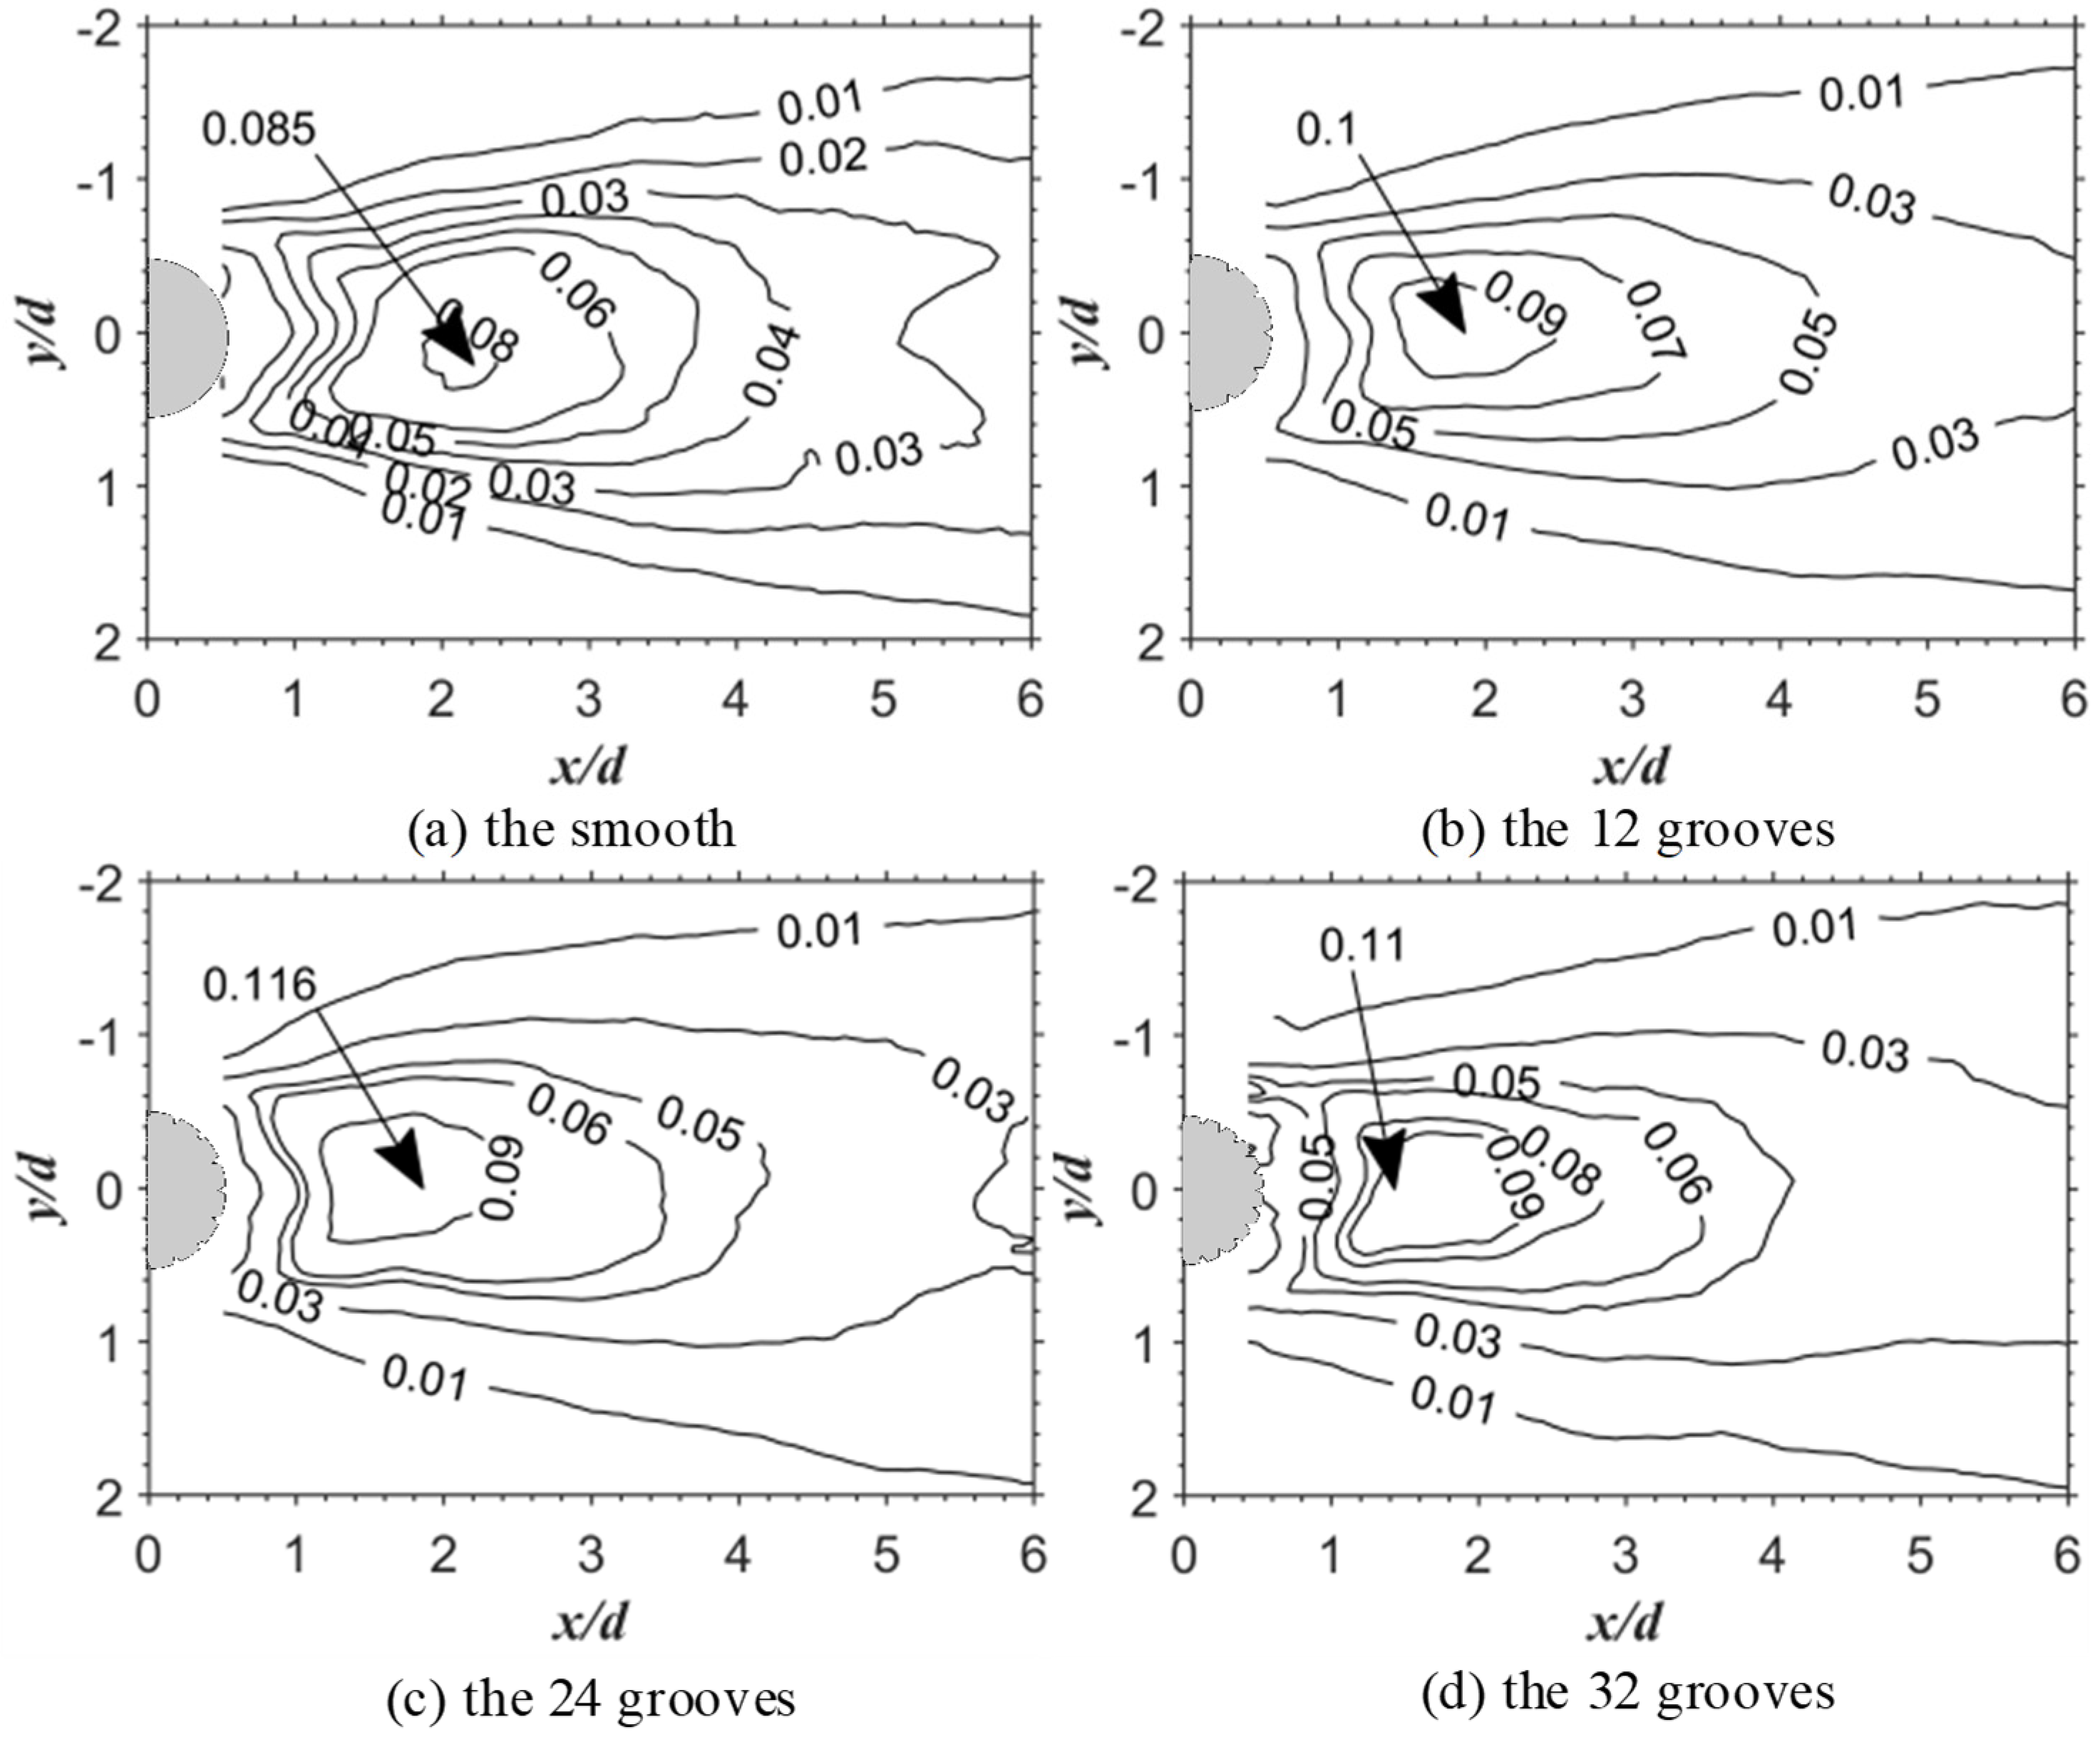
As shown in Figure 9, the turbulent kinetic energy (TKE) was also used to determine the turbulent instability [21]. The turbulent kinetic energy was calculated as TKE= 0.75(). The maximum value (TKE = 0.085) of the smooth cylinder was observed at x/d = 2.4 (Figure 9a), which was longer than the locations of the three grooved cylinders. In addition, the peak values of TKE for the 12-groove, 16-groove, and 24-groove surfaces were 0.1, 0.116, and 0.011, respectively (Figure 9b–d). The maximum turbulent energy of the 32-groove cylinder was less than that of the 24-groove cylinder, which indicates that the number of grooves had a limited effect on the turbulent kinetic energy. This also means that increasing the number of grooves will not result in more turbulent momentum to prevent vortex shedding.
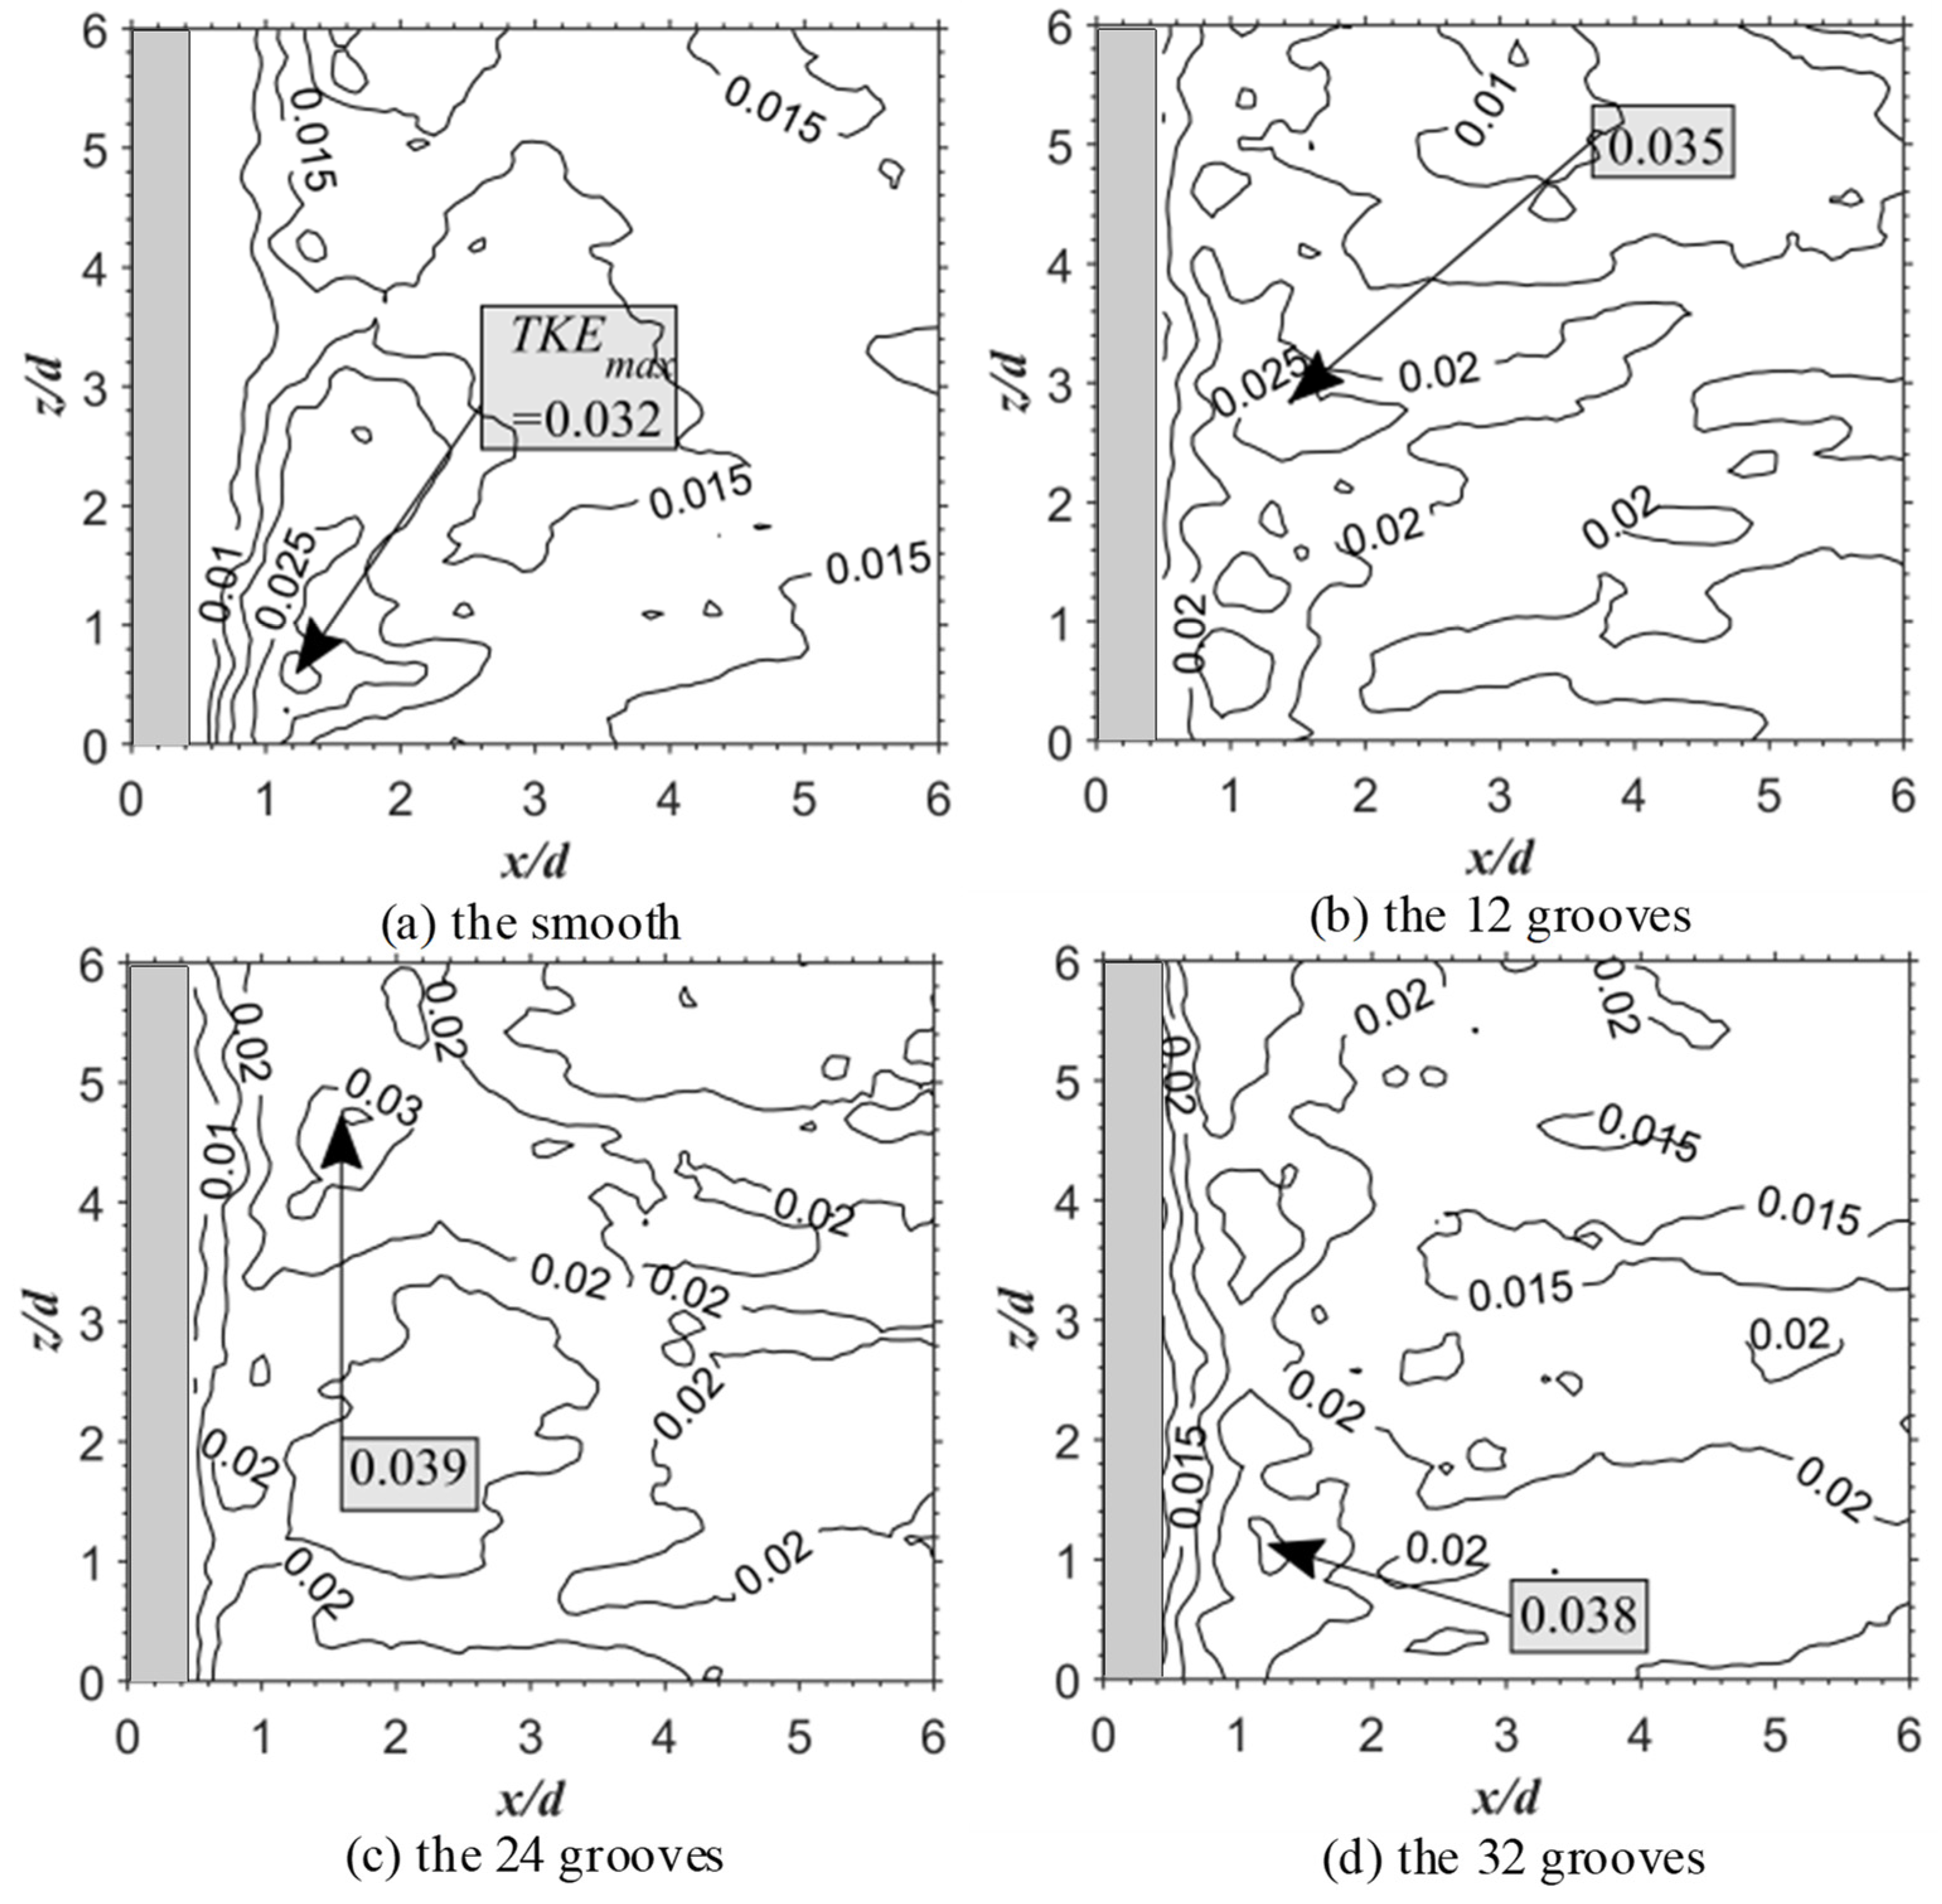
As shown in Figure 10, the turbulent kinetic energy at the trailing edge of the cylinder was not uniformly distributed in the span-wise plane. This suggests that the span-wise turbulent kinetic energy was not uniformly distributed on the trailing edge of the cylinder because of the vortex. Meanwhile, the maximum turbulent kinetic energy () of the smooth cylinder in the (x, z)-plane was 0.032 (Figure 10a), which was smaller than that of the 12-, 24-, and 32-groove cylinders.
The above results indicate that the v-groove surface increased the Reynolds shear stress and the turbulent kinetic energy, thus preventing vortex shedding and compressing the wake recirculation region. In addition, the number of grooves had a limited effect on the Reynolds shear stress and the turbulent kinetic energy. Furthermore, it is important to compare the instantaneous vorticity of the smooth cylinder and the cylinders with different v-groove numbers.
3.4. Instantaneous Flow Structures
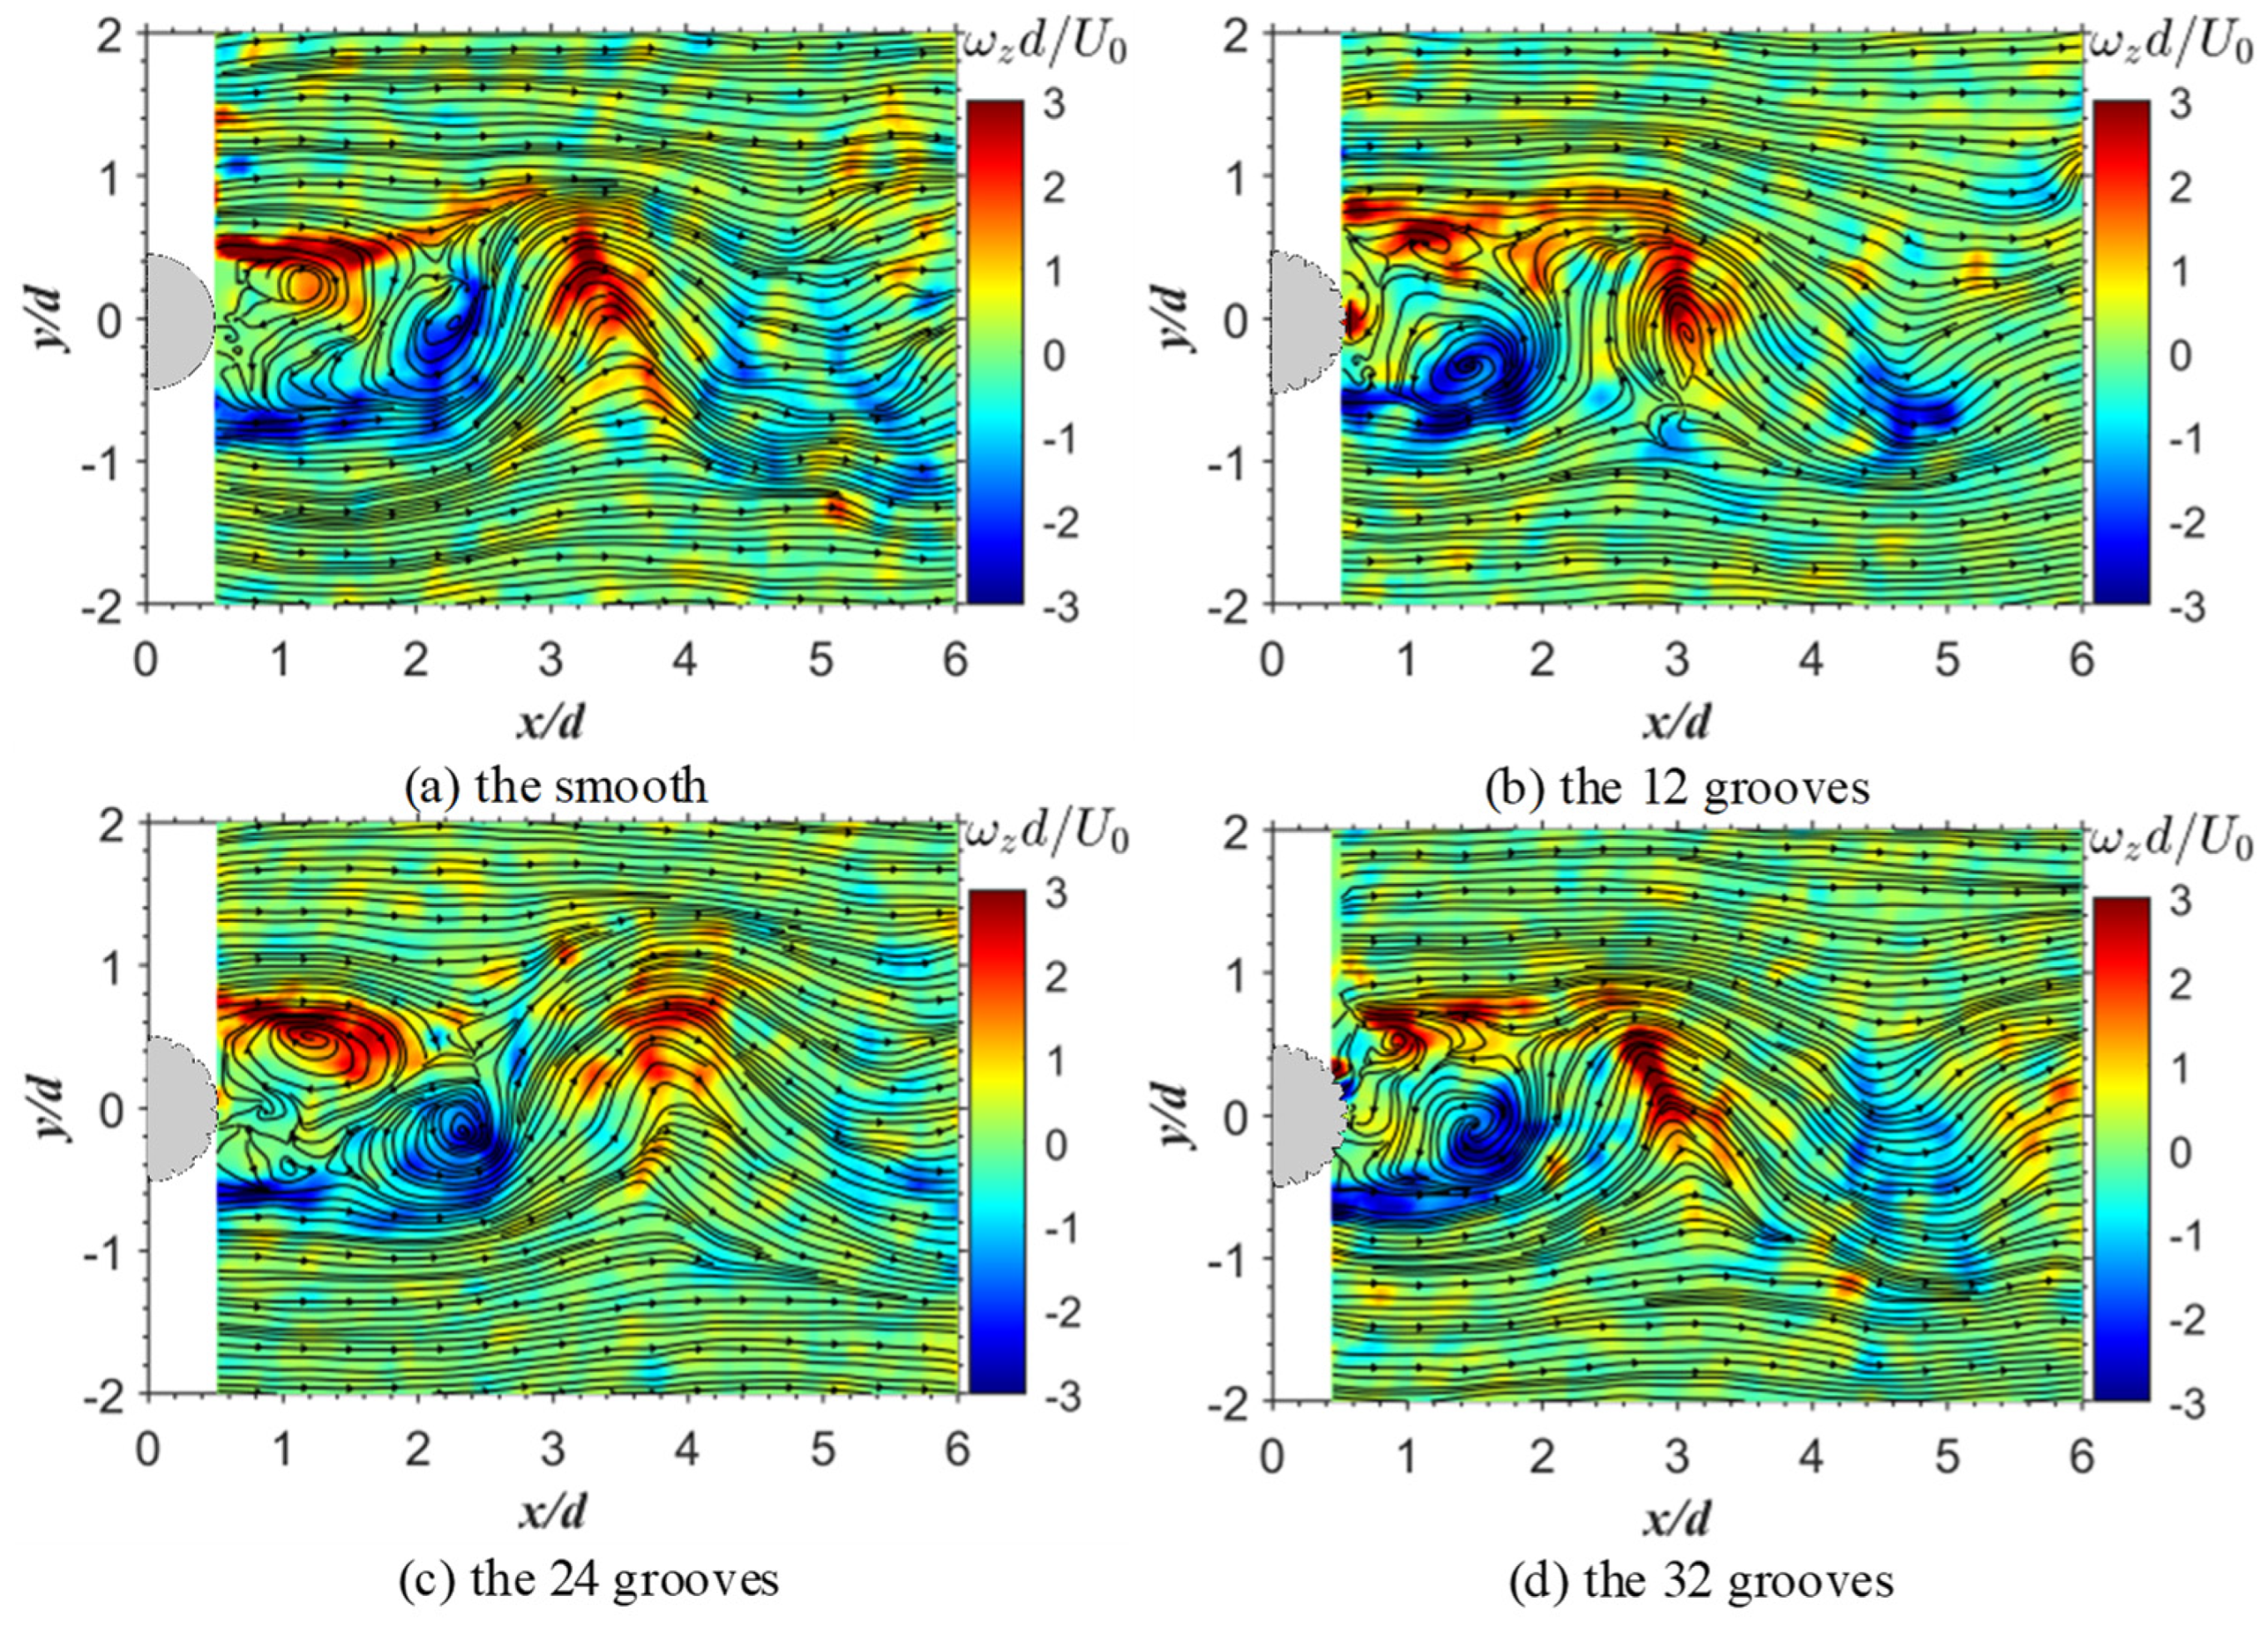
Figure 11 shows the typical instantaneous streamlines and normalized vorticity contours in the (x, y)-plane. It is easy to see similar-sized vortices in opposite directions appearing at the near-wake region of the smooth cylinder (Figure 11a), which is consistent with the Karman vortex street observed by Wang and Zhou [22]. In addition, in the case of the v-groove cylinder (Figure 11b,c), a series of small vortices were formed, the flow pattern became turbulent, the area of the vortex movement narrowed, and the Karman vortex street became blurred.
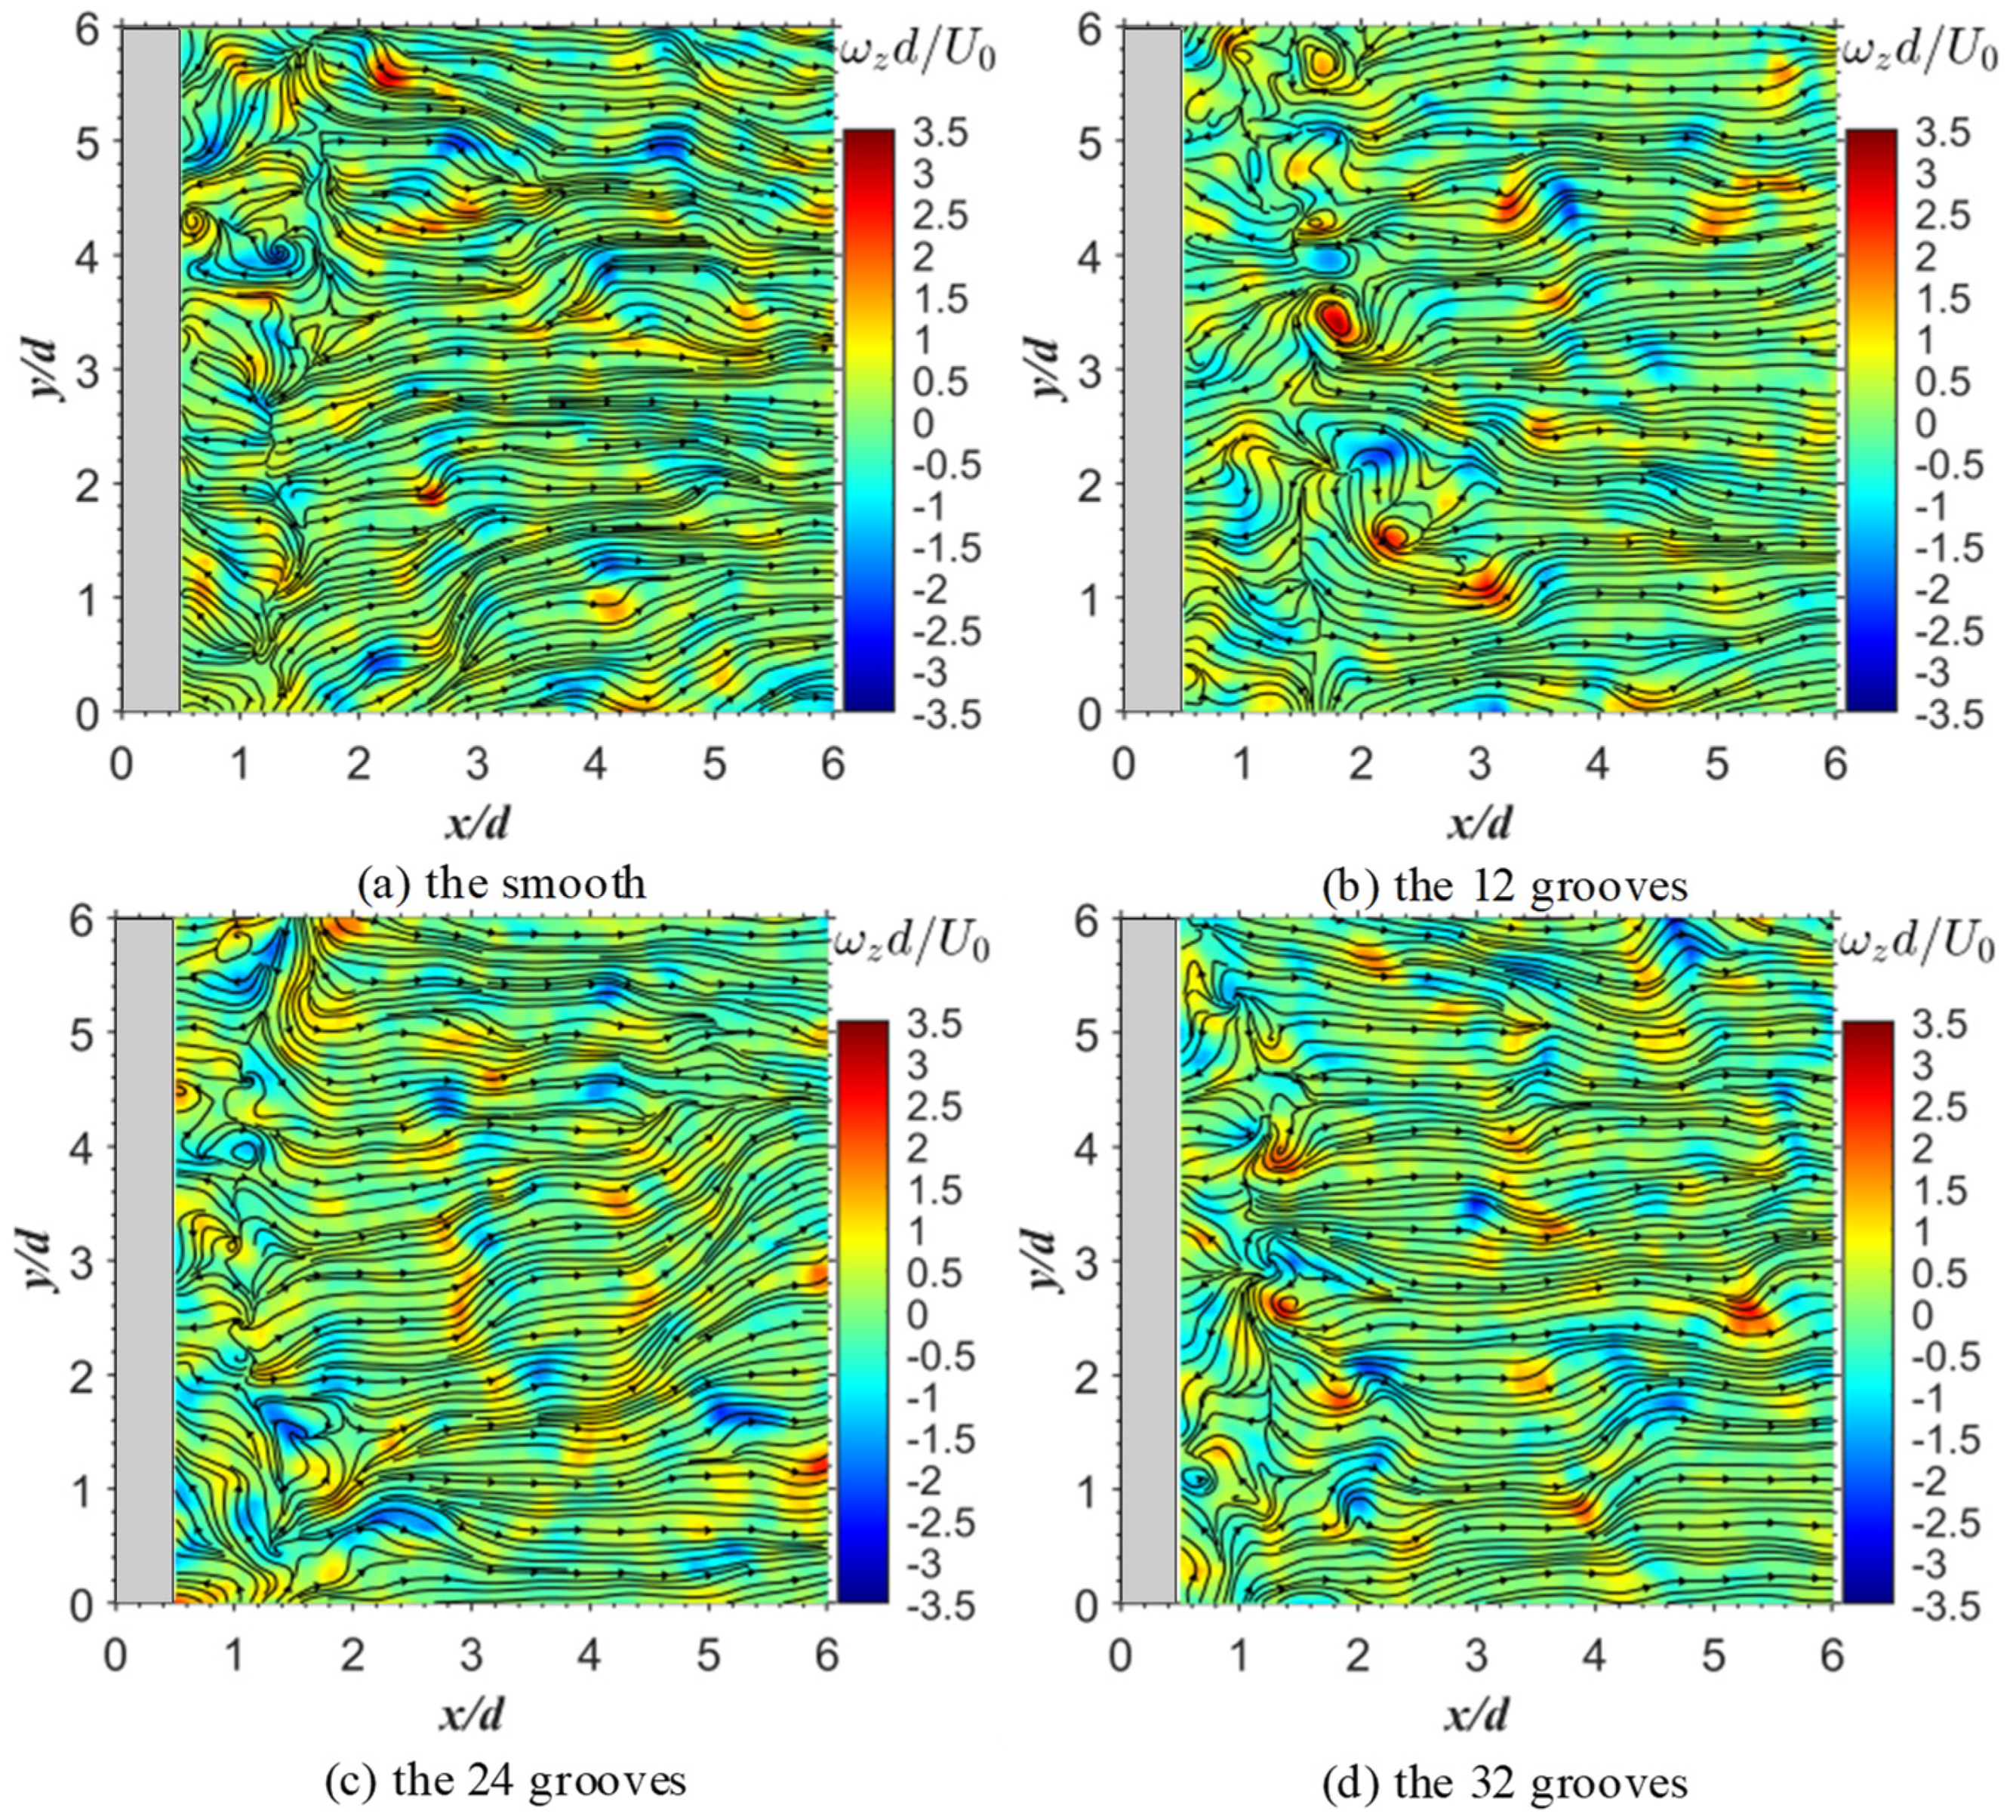
Figure 12 plots the instantaneous streamlines and normalized vorticity contours of the smooth and grooved cylinders in the (x, z)-plane. More vortices can be seen in the wake regions of the 12-, 24-, and 32-groove cylinders than the wake region of the smooth cylinder because of the interaction of the violent turbulence and the v-groove surface.
The above results indicate that the presence of the v-groove accelerated the fluid rotation within the boundary layer of the wall, increased the turbulent kinetic energy, and reduced the wake zone. To further understand the mechanism of the large-eddy breakup in the near-wake region, multi-scale wavelet analysis was used to compare the cylindrical wake structures at different frequency domain scales for the smooth and 32-groove cylinders in this study.
3.5. Select Wavelet Components Based on Relative Energy Percentage
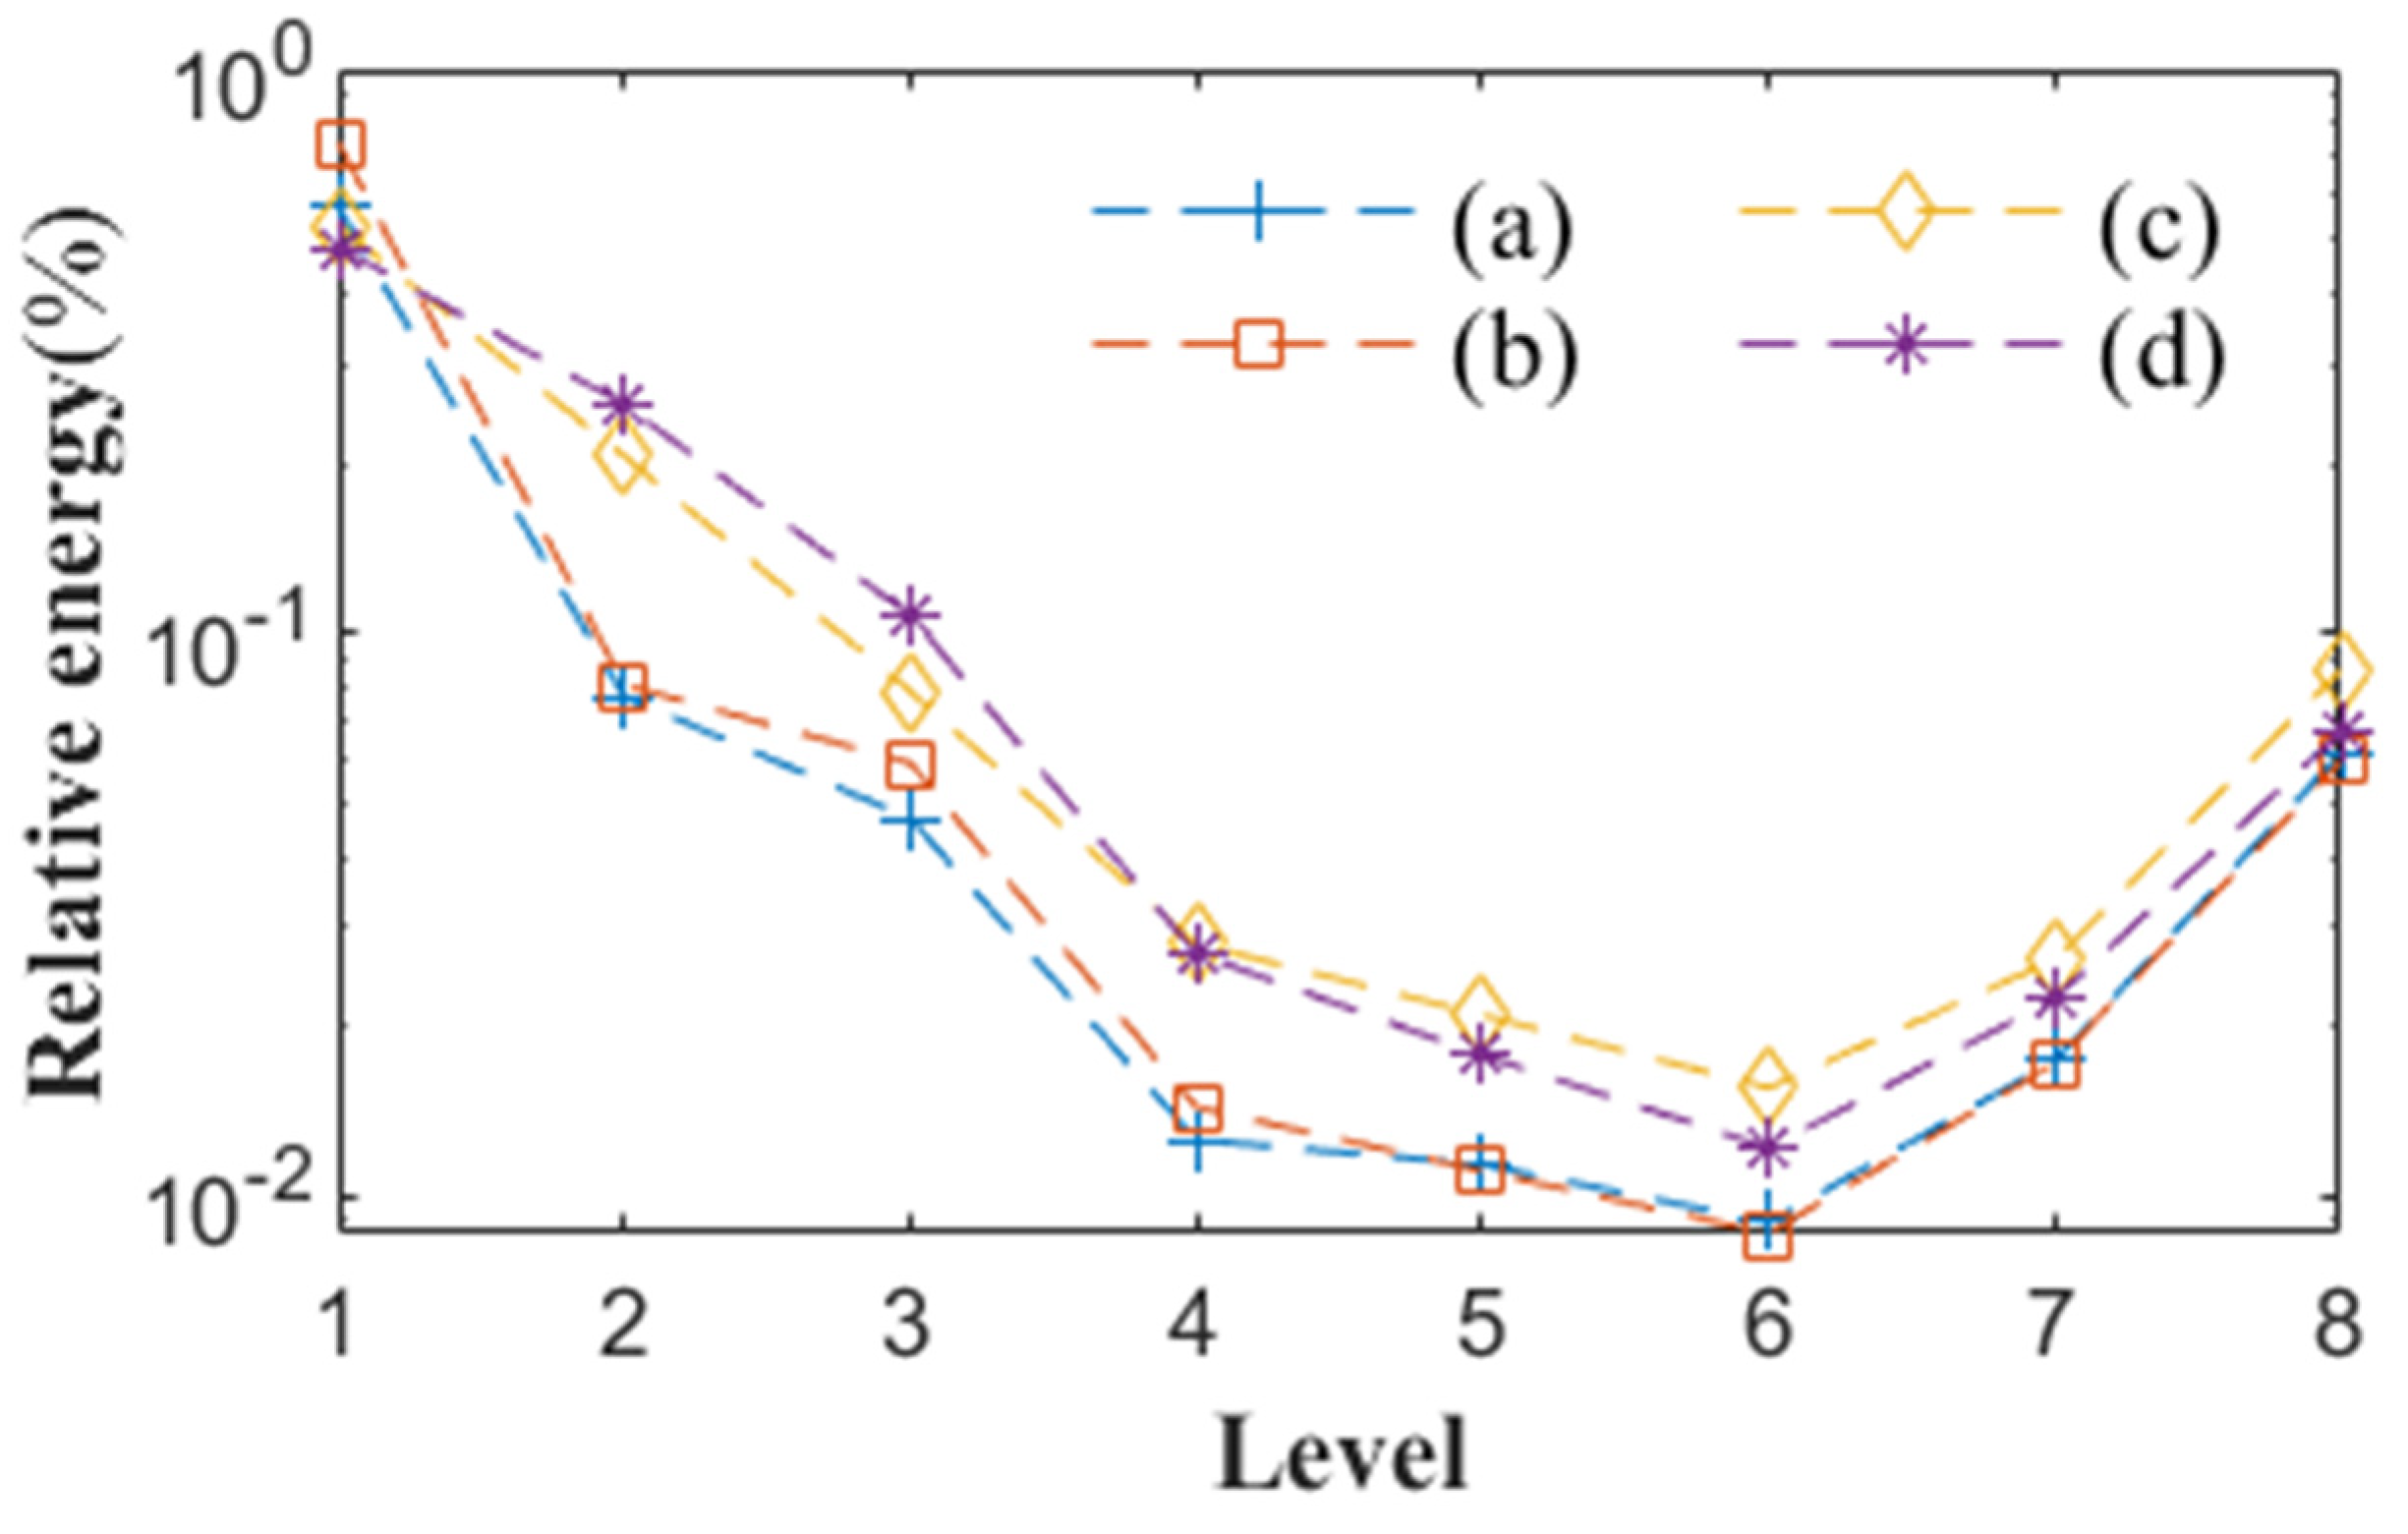
The one-dimensional wavelet multi-resolution technique decomposes the measured fluctuation velocity in the (x, y) and (x, z)-planes into eight wavelet components. The relative energy () of each wavelet component is the ratio of the sum of the turbulent kinetic energy of the wavelet components at all points in the wake region to that in the measurement data, and the relative energy in the (x, y)-plane is calculated by to determine the energy contribution of each scale.
The energy contribution of each scale is shown in Figure 13, where it can be seen that the relative energy of the level 1 wavelet component had the most prominent energy share. The sum of the energy share of the level 1238 wavelet component reached 0.9, whereas the sum energy share of the level 1238 wavelet component of the smooth and 32-groove cylinders in the (x, z)-plane reached 0.91, which was the same as the results in the (x, y)-plane. The sum of the levels 1, 2, 3, and 4 wavelet components approximated the measurement data. However, the level 8 wavelet component is a high-frequency wavelet coefficient and is of no research value [15]. Therefore, the levels 1, 2, and 3 wavelet components were selected to study the multi-scale wavelet structure.
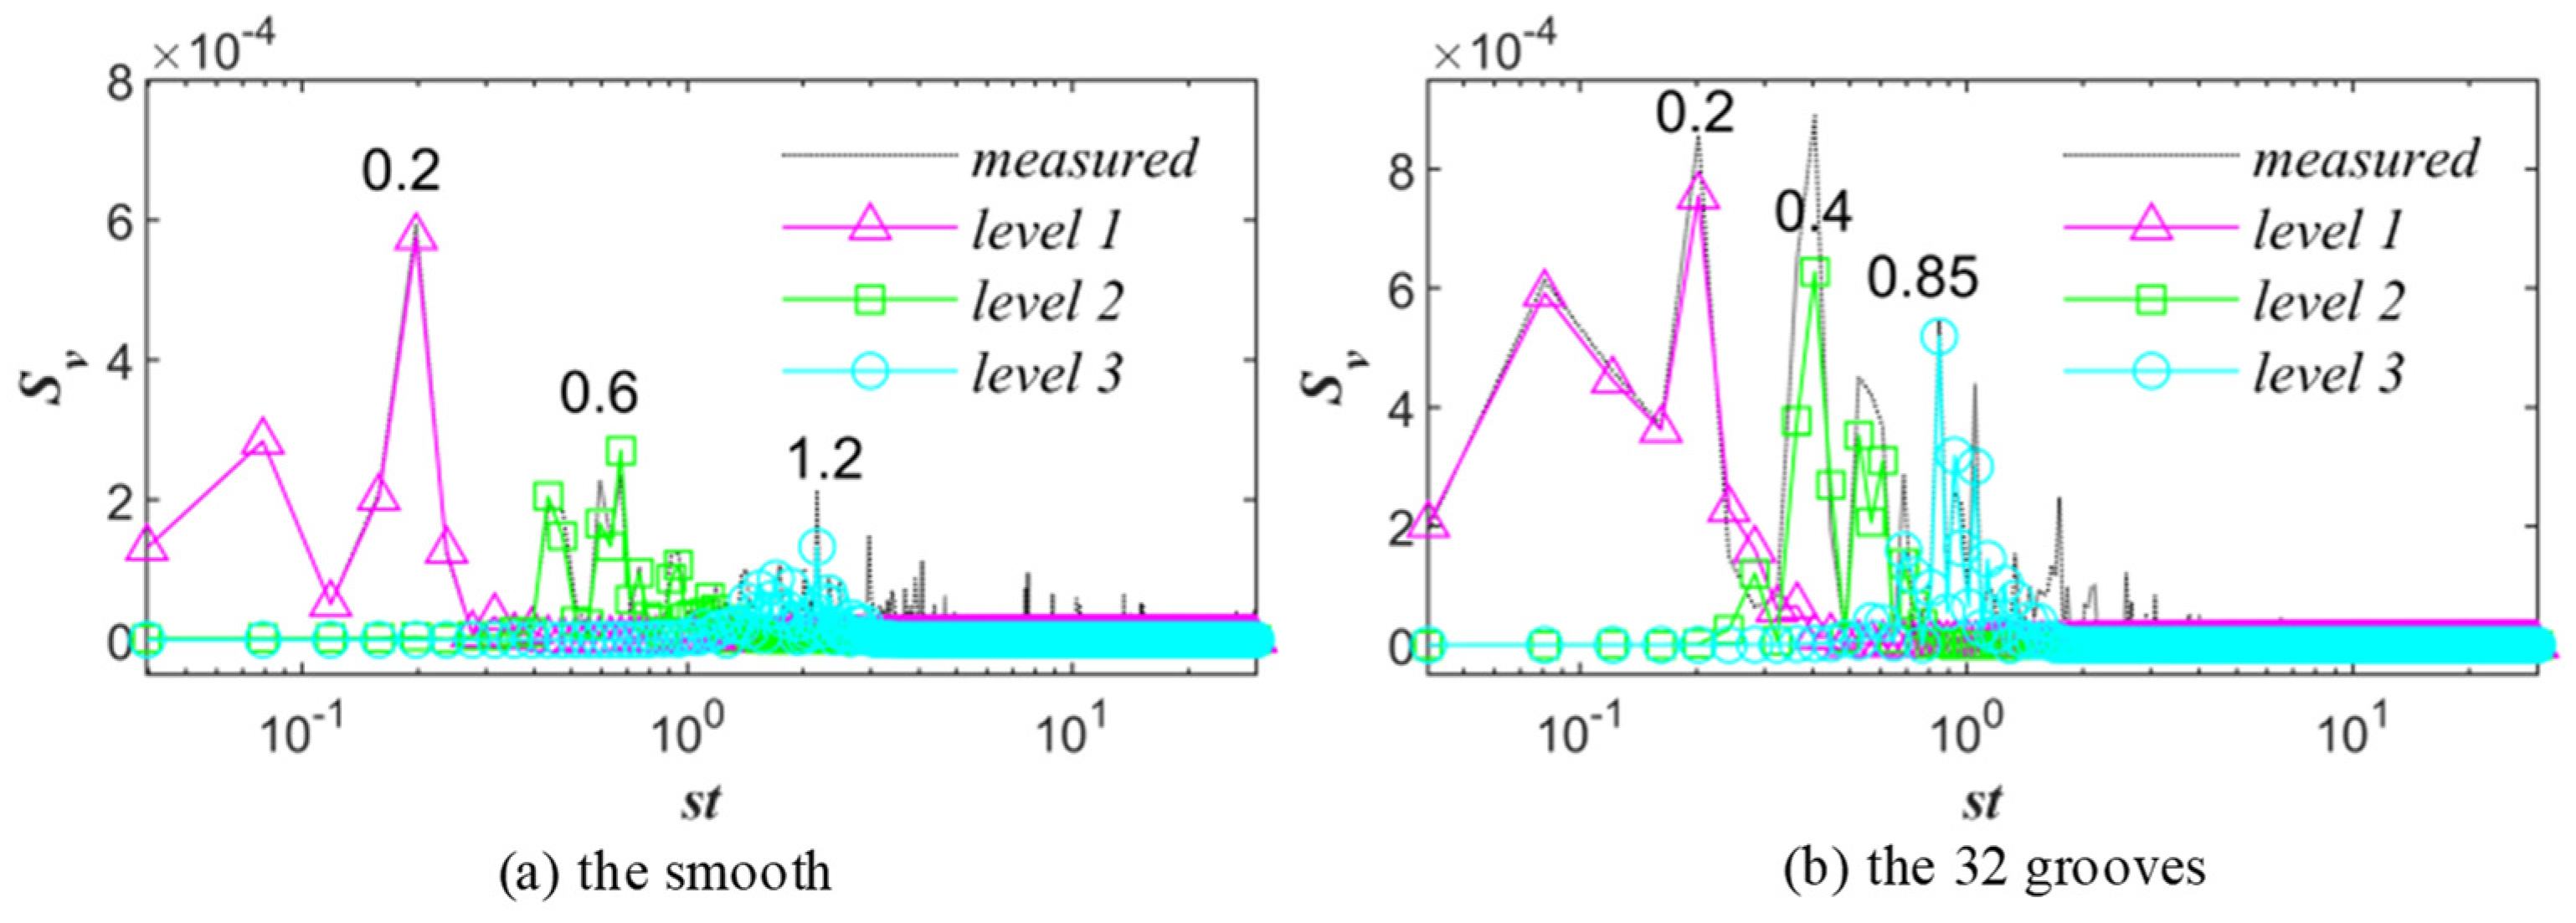
3.6. Spectral Analysis Calculation of Vortex Frequency
The flow fluctuation velocities of the smooth and 32-groove cylinders were chosen to reveal the spectral characteristics of the four wavelet components. The Strouhal number (St) was calculated from each wavelet component’s center frequency (). The power spectra were calculated at selected points (x/d = 0.6, y/d = 0.5) to obtain the central frequencies of the flow fluctuation velocity in the wavelet components at levels 1, 2, and 3 (Figure 14). For the smooth and 32-groove cylinders, the maximum peaks of the measured data and level 1 wavelet component were observed at and , indicating that the vortex shedding had slowed behind the 32-groove cylinder. In addition, the smooth cylinder’s peak spectra of wavelet components at levels 2 and 3 were located at around 0.6 and 1.2, respectively. The pronounced spectrum peaks of wavelet components levels 2 and 3 for the 32-groove cylinder were observed at around 0.4 and 0.85, respectively. So, the level 1, 2, and 3 wavelet components were selected to represent the large-, intermediate-, and small-scale structures.
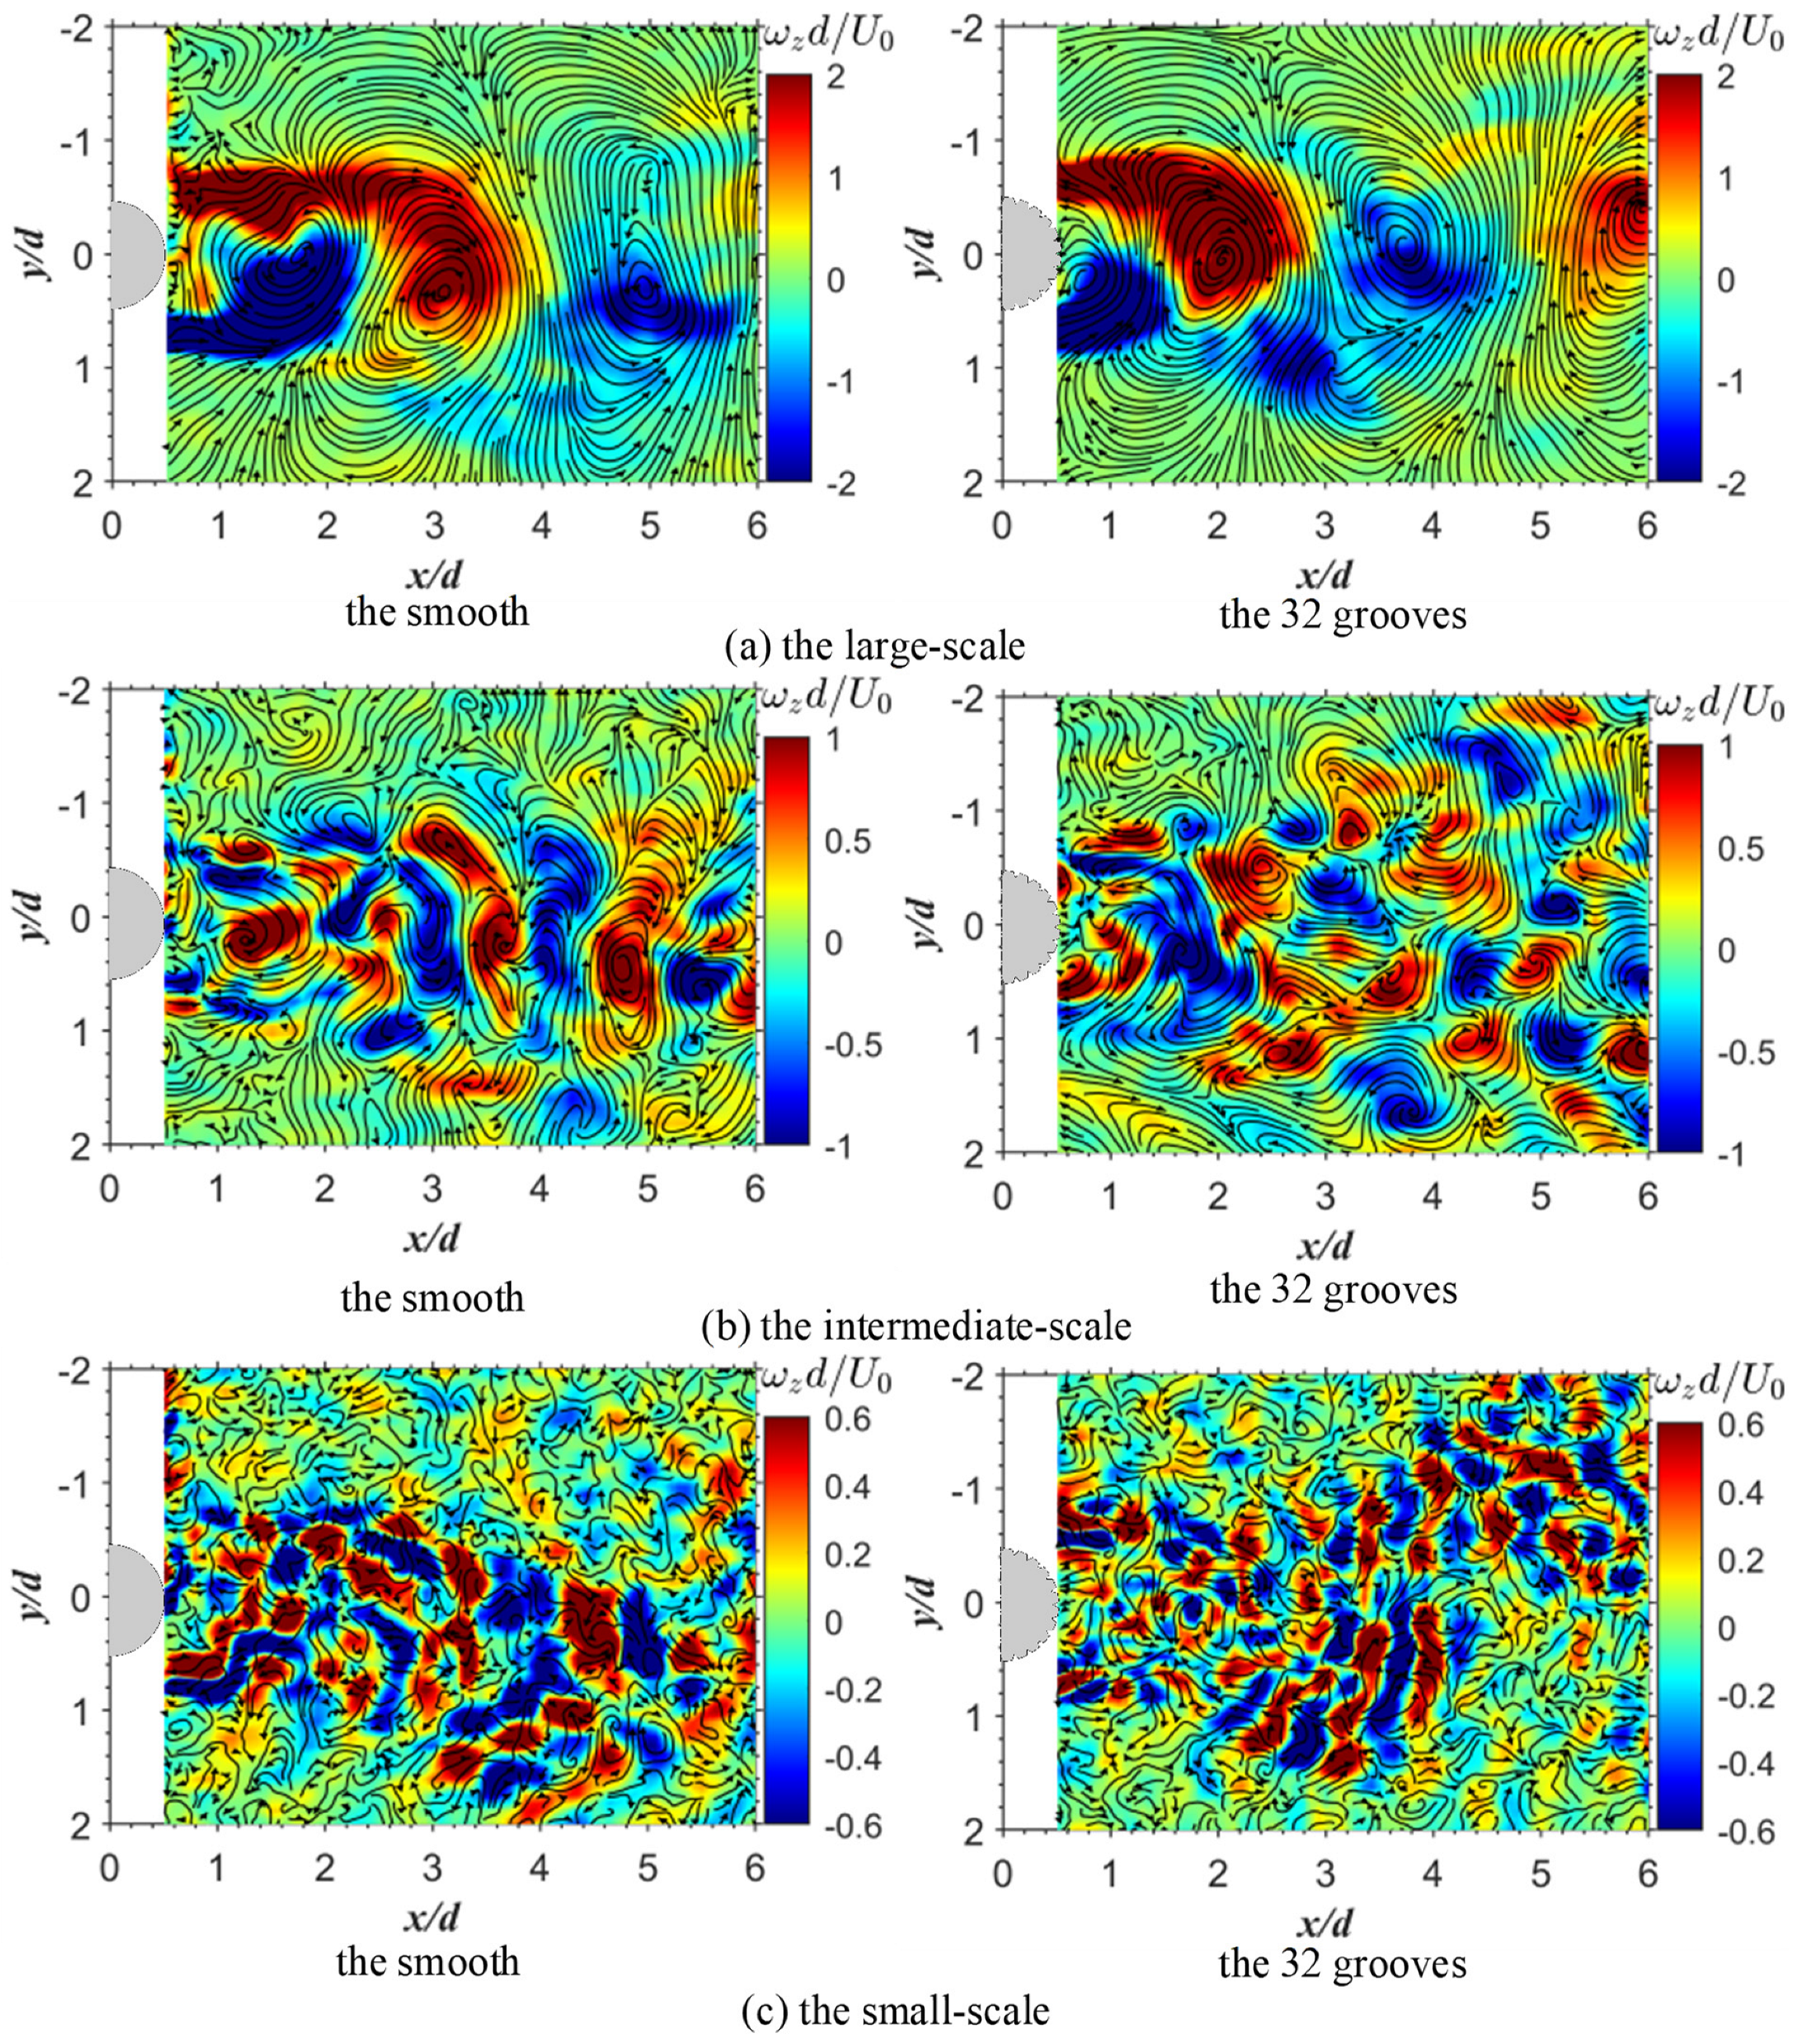
3.7. Instantaneous Vorticity Contours of Different Scales
Since the surface of the groove will divide the primary vortex shedding around the cylinder into small-scale vortex structures with weaker energies, it is important to compare the smooth and 32-groove cylinders in the multi-scale structures. The magnitude of vorticity is described by the normalized vorticity (), where is calculated by the curl of the flow velocity.
As shown in Figure 15a, a pair of Karman-like vortices were observed in the near wake of the cylinder. This suggests that the large-scale flow fields reflected the Karman-like vortices in the wake of the smooth cylinder. Furthermore, as shown in Figure 15b, there were many vorticities in the downsides of the wake regions of the intermediate-scale structures, which were caused by the shear velocity at the interface between the low- and high-speed regions in opposite directions. In addition, as presented in Figure 15c, the formation of the quasi-periodical flow oscillation was accompanied by many small-scale vorticities resulting from vortex tearing. This suggests that the small vortex’s upper and lower oscillation positions were the locations where the large vortex split.
When comparing the smooth and 32-groove cylinders at the large scale (Figure 15a), it was observed that there was a stronger wake vorticity in the wake region of the 32-groove cylinder. Furthermore, the Karman-like vortices were closer to the trailing edge of the cylinder. This suggests that the grooves increased the disturbance in the near-wake region, thereby increasing the vorticity. In addition, as presented in Figure 15b, there were more vortices in the 32-groove cylinder at the intermediate scale than in the smooth cylinder and there was significant diffusion downstream of the wake region of the 32-groove cylinder. This suggests that the grooves led to stronger rotational vortex disturbances, which is the main reason for the dispersion of the Karmen vortex. Furthermore, as presented in Figure 15c, the 32-groove cylinder disturbed the main flow more; the upper and lower oscillation positions of the 32-groove cylinder were closer to the cylinder. This confirms that the periodicity of the vortex street behind the 32-groove cylinder was altered because the phase difference between the upper and lower oscillation positions became smaller.
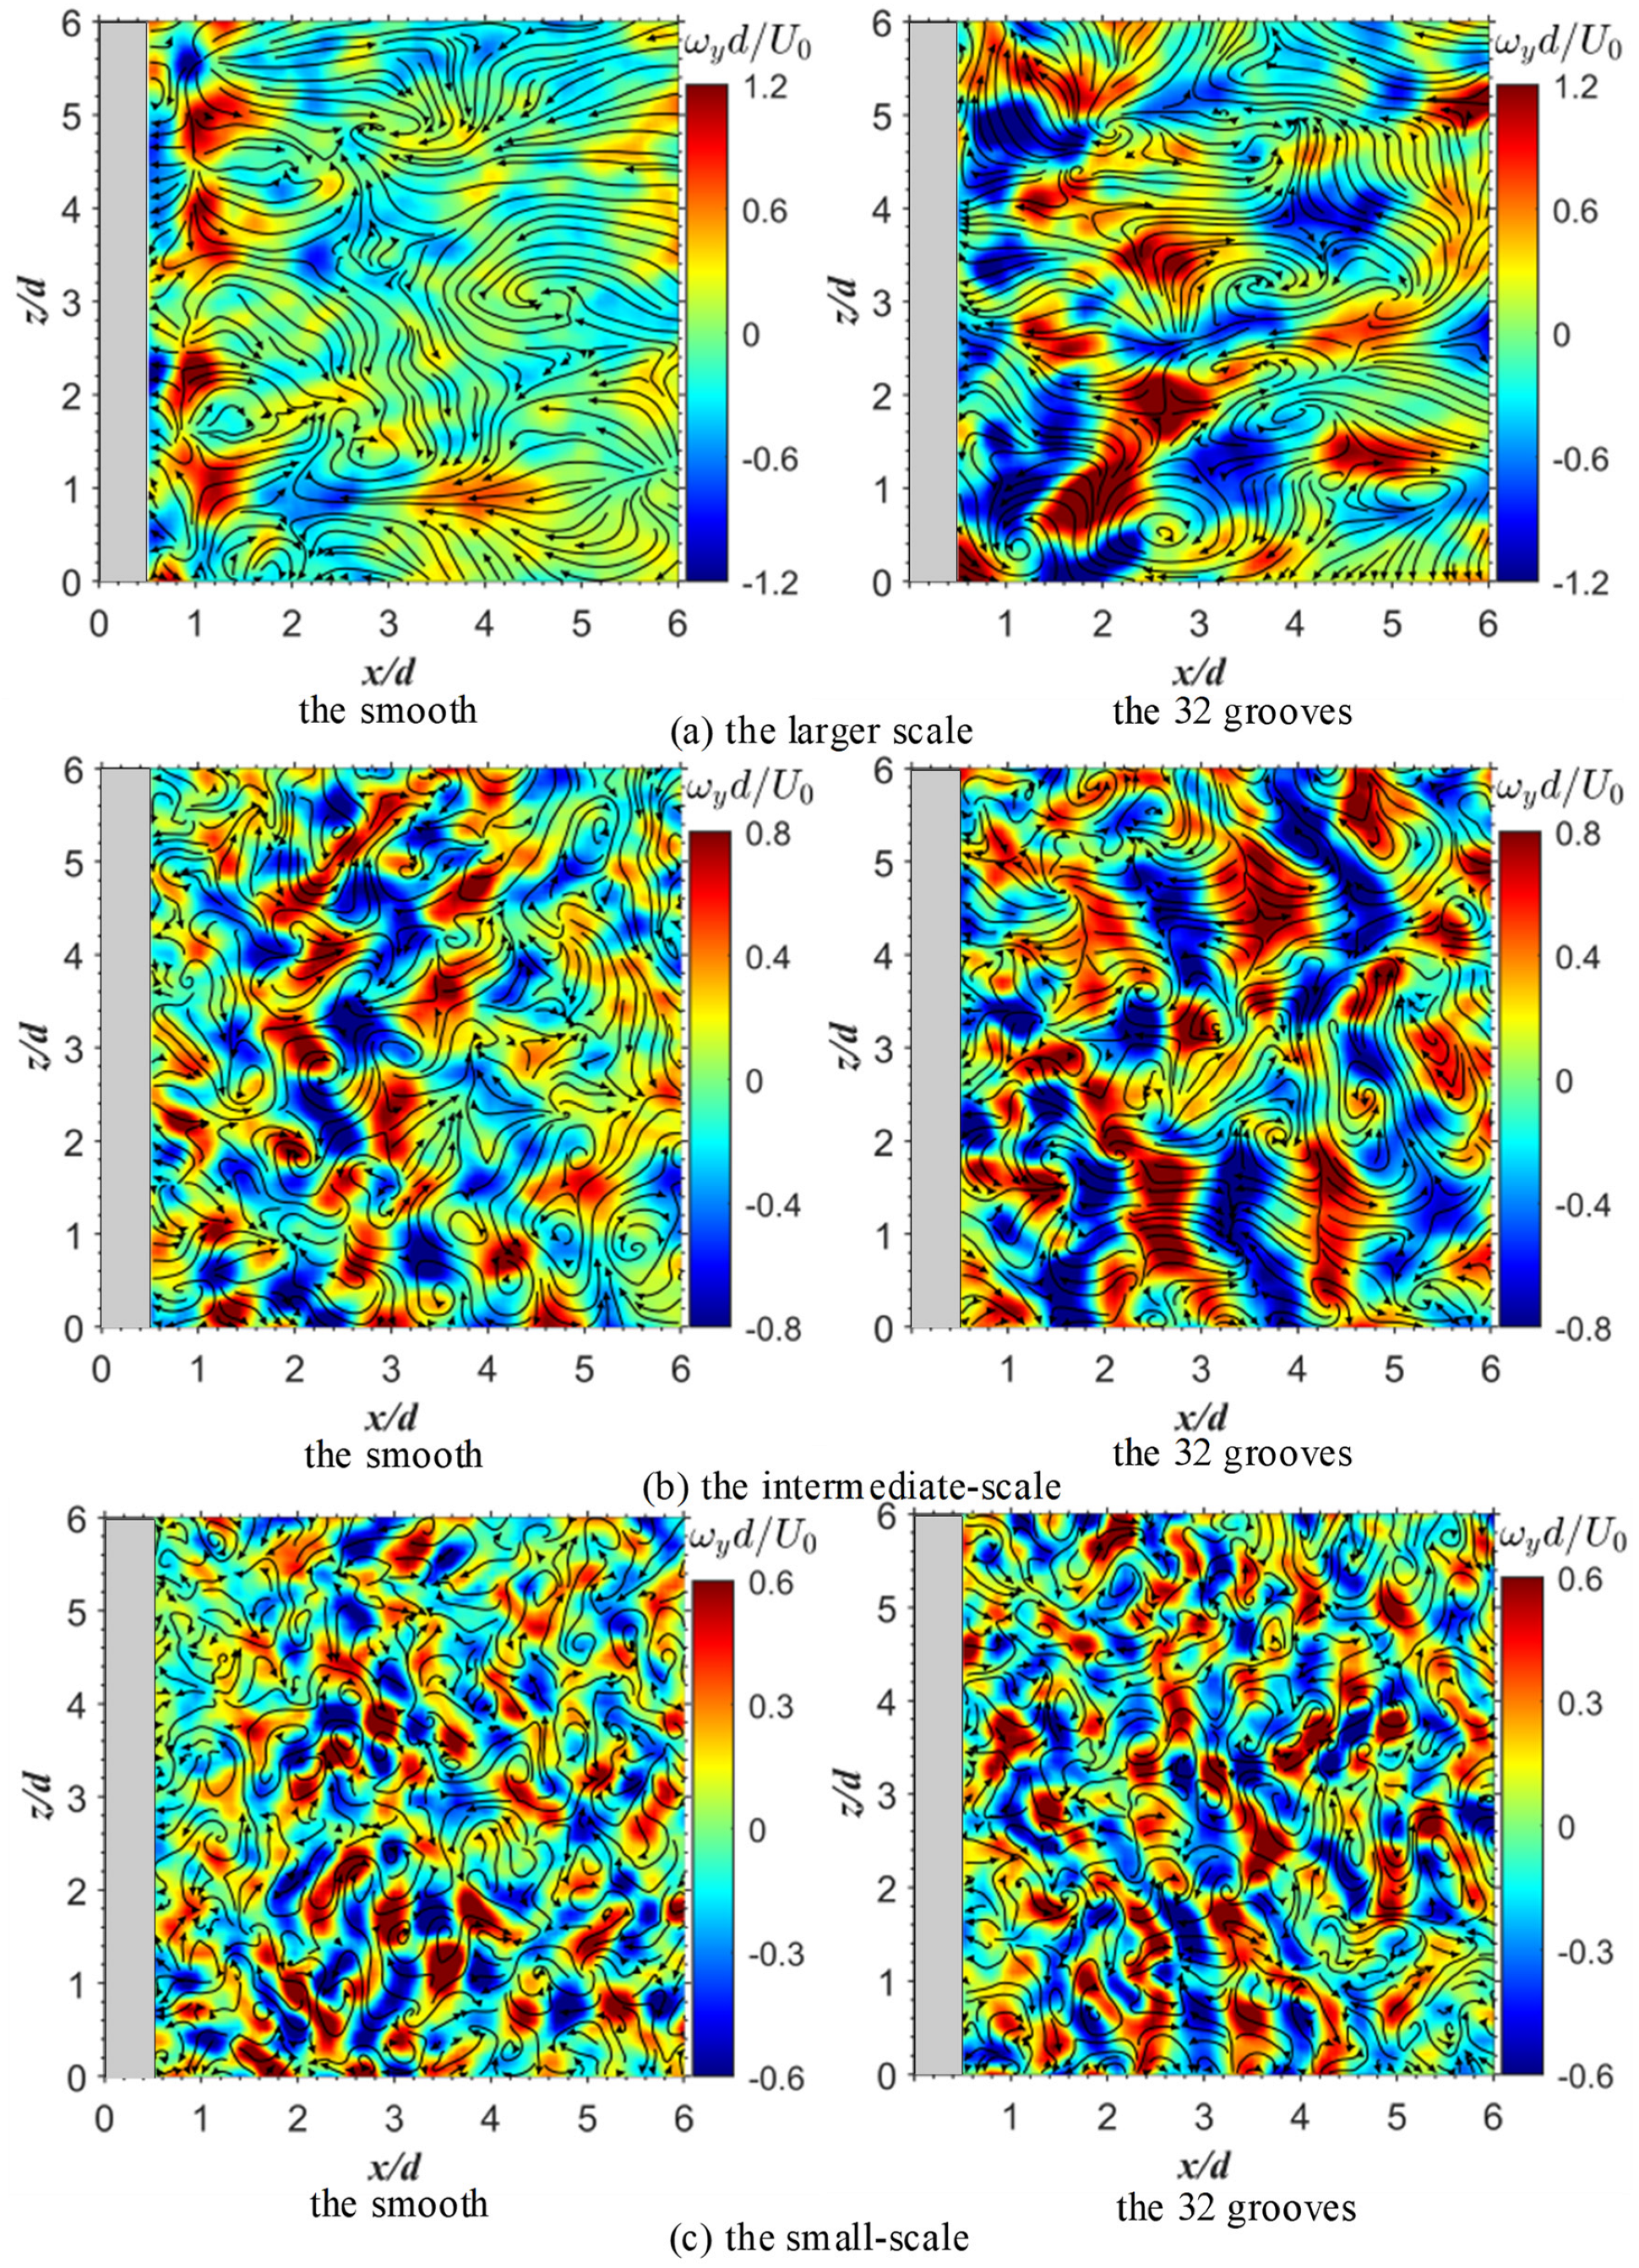
Figure 16a shows vertically oriented ribbed eddies in the wake circulation region, while downstream there were ribbed eddies in the flow direction. When comparing the smooth and 32-groove cylinders at the large scale (Figure 16a), it was observed that the ribbed vortex behind the 32-groove cylinder was shorter. This indicates a more substantial wake disturbance for the 32-groove cylinder, which is consistent with the results of the flow plane. When the scale was reduced to intermediate and small scales (Figure 16b, c), many ribbed vortices were observed perpendicular to the flow direction. This indicates that the vortex diffusion was concentrated in the (x, y)-plane.
The large-scale vorticity shows that the Karman-like vortices of the grooved cylinders were closer to the trailing edge of the cylinder. The intermediate-scale vorticity shows more vortices behind the grooved cylinder. The small-scale vorticity shows stronger vortex oscillations. Furthermore, it is important to describe the shear velocity by the Reynold shear stress.
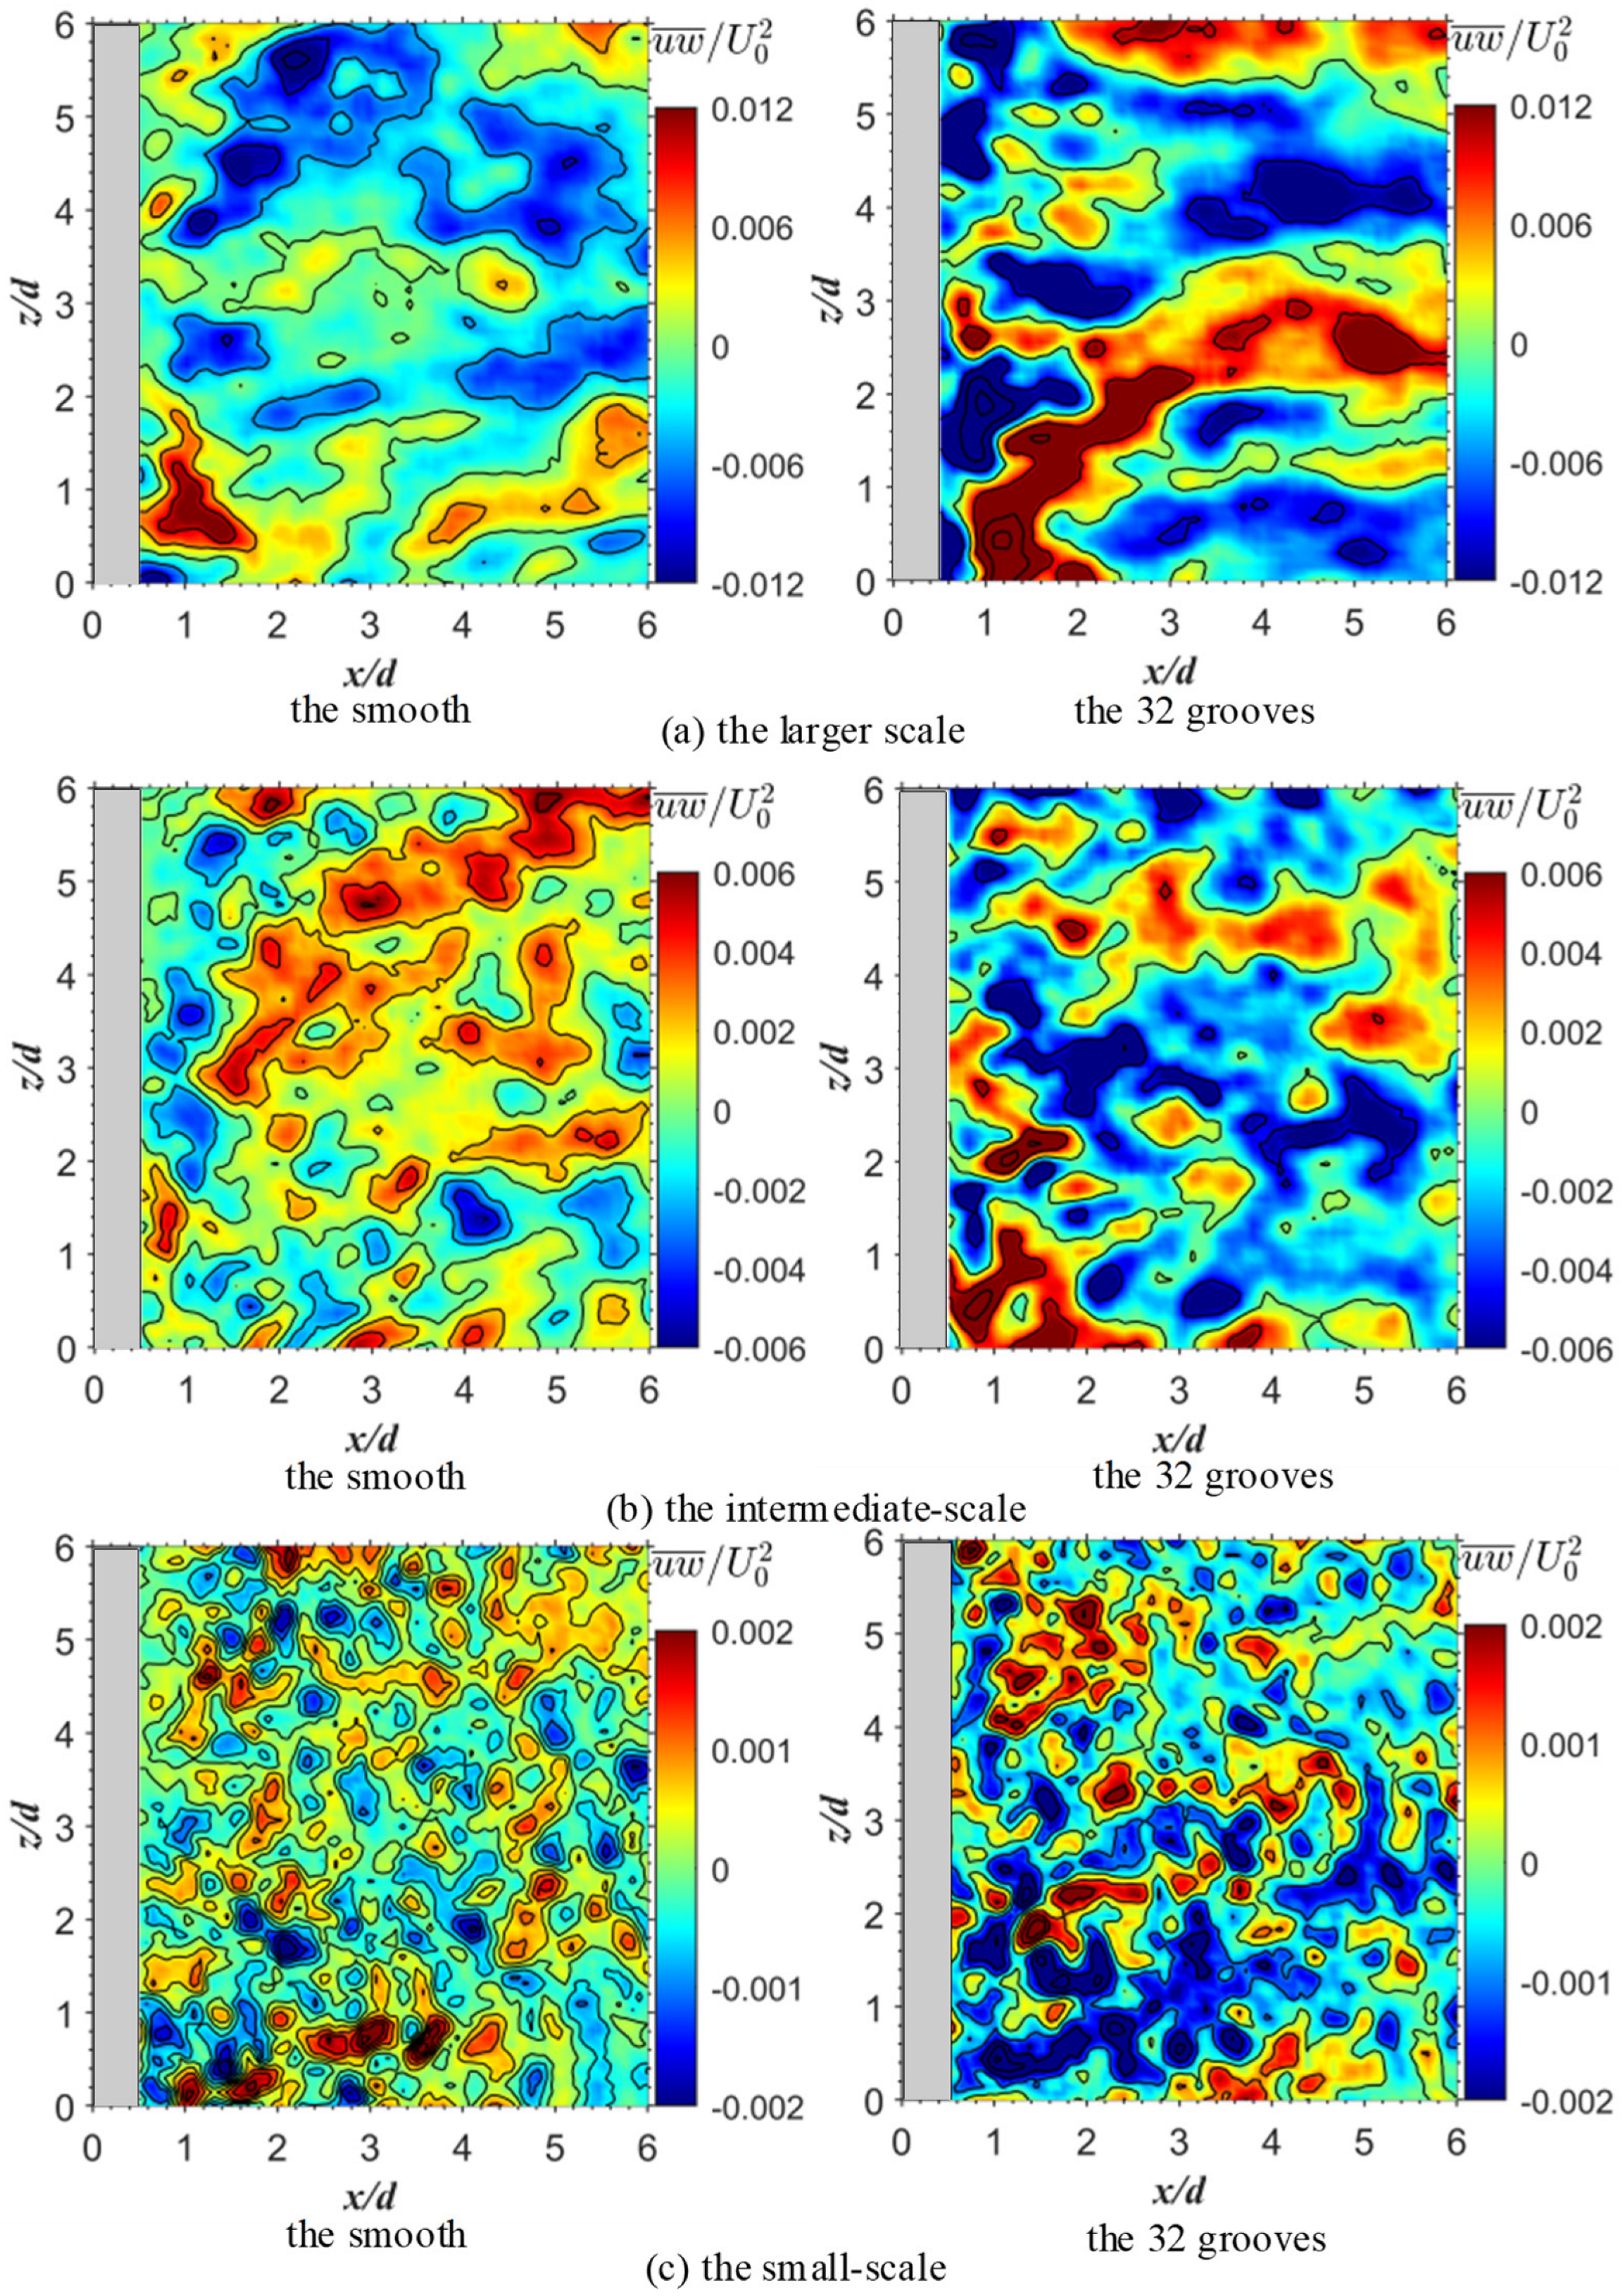
3.8. Reynold Shear Stress Contour of Different Scales
As shown in Figure 17a, the Reynolds shear stresses were more significant in the wake behind the grooved cylinder, and the position of the peak advanced further upstream. This indicates that the v-groove cylinders caused a narrowing of the velocity shear portion of the wake, which corresponds to Figure 7. At the intermediate scale (Figure 17b), the maximum shear stress of the 32-groove cylinder was more significant than that of the smooth cylinder. The shear layer instability increased the intensity of turbulence behind the v-groove cylinders. When comparing the small-scale structures' instabilities (Figure 17c), which represent the locations of the shear layer instabilities, it can be seen that the dissipation of the internal shear stresses was caused by shear-to-rotation transport processes and the dissipation of the internal shear stresses behind the v-groove cylinder had advanced.
Figure 18 shows the Reynolds shear stress distributions in the (x, z)-plane. It can be seen that the maximum Reynolds stress region of the 32-groove cylinder was broader and more robust than that of the smooth cylinder at the large scale (Figure 18a). These results are the same as the Reynolds shear stress at the large scale in the (x, y)-plane. At the intermediate scale (Figure 18b) and the small scale (Figure 18c), the location of the positive and negative region in the 32-groove cylinder appeared to be closer to the cylindrical wall surface than in the smooth cylinder. This also means that the shear stress caused turbulent instability in the recirculation region.
4. Conclusions
In this study, the near wake structures for the smooth cylinder and the cylinder with varying numbers of grooves are measured. One-dimensional orthogonal wavelet analysis extracts the multi-scale structures from the smooth and 32-groove cylinders. More detailed conclusions are as follows:
- (1)
- The results of the time-averaged velocity profile showed that the v-groove can reduce the width of the reflux section and the velocity gradient. The v-groove can reduce the recirculation region, increase the Reynolds shear stress and the turbulent kinetic energy, and prevent the formation of Karman-like vortices. The number of grooves does not affect the recirculation region.
- (2)
- When comparing the smooth and 32-groove cylinders at different scales of vorticity, it was observed that at the large scale, the Karman-like vortices of the grooves were closer to the trailing edge of the cylinder. At the intermediate scale, there were more vortices behind the 32-groove cylinder, whereas at the small scale, strong vortex oscillations were observed behind the grooved cylinder.
- (3)
- When comparing the smooth and 32-groove cylinders at different shear stress scales, it was confirmed that at the large scale, the v-groove surface can reduce the recirculation region. At the intermediate and small scales, the shear layer instability creates vortices, increasing the turbulent kinetic energy and narrowing the wake region.
This work shows the multi-scale wake structure of grooved cylinders. In future studies, two approaches can be taken: one is to study the transports of momentum and turbulent kinetic energy (TKE) for different cylinders’ surfaces to promote a deeper understanding of the interaction between the flow and the groove, and the other is to apply the new normalized Rortex identification method to the multi-scale wake structure.
Author Contributions
Conceptualization, S.J.; methodology, S.J.; validation, F.Y. and S.J.; formal analysis, S.J.; investigation, F.Y.; data curation, S.J.; writing—original draft preparation, S.J.; writing—review and editing, S.J. and F.Y.; visualization, J.Z.; Supervision, B.S. All authors have read and agreed to the published version of the manuscript.
Funding
This research received no external funding.
Institutional Review Board Statement
The authors choose to exclude this statement.
Informed Consent Statement
Not applicable.
Data Availability Statement
No new data were created or analyzed in this study. Data sharing is not applicable to this article.
Acknowledgments
The author wishes to acknowledge the support provided by the Natural Science Foundation of Jiangsu Province of China (No.BK20190103) and the National Natural Science Foundation of China (No. 52071160).
Conflicts of Interest
The authors declare no conflict of interest.
Nomenclature
| d | the diameter of the smooth cylinder | the low-frequency coefficients | |
| the center frequency | s | the area of the cross-section | |
| h | the height of the v-groove | st | the Strouhal number |
| L | the length of the smooth cylinder | TKE | the turbulent kinetic energy |
| the length of two vortices | the maximum turbulent kinetic energy | ||
| the width between the two foci points | the flow velocity | ||
| the wavelet basis matrix | the horizontal velocities | ||
| p | the distance between two measured points | the flow-fluctuating velocities at different levels | |
| the permutation matrices | the fluctuation velocity | ||
| Q | the quantity of flow | the normalized time-averaged stream-wise velocity | |
| Re | the Reynolds number | the normalized Reynolds stress | |
| the spatial correlation coefficient | the longitudinal velocities | ||
| the integral length scale | the wavelet analysis matrix | ||
| the relative energy | the wall-normal velocities | ||
| the length from the reference point to the space point | the normalized vorticity | ||
| S | the wavelet coefficient matrix | the referenced point |
References
- Hwang, J.Y.; Yang, K.S. Drag reduction on a circular cylinder using dual detached splitter plates. J. Wind Eng. Ind. Aerodyn. 2007, 95, 551–564. [Google Scholar] [CrossRef]
- Liu, K.; Deng, J.; Mei, M. Experimental study on the confined flow over a circular cylinder with a splitter plate. Flow Meas. Instrum. 2016, 51, 95–104. [Google Scholar] [CrossRef]
- Zhou, T.; Razali, S.; Hao, Z.; Cheng, L. On the study of vortex-induced vibration of a cylinder with helical strakes. J. Fluids Struct. 2011, 27, 903–917. [Google Scholar] [CrossRef]
- Yang, Y.; Laima, S. Three-dimensional effects for flow past a wavy cylinder at low Reynolds numbers. Ocean Eng. 2022, 263, 112427. [Google Scholar] [CrossRef]
- Ying, Z.L.; Liu, L.S.; Yu, J. TR-PIV measurement of the wake behind a grooved cylinder at low Reynolds number. J. Fluids Struct. 2011, 27, 394–407. [Google Scholar] [CrossRef]
- Yamagishi, Y.; Oki, M. Effect of the number of grooves on flow characteristics around a circular cylinder with triangular grooves. J. Vis. 2005, 8, 57–64. [Google Scholar] [CrossRef]
- Quintavalla, S.J.; Angilella, A.J.; Smits, A.J. Drag reduction on grooved cylinders in the critical Reynolds number regime. Exp. Therm. Fluid Sci. 2013, 48, 15–18. [Google Scholar] [CrossRef]
- Qi, J.; Qi, Y.; Chen, Q.; Yan, F. A Study of Drag Reduction on Cylinders with Different V-Groove Depths on the Surface. Water 2022, 14, 36. [Google Scholar] [CrossRef]
- Williamson, C. The natural and forced formation of spot-like “vortex dislocations” in the transition wake. J. Fluid Mech. 1992, 243, 393–441. [Google Scholar] [CrossRef]
- Naghib-Lahouti, A.; Lavoie, P.; Hangan, H. Wake instabilities of a blunt trailing edge profiled body at intermediate Reyn-olds numbers. Exp. Fluids 2014, 55, 1–15. [Google Scholar] [CrossRef]
- De, A.K.; Sarkar, S. Wake events during early three-dimensional transition of a circular cylinder placed in shear flow. Phys. Fluids 2020, 32, 053603. [Google Scholar] [CrossRef]
- Talley, S.; Iaccarino, G.; Mungal, G.; Mansour, N. An experimental and computational investigation of flow past cacti. Annu. Res. Briefs Cent. Turbul. Res. NASA AmesStanford Univ. 2001, 51–63. [Google Scholar]
- Fujisawa, N.; Hirabayashi, K.; Yamagata, T. Aerodynamic noise reduction of circular cylinder by longitudinal grooves. J. Wind Eng. Ind. Aerodyn. 2020, 199, 104129. [Google Scholar] [CrossRef]
- Addison, P.S.; Murray, K.B.; Watson, J.N. Wavelet transform analysis of open channel wake flows. J. Eng. Mech. 2001, 127, 58–70. [Google Scholar] [CrossRef]
- Fujimoto, S.; Rinoshika, A. Wavelet multi-resolution analysis on turbulent wakes of asymmetric bluff body. Int. J. Mech. Sci. 2015, 92, 121–132. [Google Scholar] [CrossRef]
- Rinoshika, A.; Omori, H. Orthogonal wavelet analysis of turbulent wakes behind various bluff bodies. Exp. Therm. Fluid Sci. 2011, 35, 1231–1238. [Google Scholar] [CrossRef]
- Yan, Z.A.; Lin, D.; Arc, D. Multi-scale wake structures around the dune. Exp. Therm. Fluid Sci. 2019, 104, 209–220. [Google Scholar] [CrossRef]
- Rinoshika, A.; Zhou, Y.U. Orthogonal wavelet multi-resolution analysis of a turbulent cylinder wake. J. Fluid Mech. 2005, 524, 229–248. [Google Scholar] [CrossRef] [Green Version]
- Sun, C.; Zhou, T.; An, H.; Zhu, H.; Cheng, L. Experimental studies on wake structures of a circular cylinder with different surface roughness heights. Int. J. Heat Fluid Flow 2022, 94, 108941. [Google Scholar] [CrossRef]
- Lim, H.C.; Lee, S.J. PIV measurements of near wake behind a U-grooved cylinder. J. Fluids Struct. 2004, 18, 119–130. [Google Scholar] [CrossRef]
- Lee, S.J.; Lim, H.C.; Han, M.; Lee, S.S. Flow control of circular cylinder with a V-grooved micro-riblet film. Fluid Dyn. Res. 2005, 37, 246–266. [Google Scholar] [CrossRef]
- Zhou, B.; Wang, X.; Guo, W.; Gho, W.M.; Tan, S.K. Experimental study on flow past a circular cylinder with rough surface. Ocean Eng. 2015, 109, 7–13. [Google Scholar] [CrossRef]
Figure 1.
Experimental models: (a) smooth cylinder, (b) 12-groove cylinder, (c) 24-groove cylinder, (d) 32-groove cylinder.
Figure 1.
Experimental models: (a) smooth cylinder, (b) 12-groove cylinder, (c) 24-groove cylinder, (d) 32-groove cylinder.

Figure 2.
PIV measurement setup and measurement planes.

Figure 3.
Schematic diagram of wake velocity extraction location.

Figure 4.
Profiles of time-averaged stream-wise velocities in the (x, y)-plane.

Figure 5.
Profiles of time-averaged stream-wise velocities in the (x, z)-plane.

Figure 6.
Time-averaged streamlines in the (x, y)-plane.

Figure 7.
Time-averaged Reynolds shear stress distribution in the (x, y)-plane.

Figure 8.
Time-averaged streamlines and Reynolds shear stress distributions in the (x, z)-plane.

Figure 9.
Contours of the turbulent kinetic energy in the (x, y)-plane.

Figure 10.
Contours of the turbulent kinetic energy in the (x, z)-plane.

Figure 11.
Instantaneous streamlines and normalized vorticity contours in the (x, y)-plane.

Figure 12.
Instantaneous streamlines and normalized vorticity contours in the (x, z)-plane.

Figure 13.
Relative energy ratio of eight wavelet levels in (x, y)- and (x, z)-plane. (a) Smooth cylinder in the (x, y)-plane (), (b) 32-groove cylinder in the (x, y)-plane (), (c) smooth cylinder in the (x, z)-plane (), (d) 32-groove cylinder in the (x, z)-plane ().
Figure 13.
Relative energy ratio of eight wavelet levels in (x, y)- and (x, z)-plane. (a) Smooth cylinder in the (x, y)-plane (), (b) 32-groove cylinder in the (x, y)-plane (), (c) smooth cylinder in the (x, z)-plane (), (d) 32-groove cylinder in the (x, z)-plane ().

Figure 14.
Power spectra of the measured and the three wavelet components at the points x/d = 0.6 and y/d = 0.5.
Figure 14.
Power spectra of the measured and the three wavelet components at the points x/d = 0.6 and y/d = 0.5.

Figure 15.
Multi-scale instantaneous streamlines and vorticity contours of the smooth and 32-groove cylinders in the (x, y)-plane.
Figure 15.
Multi-scale instantaneous streamlines and vorticity contours of the smooth and 32-groove cylinders in the (x, y)-plane.

Figure 16.
Multi-scale instantaneous streamlines and vorticity contours of the smooth and 32-groove cylinders in the (x, z)-plane.
Figure 16.
Multi-scale instantaneous streamlines and vorticity contours of the smooth and 32-groove cylinders in the (x, z)-plane.

Figure 17.
Multi-scale shear stress distributions of the smooth and 32-groove cylinders in the (x, y)-plane.
Figure 17.
Multi-scale shear stress distributions of the smooth and 32-groove cylinders in the (x, y)-plane.

Figure 18.
Multi-scale shear stress distributions of the smooth and 32-groove cylinder in the (x, z)-plane.
Figure 18.
Multi-scale shear stress distributions of the smooth and 32-groove cylinder in the (x, z)-plane.


Disclaimer/Publisher’s Note: The statements, opinions and data contained in all publications are solely those of the individual author(s) and contributor(s) and not of MDPI and/or the editor(s). MDPI and/or the editor(s) disclaim responsibility for any injury to people or property resulting from any ideas, methods, instructions or products referred to in the content. |
© 2023 by the authors. Licensee MDPI, Basel, Switzerland. This article is an open access article distributed under the terms and conditions of the Creative Commons Attribution (CC BY) license (https://creativecommons.org/licenses/by/4.0/).
Share and Cite
MDPI and ACS Style
Jiang, S.; Yan, F.; Zhang, J.; Song, B. Multi-Scale Wake Characteristics of the Flow over a Cylinder with Different V-Groove Numbers. Water 2023, 15, 805. https://doi.org/10.3390/w15040805
AMA Style
Jiang S, Yan F, Zhang J, Song B. Multi-Scale Wake Characteristics of the Flow over a Cylinder with Different V-Groove Numbers. Water. 2023; 15(4):805. https://doi.org/10.3390/w15040805
Chicago/Turabian StyleJiang, Suyu, Fei Yan, Jian Zhang, and Bo Song. 2023. "Multi-Scale Wake Characteristics of the Flow over a Cylinder with Different V-Groove Numbers" Water 15, no. 4: 805. https://doi.org/10.3390/w15040805
Note that from the first issue of 2016, this journal uses article numbers instead of page numbers. See further details here.