
Groundwater Vulnerability Assessment to Cemeteries Pollution through GIS-Based DRASTIC Index
by
 , , and
Vanessa Gonçalves
1,2,3 ,
,
Antonio Albuquerque
1,2,3,* ,
,
Paulo Carvalho
1,3,
Pedro Almeida
1,3 and
Victor Cavaleiro
1,3 
1
Department of Civil Engineering and Architecture, University of Beira Interior, Calcada Fonte do Lameiro 6, 6200-358 Covilha, Portugal
2
GeoBioTec, University of Beira Interior, Calcada Fonte do Lameiro 6, 6200-358 Covilha, Portugal
3
FibEnTech, University of Beira Interior, Calcada Fonte do Lameiro 6, 6200-358 Covilha, Portugal
*
Author to whom correspondence should be addressed.
Water 2023, 15(4), 812; https://doi.org/10.3390/w15040812
Submission received: 29 January 2023
/
Revised: 13 February 2023
/
Accepted: 16 February 2023
/
Published: 19 February 2023
(This article belongs to the Special Issue Groundwater Protection: Contaminant Transport Processes and Remediation Approaches)
Abstract
:Deposition of corpses in the ground is the most common burial practice, which can allow interactions between polluting compounds and the soil, groundwater, and surface water, which may afterwards lead to negative environmental impacts and risks to public health. The risk of cemeteries contaminating groundwater is related to their location, the quantity of clothes, metals and adornments buried, and geographical, geological, hydrogeological, and climatic factors. Using the DRASTIC index and geographical information system (GIS) tools, the potential for groundwater contamination was investigated in eight cemeteries located in the Figueira da Foz region (Portugal), which are the main anthropogenic pollution sources in the area. Aquifer vulnerability was assessed through the development of thirteen site characteristic maps, seven thematic maps, and a DRASTIC index vulnerability map, using GIS operation tools. No studies were found on the development of vulnerability maps with this method and digital tools. Cemeteries UC2, UC4, UC5, UC6, UC7, and UC8 are located within the zones susceptible to recharge, with an average recharge rate of 254 mm/year. Cemeteries UC5, UC7, and UC8 are expected to develop a greater water-holding capacity. The water table depth is more vulnerable at UC6, varying between 9.1 m and 15.2 m. However, results show only a high vulnerability associated with the UC4 cemetery with the contributions T,C > R,S > I > A > D, which should be under an environmental monitoring program. The area surrounding UC4 is characterized by a water table depth ranging between 15.2 m to 22.9 m, mainly fine-grained sands in both the vadose zone and the aquifer media, Gleyic Solonchaks at the topsoil, very unfavorable slope (0–2%), and high hydraulic conductivity (>81.5 m/day). The sensitivity analysis shows that the topography, soil media, and aquifer media weights were the most effective in the vulnerability assessment. However, the highest contributions to index variation were made by hydraulic conductivity, net recharge, and soil media. This type of approach not only makes it possible to assess the vulnerability of groundwater to contamination from cemeteries but also allows the definition of environmental monitoring plans as well as provides the entities responsible for its management and surveillance with a methodology and tools for its continuous monitoring.
1. Introduction
Most existing cemeteries were sited without studies on the potential risks to the environment or communities. Burial practices (e.g., burials, inhumation, cremation, water burials, burial to the sea, sky burials, and stone burials) might vary depending on geography, the country or people’s habits and customs, and religion. During the decomposition of bodies, urns, clothes, accessories such as jewelry, rings, and bracelets, and additives used in burials, significant amounts of pollutants can be released through leachate and reach groundwater and surface water through soil [1,2]. An adult human body weighing an average of 70 kg generates up to 40 L of leachate (i.e., 0.4 to 0.6 L of leachate can be produced per kg of body weight) [3], which represents around 62% of the mass of decomposed material [4]. The use of pesticides (e.g., herbicides, fungicides, and insecticides), fertilizers, and paint or varnishing products in cemeteries additionally releases other polluting compounds into the soil [5,6,7]. The main pollutants of concern are organic compounds such as formaldehyde and methanol; pharmaceutical compounds such as antibiotics, tranquilizers, diuretics, and anti-inflammatories; phenolic acid esters (they come from cosmetics, fertilizers, herbicides, paints, pesticides, pigments, solvents, and personal materials); microplastic compounds such as microfibers from clothing, nurdles, polyethylene, polypropylene, polyethylene, and terephthalate; nutrients such as nitrogen (mainly in the form of nitrate) and phosphorus (mainly in the form of phosphates); and heavy metals such as arsenic (As), cadmium (Cd), chromium (Cr), copper (Cu), iron (Fe), lead (Pb), mercury (Hg), nickel (Ni), silver (Ag), and zinc (Zn) [8,9,10,11,12,13,14,15]. Pathogen microorganisms such as bacteria (e.g., E. coli, Pseudomonas aeruginosa, C. perfringens, and Salmonella spp.), viruses, intestinal fungi, and protozoa were already detected in soils of closed cemeteries [3,16,17,18,19]. Analyses of soils in areas near cemeteries have found high levels of bacteriological contamination, showing the influence of burials on groundwater contamination [20]. Soil quality analyses conducted in areas close to cemeteries in China, South Africa, and Nigeria showed contamination associated with burial practices, especially with trace metals due to the use of coffins with painted metal ornaments or processed wood [11,21]. Tracer metals are of special concern because they are difficult to degrade and can accumulate in water, inhibiting some uses (e.g., irrigation, environmental or social uses, and aquaculture or even abstraction for producing drinking water), thus resulting in a lasting threat to public health [22]. Neckel et al. [1] found elevated concentrations of Cr, Cu, Fe, Pb, and Zn in three cemeteries located in Manaus (Brazil).
The assessment of risks from cemeteries should follow a framework with hazard identification, identification of consequences and their magnitude, and the significance of risk [23]. The vulnerability of potential environmental receptors must be assessed and can include groundwater (wells, springs, and boreholes) and surface water (lakes, rivers, and streams) used for drinking water or for industrial and agricultural uses. Groundwater vulnerability is the tendency or likelihood for contaminants to reach a specified position in the groundwater system after introduction at some location above the uppermost aquifer, involving intrinsic vulnerability, which refers to the characteristics that affect the migration of pollutants towards groundwater [24], and specific vulnerability, which depicts the susceptibility to a specific contaminant or group of contaminants, taking into account aspects such as biogeochemical attenuation processes [25]. The main factors controlling groundwater vulnerability to cemeteries are [5,23,26] soil characteristics (e.g., lithology, mineralogy, grain size distribution, structure, thickness, leaching potential, permeability, plasticity, chemical properties, and the presence of porous or fissured zones), depth of the water table (seasonal fluctuations), groundwater flow mechanisms (intergranular or fissured), abstraction rates, the extension of source protection zones, topography, land use (e.g., the presence of vegetation, agricultural practices, and urbanized areas), climatic characteristics (e.g., events of precipitation and temperature and evapotranspiration potential), the proximity of water sources, the size of cemeteries, and the number of burials. As groundwater vulnerability cannot be directly measured [27], several indicators have been proposed to evaluate the actual state, or to forecast future scenarios, of groundwater quality associated with potential contamination [28]. Several models to evaluate vulnerability have been proposed, including statistical techniques, process-based methodologies, and overlay and index methods [29]. Taghavi et al. [30] categorized groundwater vulnerability assessment methods into four groups: (i) overlay and index-based methods [31,32]; (ii) process-based simulation models [33]; (iii) statistical methods (including orthodox and Bayesian methods) [34,35]; and (iv) hybrid methods [36,37]. Other evaluations of groundwater vulnerability assessment techniques have been proposed elsewhere [25,27,38,39,40,41]. Groundwater contamination risk associated with cemeteries may be analyzed through the vulnerability-based DRASTIC index, proposed by Aller et al. [31] and already used for groundwater vulnerability assessment in many studies [42,43,44,45]. Some modified or updated versions have been developed to identify appropriate ratings and determine weights for DRASTIC’s parameters [44,46,47], reducing the subjectivity of the evaluation associated with the initial model. Due to the large amount of information necessary for creating vulnerability maps based on that index, geographical information systems (GIS) tools have been used for manipulating hydrogeomorphological, hydrogeological, soil characteristics, and soil use data [48,49]. The development of GIS-based thematic maps or vulnerability maps allows better aquifer management. Map algebra calculations allow mathematical operations between thematic maps, resulting in composite charts (vulnerability or susceptibility maps) of a spatial nature.
Alternative models have been developed such as the AVI based on the thickness of sedimentary units above the uppermost aquifer and hydraulic conductivity [50]; the REKS, which uses vulnerability criteria suitable for karst and karst-fissure groundwater systems [51]; the GRAM, which is based on a “multi-barrier” approach using the likelihood of release and contaminant pathways [52]; the GOD, which uses data from groundwater type, lithology for the unsaturated zone, and depth of groundwater [32]; the COD, which considers the special hydrogeological properties of karst [53]; the SINTACS, based on groundwater depth, effective infiltration, unsaturated zone attenuation capacity, soil/overburden attenuation capacity, saturated zone characteristics, hydraulic conductivity, and topographic data [54]; and the OREADIC, which considers hydrogeological factors specific of the Yinchuan Plain, Northwest China [55]. An innovative evaluation method combining aquifer intrinsic vulnerability and pollution source loading (modified DRATICL model) was developed by Zhang et al. [56] and it was applied for evaluating groundwater contamination risk in Guanzhong Basin (China) on a macro scale. The results showed that industries and landfills were the most likely pollution sources in the study area, and high vulnerability was observed in areas with shallow groundwater depth and high net recharge. Qian et al. [55] developed and applied the OREADIC model to several regions in the Yinchuan Plain of Northwest China and have identified several areas of high vulnerability to groundwater contamination by nitrates, which was associated with high rates of aquifer recharge, shallow depths to the water table, and highly permeable aquifer materials.
GISs have already been used for developing DRASTIC-based vulnerability studies; however, they mostly focus on contamination risk coming from wastewater facilities, garbage deposits, underground gas or fuel deposits, sanitary landfills, soils contaminated by industrial activities, and agricultural soils with excess of fertilizers (namely nitrate) or pesticides [29,37,43,45,57,58,59]. No specific studies were found with the application of the DRASTIC index to assess the vulnerability of aquifers to contamination from cemeteries. Sinan & Razack [60] assessed the vulnerability of the Haouz aquifer of Marrakech (Morocco) to various sources of pollution (e.g., industrial park of Marrakech, industrial facilities, cemeteries, and waste deposits located near the centers of Ourika and Tahanaout).
The objective of this study was to develop a DRASTIC-index-based vulnerability map for evaluating the risk of aquifer contamination associated with eight cemeteries in the Figueira da Foz region (Portugal), using GIS interpolation tools, because they are the biggest threats to groundwater contamination and its uses in those areas. Thus, the contamination possibility of cemeteries in the Figueira da Foz region was studied for the first time. The main novelty of the study is the application of this method for defining vulnerability maps to prevent pollution from cemeteries, which has great applicability both for the management of these spaces and for the selection of new spaces. The use of the most universally known DRASTIC approach is justified because it is easier to use, less time consuming, and suitable for use in the GIS framework and easy for technicians from environmental service management entities and city councils to apply and understand.
2. Materials and Methods
2.1. Location of Cemeteries and Local Characteristics
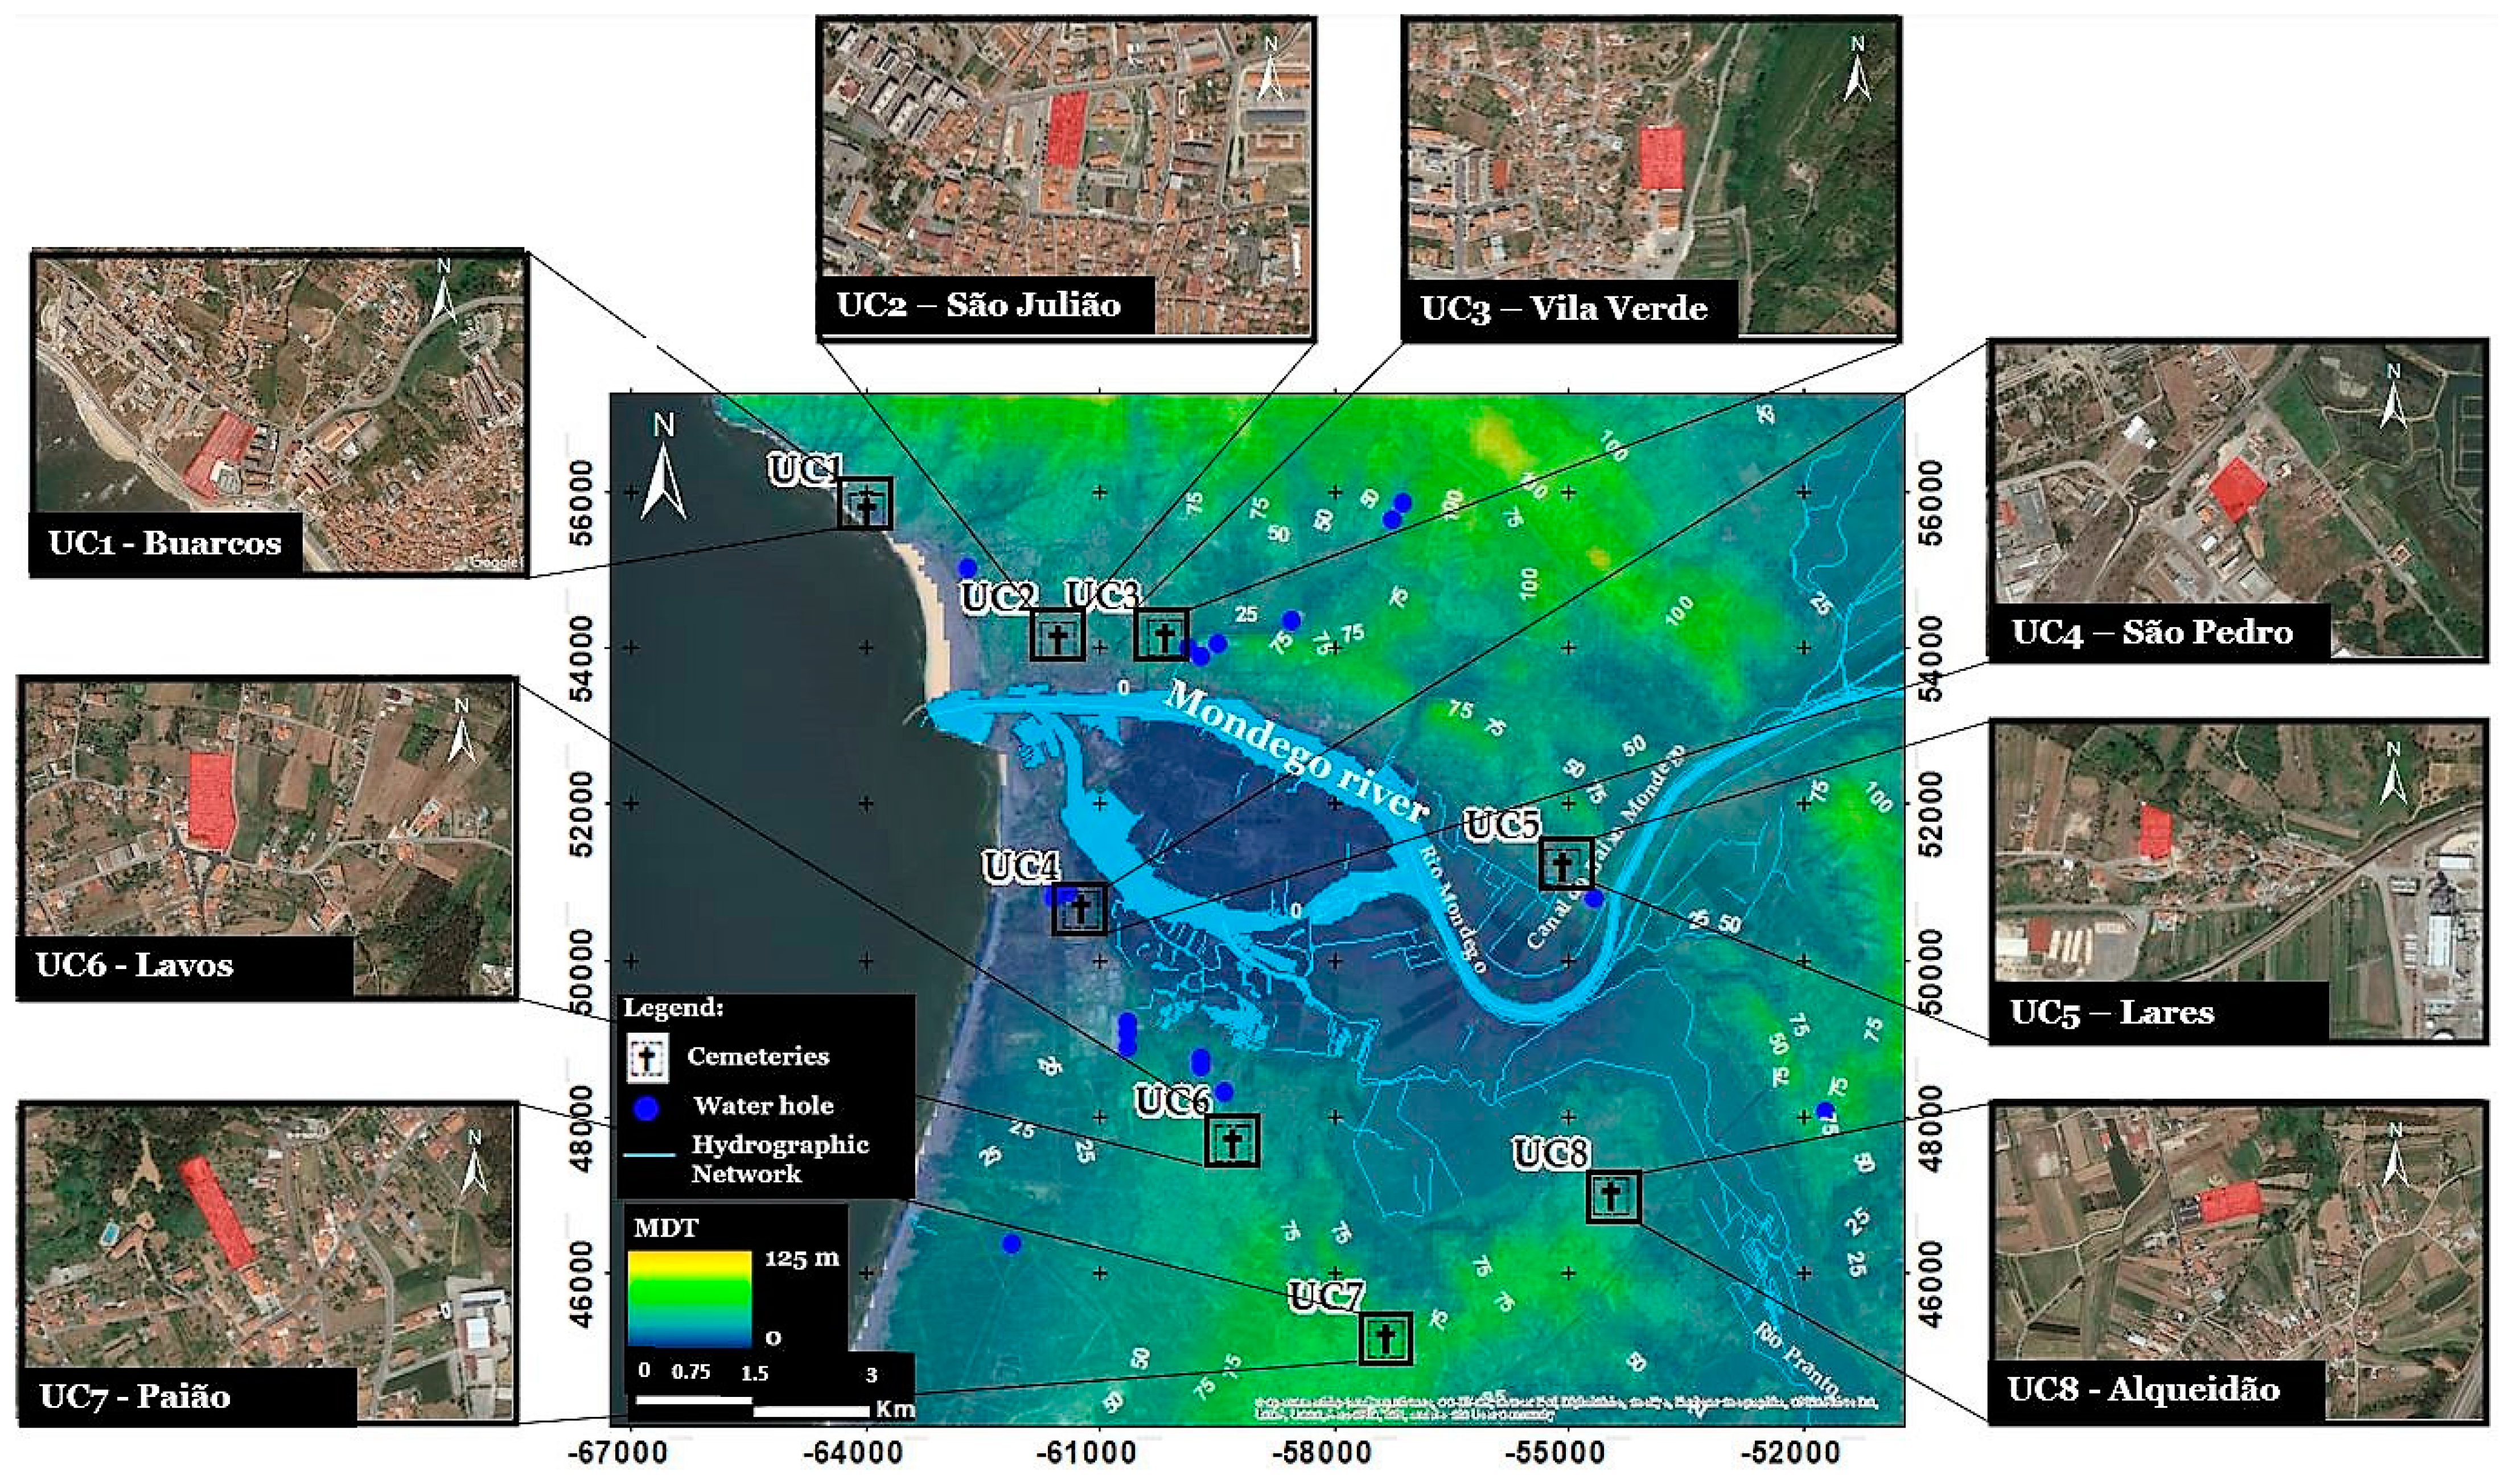
The following eight cemeteries located in the Figueira da Foz region (central region of Portugal) were used for this study: Buarcos, São Julião, and Vila Verde (identified as UC1, UC2, and UC3, respectively), São Pedro (identified as UC4), Lares (identified as UC5), Lavos (identified as UC6), Paião (identified as UC7), and Alqueidão (identified as C8), belonging to the municipality of Figueira da Foz (Figure 1). In the areas where the cemeteries are located, there are no other known sources of significant anthropogenic pollution and, therefore, they are the biggest threats to the quality of the groundwater. The Figueira da Foz region’s western strip has heights that are normally lower than 200 m and gradually go lower as one moves west. It relates to the Littoral Platform, a series of gently sloping reliefs. The Mondego River’s right bank has a much steeper relief, with a few tiny valleys interspersed and crossed by low-flow water lines.
2.2. Assessment of Groundwater Vulnerability
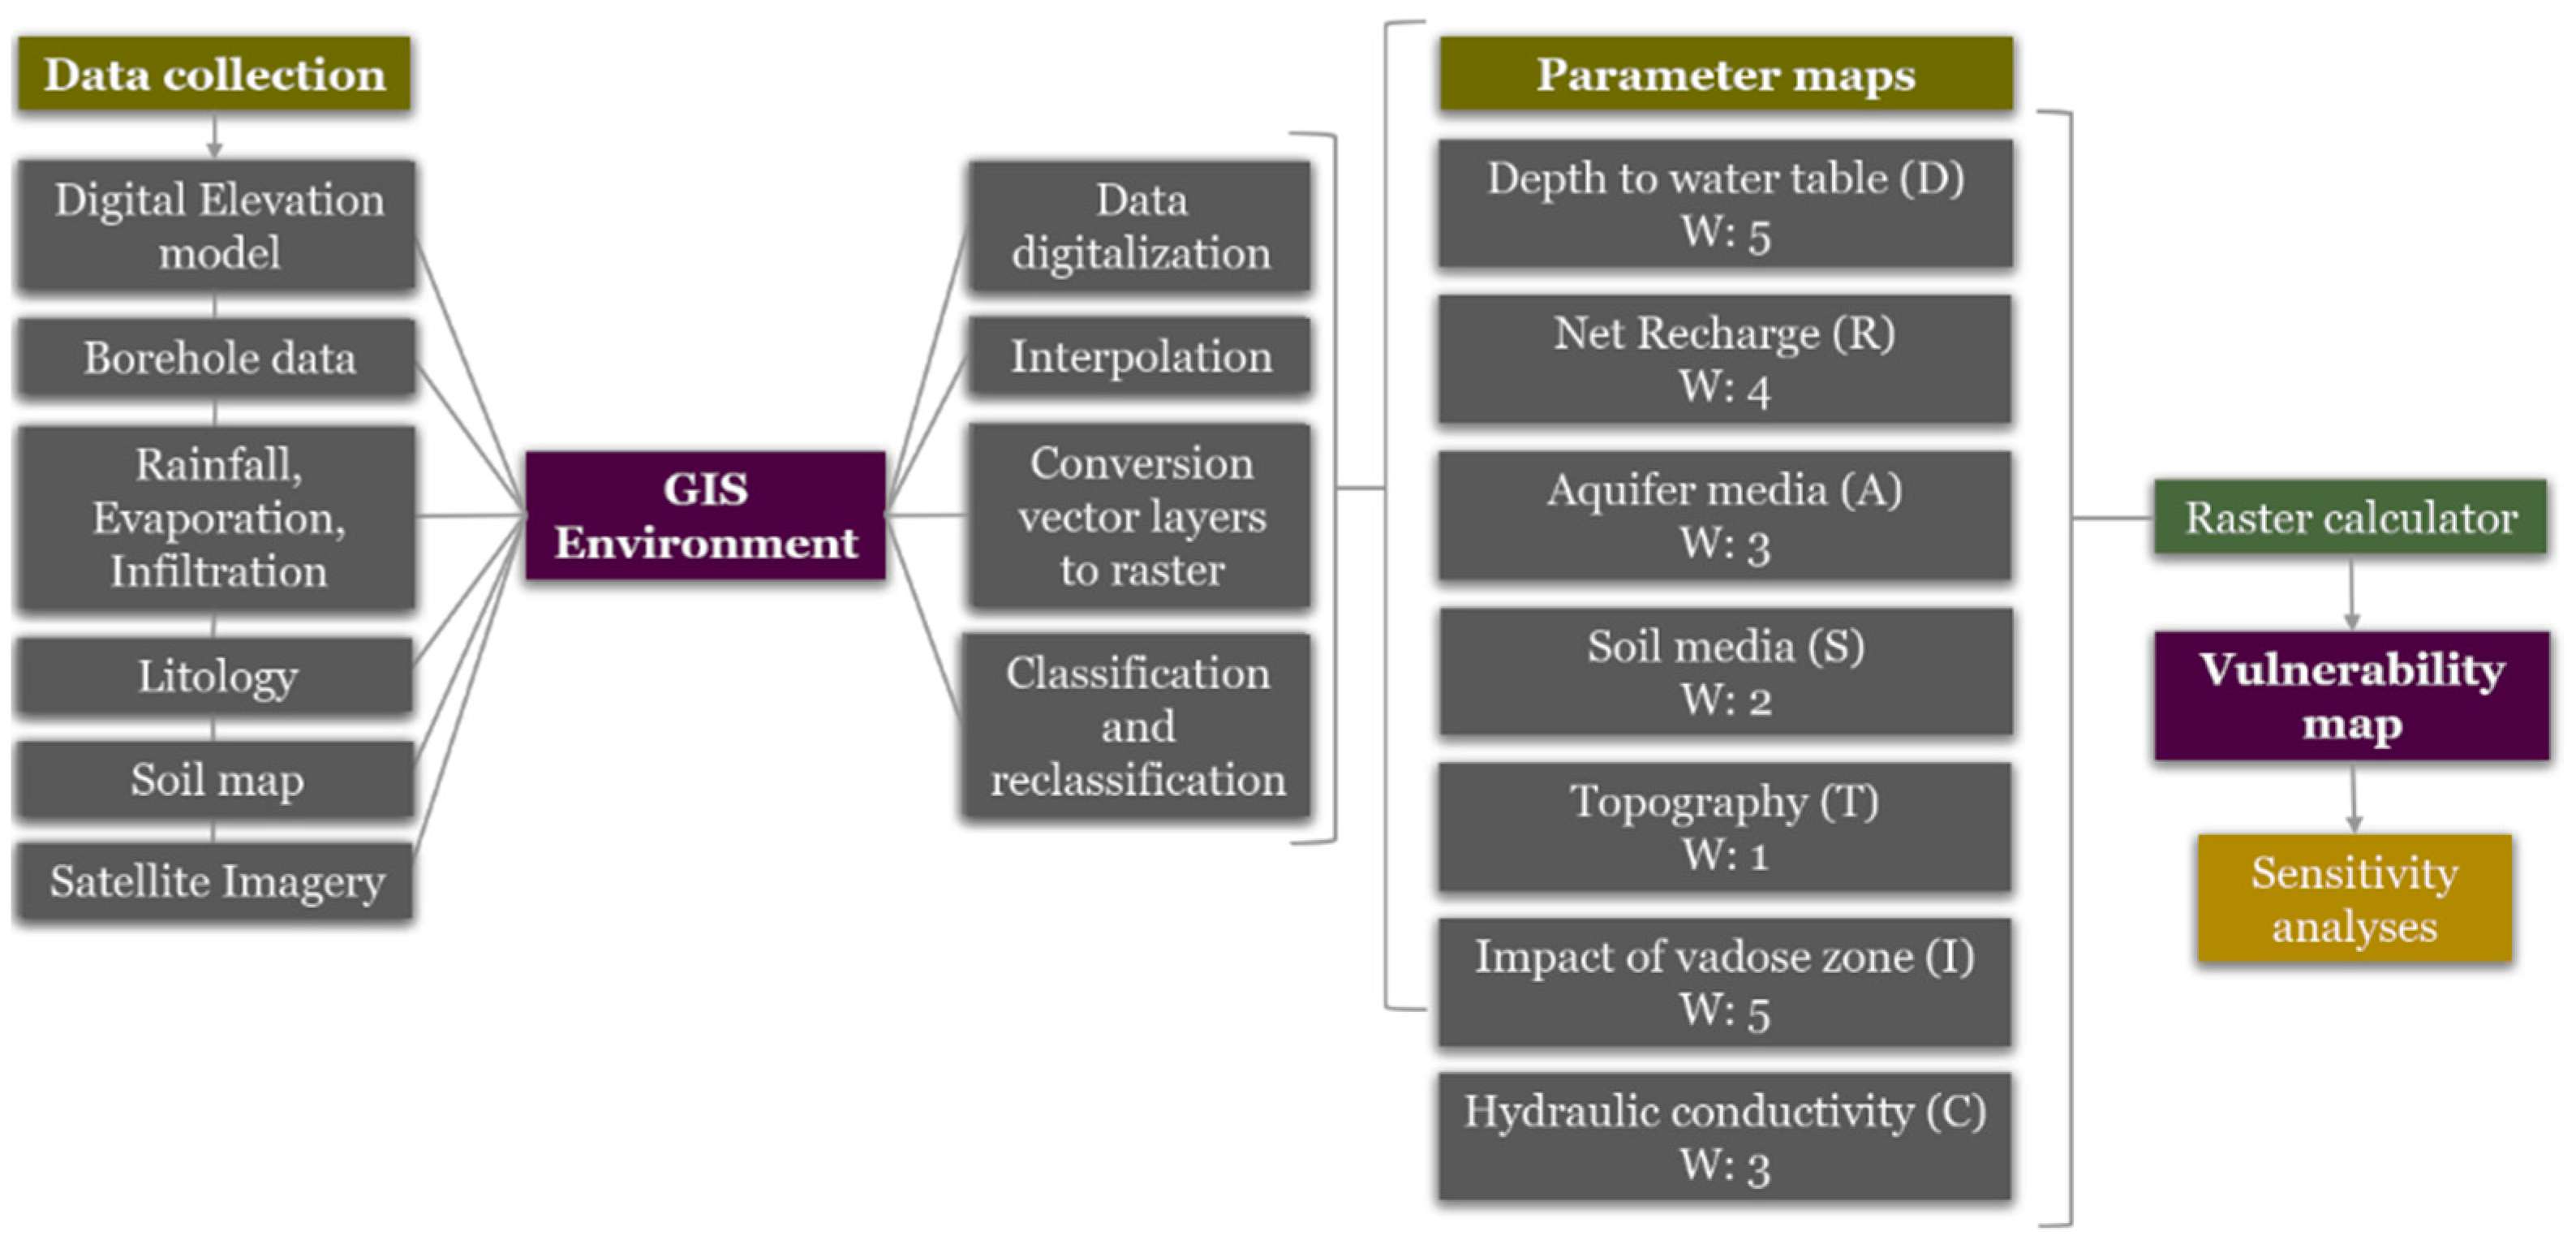
A three-step evaluation process was developed to assess the potential impacts of cemeteries’ runoff on the groundwater in the Figueira da Foz region. The first step involved evaluating the physical characteristics of the area where cemeteries are located and the development of the following thirteen site characteristic maps from national data sources and using ESRI’s ArcMap 10.8 software: slope, curvature, geological, hydrogeological, potential infiltration area, normalized difference moisture index (NDMI), land use and classification, amount of silt, amount of clay, amount of sand, pH, organic carbon, and cation exchange capacity (CEC). The DRASTIC index approach was used in the second phase to assess groundwater pollution vulnerability, and some of the site characteristic maps were used for developing seven thematic maps of the DRASTIC equation (Equation (1)). This index allows assessing the vulnerability of an aquifer by combining seven parameters [31]: depth to groundwater (D), net recharge (R), aquifer material typology (A), soil type (S), topography (T), impact of vadose zone (I), and hydraulic conductivity (C). Each parameter is further separated into representative classes, each of which is assigned a rating (r) ranging from 1 to 10 to correlate to the local hydrogeological characteristics.
where D, R, A, S, T, I, and C are the hydrogeologic parameters; r is the rating for the area being evaluated (1 to 10); and w is the weight for the factor (1 to 5).
DI = Dr × Dw + Rr × Rw + Ar × Aw + Sr × Sw + Tr × Tw + Ir × Iw + Cr × Cw
The weights (w) indicate how important each DRASTIC parameter is in relation to the other attributes. The higher the DRASTIC index number, the more vulnerable that area of the aquifer is to pollution. The steps used for developing the DRASTIC-index-based vulnerability map are presented in Figure 2. The adopted weights and ratings, proposed by Aller et al. [31], have been successfully validated in several international studies [45,47,57,58,59,60,61,62,63,64,65,66,67].
Parameter D will have an impact on the level of interaction between the percolating pollutants and the subsurface elements as well as the extent and degree of physical and chemical attenuation and degradation. Piezometric data were obtained from the Portuguese water resources information system (SNIRH) [68] and used to define parameter D, using a spatial interpolation method—the inverse distance weighted (IDW) method. The water that percolates through the ground surface and into the water table per unit area of land is represented by parameter R. It is affected by soil permeability, the slope of the land surface, surface cover, and the amount of water that recharges the aquifer. The Thornthwaite method was used to calculate the expected recharge rate. The union of areas with a slope lower or equal to 6% and soil curvature profiles lower or equal to 0 and the removal of artificial land allow producing a map of potential infiltration zones. Parameter A represents the attenuation potential as a function of lithology in the saturated zone and is intrinsically linked to geotechnical properties. To reduce the likelihood of pollution, parameter S assesses the properties of the soil in the upper weathered zone. This information was obtained at ISRIC [69] and SNIAMB [70]. Parameter T is connected to the slope variation (%) that influences drainage and makes flat regions vulnerable to contaminants that can persist and enter the aquifer. The slope map was prepared from a digital terrain model, created with topographic information collected in USGS [71]. In estimating vulnerability, parameter I is crucial because it affects the residence time of pollutants in the unsaturated zone and, subsequently, the likelihood of attenuation. The hydraulic gradient and groundwater flow are both affected by the aquifer’s ability to transport water, which is denoted by the C parameter. High-conductivity readings are associated with a high risk of contamination. This parameter was calculated using an abacus developed by Singhal and Gupta [72]. The data used to calculate the partial indices A, I, and C were derived from a geological map of Portugal on a scale of 1:500,000 from LNEG [73]. Based on the susceptibility of each soil and aquifer characteristic to pollution, weights (w) and ratings (r) were assigned to each one according to Figure 2 (for w) and the information found in Aller et al. [31] (for r) and validated in several international studies [45,47,62,64,65,66]. Using the raster calculator feature in ArcGIS, the seven hydrogeological layers were overlaid to create the DRASTIC vulnerability index map. The quantitative and qualitative classification of aquifer pollution susceptibility was adapted from the classes used by Hamza et al. [43] and LNEC [74] and is shown in Table 1. That classification is the most used in Portuguese studies.
The seven thematic maps of the DRASTIC index (one for each variable Equation (1)) were developed using some of the site characteristic maps as well as a variety of data collected from several sources and processed using ArcGIS tools. The work also involved the confirmation of the information through field visits. The computation procedure for generating the DRASTIC-based vulnerability map is presented in Equation (2) and was adopted from [58] involving the overlap of the seven thematic maps through arithmetic operations of maps according to Equation (1) and the values in Table 1. The value of each cell in the vulnerability map was generated using an arithmetic operation and the values were stored in each cell of each thematic map, following Equation (2). Finally, Equation (3) was inserted in the raster calculator function to generate the vulnerability map.
where () is the vector of cell values from each thematic map that is in line i and row j, m and n are the dimensions of the thematic grid map, k is the thematic map, tm is the number of thematic maps, and W is the vector of values associated with each cell.
where () is the vector of cell values for the suitability map that is in line i and row j, and m and n are the dimensions of the suitability grid map.
Sensitivity analysis on adopted rating values and weights is normally used to reduce subjectivity in the selection of rating ranges and to increase the reliability of vulnerability map results and analysis. A single parameter sensitivity analysis was carried out to assess the influence of each of the seven DRASTIC parameters on the vulnerability measure according to Equation (4) [62].
where W is the effective weight of a parameter in a polygon, Pr and Pw are the rating and weight of the parameter, respectively, and V is the overall vulnerability index of that polygon.
W = (Pr × Pw/V) × 100
3. Results and Discussion
3.1. Development of the Site Characteristic Maps
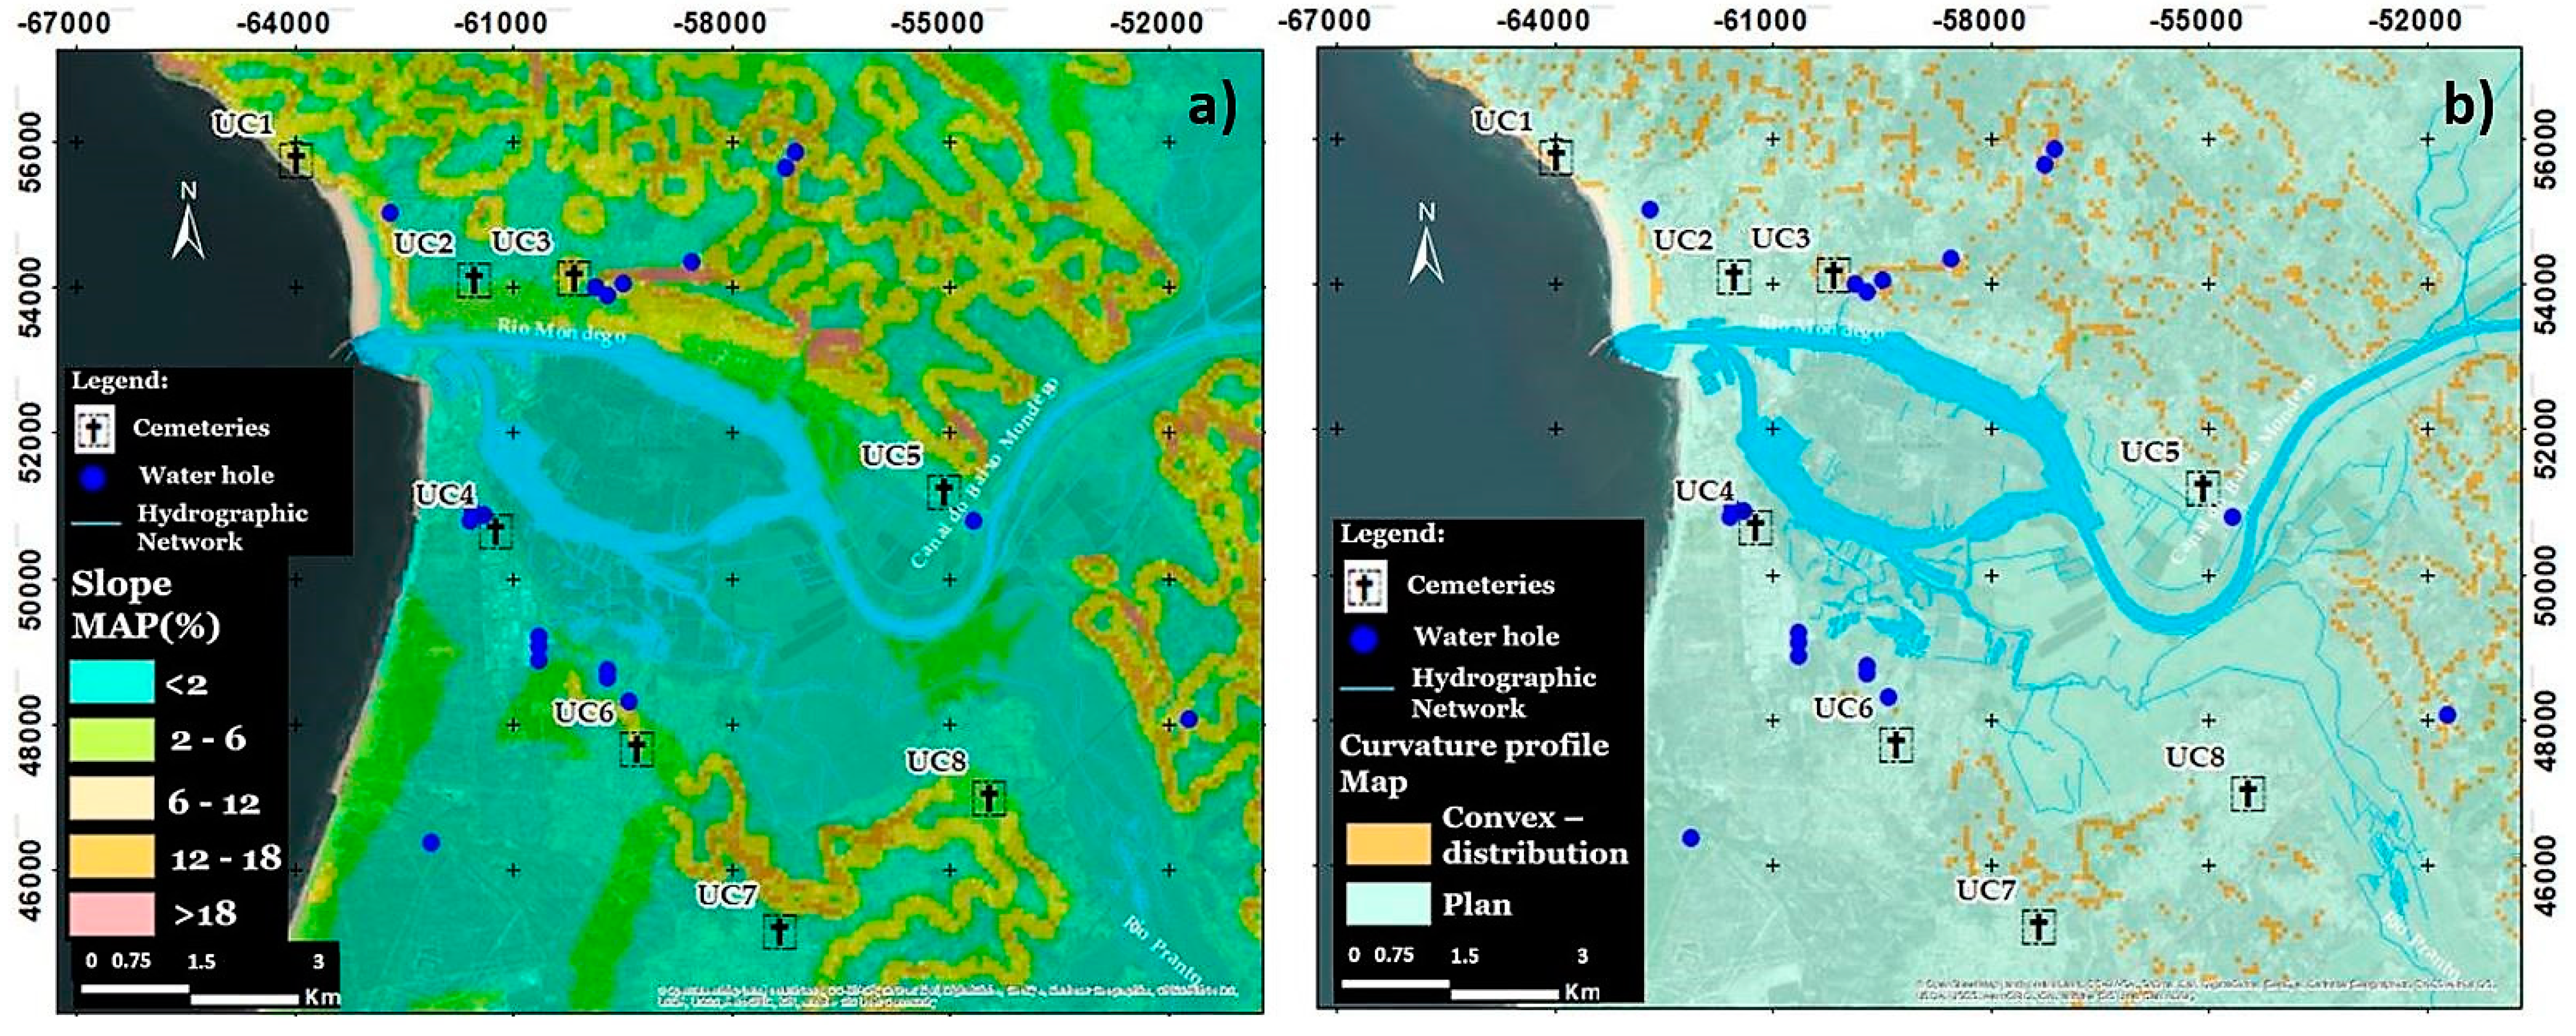
The slope map (Figure 3a) shows areas that are favorable for recharging aquifers as well as those that are susceptible to pollution infiltration. There are no cemeteries located on slopes greater than 12%. The cemeteries UC4, UC5, and UC7 have low slopes (0% to 2%); UC6 and UC8 have medium slopes (2% to 6%); and UC1 and UC3 have high slopes (6% to 12%). The physical features of a drainage basin can be specified using the curvature function result to better understand runoff processes. The curvature profile (Figure 3b) controls flow acceleration and slowing as well as erosion and deposition. Every cemetery is located on flat terrain. The vadose zone must be better studied since flat areas promote the accumulation of pollutants and their potential percolation through soil during rain events.
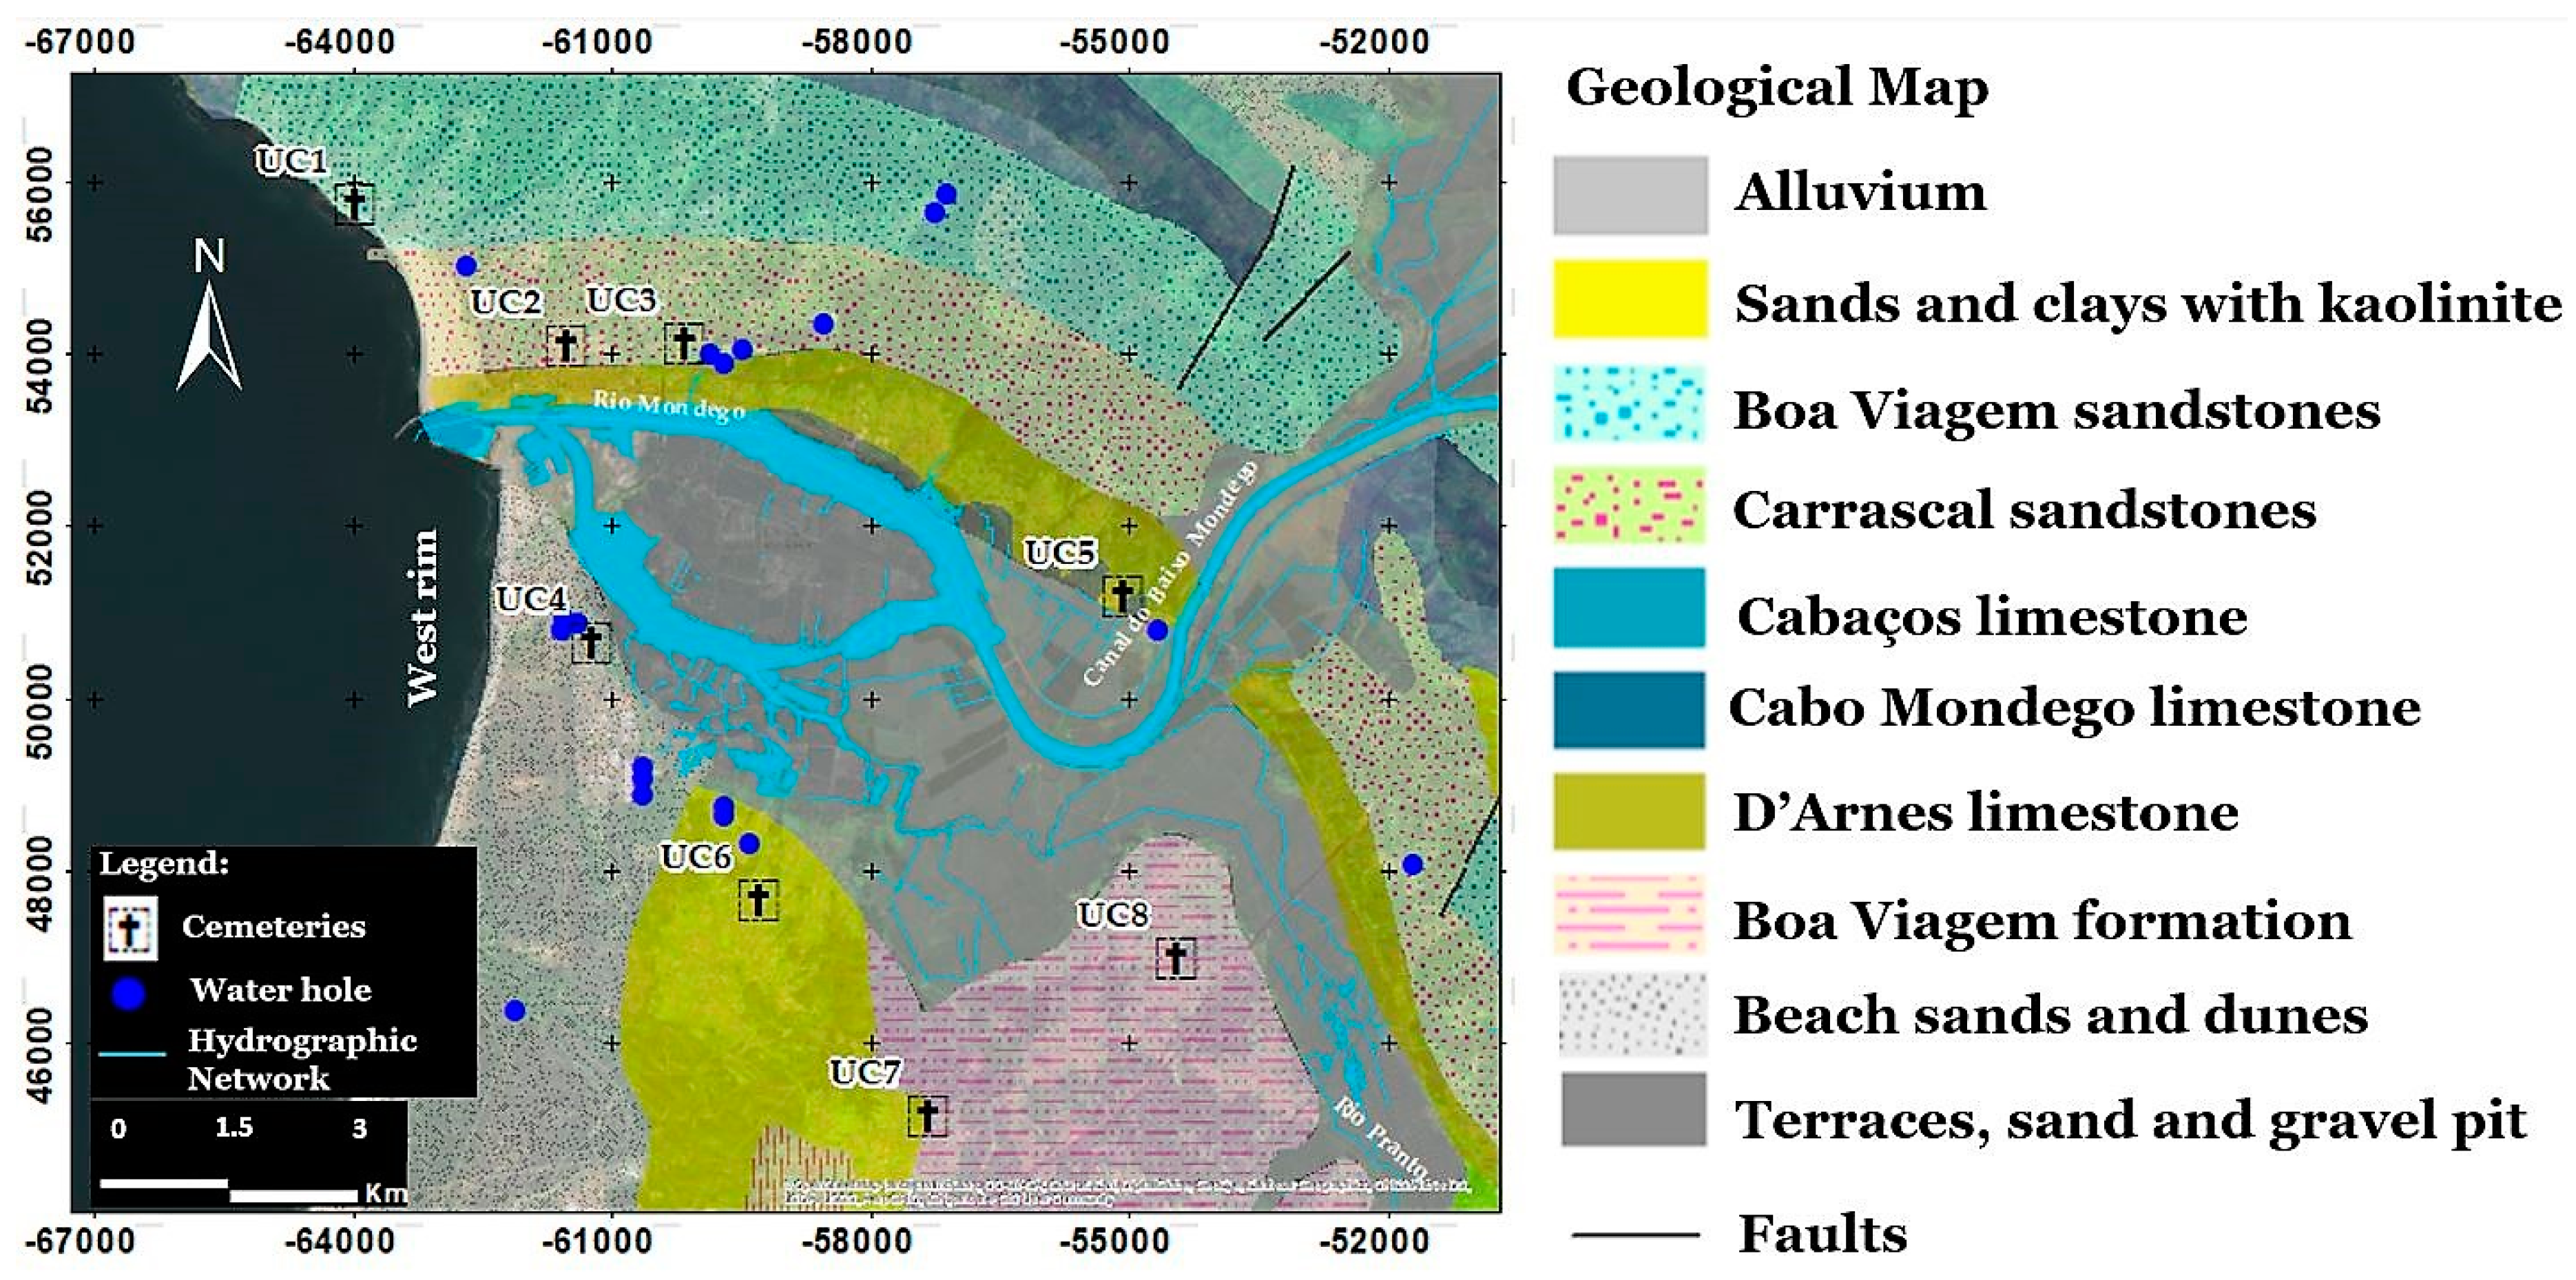
Figure 4 presents the geological characterization of the study area. The Figueira da Foz region’s geological history covers approximately 180 Myr and is characterized by the many Mesozoic evolution stages of the Lusitanian Basin as well as the more recent geodynamic setting of Cenozoic deposits [75]. The stratigraphic units in the study region are organized along a thick column that extends from the Mesozoic (Upper Triassic) to the present and lies discordantly at its base on Precambrian and Paleozoic metasediments. A substantial amount of the West Rim is covered with lower Cretaceous sandstones, clays, and marls that lie discordantly on Jurassic terrains [75]. The Carrascal sandstones are composed of clayey, fine to coarse conglomeratic sandstones with gravel and pebbles, and, often, sandy clays [29]. Granulometry shows that the size of the grains decreases from the bottom to the top of the formation, and it is based on disagreements regarding Jurassic formations [76]. The Serra D’Arnes limestones are concreted or piled marly limestones, limestone sandstones, and marls with a lapped surface [74]. Dunes sands are composed of fine-grained and calibrated sands. The Boa Viagem sandstones are a thick succession of fine to coarse sandstones, conglomerates, clays, and some marls that can occasionally be found in a variety of colours, including red, green, grey, and yellow [75]. Limestone and sandstone aquifers are particularly vulnerable to pollution because of a few features. Sinking streams and sinkholes are excellent sources of pollution transmission from the soil’s surface to the underground aquifer.
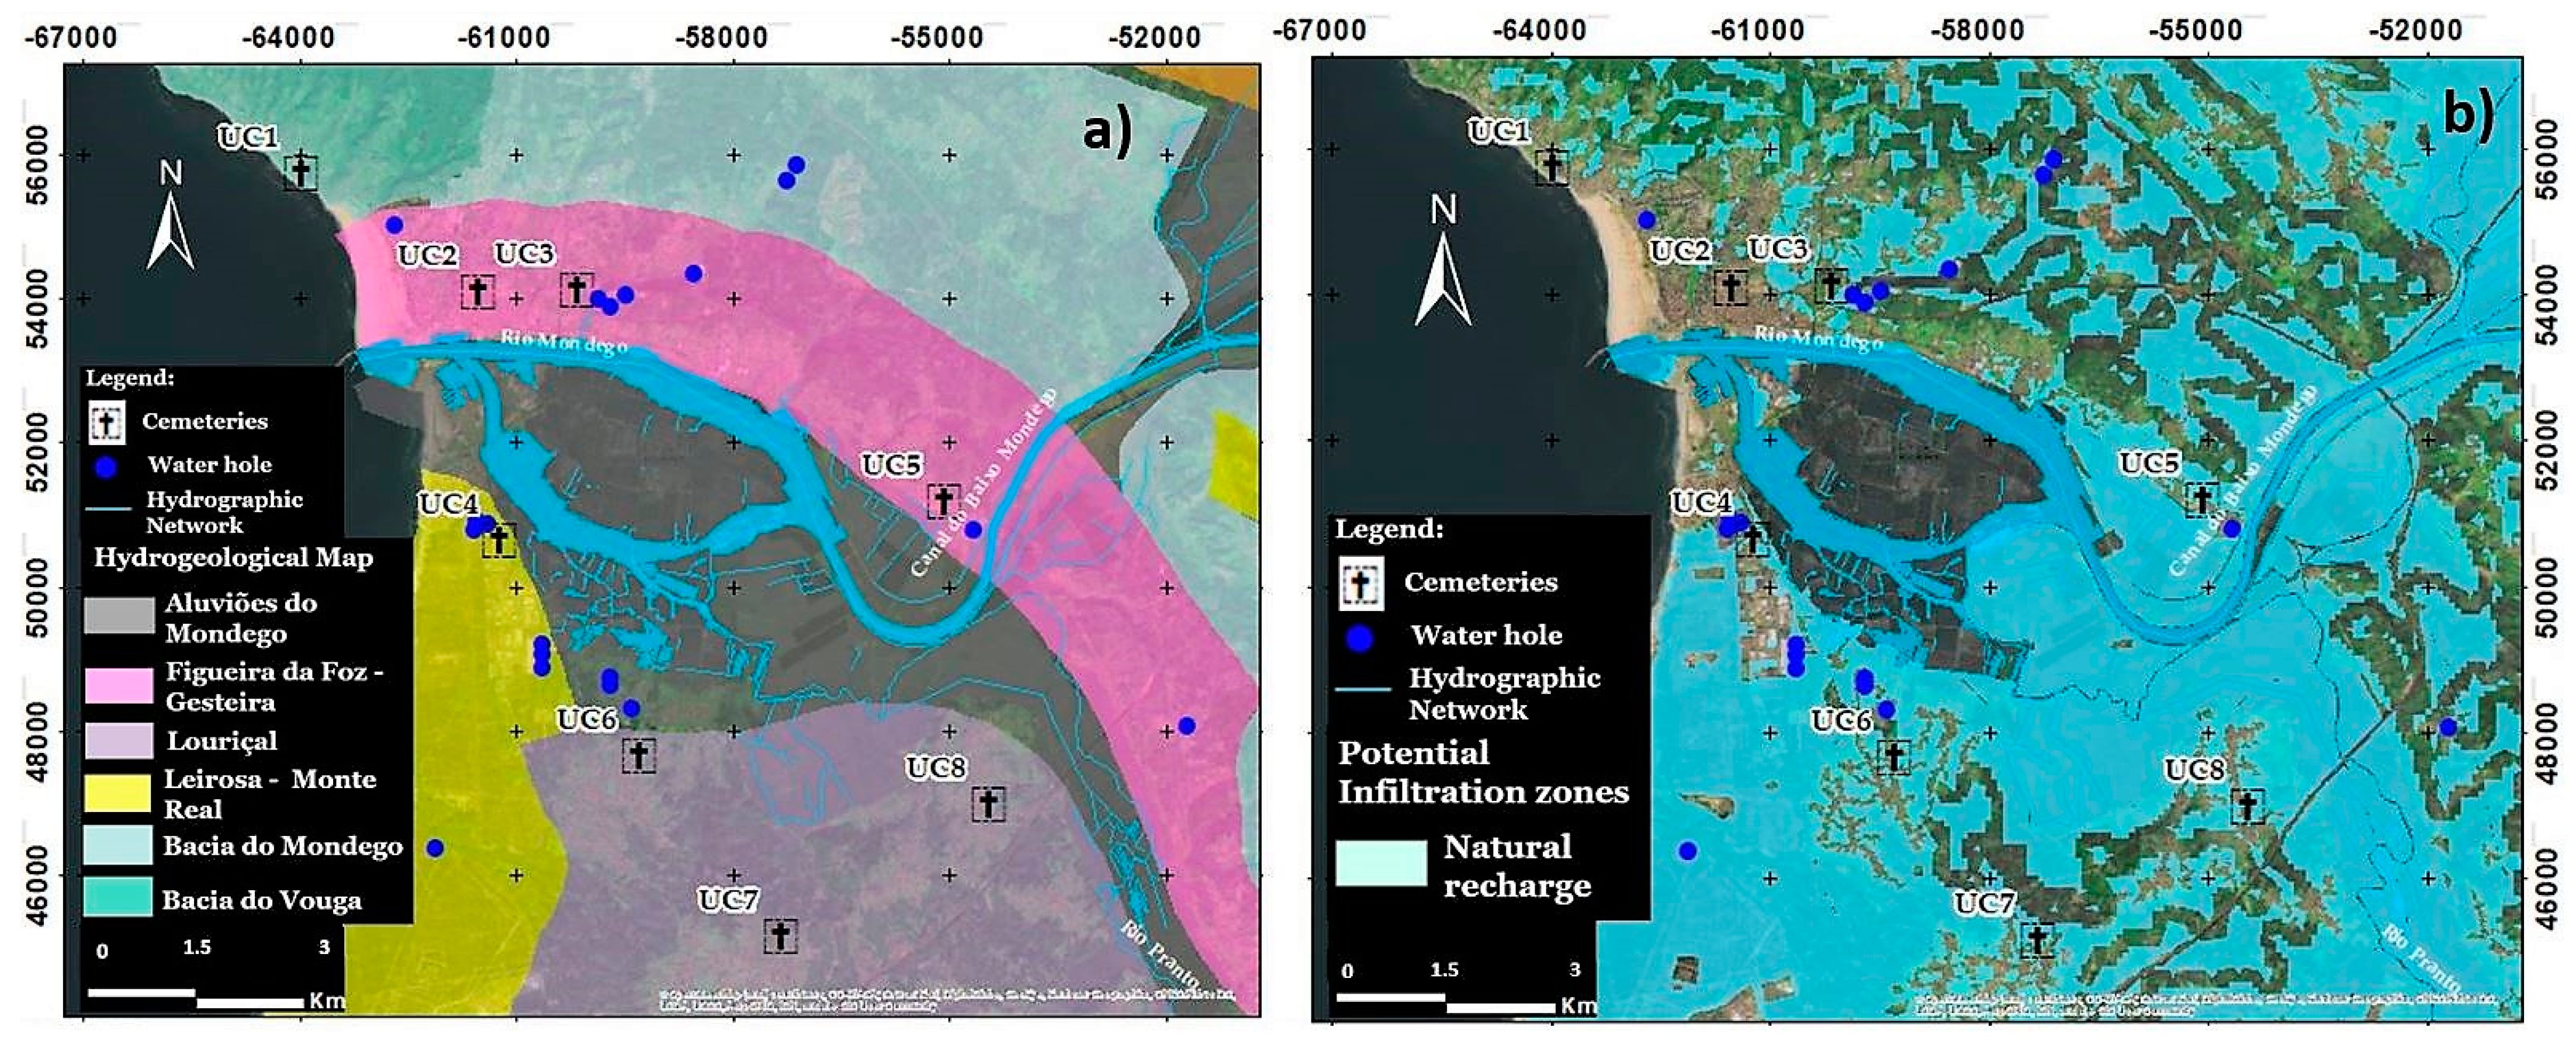
All cemeteries are located in the Mondego river basin as well as the Panto and Arunca river sub-basins. The West Rim is distinguished by the presence of numerous significant aquifer systems associated with limestone and detrital formations. Due to the complexity of Upper Jurassic rocks, which can have significant lateral changes, hydrogeological conditions vary depending on the layers. The karst aquifer systems associated with sandstones on the western edge have a limited ability to self-regulate, as indicated by the huge changes in the flow of the springs through which they discharge and the magnitude of the variation in water levels between the rainy and dry seasons. Infiltration rates might range from 50% to 60% [76]. The Figueira da Foz-Gesteira aquifer system’s conceptual flow model is essentially a geological volume made up mostly of porous detrital sediments with a wide range of textures and lenticular structures. The many aquifer units are separated by clayey layers, which give the system a multilayered appearance. Due to the variety of the granulometric composition, the hydraulic characteristics may differ significantly from one location to another. The aquifer wall is composed of a thick sandstone series (Boa Viagem sandstones) with poorer permeability than the aquifer system’s Cretaceous sandstones (Figure 5a). The system is described as either free (in the shallow and/or high areas of the aquifer where recharge occurs) or constrained. The aquifer system can be separated into two distinct domains: south of Mondego, on the flanks of the Verride anticline, with centrifugal flow relative to that structure’s core; and north of Mondego, with a monocline structure dipping south and a general direction of flow similar to the south [76]. The cemeteries situated within the zones susceptible to recharge are UC2, UC4, UC5, UC6, UC7, and UC8 (Figure 5b).
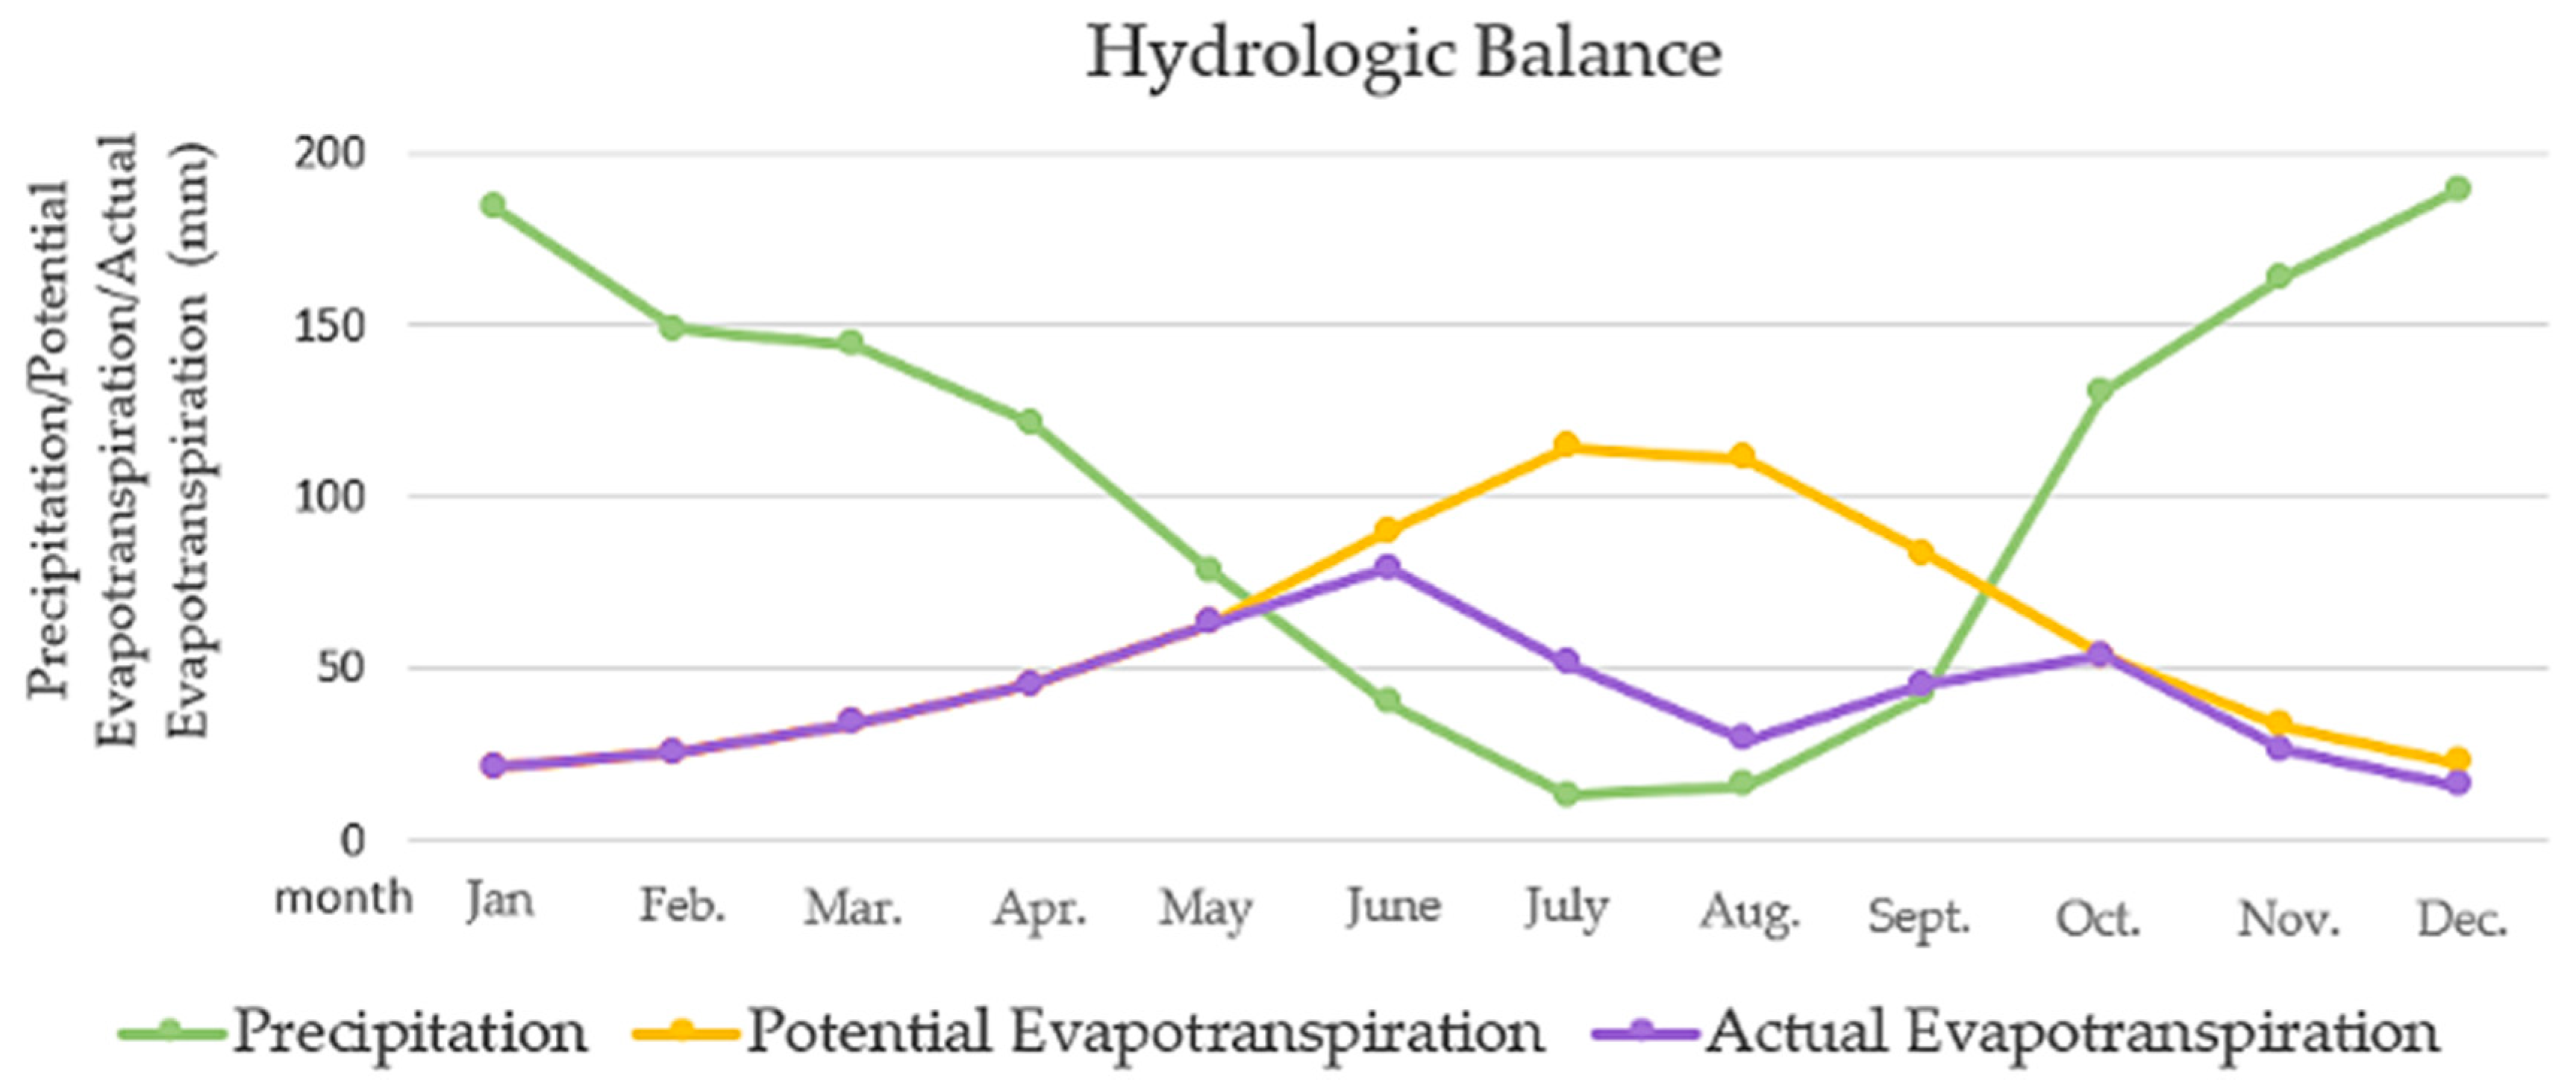
All cemeteries are situated close to the Atlantic coast, tucked into the west coast’s climatic region, and have a Köppen Geiger climatic classification of Csb, which is mesothermal (humid temperate), with a rather hot and prolonged dry season in July. With the effects of the ocean, this climate is typical of the Mediterranean [74]. According to the Thornthwaite climate classification, climates along the shore in the Mondego Basin are of type C2 B’2 s a’, becoming wetter as the height in the basin increases. The real annual evapotranspiration for the region was calculated using the Thornthwaite method (Figure 6) from data collected on the Portuguese Climate website [77].
The study area is characterized by an annual average precipitation of 1270 mm and evapotranspiration of 695 mm and air temperature ranging from 12.5 °C and 16 °C [77]. Aquifer recharge is expected in UC2, UC4, UC5, UC6, UC7, and UC8, considering the flattened morphology and soil characteristics of the cemeteries and surrounding areas, even though the sum of the annual average values of evapotranspiration and surface runoff approaches the annual average value of atmospheric precipitation.
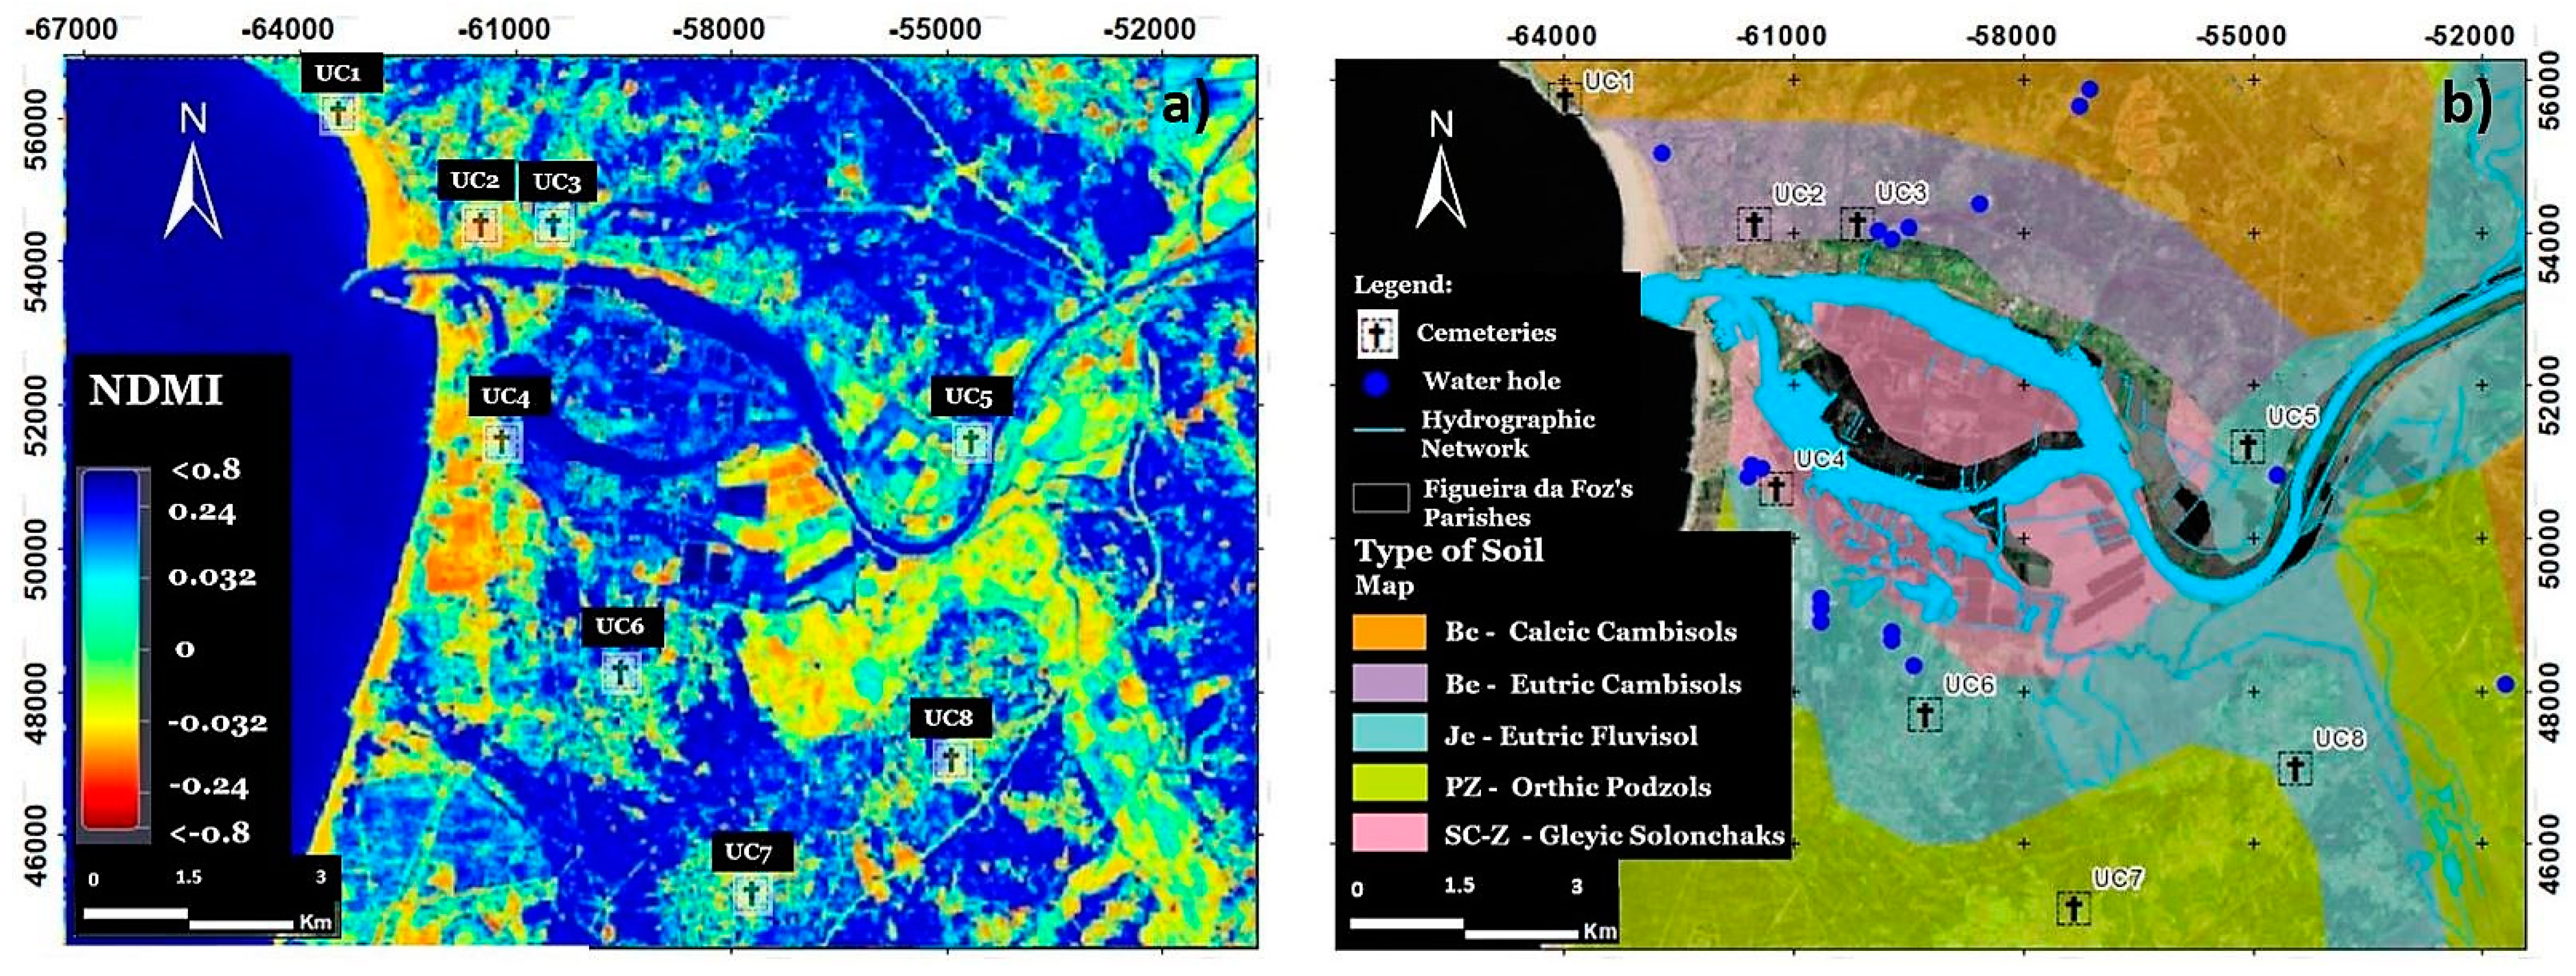
The NDMI was used to determine vegetation water content and it was calculated as the ratio between the difference and the sum of the refracted radiations in the near-infrared (NIR) and the shortwave infrared (SWIR), that is, as (NIR − SWIR)/(NIR + SWIR) [71]. The ability of soil to remove organisms improves as the soil water content decreases. Bodies decompose fastest in hot and moist environments. In extremely hot and dry temperatures, instead of decomposing, the body is mummified. Three cemeteries (UC1, UC2, and UC4) have high soil water stress (Figure 7a). The rest have more soil water, which could facilitate contaminants’ percolation.
The soil in the upper weathered zone is essentially calcic and Eutric Cambisols (UC1, UC2, and UC3), Gleyic Solonchaks (UC4), Eutric Fluvisol (UC5, UC6, and UC8), and Orthic Podzols (UC7) [69] (Figure 7b). Cambisols are related to Gleysols and Fluvisols in wetlands and are medium-textured, have high porosity, have good water-holding capacity, and have good internal drainage. They also have good structural stability. Solonchaks are soils with a high concentration of soluble salts at some point during the year. They can dry out during part of the year and tend to have strong structural elements. When the salt content is lowered by winter rains or irrigation water, soil structure tends to degrade, particularly if the salts contain sodium and/or magnesium compounds. The strong peptization of clays at the onset of (winter) rains may make the surface soil virtually impermeable to water. Fluvisols accommodate genetically young, azonal soils in alluvial deposits. Their texture can vary from coarse sand in levee soils to heavy clays in basin areas. Due to stagnant groundwater and/or flood water from rivers or tides, the majority of fluvisols have water in all or part of the profile. Podzols are well drained and are leached of clay and organic matter [69]. Cemeteries UC1, UC2, UC3, and UC7 are in more artificial territories, exposing the surrounding community to contaminants. The rest are in agricultural areas, where the ecosystem’s biodiversity may even profit from the decay of bodies.
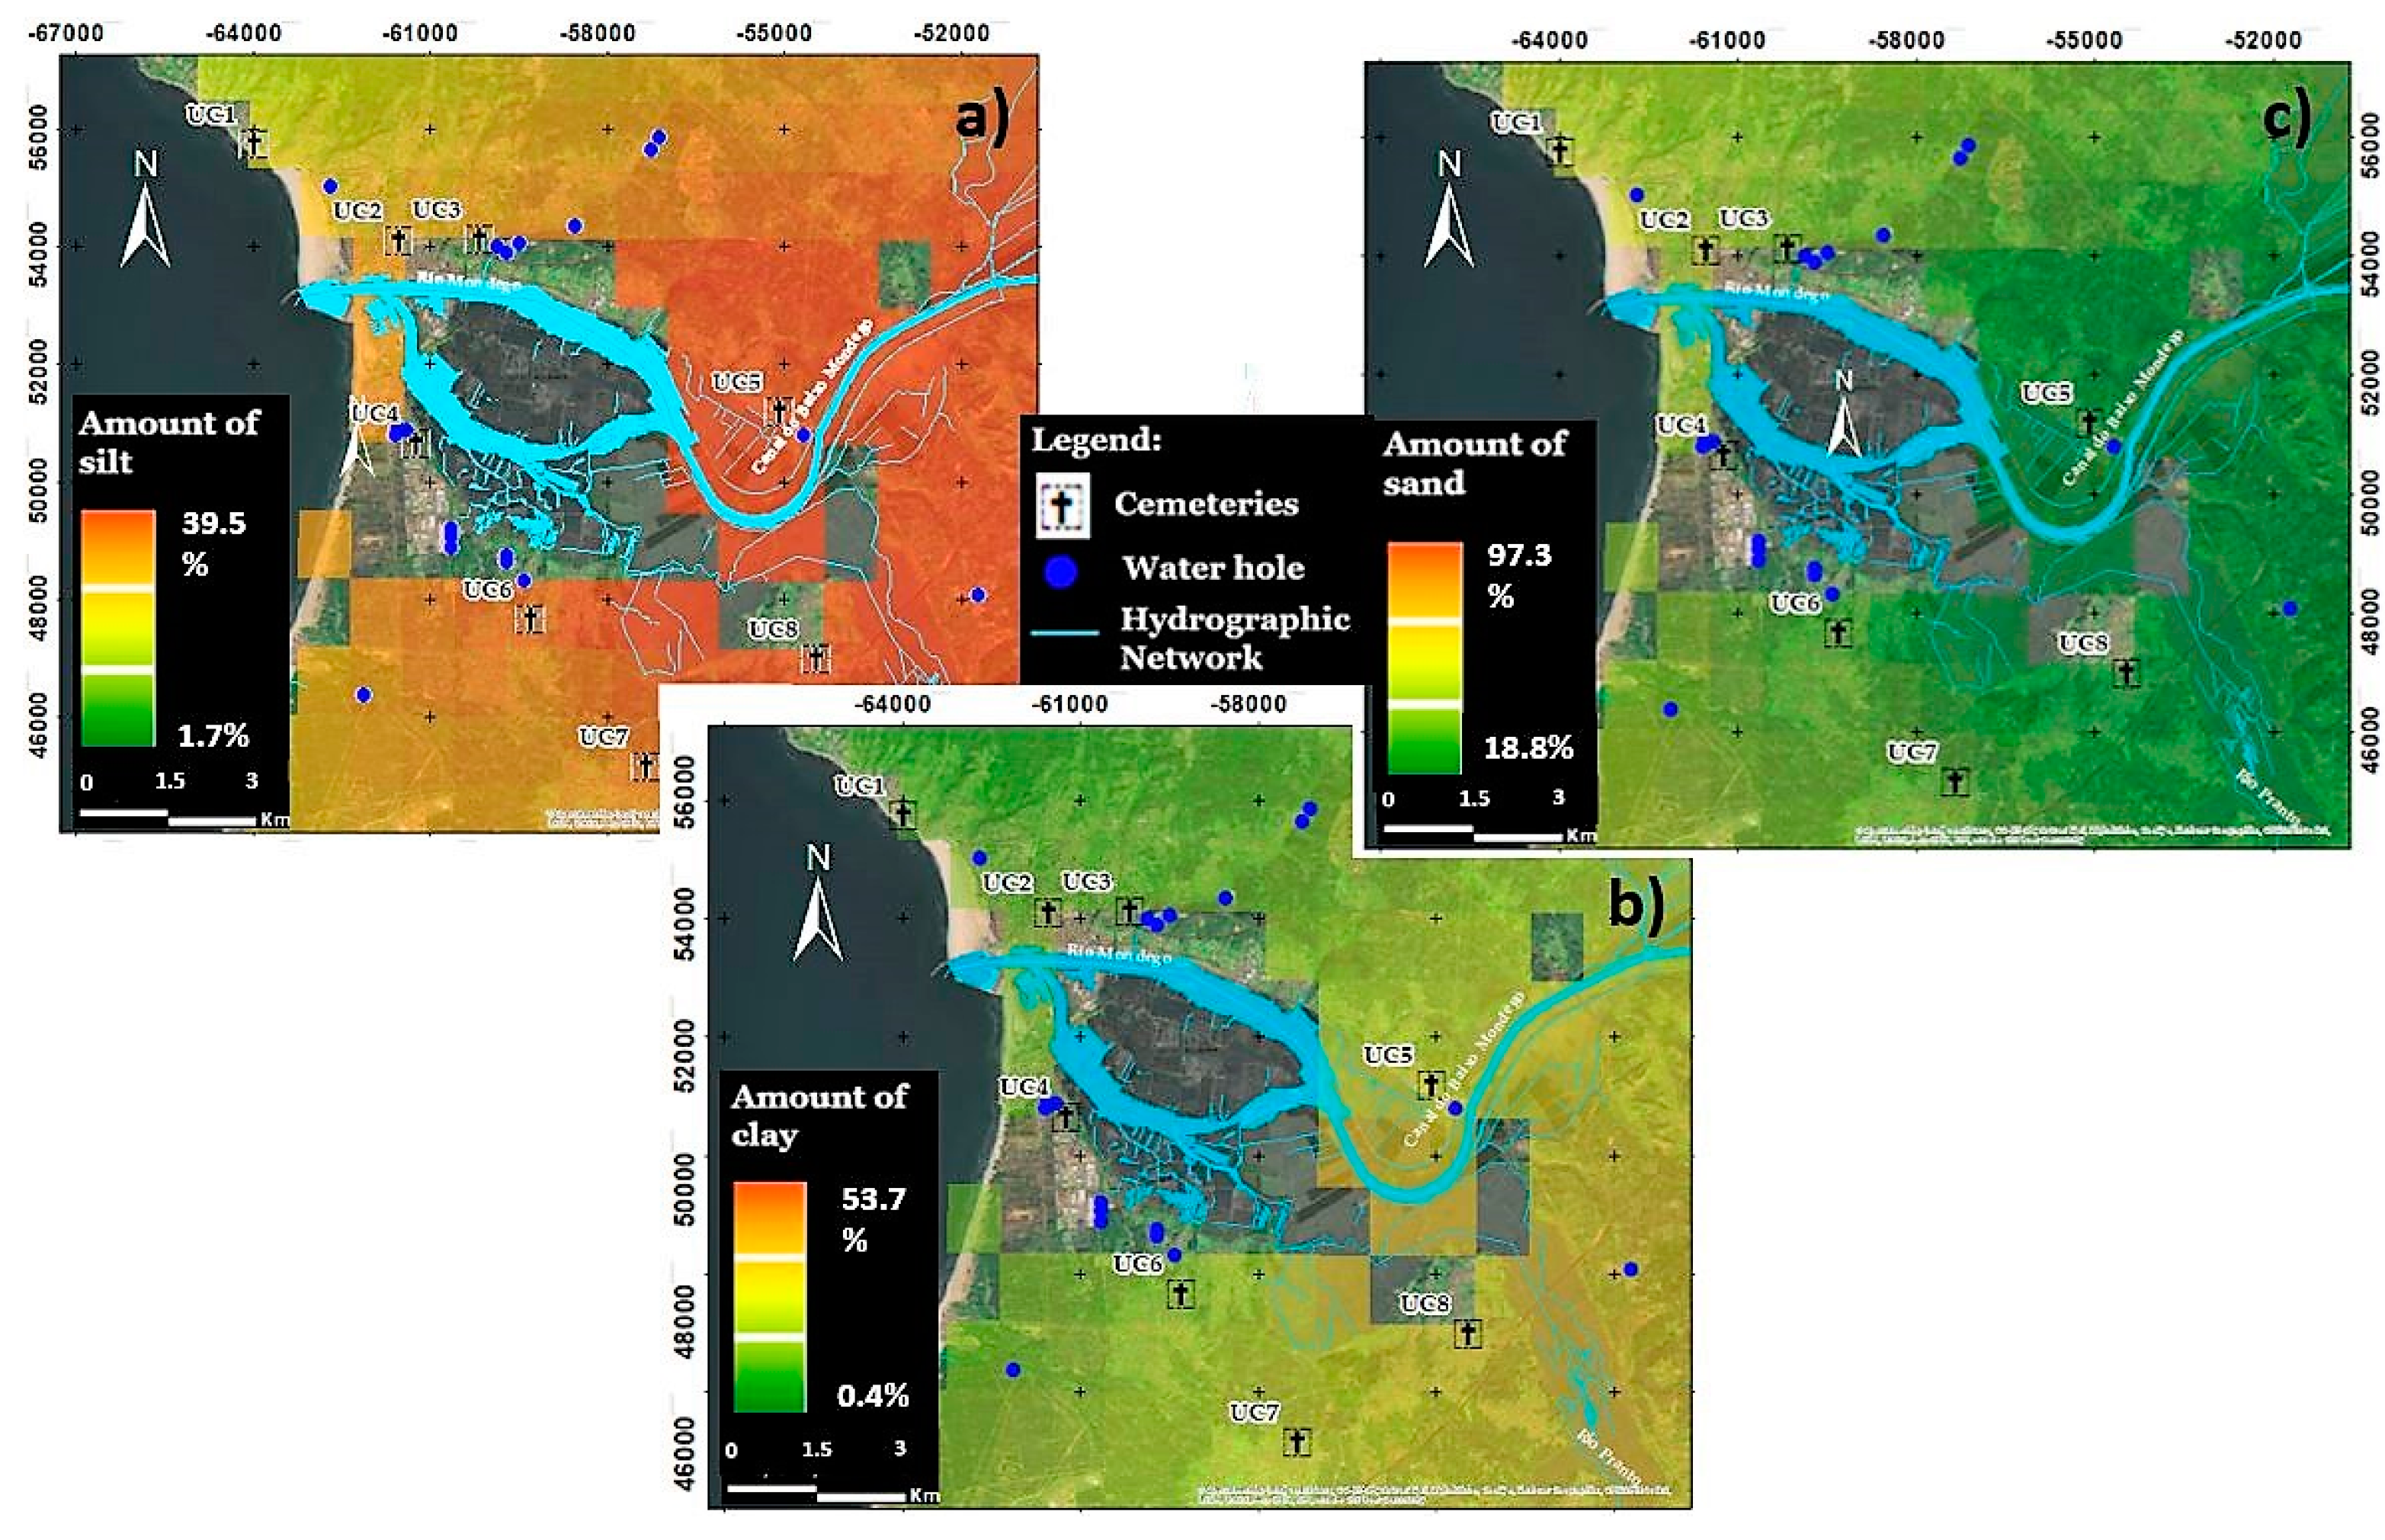
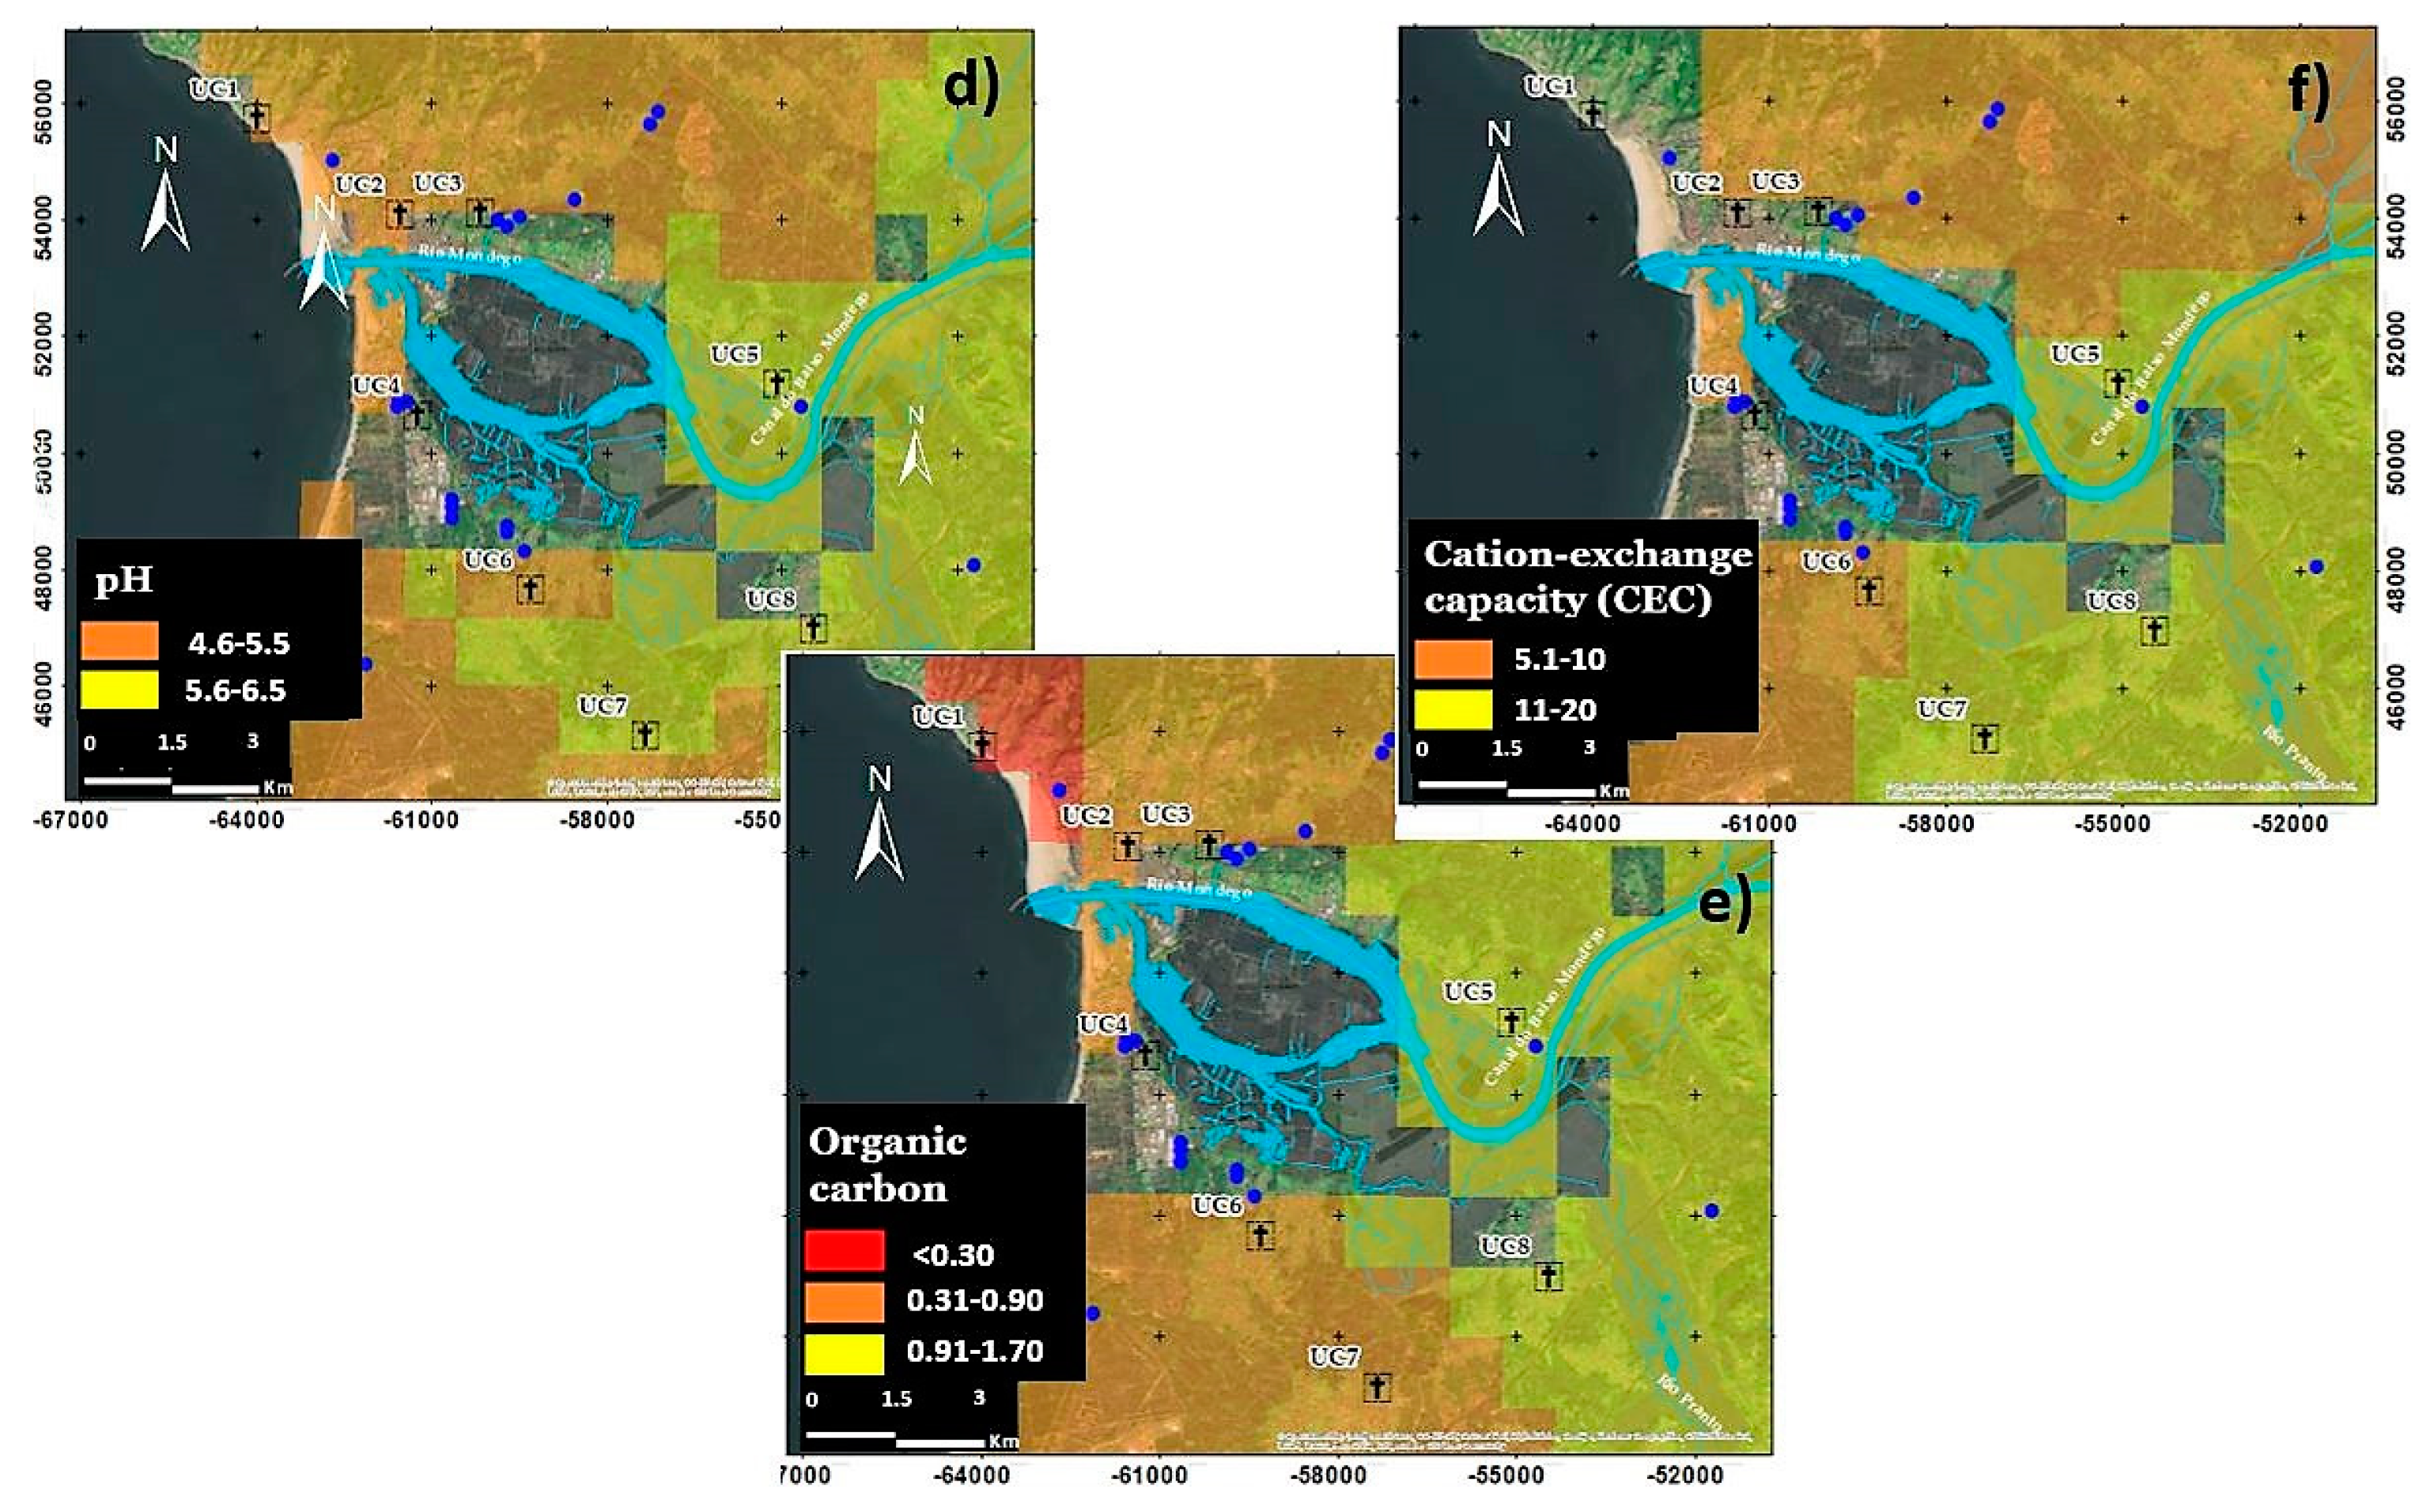
The percentage of silt, clay, sand, and organic carbon as well as the pH and CEC of soils were obtained from the INIAV [78] database of soil profiles and allowed the production of the respective maps (Figure 8). Soils have different textures (sand (2 mm to 0.02 mm), silt (0.02 mm to 0.002 mm), and clay (<0.002 mm)), and the particle size of soil could affect the process of decomposition. Decomposition can be reduced in low coarse-textured soil due to gas diffusion through the soil matrix. The oxygen-CO2 exchange may not be sufficient to produce aerobic biodegradation microorganisms in fine-textured (clayey) soil because it has a lower rate of gas diffusion than coarse-textured soil, and these conditions favour anaerobic microorganisms, which are fewer effective decomposers [79]. Organic compounds decompose slowly in poorly aerated soil. Cemeteries with a percentage of silt around 20% (e.g., UC1, UC2, UC3, and UC4) (Figure 8a) are more favourable for biodecomposition. On the other hand, the presence of clay minerals around 20% can allow the adsorption of heavy metals [22,80,81], as observed in cemeteries UC5, UC6, and UC7 (Figure 8b). Clays in cemetery UC8 are slightly greater, while the rest are significantly lower. Soils with more sand (<20%), as observed in UC1, UC2, UC3, and UC4 (Figure 8c), may allow a quick migration of pollutants to groundwater sources. The optimal soil pH range for good microbial biodegradation and metal sorption is 5.5–8.8 [22,82], and it was observed in soils of UC5, UC7, and UC8 (Figure 8d). In the remaining cemeteries, the soil pH is less than optimal. Most soils present good organic content, which allows supporting the soil structure, nutrient retention, moisture availability and retention, pollutant breakdown, and carbon sequestration. Only UC1 soil has very low organic content [82], which is an undesirable factor for corpse decomposition (Figure 8e). The CEC is an indicator of the capability of the soil for exchanging and retaining cations, such as metals. Soil CEC fluctuates according to clay percentage, clay type, soil pH, and organic matter content. A higher CEC (>10 meq/100 g [83]) usually indicates that the soil has more clay and organic matter, as was observed in UC5, UC7, and UC8 (Figure 8f), and these soils, therefore, are expected to develop a greater water-holding capacity than low-CEC soils [39].
3.2. Development of the Thematic Maps and the DRASTIC-Based Vulnerability Map
The seven thematic maps (Figure 9 and Figure 10) for each DRASTIC parameter were developed and reclassified according to the information shown in Table 3 and Table 4.
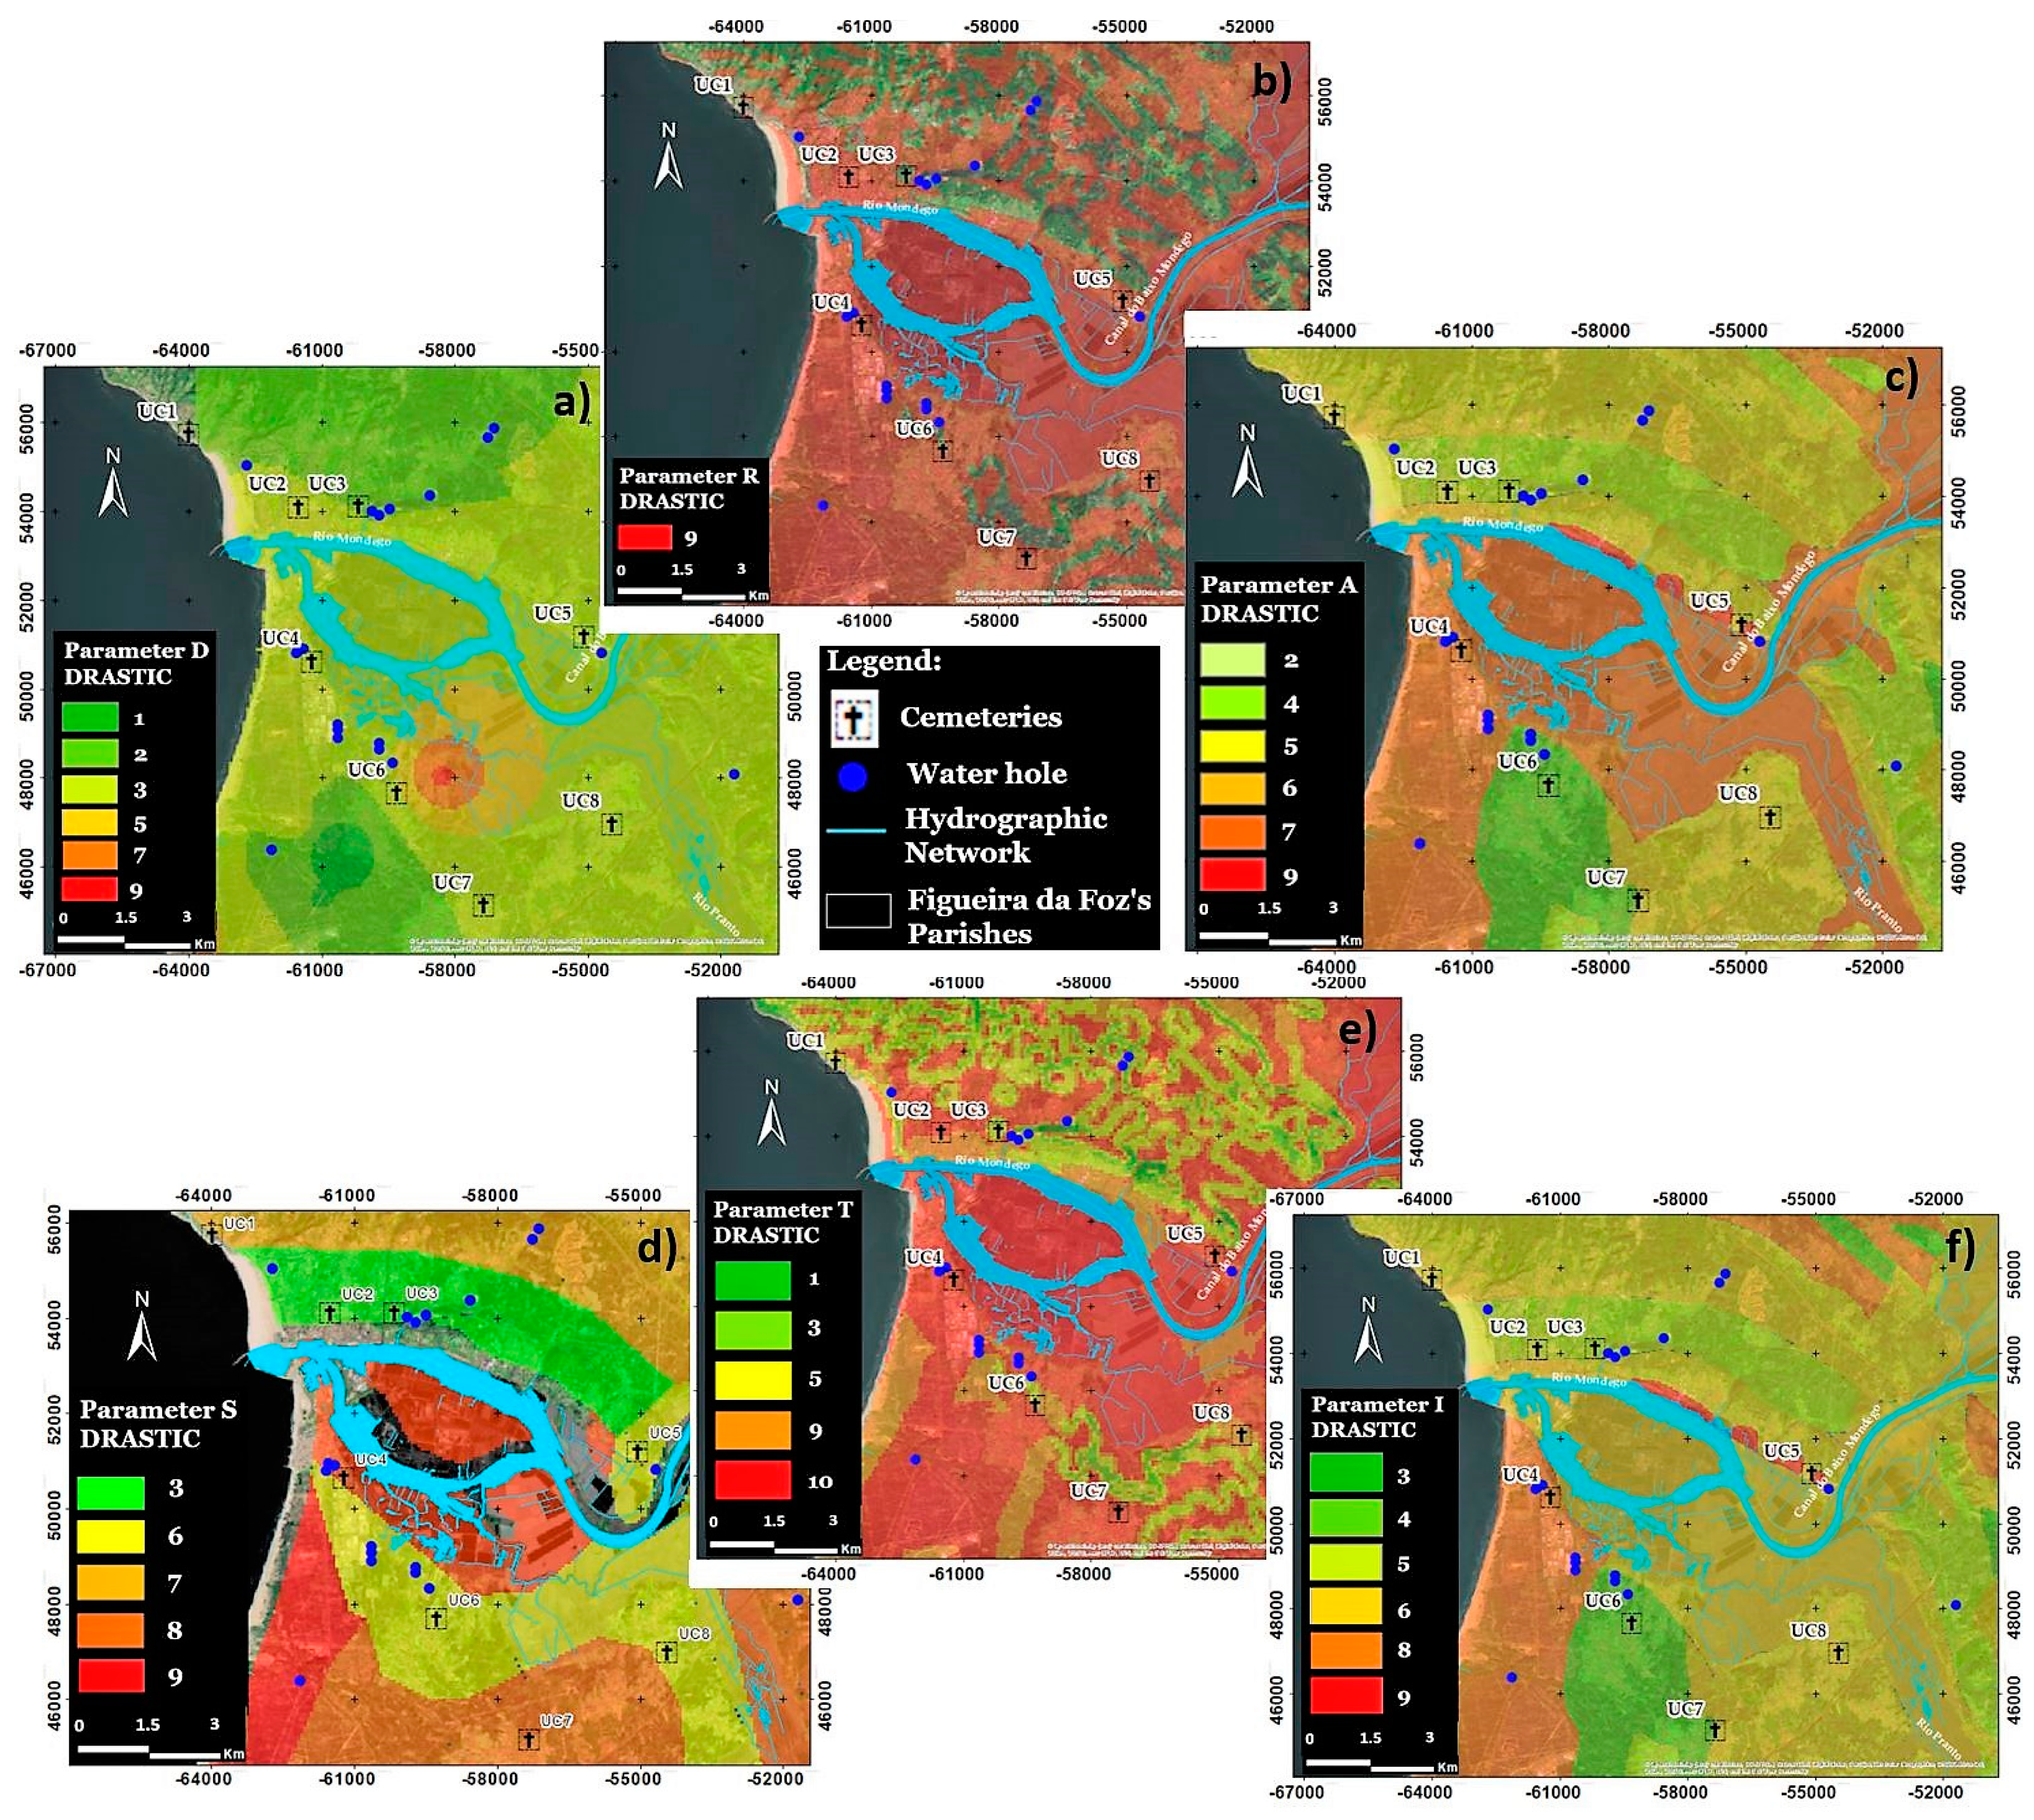
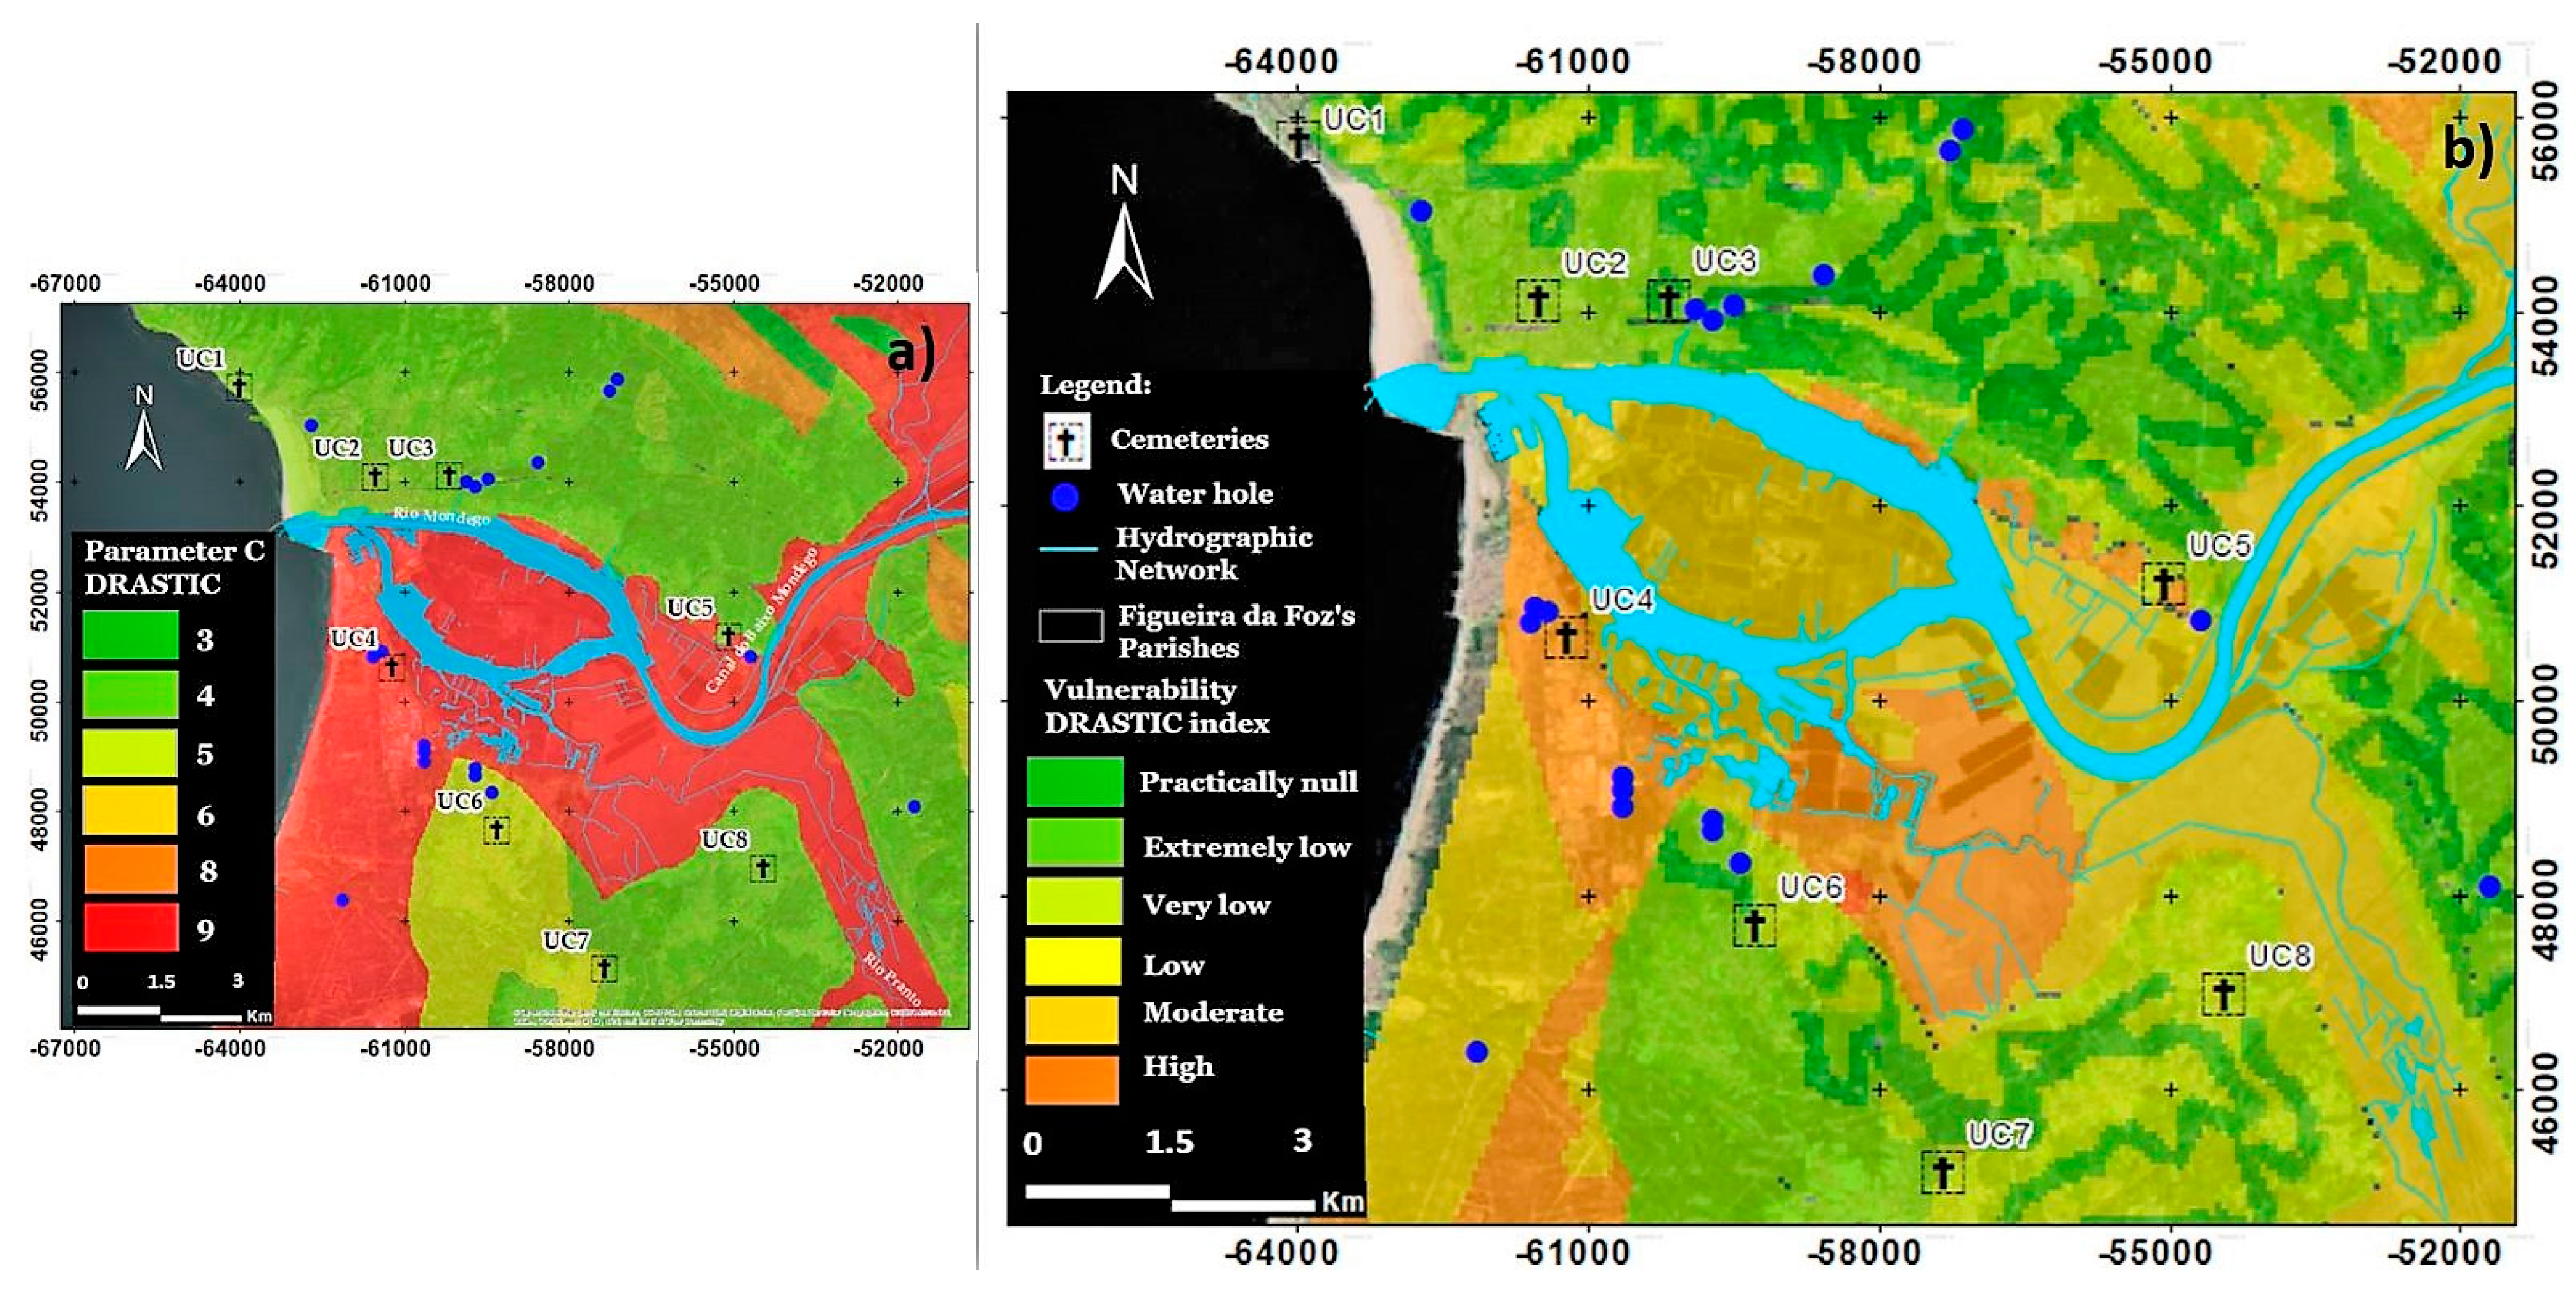
Parameter D assumes low ratings (2 and 3) around all cemeteries except for UC6, which has a medium rating of 5, and, therefore, the water table depth may have a significant impact only in UC6 where it ranges between 9.1 m and 15.2 m (Figure 9a; Table 3 and Table 4). The hydrological balance and lithology were used for estimating the aquifer recharge (R), which was set to 254 mm/year for UC2, UC4, UC5, UC6, UC7, and UC8, leading to a rating of 9 for these cemeteries and 0 in cemeteries UC1 and UC3 (Figure 9b; Table 3 and Table 4). The water content in the saturation zone and net recharging has a considerable impact on the dilution and dispersion of pollutants. Parameter A depends on the lithological material in the saturated zone, with areas with sand/kaolinite (UC6) receiving a rating of 4; those with silty clay stoneware (UC2 and UC3) receiving a rating of 5; those with fine/coarse sandstones, conglomerates, clays, some marls, limestones, and clayey sandstones (UC1, UC5, UC7, and UC8) receiving a rating of 6; and those with fine-grained sands (UC4) receiving a rating of 7 (Figure 9c; Table 3 and Table 4). The highest ratings for parameter S were set in Gleyic Solonchaks (UC4) and Orthic Podzols (UC7) with 9 and 8, respectively, whilst calcic Cambisols (UC1) and Eutric Fluvisol (UC5, UC6, and UC8) were rated 7 and 6, respectively. Eutric Cambisols of UC2 and UC3 received a lower rating of 3 (Figure 9d; Table 3 and Table 4). All cemeteries are located close to agricultural soils, and the presence of a high content of N and P associated with fertilizers as well as of pesticides can be anticipated. Cemeteries UC4, UC5, and UC7 (with slopes between 0% and 2% and a rating of 10) and UC2, UC6, and UC8 (with slopes between 2% and 6% and a rating of 9) have the most unfavourable slopes associated with parameter T (Figure 9e; Table 3 and Table 4). UC4, with a vadose zone consisting mainly of fine-grained sands, has the highest rating for parameter I (Figure 9f; Table 3 and Table 4), with a value of 8. Vadose zones with fine/coarse sandstones, conglomerates, clays, marls, limestones, and clayey sandstones (UC1, UC5, UC7, and UC8) were rated 6, whilst unsaturated zones with coarse silty clay stoneware (UC2 and UC3) and sands with kaolinite (UC6) were rated 5 and 4, respectively. Hydraulic conductivity is very high in UC4 (>81.5 m/day), which received the maximum rating of 10. In the remaining cemeteries, hydraulic conductivity is lower (from 4.1 m/day to 28.5 m/day) due to the presence of clayey materials, and ratings were 2 (UC1, UC2, UC3, UC5, UC7, and UC8) and 4 (UC6) (Figure 10a, Table 3 and Table 4).
Finally, using the raster calculator function, a vulnerability map (Figure 10b) was created based on the application of Equation (1), the weights of Figure 2, the ratings of Table 4, and the GIS matrix operations represented by Equations (2) and (3).
The calculated index for the eight cemeteries varied between 67 (insignificant vulnerability for UC3) and 167 (high vulnerability for UC4), with 12.5% being insignificant, 12.5% being extremely low, 12.5% being very low, 50% being low, and 12.5% indicating high vulnerability. Therefore, 12.5% of the area is under high risk (cemetery UC4) and must have an environmental monitoring programme for the surrounding groundwater uses (e.g., wells, holes, and springs) similar to what is set up for sanitary landfills in the Directive 1999/31/EC [84]. The highly vulnerable area around cemetery UC4 is in the shallower aquifer in the center-western area, close to the Atlantic Ocean, where the vadose zone and the aquifer zone are both composed of fine-grained sands and Gleyic Solonchaks are presented at the topsoil. The area has also an unfavorable slope (0% to 2%) that favors the accumulation of water in the rainy season and high recharge capacity (254 mm/year) and hydraulic conductivity (>81.5 m/d) that favor the percolation of pollutants in the soil and contamination of groundwater. The contribution to vulnerability is T,C > R,S > I > A > D. These results are similar to the ones observed by Kabera and Zhaohui [62] (C > T > S > A > R > I > D) for high-vulnerability indexes but for assessing the risk of contamination coming from wastewater devices (e.g., septic tanks) and agricultural fields in the Yuncheng Basin (Shanxi, China). If the unsaturated zone height is small and the soil is mainly porous (e.g., mostly with coarse sand, graded sand, and sandy clay and with a water table depth less than 15 m [45,62,64]), the risk of groundwater contamination is high [5,9]. More rocky and fractured soils, with a short water height, are more conducive to groundwater contamination [26]. More clayey soils can concentrate rainwater on its surface and contribute to the transport of contaminants to the soil, vegetation, and surface water [85], since it acts as a liner material [86]. However, mostly porous soils with an extensive unsaturated zone (e.g., more than 20 m) can contribute to the reduction in pollutant migration by chemical (e.g., chemical adsorption), physical (e.g., ion exchange and physical adsorption), and biological (e.g., nitrification and denitrification) mechanisms [79,80,81,87,88].
In the only study found with reference to cemeteries, Sinan and Razack [60] observed DRASTIC indexes varying between 71 and 204, with 1.2% of the areas considered of high vulnerability, 45.8% of average vulnerability, 51.5% of low vulnerability, and 1.5% of very low vulnerability. The high and average vulnerabilities were associated with particularly coarse facies of the unsaturated zone, significant recharging of the groundwater (>500 mm/y), and low-to-average water table depth (<30 m).
Most approaches for evaluating groundwater vulnerability were associated with soil or water analysis carried out in wells, holes, springs, and piezometers [1,3,8,11,12,13,14,15,16,17,89] in their proximity regarding soil characteristics that make them vulnerable (e.g., porous or fractured soils, water table depth close to the surface, and physical and chemical properties) [5,9,89] and statistical correlations between data from enquiries, cultural practices, and local visits [10,90]. No studies were found for the elaboration of DRASTIC-index-based vulnerability maps using GIS tools; however, Kemerich et al. [32] used the alternative GOD method in four cemeteries in Santa Maria (Brazil), concluding that they were responsible for bacteriological contamination.
Table 5 shows the quantitative classification of the DRASTIC index for studies that used the same weights and ratings adopted in this study but for other sources of contamination, as no specific studies were found for cemeteries. As it is intended to compare the qualitative classification of the index, only the “Very low”, “Low”, “Average”, and “High” classes are presented. There is always subjectivity in the quantile classification of the index because the results sometimes are outside the minimum (23) and maximum (226) shown in Table 1. Therefore, there is a certain degree of subjectivity in assigning an index value range and, consequently, the type of quantile classification adopted in each study. However, the importance of the results is that there must be concern regarding at least one cemetery that should be carefully monitored (UC4). For all studies shown in Table 5, the areas with high vulnerability are greater than 12.5% (the value obtained in these studies), which can be associated with the vulnerability of the areas to pollution from other sources.
Table 6 shows the results of single-parameter sensitivity analysis to weights according to Equation (4). The results of the single sensitivity analysis show that effective weights differ significantly for all parameters. The topography (T), soil media (S), and aquifer media (A) were the most effective parameters, whilst the recharge (R) was almost equal in the vulnerability assessment. This circumstance reflects the importance of A, S, and T in the model and the need to obtain accurate, detailed, and representative information on these factors. However, the coefficient of variation (CV) indicates that the highest contribution to the variation in the vulnerability index is hydraulic conductivity (86.6), followed by recharge (61.7) and soil media (35.6), indicating the high impact of these parameters in the variation in the vulnerability index across the study area. Hasiniaina et al. [63], Hallaq and Elaish [65], and Hu et al. [47] also found A, S, and T as the most effective parameters influencing the vulnerability index.
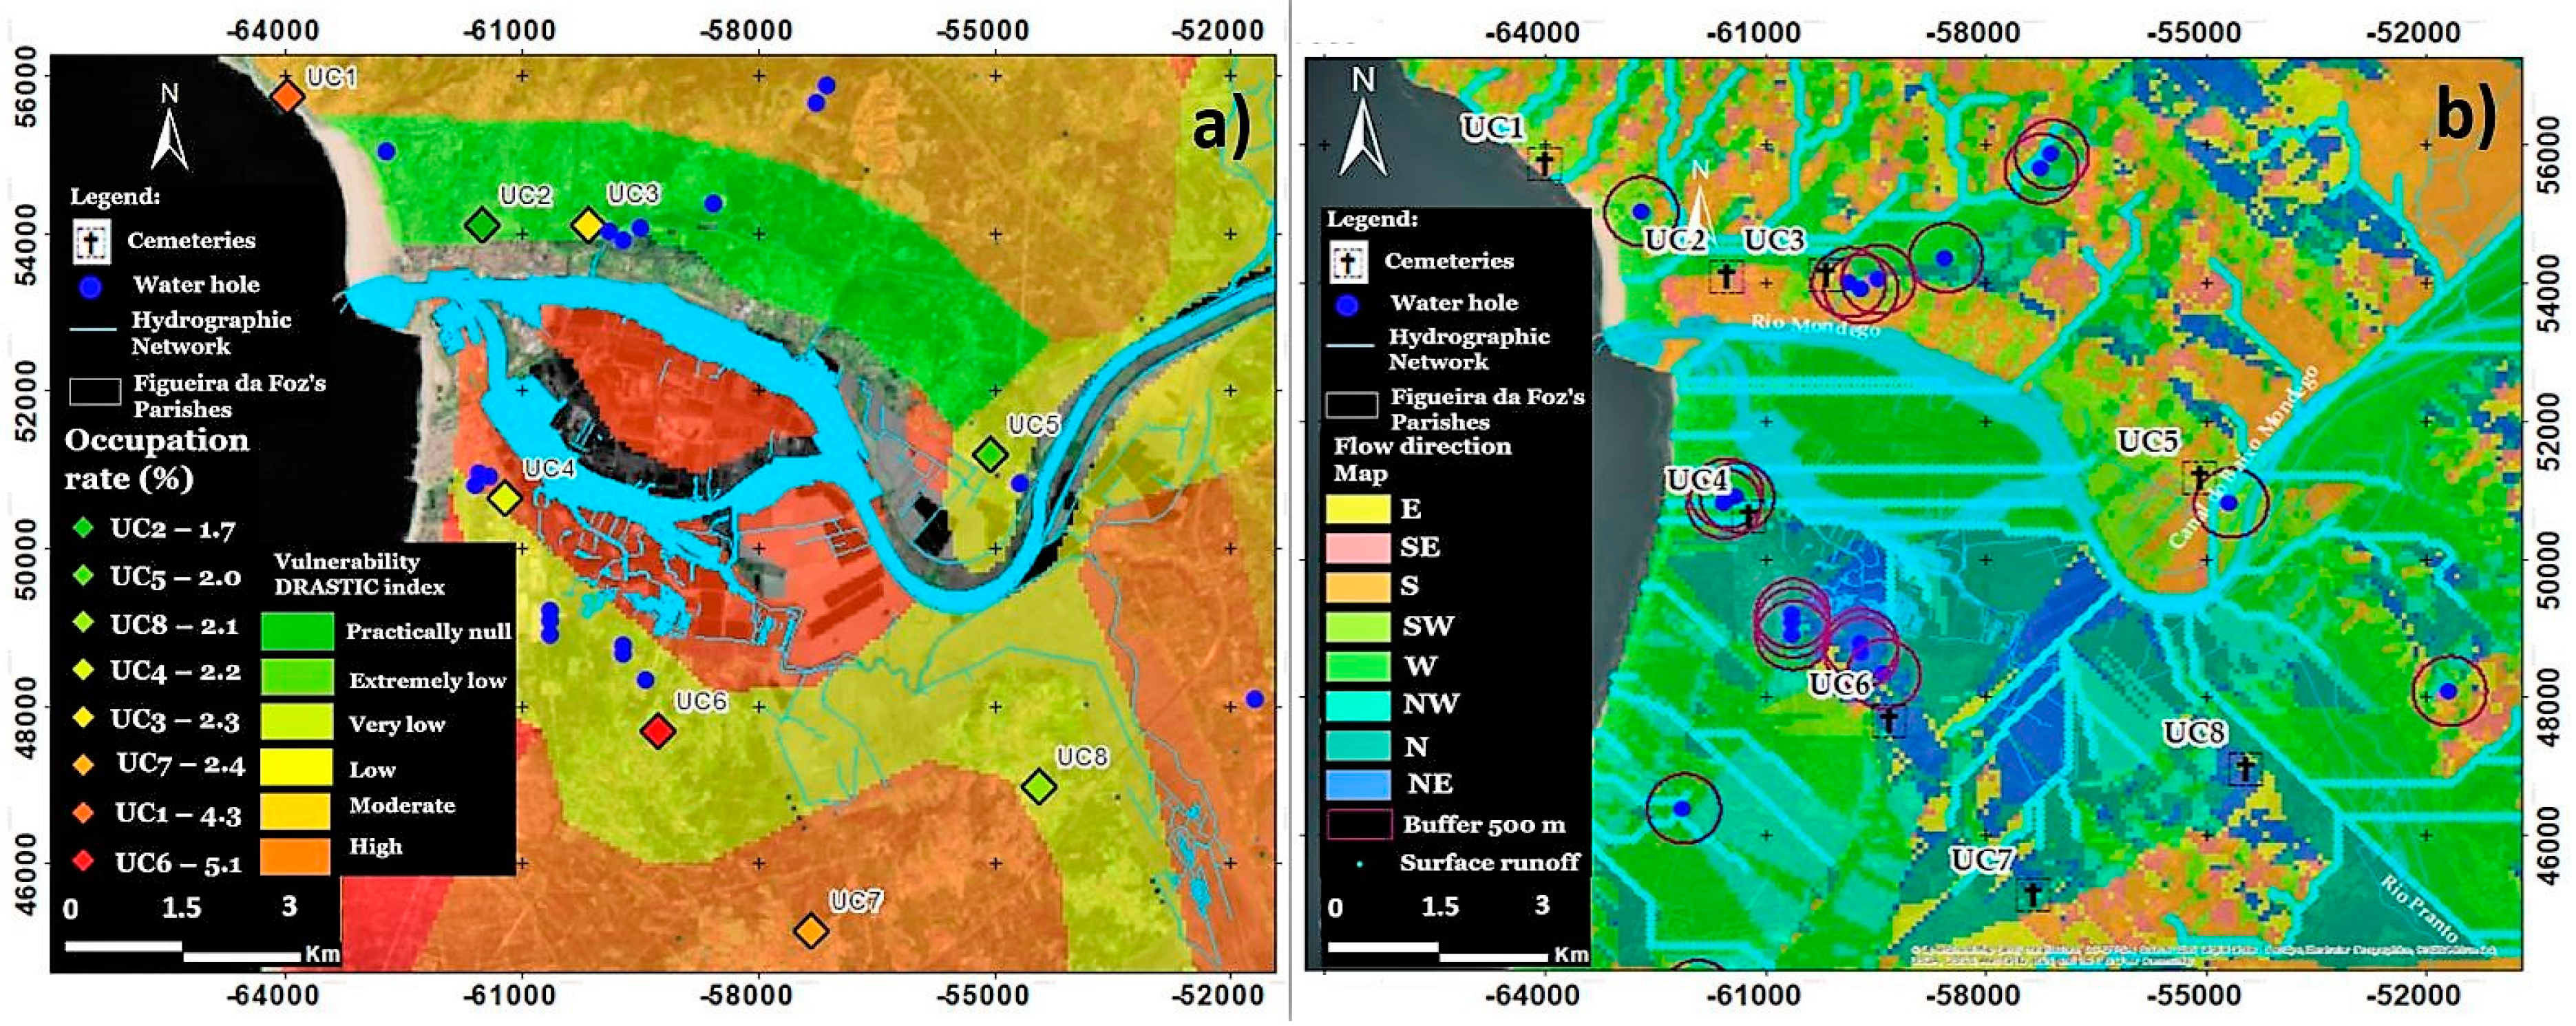
Finally, the total surface area of cemeteries (TSC), surface area free of burial plots (SAB) in 2021, and the ratio SAB/TSC (occupation rate) have been calculated [94], and an occupation rate map was developed (Figure 11a). The values of occupation rates calculated for each cemetery and presented in Table 3 show the highest values for UC1 and UC6, and, since the ratio is associated with recent burials, these are the cemeteries where it is expected that there will be a greater production of leachate with a contaminating potential.
Some pragmatic best practices are recommended by several sources [23,42,89] for cemetery locations to reduce the risk of groundwater contamination, namely: keeping a 250 m distance from potable groundwater supply sources; keeping a 30 m minimum distance from water courses or springs; keeping a 10 m minimum distance from field drains; using a substrate for burials that is not highly permeable (e.g., sands underlain by impermeable layers); using a thick aeration layer and deeply situated underground water table depth, which are advantageous; making the surface between graves as well as tombs watertight; avoiding locations in sloping areas or at risk of landslides; and not performing burials into standing water. Groundwater and surface water quality should be monitored around cemeteries. In the absence of specific guidelines, monitoring should follow the best practices of water monitoring around landfill sites of the Landfill Directive (Directive 1999/31/EC [84]. To prevent surface water runoff from cemeteries, a 500 m buffer to water abstraction points was built, as suggested by Fisher [42], and a flow direction map was created for water quality protection (Figure 11b). The flow direction of each cemetery is quite different. For UC1, UC3, and UC5, the predominant flow direction is S, for UC2 is SW, for UC4 is W, for UC5 is NE, for UC7 is N, and for UC8 is E. This buffer of 500 m should also be signalized as the minimum perimeter for setting up environmental monitoring procedures for soil and water protection.
Most studies found on groundwater vulnerability assessment are motivated by the influence of various pollution sources of anthropogenic origin, while this study is specifically directed towards pollution from cemeteries given their location and because they are regions without other significant sources of pollution nearby. Therefore, it is a study with valuable information to be replicated by managing entities of cemeteries and entities responsible for environmental vulnerability and public health vigilance.
4. Conclusions
Cemeteries can constitute an important source of water contamination, especially in vulnerable areas where this practice is the main anthropogenic source of pollution, as is the case in the studied area and in the eight analyzed cemeteries. Herein, the contamination possibility of cemeteries in the Figueira da Foz region was reported for the first time. Through the development of a vulnerability map based on the DRASTIC index and using GIS tools, this research enabled the identification of areas with susceptibility to contamination ranging from insignificant to high according to DRASTIC’s classification. The cemeteries situated within the zones susceptible to recharge are UC2, UC4, UC5, UC6, UC7, and UC8. The most vulnerable area that represents a high risk for groundwater contamination is the UC4 cemetery, which must have an environmental monitoring plan. This area is characterized by a water table depth ranging from 15.2 m to 22.9 m, high recharge (254 mm/year), vadose zone and aquifer media composed mainly of fine-grained sands, Gleyic Solonchaks at the topsoil, flat land (slope from 0% to 2%), and high hydraulic conductivity (>81.5 m/day), and it is located closed agricultural areas and in the vicinity of the Atlantic Sea. According to the sensitivity analysis, the topography, soil media, and aquifer media weights were the most effective in the vulnerability assessment. However, hydraulic conductivity, net recharge, and soil media gave the highest contributions to index variation. This is a study with evaluation procedures and tools that can be replicated by cemetery management entities to assess environmental vulnerability and risks to public health.
Author Contributions
Conceptualization, V.G., A.A., P.C., P.A. and V.C.; methodology, V.G., A.A., P.C. and P.A.; software, V.G., A.A. and P.A.; validation, V.G., A.A., P.C., P.A. and V.C.; formal analysis, V.G. and A.A.; writing—original draft preparation, V.G., A.A., P.C., P.A. and V.C.; writing—review and editing, V.G., A.A. and P.A. All authors have read and agreed to the published version of the manuscript.
Funding
This research received no external funding.
Data Availability Statement
https://www.researchgate.net/lab/Laboratory-of-Environmental-Sanitation-DECA-UBI-Antonio-Albuquerque (accessed on 28 January 2023) and https://wordpress.com/view/environmetalsanitation.wordpress.com (accessed on 28 January 2023).
Acknowledgments
The authors are grateful to the Foundation for Science and Technology (FCT, Portugal) for supporting the research through the projects UIDB/00195/2020 (FibEnTech) and UIDB/04035/2020 (GeoBioTec).
Conflicts of Interest
The authors declare no conflict of interest.
References
- Neckel, A.; Costa, C.; Mario, D.; Sabadin, C.; Bodah, E. Environmental damage and public health threat caused by cemeteries: A proposal of ideal cemeteries for the growing urban sprawl. Urbe 2017, 9, 216–230. [Google Scholar] [CrossRef] [Green Version]
- Canning, L.; Szmigin, I. Death and disposal: The universal, environmental dilemma. J. Mark. Manag. 2010, 26, 1129–1142. [Google Scholar] [CrossRef]
- Zychowski, J.; Bryndal, T. Impact of cemeteries on groundwater contamination by bacteria and viruses–A review. J. Water Health 2015, 13, 285–301. [Google Scholar] [CrossRef] [PubMed]
- Turner, B.; Haygarth, P. Phosphorus forms and concentrations in leachate under four grassland soil types. Soil Sci. Soc. Am. J. 2000, 64, 1090–1099. [Google Scholar] [CrossRef]
- Engelbrecht, J.F.P. Groundwater pollution from cemeteries. In Proceedings of the WISA Biennial Conference and Exhibition, Cape Town, Southern Africa, 4–7 May 1998. [Google Scholar]
- Wang, J.; Rao, C.Y.; Lu, L.; Zhang, S.L.; Muddassir, M.; Liu, J.Q. Efficient photocatalytic degradation of methyl violet using two new 3D MOFs directed by different carboxylate spacers. CrystEngComm 2021, 23, 741–747. [Google Scholar] [CrossRef]
- Pan, Y.; Rao, C.; Tan, X.; Ling, Y.; Singh, A.; Kumar, A.; Li, B.; Liu, J. Cobalt-seamed C-methylpyrogallol [4]arene nanocapsules-derived magnetic carbon cubes as advanced adsorbent toward drug contaminant removal. Chem. Eng. J. 2022, 433, 133857. [Google Scholar] [CrossRef]
- Zychowski, J. The impact of cemeteries in Krakow on the natural environment–selected aspects. Geogr. Pol. 2011, 84, 13–32. [Google Scholar] [CrossRef] [Green Version]
- Majgier, L.; Rahmonov, O.; Bednarek, R. Features of abandoned cemetery soils on sandy substrates in Northern Poland. Eurasian Soil Sci. 2014, 47, 621–629. [Google Scholar] [CrossRef]
- Scalenghe, R.; Pantani, O. Connecting existing cemeteries saving good soils (for livings). Sustainability 2020, 12, 93. [Google Scholar] [CrossRef] [Green Version]
- Jonker, C.; Olivier, J. Mineral contamination from cemetery soils: Case study of Zandfontein Cemetery, South Africa. Int. J. Envion. Res. Public Health 2012, 9, 511–520. [Google Scholar] [CrossRef]
- Fiedler, S.; Dame, T.; Graw, M. Do cemeteries emit drugs? A case study from southern Germany. Environ. Sci. Pollut. Res. 2018, 25, 5393–5400. [Google Scholar] [CrossRef]
- Paiqa, P.; Delerue-Matos, C. Determination of pharmaceuticals in groundwater collected in five cemeteries’ areas (Portugal). Sci. Total Environ. 2016, 569, 16–22. [Google Scholar] [CrossRef]
- Neckel, A.; Korcelski, C.; Silva, L.; Kujawa, H.; Bodah, B.; Figueiredo, A.; Maculan, L.; Gon√ßalves, A.; Bodah, E.; Moro, L. Metals in the soil of urban cemeteries in Carazinho (South Brazil) in view of the increase in deaths from COVID-19: Projects for cemeteries to mitigate environmental impacts. Environ. Dev. Sustain. 2021, 24, 10728–10751. [Google Scholar] [CrossRef]
- Amuno, S. Potential ecological risk of heavy metal distribution in cemetery soils. Water Air Soil Pollut. 2013, 224, 1435. [Google Scholar] [CrossRef]
- EA. Potential Groundwater Pollutants from Cemeteries; Environment Agency: Bristol, England, 2005; 36p, ISBN 1 8 44323471. [Google Scholar]
- Calkosinski, I.; Ploneczka-Janeczko, K.; Ostapska, M.; Dudek, K.; Gamian, A.; Rypula, K. Microbiological analysis of necrosols collected from urban cemeteries in Poland. BioMed Res. Int. 2015, 2015, 169573. [Google Scholar] [CrossRef] [PubMed] [Green Version]
- Martins, M.; Pellizari, V.; Pacheco, A.; Myaki, D.; Adams, C.; Bossolan, N.; Mendes, J.; Hassuda, S. Qualidade bacteriológica de água subterrâneas em cemitérios. Rev. Saúde Púb. 1991, 25, 47–52. [Google Scholar] [CrossRef] [PubMed] [Green Version]
- Leong, E.; Abuel-Naga, H.; Goli, V.; Jha, B.; Pathak, P.; Singh, D. Design of mass burial sites for safe and dignified disposal of pandemic fatalities. Environ. Geotech. 2021, 8, 208–216. [Google Scholar] [CrossRef]
- Rodrigues, L.; Pacheco, A. Groundwater contamination from cemeteries cases of study. In Proceedings of the Environmental 2010: Situation and Perspectives for the European Union, 1–6, Porto, Portugal, 6–10 May 2003. [Google Scholar]
- Aruomero, A.; Afolabi, O. Comparative assessment of trace metals in soils associated with casket burials: Towards implementing green burials. Euras. J. Soil Sci. 2014, 3, 65–76. Available online: http://ejss.fesss.org/10.18393/ejss.66428 (accessed on 20 December 2022). [CrossRef] [Green Version]
- Aguiar, T.; Baumann, L.; Albuquerque, A.; Teixeira, L.; de Souza Gil, E.; Scalize, P. Application of Electrocoagulation for the Removal of Transition Metals in Water. Sustainability 2023, 15, 1492. [Google Scholar] [CrossRef]
- NGCC. Potential of Cemetery Developments Assessing the Groundwater Pollution; National Groundwater and Contaminated Land Center: Bristrol, UK, 2002; 13p. [Google Scholar]
- Vrba, J.; Zaporozec, A. Guidebook on mapping groundwater vulnerability. In IAH International Contributions to Hydrogeology; FRG, Heise Verlag: Hannover, Germany, 1994; p. 16. [Google Scholar]
- Gogu, R.C.; Dassargues, A. Current trends and future challenges in groundwater vulnerability assessment using overlay and index methods. Environ. Geol. 2000, 39, 549–559. [Google Scholar] [CrossRef]
- Sale, T.; Parker, B.; Newell, C.; Devlin, J. Management of Contaminants Stored in Low Permeability Zones—A State-of-the-Science Review; SERDP Project ER-1740. Strategic Environmental Research and Development Program; 2013; 348p, Available online: https://archive.org/details/DTIC_ADA619819 (accessed on 26 December 2022).
- Machiwal, D.; Jha, M.; Singh, V.; Mohan, C. Assessment and mapping of groundwater vulnerability to pollution: Current status and challenges. Earth Sci. Rev. 2018, 185, 901–927. [Google Scholar] [CrossRef]
- Wachniew, P.; Zurek, A.J.; Stumpp, C.; Gemitzi, A.; Gargini, A.; Filippini, M.; Rozanski, K.; Meeks, J.; Kvaerner, J.; Witczak, S. Toward operational methods for the assessment of intrinsic groundwater vulnerability: A review. Crit. Rev. Environ. Sci Technol. 2016, 46, 827–884. [Google Scholar] [CrossRef]
- Shirazi, S.; Imran, H.; Shatirah, A. GIS-Based DRASTIC method for groundwater vulnerability assessment: A review. J. Risk Res. 2012, 15, 991–1011. [Google Scholar] [CrossRef]
- Taghavi, N.; Niven, R.; Paull, D.; Kramer, M. Groundwater vulnerability assessment: A review including new statistical and hybrid methods. Sci. Total Environ. 2022, 822, 153486. [Google Scholar] [CrossRef] [PubMed]
- Aller, L.; Lehr, J.; Petty, R.; Bennet, T. DRASTIC: A Standardized System to Evaluate Groundwater Pollution Potential Using Hydrogeologic Settings; National Water Well Association Worthington: Westerville, OH, USA, 1987. [Google Scholar]
- Kemerich, P.; Filho, L.; Ucker, F.; Correio, C. Influência dos cemitérios na contaminação da água subterrânea em Santa Maria–RS. Águas Subterr. 2010, 24, 129–141. [Google Scholar]
- Simunek, J.; Sejna, M.; Van Genuchten, M. The HYDRUS-2D Software Package. 1999. Available online: https://www.pc-progress.com/Downloads/Pgm_Hydrus2D/HYDRUS2D.PDF (accessed on 27 December 2022).
- Rodriguez-Galiano, V.; Mendes, M.P.; Garcia-Soldado, M.; Chica-Olmo, M.; Ribeiro, L. Predictive modeling of groundwater nitrate pollution using random forest and multisource variables related to intrinsic and specific vulnerability: A case study in an agricultural setting (Southern Spain). Sci. Total Environ. 2014, 477, 189–206. [Google Scholar] [CrossRef] [PubMed]
- Asadi, P.; Hosseini, S.; Ataie-Ashtiani, B.; Simmons, C. Fuzzy vulnerability mapping of urban groundwater systems to nitrate contamination. Environ. Model Softw. 2017, 96, 146–157. [Google Scholar] [CrossRef]
- Bordbar, M.; Neshat, A.; Javadi, S. A new hybrid framework for optimization and modification of groundwater vulnerability in coastal aquifer. Environ. Sci. Pollut. Res. 2019, 26, 21808–21827. [Google Scholar] [CrossRef]
- Antonakos, A.; Lambrakis, N. Development and testing of three hybrid methods for the assessment of aquifer vulnerability to nitrates, based on the DRASTIC model, an example from NE Korinthia, Greece. J. Hydrol. 2007, 333, 288–304. [Google Scholar] [CrossRef]
- Pavlis, M.; Cummins, E. Assessing the vulnerability of groundwater to pollution in Ireland based on the COST-620 Pan-European approach. J. Environ. Manag. 2014, 133, 162–173. [Google Scholar] [CrossRef] [PubMed]
- Sorichetta, A.; Ballabio, C.; Masetti, M.; Robinson, G.; Sterlacchini, S. A comparison of data-driven groundwater vulnerability assessment methods. Groundwater 2013, 51, 866–879. [Google Scholar] [CrossRef] [PubMed]
- Ivan, V.; Madl-Szonyi, J. State of the art of karst vulnerability assessment: Overview, evaluation and outlook. Environ. Earth Sci. 2017, 76, 25. [Google Scholar] [CrossRef]
- Aslam, R.; Shrestha, S.; Pandey, V. Groundwater vulnerability to climate change: A review of the assessment methodology. Sci. Total Environ. 2018, 612, 853–875. [Google Scholar] [CrossRef] [PubMed]
- Fisher, G.J. The selection of cemetery sites in South Africa. In Proceedings of the 4th Terrain Evaluation and Data Storage Symposium, Midrand, South Africa, 3–5 August 1994. [Google Scholar]
- Hamza, S.; Ahsan, A.; Imteaz, M.; Rahman, A.; Mohammad, T.; Ghazali, A. Accomplishment and subjectivity of GIS-based DRASTIC groundwater vulnerability assessment method: A review. Environ. Earth Sci. 2015, 73, 3063–3076. [Google Scholar] [CrossRef]
- Sahoo, S.; Dhar, A.; Kar, A.; Chakraborty, D. Index-based groundwater vulnerability mapping using quantitative parameters. Environ. Earth Sci. 2016, 75, 522. [Google Scholar] [CrossRef]
- Salem, Z.; Sefelnasr, A.; Hasan, S. Assessment of groundwater vulnerability for pollution using DRASTIC Index, young alluvial plain, Western Nile Delta, Egypt. Arab. J. Geosci. 2019, 12, 727. [Google Scholar] [CrossRef]
- Barzegar, R.; Moghaddam, A.; Norallahi, S.; Inam, A.; Adamowski, J.; Alizadeh, M.; Nassar, J. Modification of the DRASTIC framework for mapping groundwater vulnerability zones. Groundwater 2020, 58, 441–452. [Google Scholar] [CrossRef]
- Hu, X.; Ma, C.; Qi, H.; Guo, X. Groundwater vulnerability assessment using the GALDIT model and the improved DRASTIC model: A case in Weibei Plain, China. Environ. Sci. Pollut. Res. 2018, 25, 32524–32539. [Google Scholar] [CrossRef]
- Teixeira, J.; Chaminé, H.; Carvalho, J.; Perez-Alberti, A.; Rocha, F. Hydrogeomorphological mapping as a tool in groundwater exploration. J. Maps 2013, 9, 263–273. [Google Scholar] [CrossRef]
- Teixeira, J.; Chaminé, H.; Espinha Marques, J.; Carvalho, J.; Pereira, A.; Carvalho, M.; Fonseca, P.; Perez-Alberti, A.; Rocha, F. A comprehensive analysis of groundwater resources using GIS and multicriteria tools (Caldas da Cavaca, Central Portugal): Environmental issues. Environ. Earth Sci. 2015, 73, 2699–2715. [Google Scholar] [CrossRef]
- Stempvoort, D.; Ewert, L.; Wassenaar, L. Aquifer vulnerability index: A gis–compatible method for groundwater vulnerability mapping. Can. Water Resour. J. 1993, 18, 25–37. [Google Scholar] [CrossRef] [Green Version]
- Malik, P.; Svasta, J. REKS: An alternative method of Karst groundwater vulnerability estimation. In Proceedings of the XXIX Congress of the International Association of Hydrogeologists, Bratislava, Slovakia, 6–10 September 1999; pp. 79–85. [Google Scholar]
- Somaratne, N.; Zulfic, H.; Ashman, G.; Vial, H.; Swaffer, B.; Frizenschaf, J. Groundwater risk assessment model (GRAM): Groundwater risk assessment model for wellfield protection. Water 2013, 5, 1419–1439. [Google Scholar] [CrossRef] [Green Version]
- Vias, J.; Andreo, B.; Perles, M.; Carrasco, F.; Vadillo, I.; Jimenez, P. Proposed method for groundwater vulnerability mapping in carbonate (karstic) aquifers: The COP method. Hydrogeol. J. 2006, 14, 912–927. [Google Scholar] [CrossRef]
- Civita, M.; Maio, M. Assessing and mapping groundwater vulnerability to contamination: The Italian “combined” approach. Geofisc. Int. 2004, 43, 513–532. Available online: https://www.scopus.com/record/display.uri?eid=2-s2.0-16244403601&origin=inward&txGid=586cb690afbbd0839a7ccb2b2ab8e9f7 (accessed on 5 January 2023). [CrossRef] [Green Version]
- Qian, H.; Li, P.; Howard, K.; Yang, C.; Zhang, X. Assessment of groundwater vulnerability in the Yinchuan plain, northwest China using OREADIC. Environ. Monit. Assess. 2012, 184, 3613–3628. [Google Scholar] [CrossRef]
- Zhang, Q.; Li, P.; Lyu, Q.; Ren, X. Groundwater contamination risk assessment using a modified DRATICL model and pollution loading: A case study in the Guanzhong Basin of China. Chemosphere 2022, 291 Pt 1, 132695. [Google Scholar] [CrossRef] [PubMed]
- Wang, J.; He, J.; Chen, H. Assessment of groundwater contamination risk using hazard quantification, a modified DRASTIC model, and groundwater value, Beijing Plain, China. Sci. Total Environ. 2012, 432, 216–226. [Google Scholar] [CrossRef] [PubMed]
- Goncalves, V.; Albuquerque, A.; Almeida, P.G.; Cavaleiro, V. DRASTIC Index GIS-Based Vulnerability Map for the Entre-os-Rios Thermal Aquifer. Water 2022, 14, 2448. [Google Scholar] [CrossRef]
- Jang, W.; Engel, B.; Harbor, J.; Theller, L. Aquifer Vulnerability Assessment for Sustainable Groundwater Management Using DRASTIC. Water 2017, 9, 792. [Google Scholar] [CrossRef] [Green Version]
- Sinan, M.; Razack, M. An extension to the DRASTIC model to assess groundwater vulnerability to pollution: Application to the Haouz aquifer of Marrakech (Morocco). Environ. Geol. 2009, 57, 349–363. [Google Scholar] [CrossRef]
- Herlinger, R., Jr.; Viero, A. Groundwater vulnerability assessment in coastal plain of Rio Grande do Sul State, Brazil, using drastic and adsorption capacity of soils. Envion. Geol. 2007, 52, 819–829. [Google Scholar] [CrossRef]
- Kabera, T.; Zhaohui, L. A GIS Based DRASTIC model for assessing groundwater in shallow aquifer in Yuncheng Basin, Shanxi. China Res. J. Appl. Sci. 2008, 3, 195–205. Available online: https://medwelljournals.com/abstract/?doi=rjasci.2008.195.205 (accessed on 30 January 2023).
- Hasiniaina, F.; Zhou, J.; Guoyi, L. Regional assessment of groundwater vulnerability in Tamtsag basin, Mongolia using drastic model. J. Am. Sci. 2010, 6, 65–78. Available online: http://www.jofamericanscience.org/journals/am-sci/am0611/09_3069am0611_65_78.pdf (accessed on 30 January 2023).
- Saidi, S.; Bouri, S.; Ben Dhia, H.; Anselme, B. Assessment of groundwater risk using intrinsic vulnerability and hazard mapping: Application to Souassi aquifer. Tunis. Sahel Agric. Water Manag. 2011, 98, 1671–1682. [Google Scholar] [CrossRef]
- Hallaq, A.; Elaish, B. Assessment of aquifer vulnerability to contamination in Khanyounis Governorate, Gaza Strip-Palestine, using the DRASTIC model within GIS environment. Arab. J. Geosci. 2012, 5, 833–847. [Google Scholar] [CrossRef]
- Shah, S.; Yan, J.; Ullah, I.; Aslam, B.; Tariq, A.; Zhang, L.; Mumtaz, F. Classification of aquifer vulnerability by using the DRASTIC index and geo-electrical techniques. Water 2021, 13, 2144. [Google Scholar] [CrossRef]
- Hamed, M.; Dara, R.; Kirlas, M. Groundwater vulnerability assessment using a GIS-based DRASTIC method in Erbil Dumpsite area (Kani Qirzhala), Central Erbil Basin, North Iraq. Res. Sq. 2022. [Google Scholar] [CrossRef]
- SNIRH: Portuguese Water Resources Information System. Available online: https://dataportal.ponderful.eu/hu/dataset/snirh-portuguese-national-information-system-of-the-water-resources (accessed on 5 January 2023).
- ISRIC. World Soil Information. International Soil Reference and Information Centre. 2023. Available online: https://www.isric.org (accessed on 5 January 2023).
- SNIAMB. Carta dos Solos de Portugal. Information Provided for FAO. Agência Portuguesa do Ambiente, Department of Technologies and Information Systems, SROA–1971. Available online: https://sniambgeoviewer.apambiente.pt/GeoDocs/shpzips/AtAmb_3001111_CSolos_Cont.zip (accessed on 5 January 2023).
- USGS, EarthExplorer. Available online: https://earthexplorer.usgs.gov/ (accessed on 5 January 2023).
- Singhal, B.; Gupta, R. Applied Hydrogeology of Fractured Rocks, 2nd ed.; Springer: Dordrecht, The Netherlands, 2010. [Google Scholar] [CrossRef]
- LNEG. Carta geológica de Portugal Continental, Escala 1:500000, Laboratório Nacional de Engenharia Geológica. 1992. Available online: https://geoportal.lneg.pt/pt/dados_abertos/cartografia_geologica/ (accessed on 6 January 2023).
- LNEC. Cartografia da Vulnerabilidade à Poluição das Águas Subterrâneas do Concelho de Montemor-o-Novo Utilizando o Método DRASTIC. Proc. 607/1/14252, Laboratório Nacional de Engenharia Civil, Departamento de Hidráulica, Grupo de Investigação de Águas Subterrâneas, Lisbon. 2002. Available online: www.lnec.pt/en/research/publications/1-4-665/?pg_1529=8 (accessed on 8 January 2023).
- Trincão, P.; Lopes, E.; Carvalho, J.; Ataíde, S.; Perrolas, M. Beyond Time and Space-The Aspiring Jurassic. Geosciences 2018, 8, 190. [Google Scholar] [CrossRef] [Green Version]
- Almeida, C.; Mendonça, J.; Jesus, M.; Gomes, A. Sistemas Aquíferos de Portugal Continental; Centro de Geologia da Universidade de Lisboa and Instituto Nacional da Água: Lisbon, Portugal, 2000. [Google Scholar] [CrossRef]
- Portuguese Climate Database. Available online: http://portaldoclima.pt/pt/ (accessed on 10 January 2023).
- INIAV. Base de Dados de Perfis de Solos de Portugal, Instituto Nacional de Investigação Agrária e Veterinária. 2020. Available online: https://projects.iniav.pt/infosolo/ (accessed on 11 January 2023).
- Carter, D.; Yellowlees, D.; Tibbett, M. Cadaver decomposition in terrestrial ecosystems. Naturwissenchaften 2007, 94, 12–24. [Google Scholar] [CrossRef] [Green Version]
- Silva, F.; Albuquerque, A.; Cavaleiro, V.; Scalize, P. Removal of Cr, Cu and Zn from liquid effluents using the fine component of granitic residual soils. Open Eng. 2018, 8, 417–425. [Google Scholar] [CrossRef]
- Silva, F.; Scalize, P.; Crunivel, K.; Albuquerque, A. Caracterização de solos residuais para infiltração de efluente de estação de tratamento de esgoto. Rev. Eng. Sanit. E Ambient. 2017, 22, 95–102. [Google Scholar] [CrossRef] [Green Version]
- Pietri, J.; Brookes, P. Relationships between soil pH and microbial properties in a UK arable soil. Soil Biol. Biochem. 2008, 40, 1856–1861. [Google Scholar] [CrossRef]
- Moore, G.; Dolling, P.; Porter, B.; Leonard, L. Soil acidity. In Soilguide; A handbook for understanding and managing agricultural soils; Moore, G., Ed.; Agriculture Western Australia: Perth, Australia, 2001; ISBN 0-7307-0057-7. [Google Scholar]
- CEE. Council Directive 1999/31/EC on the landfill of waste. In Council of the European Union, Official Journal of the European Communities; L. 182; Council of the European Union: Brussels, Belgium, 26 April 1999; 19p. [Google Scholar]
- Bombino, G.; Denisi, P.; Gomez, J.; Zema, D. Water infiltration and surface runoff in steep clayey soils of olive groves under different management practices. Water 2019, 11, 240. [Google Scholar] [CrossRef] [Green Version]
- Marchiori, L.; Studart, A.; Albuquerque, A.; Pais, L.; Boscov, M.; Cavaleiro, V. Mechanical and chemical behaviour of water treatment sludge and soft soil mixtures for liner production. Open Civ. Eng. J. 2022, 16, e187414952211101. [Google Scholar] [CrossRef]
- Tahmasbi, R.; Kholghi, M.; Najarchi, M.; Liaghat, A.; Mastouri, R. Post-treatment of reclaimed municipal wastewater through unsaturated and saturated porous media in a large-scale experimental model. Water 2022, 14, 1137. [Google Scholar] [CrossRef]
- Brooks, J.; Weisbrod, N.; Bar-Zeev, E. Revisiting soil aquifer treatment: Improving biodegradation and filtration efficiency using a highly porous material. Water 2020, 12, 3593. [Google Scholar] [CrossRef]
- Zychowski, J. Impact of cemeteries on groundwater chemistry: A review. CATENA 2012, 93, 29–37. [Google Scholar] [CrossRef]
- Quinton, J.; Duinker, P. Beyond burial: Researching and managing cemeteries as urban green spaces, with examples from Canada. Environ. Rev. 2019, 27, 252–262. [Google Scholar] [CrossRef]
- Rezaei, F.; Safavi, H.; Ahmadi, A. Groundwater vulnerability assessment using Fuzzy logic: A case study in the Zayandehrood aquifers, Iran. Environ. Manag. 2013, 51, 267–277. [Google Scholar] [CrossRef]
- Ahmed, A. Using generic and pesticide DRASTIC GIS-based models for vulnerability assessment of the Quaternary aquifer at Sohag, Egypt. Hydrogeol. J. 2009, 17, 1203–1217. [Google Scholar] [CrossRef]
- Yin, L.; Zhang, E.; Wang, X.; Wenninger, J.; Dong, J.; Guo, L.; Huang, J. A GIS-based DRASTIC model for assessing groundwater vulnerability in the Ordos Plateau, China. Envion. Earth Sci. 2013, 69, 171–185. [Google Scholar] [CrossRef]
- Pedrosa, A.; Figueiredo, F.; Azevedo, J.; Tavares, A. Geologia ambiental associada a cemitérios: Estudo de caso na região centro de Portugal. Comun. Geol. 2010, 101, 1037–1041. Available online: http://www.lneg.pt/iedt/unidades/16/paginas/26/30/185 (accessed on 24 January 2023).
Figure 1.
Geographic location of the eight cemeteries in the Figueira da Foz region.

Figure 2.
Flow chart used to develop the groundwater vulnerability map using the DRASTIC index in GIS.
Figure 2.
Flow chart used to develop the groundwater vulnerability map using the DRASTIC index in GIS.

Figure 3.
(a) Slope map; (b) curvature profile map.

Figure 4.
Geological map of the studied area.

Figure 5.
(a) Hydrogeological map; (b) potential infiltration zones of the studied area.

Figure 6.
Monthly hydrological balance for the studied area.

Figure 7.
(a) NDMI; (b) characteristics of soil in the upper weathered zone.

Figure 8.
(a) Silt map; (b) clay map; (c) sand map; (d) pH map; (e) organic carbon; (f) CEC map.


Figure 9.
(a) Parameter D map; (b) parameter R map; (c) parameter A map; (d) parameter S map; (e) parameter T map; (f) parameter I map of the studied area.
Figure 9.
(a) Parameter D map; (b) parameter R map; (c) parameter A map; (d) parameter S map; (e) parameter T map; (f) parameter I map of the studied area.

Figure 10.
(a) Parameter C map; (b) vulnerability map to pollution of the studied area.

Figure 11.
(a) Occupation rate map; (b) flow direction and buffer zones to water abstraction points of the studied area.
Figure 11.
(a) Occupation rate map; (b) flow direction and buffer zones to water abstraction points of the studied area.


| DRASTIC Index | |
|---|---|
| Quantitative Classes | Qualitative Vulnerability |
| 23–79 | Insignificant |
| 80–99 | Extremely low |
| 100–119 | Very low |
| 120–139 | Low |
| 140–159 | Average |
| 160–179 | High |
| 180–199 | Very high |
| 200–226 | Extremely high |
Table 2.
Information for developing the site characteristic maps.
| Cemeteries | Curvature (Z-Units) | Geology | Hydrogeology | NDMI | Type of Soil | Silt (%) | Clay (%) | Sand (%) | pH | Organic Carbon (%) | CEC (meq/100 g) | Occupation Rate (%) | Flow Direction |
|---|---|---|---|---|---|---|---|---|---|---|---|---|---|
| UC1 | 0 | Boa Viagem Sandstones | Bacia do Vouga | <0 | Bc | 20 | >20 | 20 | 4.6–5.5 | <0.3 | 5.1–10 | 4.3 | S |
| UC2 | 0 | Carrascal Sandstones | Figueira da Foz-Gesteira | <0 | Be | 20 | >20 | 20 | 4.6–5.5 | 0.31–0.9 | 5.1–10 | 1.7 | SW |
| UC3 | 0 | Carrascal Sandstones | Figueira da Foz-Gesteira | 0 | Be | 20 | >20 | 20 | 4.6–5.5 | 0.31–0.9 | 5.1–10 | 2.3 | S |
| UC4 | 0 | Beach Sands and dunes | Leirosa-Monte Real | <0 | SC-Z | 20 | >20 | 20 | 4.6–5.5 | 0.31–0.9 | 5.1–10 | 2.2 | W |
| UC5 | 0 | D’Arnes Limestones | Figueira da Foz-Gesteira | 0 | Je | >>40 | 20 | >20 | 5.6–6.5 | 0.91–1.7 | 11–20 | 2.0 | S |
| UC6 | 0 | Sands and Clays with Kaolinite | Louriçal | 0 | Je | >30 | 20 | >20 | 4.6–5.5 | 0.31–0.9 | 5.1–10 | 5.1 | NE |
| UC7 | 0 | Boa Viagem formation | Louriçal | 0 | PZ | >30 | <20 | >20 | 5.6–6.5 | 0.31–0.9 | 11–20 | 2.4 | NE |
| UC8 | 0 | Boa Viagem formation | Louriçal | 0 | Je | >40 | <20 | >20 | 5.6–6.5 | 1.8–2.6 | 11–20 | 2..1 | E |
Be: Eutric cambisols; Bc: Calcic Cambisols; SC-Z: Gleyic Solonchaks; Je: Eutric Fluvisol; PZ: Orthic Podzols.
Table 3.
Characteristics of cemeteries for the development of thematic DRASTIC maps.
| Cemeteries | Water Table Depth (m), D | Net Recharge (mm/year), R | Aquifer Media (Lithology of the Saturated Zone), A | Soil Media (Upper Weathered Zone), S | Topography (Land Slope, %), T | Impact of the Vadose Zone (Unsaturated Zone Material), I | Hydraulic Conductivity (m/day), C |
|---|---|---|---|---|---|---|---|
| UC1 | 22.9–30.5 | 0 | Thick succession of fine/coarse sandstones, conglomerates, clays, and some marls | Calcic Cambisols (Bc), clay loam/clayey | 6–12 | Thick succession of fine/coarse sandstones, conglomerates, clays, and some marls | 4.1–12.2 |
| UC2 | 15.2–22.9 | 254 | Well-consolidated coarse silty clay stoneware | Eutric Cambisols (Be), francs/francs clayey | 2–6 | Well-consolidated coarse silty clay stoneware | 4.1–12.2 |
| UC3 | 22.9–30.5 | Well-consolidated coarse silty clay stoneware | Eutric Cambisols (Be), francs/francs clayey | 6–12 | Well-consolidated coarse silty-clay stoneware | 4.1–12.2 | |
| UC4 | 15.2–22.9 | 254 | Fine-grained and calibrated sands | Gleyic Solonchaks (SC-Z), saline soils | 0–2 | Fine-grained and calibrated sands | >81.5 |
| UC5 | 15.2–22.9 | 254 | Concreted/piled marly limestones, limestone sandstones, and marls with a lapped surface | Eutric Fluvisol (Je), loam/sandy loam | 0–2 | Concreted/piled marly limestones, limestone sandstones, and marls with a lapped surface | 4.1–12.2 |
| UC6 | 9.1–15.2 | 254 | Sands with Kaolinite | Eutric Fluvisol (Je), loam/sandy loam | 2–6 | Sands with kaolinite | 12.2–28.5 |
| UC7 | 15.2–22.9 | 254 | Clayey sandstones and clays alternated | Orthic Podzols (PZ), unconsolidated quartz sediments | 0–2 | Clayey sandstones and clays alternated | 4.1–12.2 |
| UC8 | 15.2–22.9 | 254 | Clayey sandstones and clays alternated | Eutric Fluvisol (je), loam/sandy loam | 2–6 | Clayey sandstones and clays alternated | 4.1–12.2 |
Table 4.
Ratings, index values, and qualitative classification for the eight cemeteries.
| DRASTIC Index | |||||||||
|---|---|---|---|---|---|---|---|---|---|
| Cemeteries | D | R | A | S | T | I | C | DRASTIC Index | Qualitative Vulnerability |
| UC1 | 2 | 0 | 6 | 7 | 5 | 6 | 2 | 83 | Extremely Low |
| UC2 | 3 | 9 | 5 | 3 | 9 | 5 | 2 | 112 | Very Low |
| UC3 | 2 | 0 | 5 | 3 | 5 | 5 | 2 | 67 | Insignificant |
| UC4 | 3 | 9 | 7 | 9 | 10 | 8 | 10 | 170 | Hight |
| UC5 | 3 | 9 | 6 | 6 | 10 | 6 | 2 | 127 | Low |
| UC6 | 5 | 9 | 4 | 6 | 9 | 4 | 4 | 126 | Low |
| UC7 | 3 | 9 | 6 | 8 | 10 | 6 | 2 | 131 | Low |
| UC8 | 3 | 9 | 6 | 6 | 9 | 6 | 2 | 126 | Low |
Table 5.
Drastic index values in studies with different pollution sources.
| Reference | Index Range | Percentage Distribution for Each Drastic Index Class (%) | Source of Contamination | |||
|---|---|---|---|---|---|---|
| VL | L | A | H | |||
| This study | 67–170 | 12.5 | 50.0 | NC | 12.5 | Cemeteries |
| Hallaq and Elaish [65] | 77–182 | NC | 27.2 | 43.4 | 26.2 | Agricultural fields |
| Salem et al. [45] | 140–205 | NC | NC | 28.4 | 58.9 | Pesticides |
| Saidi et al. [64] | 62–185 | 5.0 | 37.0 | 33.0 | 25.0 | Agricultural fields |
| Kabera and Zhaohui [62] | 93–156 | NC | 24.6 | 55.0 | 20.4 | Wastewater devices (e.g., septic tanks) and agricultural fields |
| Herlinger Jr and Viero [61] | 146–203 | NC | NC | NC | 54.3 | Soil contaminated with metals |
| Rezaei et al. [91] | 50–153 | 3.5 | 38.0 | 48.3 | 9.4 | Industrial facilities |
| Ahmed [92] | 94–189 | NC | 2.0 | 15.0 | 35.0 | Pesticides |
| Yin et al. [93] | 76–188 | 31.3 | 19.7 | 24.2 | 24.8 | Nitrates |
| Hu et al. [47] | 144–199 | NC | 29.0 | 34.3 | 9.9 | Seawater intrusion |
| Sinan and Razack [60] | 71–204 | 1.5 | 51.5 | 45.8 | 1.2 | Industrial facilities, cemeteries, and waste deposits |
L: low; A: average; H: high; NC: no classification for the class.
Table 6.
Theoretical weights and effective weights after single-parameter sensitivity analysis.
| Parameter | Theoretical Weight (%) | Effective Weight (%) | ||
|---|---|---|---|---|
| Mean | CV | SD | ||
| D | 21.74 | 7.74 | 30.9 | 0.93 |
| R | 17.39 | 17.42 | 61.7 | 4.17 |
| A | 13.04 | 14.52 | 16.3 | 0.92 |
| S | 8.70 | 15.48 | 35.6 | 2.14 |
| T | 4.35 | 21.61 | 25.5 | 2.13 |
| I | 21.74 | 14.84 | 20.3 | 1.16 |
| C | 13.04 | 8.39 | 86.6 | 2.82 |
Disclaimer/Publisher’s Note: The statements, opinions and data contained in all publications are solely those of the individual author(s) and contributor(s) and not of MDPI and/or the editor(s). MDPI and/or the editor(s) disclaim responsibility for any injury to people or property resulting from any ideas, methods, instructions or products referred to in the content. |
© 2023 by the authors. Licensee MDPI, Basel, Switzerland. This article is an open access article distributed under the terms and conditions of the Creative Commons Attribution (CC BY) license (https://creativecommons.org/licenses/by/4.0/).
Share and Cite
MDPI and ACS Style
Gonçalves, V.; Albuquerque, A.; Carvalho, P.; Almeida, P.; Cavaleiro, V. Groundwater Vulnerability Assessment to Cemeteries Pollution through GIS-Based DRASTIC Index. Water 2023, 15, 812. https://doi.org/10.3390/w15040812
AMA Style
Gonçalves V, Albuquerque A, Carvalho P, Almeida P, Cavaleiro V. Groundwater Vulnerability Assessment to Cemeteries Pollution through GIS-Based DRASTIC Index. Water. 2023; 15(4):812. https://doi.org/10.3390/w15040812
Chicago/Turabian StyleGonçalves, Vanessa, Antonio Albuquerque, Paulo Carvalho, Pedro Almeida, and Victor Cavaleiro. 2023. "Groundwater Vulnerability Assessment to Cemeteries Pollution through GIS-Based DRASTIC Index" Water 15, no. 4: 812. https://doi.org/10.3390/w15040812
Note that from the first issue of 2016, this journal uses article numbers instead of page numbers. See further details here.