
Recording Permafrost Thaw and Thaw Lake Degradation in Northern Siberia: School Science in Action

1
Tazovskaya Secondary School, 629350 Tazovsky, Russia
2
School of Biosciences, University of Sheffield, Sheffield S10 2TN, UK
3
Botany Department, Tomsk State University, 634050 Tomsk, Russia
4
Excellence Support Unit, Laboratory for Ecosystems and Climate Change Study, Tomsk State University, 634050 Tomsk, Russia
*
Author to whom correspondence should be addressed.
Water 2023, 15(4), 818; https://doi.org/10.3390/w15040818
Submission received: 17 December 2022
/
Revised: 15 February 2023
/
Accepted: 17 February 2023
/
Published: 20 February 2023
(This article belongs to the Special Issue Climate Change and Anthropogenic Impacts on Wetland Ecosystems in Siberia: Past, Present, and Future)
Abstract
:Arctic landscapes are changing dramatically in response to climate changes that are regionally four times faster than the global average. However, these vast lands are sparsely populated and ground-based measurements of environmental change impacts on land and lakes are few compared with the impacted areas. In the Tazovsky District of the Yamalo-Nenets Autonomous Okrug, school science has been put into practice for over 20 years to determine thermokarst lake changes and their causes. We describe the contributions of school science in recording these lake changes and also their local impacts as a contribution to the Siberian Environmental Change Network. Describing the process and results are particularly relevant to the generation that will experience the greatest environmental change impacts. In contrast to the use of traditional indigenous knowledge, we report on a conventional science methodology used by local people that further empowers a new generation to determine for themselves the changes in their environment and associated implications.
1. Introduction
The Arctic is vast in area and Siberia is the largest part of that landmass covering some 13 million km2 [1]. It is experiencing huge climatic changes with mega environmental impacts [2,3], and impacts on infrastructure that are causing great economic losses [4,5]. However, Siberia is sparsely populated (36 million people) and the observing power of landscape change and its impacts on the ground is limited. Although remote sensing can answer some of the questions about changes in the landscapes affected by climate change, it is local people who are affected by changes that understand their multiple social and environmental impacts. For that reason, citizen science [6], community-based observations [7,8], and indigenous knowledge [9,10] are gaining increasing recognition for their contributions to environmental observation and the monitoring of sustainability [11]. Although citizen science and community observations are well known in highly populated countries, for example, observations of birds, insects, and wildflowers [8,12], they are arguably less developed—yet more important—in isolated and small communities. One notable advance is the observatory of the indigenous Evenki in the Far East [13].
Waterbody dynamics is a critically important subject that would benefit from local science. Changes in waterbody dynamics determine human health [14] through water availability and quality [15,16,17], biodiversity [18], greenhouse gas fluxes [19,20,21], and infrastructure maintenance and development [22,23].
The numerous and varied impacts of thermokarst lake dynamics on northern landscapes and ecosystems has been described by many scientists. One of the first large-scale studies of the thermokarst lake dynamics in the vast territory of Western Siberia (within about 515 km2, from 62° N to 69° N and from 64.5° E to 85° E) was carried out by [24], but they only investigated large-scale lakes of at least 40 ha area. This study showed that more lakes were disappearing than were being formed in the period 1973 to 2003. A more recent study [25] showed the opposite trend from 1973 to 2013, indicating the need for ground-based observations. Furthermore, [19] focusing specifically on small ponds, suggested that our global flux estimates were underestimated at that time, indicating the potential important contributions from these small ponds. Kravtsova and Tarasenko [26] described the discrepancies in the conclusions from satellite imagery and point out that the various authors clearly understand the need to support their conclusions with field observations to assess the reliability and accuracy in determining changes in the areas of thermokarst lakes.
Wetland ecosystems of the subarctic region of Western Siberia are unique natural indicators of climate change as they are most sensitive to climate change due to their locations across boundaries of different climatically-sensitive permafrost zones, a situation first recognized by [27]. Until recently, landscapes of this type were in a fairly stable dynamic equilibrium. The general scheme of the cyclical dynamics was the subsidence of a section of a flat-hummocky swamp with the formation of a hollow—an “embryonic” lake, then the growth of the lake, followed by the dumping of its water into another reservoir (a lower lake) leaving a drained lake called a “khasyrey” with high biomass and productivity. Permafrost heaving occurs in the “khasyrey”, which leads to the formation of frozen mounds which eventually thaw and lead to the beginning of the next cycle of development of the thermokarst lakes. Significant field studies of this process have been undertaken by a group of French and Siberian scientists [28]. Analyses based on satellite images of long-term observations show that at present, in the north of Western Siberia, permafrost degradation is taking place with an increase in the number of thermokarst lakes that is probably overriding the natural, long-term cycles described above. Despite this recent remote sensing study ([28]), the need remains for local observations of waterbody dynamics, their causes, and their impacts, particularly as causes of waterbody dynamics at the local scale could be associated with local land use in addition to, or combined with, climate changes and their impacts. One such example of land use that affects lakes is the active development of oil and gas fields that requires a significant amount of building material, including sand, which is taken using a dredger from thermokarst lakes [29].
This paper has two aims. Firstly, it seeks to explore the application of school science to identifying, monitoring, and reporting local environmental challenges, particularly waterbody dynamics. This is within the context of improving and expanding the observational capacity of environmental change in remote areas and empowering a new generation of community members. Secondly, this study presents data, recorded by school students and teachers living in a remote area of northern Siberia, on local permafrost thaw, its causes, and its impacts on water body dynamics.
2. Materials and Methods
2.1. Study Area: Geography and Climate
The study area is at the entrance to the village of Gaz-Sale (Figure 1) in the Tazovsky District of the Yamalo-Nenets Autonomous Okrug, located 155 km north of the Arctic Circle.
The district is geographically located in the forest–tundra, tundra, and arctic tundra zones. The climate throughout these zones varies from temperate to more severe. The main part of the territory is located in the tundra zone with continuous permafrost [30,31]. Here, sandy, gently undulating plains with flat-hummocky frozen swamps, lichen, and dwarf birch tundras are widespread. In the North Nadym–Purovsky forest–tundra province, there are combinations of hill ridge-lichen tundras with frozen swamps and riverine larch woodlands. Although biodiversity is low, animals listed in the Red Book of the Russian Federation occur. The climate of the region is characterized as severe and continental. Thus, there are low winter temperatures and a large amplitude of temperatures between the cold and warm periods of the year. The warm season, with a maximum average daily temperature above 10 °C, lasts 2.9 months, from 9 June to 7 September. The hottest month of the year in Tazovsky District is July, with an average temperature maximum of 17 °C and minimum of 9 °C. The cold season lasts 4.0 months, from 13 November to 12 March, with a minimum average daily temperature below −14 °C. The coldest month of the year in Tazovsky District is January, with an average temperature maximum of −28 °C. Snow cover lasts for 8–9 months. In winter, the Asian anticyclone dominates with clear sunny weather, which contributes to the cooling of the atmosphere and temperatures drop to −55 °C and below. The influence of the Arctic Ocean on the climate of the region is small because it is covered with ice in winter [32].
The Tazovsky District is characterized by an abundance of lakes and peat bogs and there are also a large number of bays, including Ob Bay, Gydan Bay, and Taz Bay, as well as the largest rivers of the region, the Pur, the Taz, the Tanama, the Messoyakha, the Yuribey, and swamps.
Traditional land use away from settlements is subsistence fishing and reindeer herding. Currently, land use is also used for gas and oil extraction as the region has large hydrocarbon resources (oil, gas, and gas condensate) and there are deposits of phosphorites and clay. To date, 28 hydrocarbon deposits and promising areas have been explored in the region.
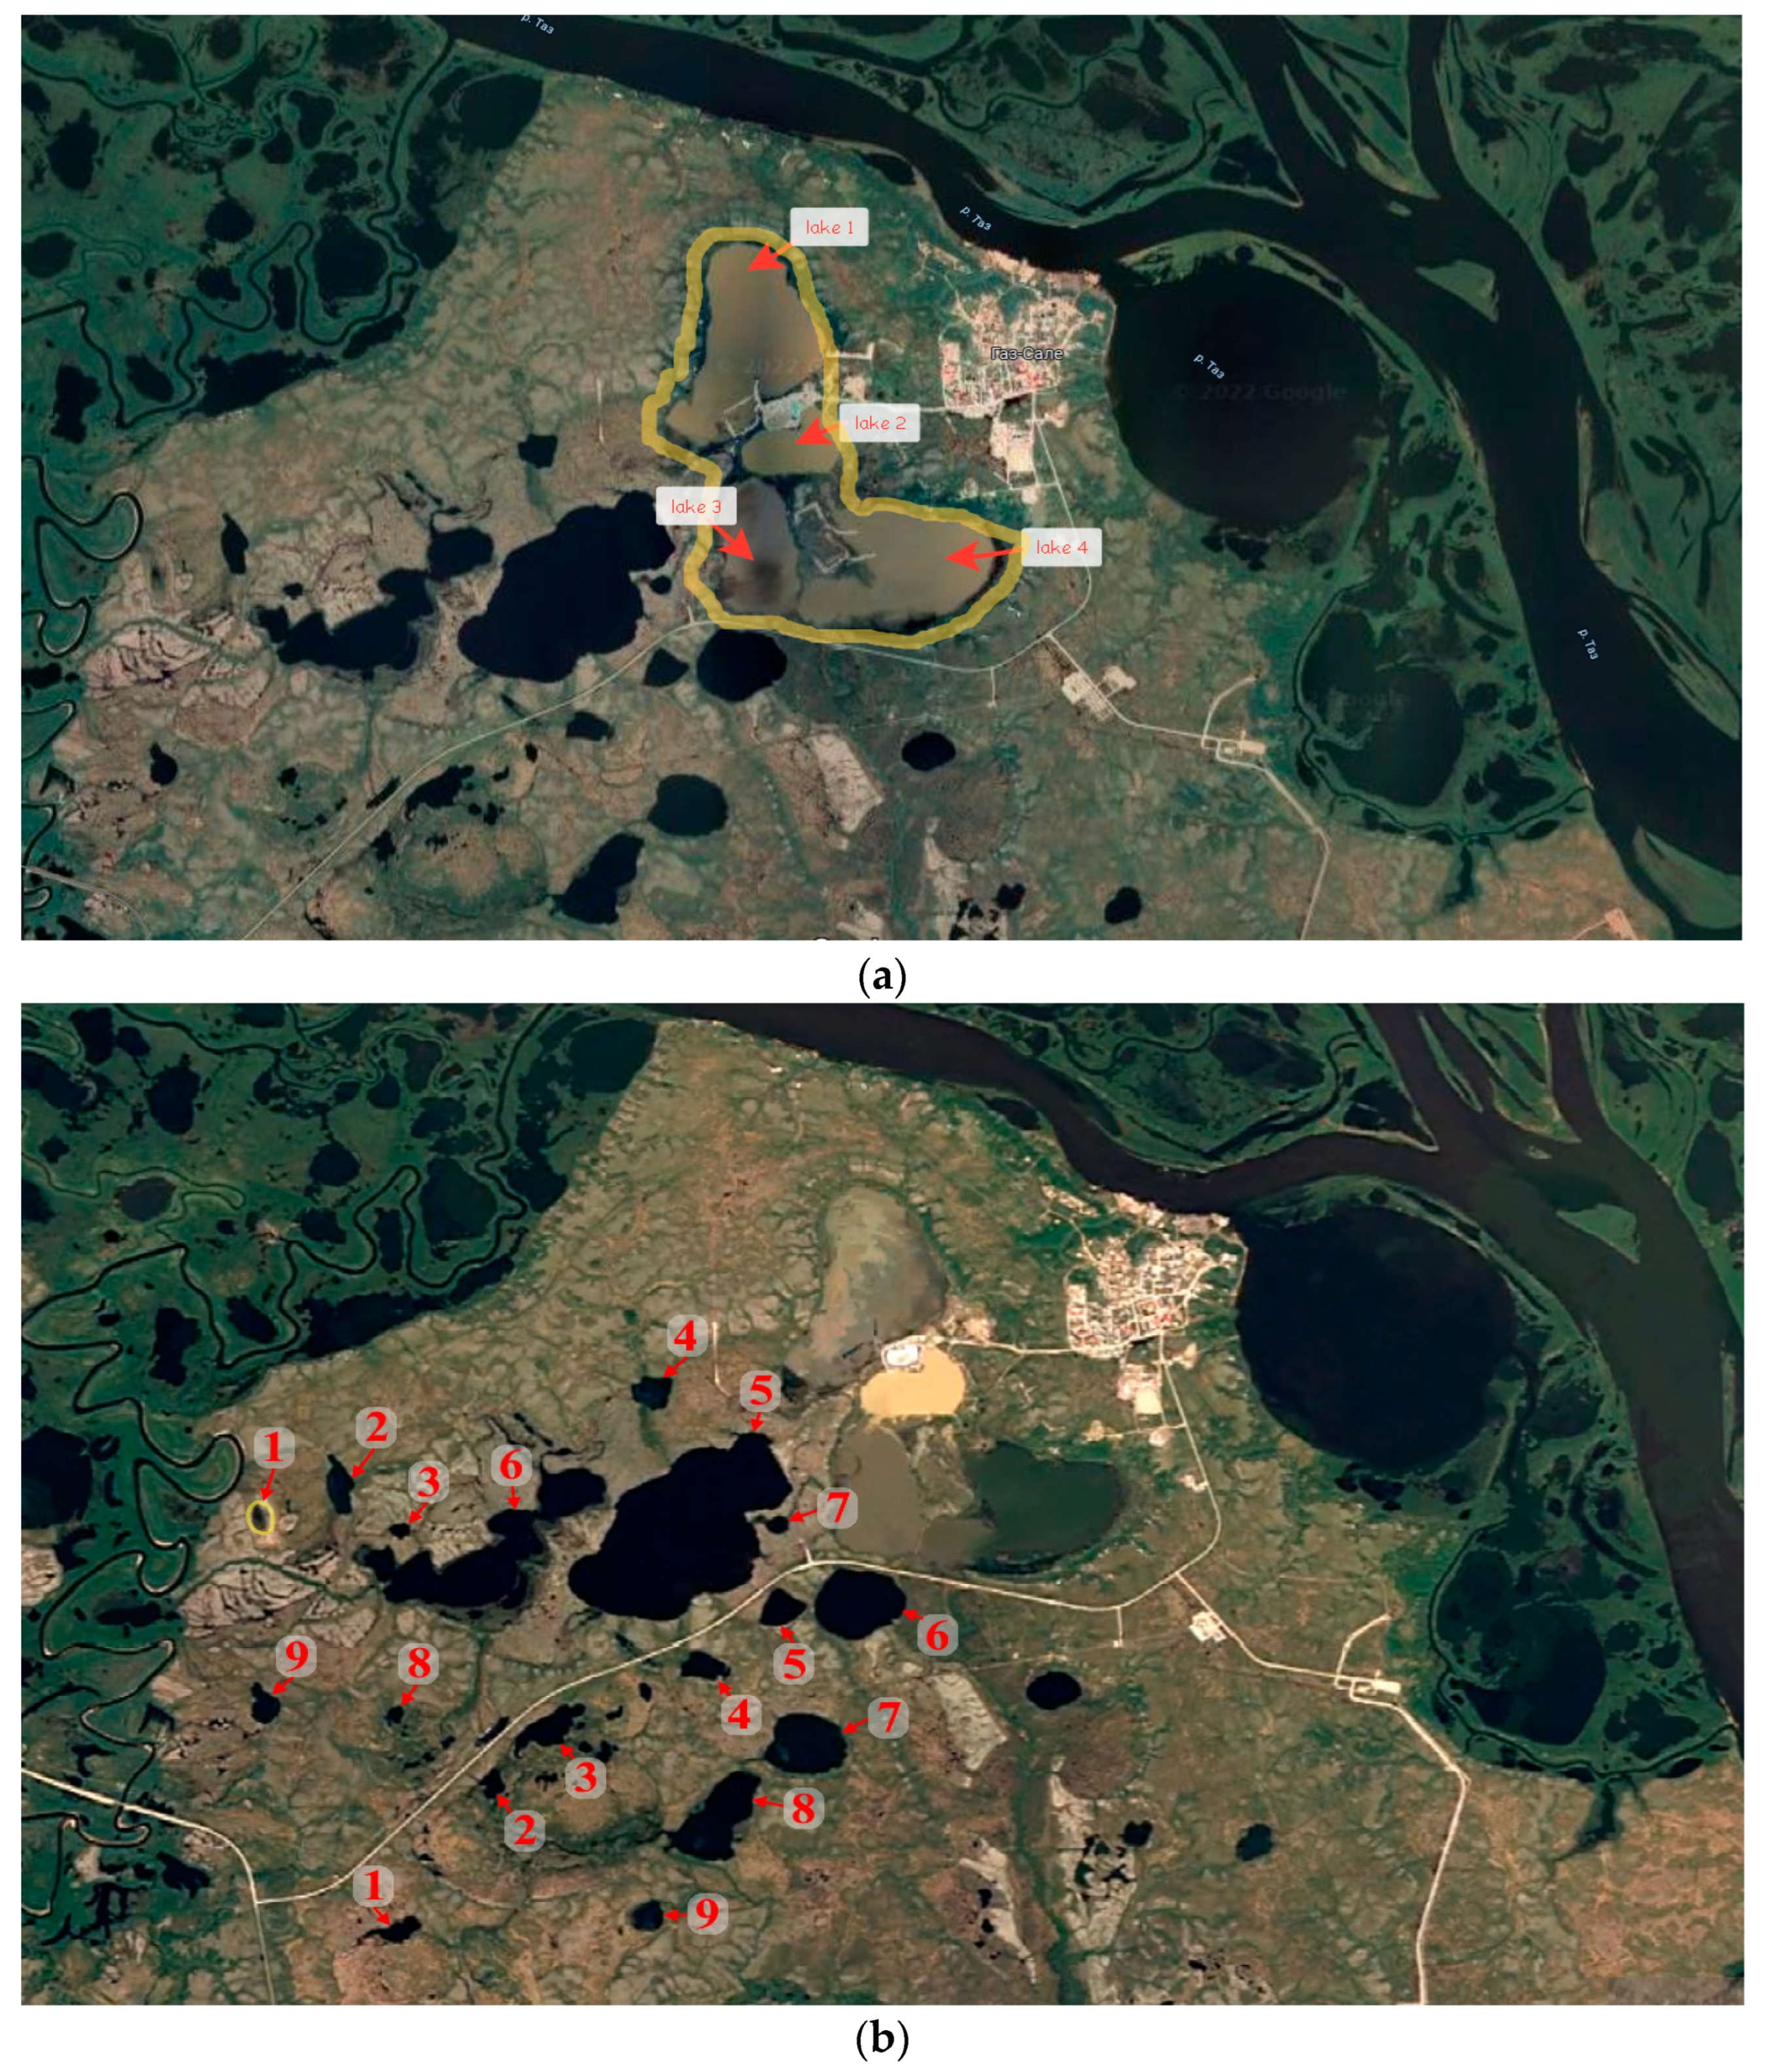
The area has a mixture of organic tundra soils and sandy soils in the continuous permafrost zone [30,31]. The continuity of permafrost is interrupted from the surface only under riverbeds and lakes as well as in relief depressions with dense thickets of shrubs where increased snow accumulation is observed. The thickness of under-channel and under-lake taliks can vary from 3 to 30 m. In the bottoms of depressions, khasyreys, and lower parts of slopes overgrown with shrubs, the depth of taliks is 2–10 m. A characteristic feature of the cryogenic structure of Quaternary deposits is high ice content. High ice content is explained by lower temperatures and a desalinated composition of formation waters due to the existence of a zone of free water exchange in Quaternary rocks before freezing [33]. The active layer varies from 5 to 20 cm. The sandy soils have a stratigraphic structure. They are silty (fine-grained) and 1 to 1.5 m deep, with a layer of blue clay 20–25 cm thick beneath, and a layer of silty sand up to 2 m deep beneath that. Below, is a repeated layer of clay alternating with subsequent layers of sand. Along the road to the western entrance to the Gaz-Sale village, there is a group of disturbed thermokarst lakes (Figure 2a), most of which have degraded since 2000, losing up to 70% of their surface area. These lakes have been subjected to dredging for sand. Nearby, many other undisturbed lakes occur (Figure 2b).
2.2. Study Design, Site Selection, Methodology, and Measurement Tools
Siberian and other Russian scientists have been conducting satellite monitoring of the state of thermokarst lakes in Yamal [26,34,35,36,37,38,39]. However, the results of these studies are far from uniform, with some lakes disappearing or shrinking in surface area and some new ones forming. Bryksina [40], in her study, indicated that in Yamal, under the influence of global warming, lakes are shrinking by 61–68% and new thermokarst lakes are being formed by 20–25%. However, more recent studies suggest a balance [41] between lake loss and gain. In our smaller study area, older satellite imagery appears to show that there has been a progressive degradation of thermokarst lakes since 2012 related to climate change, although results in published papers are somewhat inconsistent. Fortunately, high-resolution space imaging has been actively carried out in recent years, and can now be used to assess the reliability and accuracy of previously performed estimates of changes in the areas of our local thermokarst lakes.
An analysis of the degradation dynamics of thermokarst lakes is of practical value for the population of the Tazovskiy District because the lake area affects infrastructure development, transport, biodiversity, and trace gas emissions. It is therefore important for local communities to understand what is happening in their isolated localities. The Gaz-Sale village is served by the Tazovskaya Secondary School with about 1300 students aged 6 to 17 years and 100 teachers. The school (among others) serves a population of about 18,500 that includes indigenous Nenets nomads, Russians, and nationals of the former Soviet States, some of whom are employed in the developing oil and gas industry. Activities for environmental education during the current period of global warming are regularly held with students of the Tazovskaya Secondary School. They include learning through practical activities that result in recording changes in their environment. This allows the local population to perceive events taking place that affect their lives. Our current study is the result of research by the scientific eco-team “Polar Owl” of the Tazovskaya Secondary School.
There are many examples of citizen science and community observations in the Arctic and elsewhere [42,43,44,45]. Some combine conventional science methods with indigenous knowledge [13]. In contrast, our current study investigates the wider processes of thermokarst lake dynamics, their causes, and impacts using conventional science by local school students, thereby empowering a new generation of indigenous and local people to determine for themselves the changes in their environment and their implications.
Measuring local landscape change and its causes, a “multistage analysis of cryogenic landscapes and cryogenic processes” school activity was carried out based on a remote, quantitative study of the dynamics of thermokarst lakes in Western Siberia.
This involved the following tasks:
- The selection of test sites for the study of thermokarst processes depending on the landscape and geocryological zoning of the territory of the Tazovskiy District of Western Siberia.
- The development of a methodology for assessing temporal changes in the areas of thermokarst lakes using remote sensing data and modern geographic information systems (GIS) and GIS technologies.
- Assessing likely causes of lake degradation, including climate and sandy soil mining.
- The formation of a database for the areas and dynamics of thermokarst lakes based on the results of satellite observations and quantitative analysis of the dynamics of the areas of thermokarst lakes.
- Observations on the impacts of changes in the lake area.
The lakes were chosen for easy access, being only 20 km from the school. Furthermore, the lake dynamics were known to be responding to climate change and the direct human impact of sand dredging, thereby including two different drivers of lake dynamics. Two sets of lakes were, therefore, chosen: 4 lakes subjected to dredging (Figure 2a), and 18 lakes without direct human impacts (9 “below the road” (UA1–9) and 9 “above the road” (UB1–9)) (Figure 2b) (the terminology is for practical convenience only as there is no environmental difference between the two sides of the road).
A remote sensing methodology was used. The areas of lakes were calculated from satellite images taken in the July of each year in the period 2014–2019, accessed through the SAS-Planet program (https://sasplanet.ru/, accessed on 20 July 2019). Although modern programs automatically calculate lake surfaces, as a school/citizen science research activity, we calculated the average diameters of lakes, and then their areas. This can be performed in various ways. We used one simple, standardized, method, and any potential errors from using different students were avoided as the same teachers contributed throughout the 5 years of the study reported (and 15 years of the process).
We assessed the likely causes of lake change, looking at the following characteristics: climate change, active layer dynamics, and sand dredging.
2.2.1. Climate Change
The Gaz-Sale village and nearby (20 km) Tazovsky communities are served by a weather station at Tazovsky (latitude 67.47° longitude 78.73° 28 m above sea level) that has been operational since 1988. We extracted the weather data from the Global Basic Observing Network (http://meteo.ru, accessed on 10 February 2023), which collects long-term data from representative stations. We also checked extracted data with data from the World Data Centre. (https://meteoinfo.ru, accessed on 10 February 2023). Temperature (mean annual, daily, minimum, maximum), precipitation (daily totals), and snow depth are measured according to guiding documents [46] and we have extracted relevant information for this study. We used software scripts to collect data from this source and process them. Relationships between climate variables and lake area were quantified using Pearson’s correlation coefficient and coefficients were compared to identify which climate variable most explained lake area changes.
2.2.2. Active Layer Dynamics
For the last 3 years of lake observations, we measured the active layer thickness. This was determined using a metal probe, as suggested by the CALM network (https://www2.gwu.edu/~calm/, accessed on 12 August 2019). We measured the active layer thickness at key points. A total of 40 sampling points were used, 20 around each area of the lakes above and below the road. Every year, the measurements were undertaken at the beginning of September. Sample points were located at a distance of 500 m to 1 km from each other. Rods were pushed through the soil (active layer) until hard resistance was encountered. This denoted the surface of permafrost. The distance from a known point at the handle of the rod and the position of the surface of the ground (soil rather than vegetation) was measured and then subtracted from the total length of the rod to give the thickness of the active layer. (The rods can be marked with a centimeter scale from point to handle for easier reading of the active layer depth.)
2.2.3. Sand Dredging
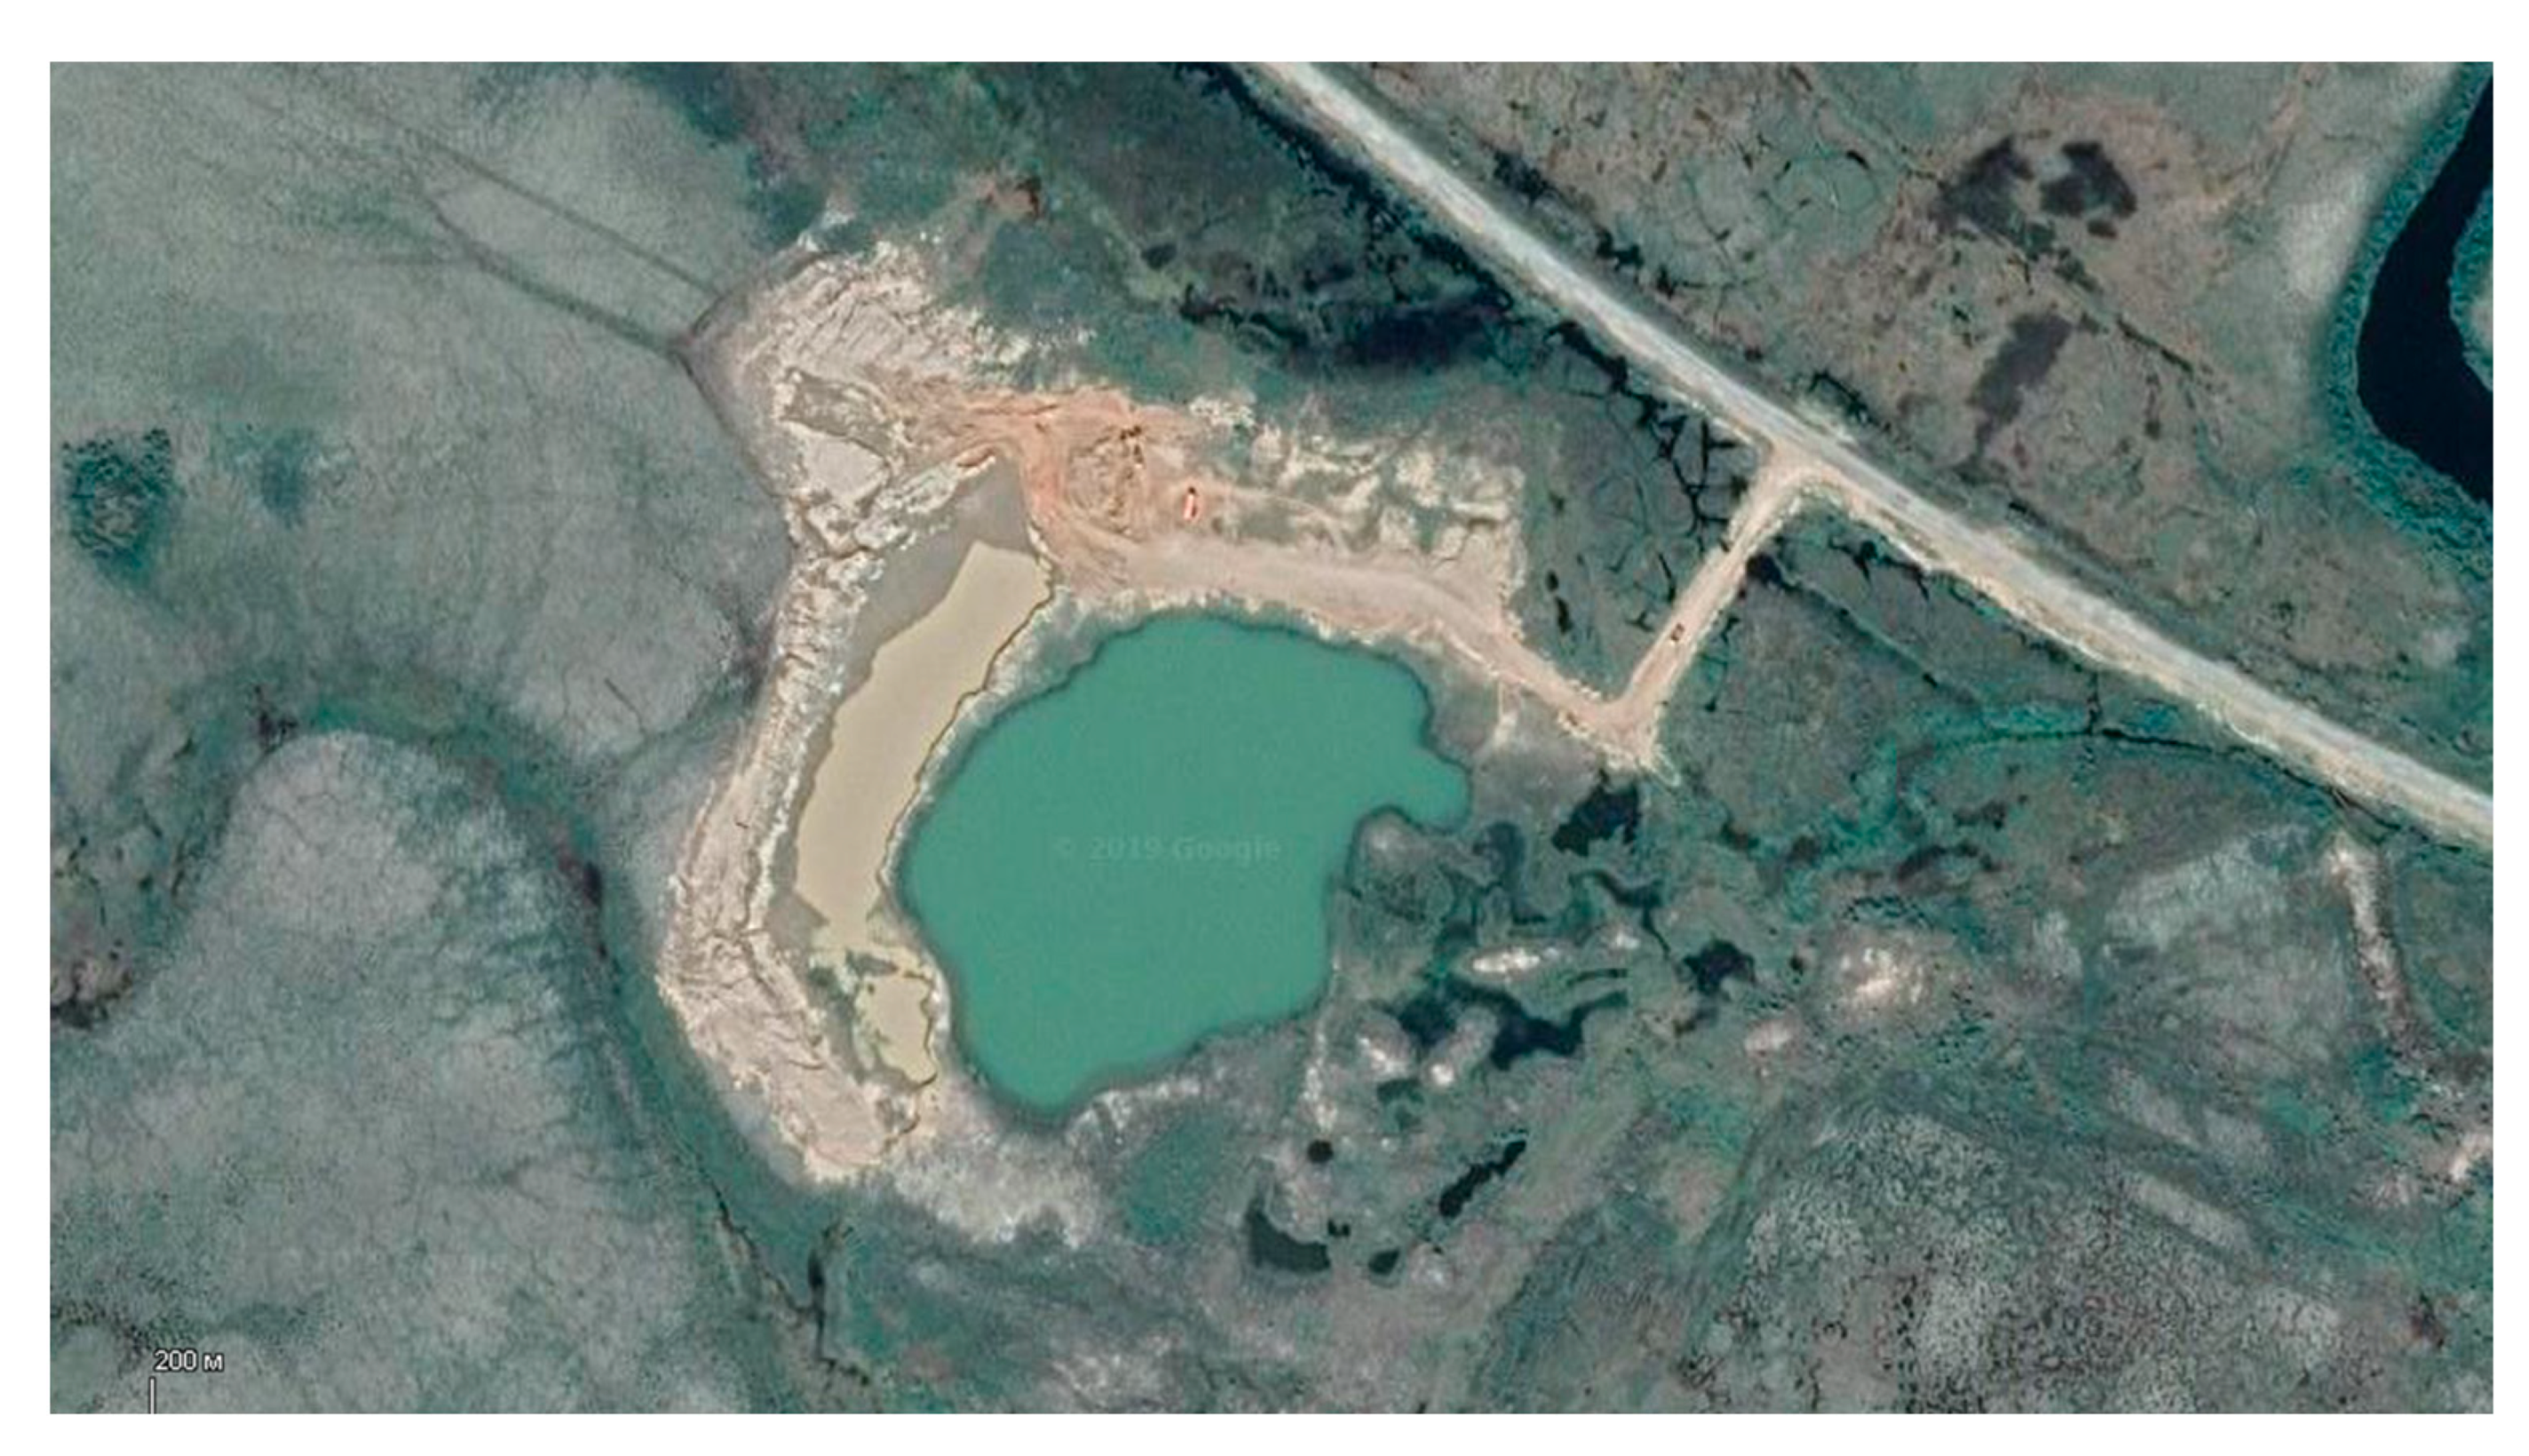
Sand dredging (Figure 3) is performed by specialized equipment that extracts sand from the base of the lake and piles it onto the banks. This deepens the lakes and creates local disturbance as the sand is transported by road to create platforms in the construction industry. These platforms are for oil and gas installations, road maintenance, and construction.
2.2.4. Statistical Analysis and Presentation
IBM SPSS Statistics 26 was used in the calculations for the t-test and Microsoft Office Excel (2019) was used for the remaining analyses. Levene’s test for equality of variances [47] was used to calculate p-values. Graphs were drawn using Excel.
3. Results
3.1. School Science
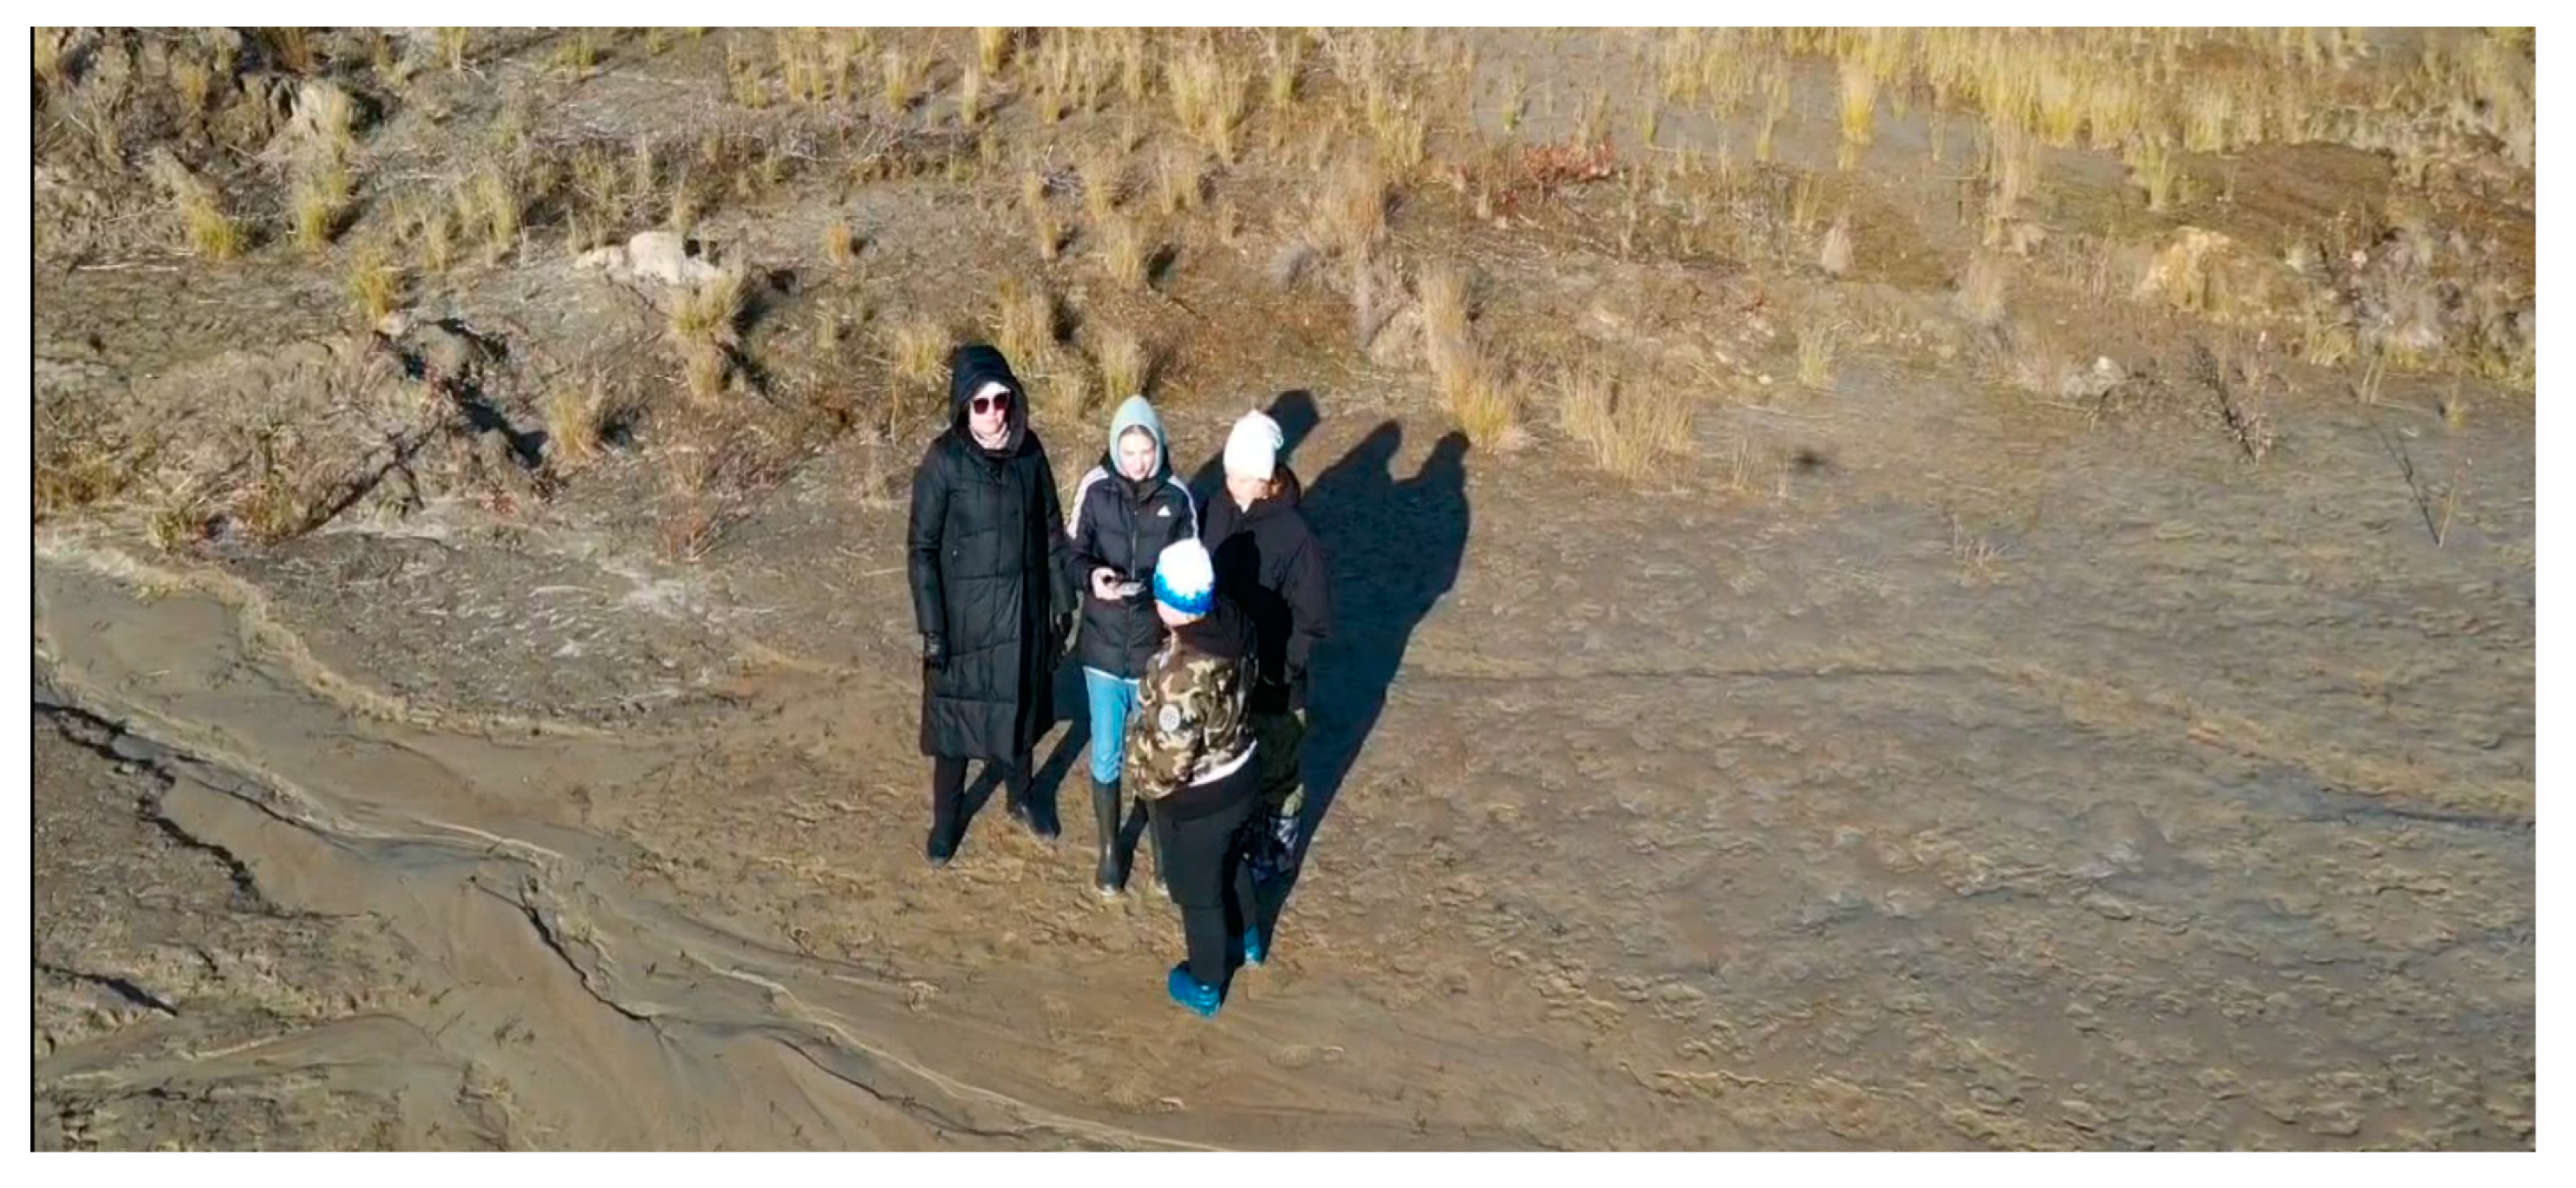
Over the past 8 years, about 200 science students from the Tazovskaya Secondary School have carried out annual monitoring of permafrost thawing and thermokarst lake dynamics in the study area under the supervision of three science teachers, and advice was sought from experts. Students from 11 to 17 years old carried out the following activities: site selection, measurement of lake area from satellite images, drone photography (Figure 4), the study of local industry and ecology, simple statistical tests, laboratory experiments (not included here), and the analysis and presentation of data.
One team of 60 students, the scientific eco-team (“Polar Owl” of 11 to 17 years old students of the Tazovskaya Secondary School) has been engaged in the ecological project “Save the Blue Lake” that focuses on the fate of a unique thermokarst lake in the area, which arose as a result of quarrying of sand in 2011. This project and team became the winner of the all-Russian environmental competition “Protect the Earth!” in November 2020. The results of this team presented below highlight the importance of supporting school local science projects.
3.2. Thermokarst Lake Dynamics, Their Causes and Impacts
In the study area, there are completely degraded (almost dry) lakes, lakes that continue to degrade with a reducing surface area and depth, and lakes that have undergone urbanization with an increased area and depth.
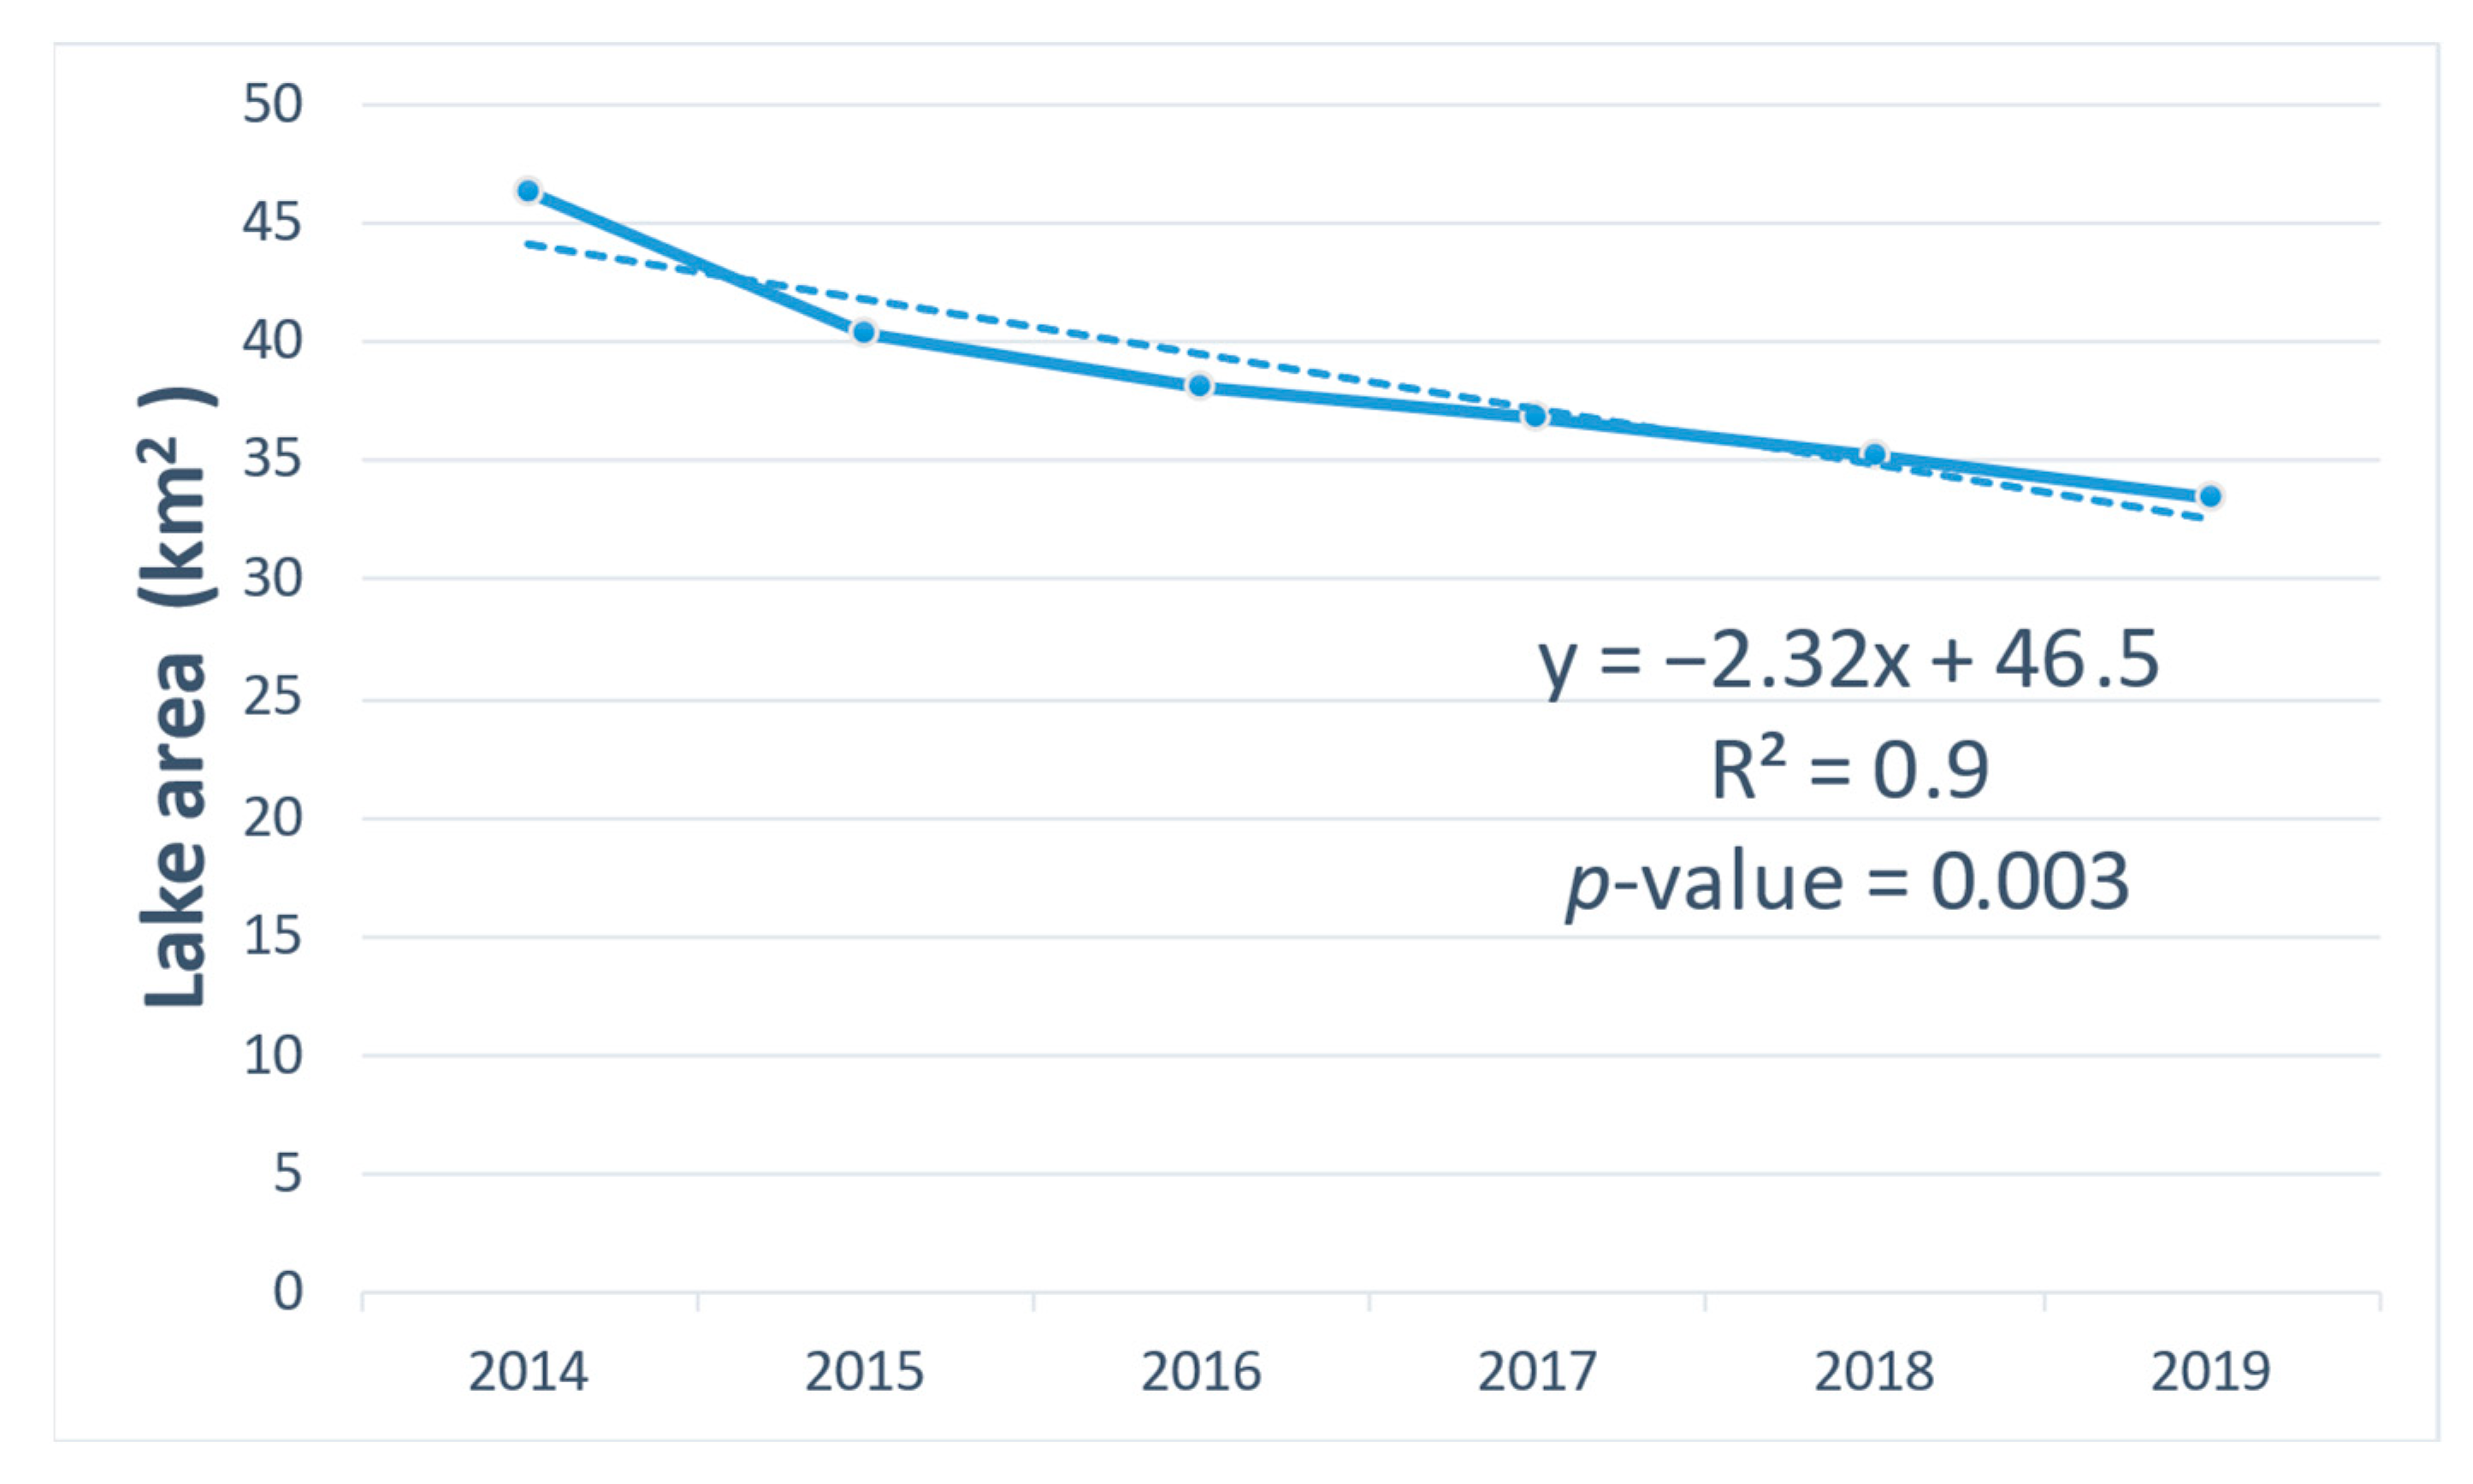
Between 2014 and 2019, the mean area of dredged lakes had significantly decreased by 22% following an almost linear trend (Figure 5 and Figure 6).
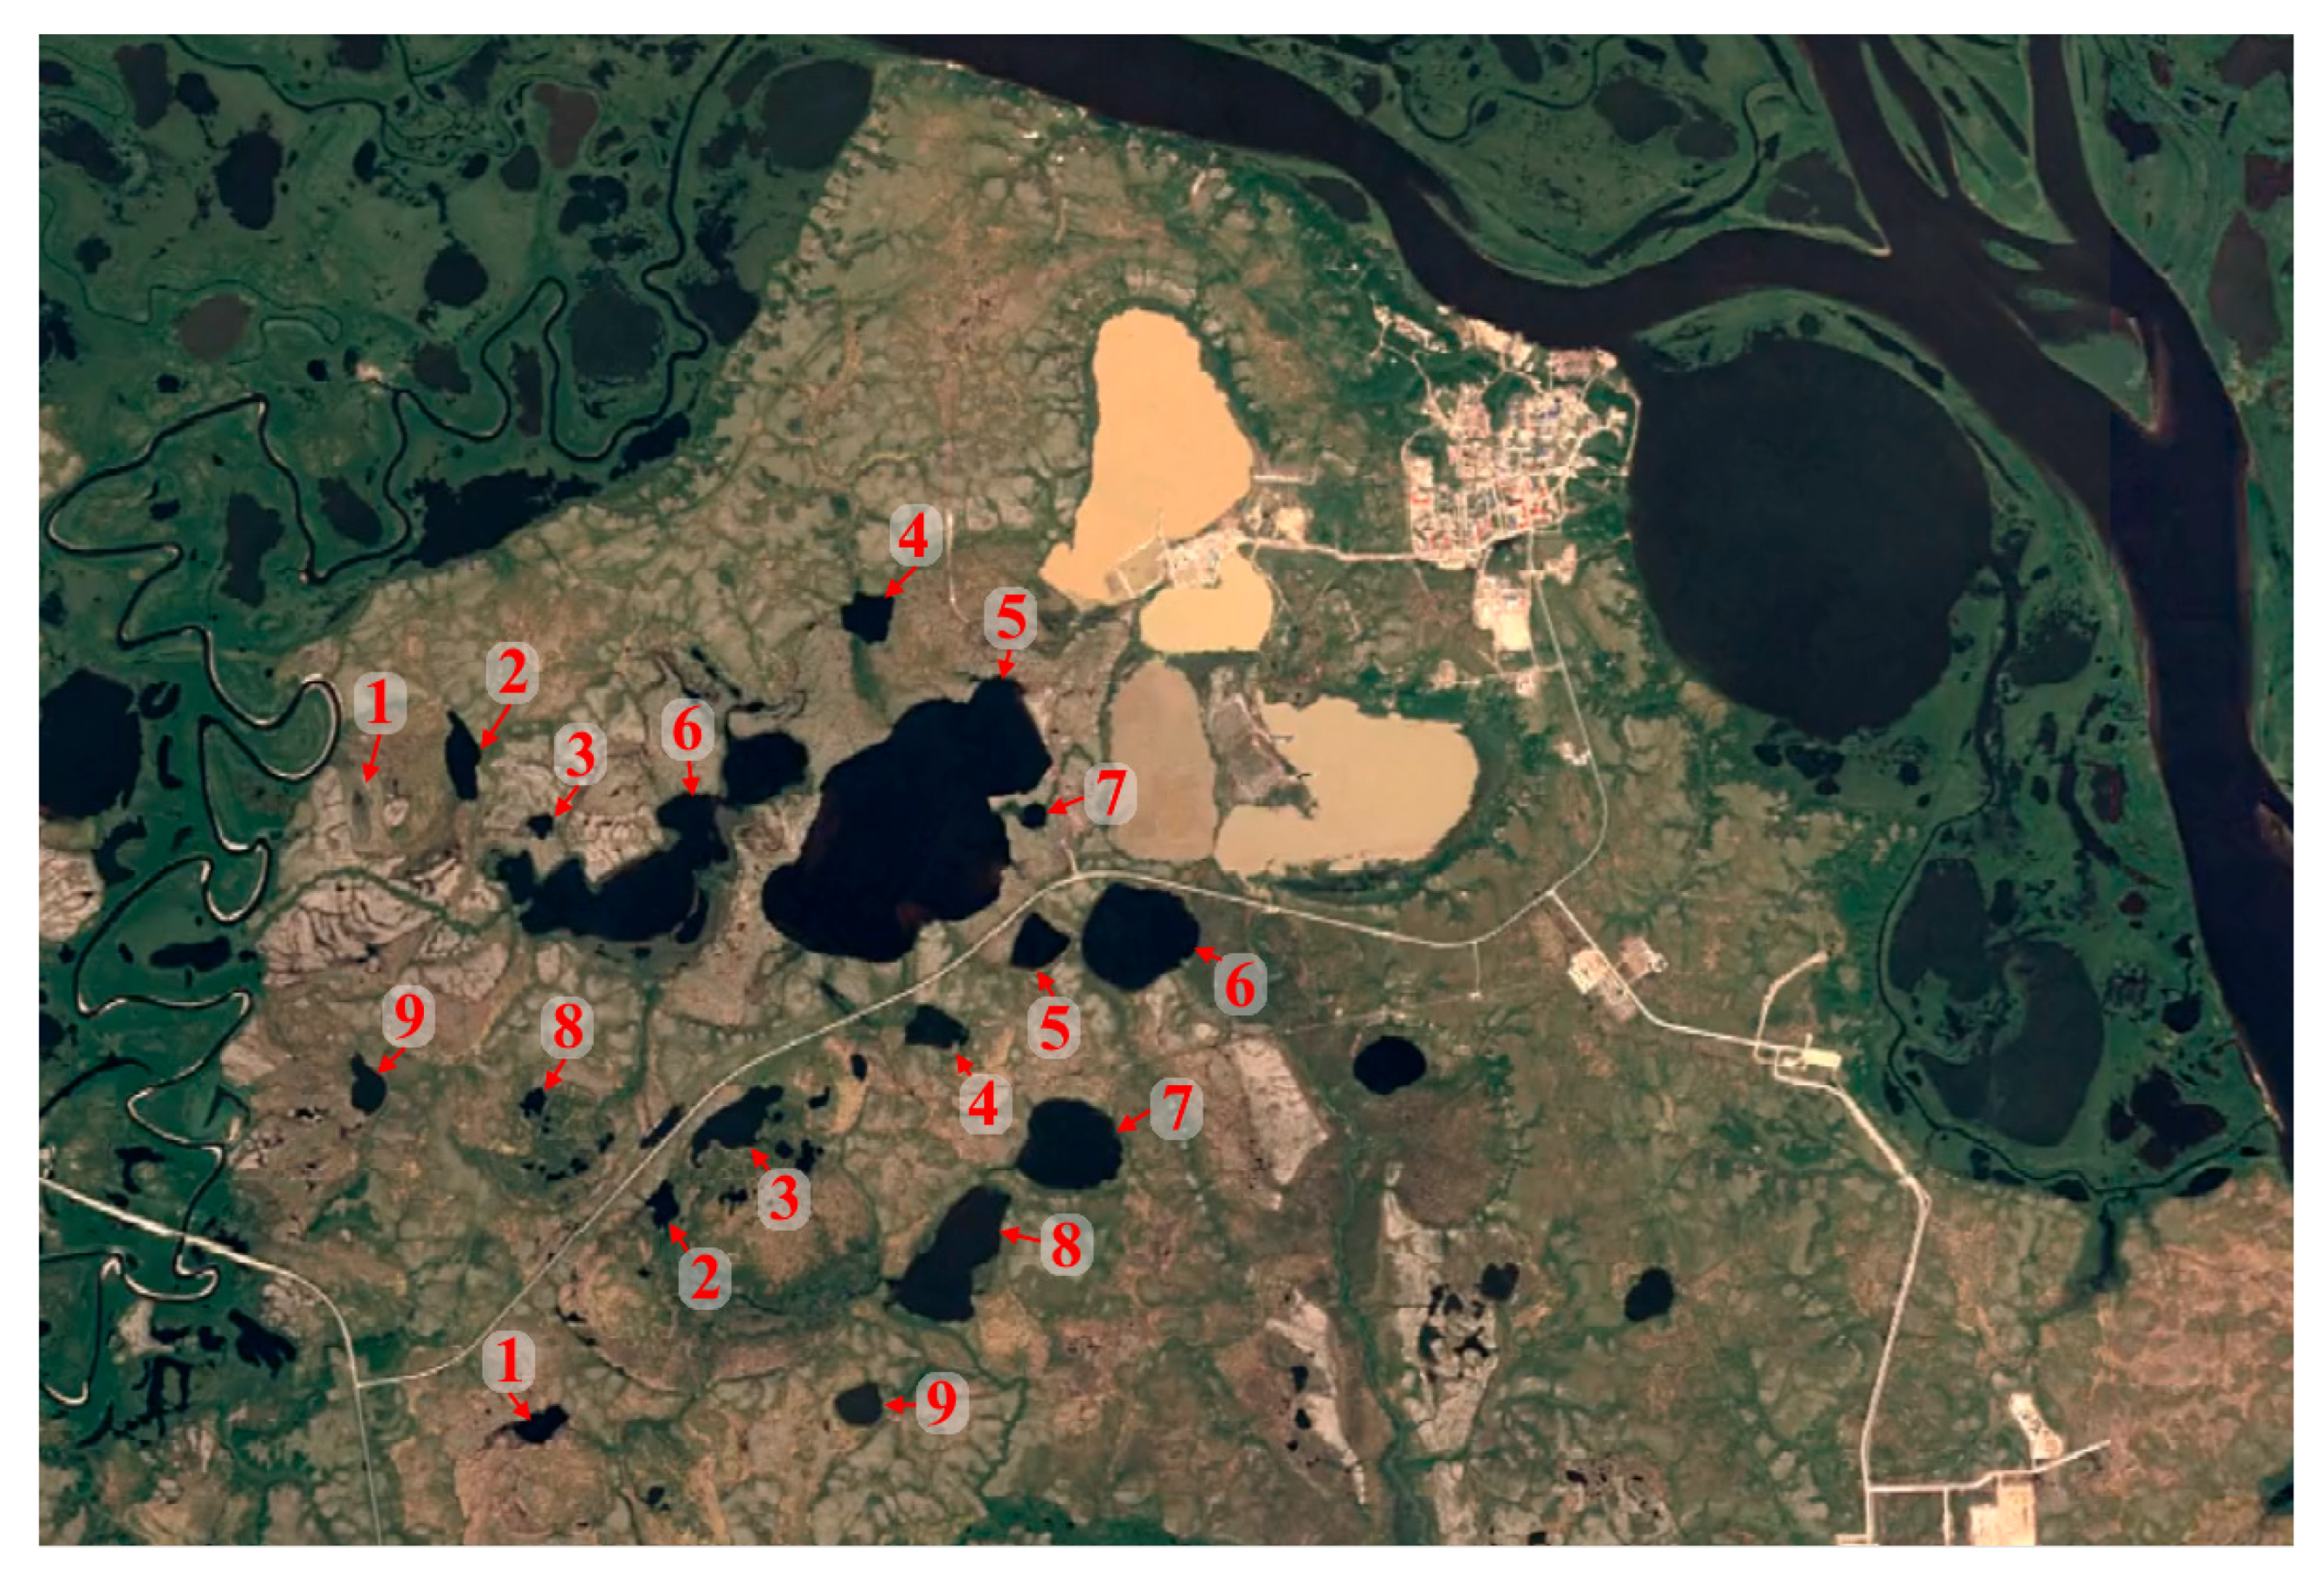
The areas of all lakes above the road decreased between 2014 and 2019 (Table 1). One lake, UA1, disappeared completely, and the overall decrease was greater for these undisturbed lakes than the decrease in the areas of the lakes that were dredged.
The areas of the lakes below the road (Table 2) are, on average, smaller than those above the road (Table 1). Similar to the areas of lakes below the road, all have seen a reduction in area, but the percentage loss is less than half that of the lakes above the road and the lakes that have been dredged. Levene’s test for equality of variances [47] showed that the overall changes in lake areas are statistically significant (p-value = 0.02).
3.2.1. Potential Causes of Lake Dynamics
- I.
- Climate
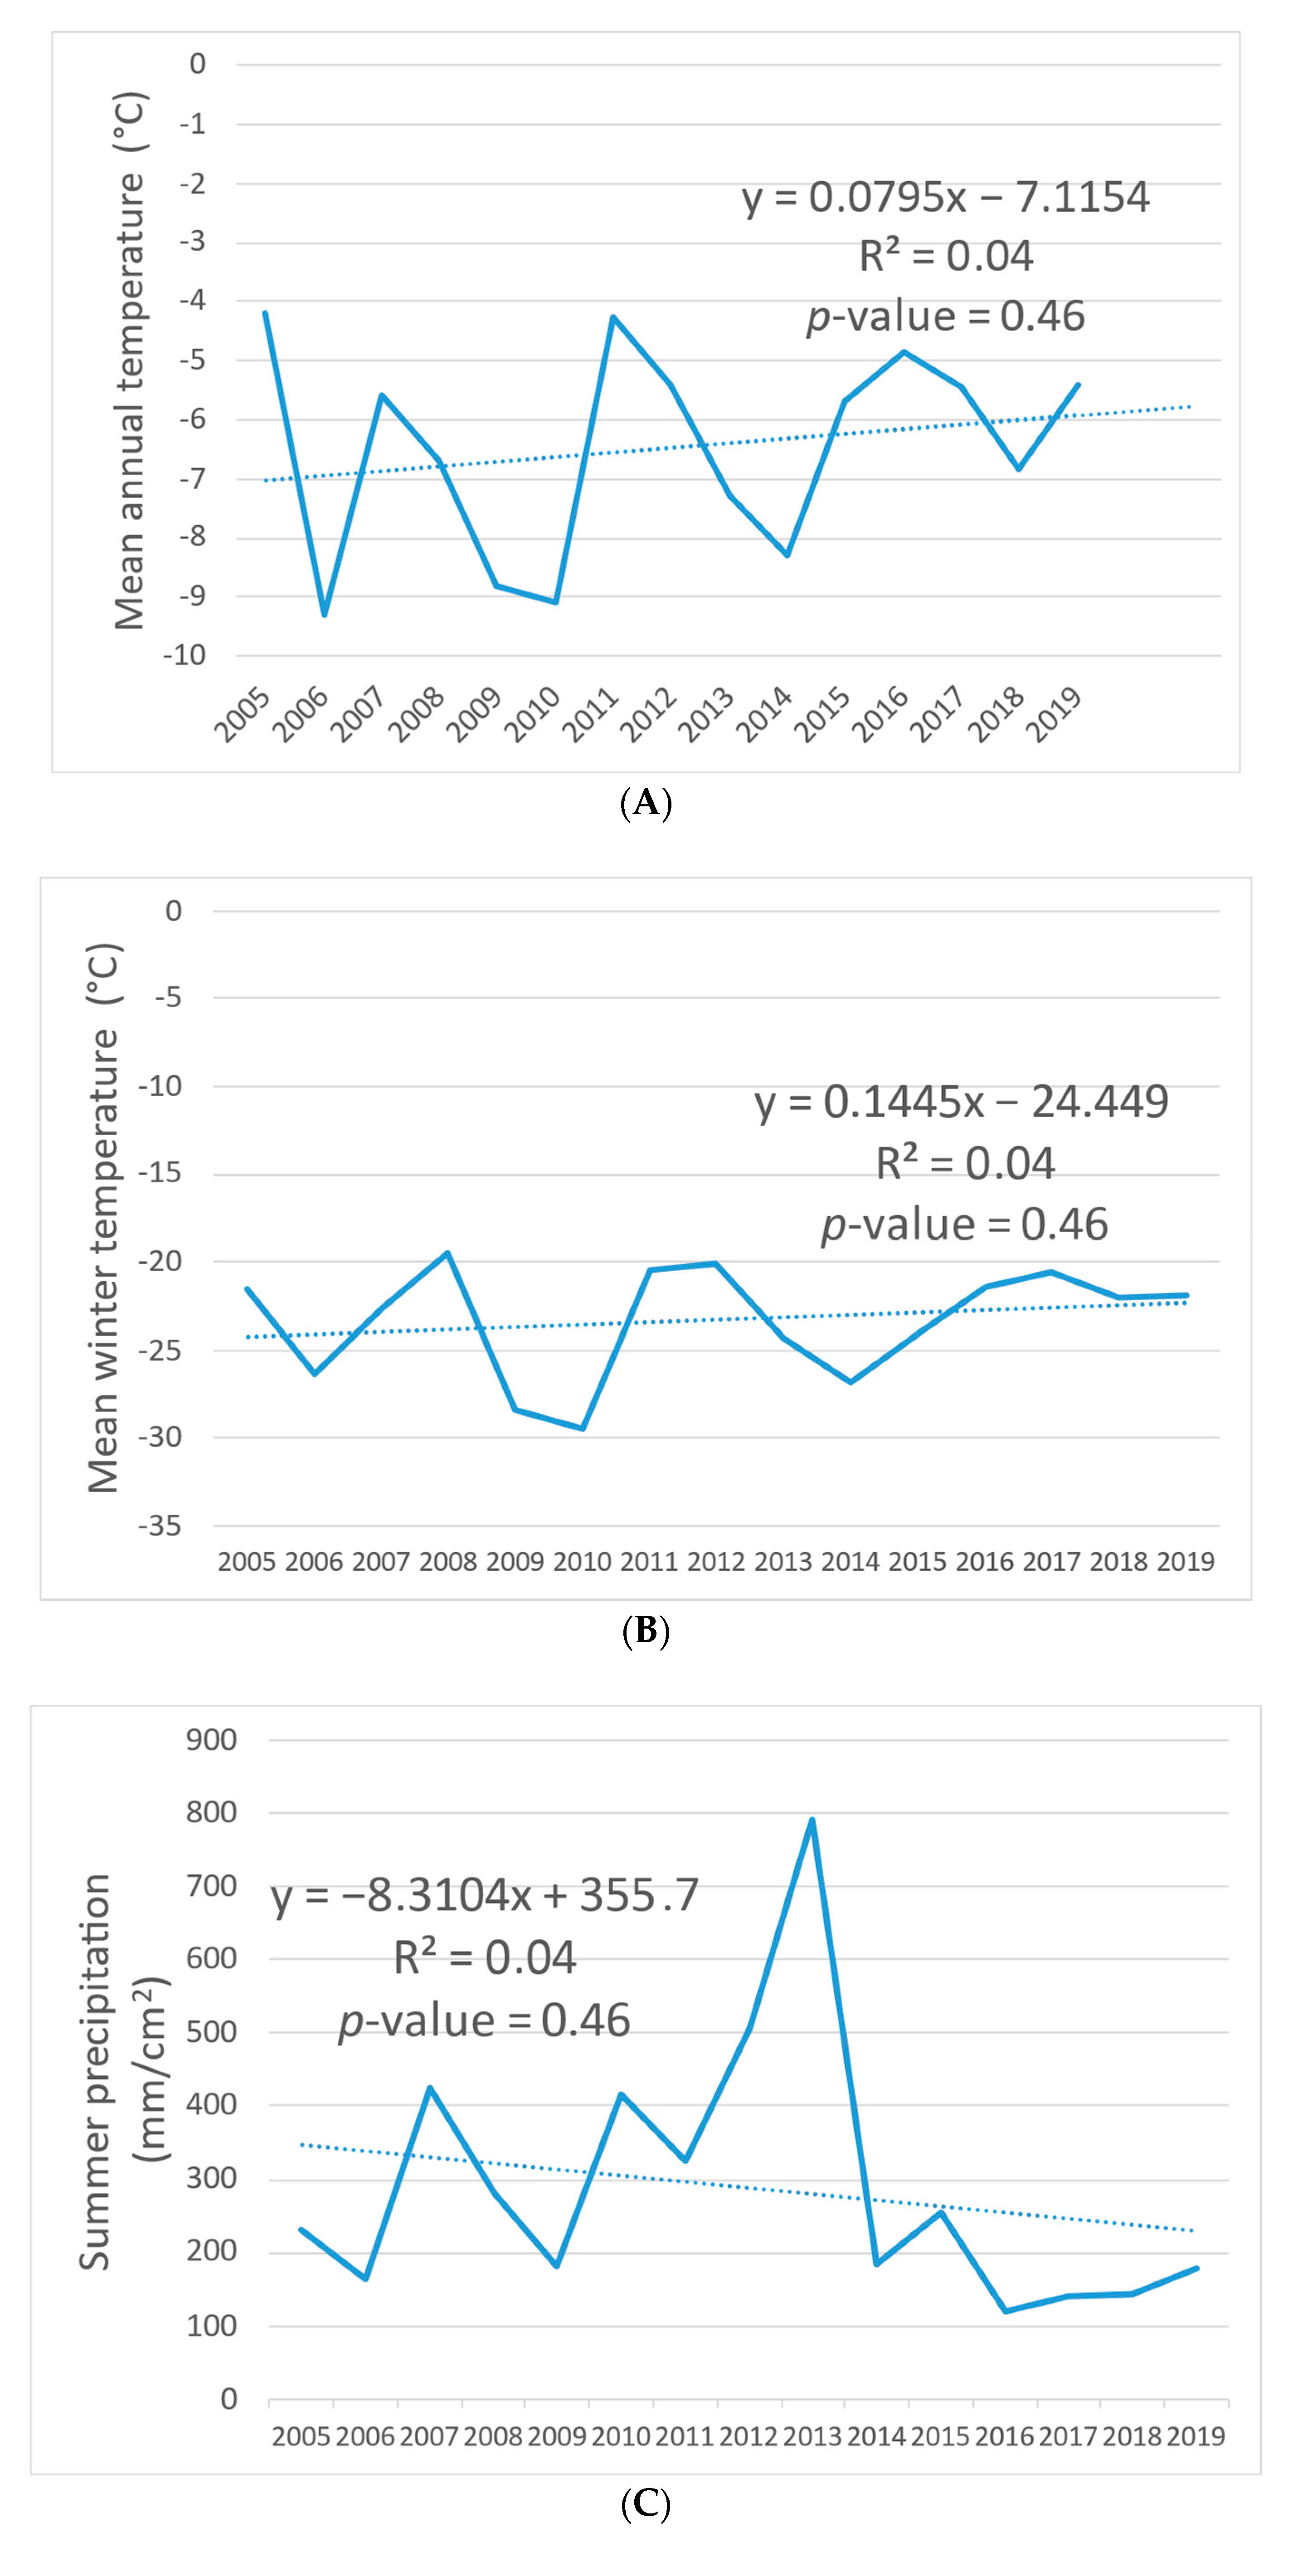
Over the period 2005 to 20019, the mean annual temperature varied by 5 °C, and although the period of observations was short, there was a significant increase in temperature estimated at 2 °C (Figure 7A). Mean annual temperatures were associated with a significant increase in estimated winter temperatures of over 2 °C (October to April inclusive) (Figure 7B).
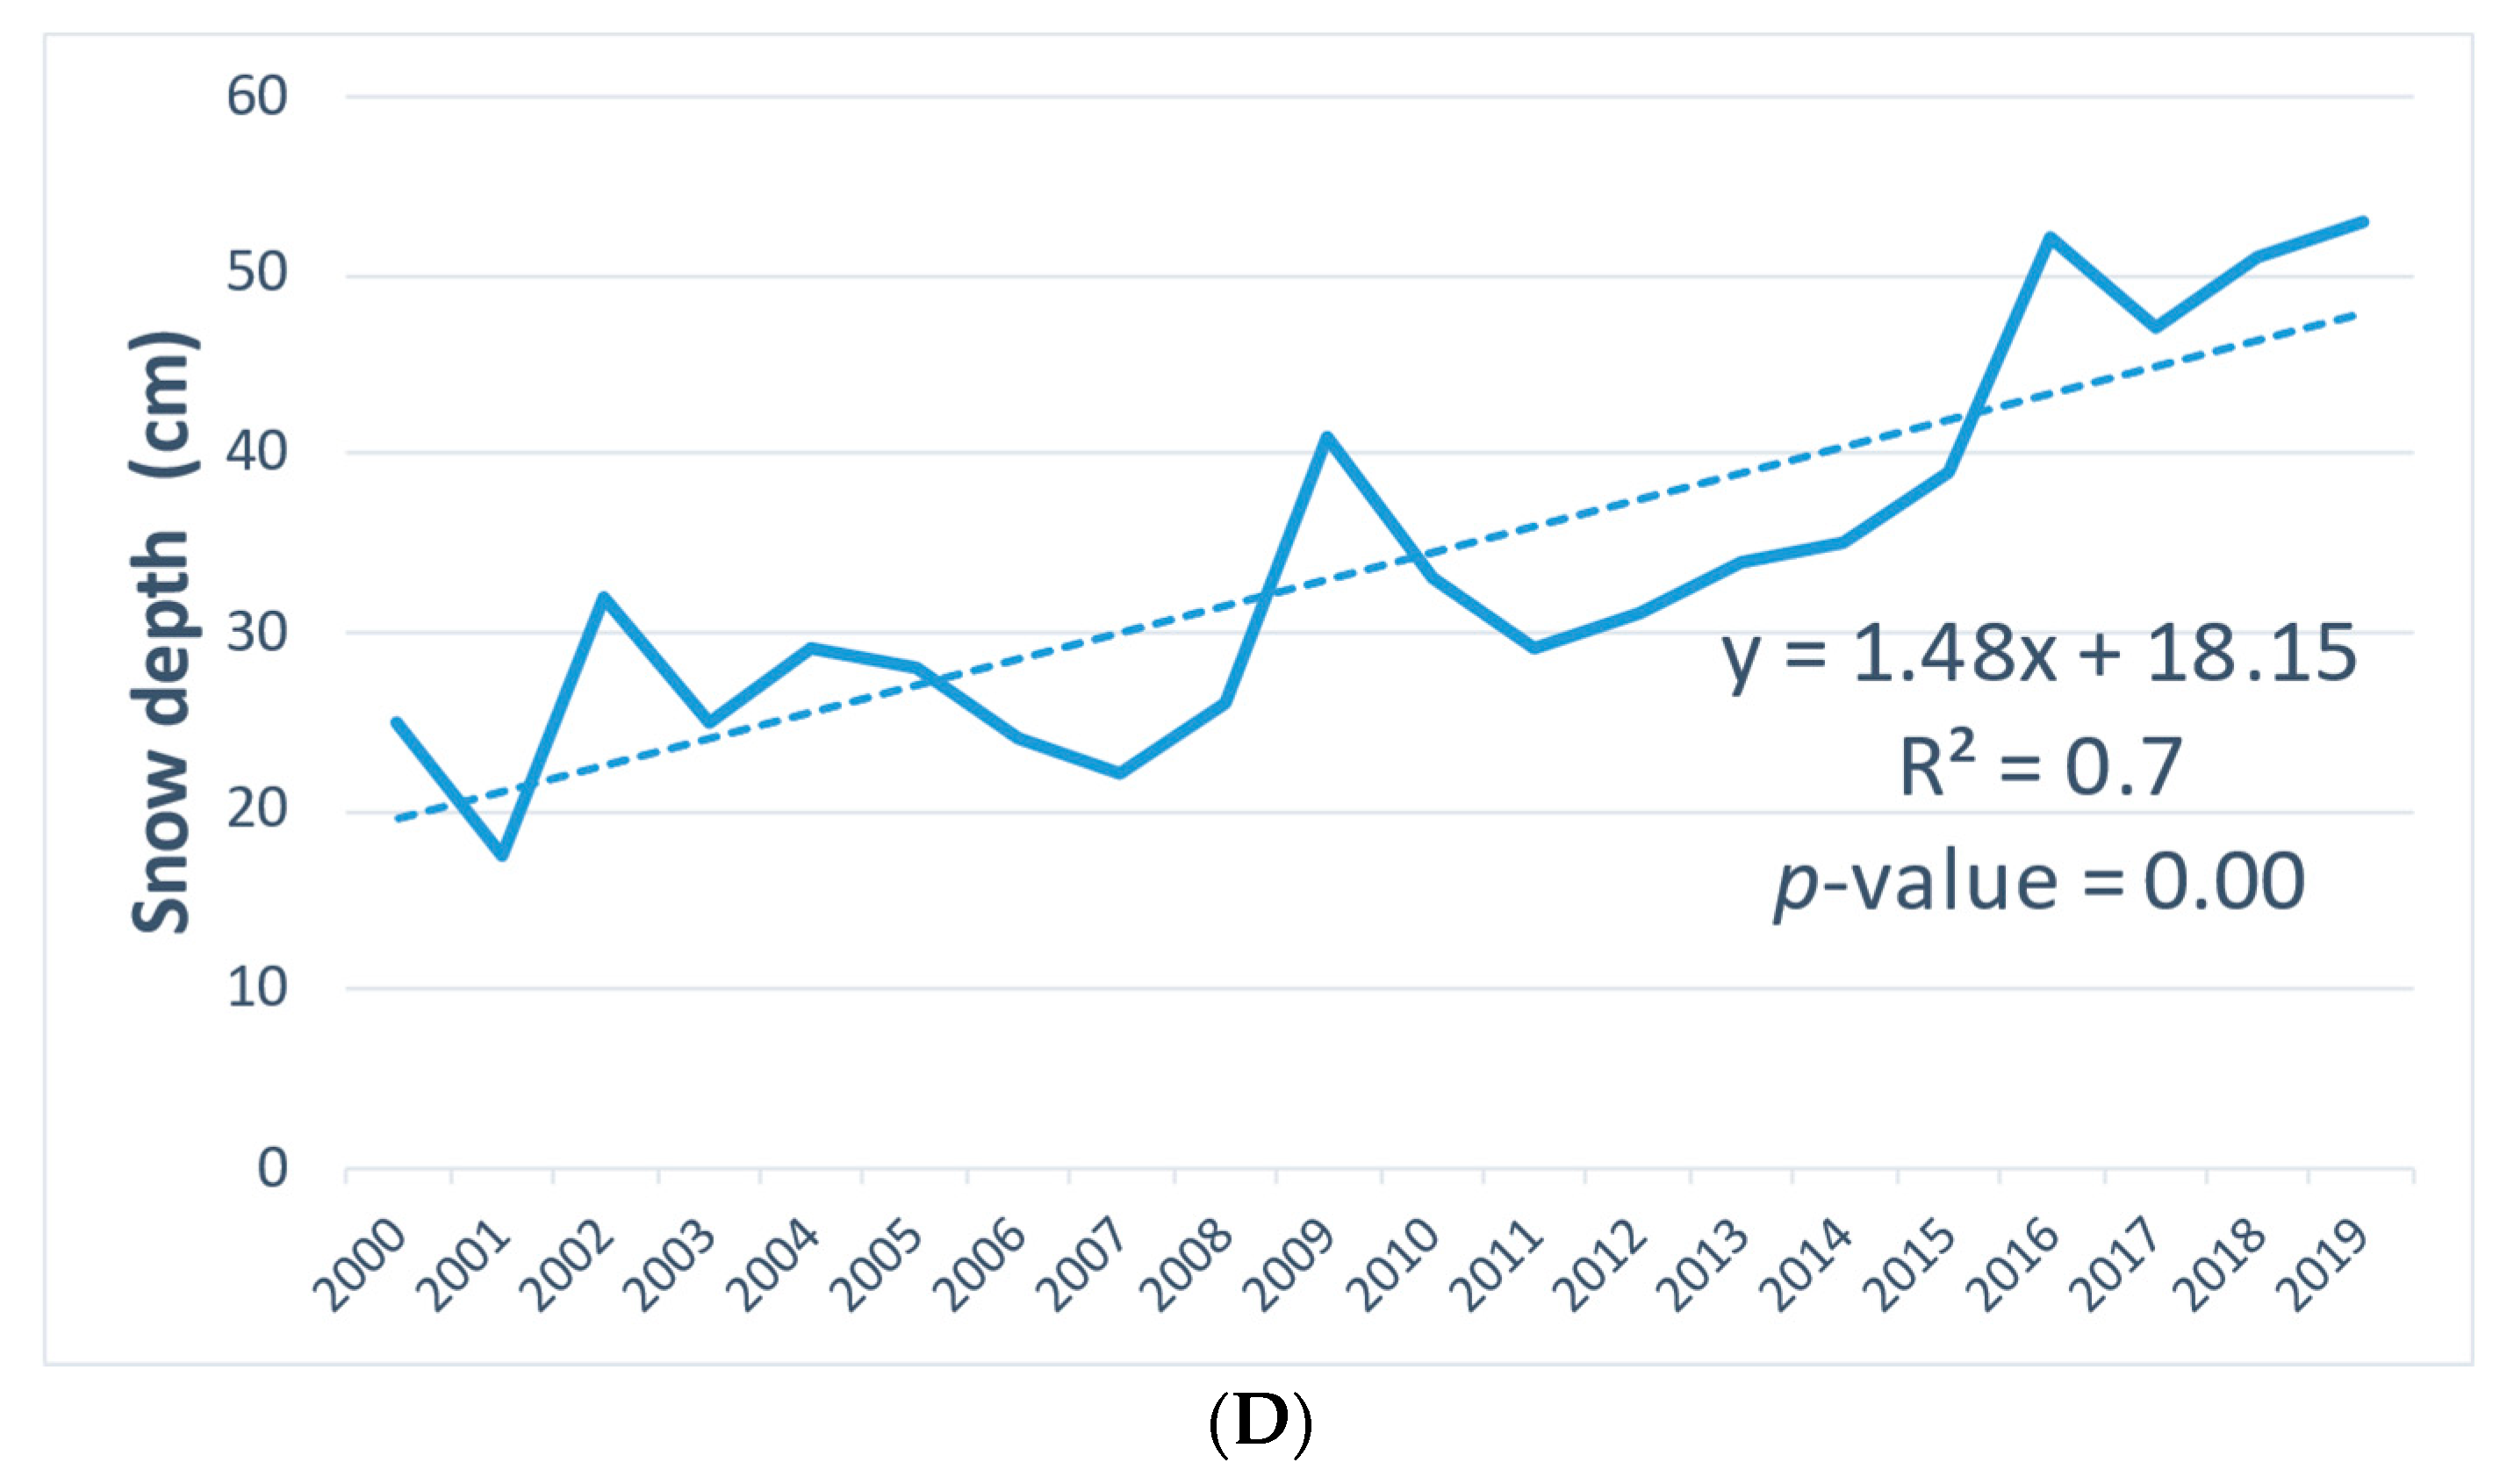
In contrast to mean annual and winter temperatures, summer precipitation (June, July, and August) decreased between 2005 and 2019, although it was very variable with a significant peak in 2013 (Figure 7C). The overall estimated decrease was about 120 mm. Over the slightly longer period of 2000 to 2019, snow depth (mean, November to March: data by Ob-Irtysh Department for Hydrometeorology and Environmental Monitoring) [48] showed a highly statistically significant change, with a more than doubling of the estimated snow depth from 20 cm in 2000 to 48 cm in 2019 (Figure 7D).
- II.
- Active Layer Dynamics
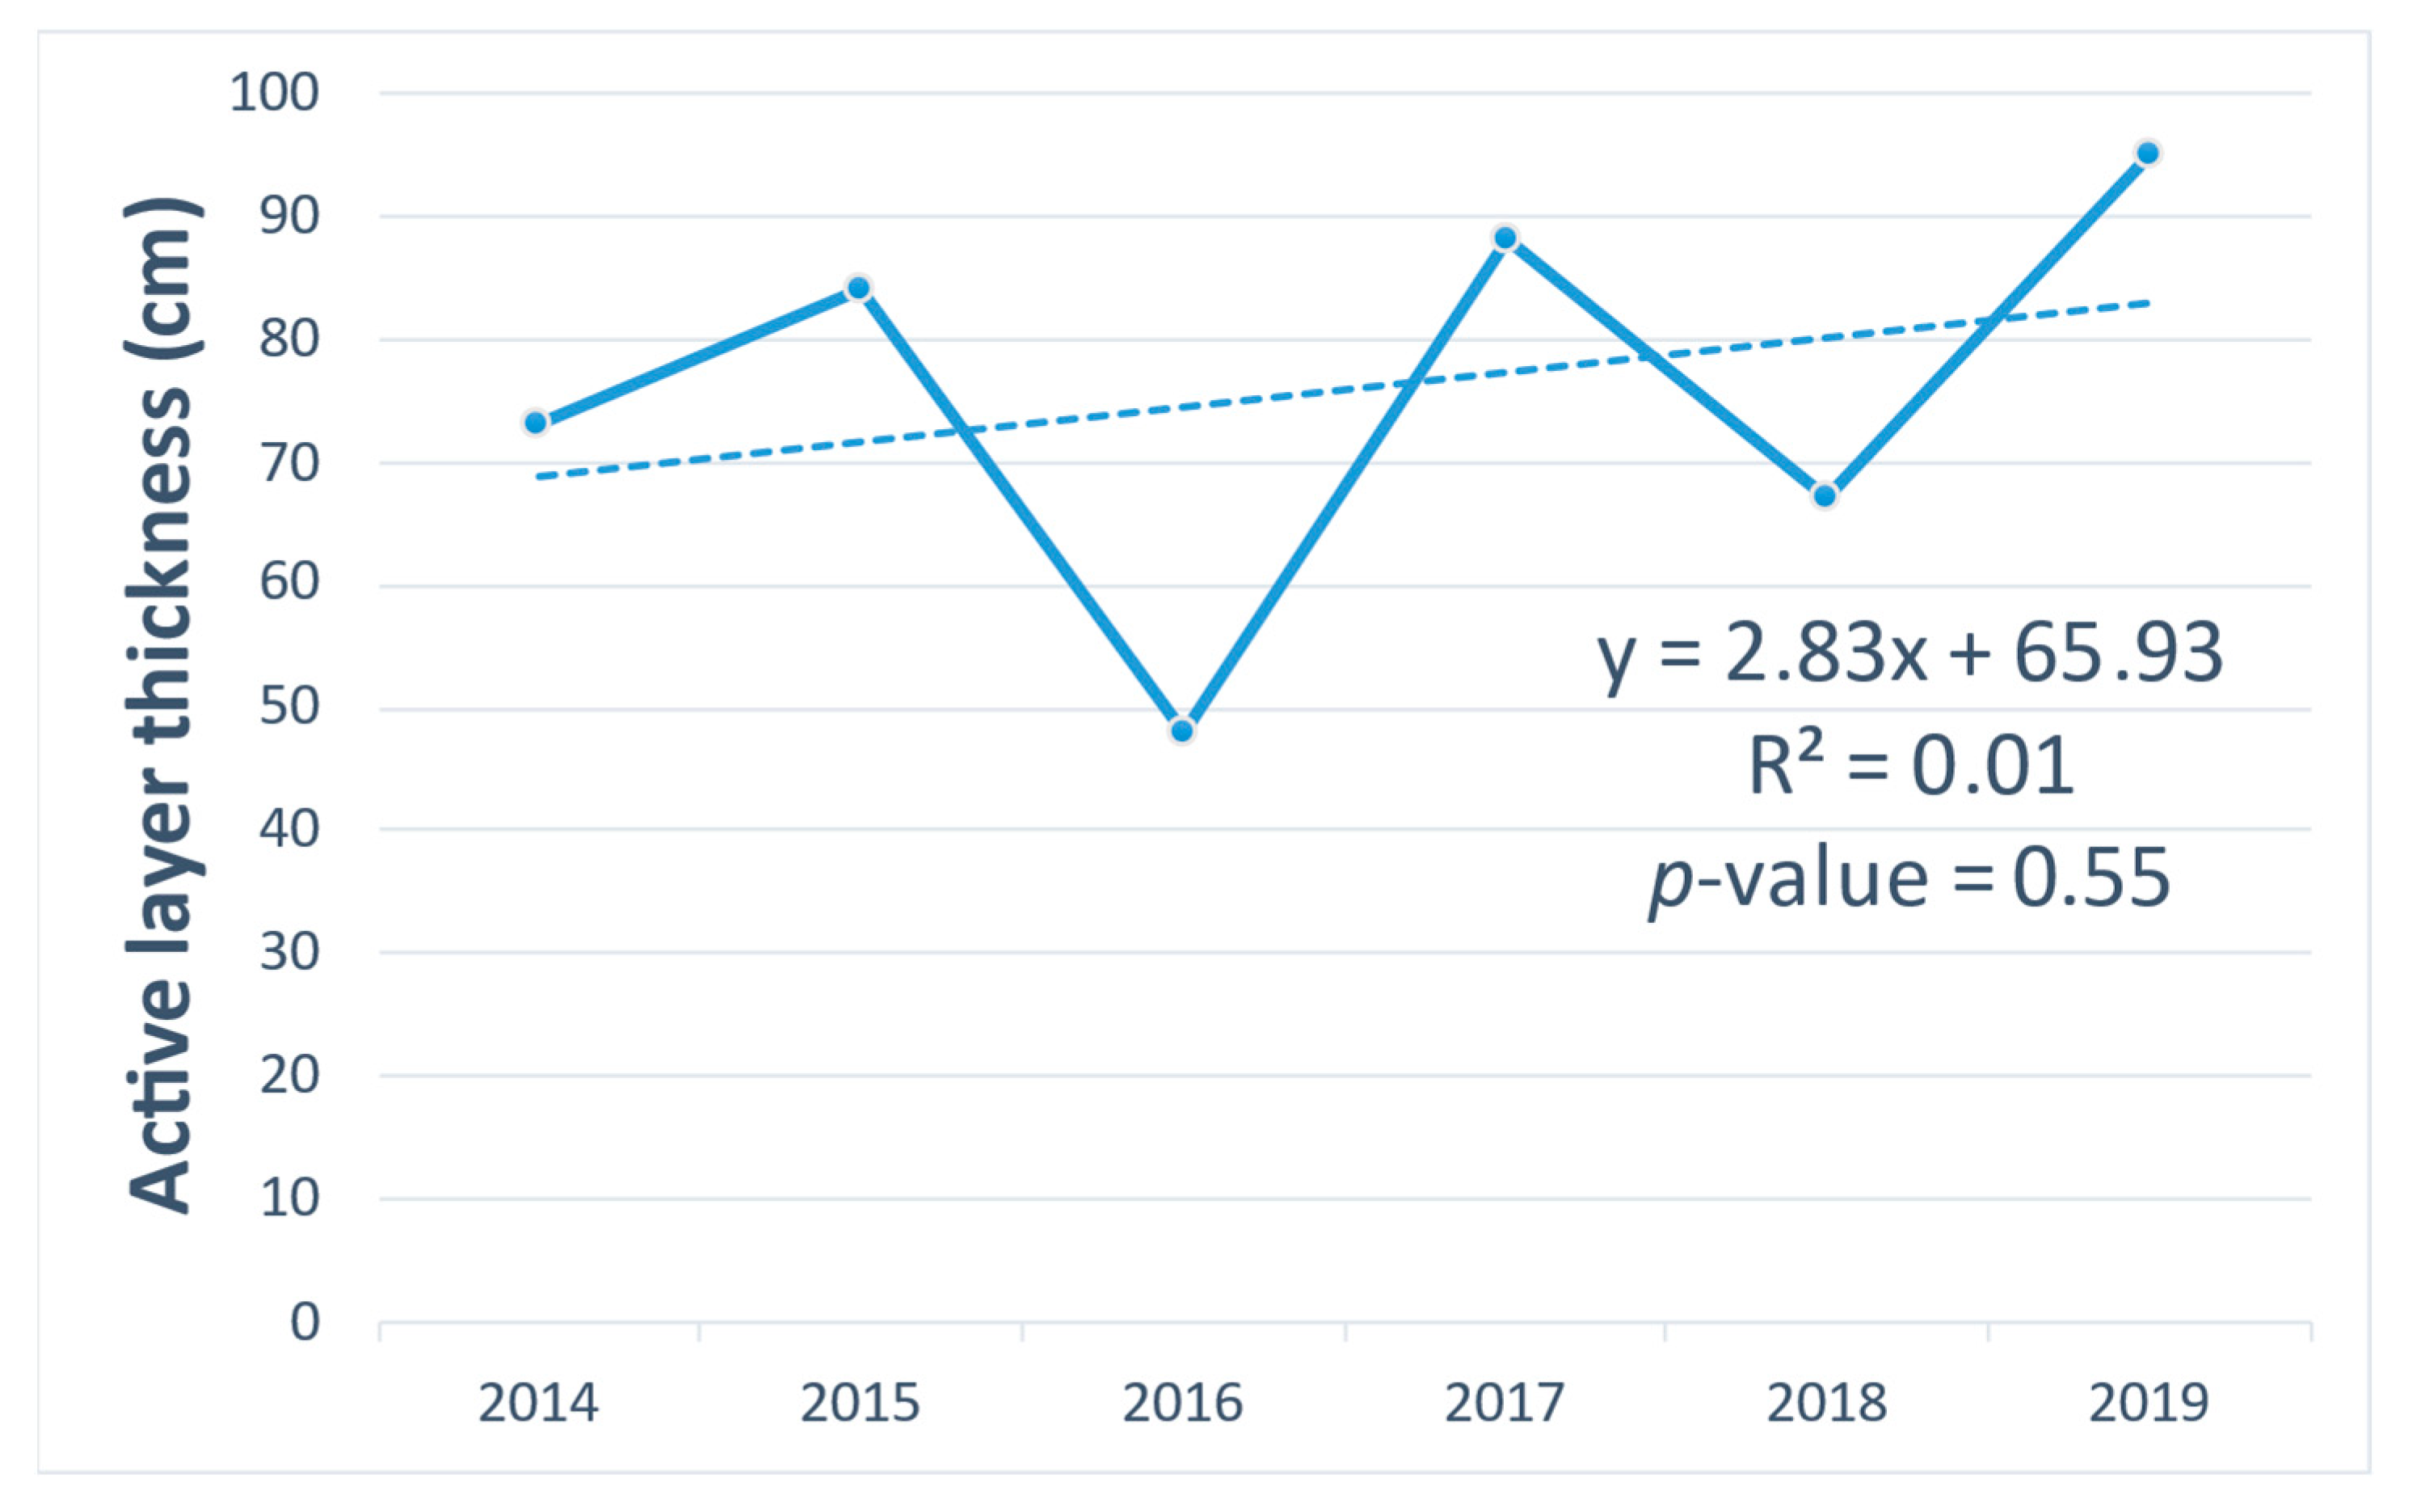
Active layer thickness has been very variable over the period from 2014 to 2019 with a slight but statistically insignificant increase in an overall interpolated 12 cm (Figure 8).
- III.
- Local Anthropological Activities
Various local industries include oil refining, gas extraction, and sand dredging. The sand dredging is to export sand to make better platforms for the oil and gas extraction plants and roads. Dredging activities can change some of the thermokarst lakes by increasing their depths and volumes in contrast to the effects of climate change which are decreasing lake area and, therefore, volume. The hydraulic sand dredging method for removing bottom soil in thermokarst lakes is a particular activity that deepens these lakes (Figure 3).
The air temperature around industrial activities is higher than elsewhere [49]. As a result, permafrost thaws, lakes evaporate, water flow into other areas and the earth subsides. Soon, vegetation grows on the dried lake beds.
- IV.
- Ranking the Importance of Factors Potentially Causing Changes in Active Layer Thickness and Lake Area
Direct human activities such as sand dredging undoubtedly have the largest and fastest impact on the dynamics of a particular lake. However, in general, climatic factors are also likely to have widespread impacts. Probably because of the short-term data sets, there are no statistically significant correlations among climate variables (Table 3A). Similarly, during the short period of observations of active layer thickness, there were no significant correlates with climate (Table 3B). In contrast, and despite the short duration of the records, the lake area is very significantly correlated with snow depth and mean winter temperature (Table 3C).
3.2.2. Impacts of Reduced Lake Areas
The bottom of former thermokarst lakes (Figure 5 above) are fertile grounds for the growth of new types of vegetation for the area, including trees (Figure 9). This can be regarded as a “greening” of the area [50,51].
Plants growing in drained thermokarst lake beds include cuckoo flax (Polytrichum), sedge (Carex sp.), wild rosemary (Lédum palústre), swamp bush (Andromeda sp.), willow bush (Salix sp.), and peat moss (Sphagnum sp.). These species can live in acidic, waterlogged soils.
In contrast to the effects of climatically-driven degrading thermokarst lakes on vegetation colonization and the loss of habitat for aquatic species such as fish, sand dredging deepens the bottom of these lakes, thereby allowing increased spawning grounds for fish reproduction and better conditions for the over-wintering of fish.
4. Discussion
“Thermokarst lakes, their shape, size, and dynamics of their coastlines can be an indicator of modern exogenous processes, and hence changes in the geological and ecological environment. The dynamics of these water bodies also have a pronounced socially significant effect, both direct and indirect” (translated from [49]). Based on five years of study and a sample of 23 lakes, a school science project has shown, with confidence, that all of the sampled lakes are getting smaller in the Tazovsky District, while one disappeared completely. This study highlights both the importance of local observers and local conditions, and our understanding now moves beyond the conflicting studies by experts based over wider areas [40,41].
At the start of the study, it was assumed that lakes used for dredging sand would show a loss of area greater than undisturbed lakes. However, the rate of loss was 22% per year, whereas the rates of loss for the undisturbed lakes above and below the road were 33% and 12%, respectively. Consequently, this type of direct intervention was not a dominant cause of the loss of the lake area. In contrast, climate—both directly and indirectly—affected lake loss significantly.
Annual mean temperature and winter temperature show increasing but nonsignificant trends. Summer precipitation, in contrast, shows a decreasing trend, whereas snow depth has increased very significantly in the Tazovsky area. The temperature increase is a global phenomenon [52] and the Arctic amplification of global warming is well documented with an Arctic-wide factor of 4 times [53] (http://climate.amap.no/, accessed on 14 October 2022). Locally, in Arctic Siberia, however, warming has been even more pronounced with temperatures reaching above 38 °C [54].
Such temperatures are bound to increase surface evaporation from waterbodies, particularly when associated with decreasing summer precipitation. In contrast, increased winter snow depth (see [55] which also reports increased snow depth) is expected to recharge lakes. The balance between drying and recharging is displaced toward drying in our sample of lakes which show decreasing areas. Increased temperatures, decreased summer precipitation, and increased snow depth [56] accelerate permafrost thaw. In our study, permafrost thaw, observed over five years through active layer thickness measurements, varied greatly from year to year with no significant overall trend. We must assume somewhat surprisingly, therefore, that permafrost thaw was not a major determinant of lake area loss over the five years of our study. This is surprising given that permafrost thaw in other areas such as northern Sweden is rapid with complete loss of sporadic permafrost in some areas [57].
For ongoing lake area loss, it could be postulated that the size of a lake could influence its rate of loss, with small lakes disappearing faster than large lakes. However, this was not the case, and the initial lake surface area had no significant relationship with the subsequent rate of loss. Thus, a combination of climatic factors will determine the further dynamics of the behavior of thermokarst lakes in the north of Western Siberia.
Although the reduction in areas of lakes that are being dredged was not significantly different from that of the undisturbed lakes, it can be assumed that lake depth increased, even if this was not measured.
There are several sociological impacts of changes in lake area and depth.
Lake depth in the Arctic is critically important for fish survival. Even though the fish diet is decreasing in the Yamal and Nenets Autonomous Okrug [58], fish are an important part of biodiversity and remain an important part of local diets, maintaining nutrition and health. Lakes deep enough to ensure the winter survival of fish are critically important for local populations who have built settlements around these lakes, e.g., Nadym (Lobanov, personal communication). Counterintuitively, the disturbed lakes provide a better habitat for fish and a better possibility for harvesting fish than the shallow lakes which are getting smaller. Local and Indigenous knowledge recognizes that disturbed lakes provide better habitats for fish as they are deeper and do not freeze to the bottom in winter.
The presence or absence of waterbodies profoundly affects biodiversity and ecosystem function, particularly trace gas emissions. While fish and other aquatic organisms are obvious dependents on waterbodies, the drying of waterbodies allows new terrestrial habitats to open up with new vegetation, and potentially, new grazing areas for reindeer. Whereas microbial respiration from anaerobic aquatic microbes releases the powerful greenhouse gas methane [55,59], aerobic respiration from terrestrial soils releases carbon dioxide and it can be postulated that with the increased vegetation cover observed, more CO2 will be sequestered than released leading to carbon storage. This is important because the Arctic—and particularly Siberia—is thought to be a major source of greenhouse gases that could lead to increased global warming [60,61].
Water availability to the local population and water quality may be affected by ongoing changes in the sizes of lakes as well as other climate change impacts and dredging. The availability of high-quality drinking water is limited for the residents of the Arctic zone of Western Siberia due to climatic and anthropogenic risks despite the rich water resources [14,15]. In the Tazovsky area, local people access their water from the Taz river and other smaller rivers and tributaries, so reductions in lake surface area and loss of lakes will not directly affect access to water resources.
Changes in lake number and area influence infrastructure maintenance and development. Transport in the remote north is particularly dependent on navigating between waterbodies and across them when they are frozen [62]. Ice roads, “zimniks”, are threatened by an early and unpredictable thaw of lake and river ice [63], although, in the long term, transport will be easier if lakes and permafrost disappear.
5. Conclusions
Although experts have recorded and published conflicting trends for changes in lakes in Siberia, school students from the Tazovskaya Secondary School working over the past five years have shown unequivocally that 21 lakes in their region have decreased in surface area, one has disappeared completely, and no new lakes or increases in the surface area have occurred. Although transitions between aquatic and terrestrial ecosystems and landscapes have been cyclical with the khasyrey phenomenon, the current ubiquitous loss of lake surface area in the Tazovsky area suggests a new landscape regime for this area. The students have recorded the various impacts of the loss of lake area giving first-hand accounts of new biodiversity, for example, based on local knowledge. Despite the approach being limited by available technology and expertise, such as low replication of measurements and simple experimental design, the results are nevertheless valuable for the local community and contribute important ground-based information for understanding remotely sensed landscape dynamics which are underrepresented in the literature [51]. It is sincerely hoped that the publication and wide visibility of this study will encourage the teachers and students to continue their important local research and will enthuse teachers and students over wider areas to add to our scientific understanding and recording of important and accelerating landscape changes over extensive, remote areas.
Author Contributions
Conceptualization, S.K; methodology, S.K.; software, V.B.; formal analysis, T.V.C.; investigation, S.K., O.S. (Olga Semenova) and O.S. (Olga Shaduyko); resources, S.K. and O.S. (Olga Semenova); data curation, T.V.C.; writing—original draft preparation, T.V.C.; writing—review and editing, T.V.C., O.S. (Olga Shaduyko), S.K., O.S. (Olga Semenova) and V.B.; visualization, V.B. and T.V.C.; supervision, T.V.C.; project administration, O.S. (Olga Shaduyko); funding acquisition, O.S. (Olga Shaduyko). All authors have read and agreed to the published version of the manuscript.
Funding
The study was supported by the Tomsk State University Development Programme (“Priority-2030”) and partly carried out using the research equipment of the Unique Research Installation “System of experimental bases located along the latitudinal gradient” TSU with financial support from the Ministry of Education and Science of Russia (RF—2296.61321X0043, agreement No. 075-553 722 15-2021-672).
Institutional Review Board Statement
Not applicable.
Data Availability Statement
The data presented in this study are available on request from the corresponding author. The data are not publicly available because an appropriate data base has not been created yet.
Acknowledgments
We are grateful to all of the school students of the Tazovsaya Secondary School of the YNAO for their participation in data gathering and preliminary analysis. We express our gratitude to the partners of the Siberian Environmental Change Network SecNET for their fruitful cooperation.
Conflicts of Interest
The authors declare no conflict of interest.
References
- Shumilova, L.V. Botanical Geography of Siberia; Tomsk State University Press: Tomsk, Russia, 1962. (In Russian) [Google Scholar]
- Biskaborn, B.K.; Smith, S.L.; Noetzli, J.; Matthes, H.; Vieira, G.; Streletskiy, D.A.; Schoeneich, P.; Romanovsky, V.E.; Lewkowicz, A.G.; Abramov, A.; et al. Permafrost is warming at a global scale. Nat. Commun. 2019, 10, 264. [Google Scholar] [CrossRef] [Green Version]
- Callaghan, T.V.; Shaduyko, O.; Kirpotin, S.N.; Gordov, E. Siberian environmental change: Synthesis of recent studies and opportunities for networking. Ambio 2021, 50, 2104–2127. [Google Scholar] [CrossRef]
- Suter, L.J.; Streletskiy, D.A.; Shiklomanov, N.I. Assessment of the cost of climate change impacts on critical infrastructure in the circumpolar Arctic. Polar Geogr. 2019, 42, 267–286. [Google Scholar] [CrossRef]
- Streletskiy, D.A.; Suter, L.J.; Shiklomanov, N.I.; Porfiriev, B.N.; Eliseev, D.O. Assessment of climate change impacts on buildings, structures and infrastructure in the Russian regions on permafrost. Environ. Res. Lett. 2019, 14, 25003. [Google Scholar] [CrossRef]
- Vohland, K.; Land-Zandstra, A.; Ceccaroni, L.; Lemmens, R.; Perelló, J.; Ponti, M.; Samson, R.; Wagenknecht, K. (Eds.) The Science of Citizen Science; Springer: Berlin/Heidelberg, Germany, 2021; 529p. [Google Scholar] [CrossRef]
- Williams, P.; Alessa, L.; Abatzoglou, J.; Kliskey, A.; Witmer, F.; Lee, O.; Trammell, J.; Beaujean, G.; Venema, R. Community-based observing networks and systems in the Arctic: Human perceptions of environmental change and instrument-derived data. Reg. Environ. Change 2017, 18, 547–559. [Google Scholar] [CrossRef]
- Klütsch CF, C.; Aspholm, P.E.; Polikarpova, N.; Veisblium, O.; Bjørn, T.-A.; Wikan, A.; Gonzalez, V.; Hagen, S.B. Studying phenological phenomena in subarctic biomes with international school pupils as citizen scientists. Ecol. Evol. 2021, 11, 3501–3515. [Google Scholar] [CrossRef]
- Alessa, L.; Kliskey, A.; Gamble, J.; Fidel, M.; Beaujean, G.; Gosz, J. The role of indigenous science and local knowledge in integrated observing systems: Moving toward adaptive capacity indices and early warning systems. Sustain. Sci. 2016, 11, 91–102. [Google Scholar] [CrossRef]
- Lavrillier, A.; Gabyshev, S. An Arctic Indigenous Knowledge System of Landscape, Climate, and Human Interactions: Evenki Reindeer Herders and Hunters; Verlag der Kulturstiftung Sibirien: Fürstenberg, Germany, 2017; 201p. [Google Scholar]
- Petrov, A.N.; Vlasova, T. Towards an Arctic Sustainability Monitoring Framework. Sustainability 2021, 13, 4800. [Google Scholar] [CrossRef]
- Hulbert, A.; Hayes, T.; McKinnon, T.; Goforth, C. Caterpillars Count! A Citizen Science Project for Monitoring Foliage Arthropod Abundance and Phenology. Citiz. Sci. Theory Pract. 2019, 4, 1–12. [Google Scholar] [CrossRef] [Green Version]
- Lavrillier, A.; Gabyshev, S. An Indigenous science of the climate change impacts on landscape topography in Siberia. Ambio 2021, 50, 1910–1925. [Google Scholar] [CrossRef]
- Bogdanova, E.; Lobanov, A.; Andronov, S.; Soromotin, A.; Popov, A.; Skalny, A.; Shaduyko, O.; Callaghan, T. V Access to Natural Drinking Water in the Arctic Zone of Western Siberia in a Changing Climate. Water 2022. submitted. [Google Scholar]
- Ismajylov, G.; Fedorov, V. Forecast of the State of Russia’s Freshwater Resources in Connection with Global and Regional Changes. Prir. Environ. Manag. 2013, 1, 60–64, (In Russian with English Abstract). [Google Scholar]
- Golubyatnikov, L.L.; Zarov, E.A.; Kazantsev, V.S.; Filippov, I.V.; Gavrilov, G.O. Analysis of Landscape Structure in the Tundra Zone for Western Siberia Based on Satellite Data. Issled. Zemli Iz Kosm. 2015, 3, 4–14, (In Russian with English Abstract). [Google Scholar] [CrossRef]
- Im, S.T.; Kharuk, V.I. Water mass dynamics in permafrost of central Siberia based on grace gravity data. Geophys. Process. Biosph. 2015, 14, 53–69, (In Russian with English Abstract). [Google Scholar]
- Vonk, J.E.; Tank, S.E.; Bowden, W.B.; Laurion, I.; Vincent, W.F.; Alekseychik, P.; Amyot, M.; Billet, M.F.; Canário, J.; Cory, R.M.; et al. Reviews and syntheses: Effects of permafrost thaw on Arctic aquatic ecosystems. Biogeosciences 2015, 12, 7129–7167. [Google Scholar] [CrossRef] [Green Version]
- Holgerson, M.A.; Raymond, P.A. Large contribution to inland water CO2 and CH4 emissions from very small ponds. Nat. Geosci. Lett. 2016, 9, 222–226. [Google Scholar] [CrossRef]
- Pokrovsky, O.S.; Manasypov, R.M.; Kopysov, S.G.; Krickov, I.V.; Shirokova, L.S.; Loiko, S.V.; Lim, A.G.; Kolesnichenko, L.G.; Vorobyev, S.N.; Kirpotin, S.N. Impact of Permafrost Thaw and Climate Warming on Riverine Export Fluxes of Carbon, Nutrients and Metals in Western Siberia. Water 2020, 12, 1817. [Google Scholar] [CrossRef]
- Karlsson, J.; Serikova, S.; Vorobyev, S.N.; Rocher-Ros, G.; Denfeld, B.; Pokrovsky, O.S. Carbon emission from Western Siberian inland waters. Nat. Commun. 2021, 12, 825. [Google Scholar] [CrossRef]
- Paramonov, E.G.; Rybkina, I.D. Stabilization of Aley river water content by forest stands. Sib. Lesn. Zurnal Sib. J. For. Sci. 2016, 3, 57–66, (In Russian with English Abstract). [Google Scholar] [CrossRef]
- Vassiliev, G.; Djalyabov ALeonovich, I. Analysis of the causes of deformations of engineering structures of gas complex facilities in the permafrost zone (Analiz prichin vozniknoveniya deformatsiy inzhenernykh so oruzheniy ob”yektov gazovogo kompleksa v kriolitozone). Notes Min. Inst. Zap. Gorn. Inst. 2021, 249, 377–385. [Google Scholar] [CrossRef]
- Smith, L.C.; Sheng, Y.; Macdonald, G.M.; Hinzman, L.D. Disappearing Arctic Lakes. Science 2005, 308, 1429. [Google Scholar] [CrossRef] [PubMed] [Green Version]
- Polishchuk, Y.M.; Bryksina, N.A.; Polishchuk, V.Y. Remote analysis of changes in the number of small thermokarst lakes and their distribution with respect to their sizes in the cryolithozone of Western Siberia. Izv. Atmos. Ocean. Phys. 2015, 51, 999–1006. [Google Scholar] [CrossRef]
- Kravtsova, V.I.; Tarasenko, T.V. Investigation of changes in thermokarst lake distribution in West Siberia by multitemporal satellite images. Environ. Dyn. Glob. Clim. Change 2010, 1, 82–87, (In Russian with English Abstract). [Google Scholar]
- Kirpotin, S.N.; Polishchuk Yu, M.; Bryksina, N.A. Thermokarst lakes square dynamics of West Siberian continuous and discontinuous permafrost under impact of global warming. Vestn. Tomsk State Univ. 2008, 311, 185–189, (In Russian with English Abstract). [Google Scholar]
- Loiko, S.; Klimova, N.; Kuzmina, D.; Pokrovsky, O. Lake Drainage in Permafrost Regions Produces Variable Plant Communities of High Biomass and Productivity. Plants 2020, 9, 867. [Google Scholar] [CrossRef]
- Makarenkova, I.Y.; Uvarova, V.I. Changes in the ecological state of lakes used for the development of sand deposits in the Bovanenkovskoye oil and gas condensate field. Environ. Prot. Oil Gas Complex 2017, 3, 22–27. (In Russian) [Google Scholar]
- Brown, J.; Ferrians, O.J.; Heginbottom, J.A.; Melnikov, E.S. Circum-Arctic Map of Permafrost and Ground-Ice Conditions on CD-ROM; 1998, International Permafrost Association on Data Information and Communication (Comp.) Circumpolar Active-Layer Permafrost System, Version 2.0; Parsons, M., Zhang, T., Eds.; National Snow and Ice Data Center/World Data Center for Glaciology: Boulder, CO, USA, 2003. [Google Scholar]
- Kondratieva, K.A.; Afanasenko, V.E.; Gavrilov, A.V.; Dunaeva, E.N.; Zamolotchikova, S.A.; Trush, N.I.; Lisitsyna, O.M.; Trofimov, V.T.; Sverdlova, L.Y.; Syritsyna, M.I.; et al. Geocryological Map of the USSR, Scale 1:2,500,000; Ministerstvo Geologii: Moscow, Russia, 1996; 16p. (In Russian) [Google Scholar]
- Dobrinskiy, L.N. Priroda Yamala/Otv. Red.; UIF Nauka: Ekaterinburg, Russia, 1995; 487p. [Google Scholar]
- Bolshanik, P.V.; Mukhamedyanov, T.I. Transformation on the relief of the areas of development of gas field of the Taz peninsula. Environ. Dyn. Glob. Clim. Change 2019, 10, 16–27, (In Russain with English Abstract). [Google Scholar] [CrossRef]
- Bryksina, N.A.; Kirpotin, S.N. Landscape-space analysis of change of thermokarst lakes areas and numbers in the permafrost zone of West Siberia. Tomsk State Univ. J. Biol. 2012, 4, 185–194, (In Russian with English Abstract). [Google Scholar]
- Romanov, A.N.; Khvostov, I.V.; Pavlov, V.E.; Vinokurov, Y.I. Remote monitoring of wetland areas of Western Siberia using SMOS (ESA) data. Atmos. Ocean. Opt. 2014, 27, 313–316. [Google Scholar] [CrossRef]
- Bryksina, N.A.; Polishchuk, Y.M. Studying the distribution of thermokarst lakes areas in arctic zone of Western Siberia and their dynamics by the ultrahigh resolution satellite images. Bull. Tomsk. Polytech. Univ. Geo Assets Eng. 2016, 327, 13–21, (In Russian with English Abstract). [Google Scholar]
- Polishchuk, Y.M.; Bogdanov, A.N.; Bryksina, N.A.; Polishchuk, V.Y.; Muratov, I.N.; Kupriyanov, M.A.; Baisalyamova, O.A.; Dneprovskaya, V.P. Experience and results of a remote study of lakes in the permafrost zone of Western Siberia from satellite images of various resolutions over a 50-year period. Current Probl. Remote Sens. Earth Space 2017, 14, 42–55, (In Russian with English Abstract). [Google Scholar] [CrossRef]
- Polishchuk, V.Y.; Muratov, I.N.; Kupriyanov, M.A.; Polishchuk, Y.M. Modeling the fields of thermokarst lakes in the permafrost based on the geo–simulation approach and satellite images. Math. Notes NEFU 2020, 27, 101–114, (In Russian with English Abstract). [Google Scholar] [CrossRef]
- Polishchuk, Y.M.; Muratov, I.N.; Polishchuk, V.Y. Remote research of spatiotemporal dynamics of thermokarst lakes fields in Siberian permafrost. In The Arctic: Current Issues and Challenges; Nova Science Publishers: New York, NY, USA, 2020; pp. 208–237. [Google Scholar]
- Bryksina, N.A. Scientific and Methodological Basis for the Application of Remote Sensing Data in Studying the dynamics of the Thermokarst Landscape of the West Siberian Plain. Ph.D. Thesis, Yugra State University, Khanty-Mansiisk, Russia, 2011. (In Russian). [Google Scholar]
- Ivanova, T.N. Thermokarst lakes of permafrost areas. Adv. Curr. Nat. Sci. 2019, 6, 62–66, (In Russian with English Abstract). [Google Scholar]
- Hecker, S.; Haklay, M.E.; Bowser, A.; Makuch, Z.; Vogel, J.; Bonn, A. (Eds.) Citizen Science; UCL Press: London, UK, 2018. [Google Scholar] [CrossRef]
- Wilson, N.J.; Walter, T.M.; Waterhouse, J. Indigenous Knowledge of Hydrologic Change in the Yukon River Basin: A Case Study of Ruby, Alaska. Arctic 2015, 68, 93–106. [Google Scholar] [CrossRef]
- Community Observation Network for Adaptation and Security (CONAS). Available online: http://conas-ak.org/ (accessed on 12 September 2022).
- Saunders, M.E.; Roger, E.; Geary, W.L.; Meredith, F.; Welbourne, D.J.; Bako, A.; Canavan, E.; Herro, F.; Herron, C.; Hung, O.; et al. Citizen science in schools: Engaging students in research. Aust. Ecol. 2018, 43, 635–642. [Google Scholar] [CrossRef] [Green Version]
- World Meteorological Organization (WMO). Technical Regulations, Basic Documents No. 2, Volume I: General Meteorological Standards and Recommended Practices, 2019th ed.; WMO 49; Secretariat of WMO: Geneva, Switzerland, 2019; 71p. [Google Scholar]
- Levene, H. Contributions to Probability and Statistics: Essays in Honor of Harold Hotelling; Olkin, I., Sudhish, G., Wassily, H., Maddow, W., Eds.; Stanford University Press: Redwood City, CA, USA, 1960; pp. 278–292. [Google Scholar]
- Ob-Irtysh Department for Hydrometeorology and Environmental Monitoring. Available online: http://omsk-meteo.ru/index.php/ru/ (accessed on 15 January 2020).
- Soromotin, A.V.; Prikhodko, N.V.; Sizov, O.S.; Dayzel, A.V.; Kudryavtsev, A.A.; Zakirova, M.R. Geoecology of thermokarst lakes of Western Siberia in the zone of influence of an arctic town (a case study of the town of Nadym). Geogr. Bull. 2022, 2, 90–108, (In Russian with English Abstract). [Google Scholar] [CrossRef]
- Myers-Smith, I.H.; Kerby, J.T.; Phoenix, G.K.; Bjerke, J.W.; Epstein, H.E.; Assmann, J.J.; John, C.; Andreu-Hayles, L. Complexity revealed in the greening of the Arctic. Nat. Clim. Change 2020, 10, 106–117. [Google Scholar] [CrossRef] [Green Version]
- Callaghan, T.V.; Cazzolla Gatti, R.; Phoenix, G. The need to understand the stability of arctic vegetation during rapid climate change: An assessment of imbalance in the literature. Ambio 2021, 51, 1034–1044. [Google Scholar] [CrossRef] [PubMed]
- IPCC. Climate Change 2013: The Physical Science Basis; Contribution of Working Group I to the Fifth Assessment Report of the Intergovernmental Panel on Climate, Change; Stocker, T.F., Qin, D., Plattner, G.-K., Tignor, M., Allen, S.K., Boschung, J., Nauels, A., Xia, Y., Bex, V., Midgley, P.M., Eds.; Cambridge University Press: Cambridge, UK; New York, NY, USA, 2013; 1535p. [Google Scholar]
- AMAP. Available online: http://climate.amap.no/ (accessed on 14 October 2022).
- Overland, J.E.; Wang, M. The 2020 Siberian heat wave. Int. J. Climatol. 2021, 41, E2341–E2346. [Google Scholar] [CrossRef]
- Anisimov, O.; Zimov, S. Thawing permafrost and methane emission in Siberia: Synthesis of observations, reanalysis, and predictive modeling. Ambio 2021, 50, 2050–2059. [Google Scholar] [CrossRef] [PubMed]
- Johansson, M.; Callaghan, T.V.; Bosiö, J.; Åkerman, J.; Jackowicz-Korcynski, M.; Christensen, T.R. Rapid responses of permafrost and vegetation to experimentally increased snow cover in sub-arctic Sweden. Environ. Res. Lett. 2013, 8, 35025. [Google Scholar] [CrossRef] [Green Version]
- Åkerman, H.J.; Johansson, M. Thawing permafrost and thicker active layers in sub-arctic Sweden. Permafr. Periglac. Process. 2008, 19, 279–292. [Google Scholar] [CrossRef]
- Andronov, S.; Lobanov, A.; Popov, A.Y.; Shaduyko, O.; Fesyun ALobanova, L.; Bogdanova, E.; Kobel’kova, I. Changing diets and traditional lifestyle of Siberian Arctic Indigenous Peoples and effects on health and well-being. Ambio 2021, 50, 2060–2071. [Google Scholar] [CrossRef] [PubMed]
- Christensen, T.R.; Jonasson, S.; Callaghan, T.V.; Havstrom, M.; Livens, F.R. Carbon cycling and methane exchange in Eurasian tundra ecosystems. Ambio 1999, 28, 239–244. [Google Scholar]
- Tarnocai, C.; Canadell, J.G.; Schuur, E.A.G.; Kuhry, P.; Mazhitova, G.; Zimov, S. Soil organic carbon pools in the northern circumpolar permafrost region. Glob. Biogeochem. Cycles 2009, 23, 3327. [Google Scholar] [CrossRef]
- Schuur EA, G.; McGuire, A.D.; Schädel, C.; Grosse, G.; Harden, J.W.; Hayes, D.J.; Hugelius, G.; Koven, C.D.; Kuhry, P.; Lawrence, D.M.; et al. Climate change and the permafrost carbon feedback. Nature 2015, 520, 171–179. [Google Scholar] [CrossRef]
- Rakhmanova, L.; Kolesnichenko, L.; Kuzhevskaya, I.; Kolesnichenko, I.; Vorobev, R.; Tyulyupo, S.V.; Drozdov, V.; Shaduyko (Morozova), O. Perspectives of climate change. A comparison of scientific understanding and local interpretations by different Western Siberian communities. Ambio 2021, 50, 2072–2089. [Google Scholar] [CrossRef] [PubMed]
- ACIA. Arctic Climate Impact Assessment; ACIA Overview Report 2005; Cambridge University Press: Cambridge, UK, 2005; 1020p. [Google Scholar]
Figure 1.
Location map of the general study area: (left), the location in the Yamalo-Nenets Autonomous Okrug (Worldmap northern.svg); (middle), the Tazovsky District (right) showing the location of the Tazovskaya Secondary School and the Gaz-Sale village (Google Maps).
Figure 1.
Location map of the general study area: (left), the location in the Yamalo-Nenets Autonomous Okrug (Worldmap northern.svg); (middle), the Tazovsky District (right) showing the location of the Tazovskaya Secondary School and the Gaz-Sale village (Google Maps).

Figure 2.
(a) The village of Gaz-Sale and the study area showing the four disturbed lakes (D1–D4) in 2014. (b) The village of Gaz-Sale and study lakes showing the nine undisturbed lakes above the road (UA1–UA9) and the nine undisturbed lakes below the road (UB1–UB9) in 2014. The yellow outline around lake UA1 denotes the lake which had disappeared by 2019.

Figure 3.
A 2018 photo of a dredged lake which is now abandoned.

Figure 4.
Drones are used to describe landscapes.

Figure 5.
The village of Gaz-Sale and the study area showing the lakes in 2019 that can be compared with the lakes in 2014 (Figure 2b). Note the disappearing lake UA1 and the change in the water color of the disturbed lakes.
Figure 5.
The village of Gaz-Sale and the study area showing the lakes in 2019 that can be compared with the lakes in 2014 (Figure 2b). Note the disappearing lake UA1 and the change in the water color of the disturbed lakes.

Figure 6.
Mean lake area between 2014 and 2019 for four disturbed lakes (D1–D4). (p-value = 0.0033).
Figure 6.
Mean lake area between 2014 and 2019 for four disturbed lakes (D1–D4). (p-value = 0.0033).

Figure 7.
Climate trends at Tazovskiy Village. (A) mean annual temperature (°C); (B) mean winter (October to April inclusive) temperatures (°C); (C) mean summer precipitation (mm) (June, July, and August); (D) mean snow depth (November to March inclusive) (cm).
Figure 7.
Climate trends at Tazovskiy Village. (A) mean annual temperature (°C); (B) mean winter (October to April inclusive) temperatures (°C); (C) mean summer precipitation (mm) (June, July, and August); (D) mean snow depth (November to March inclusive) (cm).


Figure 8.
Active layer thickness from 2014 to 2019.

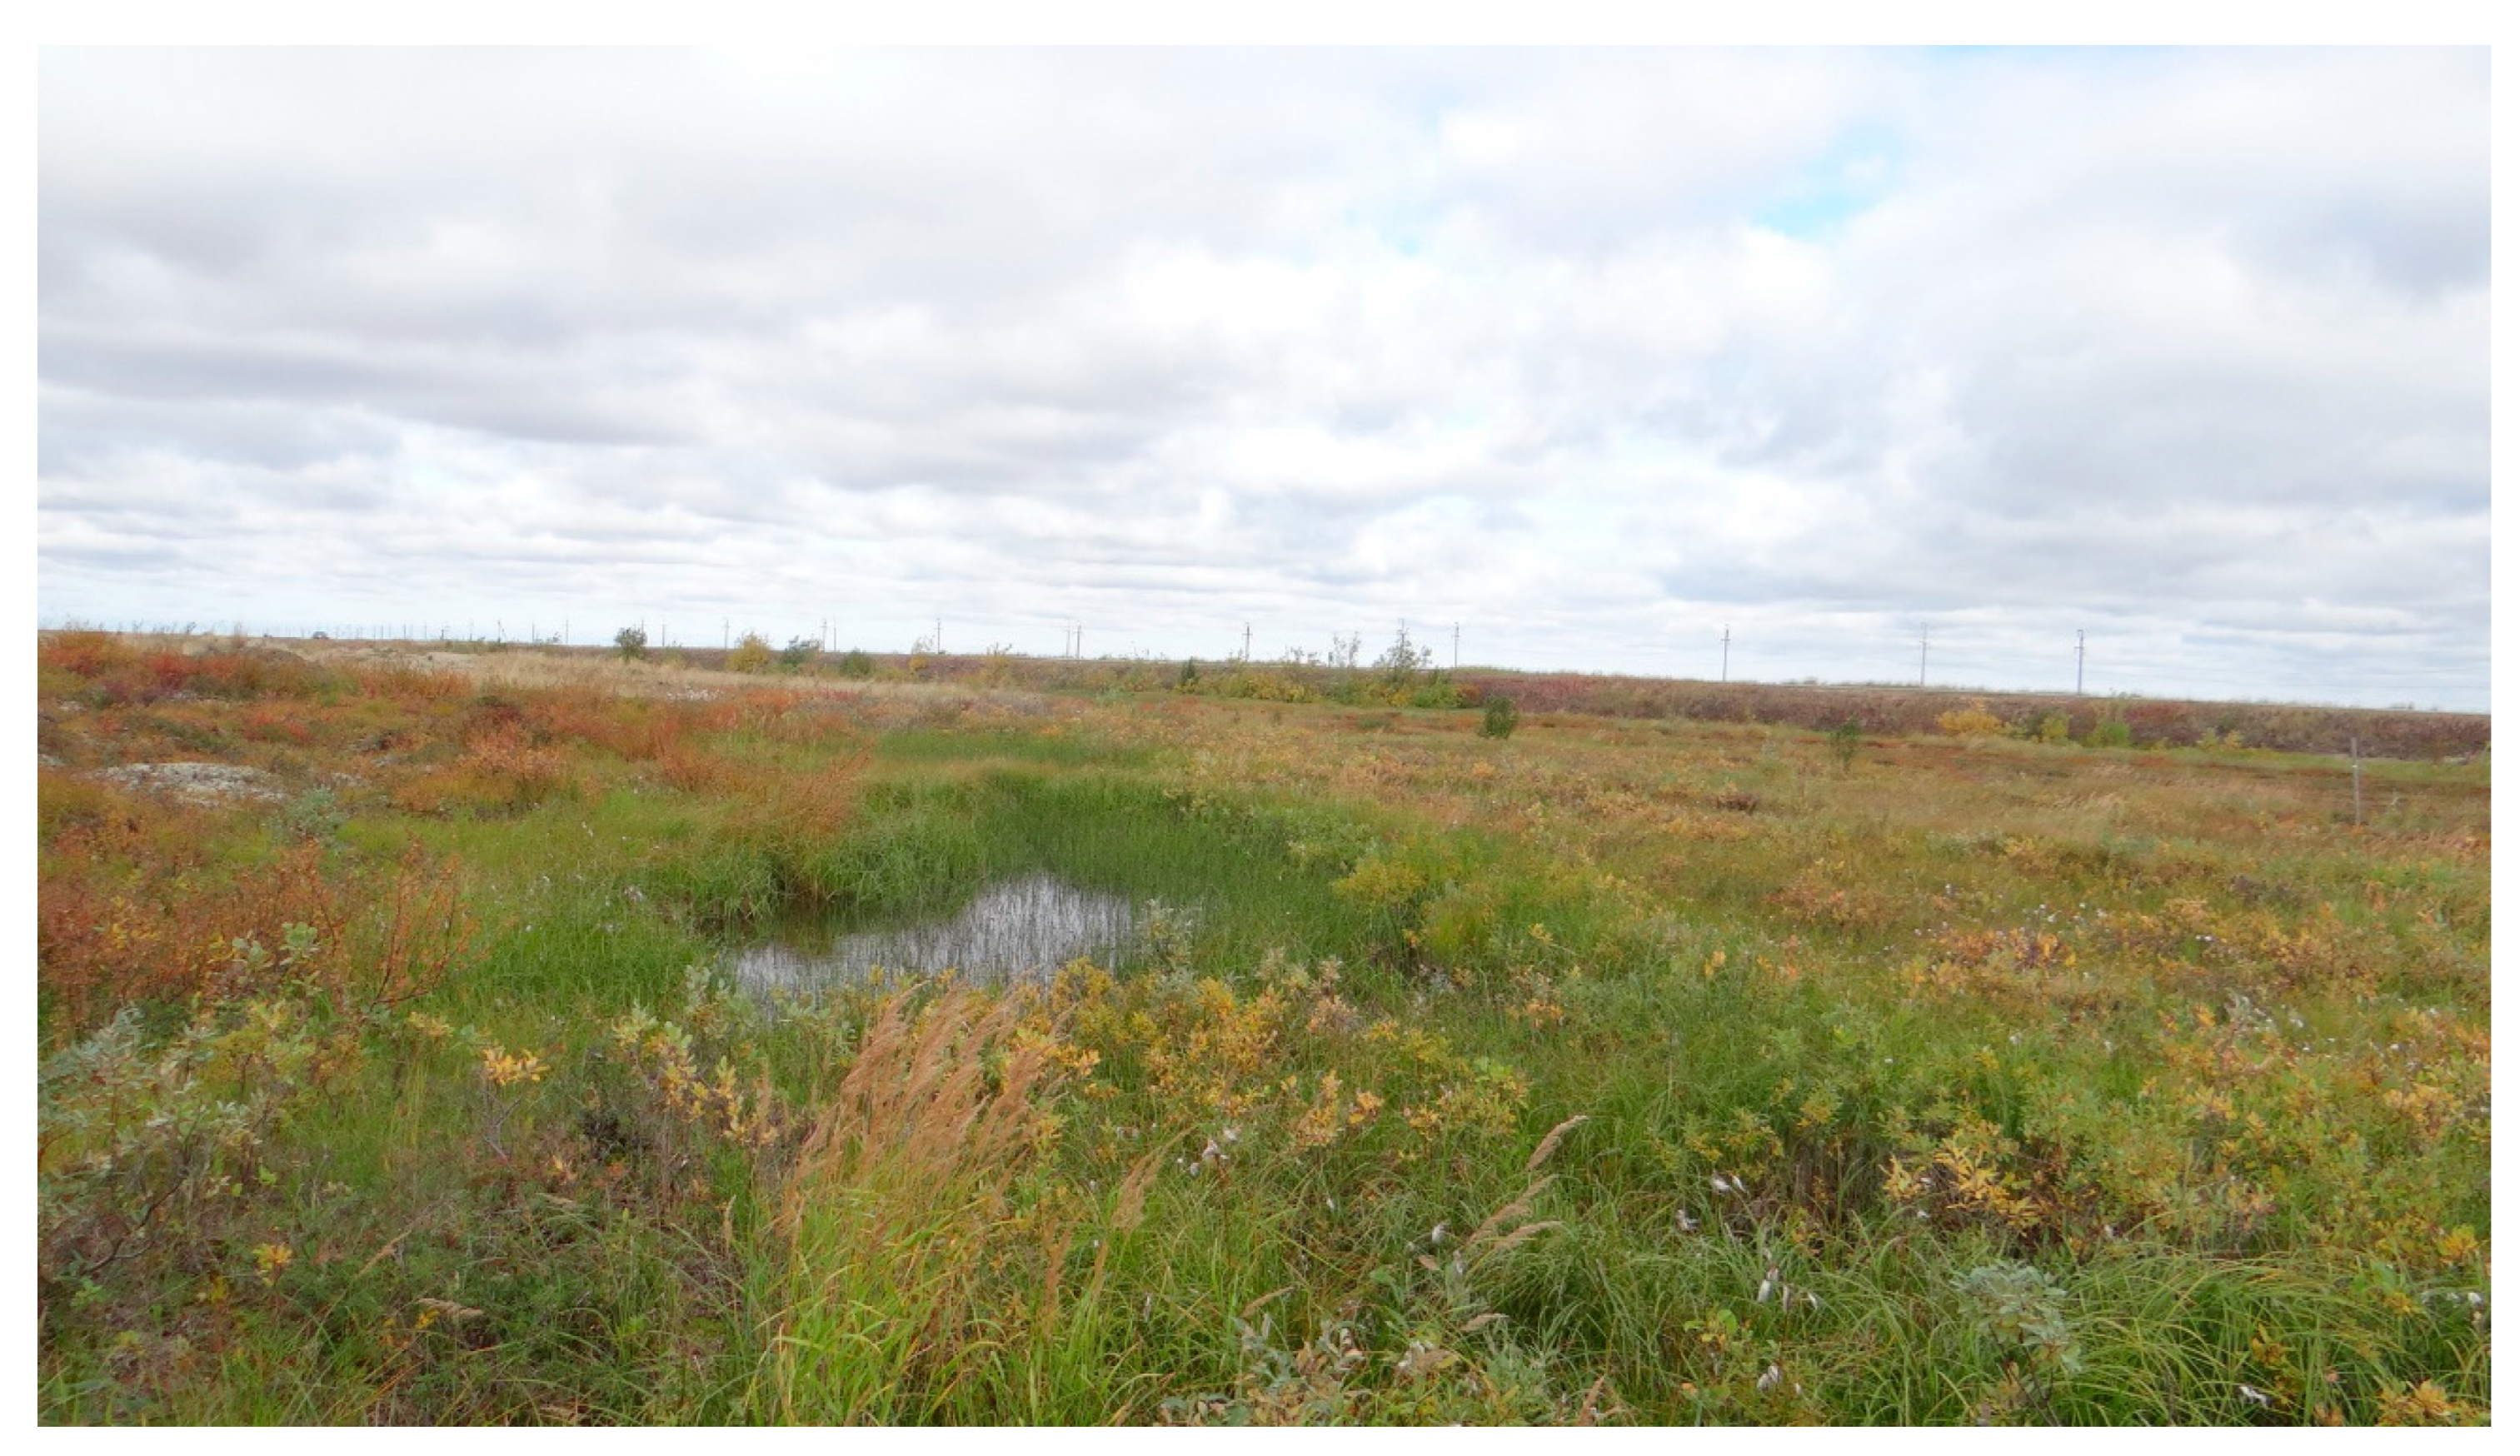
Figure 9.
Photo of the bottom of a degraded thermokarst pond.


Table 1.
Dynamics of the undisturbed lakes above the road. Note: areas are estimated in a standardized way and are not absolute.
Table 1.
Dynamics of the undisturbed lakes above the road. Note: areas are estimated in a standardized way and are not absolute.
| Lakes | Maximum Diameter, m | Minimum Diameter, m | Lake Area, km2 | ||||
|---|---|---|---|---|---|---|---|
| 2014 | 2019 | 2014 | 2019 | 2014 | 2019 | Difference % | |
| Lake UA1 | 197 | 0 | 103 | 0 | 0.070 | 0 | −100 |
| Lake UA2 | 582 | 486 | 254 | 233 | 0.137 | 0.101 | −26.3 |
| Lake UA3 | 368 | 321 | 199 | 151 | 0.063 | 0.053 | −5.87 |
| Lake UA4 | 623 | 596 | 441 | 391 | 0.222 | 0.191 | −14.0 |
| Lake UA5 | 2865 | 2313 | 1251 | 936 | 3.324 | 2.071 | −37.7 |
| Lake UA6 | 2638 | 2145 | 1403 | 1224 | 3.204 | 2.227 | −30.5 |
| Lake UA7 | 486 | 458 | 432 | 362 | 0.165 | 0.131 | −20.6 |
| Lake UA8 | 498 | 412 | 385 | 343 | 0.153 | 0.114 | −25.5 |
| Lake UA9 | 345 | 339 | 289 | 261 | 0.079 | 0.070 | −23.9 |
| Mean | 955.8 | 785.6 | 528.6 | 433.4 | 0.821 | 0.551 | −31.6 |
| Standard error | 0.462 | 0.302 | |||||
Table 2.
Dynamics of the undisturbed lakes below the road.
| Lakes | Maximum Diameter, m | Minimum Diameter, m | Lake Area, km2 | ||||
|---|---|---|---|---|---|---|---|
| 2014 | 2019 | 2014 | 2019 | 2014 | 2019 | Difference % | |
| Lake UB1 | 286 | 268 | 168 | 153 | 0.040 | 0.035 | −12.5 |
| Lake UB2 | 265 | 248 | 172 | 159 | 0.037 | 0.032 | −13.5 |
| Lake UB3 | 462 | 417 | 298 | 246 | 0.113 | 0.086 | −23.9 |
| Lake UB4 | 312 | 271 | 252 | 241 | 0.062 | 0.051 | −17.7 |
| Lake UB5 | 452 | 385 | 287 | 271 | 0.107 | 0.084 | −21.5 |
| Lake UB6 | 685 | 649 | 452 | 436 | 0.253 | 0.231 | −8.7 |
| Lake UB7 | 648 | 612 | 447 | 421 | 0.235 | 0.209 | −11.1 |
| Lake UB8 | 928 | 895 | 536 | 502 | 0.420 | 0.383 | −8.8 |
| Lake UB9 | 323 | 318 | 203 | 172 | 0.054 | 0.047 | −13.0 |
| Mean | 484.6 | 451.4 | 312.8 | 289.0 | 0.15 | 0.12 | −12.3 ± SE |
| Standard error | 0.043 | 0.04 | |||||
Table 3.
Correlations (Pearson product–moment): among climatic factors (A); between active layer thickness and climatic factors (B); and between the area of disturbed lakes and climatic factors (C). Values in bold denote significant p-values.
Table 3.
Correlations (Pearson product–moment): among climatic factors (A); between active layer thickness and climatic factors (B); and between the area of disturbed lakes and climatic factors (C). Values in bold denote significant p-values.
| (A) | |||||
|---|---|---|---|---|---|
| Active Layer Thickness (cm) | Summer Precipitation (mm/cm2) | Mean Annual Temperature (°C) | Mean Winter Temperature (°C) | Mean Snow Depth (cm) | |
| Active layer thickness (cm) | 1 | ||||
| Summer precipitation (mm/cm2) | 0.521 | 1 | |||
| Mean annual temperature (°C) | 0.023 | −0.170 | 1 | ||
| Mean winter temperature (°C) | 0.008 | −0.570 | 0.806 | 1 | |
| Mean snow depth (cm) | −0.143 | −0.646 | −0.644 | 0.860 | 1 |
| (B) | |||||
| Summer precipitation (mm/cm2) | Mean annual temperature (°C) | Mean winter temperature (°C) | Mean snow depth (cm) | ||
| p-value for active layer thickness correlation with four climate variables | 0.289 | 0.988 | 0.955 | 0.787 | |
| (C) | |||||
| Summer precipitation (mm/cm2) | Mean annual temperature (°C) | Mean winter temperature (°C) | Mean snow depth (cm) | ||
| p-value for lake area correlation with four climate variables | 0.487 | 0.153 | 0.025 | 0.0125 | |
Disclaimer/Publisher’s Note: The statements, opinions and data contained in all publications are solely those of the individual author(s) and contributor(s) and not of MDPI and/or the editor(s). MDPI and/or the editor(s) disclaim responsibility for any injury to people or property resulting from any ideas, methods, instructions or products referred to in the content. |
© 2023 by the authors. Licensee MDPI, Basel, Switzerland. This article is an open access article distributed under the terms and conditions of the Creative Commons Attribution (CC BY) license (https://creativecommons.org/licenses/by/4.0/).
Share and Cite
MDPI and ACS Style
Kunin, S.; Semenova, O.; Callaghan, T.V.; Shaduyko, O.; Bodur, V. Recording Permafrost Thaw and Thaw Lake Degradation in Northern Siberia: School Science in Action. Water 2023, 15, 818. https://doi.org/10.3390/w15040818
AMA Style
Kunin S, Semenova O, Callaghan TV, Shaduyko O, Bodur V. Recording Permafrost Thaw and Thaw Lake Degradation in Northern Siberia: School Science in Action. Water. 2023; 15(4):818. https://doi.org/10.3390/w15040818
Chicago/Turabian StyleKunin, Sergey, Olga Semenova, Terry V. Callaghan, Olga Shaduyko, and Vladimir Bodur. 2023. "Recording Permafrost Thaw and Thaw Lake Degradation in Northern Siberia: School Science in Action" Water 15, no. 4: 818. https://doi.org/10.3390/w15040818
Note that from the first issue of 2016, this journal uses article numbers instead of page numbers. See further details here.