
Dissolved Methane Transport in the Tatar Strait and the Deepest Basin of the Japan (East) Sea from Its Possible Sources

V.I. Il’ichev Pacific Oceanological Institute FEB RAS, 690048 Vladivostok, Russia
*
Author to whom correspondence should be addressed.
Water 2023, 15(4), 821; https://doi.org/10.3390/w15040821
Submission received: 3 January 2023
/
Revised: 10 February 2023
/
Accepted: 16 February 2023
/
Published: 20 February 2023
(This article belongs to the Section Oceans and Coastal Zones)
Abstract
:Dissolved methane coming from its various sources is an important component of seawater. Finding these probable sources allows for the determination of potential oil and/or gas deposit areas. From an ecological point of view, methane transport studies can reveal probable pollution areas on the one hand and biological communities, being the lower part of the food chain commercial species, on the other hand. Moreover, the methane transport mechanism can help to obtain a better understanding of the contribution of the World’s oceans to global greenhouse gas emissions. Our research combines gas geochemistry and oceanography. In comparing the research results of both branches, we show the mechanism of methane transport. The features of the dissolved methane on oceanographic sections in the southern part of the Tatar Strait are discussed. The CH4 intake from the bottom sediment and the transport of dissolved methane by the currents in the Tatar Strait are shown. The absolute maximum concentration of CH4 (155.6 nM/L) was observed on the western Sakhalin Island shelf at the near-bottom layer at a depth of 65 m. The local maximum, 84.4 nM/L, was found north of the absolute maximum in the jet current under the seasonal pycnocline. A comparison of the simulated surface seawater origin and dissolved methane in the 4 m depth distribution shows methane transport with the currents in the Tatar Strait. Another studied section is along 134° E in the Japan Basin of the Japan (East) Sea. Here, the East Korean Warm Current close to the Yamato Rise slope and a quasi-stationary mesoscale anticyclonic eddy centered at 41° N intersect. The local maximum methane concentration of 8.2 nM/L is also observed under the seasonal pycnocline. In a mesoscale anticyclonic eddy at 134° E in the deep part of the Japan Basin, a local methane maximum of 5.2 nM/L is detected under the seasonal pycnocline as well.
1. Introduction
Gas-geochemical methods are widely used to study the oil and gas potential of the ocean. The methane distribution in the ocean is uneven due to its local endogenous, biogenic and anthropogenic sources. The foci of its high concentrations in seawater can be indirect signs of hydrocarbon deposits. In addition, a study of methane sources and the distribution of this gas in the ocean is important when assessing its entry as a greenhouse gas into the atmosphere. Russian [1,2,3,4,5,6,7,8] and foreign [6,7,8,9,10,11,12,13,14,15] studies have shown many underwater foci of hydrocarbon discharge, mainly methane-bearing fluids along the slopes of oceanic basins and shelves. Large pockets of methane and hydrocarbon fluids are located in the Pacific oil and gas regions [15,16,17,18,19,20,21]. The number of detectable natural gas underwater emissions areas grows annually [1,19,22], including a high variety of gas flows, new information about the conditions of the occurrence of gas hydrates and new facts about the relationship between gas flows and seismotectonic activity [4,23,24,25,26,27,28].
In the eastern Pacific Ocean, one of the most thoroughly studied phenomena is gas occurrences on the continental slope of Oregon [29]. There are other well-known areas. For example, in the northern part of the Santa Barbara Canal (CA, USA), there are more than 1500 concentrated outlets at the bottom, from which hydrocarbon gases and oil are released. In total, there are about 4000 diverse structures (pockmarks) on the ocean floor within the underwater California margin [30], which are formed by local flows of thermogenic natural gas.
In the Atlantic Ocean, more than 30 similar areas with local releases of natural gases have been found, including abiogenic methane flows in the hydrothermal systems of the HSZ spreading zone [31]. The most numerous outlets of thermogenic (oil and gas) hydrocarbon gases in the Atlantic Ocean are found in the Gulf of Mexico. Natural gas outlets are known near the Azores, in the Gulf of Cadiz (northwestern slope of Spain) [32] and in other areas. Irrelevant to hydrothermal activity, underwater natural gas outlets are common within the continental margins at shelf and slope depths [19,33,34,35,36,37].
Areas with natural gas outlets are found within powerful (over 2 km) sedimentary strata containing various hydrocarbon accumulations, such as oil and gas deposits, gas hydrates and methane-saturated sediments. A necessary condition for hydrocarbon degassing of such sites is, as a rule, the presence of discontinuous faults [38], additional folded dislocations and increased seismicity. All these signs are observed in the basins and the shelf of the Far Eastern Seas slopes [39,40,41,42,43,44,45], including the Tatar Strait of the Japan (East) Sea (JES) [4].
Applying just gas-geochemical methods, one can deal with a geologically limited area. Our study shows cooperation between gas geochemistry and oceanology. Comparing the results of a little bit distant science branches gives some new understanding of the methane transport mechanism. This can be used for wider ocean areas when studying dissolved methane sources and the distribution and emission of this gas to the atmosphere.
Our study, showing methane transport with currents under the seasonal pycnocline in the Japan (East) Sea, is verified with described [46,47] methane transport in some parts of both the Southern and Atlantic Oceans and also with PAU (polluting hydrocarbon matter) transport under the seasonal pycnocline in the Japan (East) Sea [48].
2. Materials and Methods
The data of gas-geochemical surveys and CTD measurements performed during marine expeditions on the RV “Academician Oparin” in October 2017, cruise 54 (OP54) and on the RV “Academician M.A. Lavrentiev”, cruise 85 (LV85) in May 2019 are used [49,50].
During cruise 54 of the RV “Akademik Oparin”, seawater was sampled to estimate the content of dissolved methane in the 4 m sub-surface sea layer using a flow-through intake unit (flow-through thermosalinograph SeaBird SBE-45). Seawater was also sampled at various sea layers with NISKIN bathometers that were closed during the 24-position rosette up cast. Horizons from the sub-surface sea layer to the bottom were selected according to the CTD measurement results. During cruise 85 of the RV “Academician M.A. Lavrentiev”, samples were taken only from the rosette bathometers (Table 1).
These surveys are conducted to determine the seawater dissolved methane spatial distribution, the relationship of this distribution with the heterogeneity of the temperature, salinity and density and also the current characteristics for a particular season.
The method of equilibrium concentrations “HeadSpace” [51] was used to analyze the methane content in all the water samples. The water from the bathometers was placed into pre-sterilized medical glass bottles with a volume of 68 mL, which were hermetically sealed with sterile rubber stoppers without atmospheric air access to the bottles. To remove excess water, needles from a medical syringe were used.
Gas-phase helium was used. The samples were intensively shaken for at least 4 h on an LS 110 mixing device (Russia), and then the gas was injected into the chromatograph.
The composition of hydrocarbon gases was measured on a “Crystal Lux 4000” gas chromatograph equipped with one flame ionization detector and two thermal conductivity detectors. The carrier gas was helium. Certified calibration gas mixtures were used to calibrate the instruments. The error of this method is less than 5%. The dissolved seawater methane concentrations were calculated according to the method described in [52], including a modification described in [53], using the calculated solubility constants of methane.
Microsoft Excel spreadsheets were used to calculate and systematize the data obtained. For operational visualization and interpretation of the analyzed gas-geochemical data, geoinformation applications (ArcGIS 10.4.1, OceanDataView 5.2.1) were used.
The sampling, preparation of the samples and analytical studies were carried out according to the certified method adopted in the Gas Geochemistry Laboratory of the V.I. Il’ichev Pacific Oceanological Institute (State Standard Certificate No. 58 for the Laboratory Passport PS 1.051-21).
The average surface seawater methane concentration for the OP54 cruise was 8.8 nM/L, with a maximum value of 37.2 nM/L and a minimum value of 4.3 nM/L.
The average CH4 concentration in the water column for cruises OP54 and LV85 was 3.6 nM/L and 21.1 nM/L, respectively, with a minimum of 1.1 nM/L and 3.6 nM/L and a maximum of 6.6 nM/L and 155.6 nM/L, respectively.
3. Oceanographic Features of the Research Area
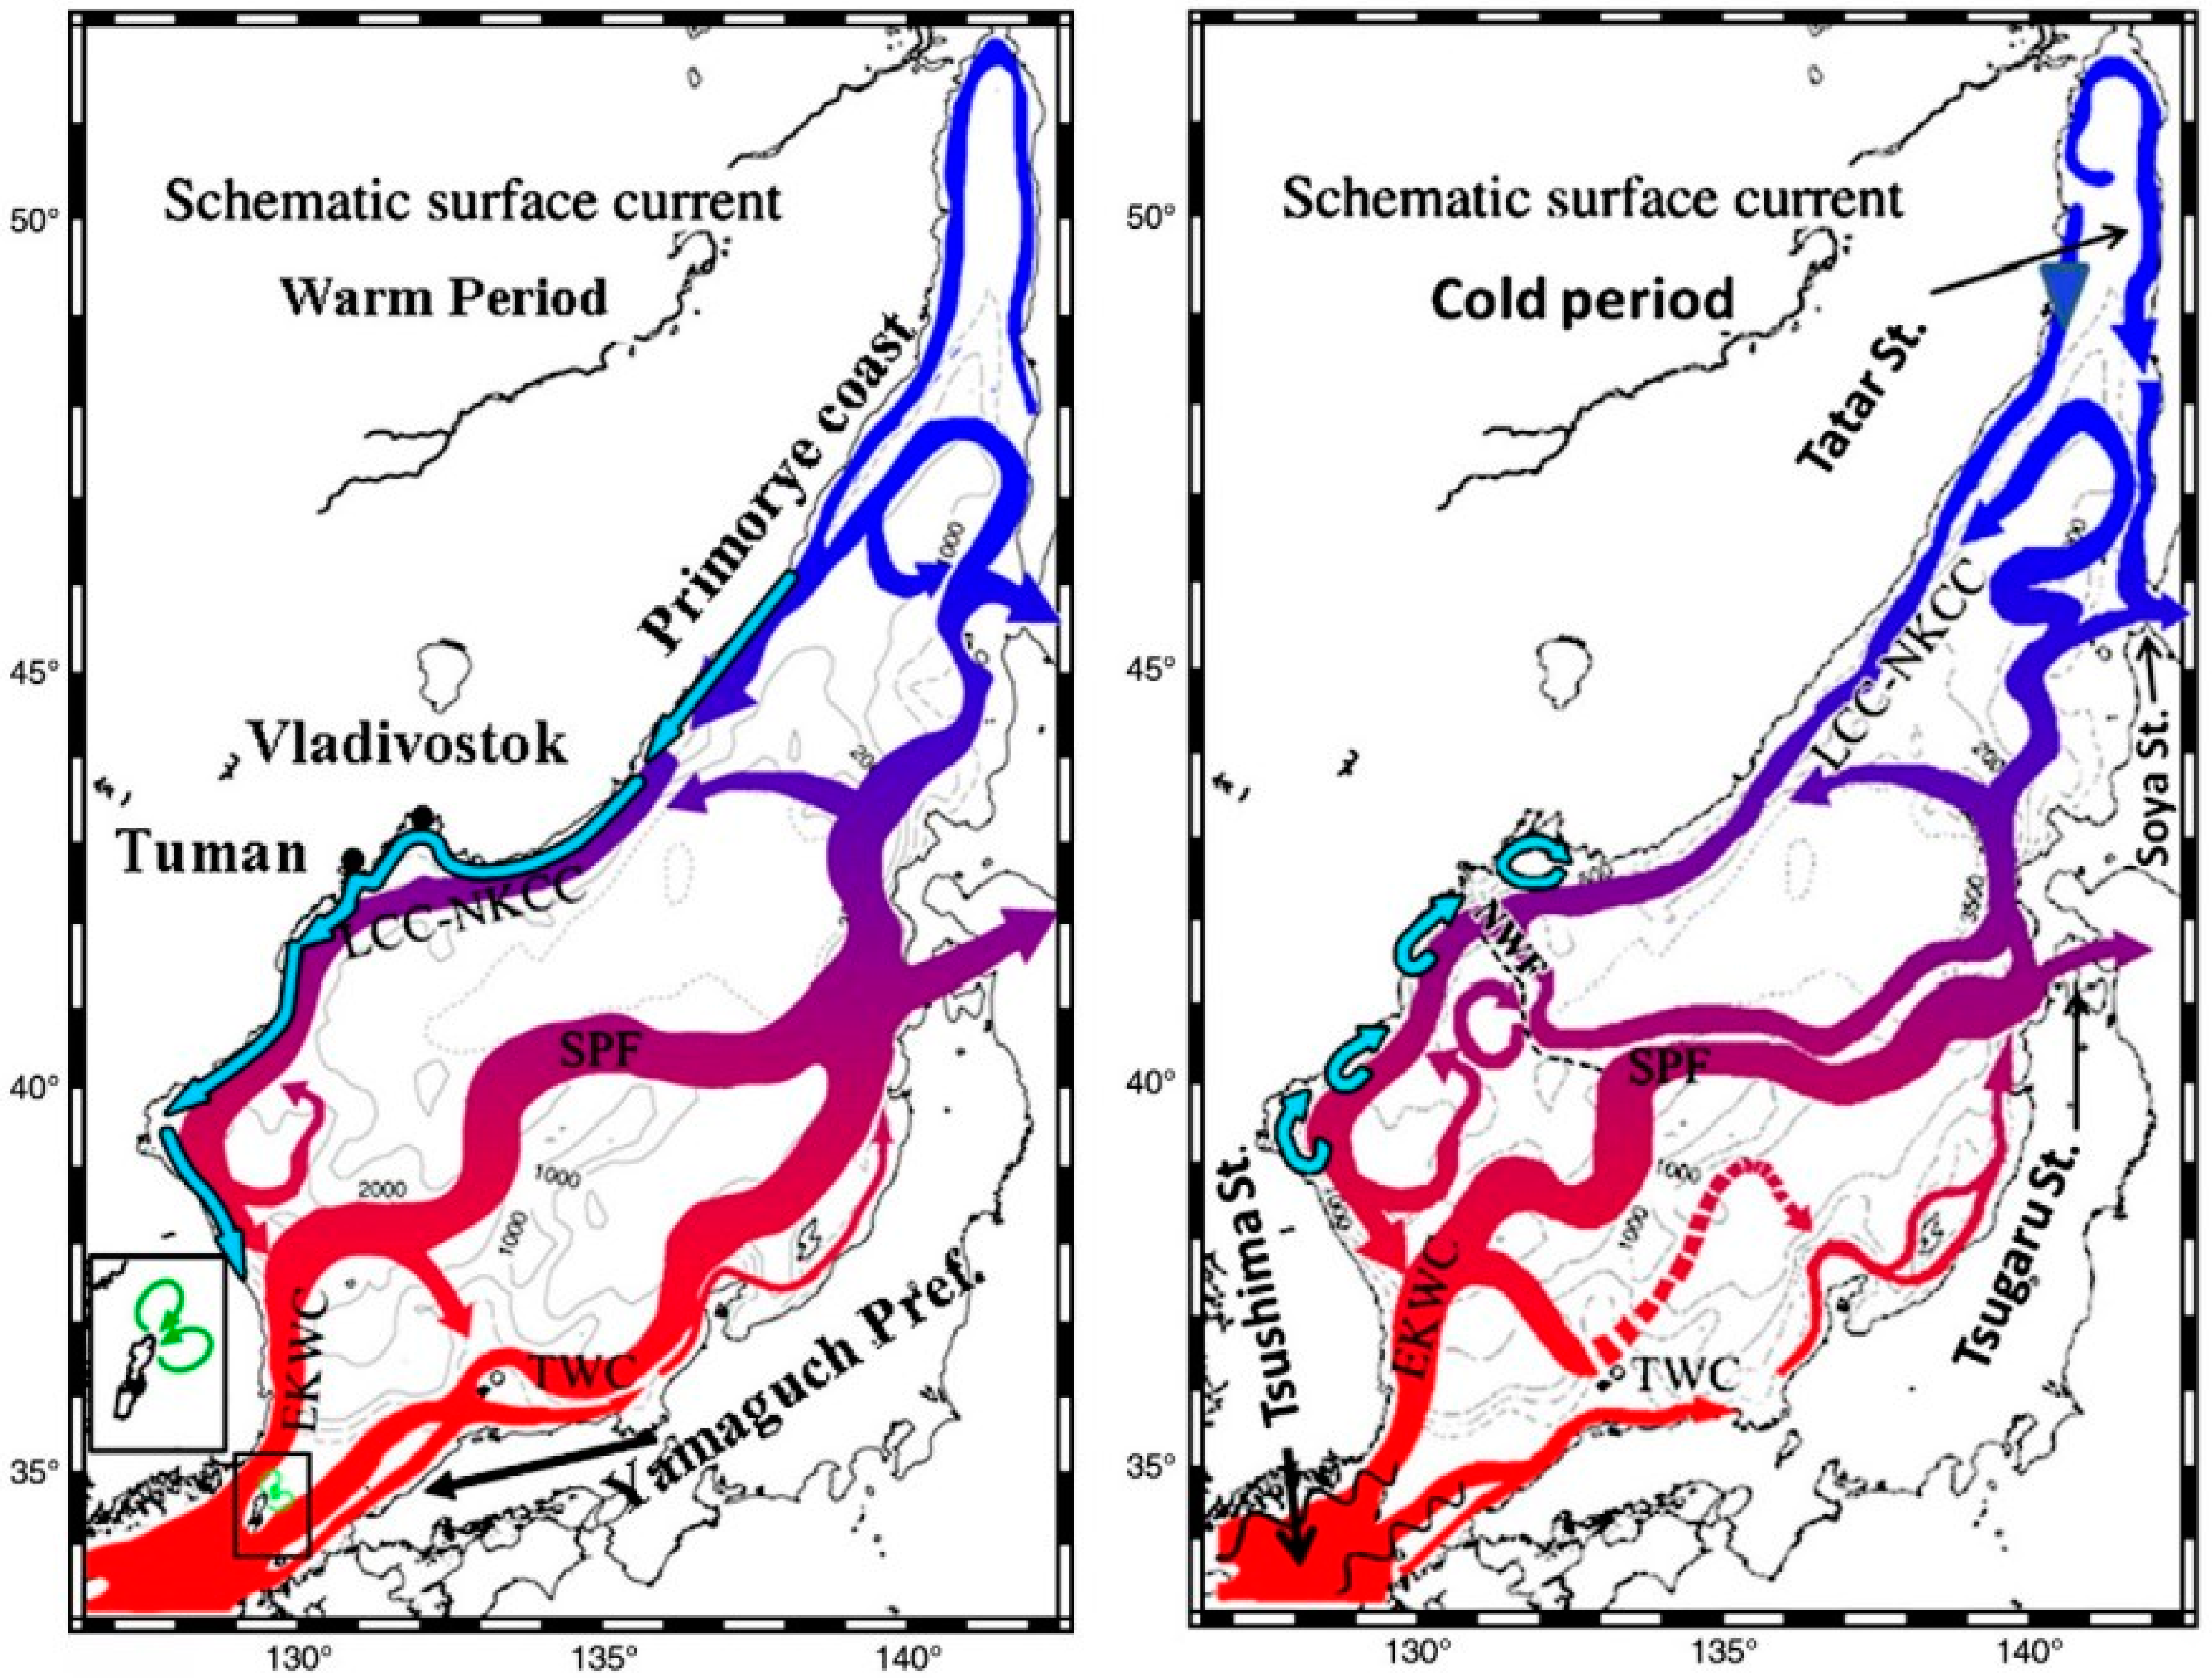
The main elements (Figure 1) of the Japan (East) Sea large-scale water circulation include the cyclonic eddy over the Japan Basin and the main cold and warm currents indicated in published circulation schemes [54,55,56,57,58].
The cold Primorsky current directed to the south-southwest over the Japan Basin continental slope, south of Peter the Great Bay, at latitude 42° N, passes into the cold North Korean Cold Current. Directed from the Korean Strait to the north, the warm East Korean Current turns to the East around the northern slope of the Yamato Rise and splits into two branches. One of the branches is directed east into the Sangar Strait, and the second branch is directed north along the Japan Basin’s eastern slope, carrying the transforming warm salty subtropical waters into the Tatar Strait. Two branches of the warm Tsushima Current [58] transfer subtropical waters from the Korean Strait along the Japan Islands shelf and Yamato Basin slope, respectively, to the Sangar Strait adjacent sea area, where they merge with the East Korean Current and its extensions into the Sangar and Tatar Straits. In the cold season, the shelf branch of the Tsushima current is most stacked out, and the slope branch significantly weakens and degrades north of 39° N.
In the winter, the Cold Liman (Primorsky) Current breaks away from the continental slope near Peter the Great Bay to the east and reaches the East Korean Warm Current at the Yamato Rise slope as a separate jet (Figure 1 from [58] (Figure 2)), strengthening the horizontal gradient of temperature, salinity and density on the subarctic front of the Japan (East) Sea.
The major currents in the Tatar Strait and their seasonal variability are also shown in Figure 1. The Cold Liman (Shrenk) Current directs southward along the continental shelf break all year round, while the West Sakhalin Current changes its direction from the warm period of the year (northward) to the cold period (southward), which has also been confirmed by [59], taking into account the seasonal variability of the mesoscale circulation. In the warm season, the cyclonic mesoscale eddy street is formed over the axis of the Tatar Trough between the Liman (Shrenk) and West Sakhalin Currents. In the cold season, in the Strait usually north of 48° N, the anticyclonic mesoscale eddy street is generated west of the Sakhalin Current jet, while the cyclonic mesoscale eddy street occurs east of the Liman Current jet. The northward countercurrent is formed along the strait between the eddy streets mentioned above [59]. This countercurrent in the near-surface layer is proved by the northward ice drift under a weak wind in the northern part of the Tatar Strait in winter, as shown by [60].
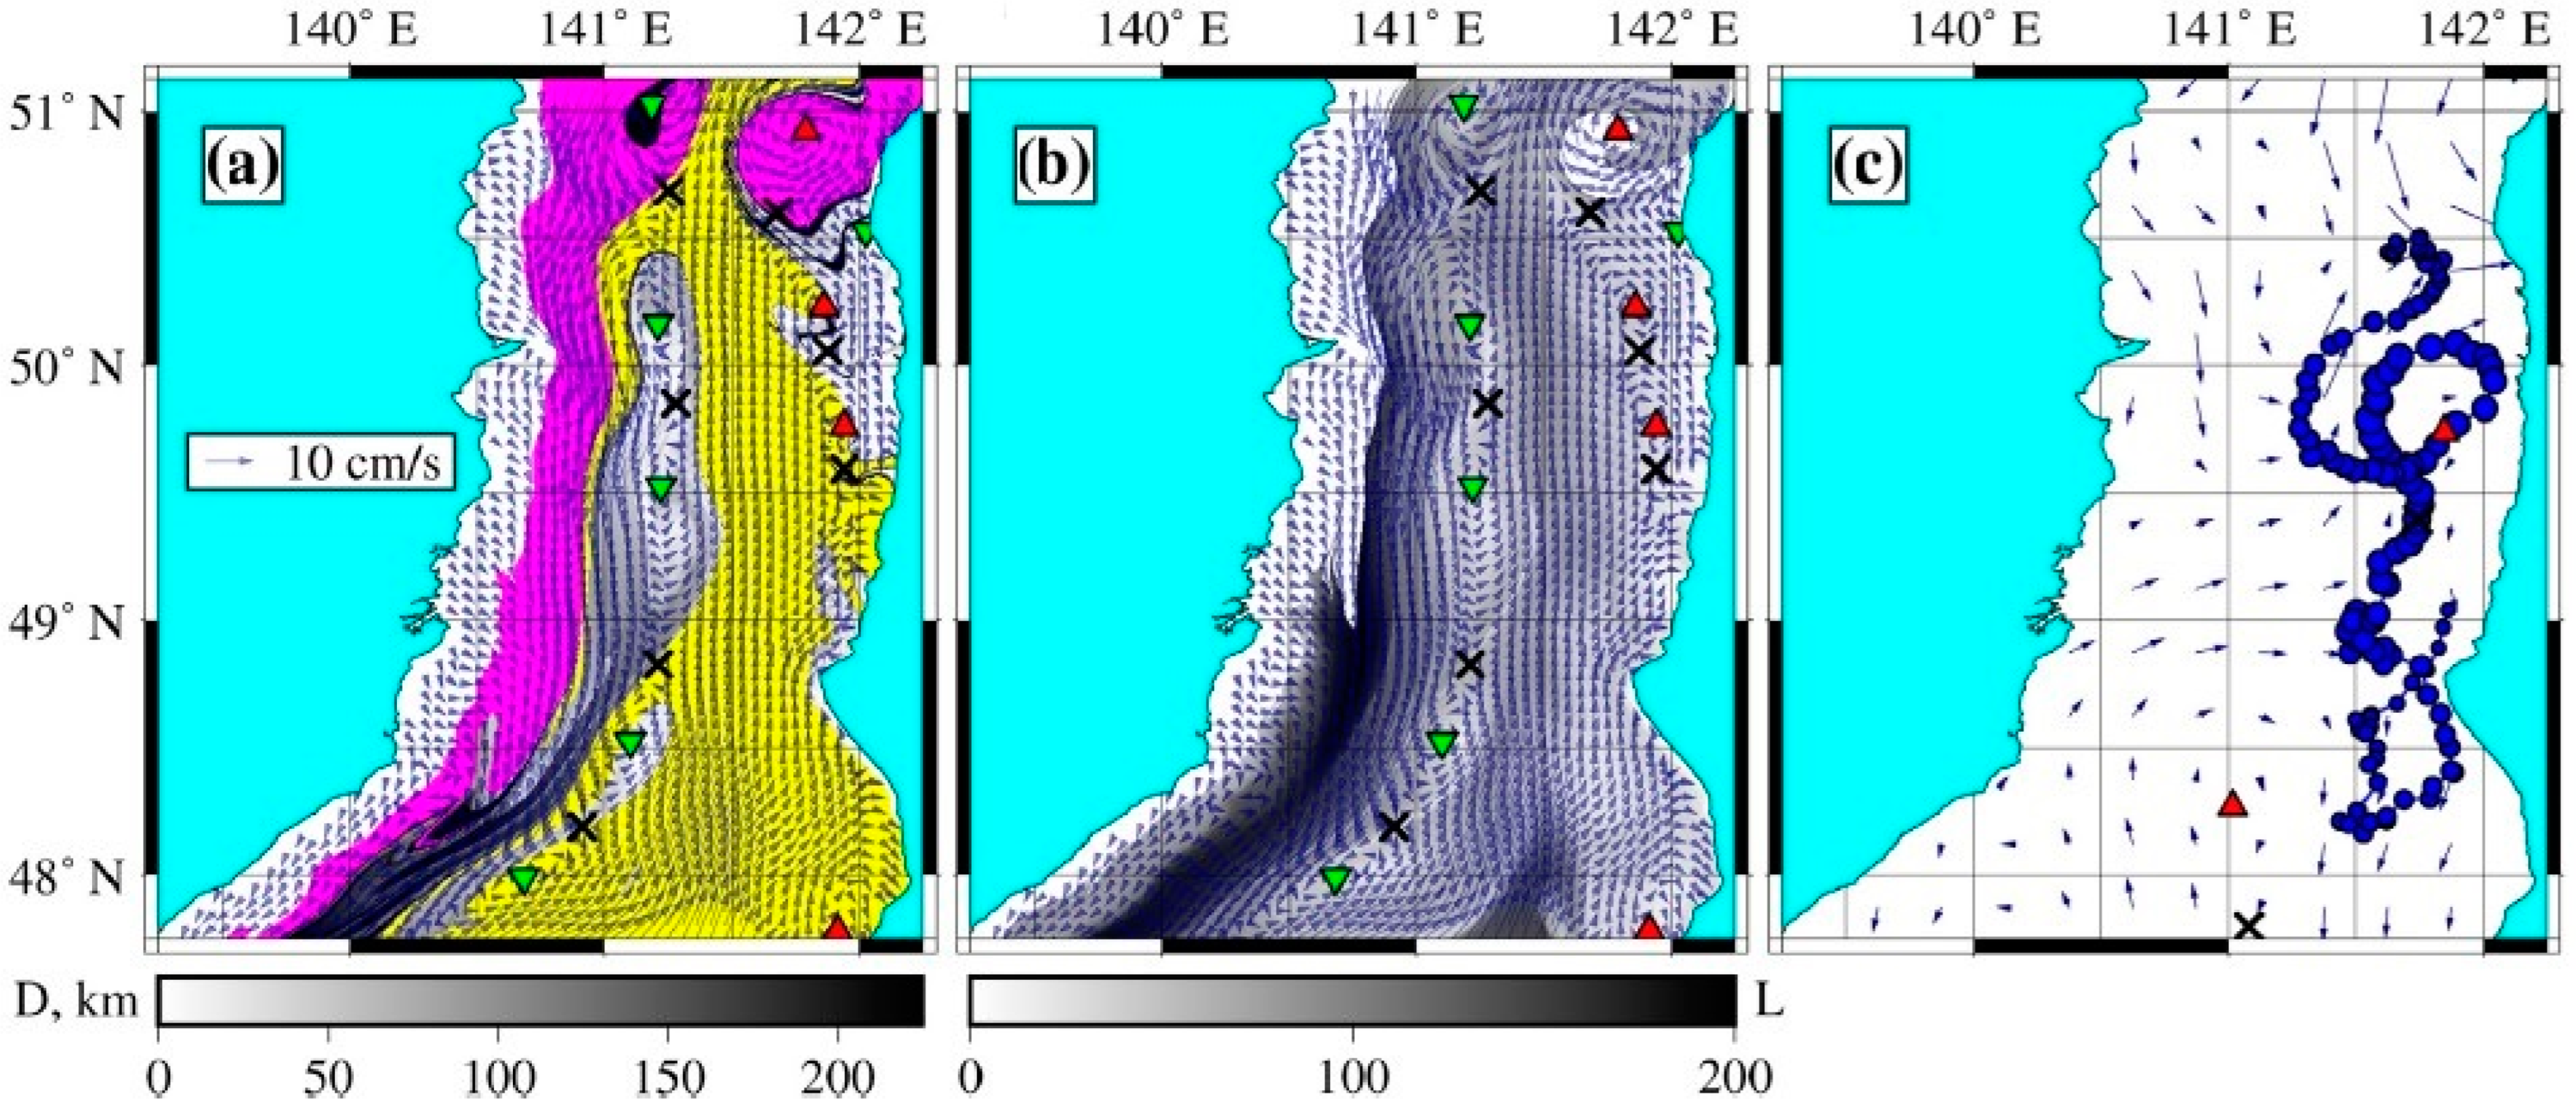
We present the results of backward-time Lagrangian analyses using simulated RIAMOM current velocity fields in the Tatar Strait with the eddy-resolved RIAM Ocean Model output from 1991 to 2000 (Figure 2 is from [59]).
Figure 2 shows that during the warm season, the West Sakhalin Current transports subtropical water, shown in yellow, from the southern border of the Tatar Strait to the north along the western shelf of Sakhalin Island. The Liman (Shrenk) Current carries water along the western continental shelf break from north to south, shown in pink. The Lagrangian maps (Figure 2a,b) show the cyclonic eddies street along the axis of the Tatar Strait (green triangles) and the anticyclonic eddies (red triangles) above the eastern slope of the Tatar Trough adjacent to the Sakhalin Island shelf. The arrows in Figure 2a,b represent the simulated flow velocity field at the 15 m level on 5 September 1994.
The trajectory of drifter No. 67169 in the near-surface sea layer in the summer of 2007 (Figure 2b) confirms the presence of anticyclonic mesoscale eddies over the eastern slope of the Tatar Trough. The figure also shows the velocity field of the geostrophic currents calculated from satellite sea level data (AVISO with a resolution of ¼° on 3 September 2007) [50,59]. This resolution is not enough to obtain mesoscale eddies in the geostrophic velocity field in the Tatar Strait.
The backward-time Lagrangian origin map combined with the D-map in 5 September 1994 (Figure 2a) shows the observed southward transport of low salinity water from the Amur River estuary (Amurskii Liman) and the Nevelskoy Strait mainly along the continental shelf break and particularly along the Sakhalin Island coast in the Northeastern Tatar Strait shelf, where the Amur River water is incorporated into the mesoscale anticyclonic eddy in the latitude band 50°–50°30′ N. The dissolved methane concentration observed in the sub-surface layer (4 m) during the same season and area of the Tatar Strait is shown in the next paragraph.
4. Results and Discussion
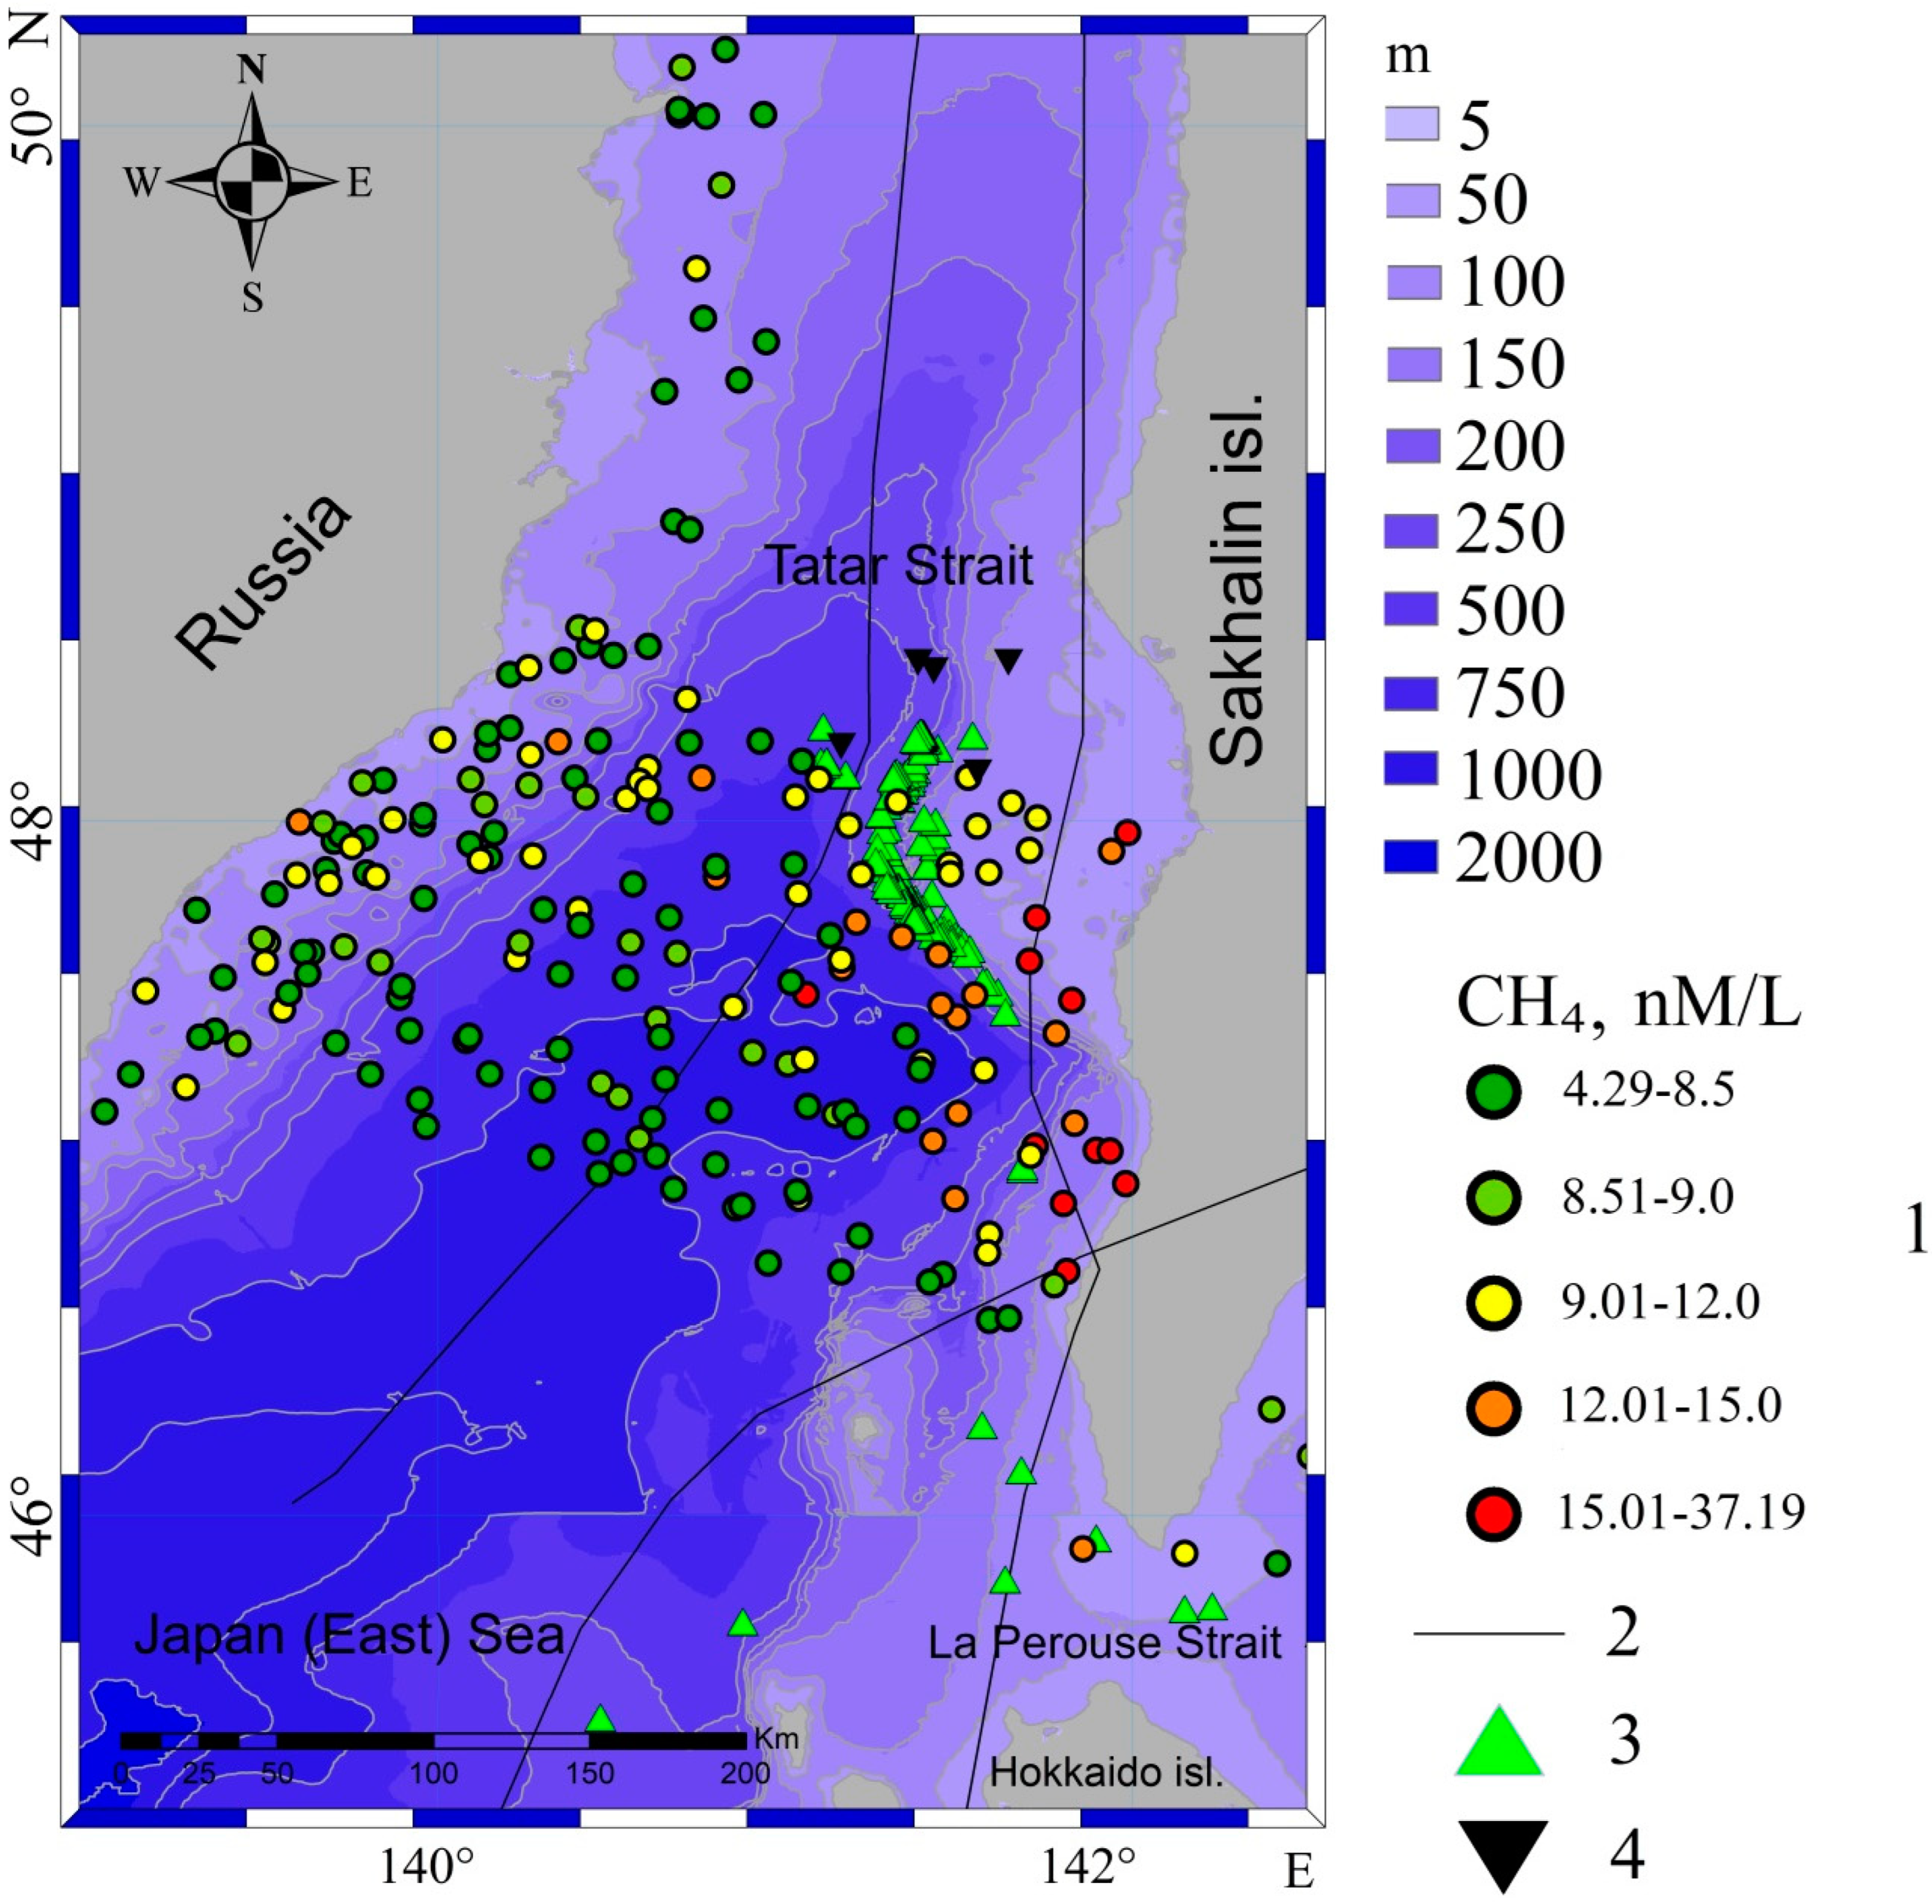
Figure 3 represents the features of the dissolved methane concentration in the near-surface layer of the Tatar Strait and its sources on the sea bed. The range of the surface seawater methane concentrations sampled with a flow-through intake unit at the 4 m horizon was 4.3–37.2 nM/L, with an average value of 8.8 nM/L for cruise 54 of the RV “Akademik Oparin” in October 2017 (OP54). As shown in Figure 3, the highest CH4 (15–37 nM/L) concentrations are typical for the Sakhalin Island shelf zone.
The sources of methane in the Tatar Strait have been investigated, and the data are presented in international research reports and publications [61,62,63,64,65,66,67,68,69,70].
Dissolved or gaseous methane coming from the seabed is transferred to the upper layer of the water column as a result of diffusion with convective flows, as well as during the dissolution of pop-up bubbles and gas hydrates [9,20]. The profile of methane concentration in the water column is generally determined by the mechanisms of its transport and the characteristics of the currents, as well as methane sources.
Acoustic systems are frequently used to study gas seep sites, as they provide broad synoptic observations of processes in the water column. Calculation methods have been developed and applied based on acoustic observations of methane concentrations dissolved in water due to the dissolution of pop-up bubbles [71,72,73]. The obtained research results are consistent with the data of direct measurements of dissolved methane concentrations in the water column [18,71].
Average and low values are mainly observed over the Strait axis and along the continental shelf. Such heterogeneity of methane distribution may be related to its predominant emission from bottom sediments on the Tatar Trough’s eastern slope and the shelf of Sakhalin Island.
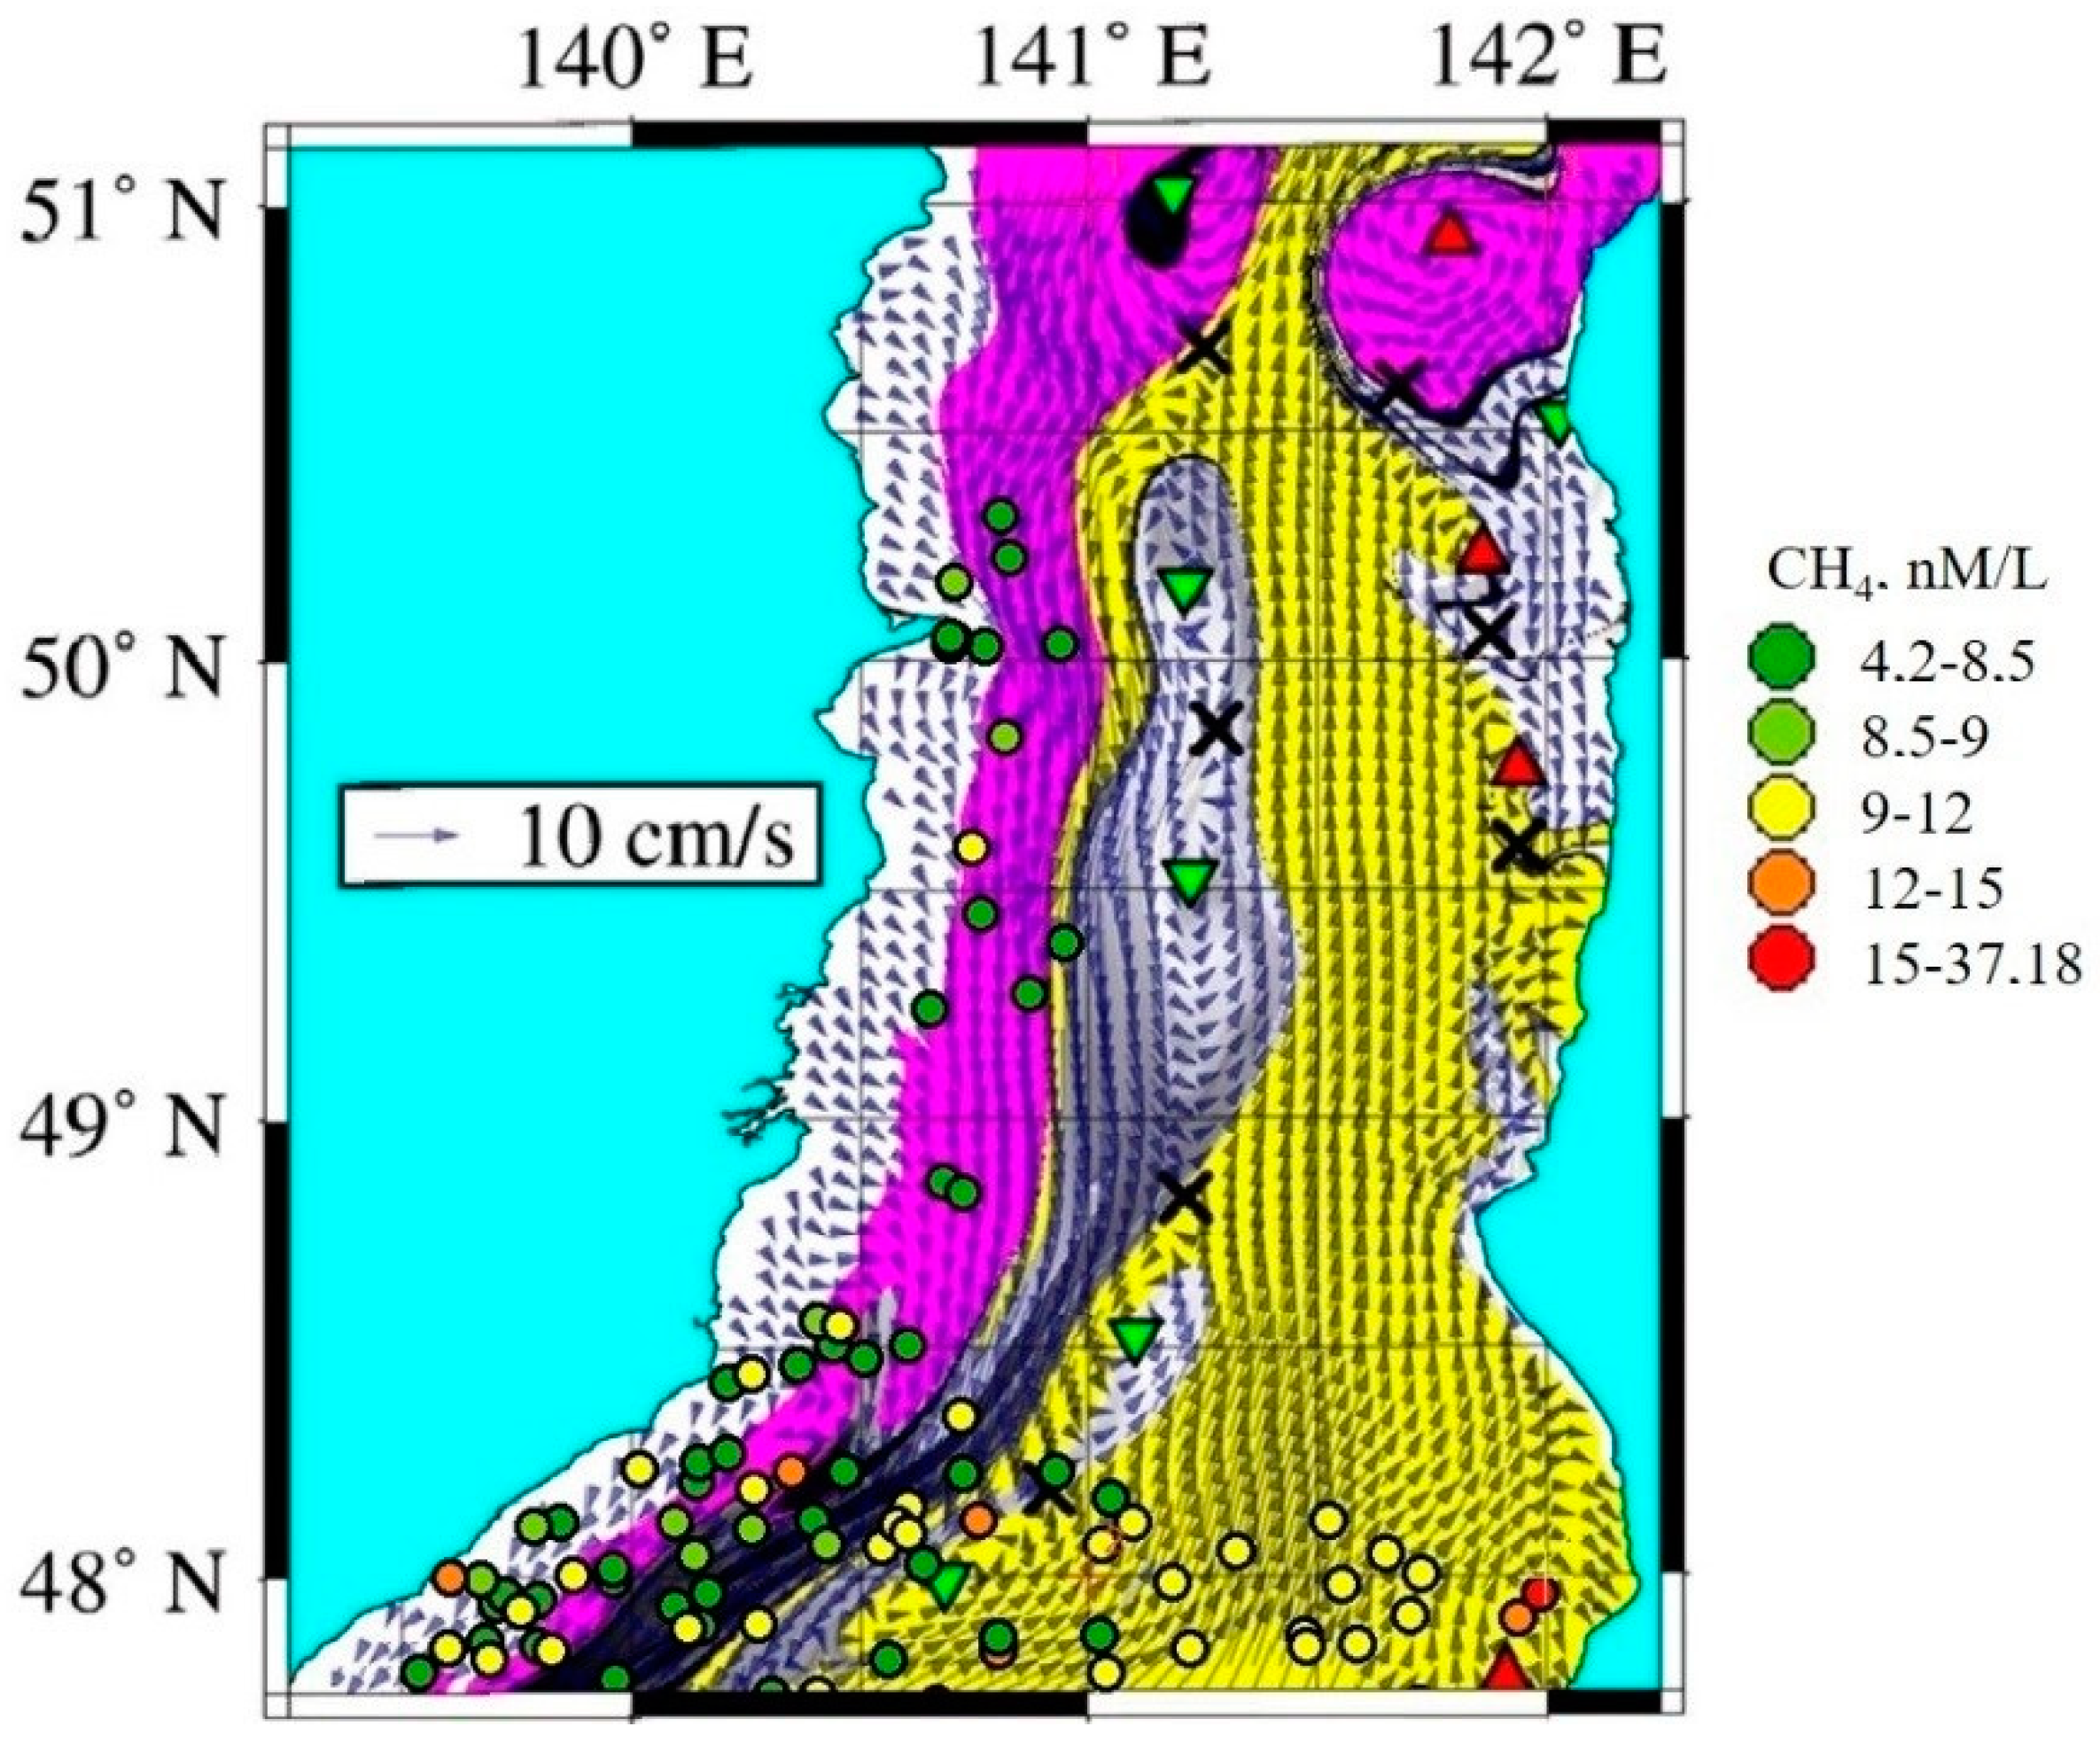
The distribution of the dissolved methane concentration in the near-surface layer could be associated with endogenous methane sources and a system of multiple-scale circulation in the Tatar Strait, resulting in methane advection. As shown in Figure 4, the southeastern Tatar Strait’s waters with a high methane concentration are transported to the north, while the Liman (Shrenk) Current waters carry a much smaller amount of dissolved CH4 from the north to the south of the western part of the Strait.
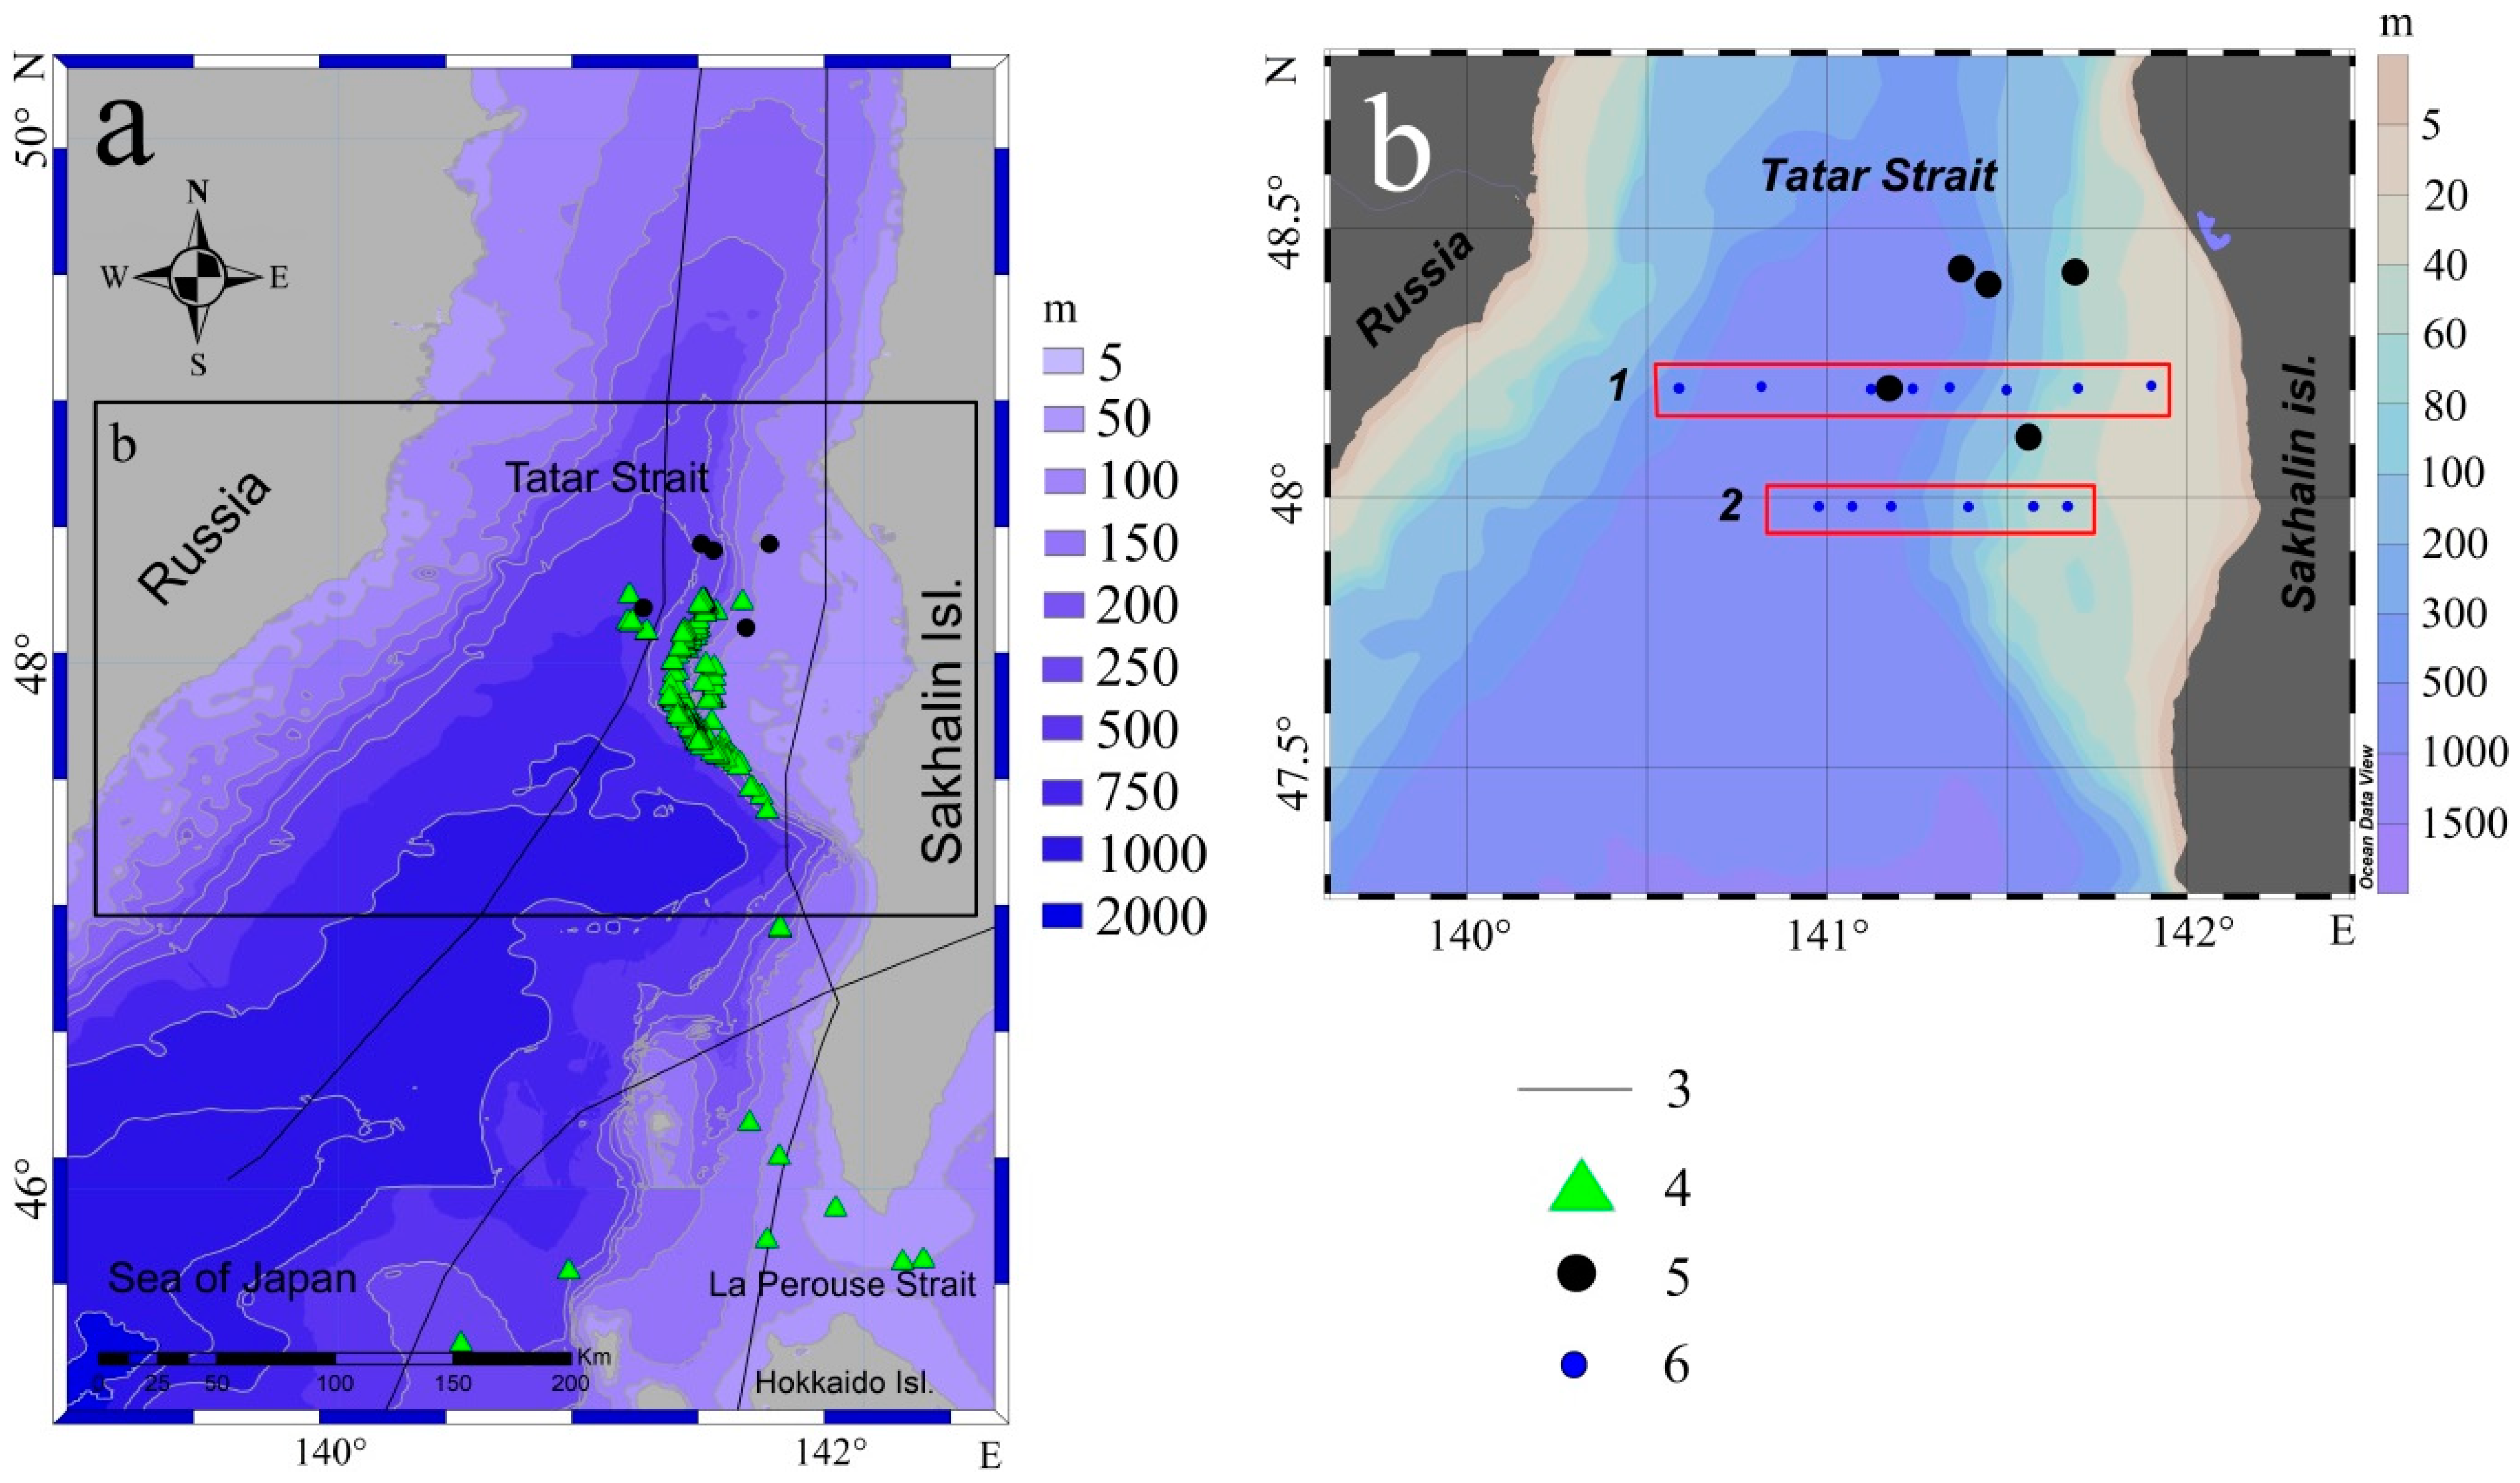
Gas hydrates (black triangles in Figure 3), gas torches (green triangles in Figure 3) and permeability zones located near the areas of influence of tectonic faults (black lines in Figure 3) are probable sources of methane emission to the water masses in the studied area of the Tatar Strait. Two zonal CTD and dissolved methane sections were performed along the parallels 48° and 48.2° N (Figure 5) during the 85th cruise of the RV “Academician M.A. Lavrentiev” in May 2019. In these sections, samples of seawater were taken from rosette bathometers, which were closed during measurements at various horizons from the sea surface to the bottom.
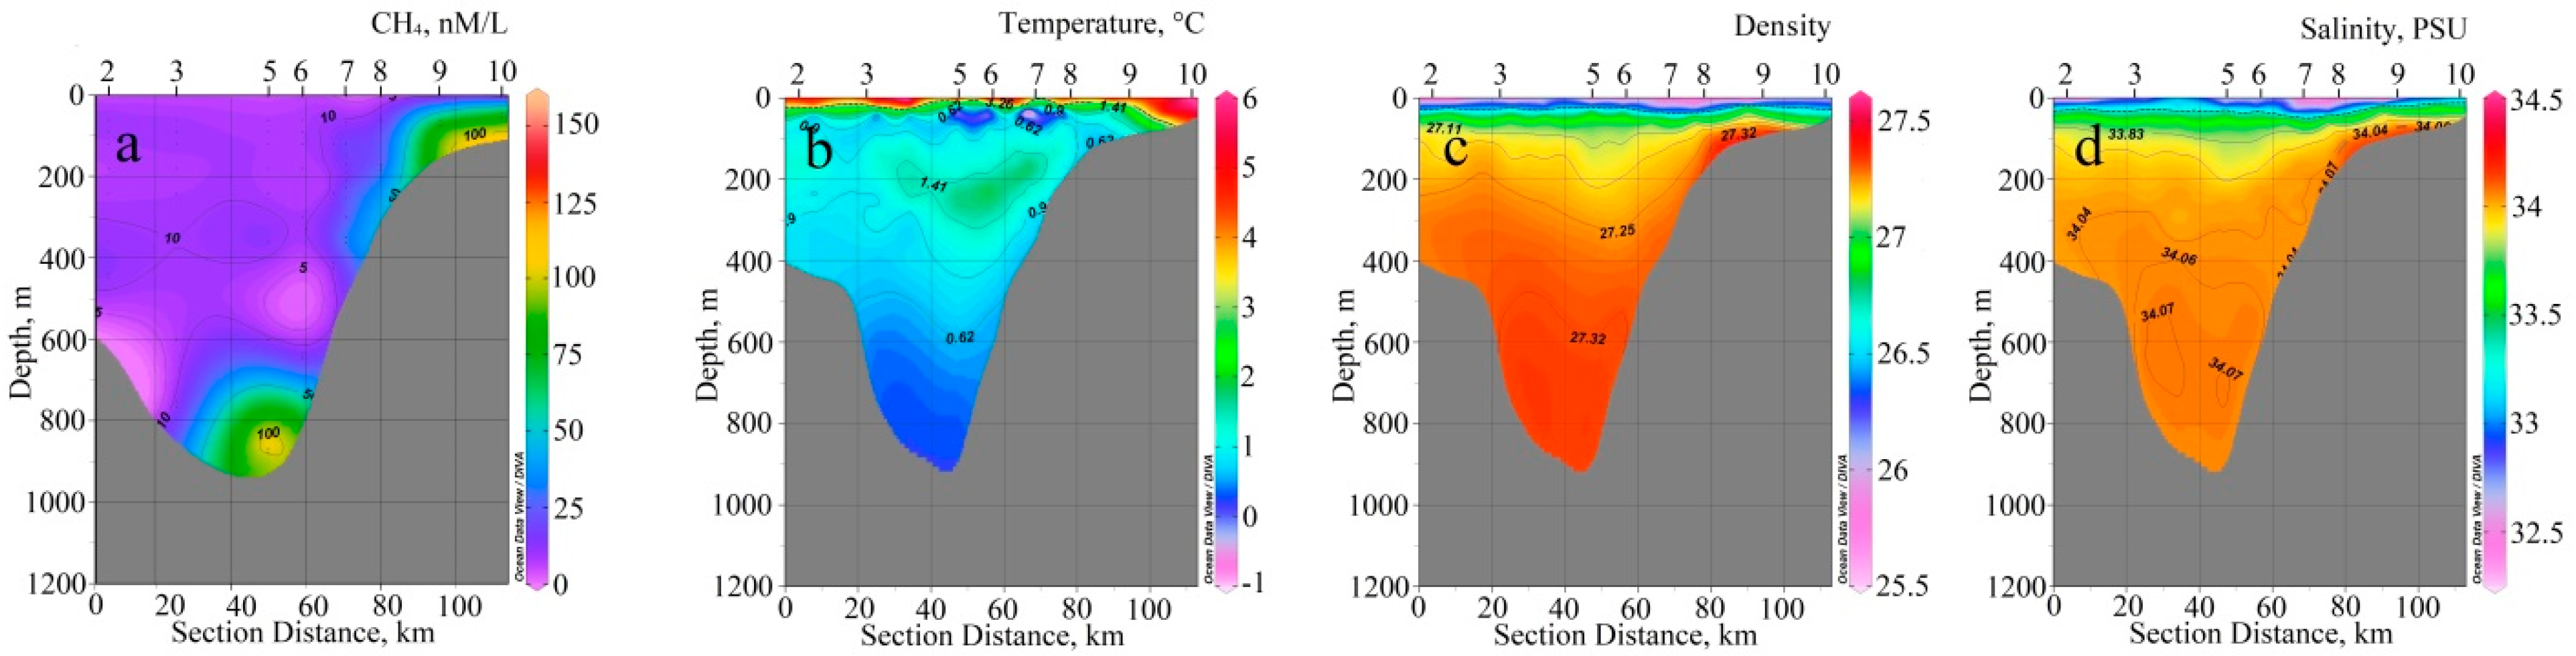
Section 1 (Figure 6a) shows two near-bottom anomalies of high methane concentrations. One is near the Tatar Strait axis (station 5) (124 nM/L) at a depth of 723 m, and the second one is on the Sakhalin Island shelf slope (station 9) (84.4 nM/L) at a depth of 62 m. The near-bottom methane anomaly on the axis of the Tatar Trough could be explained by gas hydrates (location E 141.1619 N 48.21194) found here; their destruction is associated with the release of methane [74].
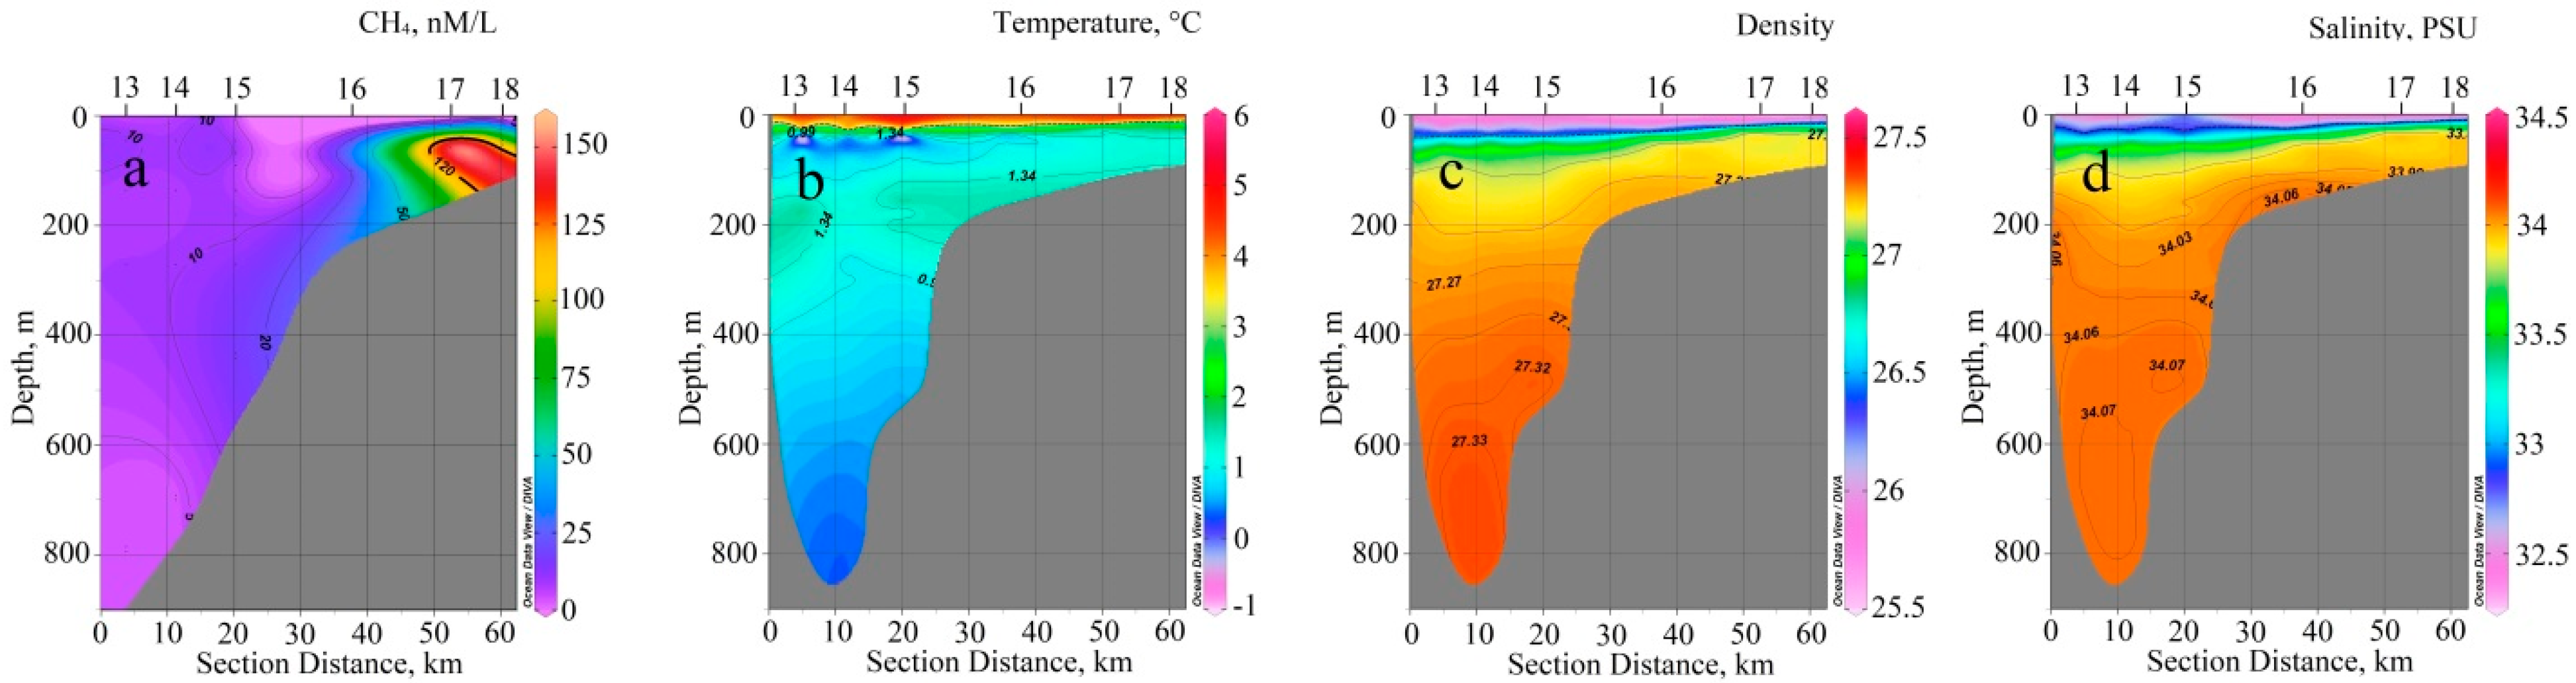
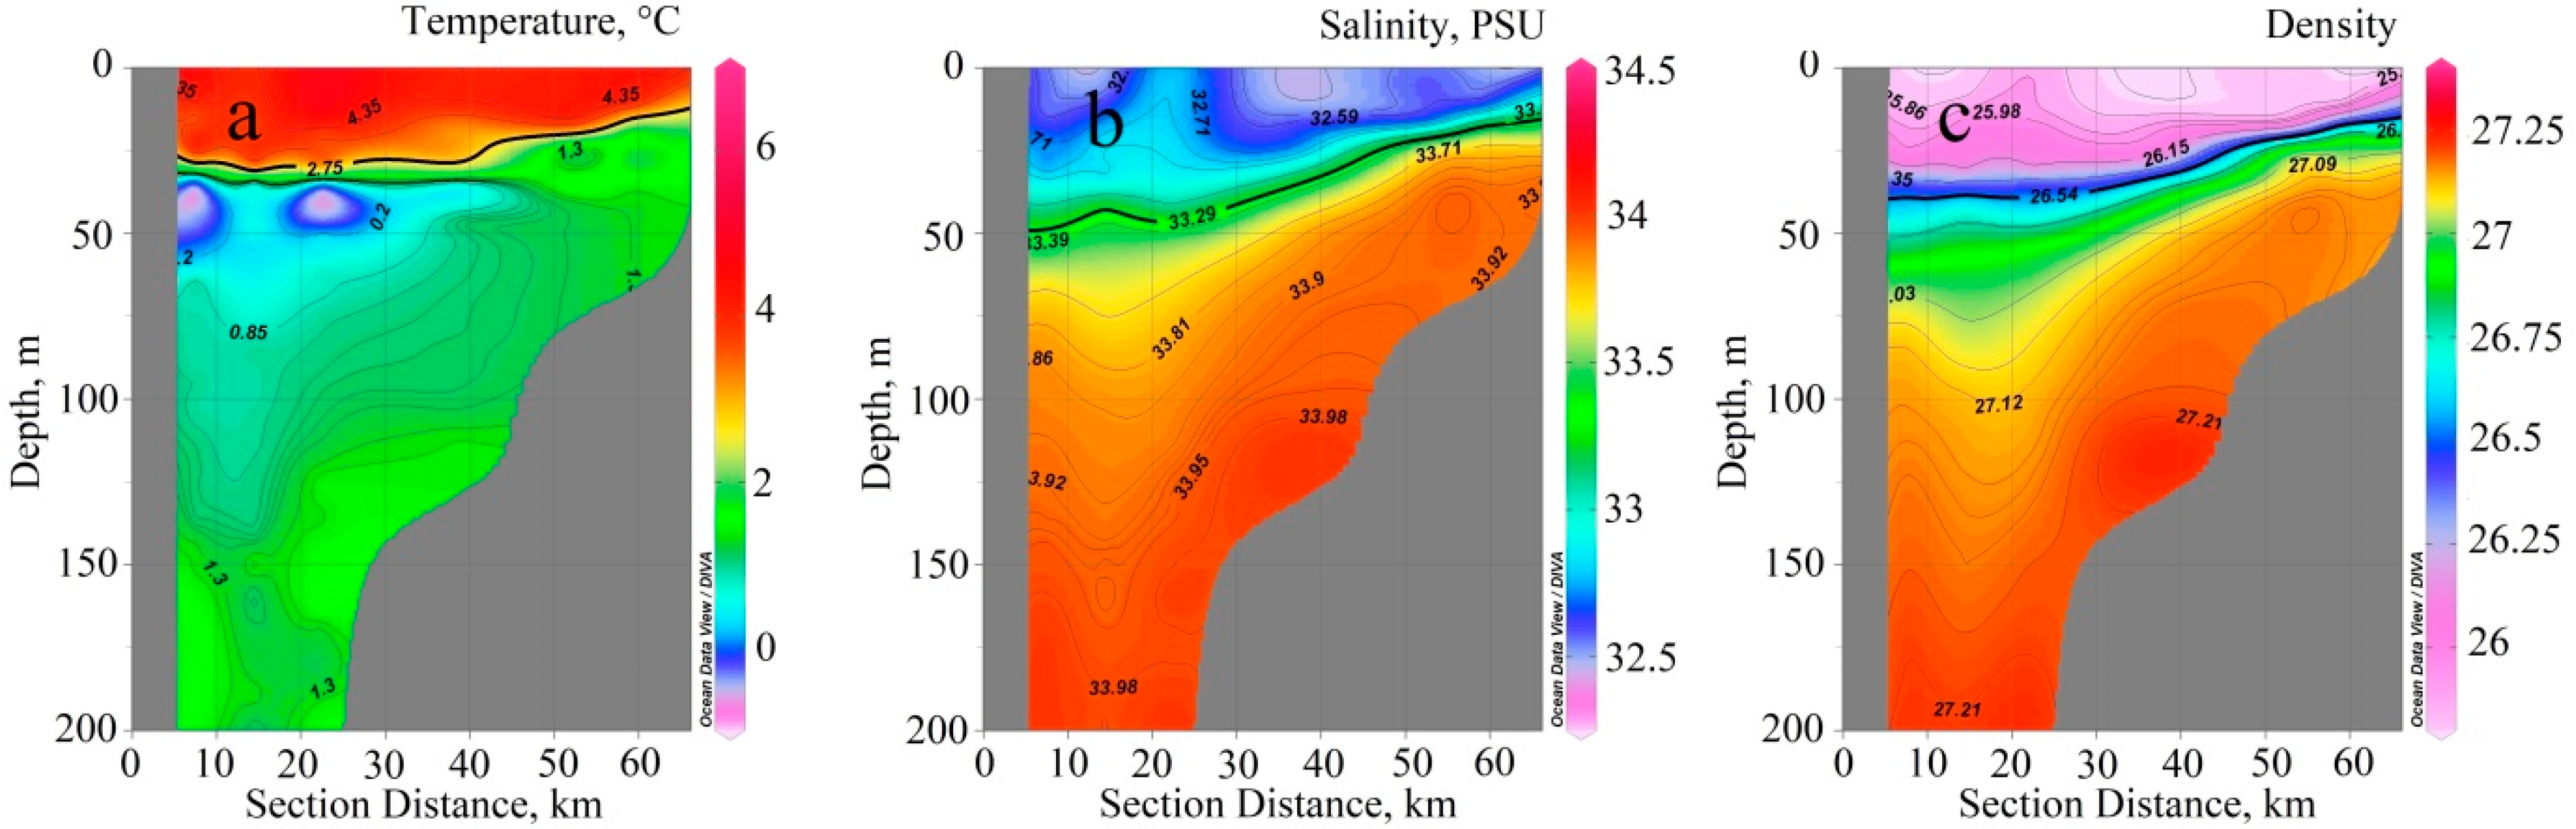
A low dissolved methane concentration (10 nM/L) was observed in the offshore part of the southern Section 2, basically in the deep and bottom layers at stations 13 and 14 of the LV 85 cruise, as well as within the upper 100 m layer at stations 15 and 16 (Figure 7a). A high methane concentration zone with a maximum value of 155.6 nM/L was found at the same Section 2 on the Sakhalin Island shelf slope at a depth of 75 m and 65 m at stations 17 and 18, respectively (Figure 7a). This zone is observed in the total layer from the bottom up to the seasonal pycnocline (lower boundary of the upper mixed layer) at the 25 m level (Figure 6b–d and Figure 7b–d).
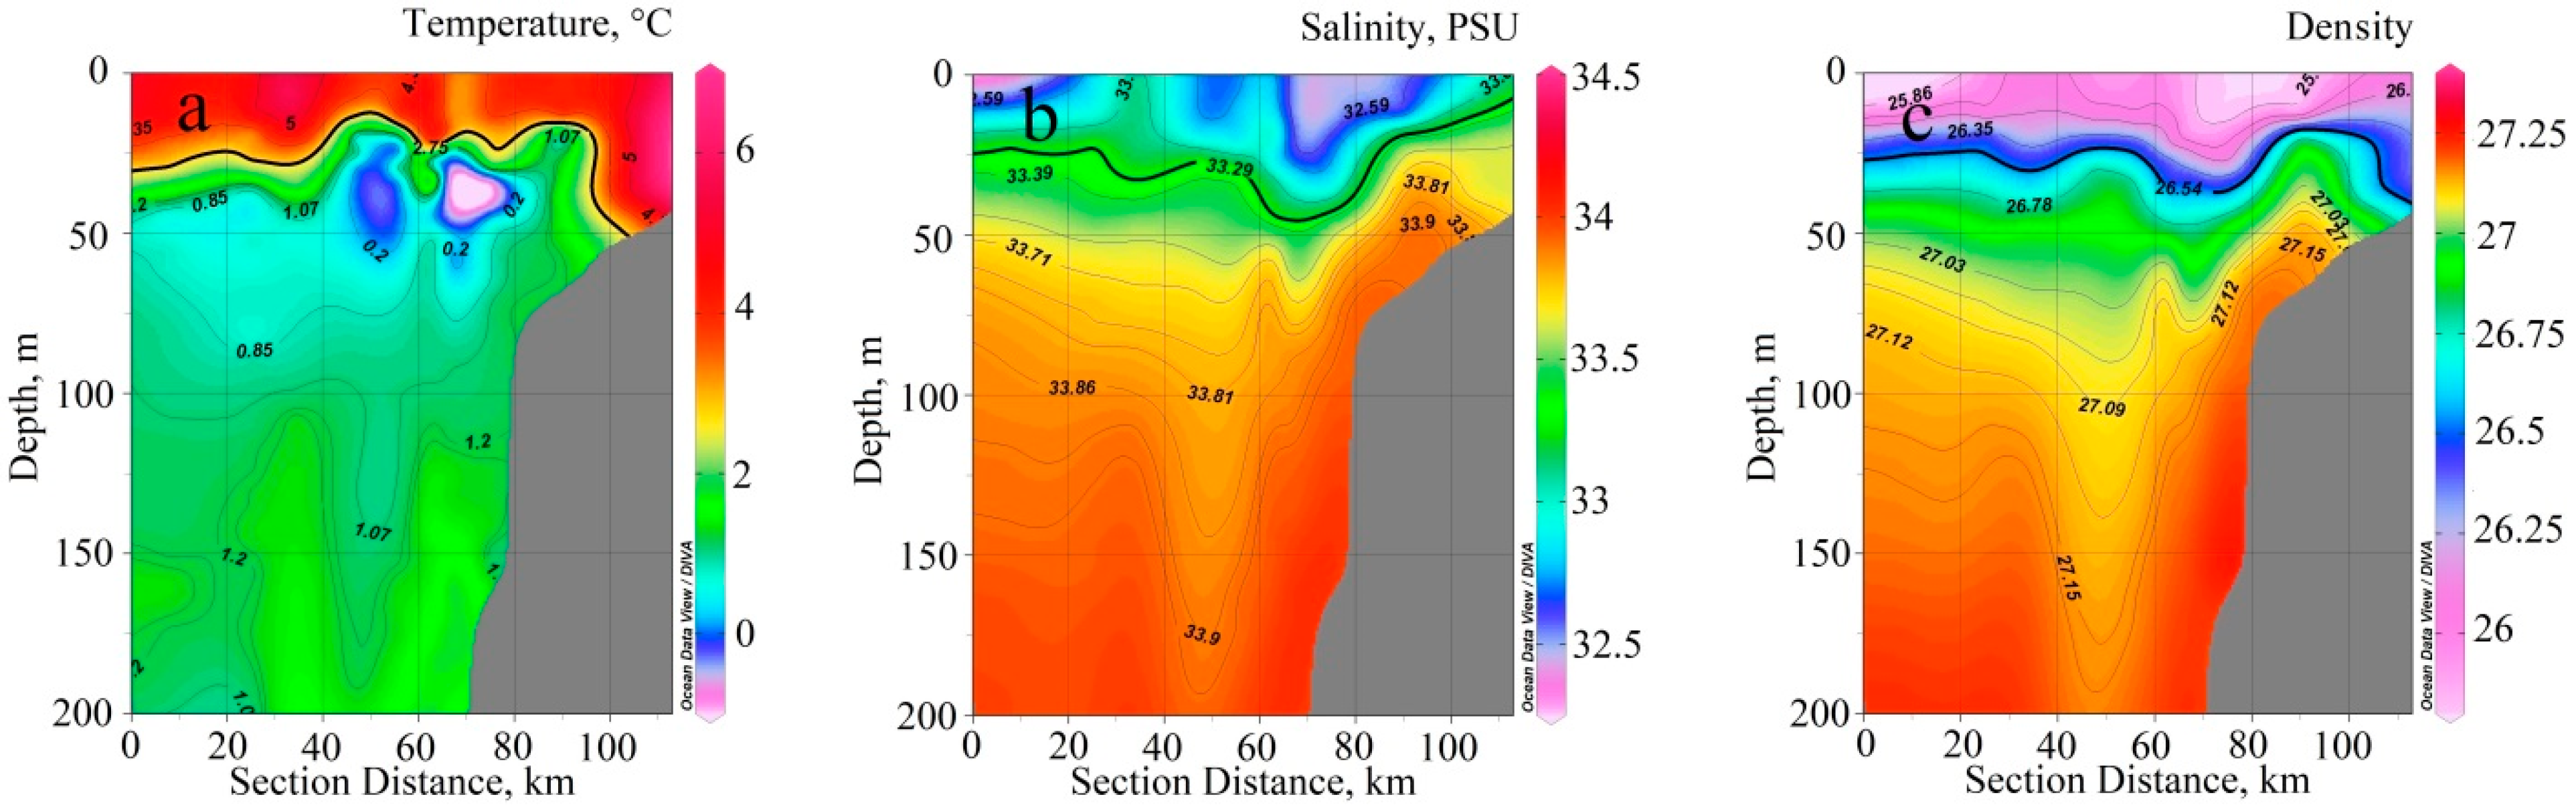
Figure 8 and Figure 9 show the northern and southern sections of the temperature, salinity and density in the water layer 0–200 m. This scale enables the determination of the seasonal pycnocline. The temperature (Figure 8a and Figure 9a), salinity (Figure 8b and Figure 9b) and density (Figure 8c and Figure 9c) sections also indicate the mesoscale eddies mentioned above.
Significant lithospheric methane sources providing CH4 to the bottom waters of the Tatar Strait are both the degassing of the lithosphere, manifested in the form of gas emissions in the zone of influence of tectonic faults, and the release of methane during the destruction of gas hydrates [75,76]. The results of gas-geochemical studies of the Tatar Strait bottom sediments are presented in [6,15,77]. The sources of gas-geochemical anomalies in the bottom sediments of the Tatar Strait can be gas-generating sedimentary strata, metamorphogenic and magmatic gases that characterize the modern tectonic activity of the research area. The migration of gases along faults creates anomalies in bottom sediments and, under favorable thermobaric conditions, can lead to the formation of gas hydrate accumulations. Indicators of gas-fluid manifestations in the Tatar Strait are high-anomaly concentrations of methane (up to 196,000 ppm) and its homologues in the lower interval of cores, as well as the accompanying anomalies of carbon dioxide, hydrogen and helium fixation and the development of hydrocarbon-oxidizing microbial communities [78,79].
The deep fluid is also evidenced by specific microbial communities identified in the cores of gas-saturated sediments [7]. In gas-geochemical terms, the Tatar Strait is a continuation of the active zone of lithospheric degassing, volcanism and metamorphism manifestations within the coastal shelf of the Sea of Japan.
The maximum methane concentrations in bottom sediments were found in the eastern and northeastern parts of the South Tatar sedimentary basin, as well as along the Sakhalin Island shelf slope. Elevated methane concentrations in the upper layer of sedimentary rocks characterize this region as a fluid-conducting hydrocarbon gas emission zone and also indicate the presence of large-scale deep sources. The methane source feeding this largest anomaly in the Tatar Strait (Figure 6a) could also stem from gas hydrate (found earlier in the bottom sediment layer at the same point E 141.5547; N 48.13583) destruction [6,68,74,77].
The seawater bottom layer in northern Section 1 (station 9), approximately the same thickness as that of southern Section 2, contains a local maximum methane concentration of 84.4 nM/L. At the same time, the local methane concentration maximums for the northern section are about two times less than for the southern section (the distance between the sections is 22 km). Methane is likely to be transported from the Section 2 bottom source along the shelf to the north by the West Sakhalin Current, which is well expressed in the warm season [58,59], as shown in Figure 6 and Figure 7. The methane concentration decreases as it moves away from its source. The seasonal pycnocline significantly prevents the spread of methane into the upper mixed layer.
Methane enters the marine environment near fluid-conducting geological structures, where it is spread under the influence of water mixing and is carried by currents. Released lithospheric CH4 enters the seawater bottom layer in the southeastern part of the Tatar Trough deep area and the Sakhalin Island shelf, where in the warm period, the dissolved methane is transported by the East Sakhalin Current to the north and been incorporated into the multiple-scale circulation (Figure 6 and Figure 7).
In the same way, dissolved methane is transported from its any source (including those in the Korean Strait) by currents almost throughout the Japan Sea. In the Tsushima basin area, deep-sea drilling revealed methane accumulations in the bottom sediment [79]. Acoustic methods detected blots and a gas-saturated bottom sediment layer with a 90 m thickness [80]. The authors of [81] describe the signs of the presence of gas hydrates in bottom sediments. The papers [82,83] are devoted to the methane-producing microorganisms that contribute to the methane debit in this area. In addition, the waters of the East China Sea, which contain dissolved methane [84,85] enter the Japan (East) Sea (JES) through the Korean Strait and are incorporated into the JES current system (Figure 1).
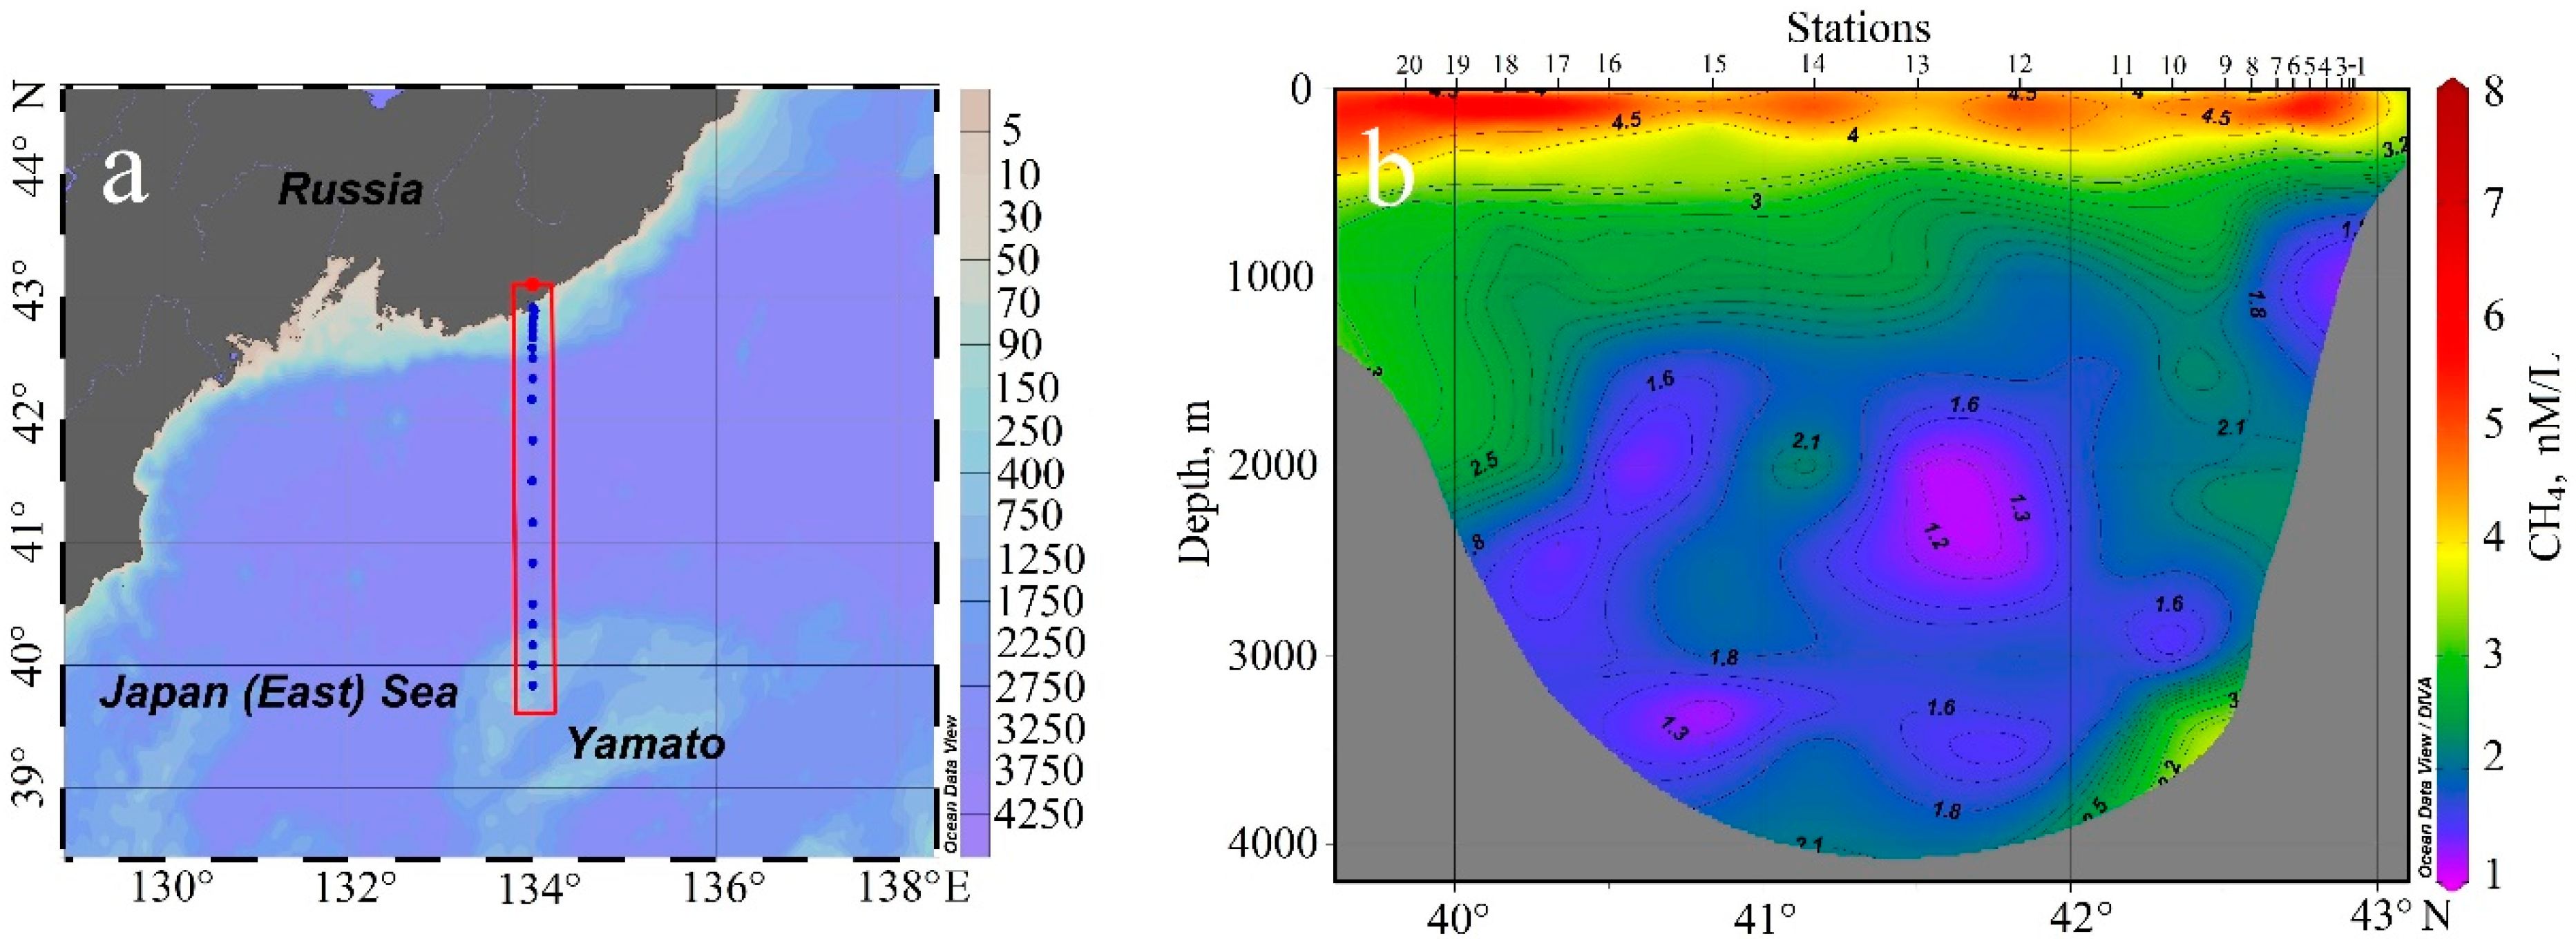
During the 54th cruise of the RV “Akademik Oparin” (OP54) in October 2017, CTD and dissolved methane measurements were made along 134° E from the Yamato Rise to the continental slope of the Japan Basin (20 oceanographic stations) in the central part of the Japan (East) Sea. Seawater was sampled with bathometers at various horizons (in the deep part of the basin up to 13 samples) from the sea bottom layer to the sub-surface layer.
Figure 10 shows the dissolved seawater methane concentration, temperature and salinity distribution from the surface to the bottom of this meridional section, indicating the sampling stations on 24–27 October 2017. In its northern part, the section crosses the Cold Liman (Primorsky) Current, and in the southern part, the section crosses the East Korean Warm Current (Figure 1) over the Yamato Rise slope.
Low methane concentrations (less than 1.5 nM/L) in the cold subarctic waters of the Liman (Primorsky) Current were found over the continental slope (Figure 10a) in the 750–1500 m layer (Figure 10b) at northern oceanographic stations 1–6. In the southern part of this section (stations 18–20 in Figure 10b), the Cold Liman (Primorsky) Current accompanies the Korean Warm Current, where the methane concentration is higher (2.5 nM/L) in the 750–2000 m layer.
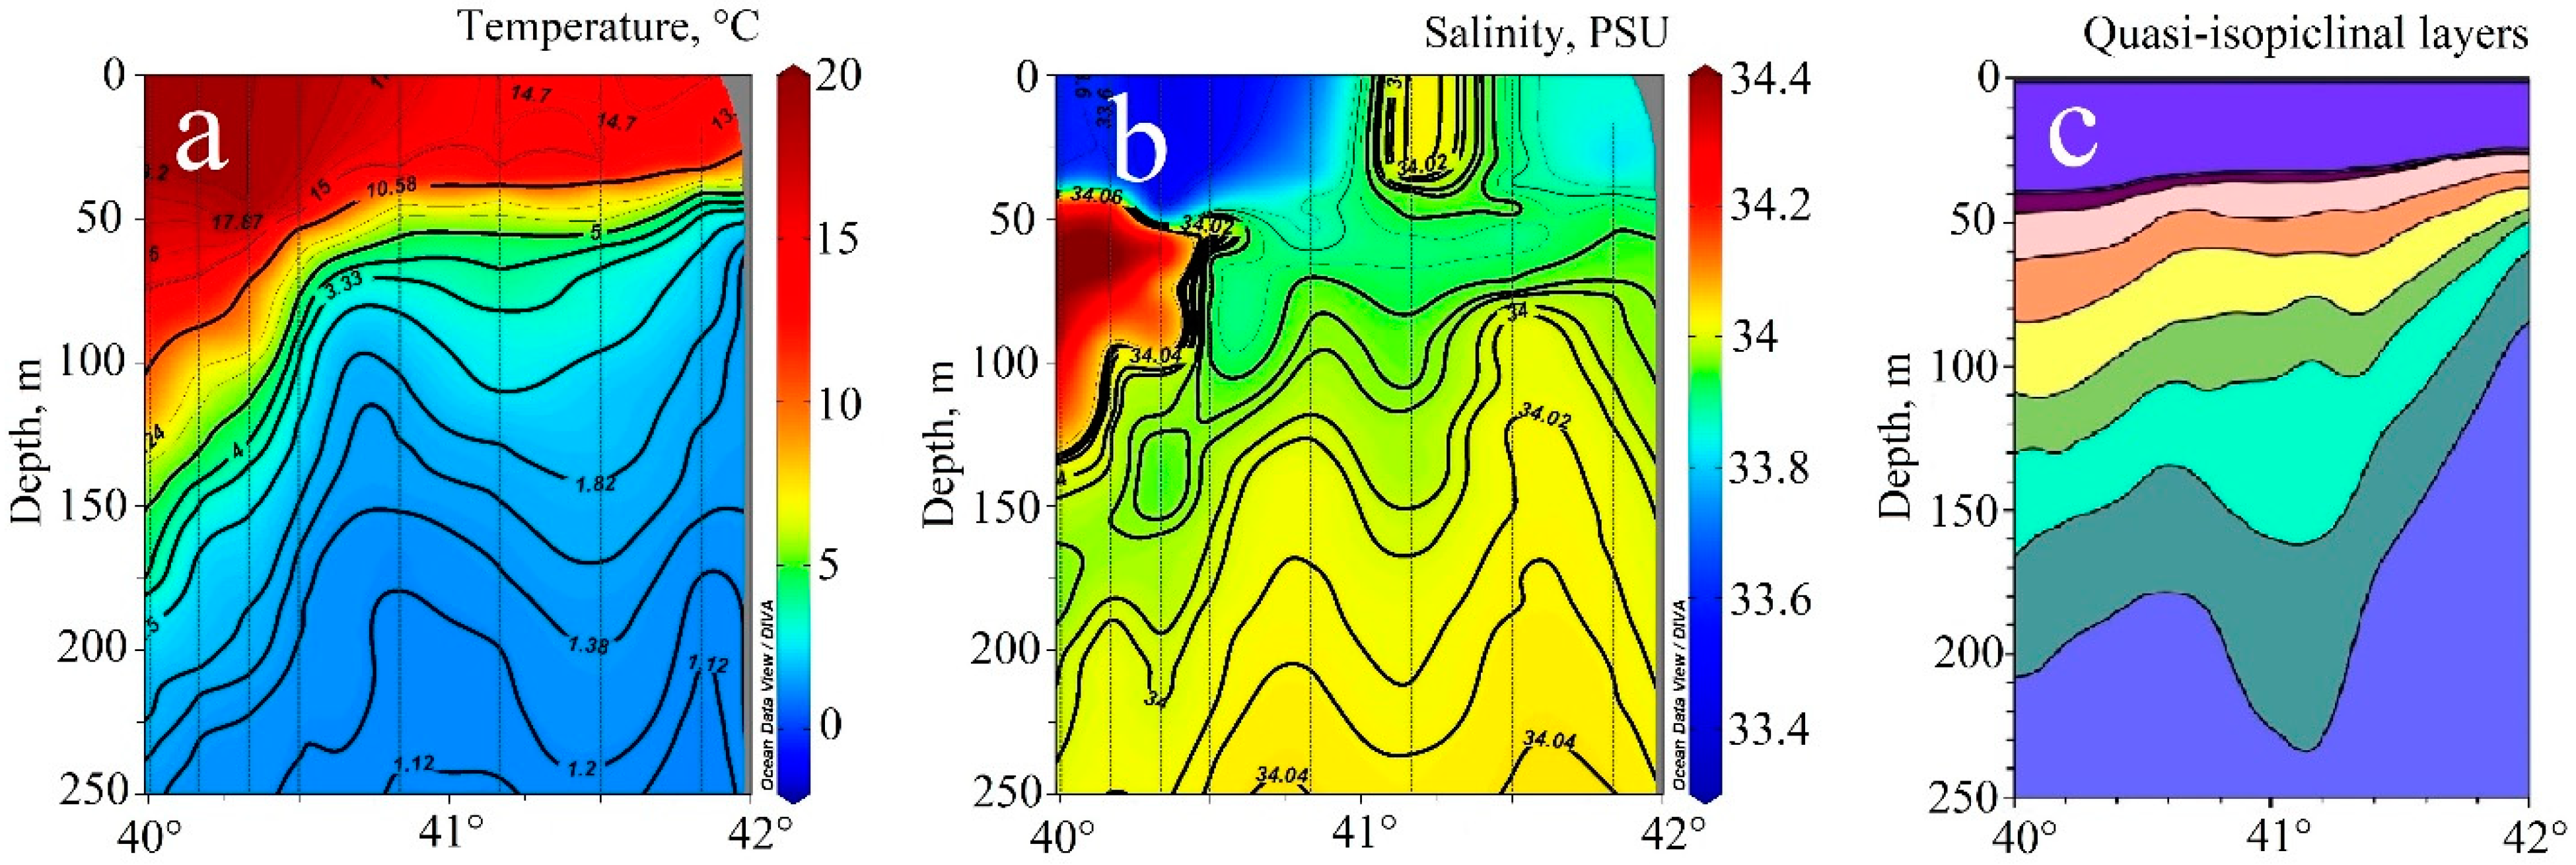
The meridional salinity section in Figure 11b shows the core of the mesoscale anticyclonic eddy located in the latitude zone 41°–41.5° N. This quasi-stationary eddy has been observed in this area before [86,87].
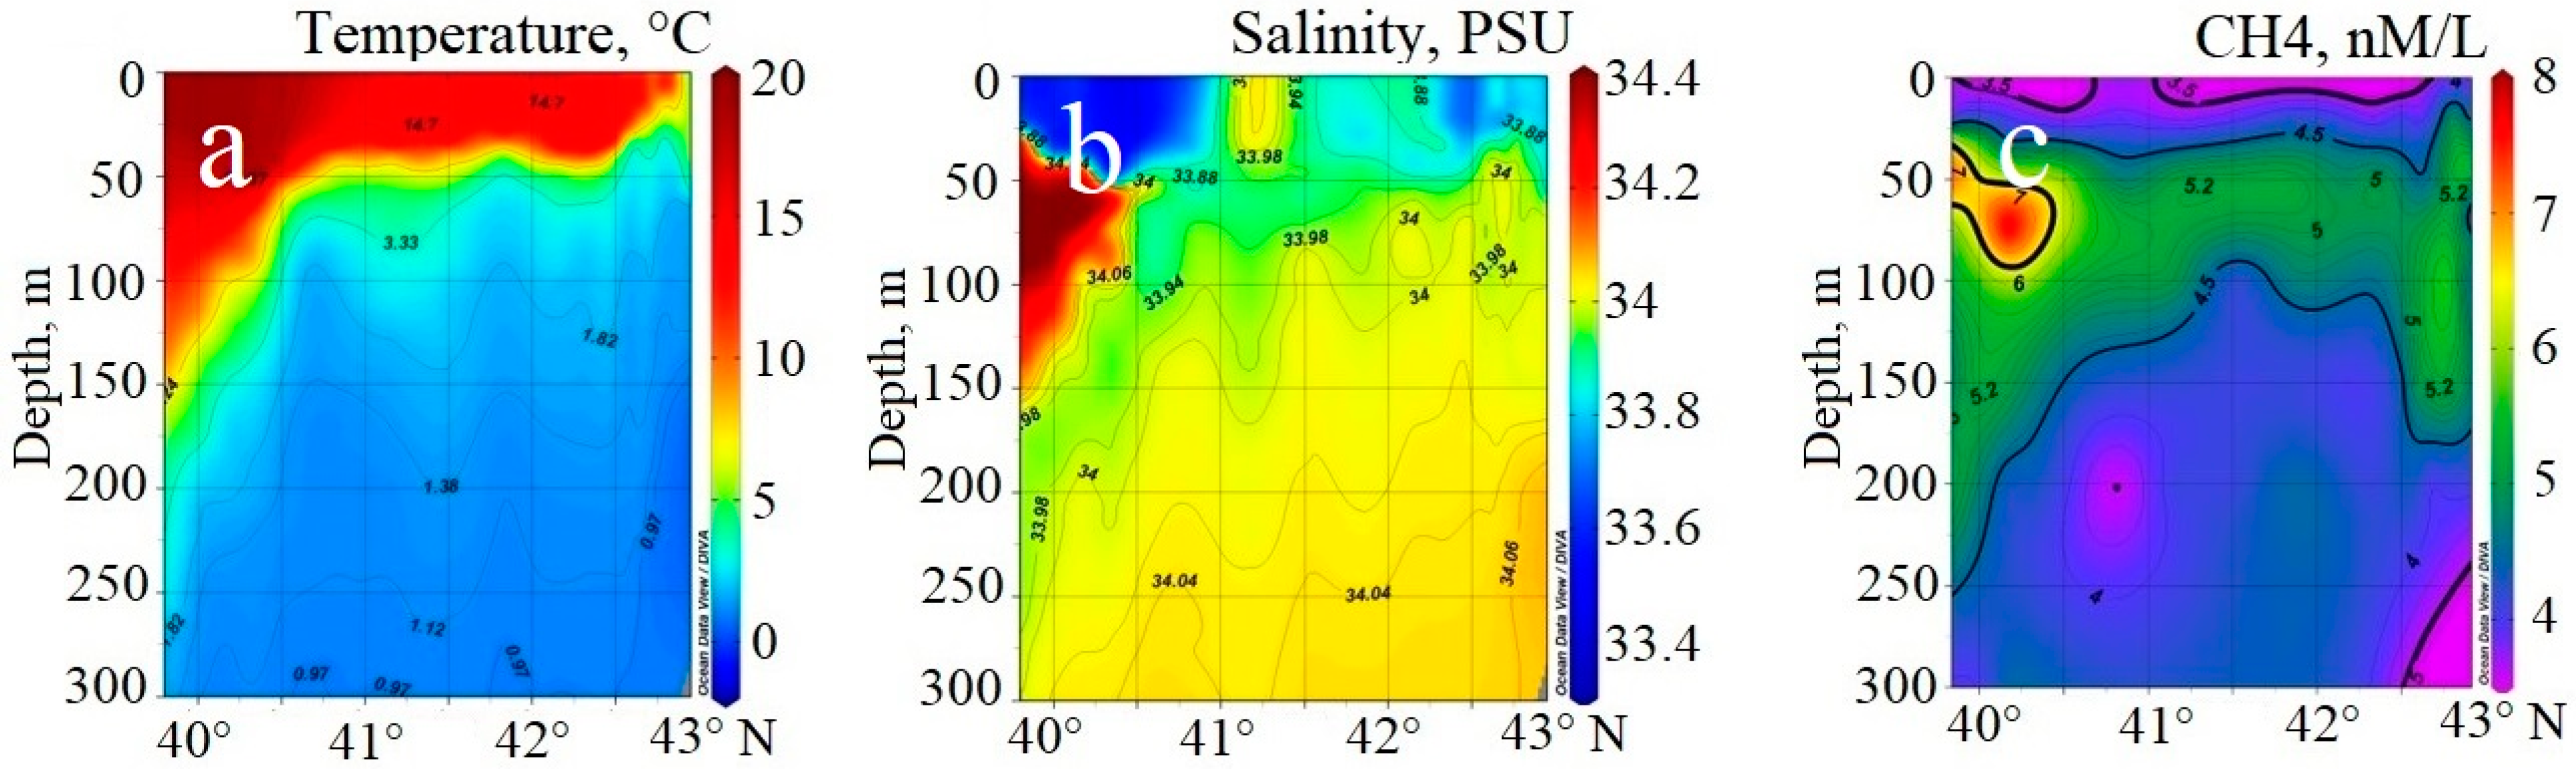
Figure 11 shows the temperature (Figure 11a), salinity (Figure 11b) and dissolved methane concentration (Figure 11c) sections along 134° E (stations 11–20) in the upper 300 m layer, and Figure 12 shows similar sections of the water temperature [87] based on CTD data obtained during the RV “Professor Khromov” cruise in August 1999 in the frame of the CREAMS International Project [88].
Figure 12c shows the results of the numerical simulation using the MHI layered ocean circulation model [89,90].
The average methane concentration in the total water column in the section along 134° N is 4 nM/L. An increased methane concentration (from 5.2 to 8.2 nM/L) is observed within the main sea pycnocline layer throughout the section, with an increase in the thickness of this layer marked with jet currents on the southern and northern peripheries of the section (Figure 11c).
The section in Figure 11c shows two cores of increased methane concentrations. The first core, with an absolute maximum concentration of 8.2 nM/L in the 25–100 m layer, is observed in the East Korean Warm Current in the area of 40°–40.5° N (left of Figure 11c). The second core, with a local CH4 maximum of 5.7 nM/L in the same layer, is found in the Liman (Primorsky) Current in the 42° N area over the continental slope of the Japan Basin (Figure 11c). In the central part of the mesoscale anticyclonic eddy, the dissolved methane local maximum of 5.2 nM/L is in the 50–100 m layer.
The anticyclonic eddy was also observed in a similar meridional section along 134° E, as well as in the zonal section along 41° N, in the summer of 1999 and winter of 2000 during the R/V Professor Khromov cruises in the frame of the CREAMS International Project led by Lynn Talley (Scripps Institution of Oceanography, UC San Diego, CA, USA) [91,92].
All the intermediate layers with the local methane maximum described above are located below the seasonal pycnocline in the layer associated with the absolute maximum of the gradient current velocity on its vertical profile in both the Liman (Primoskoye) Current [93] and the East Korean Warm Current [93,94].
The central part of the section and the cyclonic gyre over the Japan Basin meet a significant decrease in the thickness of this layer and the maximum elevation of the CH4 isoline (4.5 nM/L) near 41.5° N due to the upward vertical velocity at the periphery of the anticyclonic eddy and the center of the large-scale cyclonic cycle. Figure 12 shows the anticyclonic eddy in the temperature and salinity sections based on CTD measurements taken in October 2017 as well as a section of quasi-isopycnal layer interfaces given in [87] and simulated in [88] using a layered numerical circulation model developed by N.B. Shapiro and E.N. Mikhailova [89,90].
On the whole, dissolved methane is spread below the seasonal thermocline within the layer of maximal current velocity, where it is transported by various scale currents in the Japan (East) Sea, which is similar to the dissolved methane transport in the Atlantic sector of South Ocean, including the Bransfield Strait [95], as well as in the subtropical South Atlantic Current and the cyclonic and anticyclonic mesoscale eddies [47].
The cold cyclonic ring affected by the Malvinas Current is characterized by low methane concentrations on the one hand, and the warm anticyclonic ring affected by the Brazil Current carries the core of the local maximum methane concentration below the seasonal pycnocline on the other hand. Along-track SADCP measurements detected velocities projected to a direction of 120° (East-Southeast), which corresponds to the direction of the maximum velocity at the periphery of the eddies. This periphery is organized in a form of two main high-velocity jets. The maximum velocity of the first jet is 84 cm/s, while the second jet has a maximum velocity of 71 cm/s. The velocities near the centers of the eddies are much lower and do not exceed 20 cm/s. In the anticyclonic ring, the average concentrations of methane are lower than in the cyclonic ring. Medium (4.5–6 nM/L) and high (6–12.9 nM/L) methane concentrations were observed in the 2–200 m layer, while low concentrations (2.8–4.5 nM/L) were observed between 200 and 500 m layer. Lower methane concentrations were observed in the central parts of the cyclonic (up to 3.8 nM/L at station 7290) and anticyclonic (up to 2.8 nM/L at station 7286) rings at depths of 200 m and 500 m, respectively. The maximum concentration of methane (12.9 nM/L) was observed at the central station of the section between the rings at a depth of 110 m. The local maximum methane concentration core is located and carried under the seasonal pycnocline in the 70–200 m layer and corresponds to the measured current velocity maximum [47].
The authors of [95] reported CTD and LADCP measurements that were performed in 2022 over water exchange between the deep basins of the Bransfield Strait in the Southern Ocean during cruise 87 of the RV “Mstislav Keldysh” in 2021–2022. During this cruise, the distribution of the gas-geochemical fields of methane in the Bransfield Strait was studied. The maximum methane concentration (10.95 nM/L) was observed on the slope of the trough of the Strait near the South Shetland Islands. A core of elevated methane concentrations having a horizontal scale of about 10 km was found under the seasonal pycnocline in the 50–200 m water layer. This core corresponds to the measured maximum current velocity [95] of the Bransfield Strait current that transfers methane-saturated waters to the east.
5. Conclusions
The main features of methane distribution in both the Tatar Strait and the meridional section along 134° E from the Yamato Rise to the continental slope of the Japan Basin are determined.
The Tatar Strait is characterized by a complicated current system and mesoscale eddies of opposite signs forming over the strait. It has been established that from May to June, seawater dissolved methane comes from its sources located on the western shelf of Sakhalin Island and in the deep area near the axis of the Tatar Trough. In the early warm season, dissolved methane is transported to the north by the West Sakhalin Current over the Tatar Strait eastern shelf in the layer under the seasonal pycnocline.
The local methane maximum, on its vertical profile in the Cold Liman Current, in the East Korean Warm Current and the mesoscale anticyclonic eddy at 134° E in the Japan Basin, is also located under the seasonal pycnocline and spread in a layer of about 50–150 m in the northwestern Japan (East) Sea.
The incorporation of methane from the lithosphere into the water column has been well described; however, few studies have been devoted to dissolved methane transport within currents. The study of methane transport by uniting gas geochemistry and oceanology is a new way to better understand some geological, biological and ecological issues. The cooperation of both branches could help to estimate global dissolved methane circulation and its further emission to the atmosphere. Knowing the way of transport also makes it easier to find new methane sources.
The deep marginal sea, such as the Japan (East) Sea, is an important component of the Western Pacific trench arc and basin system, which is sensitive to global climate changes. The methane released from the seabed caused by various geological processes and environmental changes is extremely active, which seriously affects the marine environment and global climate change. Therefore, the Western Pacific marginal seas are a natural laboratory to study the process of methane release from the seabed and its environmental effects. In the context of the current global change, the study of methane transport is the most important distribution factor of greenhouse gas emissions. The origin of the devolved methane transported by different currents in the Japan (East) Sea is a subject for future measurements and studies.
This study corresponds to the objectives of the priority projects CREAMS, GEOMIR (ID 164), the UN Decade of Ocean Sciences for Sustainable Development (2021–2030), the WESTPAC Working group on the Integrated Study of Gas Hydrates and Methane Fluxes in the Indo-Pacific Region (CoSGas) and the development of marine research in the BRICS countries.
Author Contributions
Conceptualization, A.K. and V.P.; methodology, N.S. and V.P.; software, S.S.; validation, V.P.; formal analysis, A.K.; investigation, A.K. and V.P.; resources, N.S.; data curation, S.S.; writing—original draft preparation, A.K.; writing—review and editing, V.P.; visualization, A.K.; supervision, N.S.; project administration, N.S.; funding acquisition, N.S. All authors have read and agreed to the published version of the manuscript.
Funding
This research was funded by the Russian Federation State Assignment of the V.I. Il’ichev Pacific Oceanological Institute. The work was carried out within the framework of theme AAAA-A19-119122090009-2 and partly 122110700009-1.
Data Availability Statement
All data generated or analysed during this study are included in this published article.
Conflicts of Interest
The authors declare no conflict of interest.
References
- Obzhirov, A.I.; Astakhova, N.V.; Lipkina, M.I.; Vereschagina, O.F.; Mishukova, G.I.; Sorochinskaya, A.V.; Ugay, L.G. Gasgeochemical Zoning and Floor Mineral Associations of the Sea of Okhotsk; Dalnauka: Vladivostok, Russia, 1999; 184p. [Google Scholar]
- Burov, B.A.; Maltseva, E.V.; Lazaryuk, A.Y.; Salomatin, A.S.; Telegin, Y.A.; Chernykh, D.V. Methane content in bottom sediments and water layer under tectonic faults in the Amur bay of the Sea of Japan. Bull. FEB RAS 2014, 4, 66–74. (In Russian) [Google Scholar]
- Poletaev, A.V.; Poletaeva, E.V. Study of hydrocarbon gas outputs distribution depending on geological structure of the southern Caspian by gas survey. Bull. Tomsk. Polytech. Univ. Geo Assets Eng. 2018, 329, 136–152. Available online: https://earchive.tpu.ru/bitstream/11683/51956/1/bulletin_tpu-2018-v329-i11-14.pdf (accessed on 18 June 2022).
- Shakirov, R.B. Gasgeochemical Fields of the Eastern Asia Marginal Seas; GEOS: Moscow, Russia, 2018; 341p. [Google Scholar]
- Syrbu, N.S.; Kyong, D.H.; Yakimov, T.S.; Kholmogorov, A.O.; Telegin, Y.A.; Tsunogai, U. Geological features for the formation of gas-geochemical fields, including helium and hydrogen, in the water and sediments at the Vietnamese part of the South-China Sea. Georesursy 2021, 23, 132–142. [Google Scholar] [CrossRef]
- Shakirov, R.B.; Valitov, M.G.; Obzhirov, A.I.; Mishukov, V.F.; Yatsuk, A.V.; Syrbu, N.S.; Mishukova, O.V. Methane anomalies, its flux on the sea–atmosphere interface and their relations to the geological structure of the South-Tatar sedimentary basin (Tatar Strait, the Sea of Japan). Mar. Geophys. Res. 2019, 40, 581–600. [Google Scholar] [CrossRef]
- Ponomareva, A.L.; Eskova, A.I.; Shakirov, R.B.; Syrbu, N.S.; Legkodimov, A.A.; Grigorov, R.A. Groups of Geomicrobiological Indicators Are Spread across Gas-Hydrate and Non-Gas-Hydrate Areas in the Northern Part of the Sea of Japan. Biology 2022, 11, 1802. [Google Scholar] [CrossRef]
- Vinogradova, E.; Damm, E.; Pnyushkov, A.V.; Krumpen, T.; Ivanov, V.V. Shelf-Sourced Methane in Surface Seawater at the Eurasian Continental Slope (Arctic Ocean). Front. Environ. Sci. 2022, 10, 811375. [Google Scholar] [CrossRef]
- Judd, A.; Hovland, M. Seabed fluid flow. In The impact on Geology, Biology and the Marine Environment; Cambridge University Press: Cambridge, UK, 2007; 475p. [Google Scholar]
- Max, M.D. (Ed.) Natural Gas Hydrate in Oceanic and Permafrost Environments; Kluwer Academic Publishers: Alphen aan den Rijn, The Netherlands, 2000; 414p. [Google Scholar]
- Max, M.D.; Dillon, W.P.; Nishimura, C.; Hurdle, B.G. Sea-floor methane blow-out and global firestorm at the K–T boundary. Geo-Mar. Lett. 1999, 18, 285–291. [Google Scholar] [CrossRef]
- Milkov, A. Worldwide distribution of submarine mud volcanoes and associated gas hydrates. Mar. Geol. 2000, 167, 29–42. [Google Scholar] [CrossRef]
- Reeburgh, W.S. Oceanic methane biogeochemistry. Chem. Rev. 2007, 107, 486–513. [Google Scholar] [CrossRef] [Green Version]
- Sloan, E.D.; Dendy, J.E.; Koh, C. Clathrate Hydrates of Natural Gases; CRC Press: Boca Raton, FL, USA, 2007; 856p. [Google Scholar]
- Snyder, G.T.; Yatsuk, A.; Takahata, N.; Shakirov, R.; Tomaru, H.; Tanaka, K.; Obzhirov, A.; Salomatin, A.; Aoki, S.; Khazanova, E.; et al. Ocean Dynamics and Methane Plume Activity in Tatar Strait, Far Eastern Federal District, Russia as Revealed by Seawater Chemistry, Hydroacoustics, and Noble Gas Isotopes. Front. Earth Sci. 2021, 10, 825679. [Google Scholar] [CrossRef]
- Sano, Y.; Kinoshita, N.; Kagoshima, T.; Takahata, N.; Sakata, S.; Toki, T.; Kawagucci, S.; Waseda, A.; Lan, T.; Wen, H.; et al. Origin of methane-rich natural gas at the West Pacific convergent plate boundary. Sci. Rep. 2017, 7, 15646. [Google Scholar] [CrossRef] [Green Version]
- Yang, J.; Lu, M.; Yao, Z.; Wang, M.; Lu, S.; Qi, N.; Xia, Y. A Geophysical Review of the Seabed Methane Seepage Features and Their Relationship with Gas Hydrate Systems. Geofluids 2021, 2021, 9953026. [Google Scholar] [CrossRef]
- Weidner, E.; Weber, T.C.; Mayer, L.; Jakobsson, M.; Chernykh, D.; Semiletov, I. A wideband acoustic method for direct assessment of bubble-mediated methane flux. Cont. Shelf Res. 2018, 173, 104–115. [Google Scholar] [CrossRef] [Green Version]
- Ginsburg, G.D.; Soloviev, V.A. Submarine Gas Hydrates; VNIIOkeangeologiya: Leningrad, Russia, 1994; 194p. (In Russian) [Google Scholar]
- Suess, E. Marine cold seeps and their manifestations: Geological control, biogeochemical criteria and environmental conditions. Int. J. Earth Sci. 2014, 103, 1889–1916. [Google Scholar] [CrossRef]
- Vogt, P.R.; Gardner, J.; Crane, K. The Norwegian Barents Svalbard (NBS) continental margin: Introducing a natural laboratory of mass wasting, hydrates, and ascent of sediment, pore water and methane. Geo-Mar. Lett. 1999, 19, 2–21. [Google Scholar] [CrossRef]
- Lein, A.Y.; Ivanov, M.V. Biogeochemical Cycle of Methane in the Ocean; Lisitsyn, A.P., Ed.; Nauka: Moscow, Russia, 2009; 576p. (In Russian) [Google Scholar]
- Obzhirov, A.I. Gas-Geochemical Fields of the Bottom Layer of Seas and Oceans; Nauka: Moscow, Russia, 1993; 139p. (In Russian) [Google Scholar]
- Duddridge, G.A.; Grainger, P. Temporal variation in soil gas composition in relation to seismicity in south-west England. Geosci. South-West Engl. 1998, 9, 224–230. [Google Scholar]
- Tsunogai, U.; Kosaka, A.; Nakayama, N.; Komatsu, D.; Konno, U.; Kameyama, S.; Nakagawa, F.; Sumino, H.; Nagao, K.; Fujikura, K.; et al. Origin and fate of deep sea seeping methane bubbles at Kuroshima Knoll, Ryukyu forearc region, Japan. Geochem. J. 2010, 44, 461–476. [Google Scholar] [CrossRef] [Green Version]
- Jiang, G.-J.; Angelier, J.; Lee, J.-C.; Chu, H.-T.; Hu, J.-C.; Mu, C.-H. Faulting and Mud Volcano Eruptions Inside of the Coastal Range During the 2003 Mw = 6.8 Chengkung Earthquake in Eastern Taiwan. Terr. Atmos. Ocean. Sci. 2011, 22, 463. [Google Scholar] [CrossRef] [Green Version]
- Yang, T.F.; Fu, C.-C.; Walia, V.; Chen, C.-H.; Chyi, L.L.; Liu, T.-K.; Song, S.-R.; Lee, M.; Lin, C.-W. Seismo-Geochemical Variations in SW Taiwan: Multi-Parameter Automatic Gas Monitoring Results. Pure Appl. Geophys. 2006, 163, 693–709. [Google Scholar] [CrossRef]
- Kopf, A.; Delisle, G.; Faber, E.; Panahi, B.; Aliyev, C.S.; Guliyev, I. Long term in situ monitoring at Dashgil mud volcano, Azerbaijan: A link between seismicity, pore pressure transients and methane emission. Int. J. Earth Sci. 2010, 99, 227–240. [Google Scholar] [CrossRef]
- Kulm, L.D.; Suess, E.; Moore, J.C.; Carson, B.; Lewis, B.T.; Ritger, S.D.; Kadko, D.C.; Thornburg, T.M.; Embley, R.W.; Rugh, W.D.; et al. Oregon Subduction Zone: Venting, Fauna, and Carbonates. Science 1986, 231, 561–566. [Google Scholar] [CrossRef] [PubMed]
- Yun, J.W.; Orange, D.L.; Field, M.E. Subsurface gas offshore of northern California and its link to submarine geomorphology. Mar. Geol. 1997, 154, 357–368. [Google Scholar] [CrossRef]
- Lein, A.Y.; Sagalevich, A.M. Smokers of the Rainbow field—The area of large-scale abiogenic synthesis of methane. Priroda 2000, 8, 44–53. (In Russian) [Google Scholar]
- Baraza, J.; Ercilla, G.; Nelson, C.H. Potential geologic hazards on the eastern Gulf of Cadiz slope (SW Spain). Mar. Geol. 1999, 155, 191–215. [Google Scholar] [CrossRef]
- Xu, S.; Sun, Z.; Geng, W.; Cao, H.; Zhang, X.; Zhai, B.; Wu, Z. Advance in Numerical Simulation Research of Marine Methane Processes. Front. Earth Sci. 2022, 10, 891393. [Google Scholar] [CrossRef]
- Zubova, M.A. Hydrates of Natural Gases in the Bowels of the World Ocean; VEMS: Moscow, Russia, 1988; 61p. (In Russian) [Google Scholar]
- Callender, W.R.; Powell, E.N. Why did ancient chemosynthetic seep and vent assemblages occurs in shallower water than they today? Int. J. Earth Sci. 1999, 88, 377–391. [Google Scholar] [CrossRef]
- Kvenvolden, K.A. Methane hydrate—A major reservoir of carbon in the shallow geosphere? Chem. Geol. 1988, 71, 41–51. [Google Scholar] [CrossRef]
- Trehu, A.M.; Torres, M.E.; Moore, G.F.; Suess, E.; Bohrmann, G. Temporal and spatial evolution of a gas hydrate–bearing accretionary ridge on the Oregon continental margin. Geology 1999, 27, 939–942. [Google Scholar] [CrossRef]
- Hovland, M.; Croker, P.F.; Martin, M. Fault-associated seabed mounds (carbonate knolls?) off western Ireland and north-west Australia. Mar. Pet. Geol. 1994, 11, 232–246. [Google Scholar] [CrossRef]
- Zlobin, T.K. Okhotsk lithospheric plate and the scheme of evolution of the system “edge sea–circling arc–deep-water trough”. Bull. FEB RAS 2006, 1, 26–32. (In Russian) [Google Scholar]
- Gnibidenko, G.S. Tectonics of the Bottom of the Marginal Seas of the Far East; Nauka: Moscow, Russia, 1979; 163p. (In Russian) [Google Scholar]
- Kharakhinov, V.V. Oil and Gas Geology of the Sakhalin Region; Scientific World: Moscow, Russia, 2010; 276p. (In Russian) [Google Scholar]
- Karp, B.; Khirata, N. Soviet-Japanese seismic experiment in the Sea of Japan. Preliminary results. Pac. Geol. 1992, 16, 138–147. (In Russian) [Google Scholar]
- Ingle, J.C.; Suyehiro, K.; von Breymann, M.T.; Bristow, J.S.; Burkle, L.H.; Charvet, J.; Cragg, A.B.; Demenocal, P.B.; Dunbar, R.B.; Föllmi, K.B. Proceedings of the Ocean Drilling Program, Initial Reports. Introd. Backgr. Princ. Results Leg 128 Ocean. Drill. Program Jpn. Sea 1990, 128, 1–34. [Google Scholar]
- Jolivet, L.; Tamaki, K.; Fournier, M. Japan Sea, opening history and mechanism: A synthesis. J. Geophys. Res. Solid Earth 1994, 99, 22237–22259. [Google Scholar] [CrossRef]
- Tamaki, K. Opening tectonics of the Japan Sea. In Backarc Basins: Tectonics and Magmatism; Taylor, B., Ed.; Plenum Press: New York, NY, USA, 1995; pp. 407–420. [Google Scholar]
- Kholmogorov, A.; Syrbu, N.; Shakirov, R. Influence of Hydrological Factors on the Distribution of Methane Fields in the Water Column of the Bransfield Strait: Cruise 87 of the R/V “Academik Mstislav Keldysh”, 7 December 2021–5 April 2022. Water 2022, 14, 3311. [Google Scholar] [CrossRef]
- Morozov, E.G.; Frey, D.I.; Krechik, V.A.; Latushkin, A.A.; Salyuk, P.A.; Seliverstova, A.M.; Mosharov, S.A.; Orlov, A.M.; Murzina, S.A.; Mishin, A.V.; et al. Multidisciplinary Observations across an Eddy Dipole in the Interaction Zone between Subtropical and Subantarctic Waters in the Southwest Atlantic. Water 2022, 14, 2701. [Google Scholar] [CrossRef]
- Koudryashova, Y.; Chizhova, T.; Inoue, M.; Hayakawa, K.; Nagao, S.; Marina, E.; Mundo, R. Deep Water PAH Cycling in the Japan Basin (the Sea of Japan). J. Mar. Sci. Eng. 2022, 10, 2015. [Google Scholar] [CrossRef]
- Valitov, M.G.; Shakirov, R.B.; Yatsuk, A.V.; Aksentov, K.I.; Proshkina, Z.N.; Belous, O.V.; Mishukova, G.I. Integrated Geological and Geophysical Expedition aboard the R/V Akademik Oparin to the Tatar Strait, Sea of Japan (Cruise 54, 2017). Oceanology 2019, 59, 283–286. [Google Scholar] [CrossRef]
- Valitov, M.G.; Lee, N.S.; Sergeev, A.F.; Sagalaev, S.G.; Legkodimov, A.A.; Zakharkov, S.P.; Permyakov, P.A.; Ryazanov, S.D.; Lobanov, V.B.; Shakirov, R.B.; et al. Integrated Expeditionary Research in the Sea of Japan and the Sea of Okhotsk on Cruise No. 55 of the R/V Akademik Oparin. Oceanology 2020, 60, 145–147. [Google Scholar] [CrossRef]
- Vereshchagina, O.F.; Korovitskaya, E.V.; Mishukova, G.I. Methane in water columns and sediments of the north western Sea of Japan. Deep. Sea Res. Part II Top. Stud. Oceanogr. 2013, 86–87, 25–33. [Google Scholar] [CrossRef]
- Yamamoto, S.; Alcauskas, J.B.; Crozier, T.E. Solubility of methane in distilled water and sea water. J. Chem. Eng. Data 1976, 21, 78–80. [Google Scholar] [CrossRef]
- Wiesenburg, D.A.; Guinasso, N.L. Equilibrium solubility of methane, carbon monooxide, and hydrogen in water and sea water. J. Chem. Eng. Data 1979, 24, 356–360. [Google Scholar] [CrossRef]
- Uda, M. The results of simultaneous oceanographical investigations in the Japan Sea and its adjacent waters in May and June, 1993. Ipm. Exp. Sta. 1993, 5, 57–190, (In Japanese with English Abstract). [Google Scholar]
- Sizova, Y.V. Circulation of the Waters of the Sea of Japan. The Main Features of the Geology and Hydrology of the Sea of Japan; USSR Acad. Sci.: Moscow, Russia, 1961; 224p. (In Russian) [Google Scholar]
- Yarichin, V.G. Steady state of the Japan Sea circulation. In Leningrad: Problems of Oceanography; Pokudov, V., Ed.; Hydrometeoizdat: Moscow, Russia, 1980; pp. 46–61. (In Russian) [Google Scholar]
- Senjyu, T. The Japan Sea Intermediate Water; Its Characteristics and Circulation. J. Oceanogr. 1999, 55, 111–122. [Google Scholar] [CrossRef]
- Yoon, J.-H.; Kim, Y.-J. Review on the seasonal variation of the surface circulation in the Japan/East Sea. J. Mar. Syst. 2009, 78, 226–236. [Google Scholar] [CrossRef]
- Ponomarev, V.; Fayman, P.; Prants, S.; Budyansky, M.; Uleysky, M. Simulation of mesoscale circulation in the Tatar Strait of the Japan Sea. Ocean Model. 2018, 126, 43–55. [Google Scholar] [CrossRef]
- Martin, S.; Wakatsuchi, M.; Ono, N. Ice and ocean processes in the Tatarskiy Strait, Japan Sea, as revealed by ERS-t SAR. Int. J. Remote Sens. 1995, 16, 3227–3243. [Google Scholar] [CrossRef]
- Biebow, N.; Huetten, E. (Eds.) Cruise Reports I & II RV “Professor Gagarinsky”, Cruise 22, RV “Akademik M.A. Lavrentyev”, Cruise 28; GEOMAR Report 82 INESSA; Christian Albrechts University: Kiel, Germany, 1999; 188p. [Google Scholar]
- Biebow, N.; Ludmann, T.; Karp, B.; Kulinich, R. (Eds.) Cruise Report 88: KOMEX V and KOMEX VI, RV “Professor Gagarinsky” Cruise 26 and M/V “Marshal Gelovany” Cruise 1; Christian Albrechts University: Kiel, Germany, 2000; 296p. [Google Scholar]
- Cruise Report: CHAOS Project, RV “Akademik M.A. Lavrentyev”, Cruise 31 and 32; VNIIOkeangeologia: St. Petersburg, Russia, 2005; 164p.
- Cruise Report: CHAOS Project, RV “Akademik M.A. Lavrentyev”, Cruise 36; Vladivostok: St. Petersburg, Russia, 2006; 127p.
- Cruise Report: CHAOS Project, RV “Akademik M.A. Lavrentyev”, Cruise 39; KOPRI: Incheon, Republic of Korea, 2007; 133p.
- Shoji, H.; Jin, Y.K.; Obzhirov, A. (Eds.) Operation Report of Sakhalin Slope Gas Hydrate Project 2007, RV “Akademik M.A. Lavrentyev” Cruise 43; Korea Polar Research Institute: Kitami, Japan, 2008; 39p, ISBN 978-4-903845-03-6. [Google Scholar]
- Shoji, H.; Jin, Y.K.; Obzhirov, A.; Baranov, B. (Eds.) Operation Report of Sakhalin Slope Gas Hydrate Project 2011, RV “Akademik M.A. Lavrentyev” Cruise 56; New Energy Resources Research Center, Kitami Institute of Technology: Kitami, Japan, 2012; 140p. [Google Scholar]
- Jin, Y.K.; Shoji, H.; Obzhirov, A.; Baranov, B. (Eds.) Operation Report of Sakhalin Slope Gas Hydrate Project 2012, RV “Akademik M.A. Lavrentyev” Cruise 59; Korea Polar Research Institute: Incheon, Republic of Korea, 2013; 163p. [Google Scholar]
- Shoji, H.; Jin, Y.K.; Baranov, B.; Nikolaeva, N.A.; Obzhirov, A. (Eds.) Operation Report of Sakhalin Slope Gas Hydrate Project II 2013, RV “Akademik M.A. Lavrentyev” Cruise 62; New Energy Resources Research Center, Kitami Institute of Technology: Kitami, Japan, 2014; 111p. [Google Scholar]
- Jin, Y.K.; Minami, H.; Baranov, B.; Obzhirov, A. (Eds.) Operation Report of Sakhalin Slope Gas Hydrate Project II, 2014, RV “Akademik M.A. Lavrentyev” Cruise 67; Korea Polar Research Institute: Incheon, Republic of Korea, 2015; 121p. [Google Scholar]
- Salomatin, A.S.; Yusupov, V.I. Acoustic Investigations of Gas “Flares” in the Sea of Okhotsk. Oceanology 2011, 51, 857–865. [Google Scholar] [CrossRef]
- Salomatin, A.S.; Yusupov, V.I.; Vereshchagina, O.F.; Chernykh, D.V. Acoustic estimation of methane concentration in the water column in the areas of its bubble discharge. Acoust. J. 2014, 60, 638–644. (In Russian) [Google Scholar]
- Leifer, I.; Chernykh, D.; Shakhova, N.; Semiletov, I. Sonar gas flux estimation by bubble insonification: Application to methane bubble flux from seep areas in the outer Laptev Sea. Cryosphere 2017, 11, 1333–1350. [Google Scholar] [CrossRef] [Green Version]
- Burov, B.A.; Luchin, V.A.; Obzhirov, A.I.; Karnaukhov, A.A. Estimation of methane flux from bottom sediments to water as a result of methane hydrate degradation caused by water warming in the Strait of Tartary. Geoecol. Eng. Geol. Hydrogeol. 2018, 2, 3–14. (In Russian) [Google Scholar]
- Obzhirov, A.I. Gasgeochemical manifestation of gas hydrates in the sea of Okhotsk. Alsk. Geol. 1992, 21, 1–7. [Google Scholar]
- Obzhirov, A.; Shakirov, R.; Salyuk, A.; Suess, E.; Biebow, N.; Salomatin, A. Relations between methane venting, geological structure and seismo-tectonics in the Okhotsk Sea. Geo-Mar. Lett. 2004, 24, 135–139. [Google Scholar] [CrossRef]
- Mishukova, G.; Yatsuk, A.; Shakirov, R.; Syrbu, N.; Valitov, M.; Ponomareva, A.; Mishukova, O. Methane Fluxes at the Water–Atmosphere Interface and Gas-Geochemical Anomalies in the Bottom Sediments in the Northwestern Part of the Sea of Japan. Russ. Geol. Geophys. 2021, 62, 1385–1400. [Google Scholar] [CrossRef]
- Yatsuk, A.; Shakirov, R.; Gresov, A.; Obzhirov, A. Hydrocarbon gases in seafloor sediments of the TATAR strait, the northern sea of Japan. Geo-Mar. Lett. 2019, 40, 481–490. [Google Scholar] [CrossRef]
- Gardner, J.; Shor, A.; Jung, W. Acoustic imagery evidence for methane hydrates in the Ulleung Basin. Mar. Geophys. Res. 1998, 20, 495–503. [Google Scholar] [CrossRef]
- Lee, S.H.; Chough, S.K. Distribution and origin of shallow gas in deep-sea sediments of the Ulleung Basin, East Sea (Sea of Japan). Geo-Mar. Lett. 2003, 22, 204–209. [Google Scholar] [CrossRef]
- Yoo, D.G.; Kang, N.K.; Yi, B.Y.; Kim, G.Y.; Ryu, B.J.; Lee, K.; Lee, G.H.; Riedel, M. Occurrence and seismic characteristics of gas hydrate in the Ulleung Basin, East Sea. Mar. Pet. Geol. 2013, 47, 236–247. [Google Scholar] [CrossRef]
- Ryu, B.-J.; Collett, T.S.; Riedel, M.; Kim, G.Y.; Chun, J.-H.; Bahk, J.-J.; Lee, J.Y.; Kim, J.-H.; Yoo, D.-G. Scientific results of the Second Gas Hydrate Drilling Expedition in the Ulleung Basin (UBGH2). Mar. Pet. Geol. 2013, 47, 1–20. [Google Scholar] [CrossRef]
- Jeong, I.S.; Cho, J.C.; Bahk, J.J.; Hyun, S.M.; Kwon, K.K.; Lee, J.H.; Kang, S.G.; Lee, S.H.; Lee, J.H. Vertical profi le of bacterial community in the sediment of Ulleung Basin: Implication of the presence of methanedriven community. Microorg. Ind. Environ. 2010, 219–226. [Google Scholar] [CrossRef]
- Berner, U.; Faber, E. Light hydrocarbons in sediments of the Nankaiaccretionary prism (Leg 131, Site 808). Proc. Ocean. Drill. Program Sci. Results 1993, 131, 185–195. [Google Scholar]
- Zhang, X.; Sun, Z.; Wang, L.; Zhang, X.; Zhai, B.; Xu, C.; Geng, W.; Cao, H.; Yin, X.; Wu, N. Distribution and Discharge of Dissolved Methane in the Middle Okinawa Trough, East China Sea. Front. Earth Sci. 2020, 8, 333. [Google Scholar] [CrossRef]
- Takematsu, M.; Ostrovskii, A.; Nagano, Z. Observations of Eddies in the Japan Basin Interior. J. Oceanogr. 1999, 55, 237–246. [Google Scholar] [CrossRef]
- Prants, S.; Ponomarev, V.; Budyansky, M.; Uleysky, M.; Fayman, P. Lagrangian analysis of the vertical structure of eddies simulated in the Japan Basin of the Japan/East Sea. Ocean Model. 2015, 86, 128–140. [Google Scholar] [CrossRef] [Green Version]
- Ponomarev, V.I.; Fayman, P.A.; Mashkina, I.V.; Dubina, V.A. Simulation of multiple scale circulation in the Northwestern Japan Sea (Modelirovalie raznomasshtabnoi cirkulyacii v ceverozapadnoi chaste Yaponskogo moray). Russ. J. Monit. Syst. Environ. 2015, 2, 65–73. Available online: https://elibrary.ru/download/elibrary_25733087_93590524.pdf (accessed on 3 September 2022). (In Russian).
- Shapiro, N.B. Formation of a circulation in the quasiisopycnic model of the Black Sea taking into account the stochastic nature of the wind stress. Phys. Oceanogr. 2000, 10, 513–531. [Google Scholar] [CrossRef]
- Mikhailova, E.N.; Shapiro, N.B. Quasi-isopycnic layer model for large-scale ocean circulation. Phys. Oceanogr. 1993, 4, 251–261. [Google Scholar] [CrossRef]
- Talley, L.D.; Lobanov, V.B.; Tishchenko PYa Ponomarev, V.I.; Sherbinin, A.F.; Luchin, V.A. Hydrographic observations in the Japan/East sea in winter, 2000, with some results from summer, 1999. In Oceanography of the Japan Sea Proceedings of CREAMS-2000 International Symposium; Dalnauka: Vladivostok, Russia, 2001; pp. 25–32. [Google Scholar]
- Talley, L.; Min, D.H.; Lobanov, V.; Luchin, V.B.; Ponomarev, V.I.; Salyuk, A.N.; Shcherbina, A.; Tishchenko, P.; Zhabin, I. Japan/East Sea Water Masses and their Relation to the Sea’s Circulation. Oceanography 2006, 19, 33–49. [Google Scholar] [CrossRef] [Green Version]
- Yurasov, G.I. Thermohaline parameters, fronts, water masses, and water structure in the deep-water areas of the Japan Sea. Izv. TINRO 2009, 156, 265–281. [Google Scholar]
- Ponomarev, V.I.; Trusenkova, O.O. Circulation patterns of the Japan Sea. La Mer. V 2000, 38, 189–198. [Google Scholar]
- Frey, D.I.; Krechik, V.A.; Morozov, E.G.; Drozd, I.D.; Gordey, A.S.; Latushkin, A.A.; Mekhova, O.S.; Mukhametianov, R.Z.; Murzina, S.A.; Ostroumova, S.A.; et al. Water Exchange between Deep Basins of the Bransfield Strait. Water 2022, 14, 3193. [Google Scholar] [CrossRef]
Figure 1.
The Japan (East) Sea surface current system in the warm and cold seasons from the numerical experiment with RIAM OM. Warm period (left) and cold period (right). TWC (Tsushima Warm Current), LCC–NKCC (Liman Cold Current–North Korean Cold Current), EKWC (East Korean Warm Current), SPF (Subpolar Front). The figure is from [58].

Figure 2.
(a) The backward-time Lagrangian origin map combined with the D-map on 5 September 1994, shows that in the warm period, the Western Sakhalin Current transports transformed subtropical water to the north along the western coast of Sakhalin (the “yellow” water in the online version). The Liman Current transports the water along the western shelf break from the north (the “pink“ water in the online version). (b) The backward-time Lagrangian L-map on the same date demonstrates the mesoscale anticyclonic eddy, with the center at around 51° N, 141.5° E in the northeastern Tatar Strait shallows, the anticyclonic eddy street close to the western coast of Sakhalin (the up-oriented red triangles) and the mesoscale cyclonic eddy street in the central part of the strait between the Liman and Western Sakhalin Currents (the down-oriented green triangles). The arrows in (a) and (b) represent the simulated velocity field at 15 m depth on 5 September 1994. (c) The map with a fragment of the track of surface drifter no. 67169 in the summer of 2007. The arrows represent the AVISO velocity field on 3 September 2007. (Figure is from [59]).

Figure 3.
Dissolved methane concentration (1) in the sub-surface layer (4 m) of the Tatar Strait from measurements taken during cruise 54 of the RV “Akademik Oparin”, 29 September to 22 October 2017, and the positions of the gas hydrates (2), the gas flares (3) and the schematic fault lines (4) as sources of methane entering the water column.

Figure 4.
Distribution of the dissolved methane concentration in the sub-surface layer of the Tatar Strait south of 51° N, superimposed on a combined map of the current velocity vector at the 15 m level and the Lagrangian origin map on 5 September 1994, from a numerical experiment with the RIAM model and the Lagrangian map of the water’s origin in the modeled current velocity field obtained by back in time integration of the Lagrangian equations [59].

Figure 5.
The research area (a) with the designation of schematic fault lines (3), gas flares (4) and gas hydrates (5) as sources of methane entering the water column. Rectangle (b) shows sections 1 and 2 marking the CTD measurements and water sampling stations (6) on 21–23 May 2019 during cruise LV85. The bottom relief is shown by a color scale.

Figure 6.
Dissolved methane concentration (a), temperature (b), density (c) and salinity (d) on the northern zonal Section 1 in the Tatar Strait, cruise LV85, 21–23 May 2019.
Figure 6.
Dissolved methane concentration (a), temperature (b), density (c) and salinity (d) on the northern zonal Section 1 in the Tatar Strait, cruise LV85, 21–23 May 2019.

Figure 7.
Dissolved methane concentration (a), temperature (b), density (c) and salinity (d) on the southern zonal Section 2 in the Tatar Strait, cruise LV85, 21–23 May 2019.
Figure 7.
Dissolved methane concentration (a), temperature (b), density (c) and salinity (d) on the southern zonal Section 2 in the Tatar Strait, cruise LV85, 21–23 May 2019.

Figure 8.
Temperature (a), salinity (b) and density (c) distribution on northern zonal Section 1 for cruise LV85 on 21–23 May 2019. The bold line indicates the seasonal pycnocline boundary for the corresponding season.
Figure 8.
Temperature (a), salinity (b) and density (c) distribution on northern zonal Section 1 for cruise LV85 on 21–23 May 2019. The bold line indicates the seasonal pycnocline boundary for the corresponding season.

Figure 9.
Temperature (a), salinity (b) and density (c) distribution on southern zonal Section 2 for cruise LV85 on 21–23 May 2019. The bold line indicates the seasonal pycnocline boundary for the corresponding season.
Figure 9.
Temperature (a), salinity (b) and density (c) distribution on southern zonal Section 2 for cruise LV85 on 21–23 May 2019. The bold line indicates the seasonal pycnocline boundary for the corresponding season.

Figure 10.
Meridional section (a) bordered by the red rectangle along 134° E, from measurements taken during the OP54 cruise in October 2017. The blue dots indicate the sampling stations. Dissolved methane concentration (b) on the section.
Figure 10.
Meridional section (a) bordered by the red rectangle along 134° E, from measurements taken during the OP54 cruise in October 2017. The blue dots indicate the sampling stations. Dissolved methane concentration (b) on the section.

Figure 11.
Temperature (a), salinity (b) and methane concentration (c) meridional sections along 134° E from the Yamato Rise deep slope to the continental slope of the Japan Basin (measurements taken during the OP54 cruise in October 2017).
Figure 11.
Temperature (a), salinity (b) and methane concentration (c) meridional sections along 134° E from the Yamato Rise deep slope to the continental slope of the Japan Basin (measurements taken during the OP54 cruise in October 2017).

Figure 12.
Temperature (a) and salinity (b) meridional sections along 134° E through the mesoscale anticyclonic eddy, situated in the latitude band 40°–42 N from OP54 CTD measurements in October 2017 (a,b), as well as the quasi-isopycnal layers section (c) in the warm season in 1999 from [87] and the output of the numerical experiment [88] with the MHI quasi-isopycnal layer circulation model [89,90] applied to the Japan Sea.


Table 1.
Materials researched.
| Cruise | Study Area | Water Samples from Flow-Through Intake Unit, pcs | Water Samples from Bathometers, pcs | Analyst | CTD Stations, pcs |
|---|---|---|---|---|---|
| LV85 | Tatar Strait, Japan Sea 22 May–19 June 2019 | 123 | Yatsuk A.V. | 17 | |
| OP54 | Tatar Strait, Japan Sea 29 September–29 October 2017 | 407 | 251 | Yatsuk A.V., Lifanskiy E.V. | 20 |
Disclaimer/Publisher’s Note: The statements, opinions and data contained in all publications are solely those of the individual author(s) and contributor(s) and not of MDPI and/or the editor(s). MDPI and/or the editor(s) disclaim responsibility for any injury to people or property resulting from any ideas, methods, instructions or products referred to in the content. |
© 2023 by the authors. Licensee MDPI, Basel, Switzerland. This article is an open access article distributed under the terms and conditions of the Creative Commons Attribution (CC BY) license (https://creativecommons.org/licenses/by/4.0/).
Share and Cite
MDPI and ACS Style
Kholmogorov, A.; Ponomarev, V.; Syrbu, N.; Shkorba, S. Dissolved Methane Transport in the Tatar Strait and the Deepest Basin of the Japan (East) Sea from Its Possible Sources. Water 2023, 15, 821. https://doi.org/10.3390/w15040821
AMA Style
Kholmogorov A, Ponomarev V, Syrbu N, Shkorba S. Dissolved Methane Transport in the Tatar Strait and the Deepest Basin of the Japan (East) Sea from Its Possible Sources. Water. 2023; 15(4):821. https://doi.org/10.3390/w15040821
Chicago/Turabian StyleKholmogorov, Andrei, Vladimir Ponomarev, Nadezhda Syrbu, and Svetlana Shkorba. 2023. "Dissolved Methane Transport in the Tatar Strait and the Deepest Basin of the Japan (East) Sea from Its Possible Sources" Water 15, no. 4: 821. https://doi.org/10.3390/w15040821
Note that from the first issue of 2016, this journal uses article numbers instead of page numbers. See further details here.