
Evaluation of the Gamma Law for Settling Velocity and Trapping Capacity Analysis of Suspended Particles in a Dam Reservoir (Lobo River in Côte d’Ivoire)
 ,
,  , , ,
, , ,
Abstract
:1. Introduction
2. Methods and Data
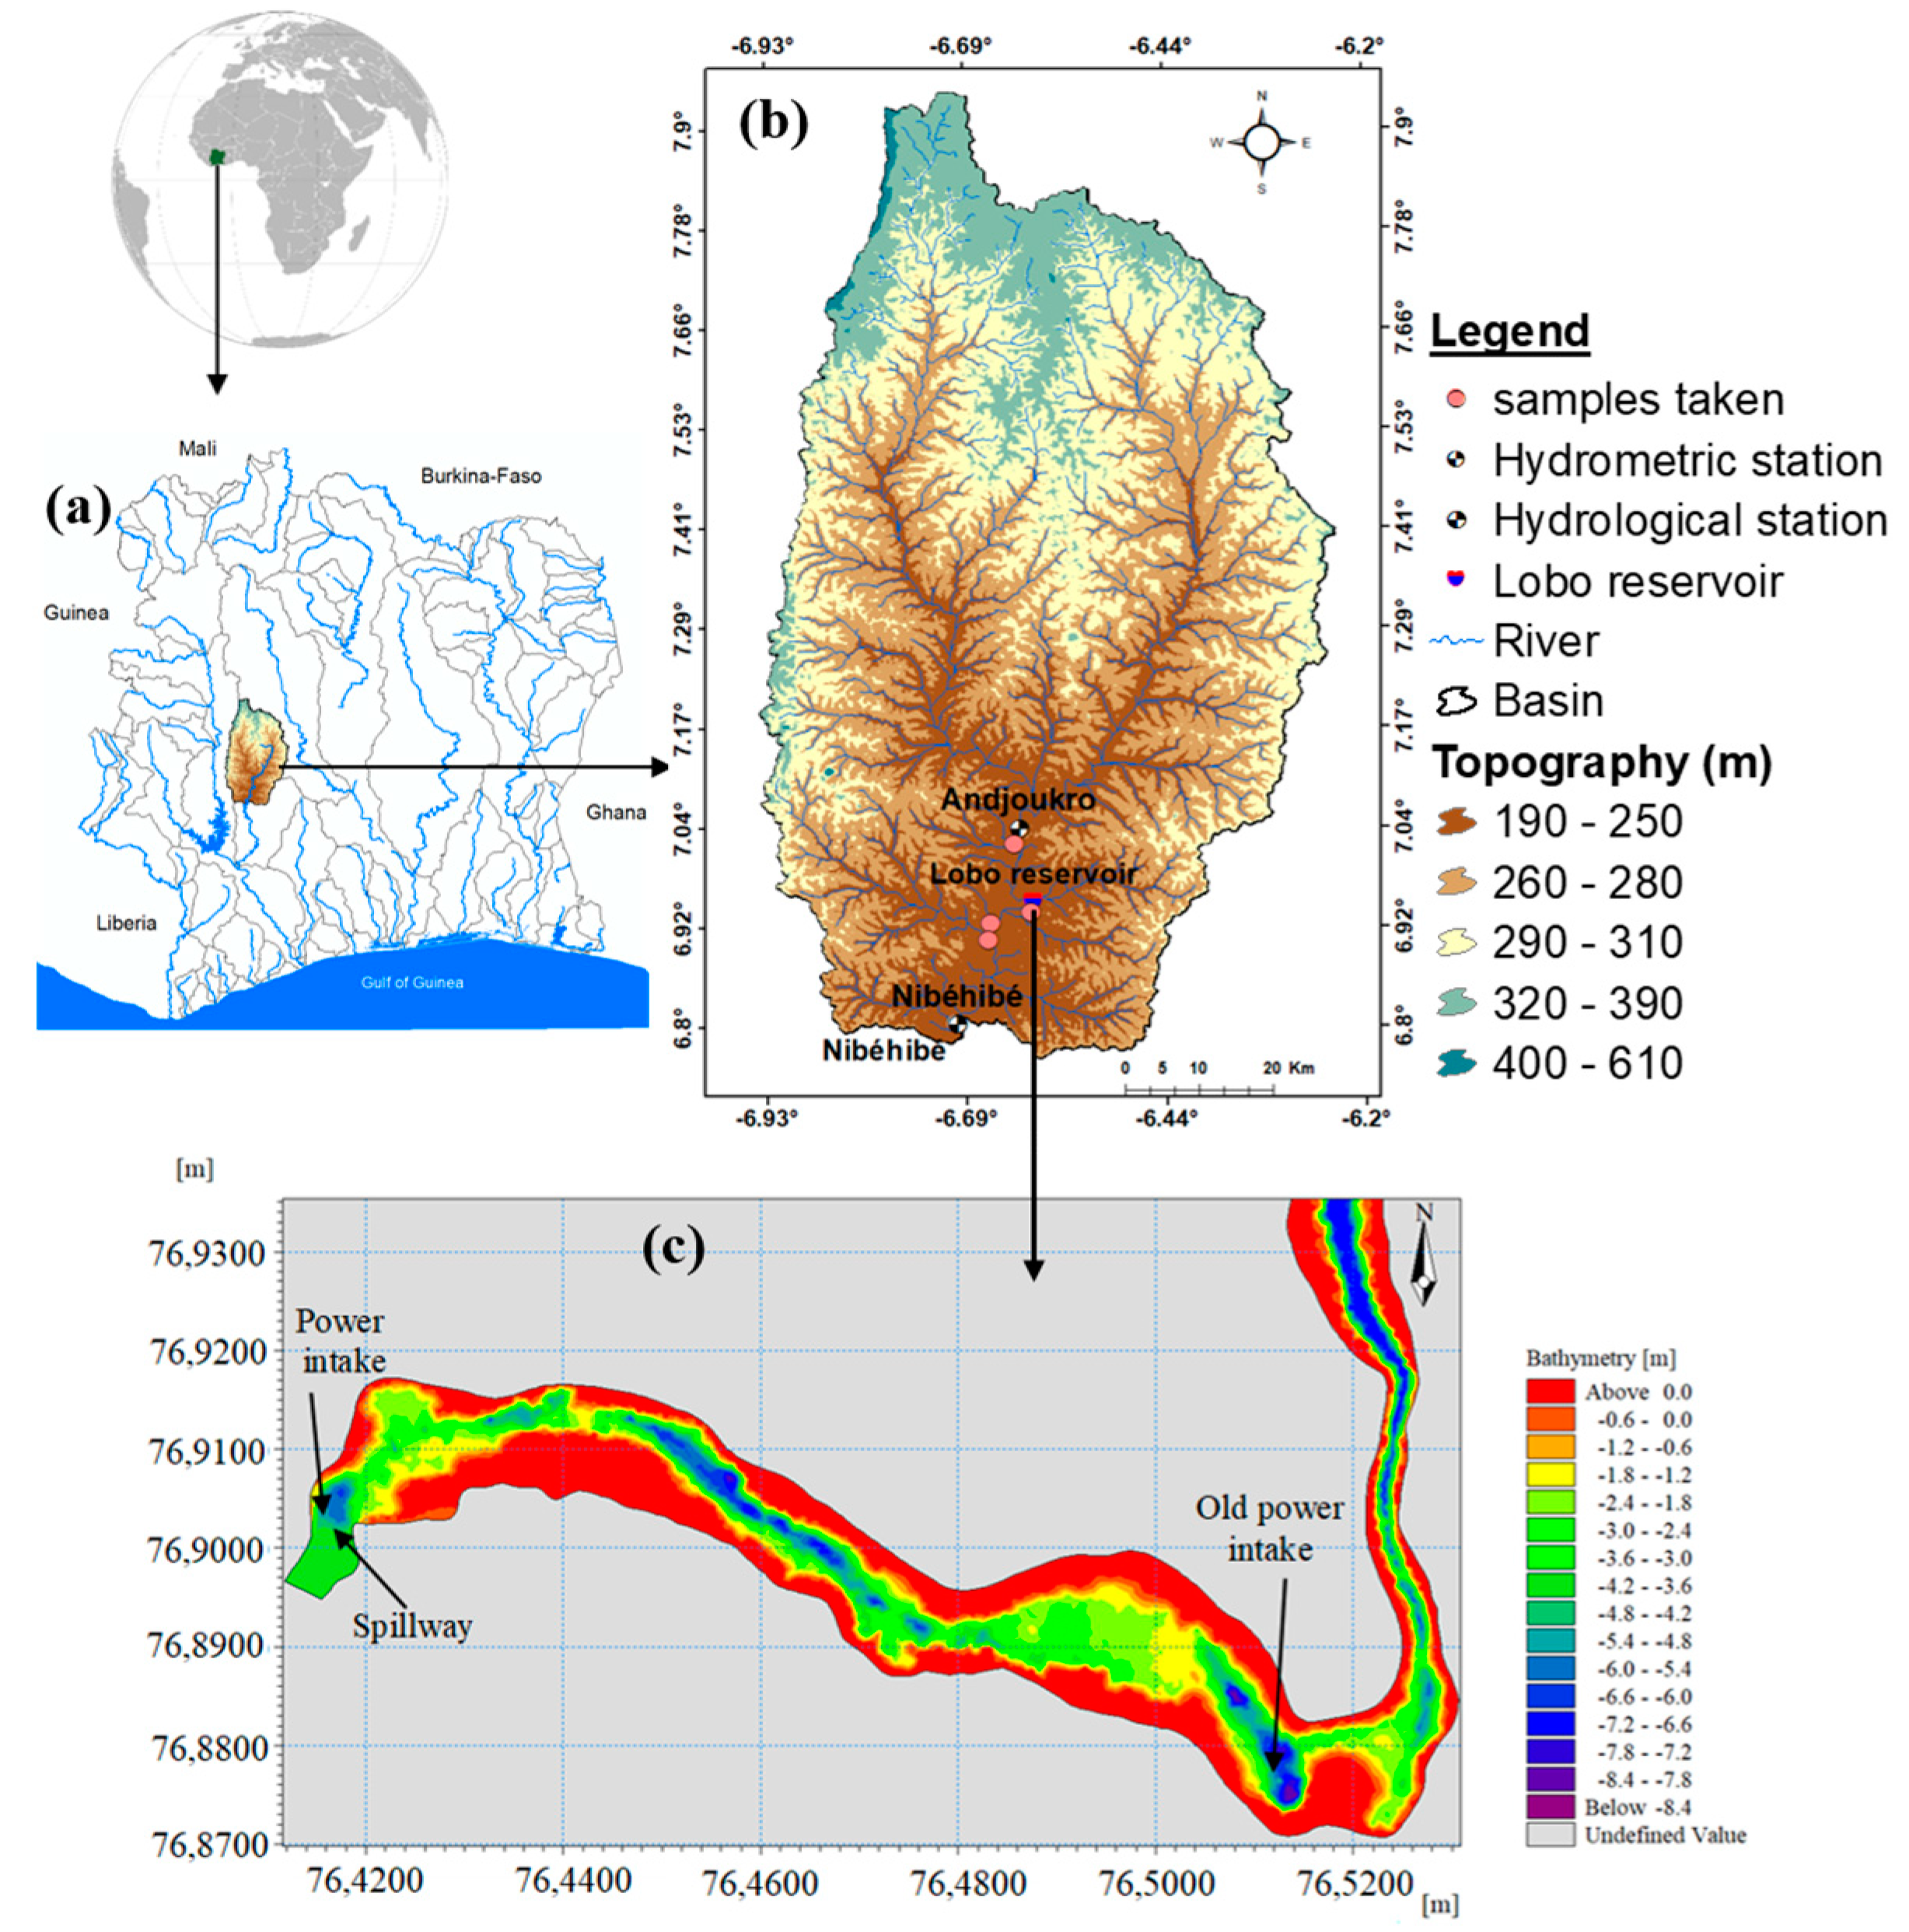
2.1. Study Area
2.2. Data
2.2.1. Hydrological Data
2.2.2. Suspended and Bottom Solids Data
2.2.3. Methods
Suspension Sediment Discharge
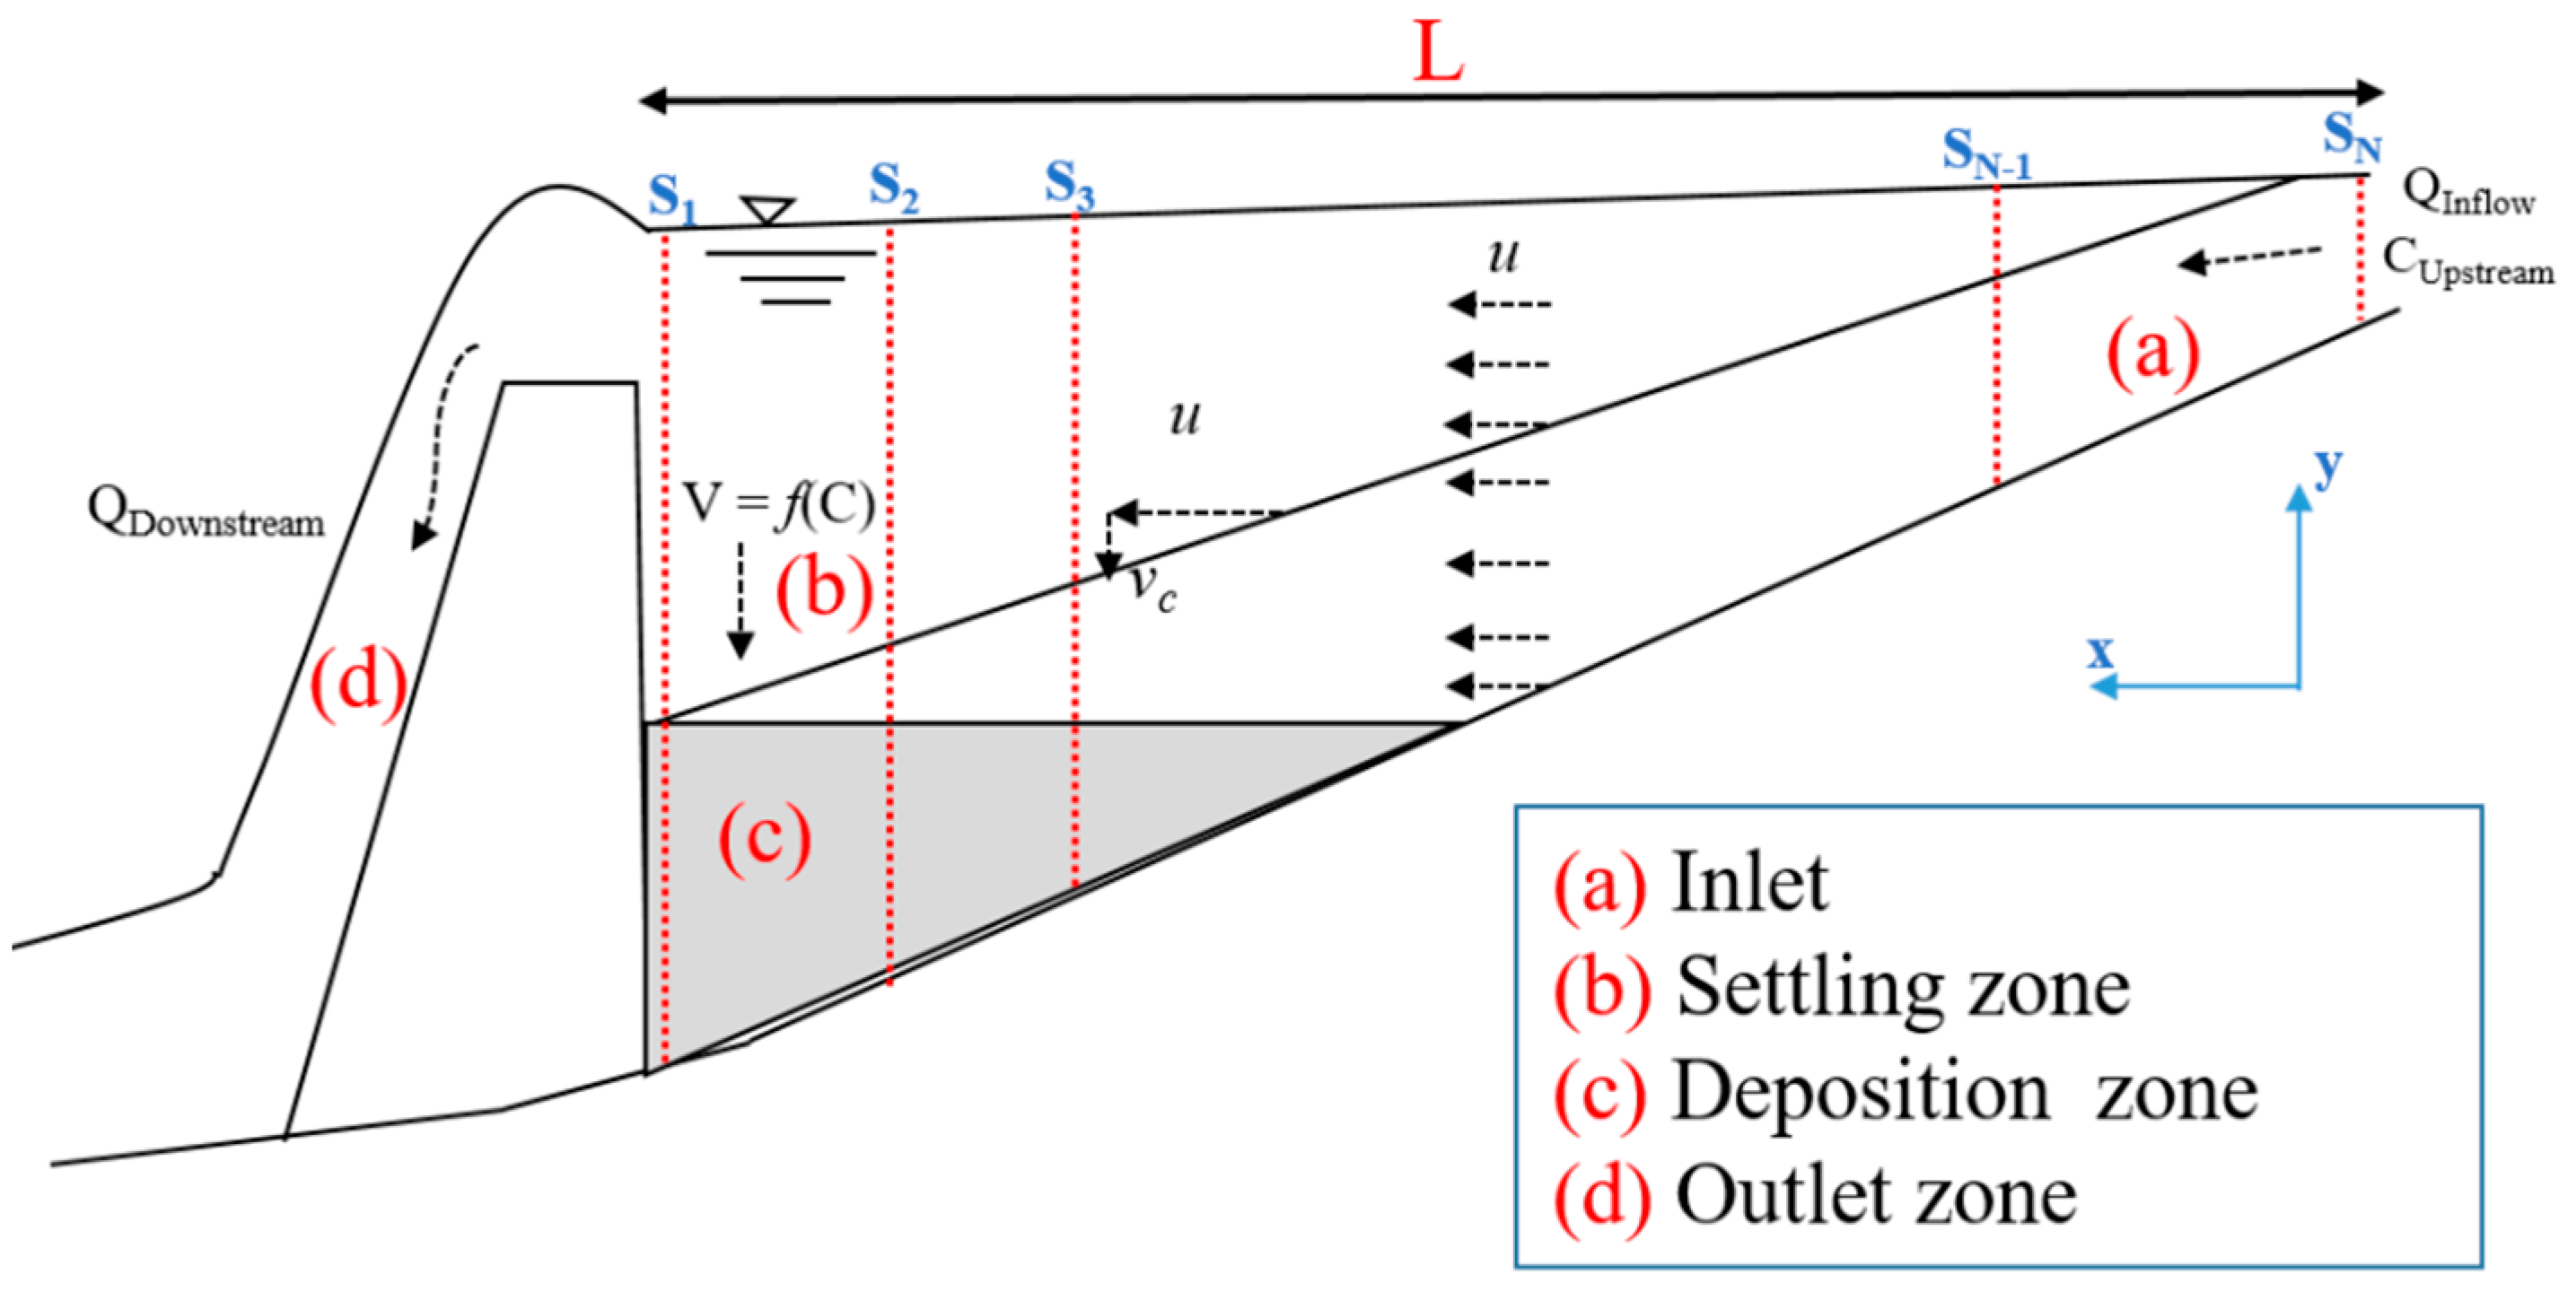
Configuration of the Mathematical Problem
Experimental Study of the Settling Velocity in Situ in a Sedimentation Tube
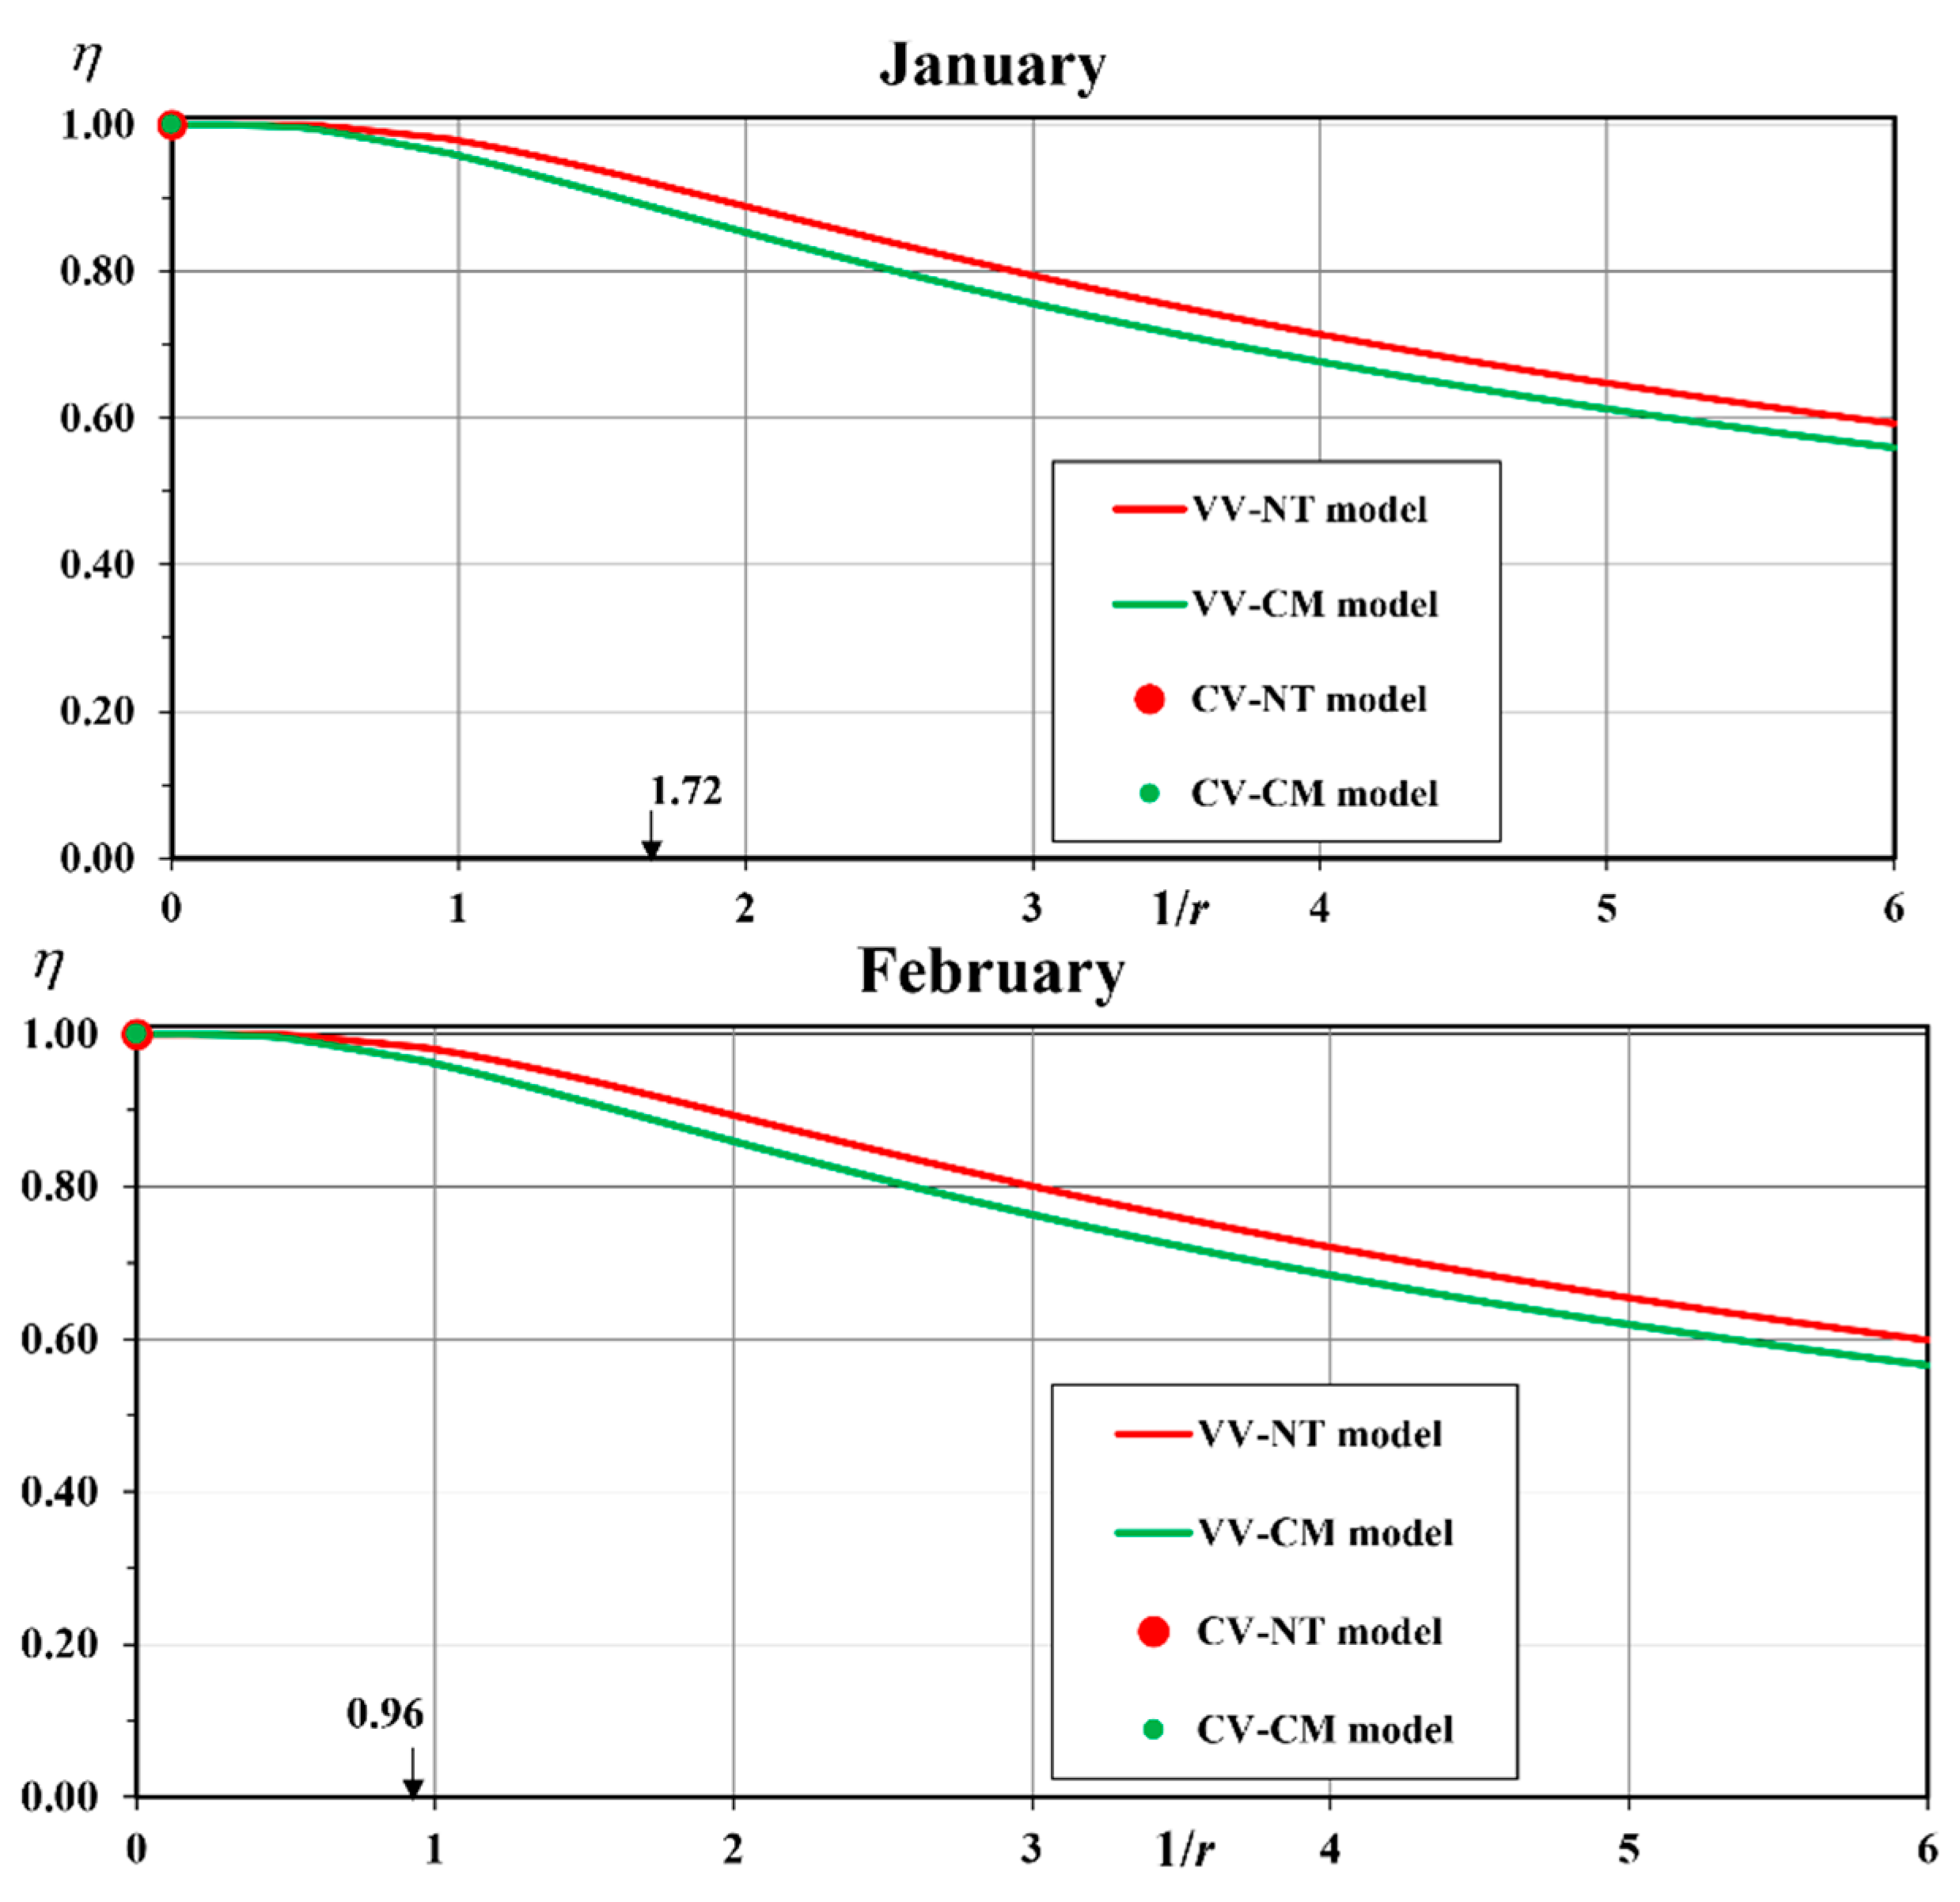
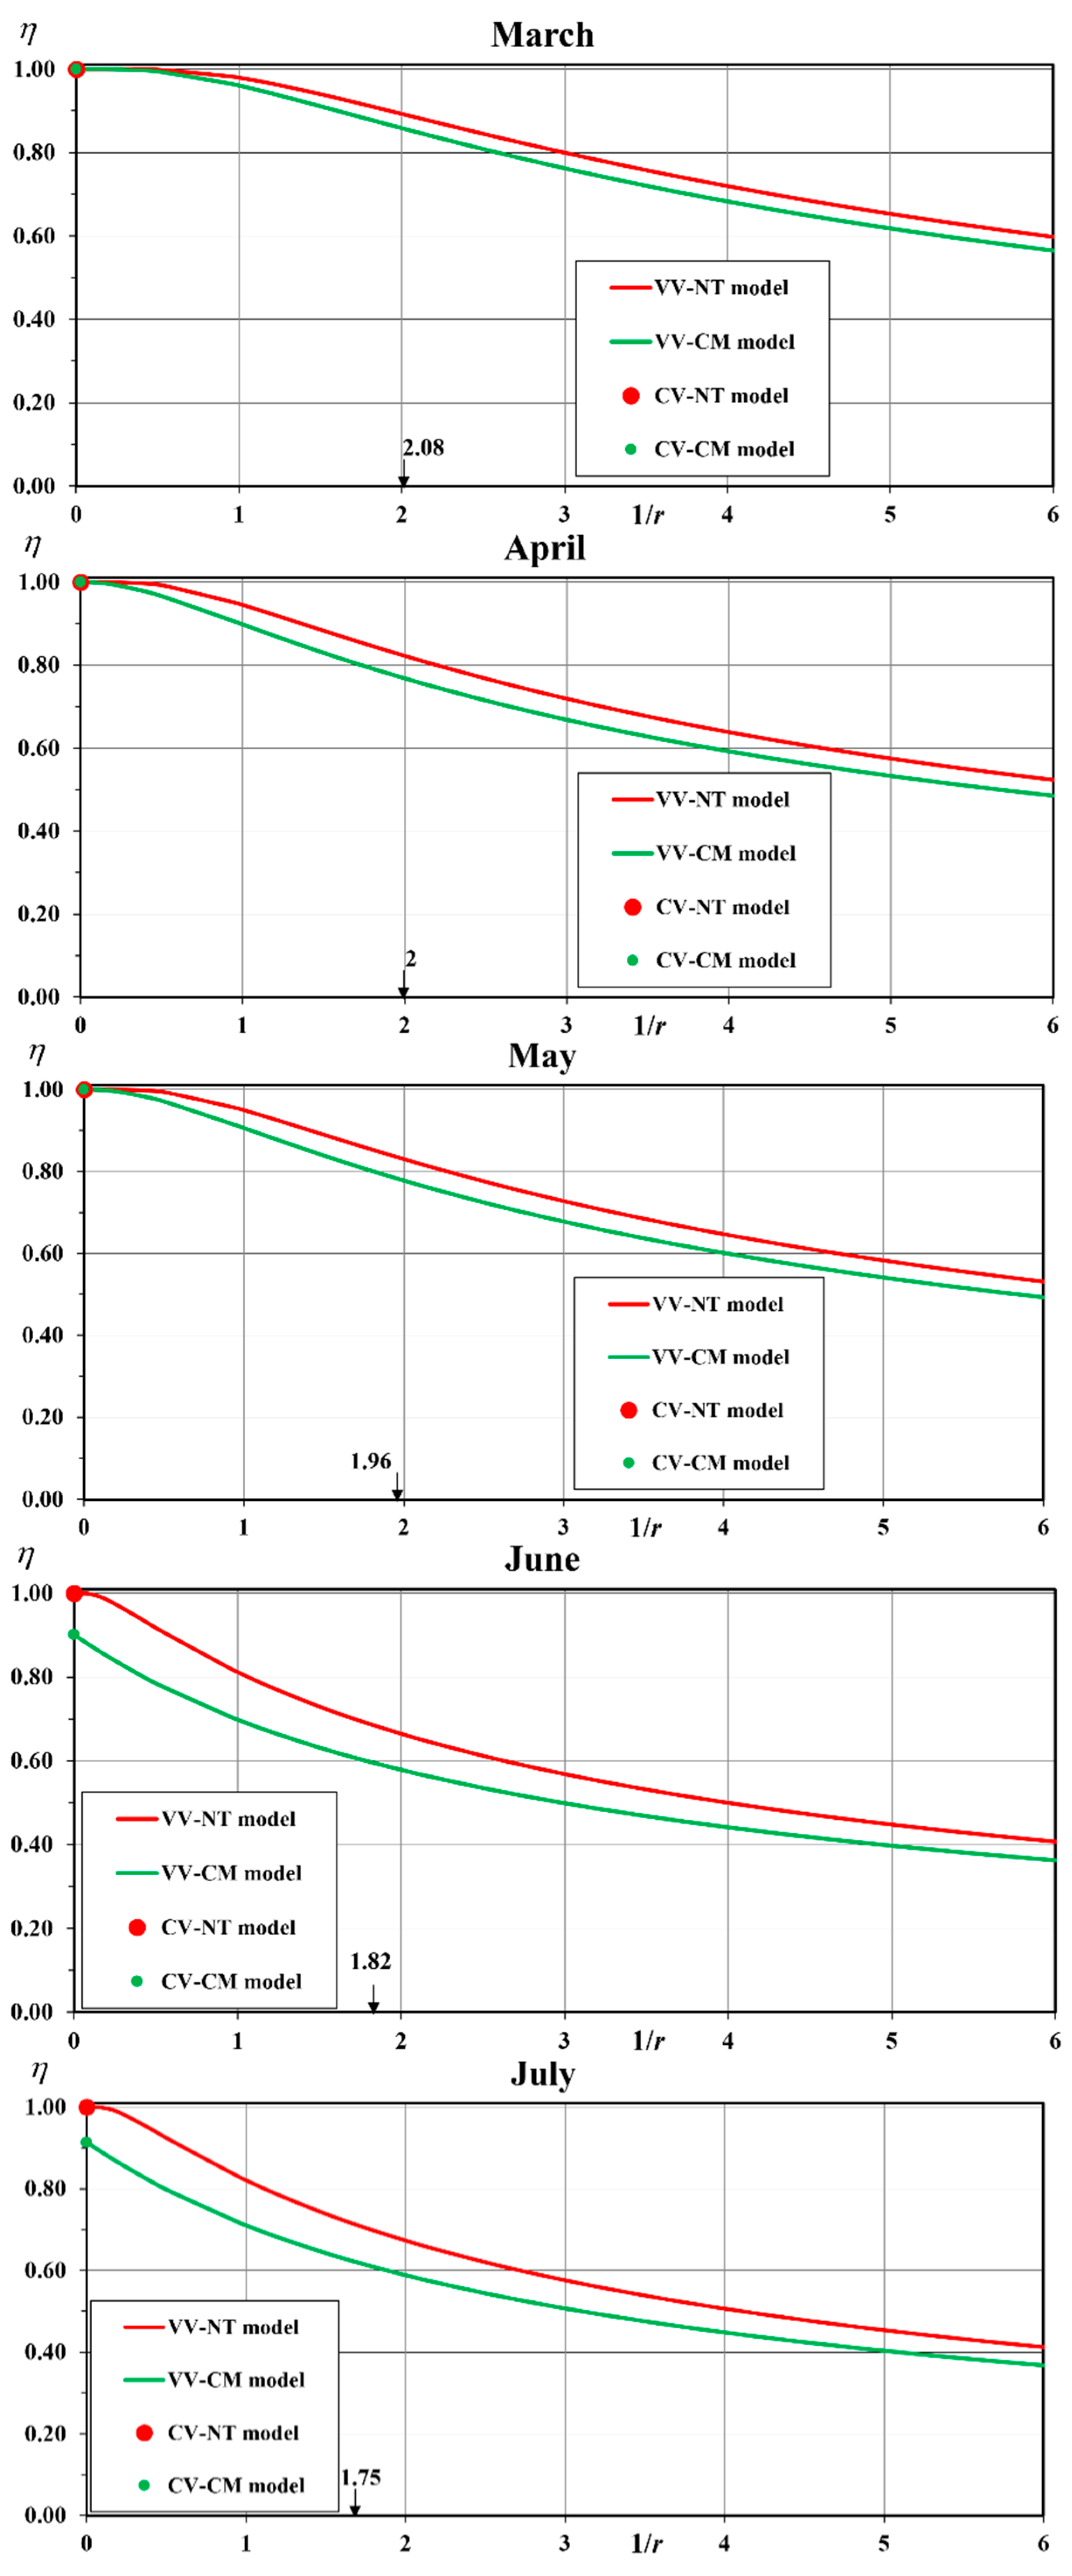
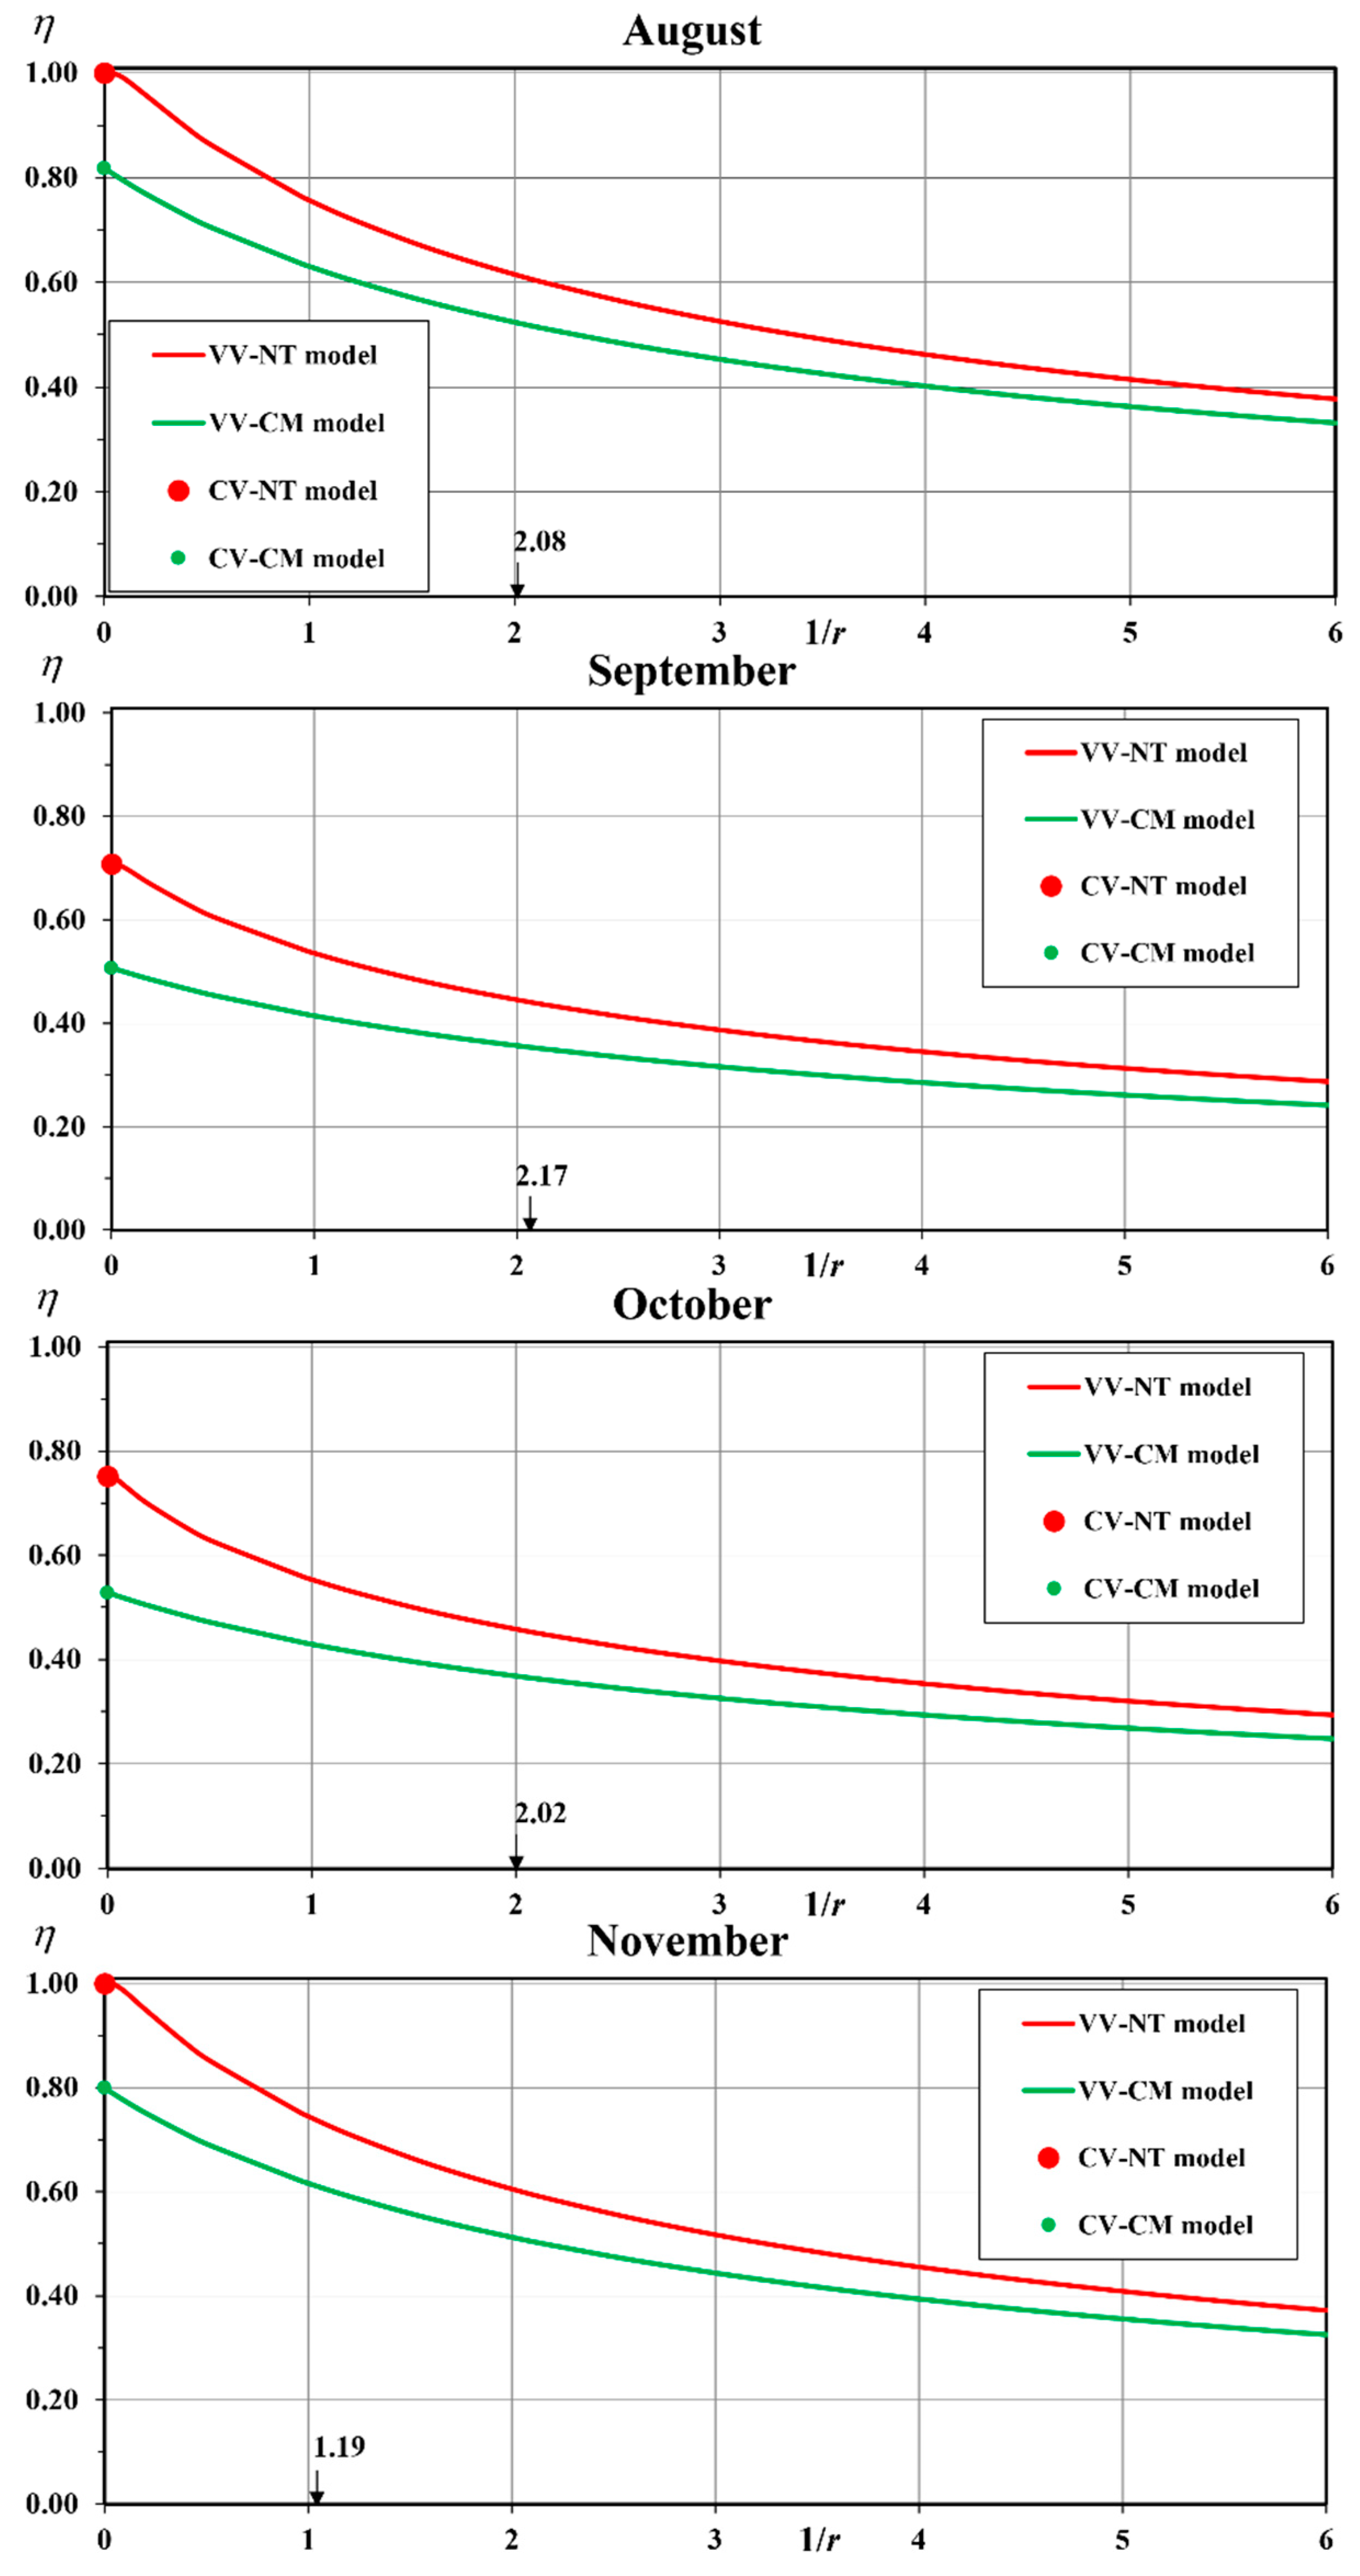
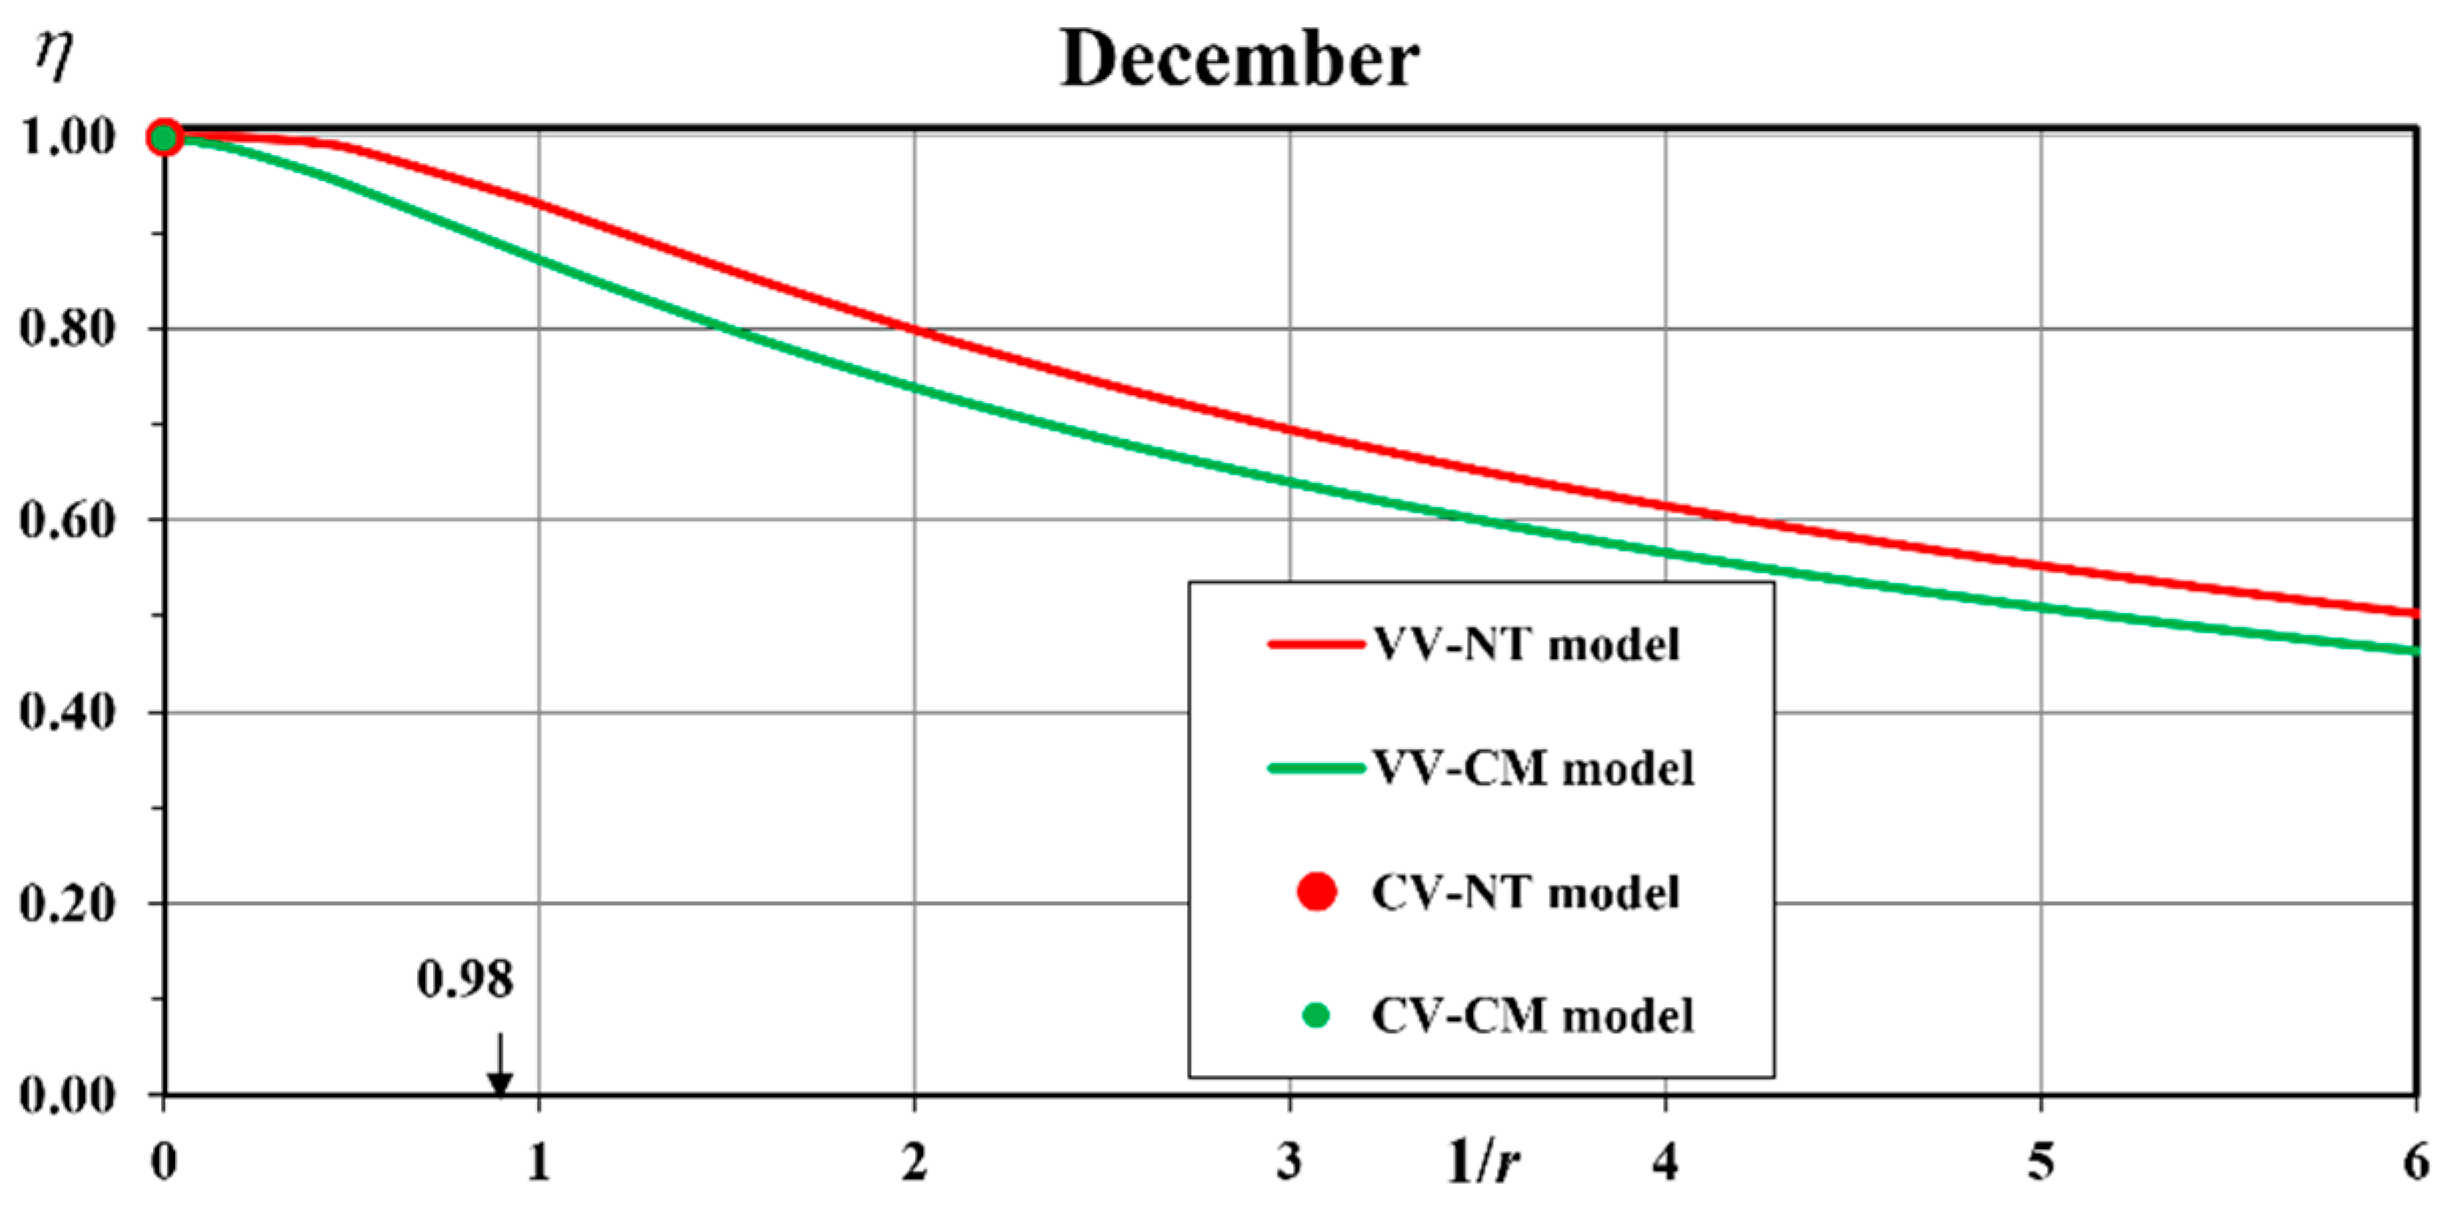
Modelling the Trapping Capacity of a Reservoir
- Constant settling velocity with complete mixing (CV-CM model)
- Suspended Solids with Varying Settling Velocities
- Varying settling velocity and no turbulence (VV-NT model)
- Varying settling velocity with complete mixing (VV-CM model)
3. Results
3.1. SSC in Lobo River Reservoir
3.2. Hydrodynamic Parameters of the Models
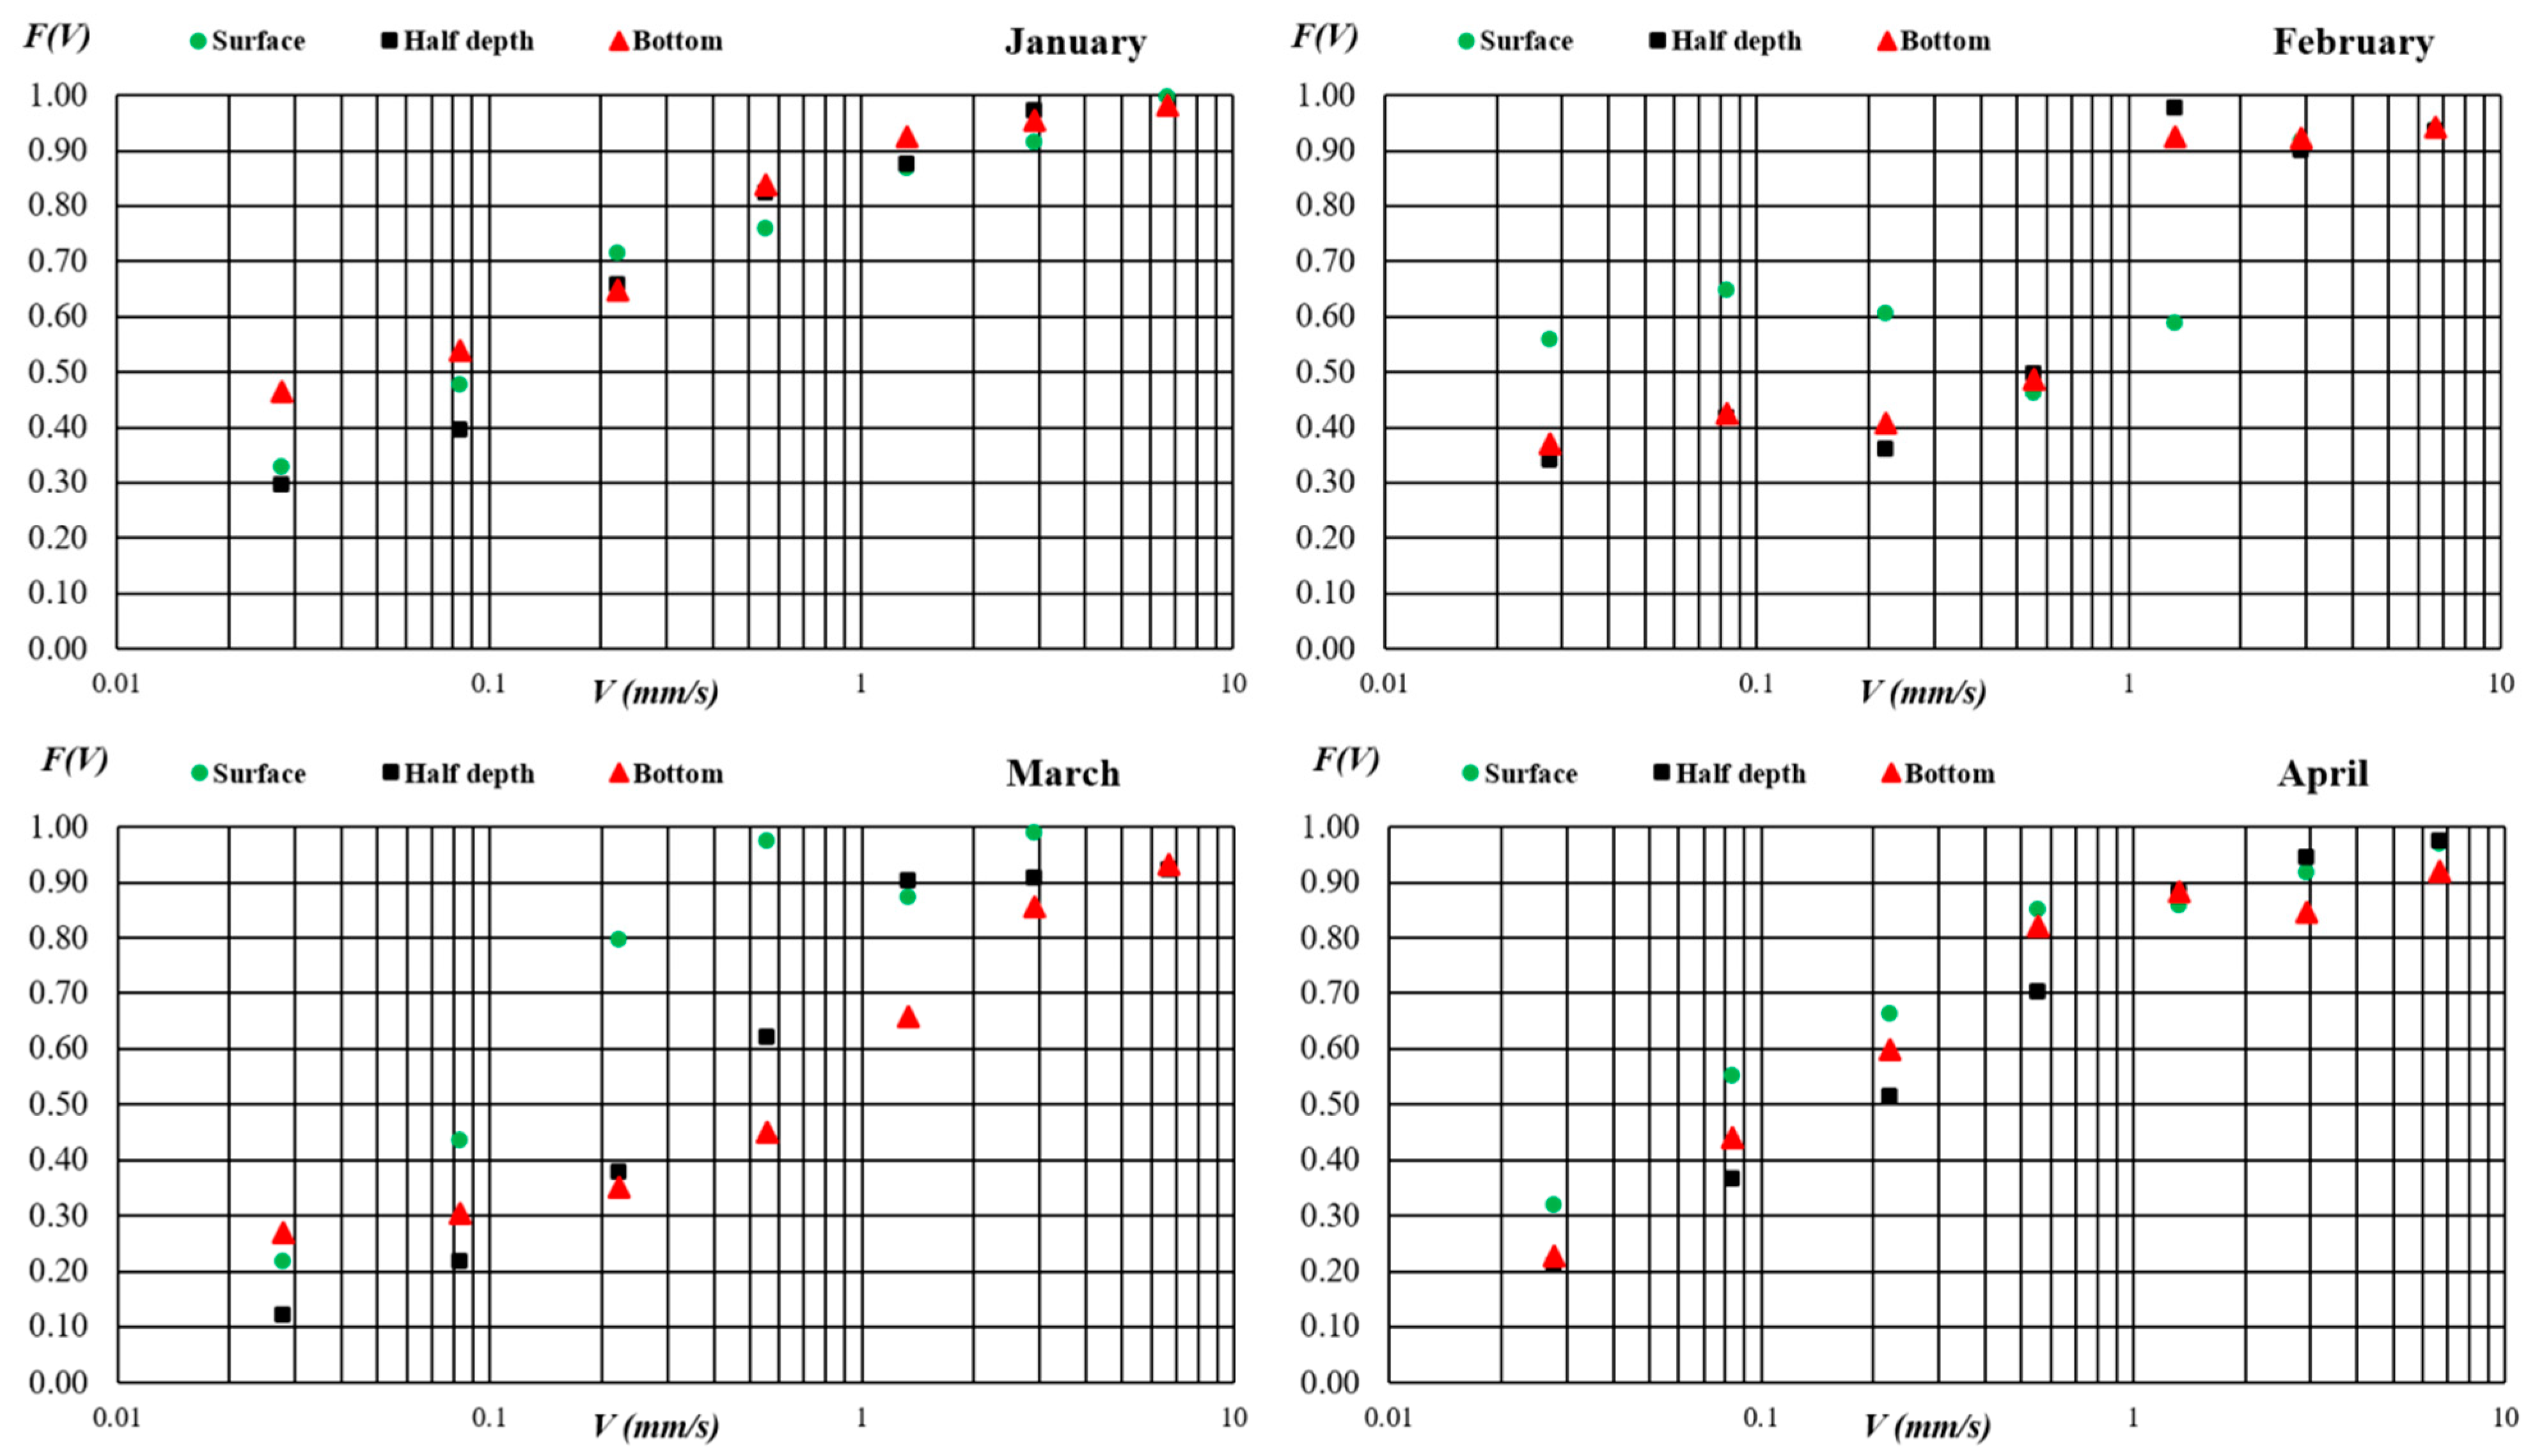
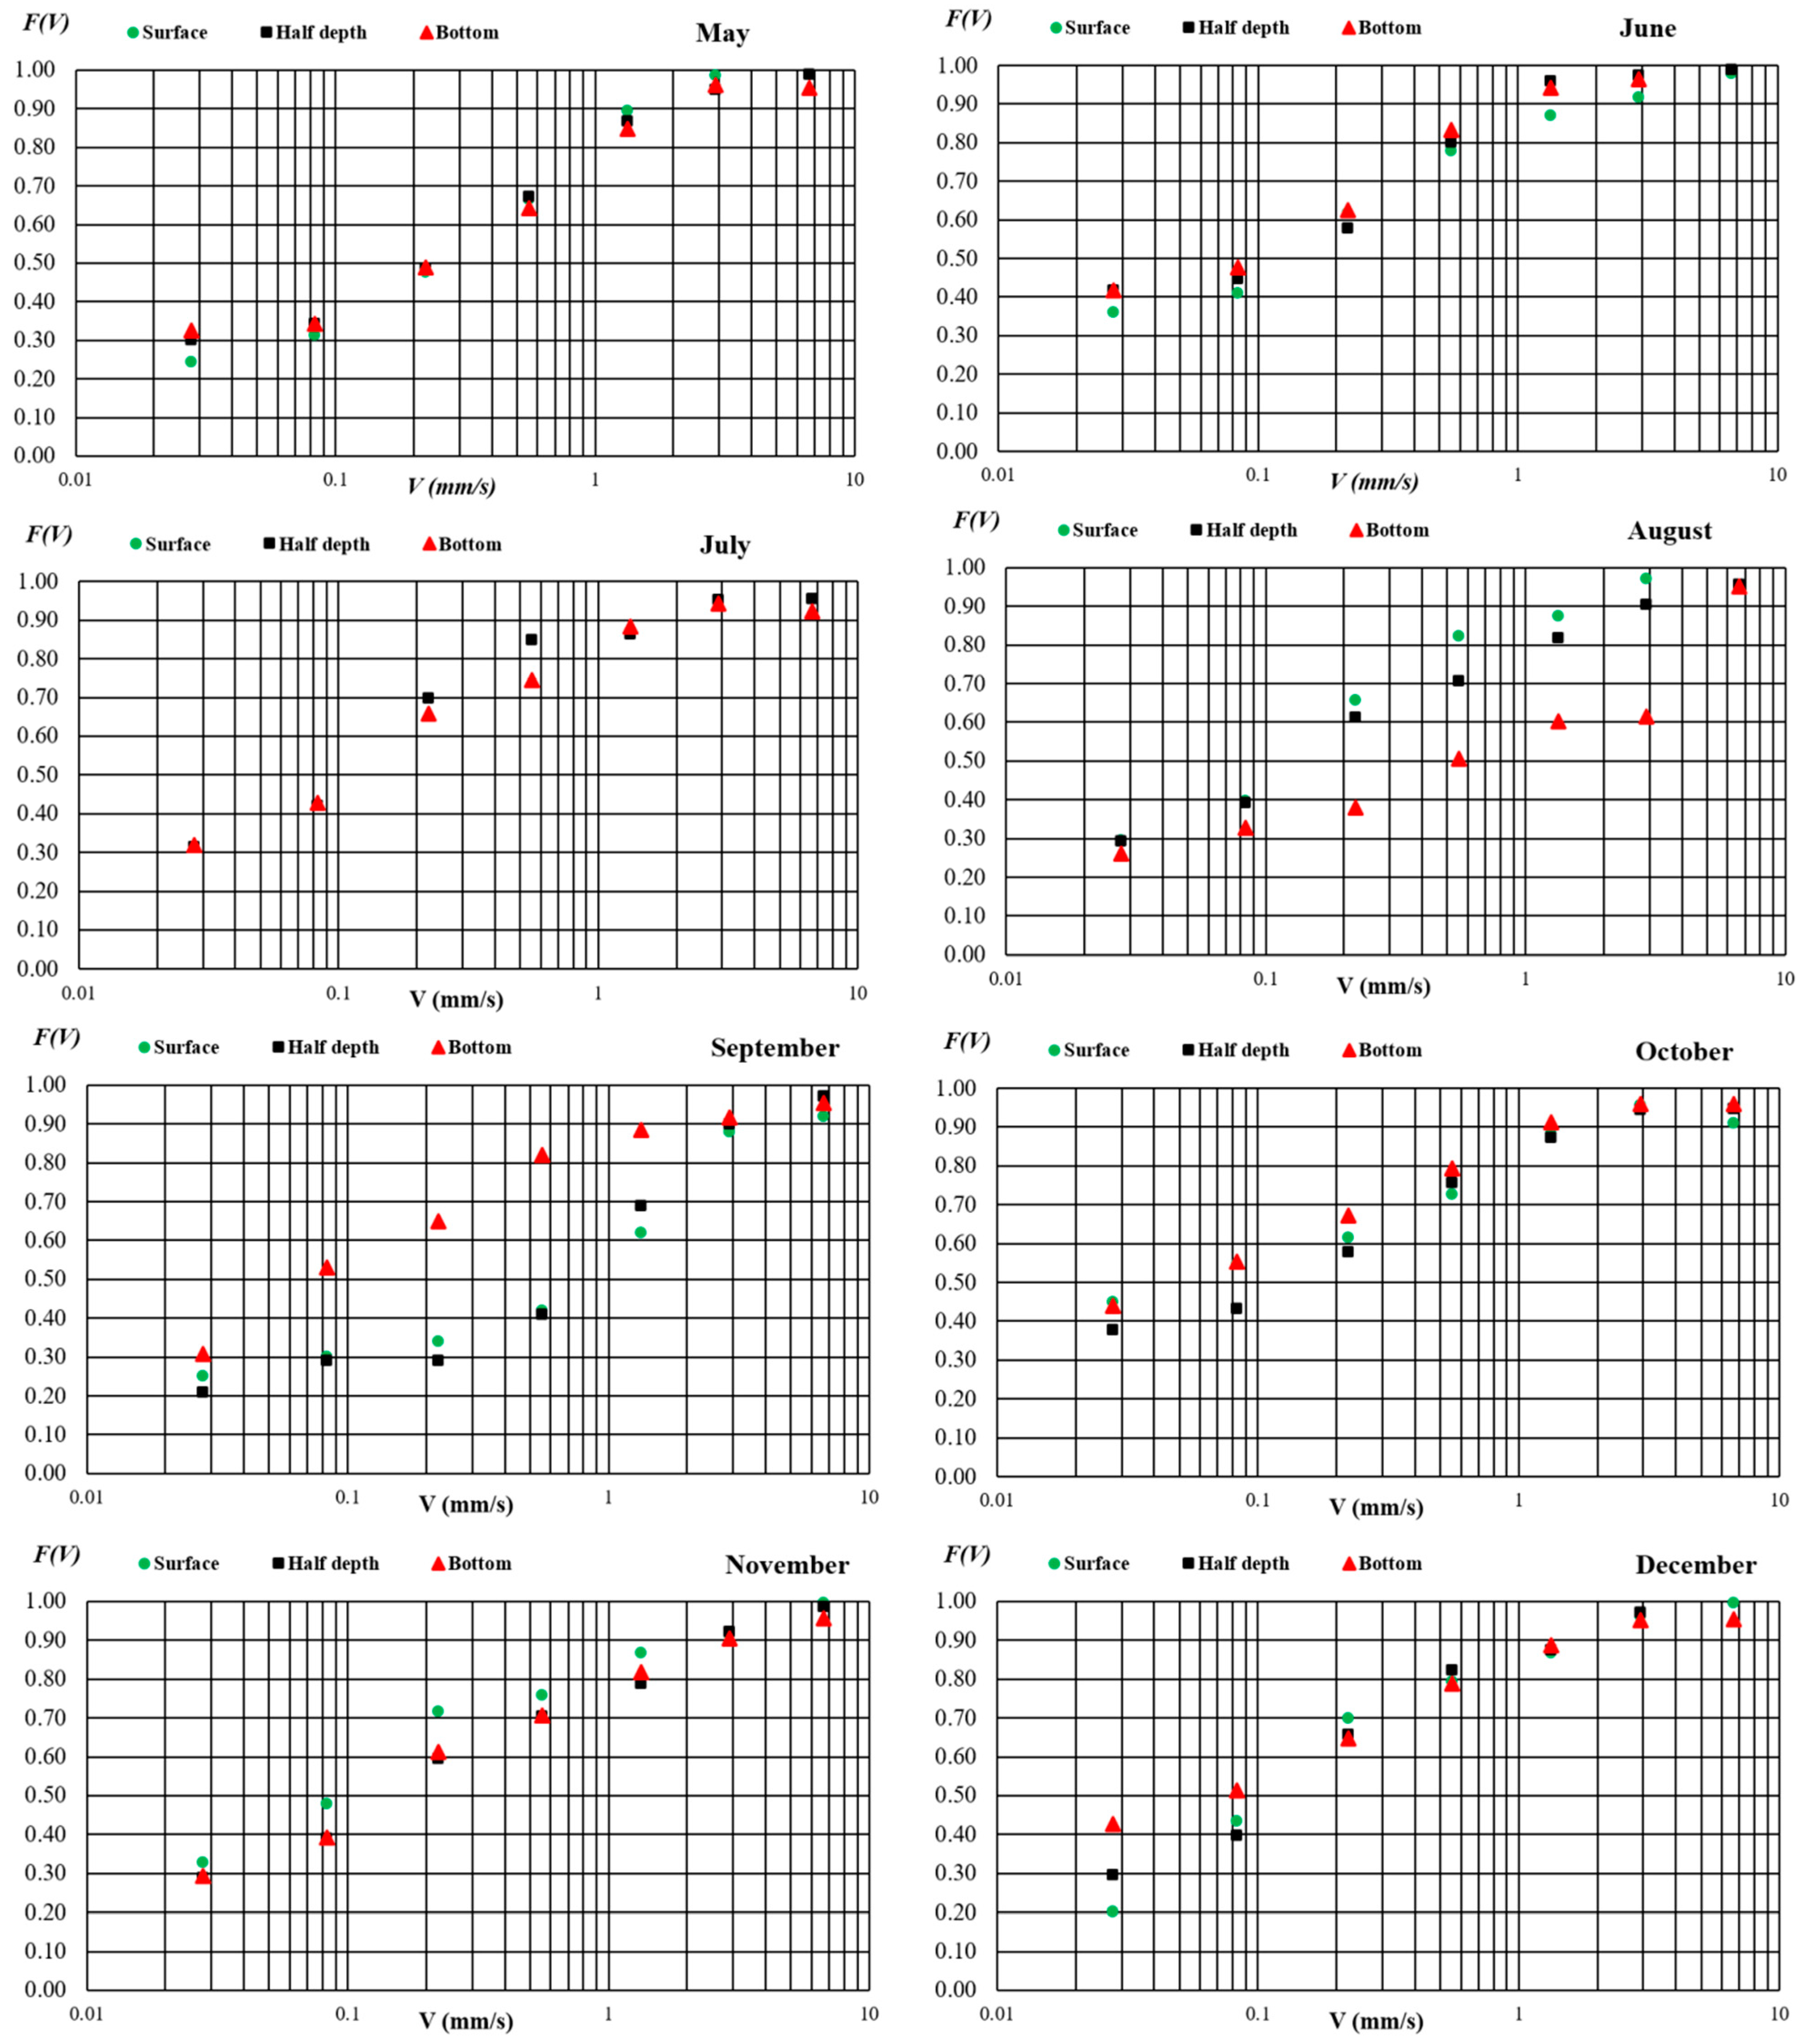
3.3. Function of Distributing the Settling Velocity of Suspended Solids
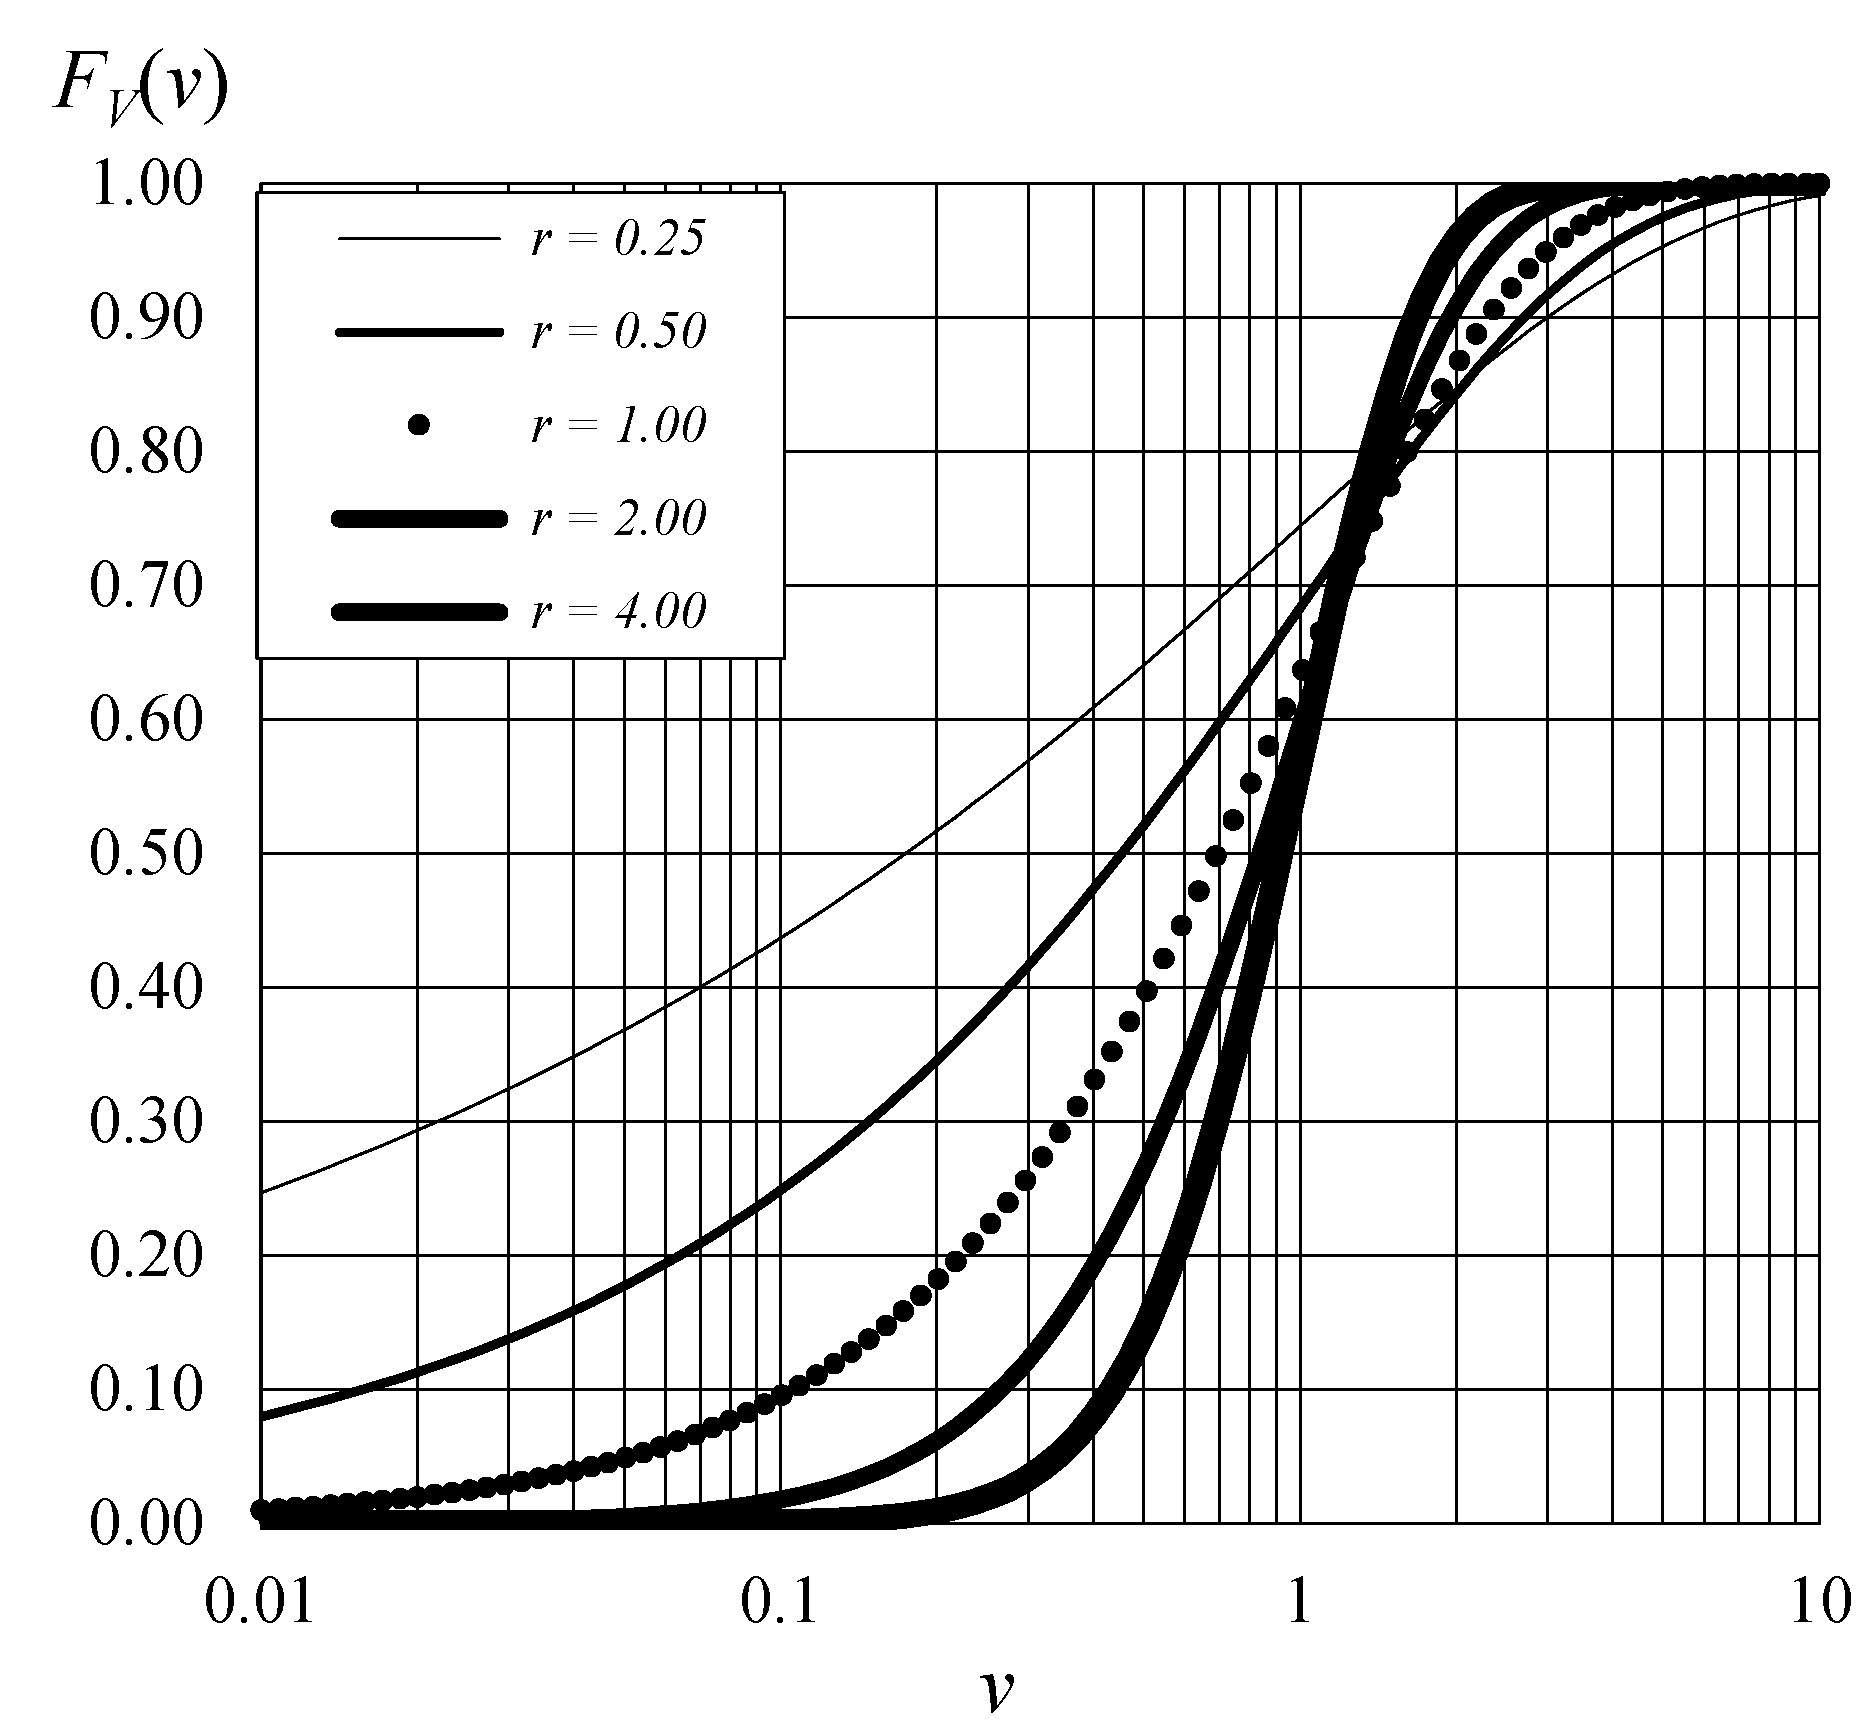
3.4. Variation of the Settling Velocity and Function of the Shape Parameter
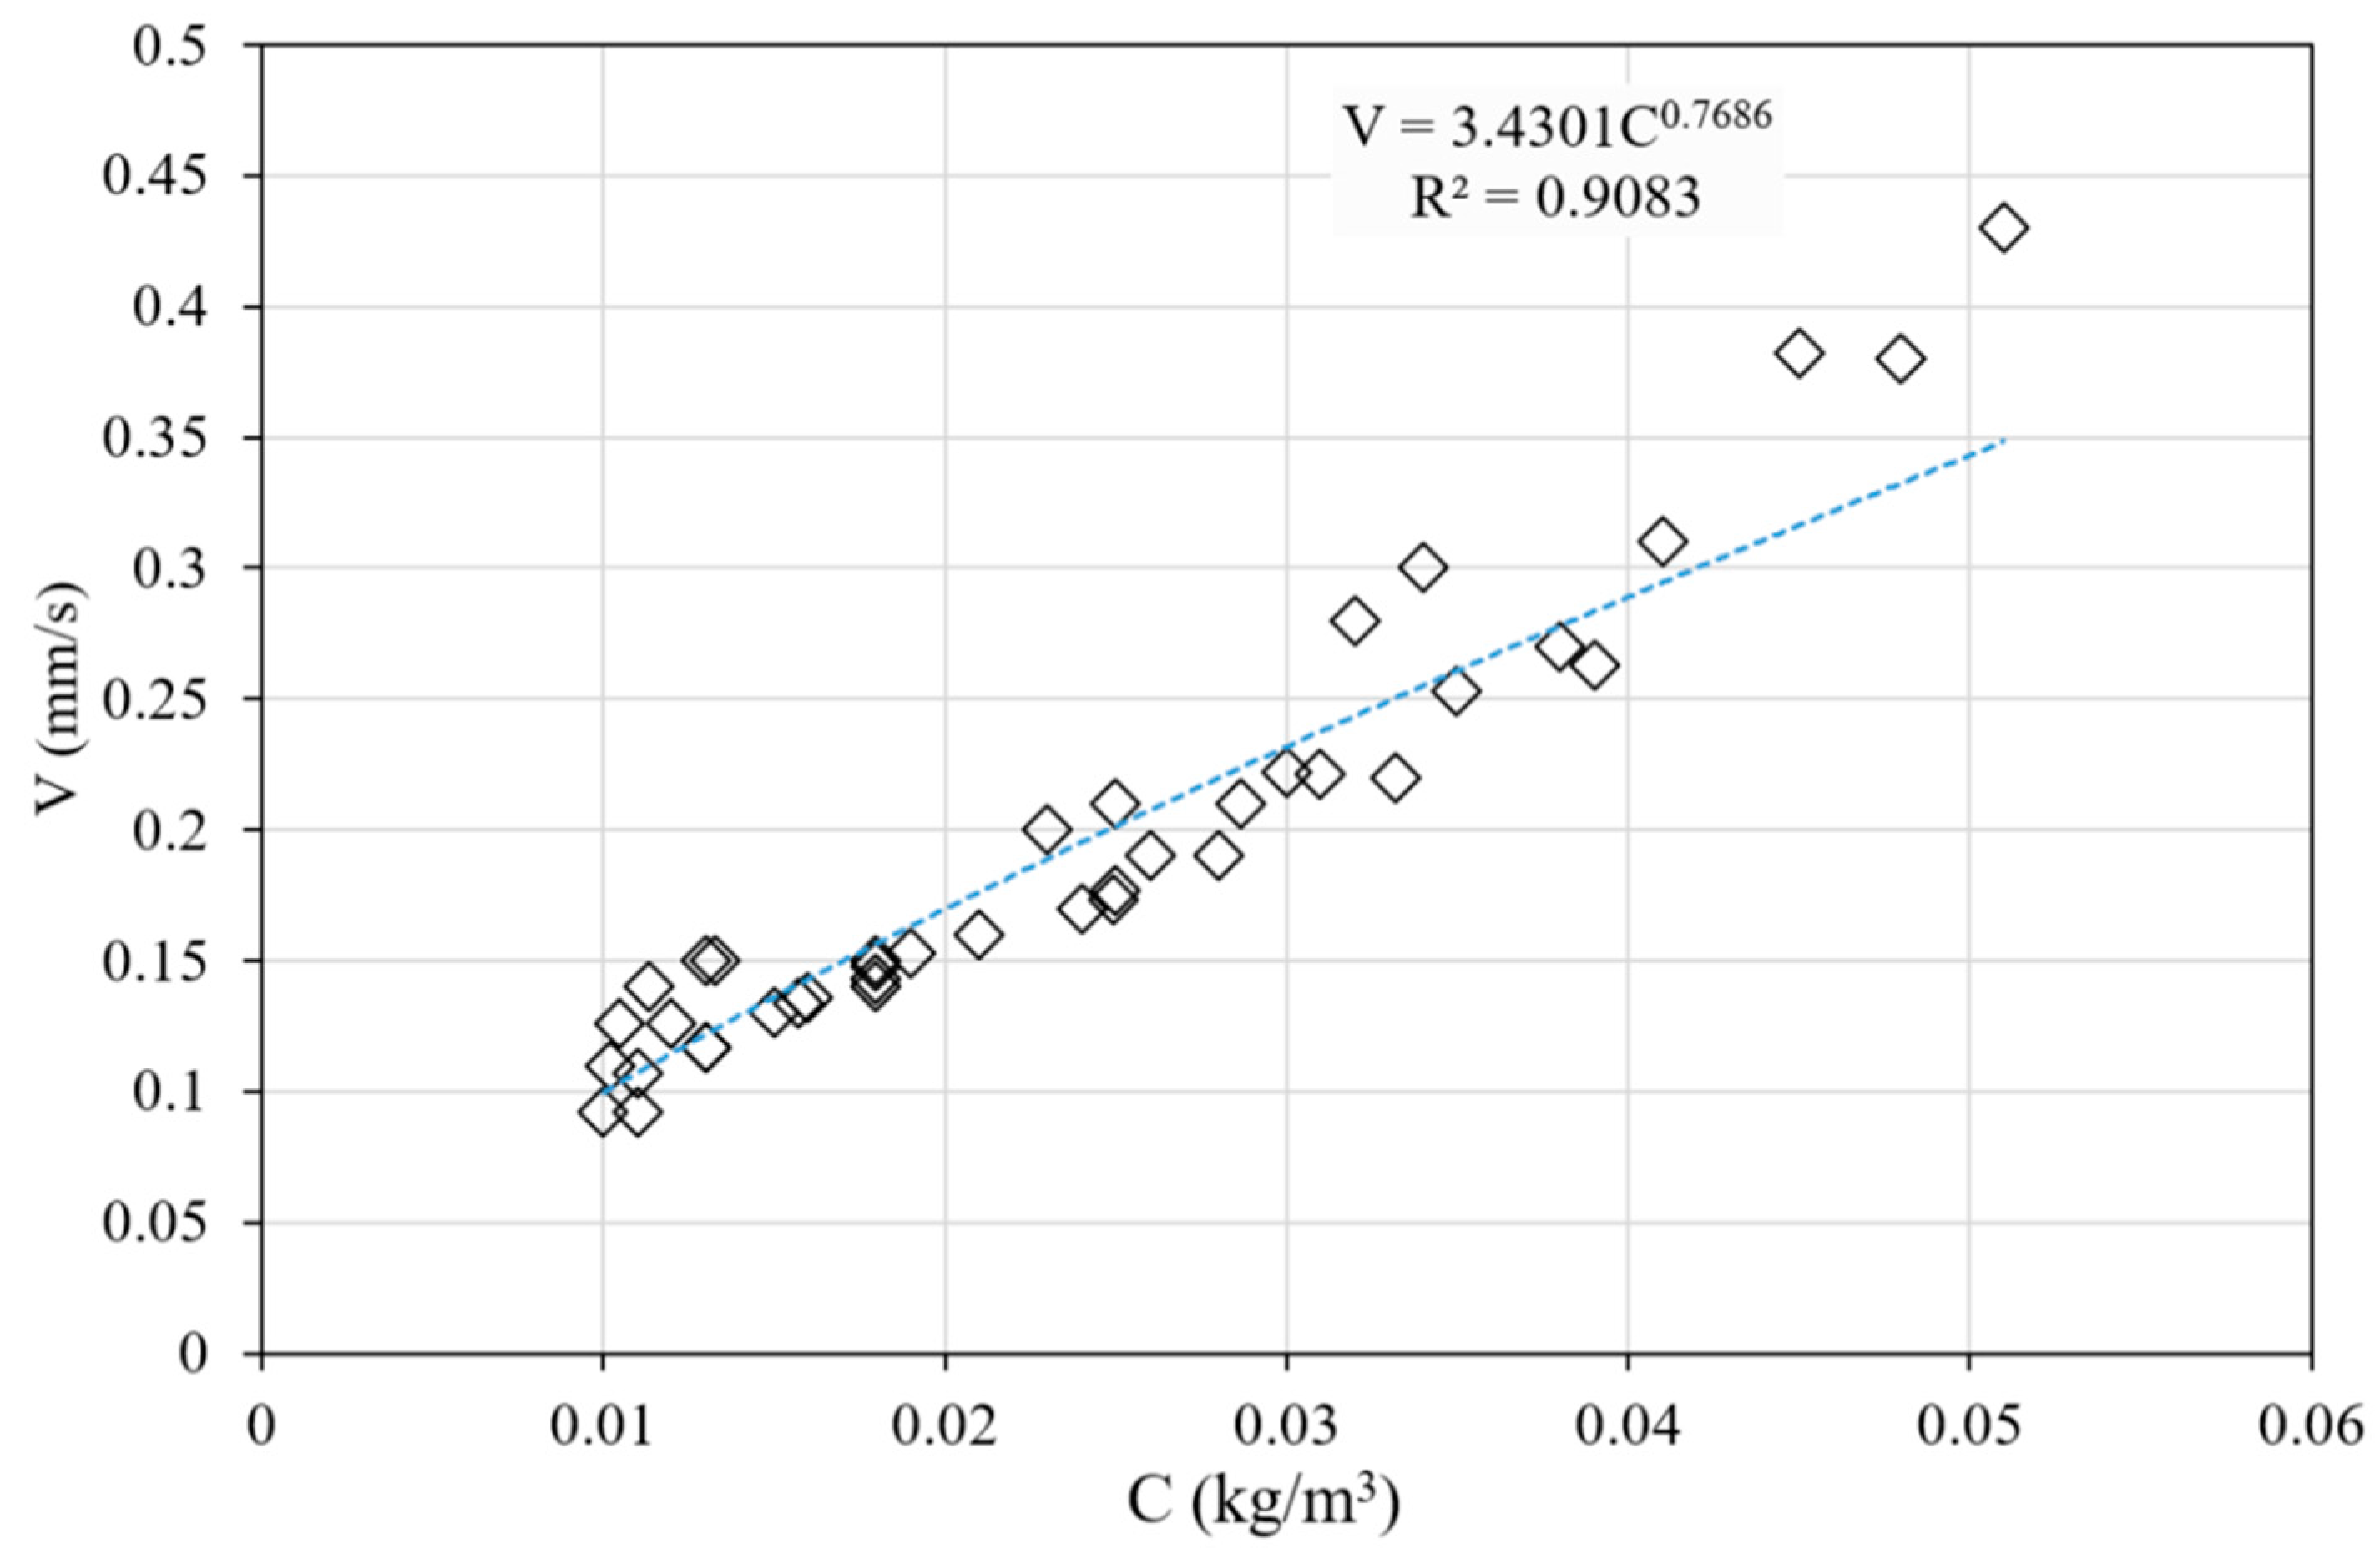
3.5. Settling Velocity as a Function of Concentration
3.6. Sediment Trapping Capacity of the Reservoir
4. Discussion
5. Conclusions
Author Contributions
Funding
Acknowledgments
Conflicts of Interest
References
- Malarkey, J.; Jago, C.; Hübner, R.; Jones, S. A simple method to determine the settling velocity distribution from settling velocity tubes. Cont. Shelf Res. 2013, 56, 82–89. [Google Scholar] [CrossRef]
- Sánchez, M.; Grimigni, P.; Delanoë, Y. Steady-state vertical distribution of cohesive sediments in a flow. Comptes Rendus Geosci. 2005, 337, 357–365. [Google Scholar] [CrossRef]
- Xiao, L.; Hu, Y.; Greenwood, P.; Kuhn, N.J. A Combined Raindrop Aggregate Destruction Test-Settling Tube (RADT-ST) Approach to Identify the Settling Velocity of Sediment. Hydrology 2015, 2, 176–192. [Google Scholar] [CrossRef] [Green Version]
- Orton, P.; Kineke, G. Comparing Calculated and Observed Vertical Suspended-Sediment Distributions from a Hudson River Estuary Turbidity Maximum. Estuar. Coast. Shelf Sci. 2001, 52, 401–410. [Google Scholar] [CrossRef] [Green Version]
- Tarpley, D.R.; Harris, C.K.; Friedrichs, C.T.; Sherwood, C.R. Tidal Variation in Cohesive Sediment Distribution and Sensitivity to Flocculation and Bed Consolidation in An Idealized, Partially Mixed Estuary. JMSE 2019, 7, 334. [Google Scholar] [CrossRef] [Green Version]
- Jones, S.; Jago, C. Determination of settling velocity in the Elbe estuary using quisset tubes. J. Sea Res. 1996, 36, 63–67. [Google Scholar] [CrossRef]
- Cornelisse, J.M. The field pipette withdrawal tube (FIPIWITU). J. Sea Res. 1996, 36, 37–39. [Google Scholar] [CrossRef]
- Puls, W.; Kühl, H. Settling velocity determination using the BIGDAN settling tube and the Owen settling tube. J. Sea Res. 1996, 36, 119–125. [Google Scholar] [CrossRef]
- van Leussen, W. The RWS field settling tube. J. Sea Res. 1996, 36, 83–86. [Google Scholar] [CrossRef]
- Owen, M.W. Determination of the Settling Velocities of Cohesive Muds; Hydraulic Research Station IT: Wallingford, UK, 1976; p. 161. [Google Scholar]
- Dyer, K.; Cornelisse, J.; Dearnaley, M.; Fennessy, M.; Jones, S.; Kappenberg, J.; McCave, I.; Pejrup, M.; Puls, W.; Van Leussen, W.; et al. A comparison of in situ techniques for estuarine floc settling velocity measurements. J. Sea Res. 1996, 36, 15–29. [Google Scholar] [CrossRef]
- Koffi, B.; Kouassi, K.L.; Sanchez, M.; Kouadio, Z.A.; Yao, A.B. Estimation de la sédimentation dans la retenue d’eau de la rivière Lobo à l’aide de la théorie des bassins de décantation. XVIèmes Journées 2020, 249–258. [Google Scholar] [CrossRef]
- Li, W.; Yang, S.; Hu, J.; Fu, X.; Zhang, P. Field measurements of settling velocities of fine sediments in Three Gorges Reservoir using ADV. Int. J. Sediment Res. 2016, 31, 237–243. [Google Scholar] [CrossRef]
- Tian, C.; Zheng, S.; Su, M. An ultrasound-based monitoring of kaolinite flocculent settling processes. Appl. Acoust. 2023, 203, 109186. [Google Scholar] [CrossRef]
- Sanchez, M. Settling velocity of the suspended sediment in three high-energy environments. Ocean. Eng. 2006, 33, 665–678. [Google Scholar] [CrossRef]
- Krone, R.B. The Significance of Aggregate Properties to Transport Processes. In Estuarine Cohesive Sediment Dynamics; Mehta, A.J., Ed.; Springer: New York, NY, USA, 1986; pp. 66–84. [Google Scholar] [CrossRef]
- Tattersall, G.; Elliott, A.; Lynn, N. Suspended sediment concentrations in the Tamar estuary. Estuar. Coast. Shelf Sci. 2003, 57, 679–688. [Google Scholar] [CrossRef]
- Avenard, J.M. Aspects du Contact Foret-Savane dans le Centre et l’Ouest de la Cote d’Ivoire: Etude descriptive; IRD Editions: Kowloon, Hong Kong, 1974; p. 35. [Google Scholar]
- Yao, A.B.; Goula, T.A.; Kouadio, Z.A.; Kouakou, K.E.; Kane, A.; Sambo, S. Analyse de la variabilité climatique et quantification des Ressources en eau en zone tropicale humide: Cas du basin. Versant de la lobo au centre-ouest de la Côte d’Ivoire. Rev. Ivoir. Des Sci. Technol. 2012, 19, 136–157. [Google Scholar]
- Koffi, B.; Kouadio, Z.A.; Kouassi, K.H.; Yao, A.B.; Sanchez, M.; Kouassi, K.L. Impact of Meteorological Drought on Streamflows in the Lobo River Catchment at Nibéhibé, Côte d’Ivoire. JWARP 2020, 12, 495–511. [Google Scholar] [CrossRef]
- Maiga, A.H.; Denyigba, K.; Allorent, J. Eutrophisation des petites retenues d’eau en Afrique de l’Ouest: Causes et conséquences: Cas de la retenue d’eau sur la Lobo à Daloa en Côte d’Ivoire. Sci. Technol. 2001, 7, 16–29. [Google Scholar]
- Avenard, J.M. Aspect de la Géomorphologie; Avenard, J.M., Eldin, M., Girard, G., Sircoulon, J., Touchebeuf, P., Guillaumet, J.L., Adjanohoun, E., Perraud, A., Eds.; Mémoire ORSTOM: Paris, France, 1971; p. 50. [Google Scholar]
- Kouassı, K.L.; Kouame, K.I.; Konan, K.S.; Angulo, M.S.; Deme, M.; Meledje, N.H.E. Two-Dimensional Numerical Simulation of the Hydro-Sedimentary Phenomena in Lake Taabo, Côte d’Ivoire. Water Resour. Manage. 2013, 27, 4379–4394. [Google Scholar] [CrossRef]
- Lowrance. ELITE Ti, Manuel de l’utilisateur; Lowrance Electronics, Inc.: Tulsa, OK, USA, 2019. [Google Scholar]
- Association française de normalisation (AFNOR). Qualité de l’eau: Environnement, Sssociation Française de Normalization, 1st ed.; AFNOR: Paris, France, 1994. [Google Scholar]
- Sanchez, M. Effects of convective-diffusive vertical mixing on the conception of rectangular settling basins. Stoch. Environ. Res. Risk Assess. 2018, 32, 1457–1463. [Google Scholar] [CrossRef]
- Huang, R.; Zhang, Q.; Zhang, W.; Li, Z. Experimental research on the effect of suspended sediment stratification on turbulence characteristics. Estuar. Coast. Shelf Sci. 2022, 278, 108128. [Google Scholar] [CrossRef]
- Yan, H.; Kouyi, G.L.; Gonzalez-Merchan, C.; Becouze-Lareure, C.; Sebastian, C.; Barraud, S.; Bertrand-Krajewski, J.-L. Computational fluid dynamics modelling of flow and particulate contaminants sedimentation in an urban stormwater detention and settling basin. Environ. Sci. Pollut. Res. 2014, 21, 5347–5356. [Google Scholar] [CrossRef]
- Khawaja, B.A. Evolutions morphologiques induites par l’implantation de barrages dans les fleuves à fort débit solide. Ph.D. Thesis, Université de Nantes, Nantes, France, 2011. [Google Scholar]
- Dramais, G.; Camenen, B.; Le Coz, J. Comparaison de methodes pour la mesure des matieres en suspension dans les cours d’eau, en présence de sable. La Houille Blanche 2018, 104, 96–105. [Google Scholar] [CrossRef]
- Endalew, L.; Mulu, A. Estimation of reservoir sedimentation using bathymetry survey at Shumburit earth dam, East Gojjam zone Amhara region, Ethiopia. Heliyon 2022, 8, e11819. [Google Scholar] [CrossRef]
- Hountondji, B.; Codo, F.; Ahoumenou, Y.; Sintondji, L.O.; Ahouansou, L. Infiltration des eaux et des depots dans la retenue du mini-barrage de wourowourokou dans le nord du benin. Larhyss J. 2019, 16, 201–214. [Google Scholar]
- Mélèdje, N.H. Modelisation de la Dynamique hydrologique Et du flux des sediments Dans le lac du barrage hydroelectrique d’Ayamé 1. Ph.D. Thesis, Université Nanguy Abrogoua, Abidjan, Côte d’Ivoire, 2015. [Google Scholar]
- Achite, M.; Meddi, M. Spatial and temporal variability of streamflow and solid yields in semiarid areas. Case of the oued Mina basin (Northwest Algeria). J. Water Sci. 2005, 18, 37–56. [Google Scholar]
- Bouguerra, S.-A.; Bouanani, A. Analyse saisonnière et interannuelle de la dynamique des flux en suspension dans le bassin versant de l’oued Boukiou (nord-ouest de l’Algérie). Geomorphologie 2019, 25, 2. [Google Scholar] [CrossRef] [Green Version]
- Bouguerra, S.-A.; Bouanani, A. Simulation study on the flow behavior of wet particles in the power-law liquid-solid fluidized bed. Powder Technol. 2023, 415, 118117. [Google Scholar] [CrossRef]
- El Mahi, A.; Meddi, M.; Bravard, J.P. Analyse du transport solide en suspension dans le bassin versant de l’Oued El Hammam (Algérie du Nord). Hydrol. Sci. J. 2012, 57, 642–1661. [Google Scholar] [CrossRef]
- Meledje, N.; Kouassi, K.; N'Go, Y.; Kouassi, K.; Savane, I.; Aka, K. Caractérisation des apports sédimentaires et morphologie du lac du barrage hydroélectrique d’Ayame 1 (Sud-Est Côte d’Ivoire). Int. J. Bio. Chem. Sci. 2014, 8, 1290. [Google Scholar] [CrossRef] [Green Version]
- Yang, Y.; Zheng, J.; Zhu, L.; Zhang, H.; Wang, J. Influence of the Three Gorges Dam on the transport and sorting of coarse and fine sediments downstream of the dam. J. Hydrol. 2022, 615, 128654. [Google Scholar] [CrossRef]
- Kouassi, L.K. Hydrologie, Transport Solide et Modélisation de la Sédimentation dans les Lacs des Barrages Hydroélectriques de Côte d’Ivoire: Cas du Lac de Taabo. Ph.D. Thesis, Université Abobo-Adjamé, Daloa, Côte d’Ivoire, 2007. [Google Scholar]
- Hosseinzadeh-Tabrizi, A.; Ghaeini-Hessaroeyeh, M. Modelling of dam failure-induced flows over movable beds considering turbulence effects. Comput. Fluids 2018, 161, 199–210. [Google Scholar] [CrossRef]
- Khoshkonesh, A.; Daliri, M.; Riaz, K.; Dehrashid, F.A.; Bahmanpouri, F.; Di Francesco, S. Dam-break flow dynamics over a stepped channel with vegetation. J. Hydrol. 2022, 613, 128395. [Google Scholar] [CrossRef]
- Schmidt, J.C. Effects of Dams on Rivers. In Reference Module in Earth Systems and Environmental Sciences; Elsevier: Amsterdam, The Netherlands, 2022; p. B9780128191668003000. [Google Scholar] [CrossRef]


| Parameters | Values | Units |
|---|---|---|
| Date of commission | 1976 | |
| Water inflow | 11.18 | m3/s |
| Water outflow | 13.33 | m3/s |
| Average length of the reservoir (L) | 4300 | m |
| Average width of the reservoir (B) | 74 | m |
| Average depth | 3.5 | m |
| Reservoir area | 0.3 | km2 |
| Flow rate drawn | 675 | m3/h |
| Weir length | 47 | m |
| Spillway crest elevation | 231,033 | m |
| Volume at reservoir elevation | 360,000 | m3 |
| Jan | Feb | Mar | Apr | May | Jun | Jul | Aug | Sep | Oct | Nov | Dec | Annual Average | |
|---|---|---|---|---|---|---|---|---|---|---|---|---|---|
| Inflow (m3/s) | 0.98 | 0.77 | 1.21 | 3.32 | 2.8 | 10.5 | 9.34 | 16.5 | 40 | 58 | 15.3 | 2.8 | 13.458 |
| SSLin (kg/m3) | 0.011 | 0.011 | 0.018 | 0.018 | 0.015 | 0.013 | 0.012 | 0.016 | 0.025 | 0.031 | 0.013 | 0.010 | 0.016 |
| Outflow (m3/s) | 1.30 | 1.76 | 4.69 | 6.62 | 10.63 | 12.65 | 13.50 | 17.05 | 35.70 | 45.00 | 17.20 | 5.32 | 14.283 |
| SSLout (kg/m3) | 0.01 | 0.01 | 0.02 | 0.02 | 0.01 | 0.01 | 0.01 | 0.01 | 0.02 | 0.03 | 0.01 | 0.07 | 0.019 |
| Average (kg/m3) | 0.011 | 0.010 | 0.017 | 0.017 | 0.014 | 0.012 | 0.013 | 0.014 | 0.022 | 0.030 | 0.012 | 0.040 | 0.018 |
| Inflow sediment discharge (t) | 29.9 | 20.3 | 58.3 | 155.8 | 113.2 | 360.9 | 300.2 | 707.1 | 2592.0 | 4815.8 | 515.5 | 75.0 | 9744.1 |
| Outflow sediment discharge (t) | 34.7 | 44.0 | 188.2 | 274.5 | 370.0 | 327.9 | 470.1 | 548.0 | 1665.6 | 3495.3 | 490.4 | 996.5 | 8905.2 |
| Budget (t) | −4.8 | −23.7 | −129.9 | −118.8 | −256.7 | 33.1 | −170 | 159.1 | 926.4 | 1320.5 | 25.1 | −921.5 | 838.9 |
| Jan | Feb | Mar | Apr | May | Jun | Jul | Aug | Sep | Oct | Nov | Dec | |
|---|---|---|---|---|---|---|---|---|---|---|---|---|
| Q | 0.98 | 0.77 | 1.21 | 3.32 | 2.8 | 10.47 | 9.34 | 16.5 | 40 | 58 | 15.3 | 2.8 |
| B (m) | 74 | 74 | 74 | 74 | 74 | 74 | 74 | 74 | 74 | 74 | 74 | 74 |
| L (m) | 4300 | 4300 | 4300 | 4300 | 4300 | 4300 | 4300 | 4300 | 4300 | 4300 | 4300 | 4300 |
| H (m) | 2.012 | 1.98 | 2.31 | 2.55 | 2.66 | 2.88 | 2.74 | 2.93 | 3.875 | 3.5 | 3.38 | 2.18 |
| (m/s) | 3 × 10⁻⁶ | 2.4 × 10⁻⁶ | 4 × 10⁻⁶ | 1 × 10⁻⁵ | 8.8 × 10⁻⁶ | 3.3 × 10⁻⁵ | 2.9 × 10⁻⁵ | 5.2 × 10⁻⁵ | 0.00013 | 0.00018 | 4.8 × 10⁻⁵ | 8.8 × 10⁻⁶ |
| Ks (m1/3 s−1) | 35 | 35 | 35 | 35 | 35 | 35 | 35 | 35 | 35 | 35 | 35 | 35 |
| Cf (Ks2d1/3) | 0.0127 | 0.0128 | 0.0121 | 0.0117 | 0.0116 | 0.0113 | 0.0114 | 0.0112 | 0.0102 | 0.0105 | 0.0107 | 0.0124 |
| Umoy (m/s) | 0.00658 | 0.00526 | 0.00708 | 0.01759 | 0.01422 | 0.04913 | 0.04606 | 0.07610 | 0.13949 | 0.22394 | 0.06117 | 0.01736 |
| U* (m/s) | 0.0005 | 0.0004 | 0.0006 | 0.0013 | 0.0011 | 0.0037 | 0.0035 | 0.0057 | 0.0100 | 0.0163 | 0.0045 | 0.0014 |
| Vmoy | 34.71 | 38.10 | 37.61 | 13.45 | 14.74 | 3.56 | 3.76 | 2.62 | 1.09 | 1.15 | 2.47 | 10.41 |
| Months | r | 1/r | V50% | (mm/s) | |||
|---|---|---|---|---|---|---|---|
| January | 0.58 | 1.72 | 1.31 | 5.09 | 1.94 | 0.055 | 0.107 |
| February | 1.04 | 0.96 | 0.98 | 3.23 | 1.42 | 0.065 | 0.092 |
| March | 0.48 | 2.07 | 1.44 | 6.19 | 2.27 | 0.063 | 0.143 |
| April | 0.50 | 1.99 | 1.41 | 5.93 | 2.19 | 0.064 | 0.140 |
| May | 0.51 | 1.96 | 1.40 | 5.83 | 2.16 | 0.060 | 0.130 |
| June | 0.55 | 1.81 | 1.34 | 5.35 | 2.02 | 0.058 | 0.117 |
| July | 0.57 | 1.75 | 1.32 | 5.18 | 1.97 | 0.064 | 0.126 |
| August | 0.48 | 2.07 | 1.44 | 6.17 | 2.26 | 0.060 | 0.136 |
| September | 0.46 | 2.16 | 1.47 | 6.47 | 2.36 | 0.058 | 0.137 |
| October | 0.50 | 2 | 1.42 | 6.00 | 2.21 | 0.100 | 0.221 |
| November | 0.84 | 1.19 | 1.09 | 3.73 | 1.55 | 0.075 | 0.117 |
| December | 1.02 | 0.98 | 0.99 | 3.28 | 1.43 | 0.064 | 0.092 |
Disclaimer/Publisher’s Note: The statements, opinions and data contained in all publications are solely those of the individual author(s) and contributor(s) and not of MDPI and/or the editor(s). MDPI and/or the editor(s) disclaim responsibility for any injury to people or property resulting from any ideas, methods, instructions or products referred to in the content. |
© 2023 by the authors. Licensee MDPI, Basel, Switzerland. This article is an open access article distributed under the terms and conditions of the Creative Commons Attribution (CC BY) license (https://creativecommons.org/licenses/by/4.0/).
Share and Cite
Koffi, B.; Sanchez, M.; Alex Kouadio, Z.; Habel, M.; Kouadio, J.S.; Kouadio, K.O.J.; Brou, D.; Kouassi, K.L. Evaluation of the Gamma Law for Settling Velocity and Trapping Capacity Analysis of Suspended Particles in a Dam Reservoir (Lobo River in Côte d’Ivoire). Water 2023, 15, 840. https://doi.org/10.3390/w15050840
Koffi B, Sanchez M, Alex Kouadio Z, Habel M, Kouadio JS, Kouadio KOJ, Brou D, Kouassi KL. Evaluation of the Gamma Law for Settling Velocity and Trapping Capacity Analysis of Suspended Particles in a Dam Reservoir (Lobo River in Côte d’Ivoire). Water. 2023; 15(5):840. https://doi.org/10.3390/w15050840
Chicago/Turabian StyleKoffi, Bérenger, Martin Sanchez, Zilé Alex Kouadio, Michal Habel, Jules Sekedoua Kouadio, Kouamé Olivier Jean Kouadio, Dibi Brou, and Kouakou Lazare Kouassi. 2023. "Evaluation of the Gamma Law for Settling Velocity and Trapping Capacity Analysis of Suspended Particles in a Dam Reservoir (Lobo River in Côte d’Ivoire)" Water 15, no. 5: 840. https://doi.org/10.3390/w15050840