Experimental Study on Neck Cutoff in Meandering River under Variable Discharges

1
School of Water Conservancy, North China University of Water Resources and Electric Power, Zhengzhou 450045, China
2
Key Laboratory of Lower Yellow River Channel and Estuary Regulation, MWR, Zhengzhou 450003, China
3
School of Hydraulic and Environmental Engineering, Changsha University of Science and Technology, Changsha 410114, China
4
College of Engineering, Ocean University of China, Qingdao 266100, China
5
Sediment Research Institute, Yellow River Institute of Hydraulic Research, Zhengzhou 450003, China
*
Author to whom correspondence should be addressed.
Water 2023, 15(5), 841; https://doi.org/10.3390/w15050841
Submission received: 5 December 2022
/
Revised: 14 February 2023
/
Accepted: 20 February 2023
/
Published: 21 February 2023
(This article belongs to the Section Hydraulics and Hydrodynamics)
Abstract
:Neck cutoff is a sudden phenomenon that occurs during the evolution of meandering rivers, but its process and mechanism remain unclear. In this investigation, the neck-narrowing process before cutoff, the formation of a new river, and the appropriate conditions for cutoff under constant and variable discharges were studied using experimental methods in a laboratory flume. The results indicated that bank erosion upstream and downstream of the neck was the main factor that triggered cutoff, regardless of whether the discharge changed. The sinuosity of the model river was approximately 7, the ratio of the neck width to the average river width reached approximately 0.43, and the experimental material was nonuniform natural sand. Under the conditions that the unit width discharge ranged from 0.0039 to 0.0069 m2/s and the longitudinal gradient was 1‰, neck cutoff could occur after sufficient bank erosion. When neck cutoff was imminent, the sinuosity of the channel increased and the channel rotated downstream. After neck cutoff, the formation of a new river experienced three stages, namely, the short-term longitudinal scouring stage, the long-term horizontal widening stage, and the long-term transverse widening and normal slow development stage. The discharge resulting in neck scouring was the effective discharge contributing to the cutoff, and this discharge directly affected the cutoff time and position. We attempted to explain the factors leading to neck cutoff from an energy consumption perspective. Neck cutoff was a sudden phenomenon that occurred when the energy consumption of a meandering river increased to its maximum value upon entry to the recession stage from the relative equilibrium stage. To a certain extent, this study is significant in understanding river evolution and neck cutoff.
1. Introduction
The interaction between water flow and sediment in natural rivers leads to the scouring or sedimentation of riverbeds, resulting in different channel forms, such as meandering, straight, wandering, and branching channels [1,2,3]. A meandering river is a typical channel form in alluvial plains. Spiral flow at the river bend promotes the deposition of convex banks and erosion of concave banks [4]. Thereafter, the sinuosity of a river bend continues to increase until cutoff occurs [5,6,7,8]. Therefore, meandering rivers in alluvial plains undergo a cyclical evolution process involving formation, development, cutoff, and new bend formation; notably, the lateral creep and migration of bends promote a gradual increase in sinuosity until cutoff occurs. Cutoff is a sudden event during the evolution of meandering rivers [9] that rapidly shortens the river length and limits the sinuosity and morphological complexity [10,11]. Natural cutoff phenomena include chute cutoff and neck cutoff, with the former being more frequently observed in many rivers, as reported in many studies [11,12,13].
The chute cutoff phenomenon generally indicates that the beach on a convex bank of a river bay is cut, and the hydrodynamic axis deviates from its original position. Chute cutoff generally occurs during high-flow periods [14]. This phenomenon may occur through the enlargement of swales, headcut extension during locally induced flooding, and downstream extension of an embayment during a sequence of floods [15]. Backwater, the inertia and direction of the channelized flow, and the floodplain topographic heterogeneity could also lead to chute cutoff [16,17].
Neck cutoff can occur after the sinuosity of a river bay reaches a critical value; the distance between upper and lower river channels is smaller than the river width, and the river bay shrinks to form a neck [18,19]; after encountering flood conditions or continuous bank collapse, the neck is washed away to form a new channel [20,21]. Due to different conditions of water and sediment and the composition of riverbank material, the occurrence modes and processes of neck cutoff also vary [9]. According to the causes of cutoff, neck cutoff can be divided into three modes: bank collapse mode, punching mode, and string groove mode [9]. In the bank collapse mode, the reason for cutoff is that the banks on both sides of a neck section collapse, or the bank on one side collapses. In punching mode, the floodplain current scours and forms new grooves. In string groove mode, the first flood scours the floodplain to form a series of gullies, and subsequent floods continue to scour along the formed series of gullies and can mainly be traced to the source.
The increased discharge during a flood period is the main factor in some rivers [22]. High-water-level floods may cause scouring of floodplains in the neck section, resulting in neck cutoff and current penetration [22,23]. However, studies also reported that increased discharge does not necessarily lead to cutoff, and cutoff does not always occur during a flood period with the highest flow [24]. Ref. [25] revealed the morphological characteristics, the degree of development of river bays, and the cycle and location of cutoff through the temporal and spatial changes in channel morphology and the sediment deposition process over 15 years. They found that the highest flow levels during a flood period did not exert the greatest impact on river evolution and cutoff. The inhomogeneity of river bank material and the increase in the local water surface gradient during a flood period may also be major factors [26]. There exists no consensus on the reasons for neck cutoff, and the study of the neck cutoff process and mechanism is an important issue in the field of riverbed evolution.
At present, chute cutoff was successfully realized in the laboratory, but neck cutoff has not been realized. The reason is that neck cutoff occurs in high-sinuosity channels that cannot be successfully prepared in the laboratory. The formation of meandering rivers is related to water flow conditions [27,28,29], sediment conditions (the content ratio of coarse and fine sand) [30,31,32,33], boundary conditions [34,35,36], and vegetation [37,38,39,40,41,42,43,44]. It is extremely difficult to experimentally coordinate the influence of various factors and shape a highly meandering channel [4,27]. At present, the sinuosity of meandering rivers established in laboratories is generally lower than 2, which cannot meet the morphological conditions for neck cutoff. Therefore, it is feasible to excavate an initial channel with a high sinuosity in a flume and apply different water flow conditions [45,46].
As a system, a river inherently contains energy, and many researchers found a relationship between the stream power and river evolution [47,48]; for example, the relationship between the stream power and sediment transport [49,50,51], and the effect of stream power on riparian vegetation [52]. In this investigation, the process of neck cutoff with a reduced geometric scale under constant and variable discharges was experimentally studied. We also attempted to explore the critical conditions for neck cutoff based on variation in the stream power per unit length in order to improve theoretical understanding of the process and mechanism of natural cutoff in meandering rivers.
2. Experiment Setup
2.1. Experimental System
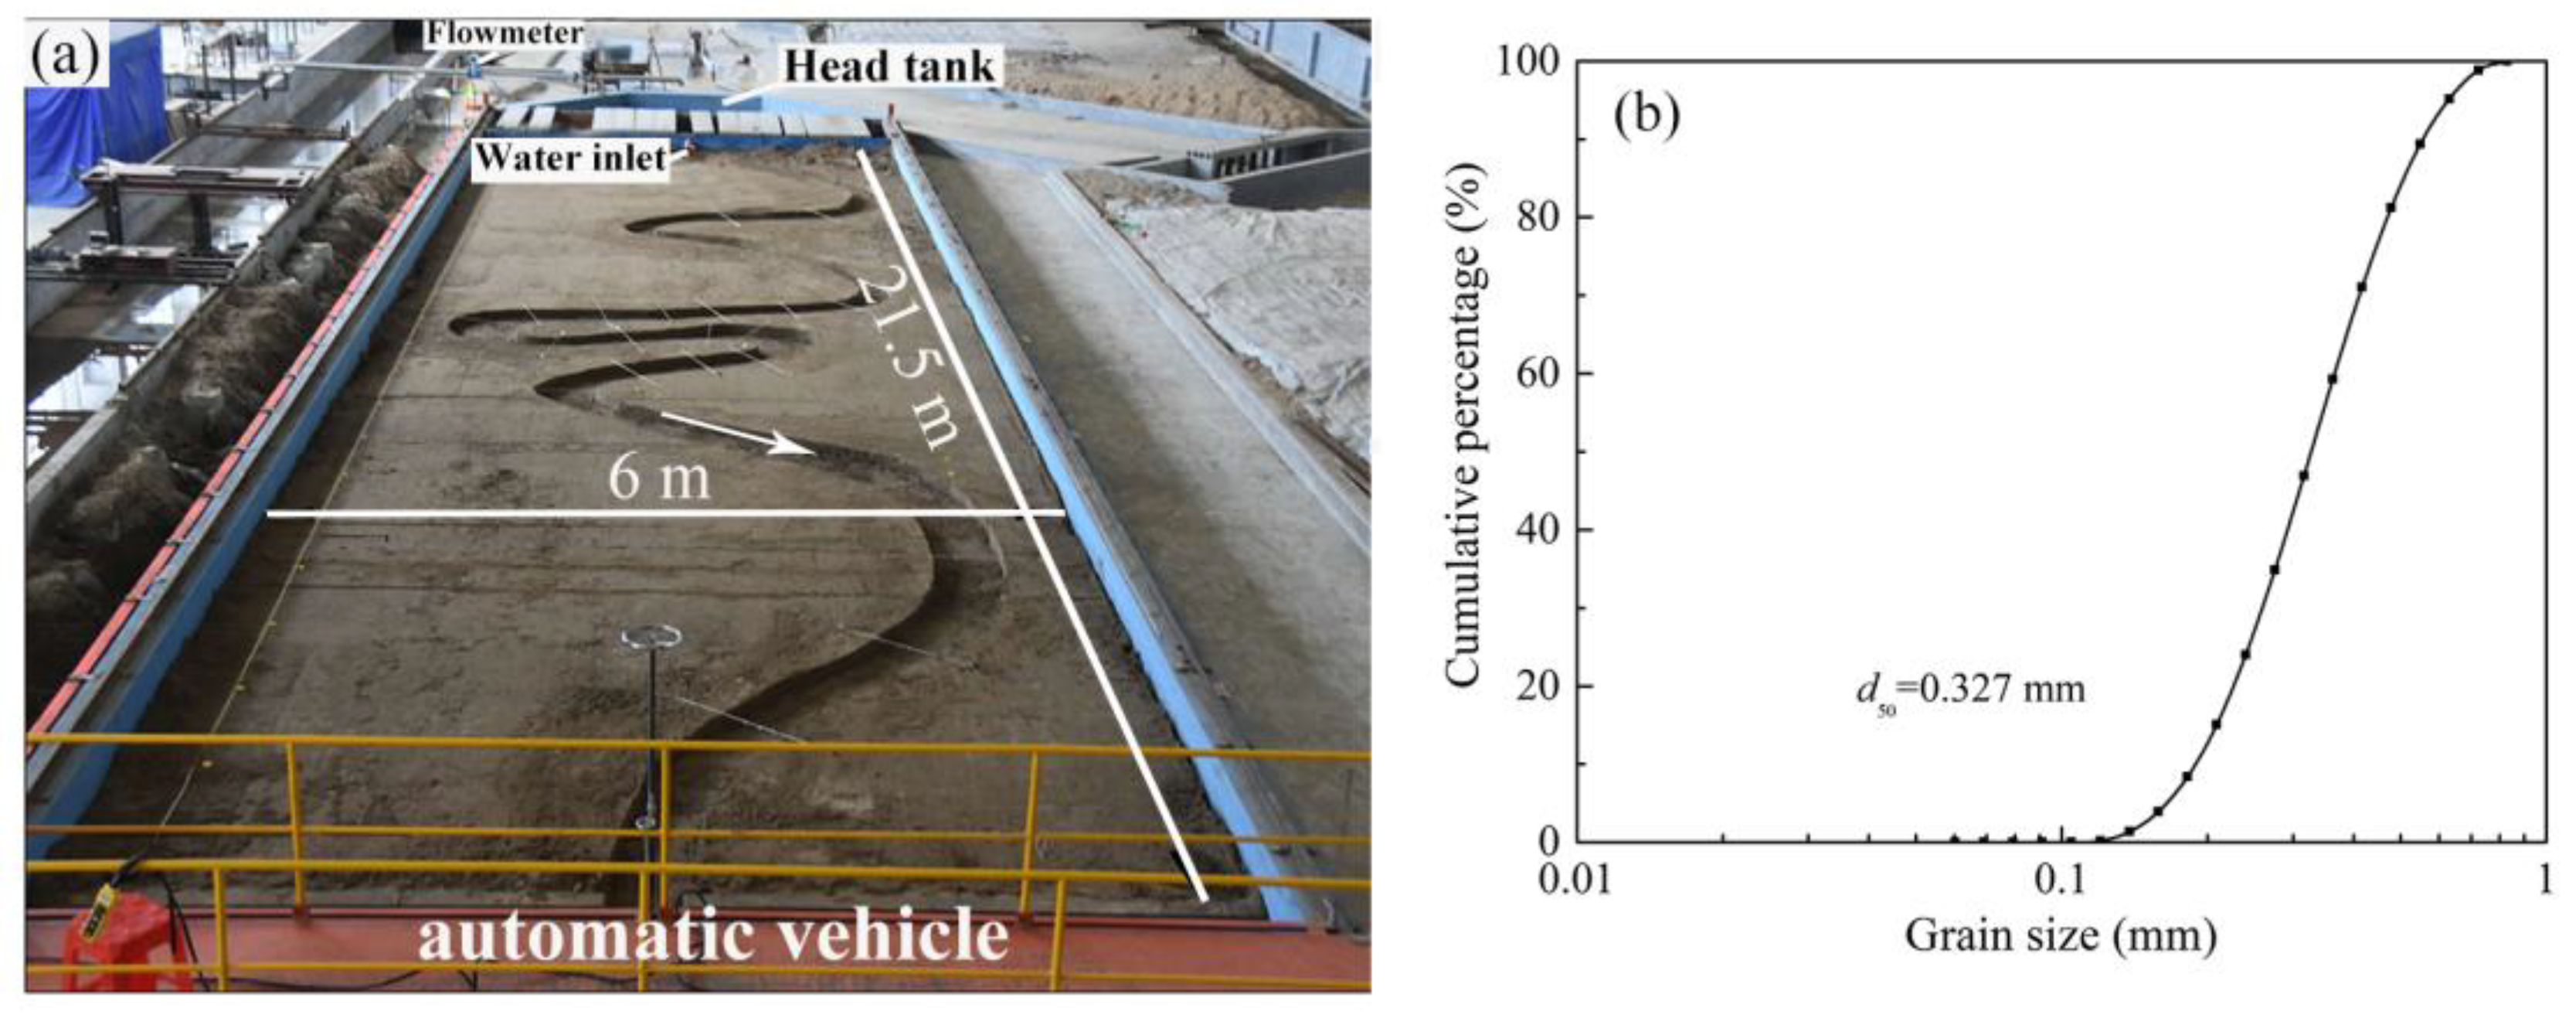
Experiments were performed in a concrete wide-body flume, which was designed and constructed from May 2016 to May 2017. The layout of the flume system is shown in Figure 1a. The wide-body flume was 25 m long, 6 m wide, and 0.4 m deep. The bottom of the flume was horizontal, and the experimental section was 21.5 m long. The front end of the flume was provided with an isosceles trapezoid-shaped forewater storage pool. The upper bottom was 2.2 m long, and the lower bottom was 6.0 m long, 2.2 m high, and 0.6 m deep. A rectangular pool with a length of 1.8 m, a width of 6.0 m, and a depth of 0.4 m was installed behind the forewater storage pool. The main function of the rectangular pool was to stabilize the water flow. After the water flow entered the forewater storage pool, it reached the rectangular pool through a grid and was discharged through the round pipe outlet. The end of the flume was provided with a sand-settling tank and a tailwater tank. The sand-settling tank was 2.0 m long and 6.0 m wide, and the tailwater tank was 1.5 m long and 6.0 m wide. The tailgate was 30 cm wide and 10 cm deep and was set at the center of the flume tail. An LDG electromagnetic flowmeter (nominal diameter DN80) was used to control the flow; the sensor coefficient was 0.8759, and the accuracy class was 0.5. Adjusting the valve of the water inlet pipe could change the reading of the electromagnetic flowmeter to control the discharge. Sediment with a thickness of 20 cm was laid in the flume before the experiment, and the sediment adopted was nonuniform natural sand. The median particle size was d50 = 0.327 mm, and the non-uniformity coefficient was φ = 1.413. The particle size distribution measured with a Mastersize 2000 laser particle size analyzer is shown in Figure 1b.
2.2. Method
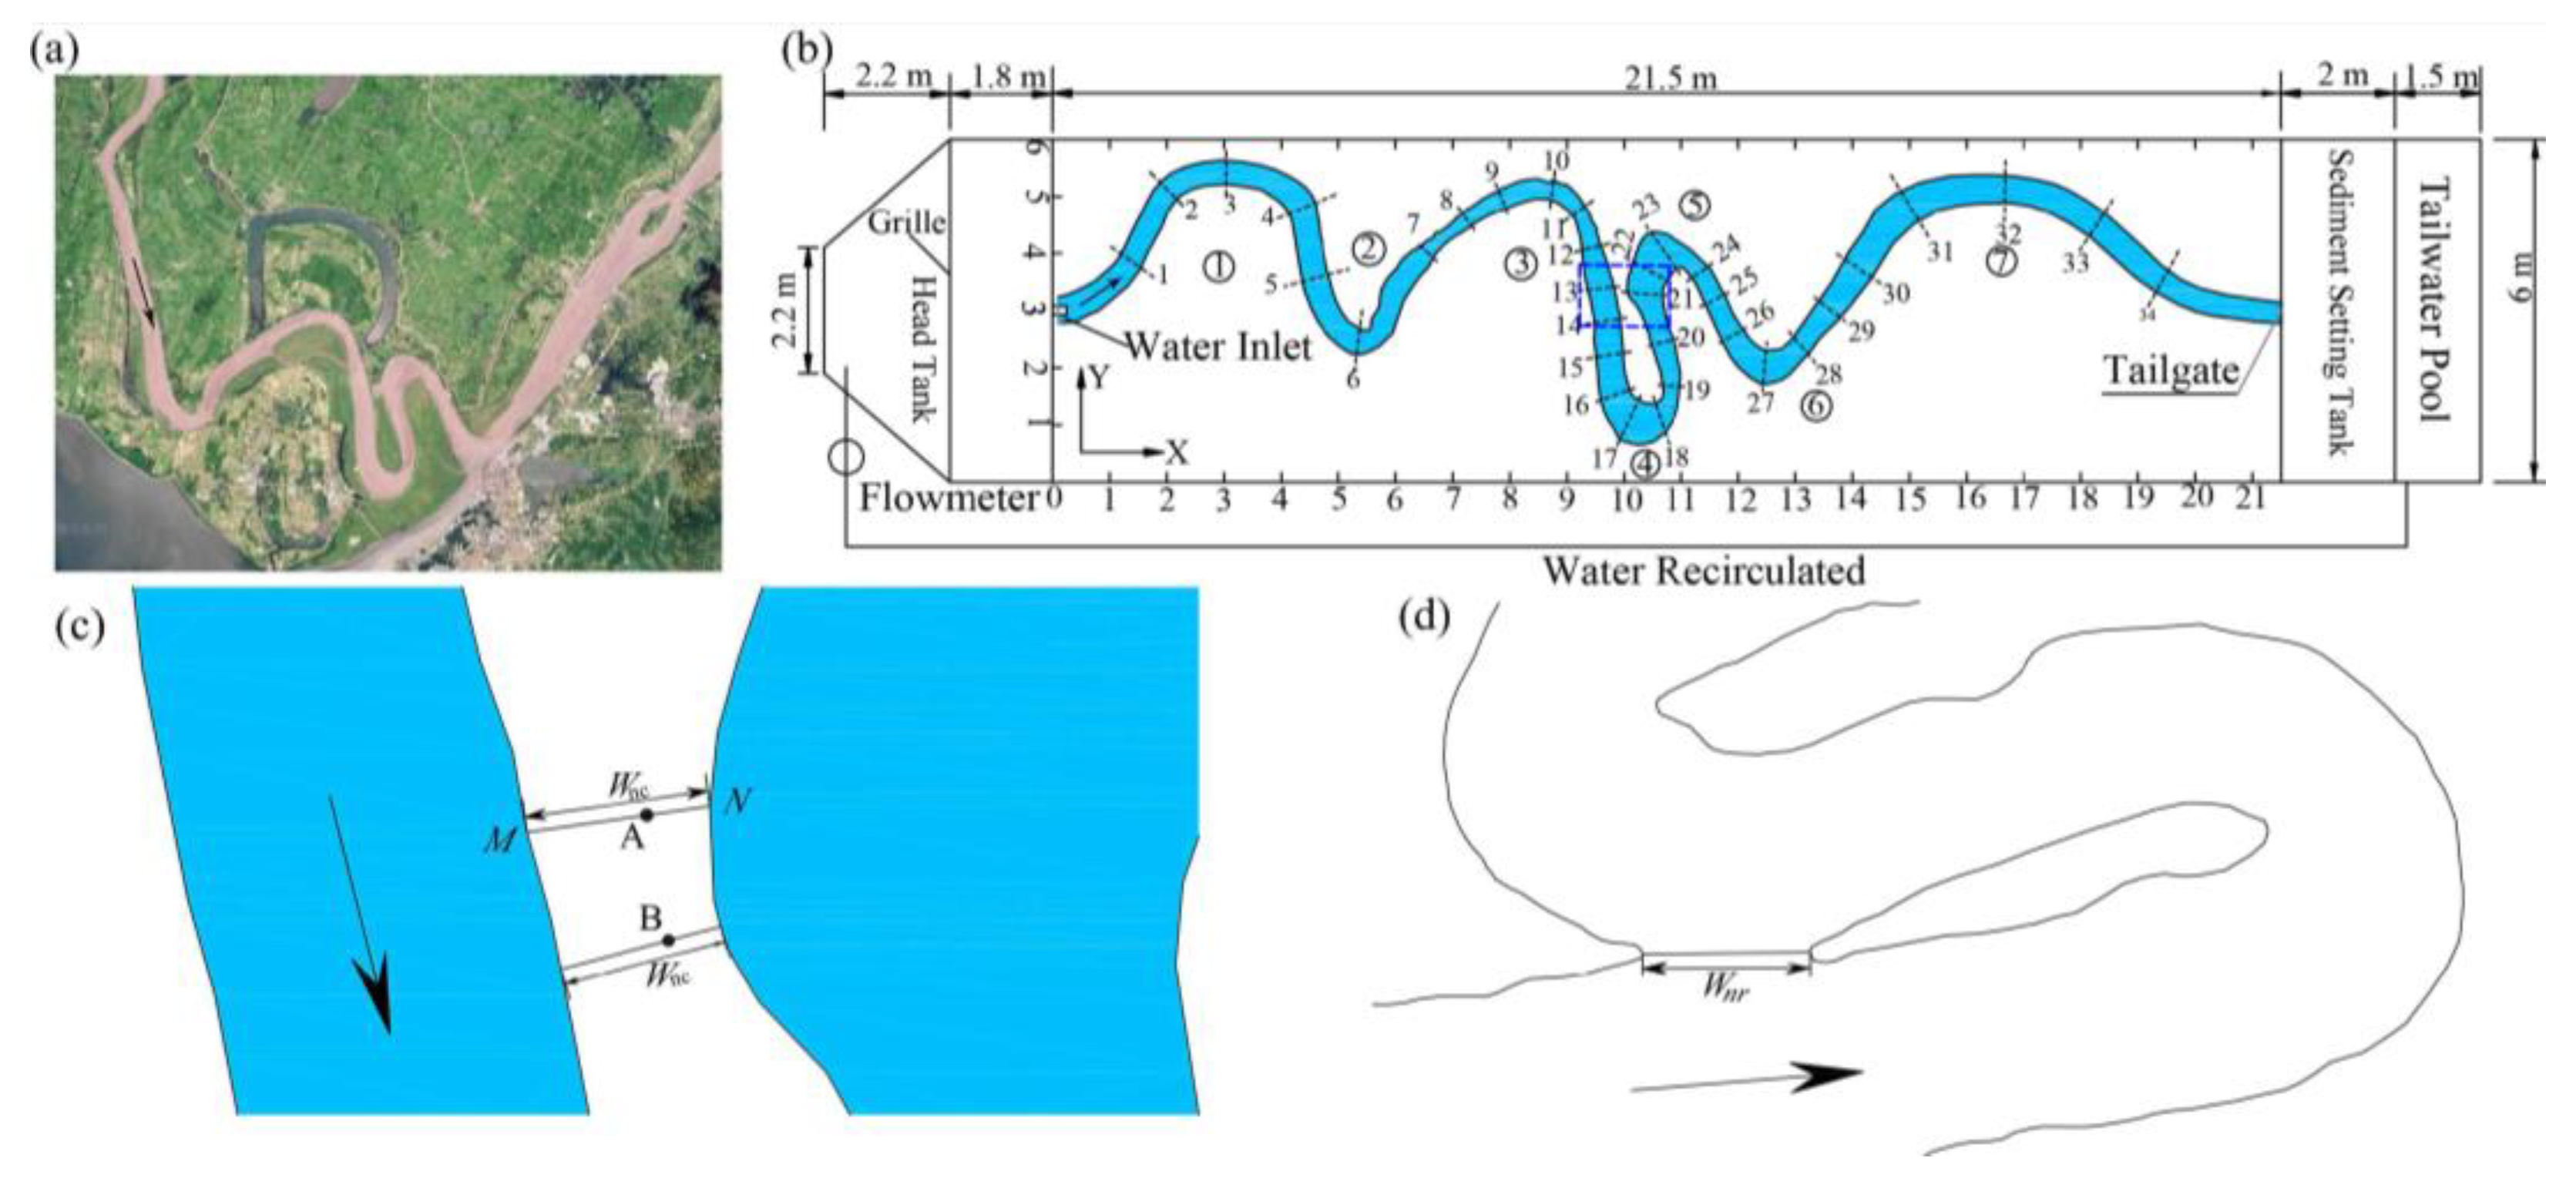
We adopted a generalized model approach using a laboratory flume. The plane shape of the initial channel referred to Qigongling Bend, which is a highly curved channel at the end of the lower Jingjiang River in the middle reaches of the Yangtze River, with a sinuosity of approximately 7. Qigongling Bend (Figure 2a) was scaled down via a plane scale factor of 1:2500. The cross-section of the initial channel was rectangular, and the channel depth was 10 cm. A schematic diagram of the experimental system is shown in Figure 2b. Before conducting the experiment, sediment was first leveled into a flat bed surface with a certain gradient, and control points were then set in the flume, while the initial channel was excavated. During the experiment, the water flow initially entered the forewater storage pool via a pump, reached the river channel through a fixed water inlet at the front of the flume, and then flowed out through the tailgate into the tailwater pond. Washed sediment was captured in a sand-settling tank and recycled in the next experiment. To ensure that the water outlet could smooth the resulting water flow and reduce scouring near the water outlet, an energy dissipation grille was arranged below the water outlet.
There were a total of 7 bends, numbered B1–B7, from upstream to downstream. A total of 34 measurement sections were arranged from upstream to downstream along the river channel (Figure 2b), at intervals ranging from 0.42 to 2.0 m. The sections are represented by a capital letter S followed by a number; for example, section 7 is denoted as S7. The interval from S7 to S26 constituted the studied area; the length was 12.8 m, the average river width was 0.51 m, and the average width-to-depth ratio of the cross-section was 4.38. The researched channel segment was divided into 3 areas: the area upstream of the cutoff position (S7–S13), the bend area (S13–S21) where cutoff occurred, and the downstream area (S21–S26). The time t of the neck cutoff occurrence was defined as the period from the start of the experiment to when the upstream and downstream flow of the neck just connected and the neck width reduced to 0. The ratio of the narrowest part of the neck to the mean river width was 0.43. Since the cutoff position was uncertain, the neck width Wnc was defined as the shortest channel width through the cutoff position. For example, points A and B in Figure 2c were the cutoff positions in two runs, and the shortest width Wnc passing through these two points was the neck width. The upstream scouring distance of the neck section was expressed as Wu, and the downstream scouring distance was expressed as Wd. For example, in Figure 2c, the distance from point A to point M was Wu, and the distance from point A to point N was Wd. The rate at which the neck width decreased over a period was represented by the parameter MD. The new channel width Wnr was defined as the shortest distance between the left and right banks of the new channel, as shown in Figure 2d. The widening rate of the new river after cutoff was denoted by Mn.
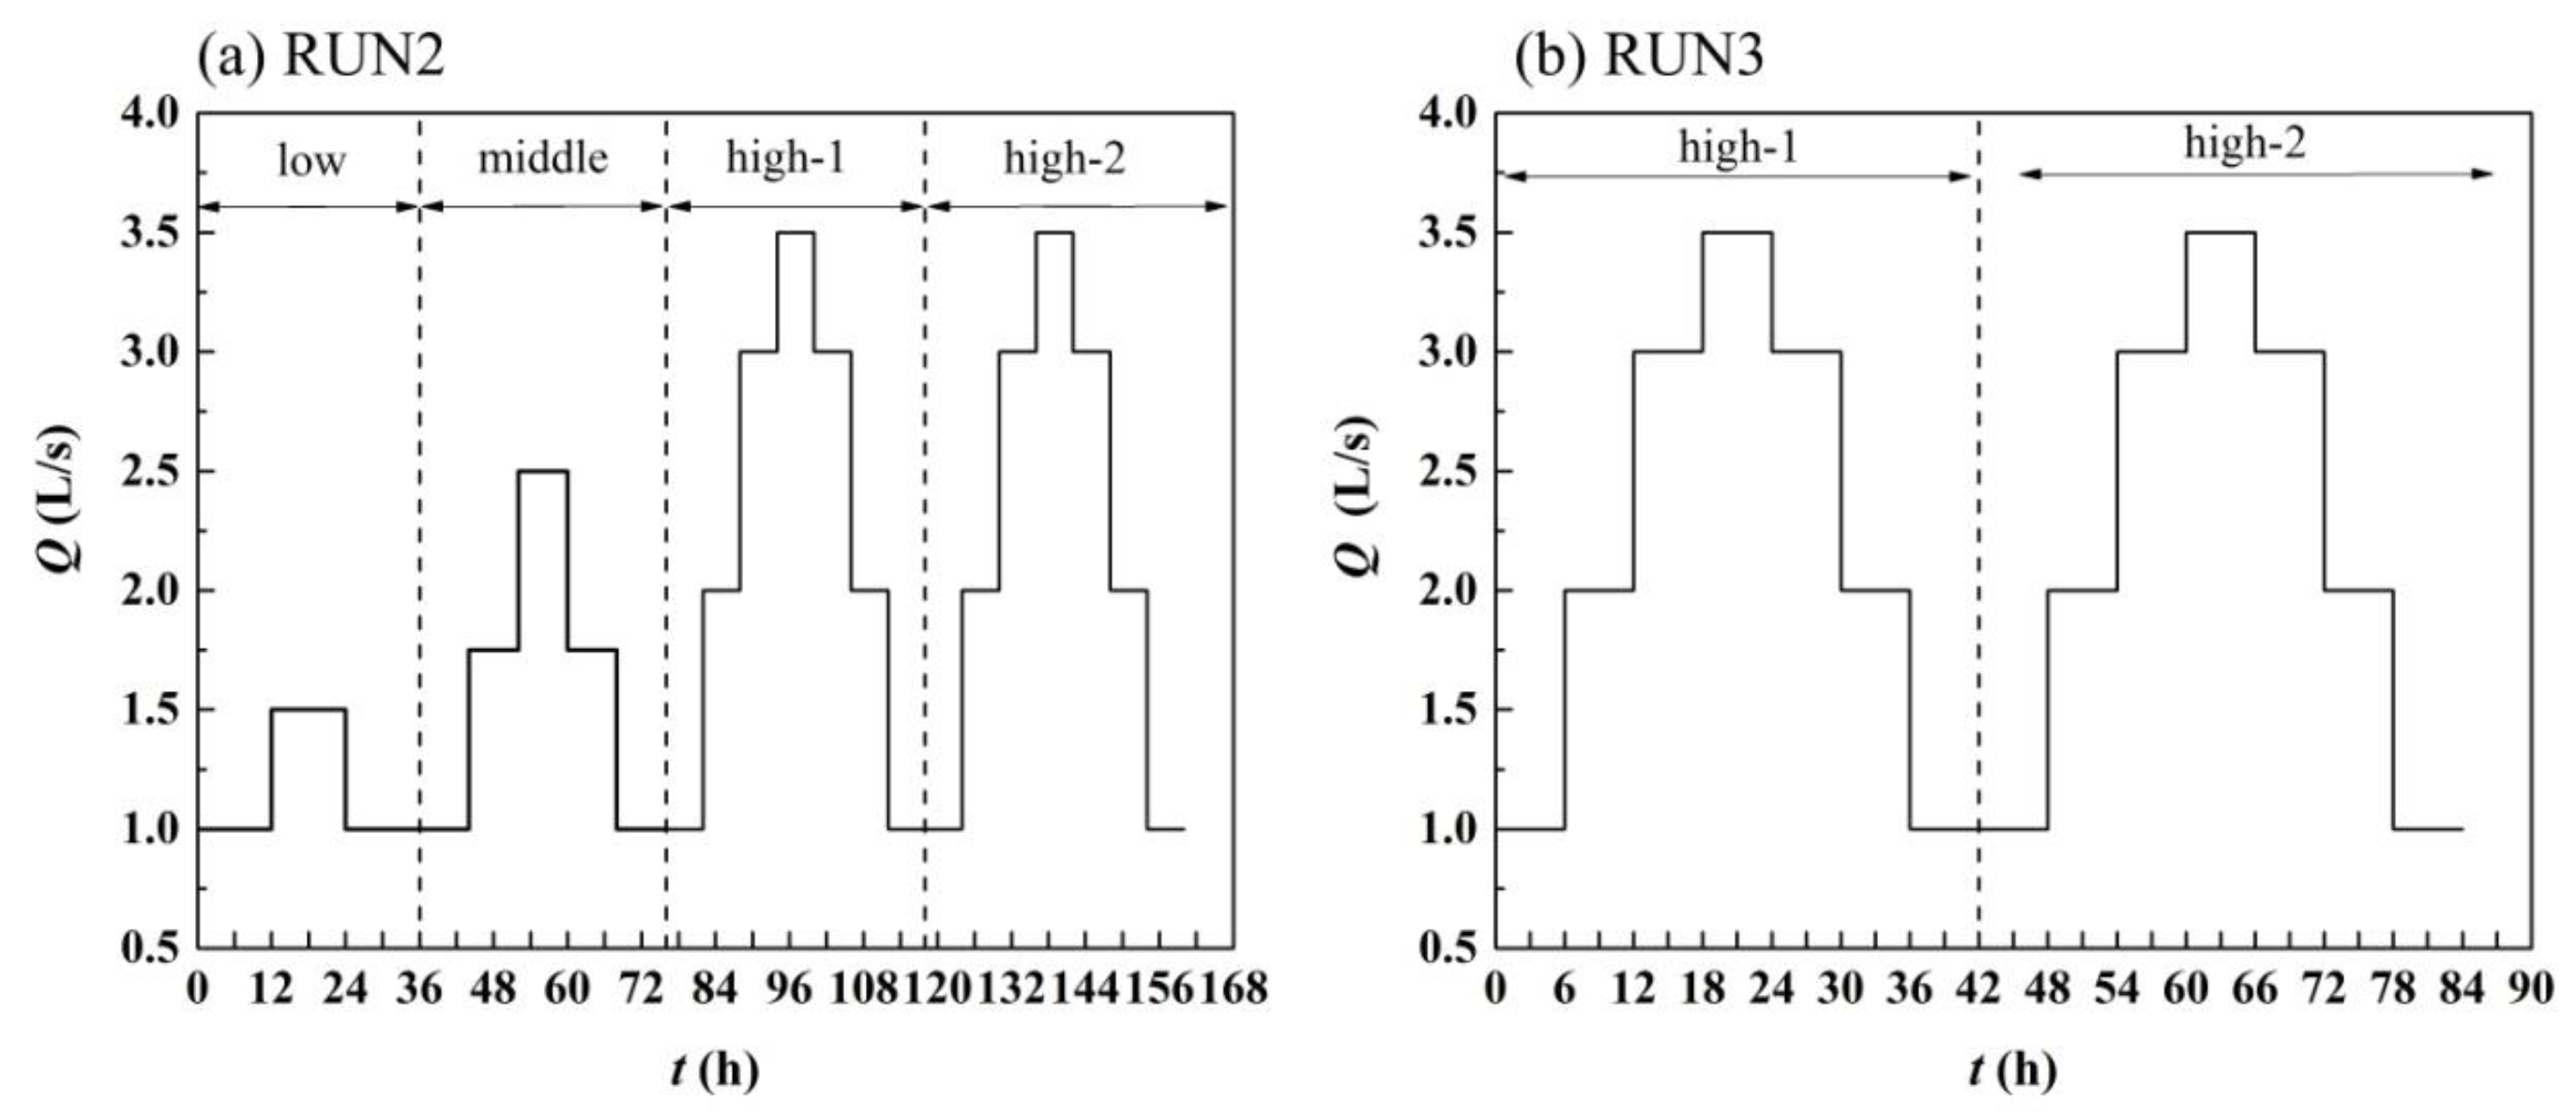
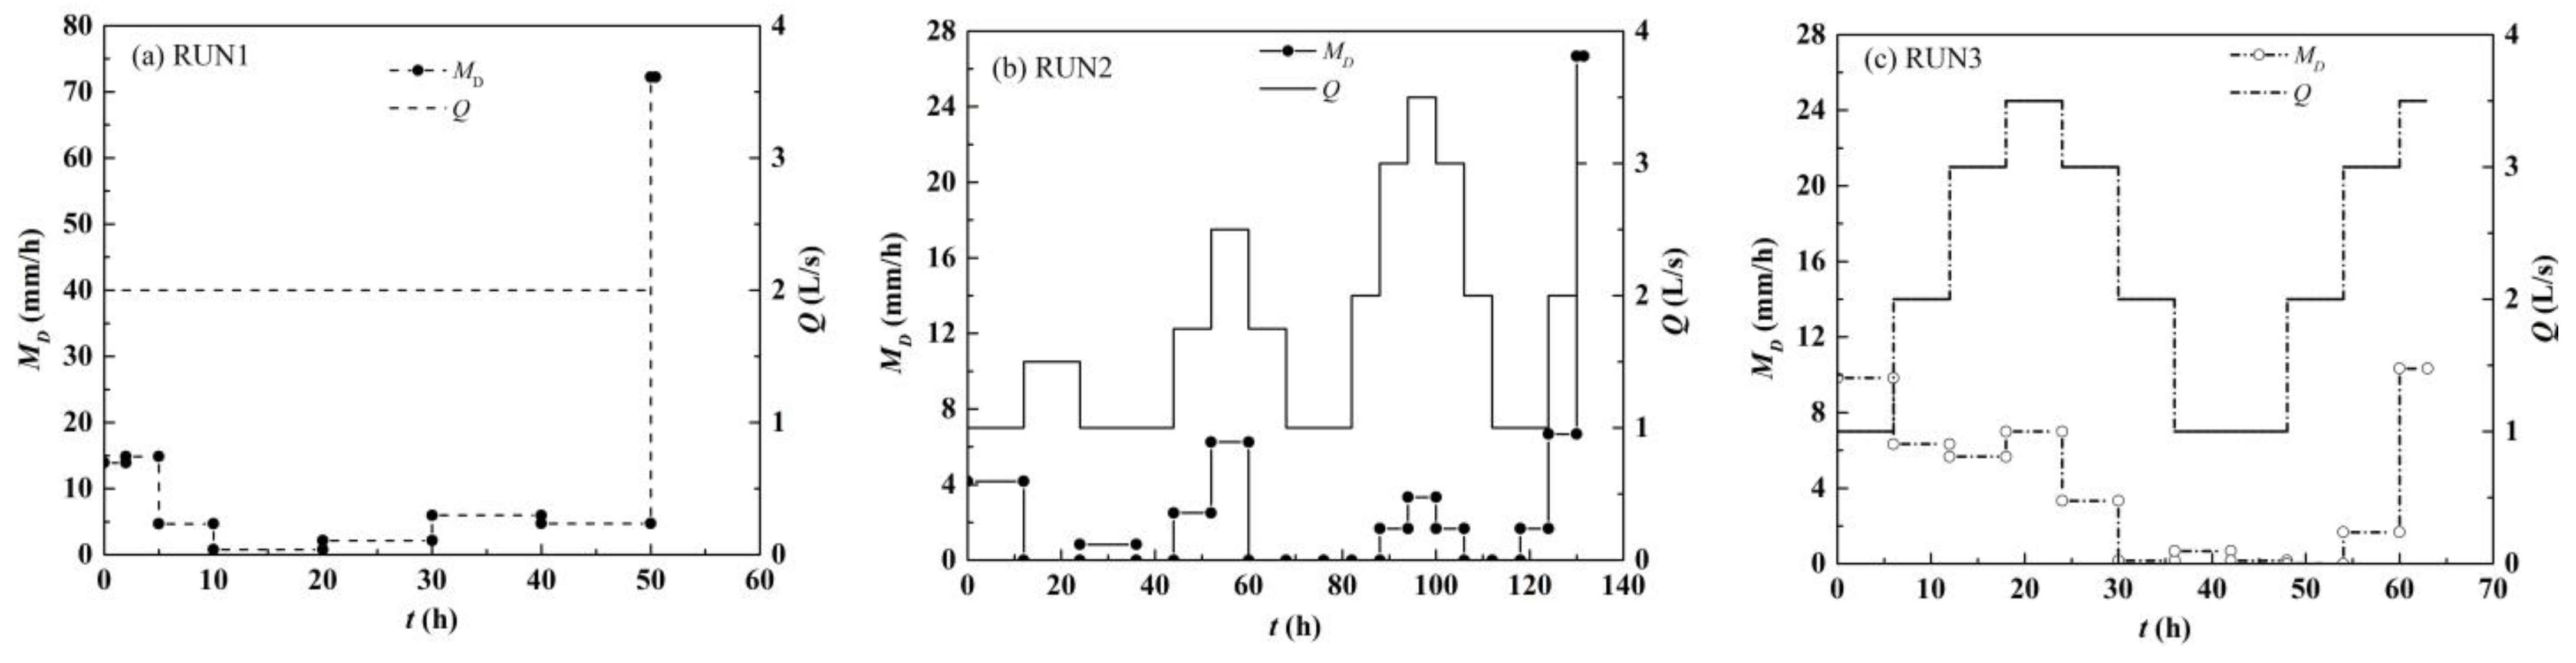
We designed 3 runs. The initial river topography remained the same, and the water flow conditions differed, as summarized in Table 1. Re is the Reynolds number, which is a parameter that reflects the flow pattern, and its physical meaning is the contrasting relationship between the action of inertial force and viscous force. The initial gradient in each run was the same, and Sr was set to 1.0‰, which agrees with the conditions of natural meandering rivers. With reference to the change in natural river flow, the flow cycle process was designed in combination with the flow needed for sediment start. The discharge in RUN1 was constant at 2.0 L/s, and the discharges in RUN2 and RUN3 are shown in Figure 3. RUN2 first used a low-discharge cycle (1.0–1.5 L/s, each discharge lasted 12 h), followed by a medium-discharge cycle (1.0–2.5 L/s, each discharge lasted 8 h), and finally a high-discharge circulation (1.0–3.5 L/s, each discharge lasted 6 h). If cutoff still did not occur after the high-discharge cycle was completed, the cycle was continued. The high-flow process was repeated twice, and the experiment lasted 160 h. RUN3 only exhibited a high-discharge cycle, the cycle was repeated twice, and the whole experimental process lasted 84 h.
When the amount of water and sediment in an alluvial river does not greatly vary, the stream power per unit length is related to whether river evolution reaches a relative equilibrium state. As a component of river evolution, cutoff is accompanied by changes in the river energy. This study attempted to analyze the potential energy change per unit length and unit time; notably, the per unit length stream power P was used to represent the hydrodynamic factor at the cutoff occurrence. P can be obtained as follows:
where P is the per unit length stream power, W·m−1; γ is the bulk density of water, with a value of γ = 9800 N·m−3 in general; Q is the discharge, m3/s; and J is the hydraulic gradient, which can be approximated by the gradient of the water surface. J = (z1 − z2)/L, where z1 and z2 are the water levels of two sections; L is the distance between the two sections.
P = γQJ
In addition, the response of the channel to the occurrence of cutoff was analyzed. The main analysis contents included the water surface gradient S and average shear stress τ. The average shear stress τ is calculated as follows:
where τ is the average shear stress, N·m−2; γ is the bulk density of water, with a value of γ = 9800 N·m−3 in general; h is the average water depth, m; and Jr is the gradient of the riverbed, which is considered equal to the water surface gradient.
τ = γhJr
2.3. Data Collection
Six HIKVISION DS-2CD3T45D-I3 video recorders (4 million pixels) were installed directly above the centerline of the flume at a height of 7 m from the bed surface to record plane shape changes. The lens distortion error was 0.12 m, and the obtained photos were corrected with Photoshop software. The distance between the video recorders was 2.89 m, and the coverage of each camera was 3.56 m. Except for the 1.44 m range at the front end of the flume, which was not covered, the rest of the area until the tailgate was covered by video cameras. The total length covered by installed video cameras reached 20.06 m. An automatic vehicle that could move forward and backward was installed above the flume, as shown in Figure 1a. A metal scraper that could be adjusted up and down was installed in front of the automatic driving vehicle, and a stylus that could be moved left and right was installed in the back. The metal scraper was used to level the sand, and the metal scraper was raised to a certain height at 2 m intervals from the tailgate to upstream according to the preset gradient. The stylus was used to measure the water level, water depth, and topography of the cross-section, with an accuracy of 0.1 mm. Channel shape control points were set at intervals of 0.5 m along the longitudinal direction of the flume, additional control points were added at locations where the river channel shape greatly changed, and a total of 110 control points were established.
During the experiment, changes in the hydrodynamic conditions and river morphology were observed. The water level and water depth in each cross section were measured every 6 to 12 h before cutoff, and the water level along B3 to B4 was measured when cutoff was about to occur. The initial topography was measured before the experiment. If a cutoff phenomenon occurred during the experiment, the water flow was stopped, and the topography at cutoff occurrence was measured. After the measurements, the experiment was continued. When a new channel was formed after cutoff and entered a relatively stable stage, the river width no longer varied, and the river bank no longer retreated, the experiment was stopped and the final topography was measured.
3. Results and Analysis
3.1. Neck Width Change before Cutoff
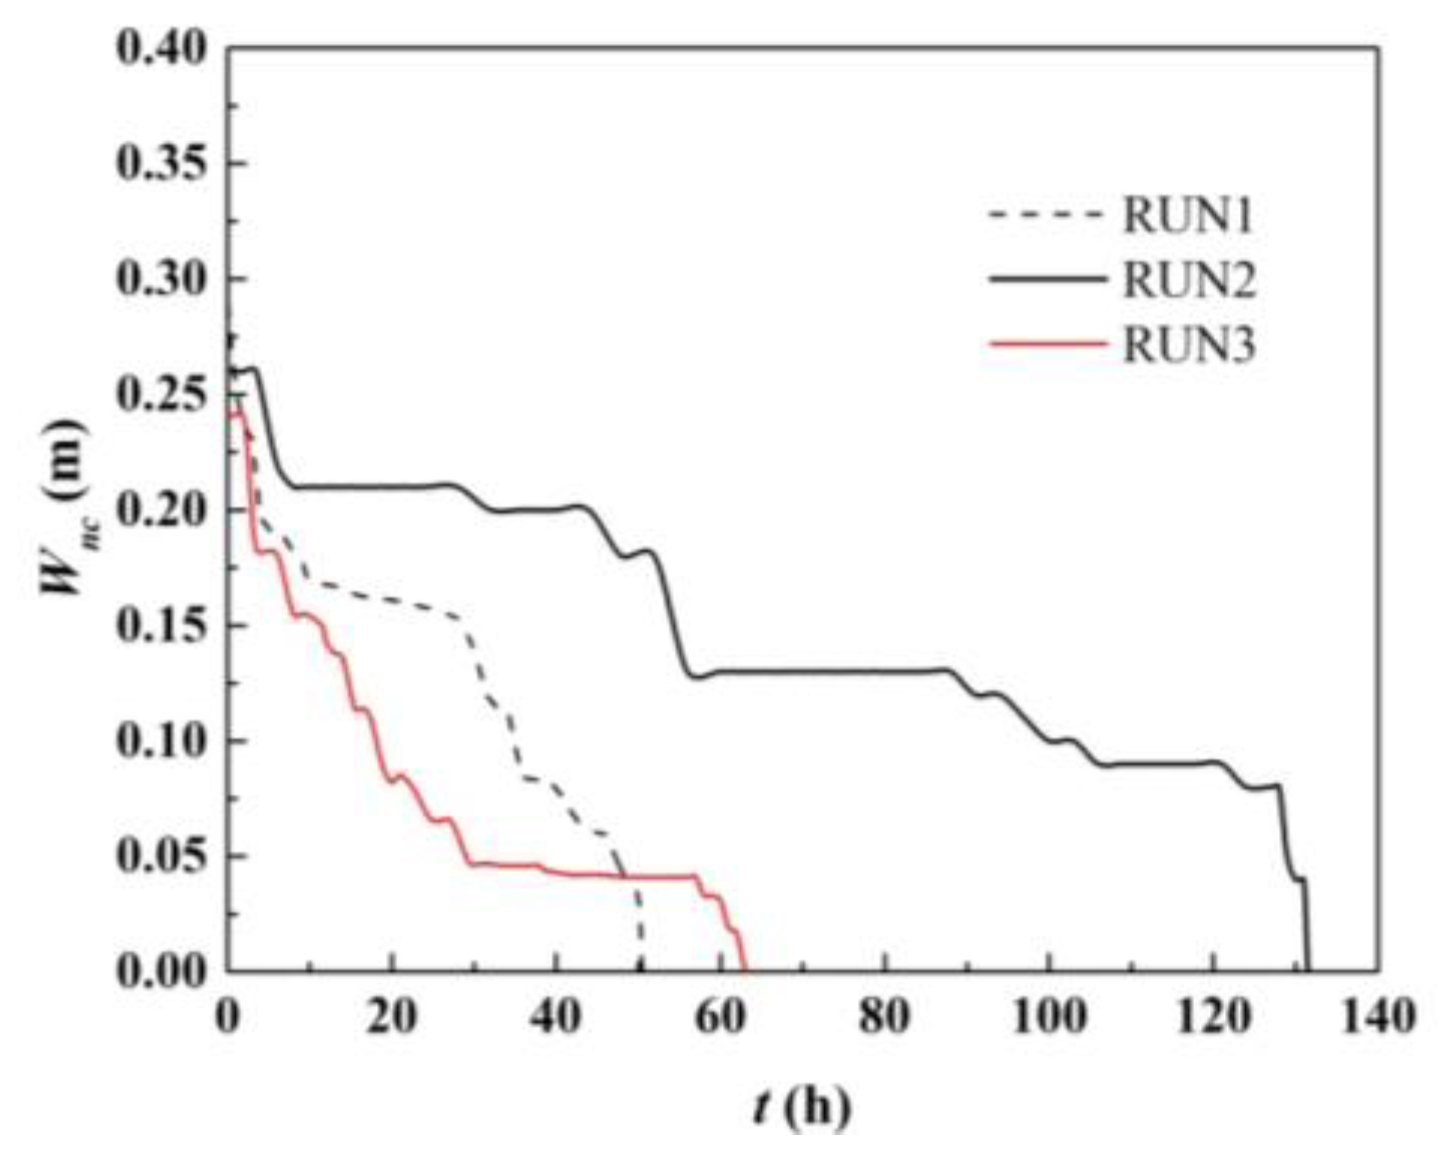
All three runs exhibited cutoffs, but the position, time, and neck width varied. In RUN1, the cutoff position was biased toward the downstream area; at 0.32 m downstream of S13, the neck width Wnc was 0.29 m. The cutoff positions in RUN2 and RUN3 were similar, only 0.055 m apart. The cutoff position in RUN2 was 0.029 m upstream of S13, and the neck width Wnc reached 0.26 m. The cutoff position in RUN3 occurred 0.026 m downstream of S13, and the neck width Wnc was 0.24 m. Under constant discharge, the cutoff time in RUN1 was the shortest, at 50.45 h, while the cutoff times in RUN2 and RUN3 were longer, at 131.5 and 63 h, respectively. Before cutoff, the variation in neck width Wnc over time is shown in Figure 4, and the reduction rate of the neck width MD during different periods is shown in Figure 5.
Although the cutoff position, neck width, and time in the three runs differed, the change trend of Wnc was similar, and Wnc gradually decreased overall. During the first few hours, due to riverbank collapse, MD was large, and the change in MD during the subsequent period was closely related to the discharge. Under constant discharge, MD was small in RUN1 and sharply increased when approaching cutoff. In RUN2 and RUN3 under the condition of varied discharge, after the discharge increased or decreased, MD accordingly increased or decreased, respectively, and MD also sharply increased when cutoff was imminent. In addition, at a discharge of Q < 2.0 L/s, MD was almost zero. By analyzing the discharges and times of cutoff in RUN2 and RUN3, it was found that cutoff occurred during medium- and high-discharge periods, and the medium- and high-discharge durations before cutoff were also similar. In RUN2, the discharge at cutoff occurrence reached Q = 3.0 L/s, and the duration of the Q ≥ 2.0 L discharge was 45.5 h. In RUN3, the discharge at cutoff occurrence was Q = 3.5 L/s, and the Q ≥ 2.0 L/s discharge persisted for 45 h. Under the same initial topography, the cutoff times in RUN2 and RUN3 were shortened by 4.95 h and 5.45 h, respectively, under varied discharge conditions, which were 9.8% and 10.8% shorter, respectively, than that in RUN1 under a constant discharge.
At cutoff, the upstream and downstream scouring distances of the neck are shown in Table 2. The upstream scouring distances Wu of RUN1 and RUN3 were less than the downstream scouring distance Wd; Wu/Wd were 0.93 and 0.62, respectively. In RUN2, Wu was greater than Wd, and Wu/Wd was 2.71. Experiments showed that Wu and Wd were closely related to the cutoff position. The closer the cutoff position was to the downstream, the greater the scouring distance Wd.
3.2. Change in the Water Level Difference and Stream Power before Cutoff
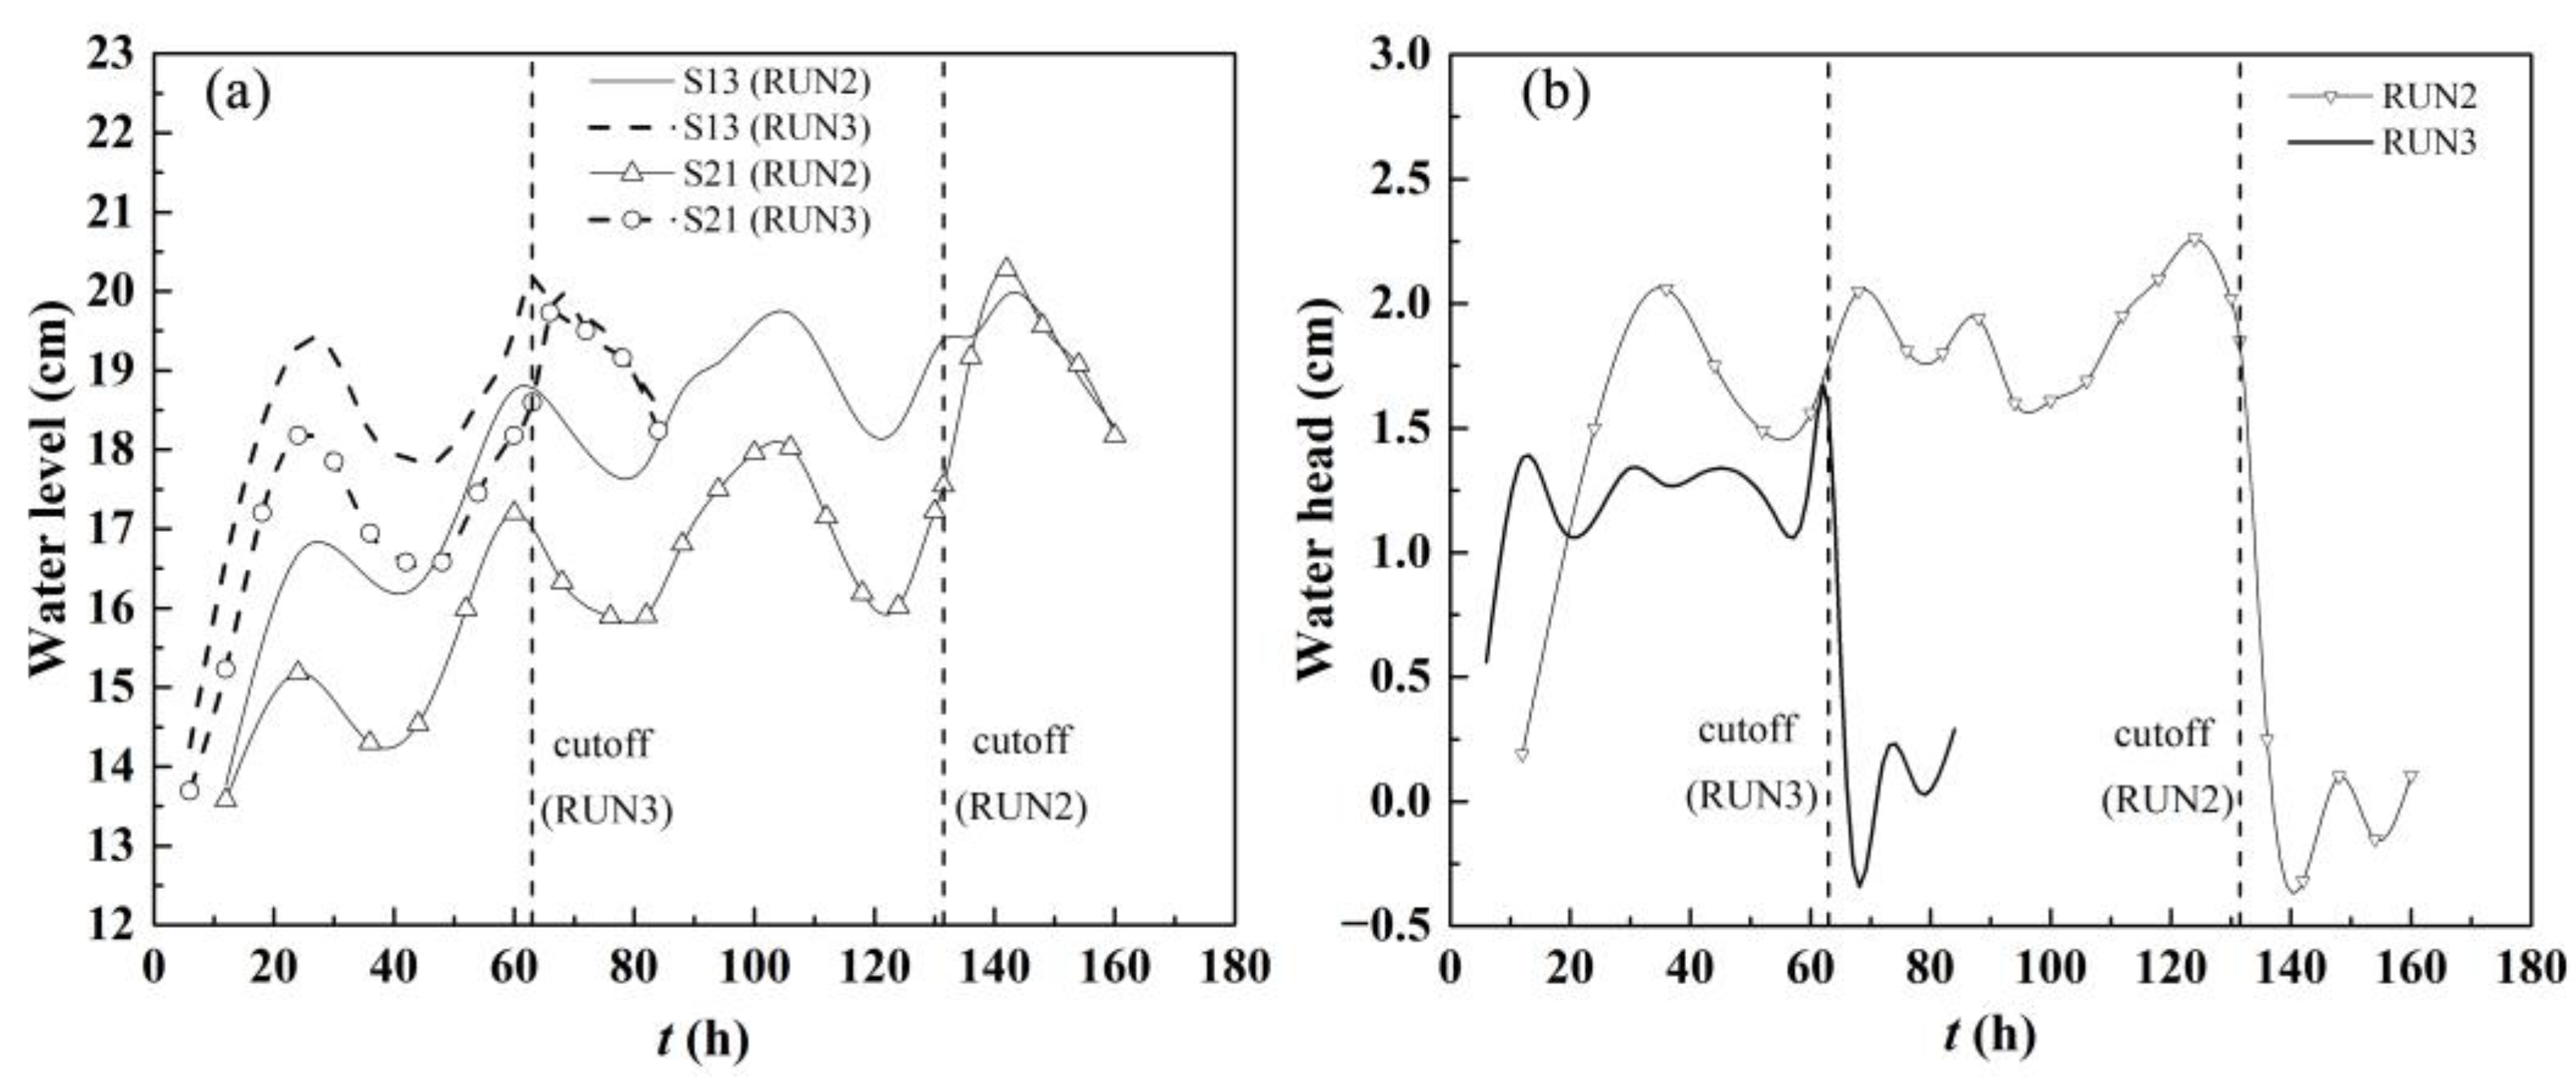
S13 and S21 in RUN2 and RUN3 were selected to analyze the water level and water level difference between the upstream and downstream sections of the neck. The variation process of the water level over time in S13 and S21 is shown in Figure 6a, and the variation process of the water level difference over time is shown in Figure 6b. The variation trends of the water level and water level difference upstream and downstream of the neck in the two runs were the same. Before cutoff, the water level and water level difference fluctuated over time. When cutoff occurred, the water level difference reached the maximum value and then sharply declined, even reaching a negative value, and the downstream water level was higher than the upstream water level. The reason for this was that upon cutoff occurrence, the discharge was high, the water flow turbulence intensity was high, stagnant water was formed downstream, and the upstream water level decreased. After cutoff, the water level difference still fluctuated. At the end of the experiment, the water level difference returned to a positive value, and the downstream water level was lower than the upstream water level.
The change process of the stream power per unit length P at B4 over time during the period from the start of the experiment to cutoff occurrence is shown in Figure 7. The value of P correspondingly fluctuated with the discharge, but the overall trend was increasing. When cutoff occurred, the P values in RUN2 and RUN3 increased to maximum values, namely, P = 0.109 W·m−1 and P = 0.101 W·m−1, respectively, and the P values in these two runs were almost equal, as indicated in Table 3. The critical sinuosity and rotation angle at B4 when cutoff occurred are provided in Table 4. In the three runs, the critical sinuosity at B4 increased to 6.71, 7.09, and 7.11, which were 3.79%, 5.89%, and 1.16% higher, respectively, than those in the initial state. In the three runs, bend B4 rotated downstream at an angle of 11°.
The experiments revealed that the main factor that caused cutoff was the scouring of river banks on both sides of the upper and lower sides of the neck. Medium and high discharges significantly contributed to cutoff, and cutoff occurred during high-flow periods. The effective discharge was defined as the discharge that contributed to scouring in the neck section, and the duration of the effective discharge directly affected the cutoff time and location. The initial topography in two runs of variable-flow experiments was the same. The duration of the effective flow and the cutoff position were similar; the duration difference reached only 0.5 h, and the distance between the cutoff positions was only 0.055 m, which also verified that the experiment was repeatable. Before cutoff occurrence, the plane geometry of the river channel also changed, the sinuosity increased, and the river bend rotated downstream. In three runs, the rotated angle was the same.
3.3. Evolution of the New Channel
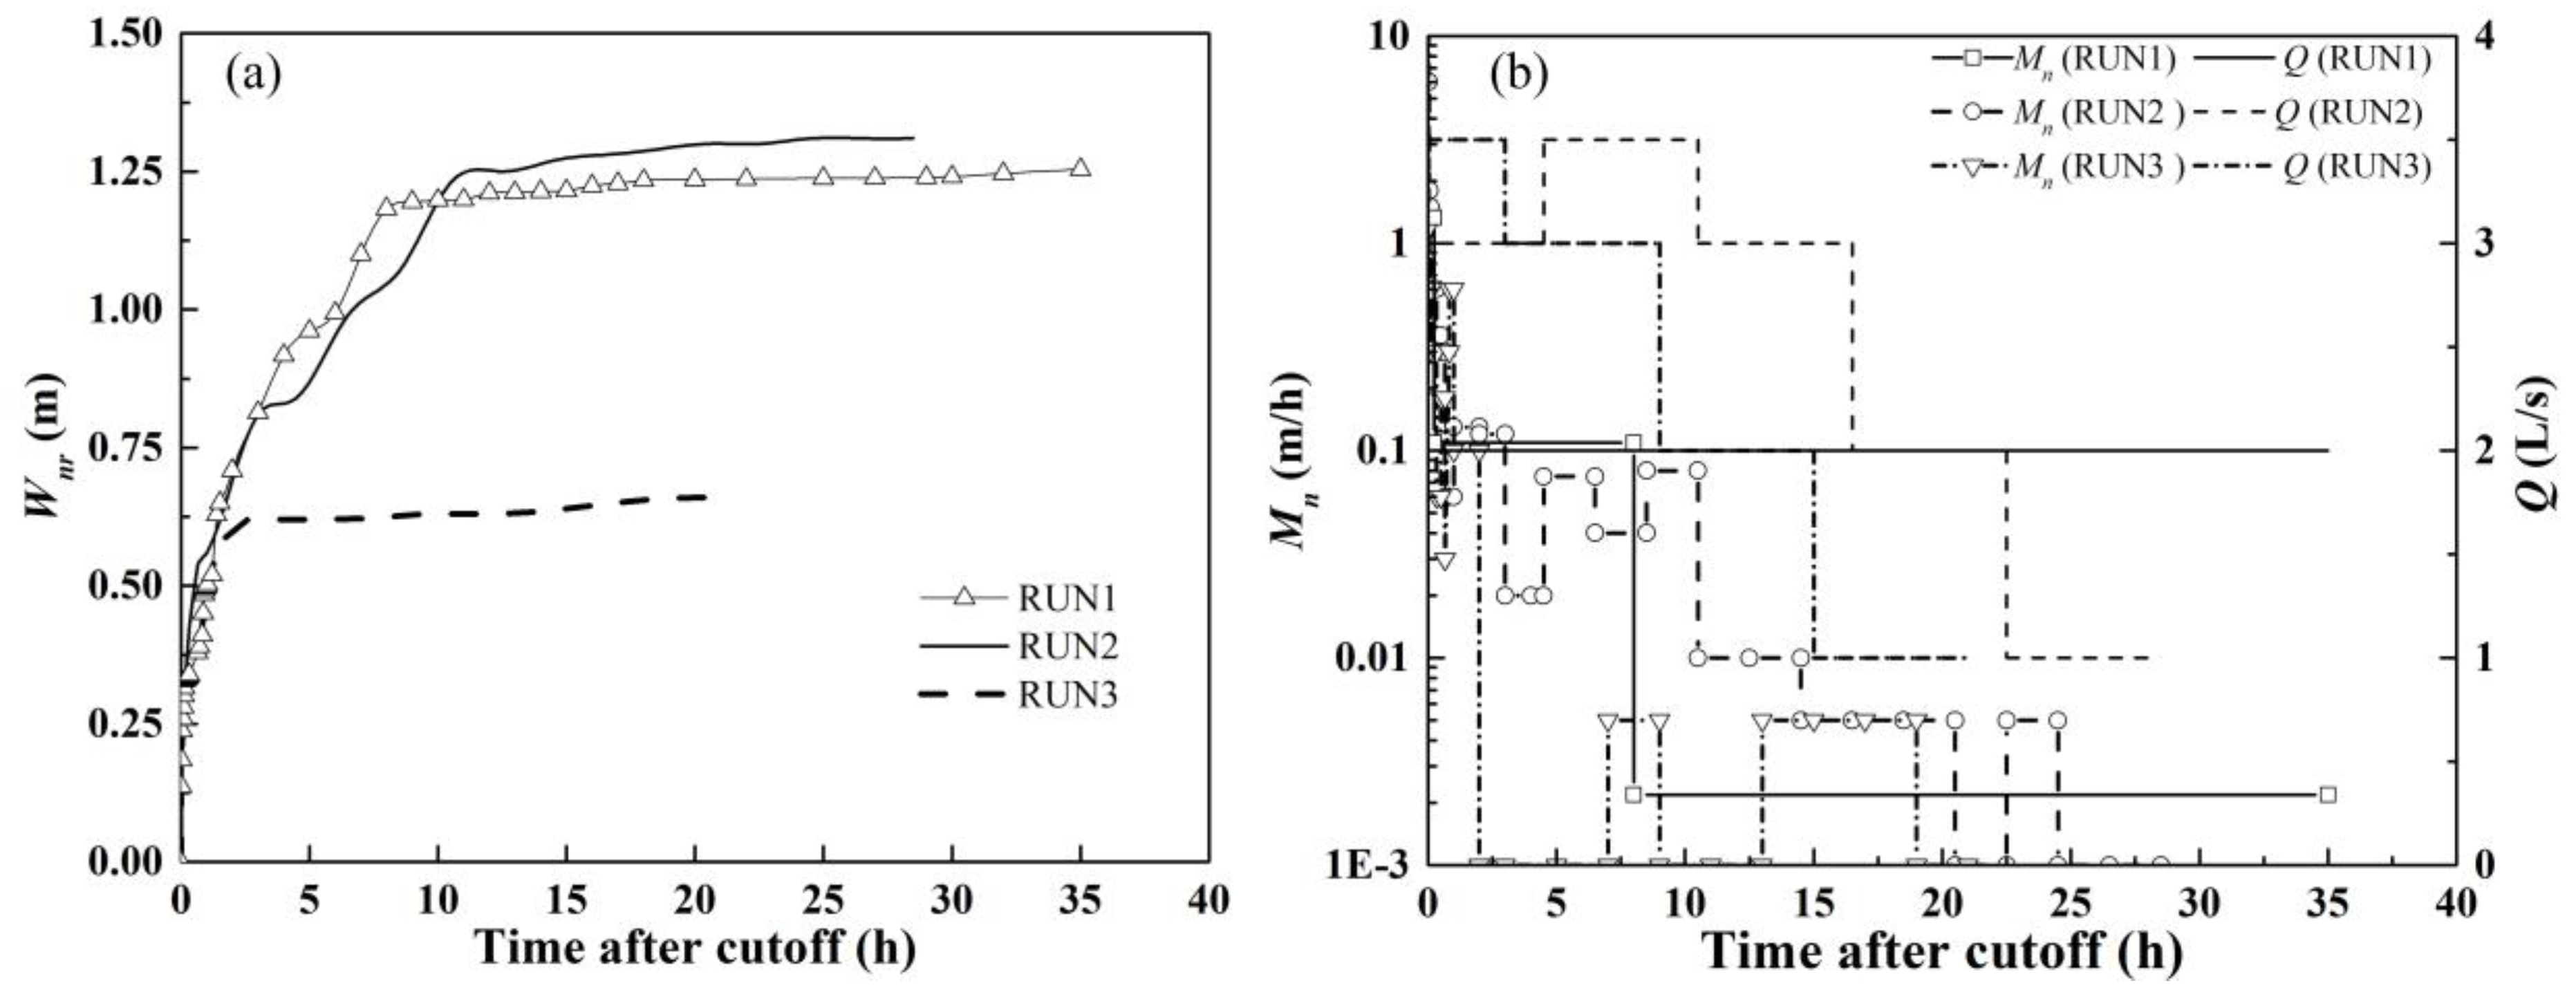
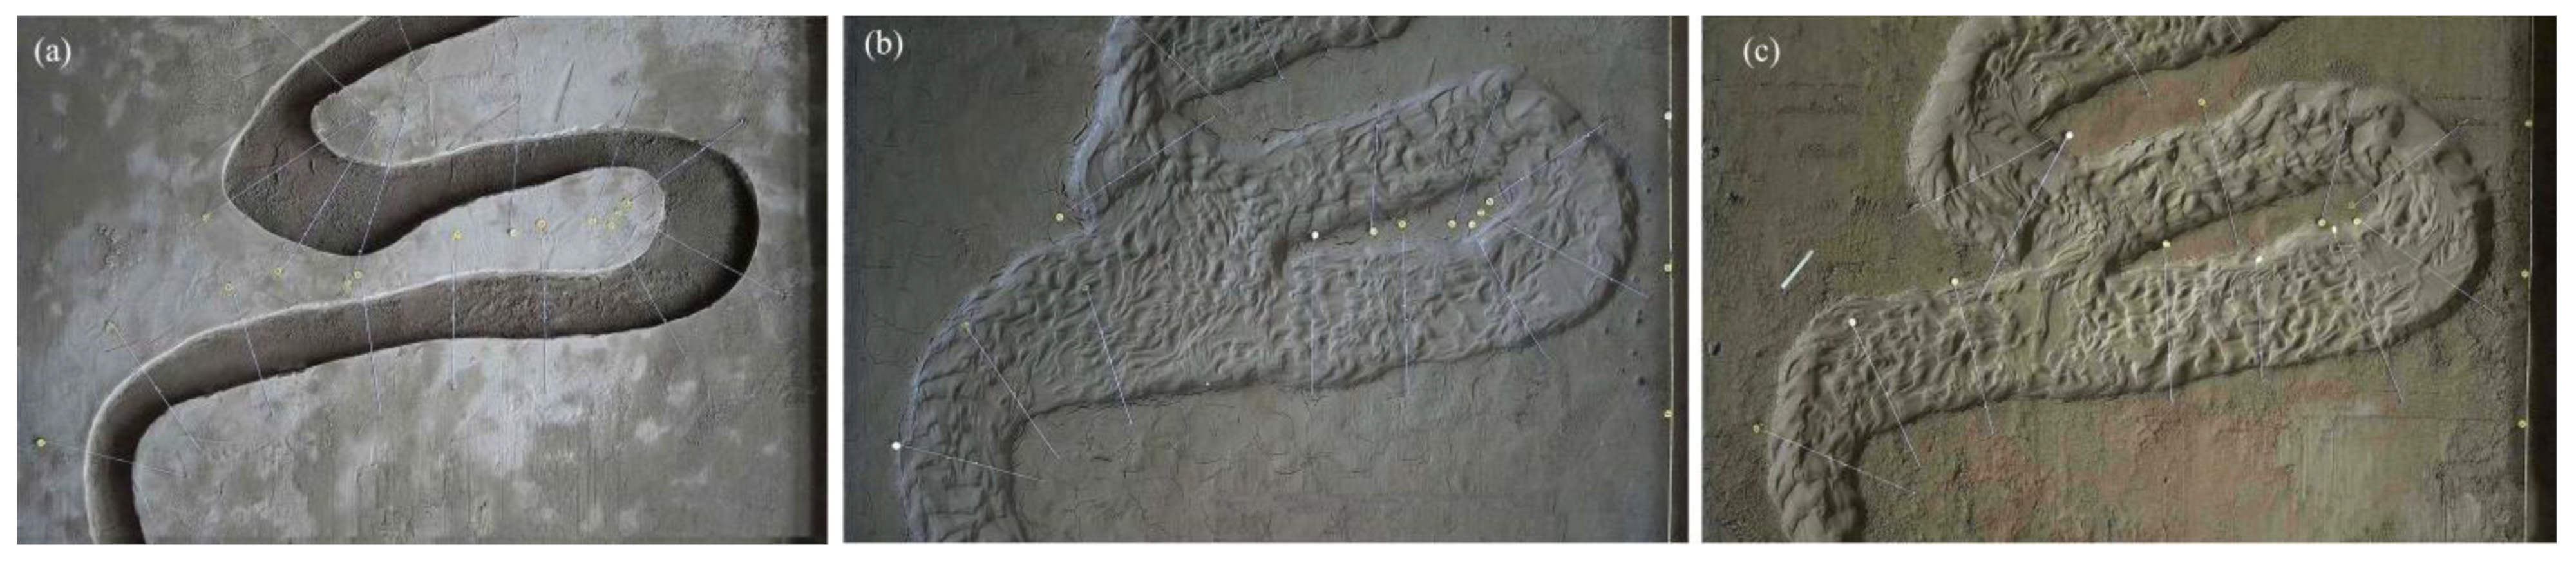
Within a few minutes after cutoff occurrence, a new channel rapidly developed, mainly via longitudinal scouring. During the next few hours, the new channel was mainly widened horizontally, the water-passing section expanded, and the diversion discharge through the new channel gradually increased. Subsequently, the width of the new channel slowly increased, and distributed discharge in the old channel gradually decreased until no flow remained. The changes in the new channel width Wnr and average widening rate Mn are shown in Figure 8. The comparison between the initial and final topography of the relative equilibrium after cutoff is shown in Figure 9.
The discharge affected the Mn value but did not affect the change trend of Wnr. Within 1 min after cutoff occurrence in RUN1, the width of the new channel Wnr reached 0.101 m, and the widening rate Mn of the new channel reached 6.04 m/h. After 10 min, Wnr reached 0.329 m. During the experimental period t = 0–10 min, Mn was 1.334 m/h. Within the experimental duration of t = 10 min–5.5 h, Mn was 0.110 m/h, and Wnr increased to 0.962 m. Within the experimental duration of t = 5.5–35 h, Mn reached 0.002 m/h, and Wnr remained stable at 1.254 m. After cutoff, the discharge remained unchanged, and Mn gradually decreased. Within 2 min after cutoff in RUN2, the Wnr reached 0.20 m. After 20 min, Wnr reached 0.43 m. Due to the increase in the discharge after cutoff, Mn increased. After cutoff at 4.5 h, the widening rate Mn decreased to 0.02 m/h at the end of the third-stage discharge Q = 3.0 L/s, and the new channel widened by 0.84 m in total. Throughout the entire process of increasing discharge, Mn increased to 0.08 m/h, and Wnr increased to 0.39 m. During the subsequent reduction in discharge, Wnr only increased by 0.08 m, and Mn was very small, at approximately 0.005 m/h. In RUN3, the discharge decreased after cutoff, Mn continuously decreased, and the change trend of Wnr was similar to that under a constant discharge. When cutoff had just occurred, Mn could reach 12 m/h, and Wnr could reach 0.24 m within 4 min. After 3 h of cutoff, the maximum discharge had stopped, and the new channel had widened by 0.62 m in total. During the subsequent reduction in the discharge, Mn reached approximately 0.002 m/h, and Wnr only increased by 0.04 m.
3.4. Channel Response to Neck Cutoff
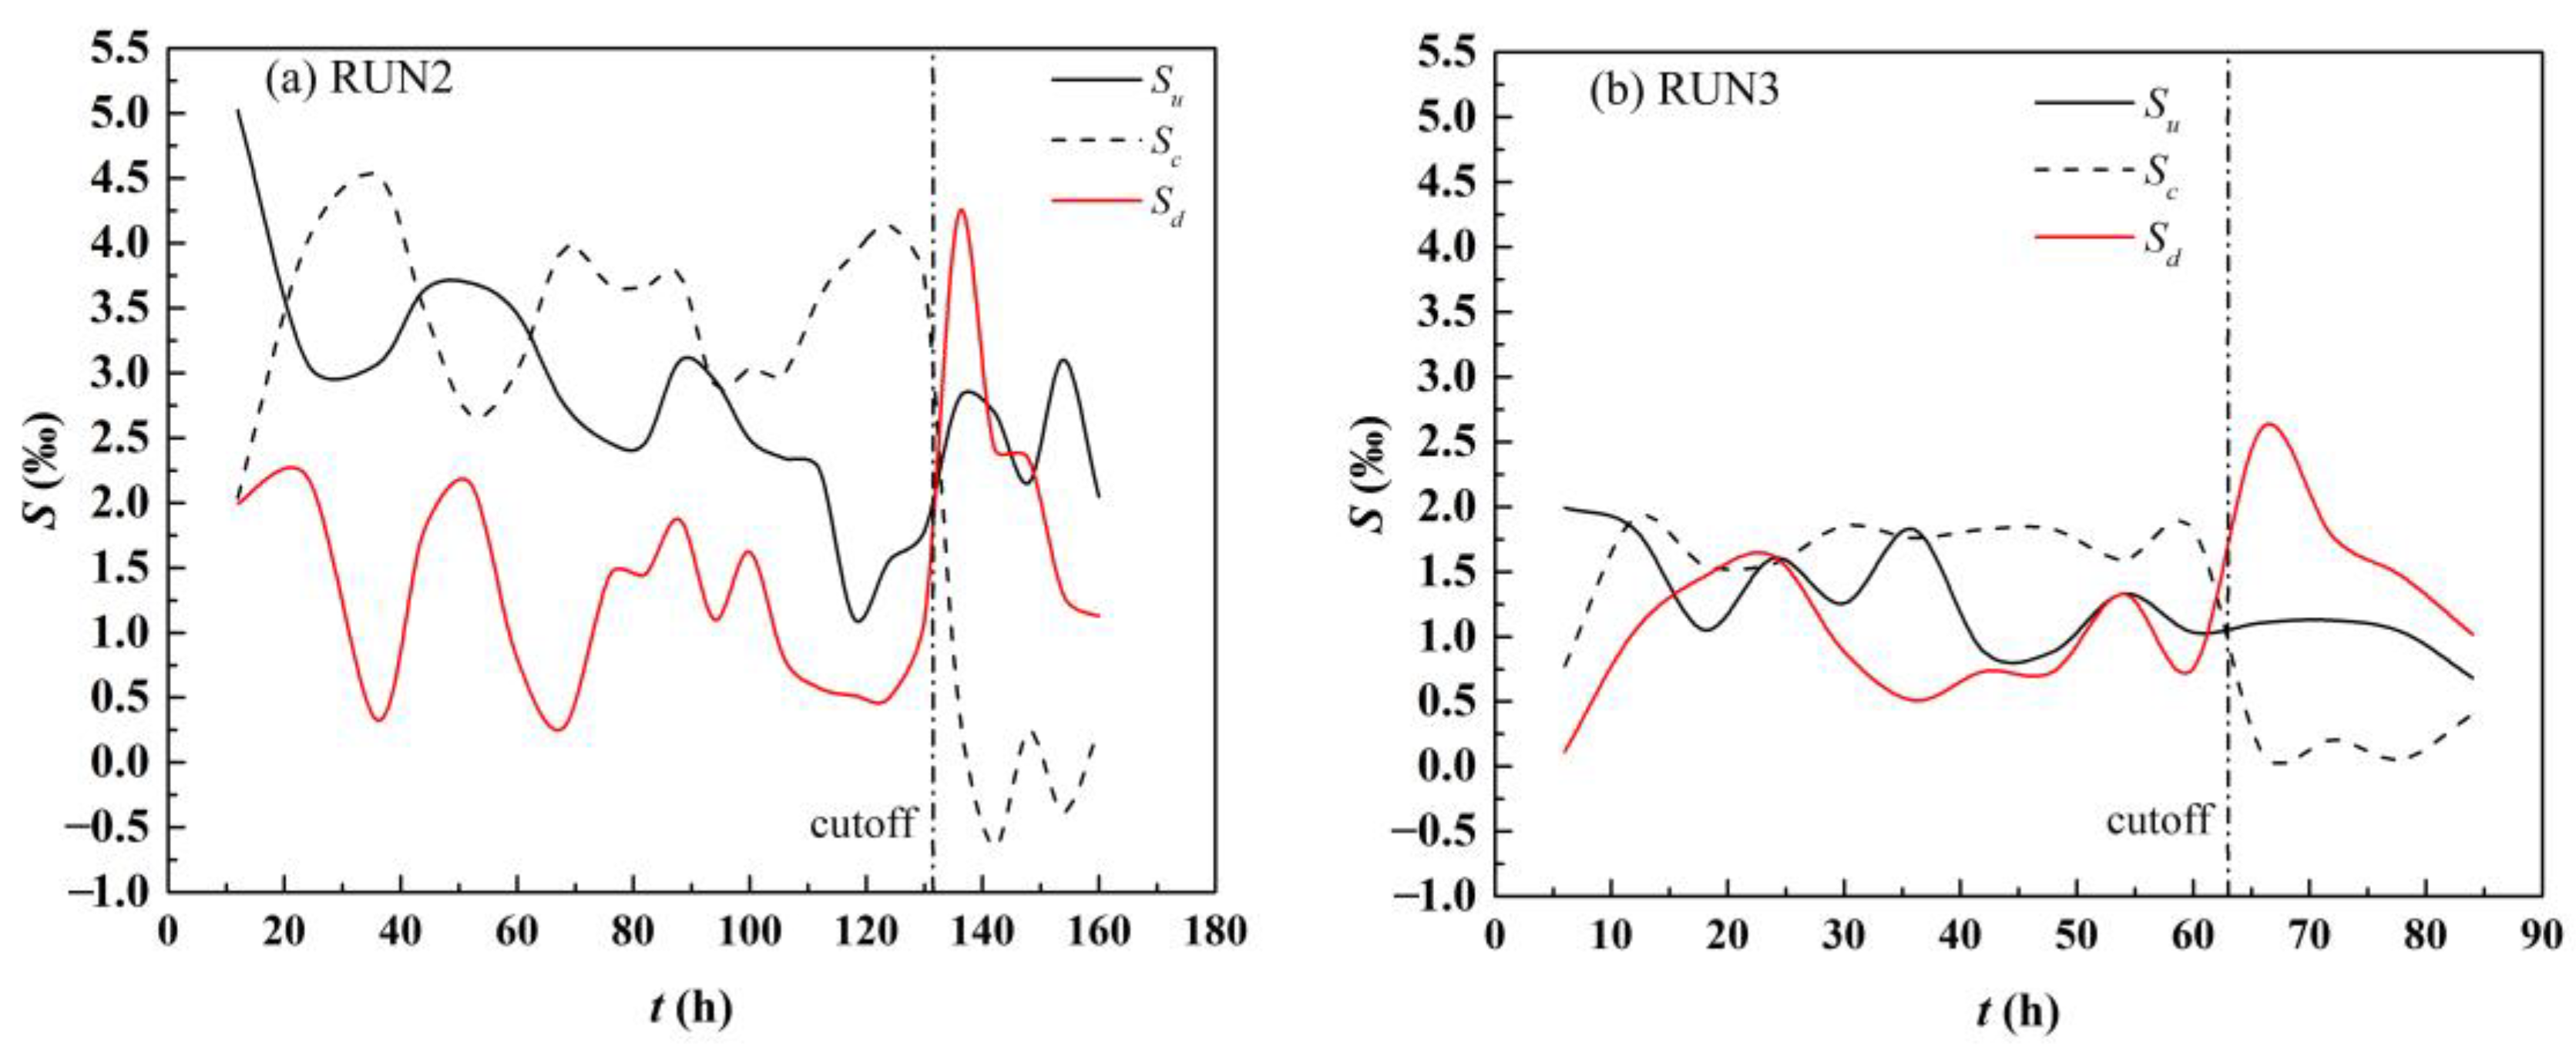
The water surface gradients within the scope of S7–S13 in the upstream area, S13–S21 in the bend area, and S21–S26 in the downstream area were represented by Su, Sc, and Sd, respectively, and the change trends are shown in Figure 10. Before cutoff, the three gradients fluctuated with discharge, and the change trends of Su and Sd were the same, but the change trend of Sc differed from these two trends. Before cutoff, Sc was the highest, and after cutoff, Sc sharply dropped, while both Su and Sd increased. At t = 0–130 h before cutoff in RUN2, the three gradient fluctuation ranges were 1.1–5.0‰, 2.0–4.5‰, and 1.3–2.2‰, respectively. When cutoff was imminent, i.e., at t = 130 h, Sc was the highest, at 3.7‰, Su was moderate, at 1.8‰, and Sd was the lowest, at 1.1‰. After cutoff, both Su and Sd increased, but Sd increased more. Due to backwater in the bend area, Sc sharply decreased. Under an experimental duration of t = 136 h, Su and Sd were 2.8‰ and 4.2‰, respectively, which were 57.7% and 287.5% higher, respectively, than that before cutoff; meanwhile, Sc decreased to 0.4‰, which was 89.4% lower than that before cutoff. At t = 0–60 h before cutoff in RUN3, the three gradient fluctuation ranges were 0.9–2.0‰, 0.7–1.9‰, and 0.1–1.6‰, respectively. Near cutoff, i.e., when the experimental duration reached t = 60 h, Su, Sc, and Sd were 1.0‰, 1.8‰, and 0.8‰, respectively. Sc was still the highest. After cutoff (experimental duration t = 63 h), Su and Sd increased to 1.1‰ and 2.6‰, respectively, which were 7.1% and 247.1% higher than those before cutoff, respectively; Sc decreased to 0.1‰, which was 94.7% lower than that before cutoff.
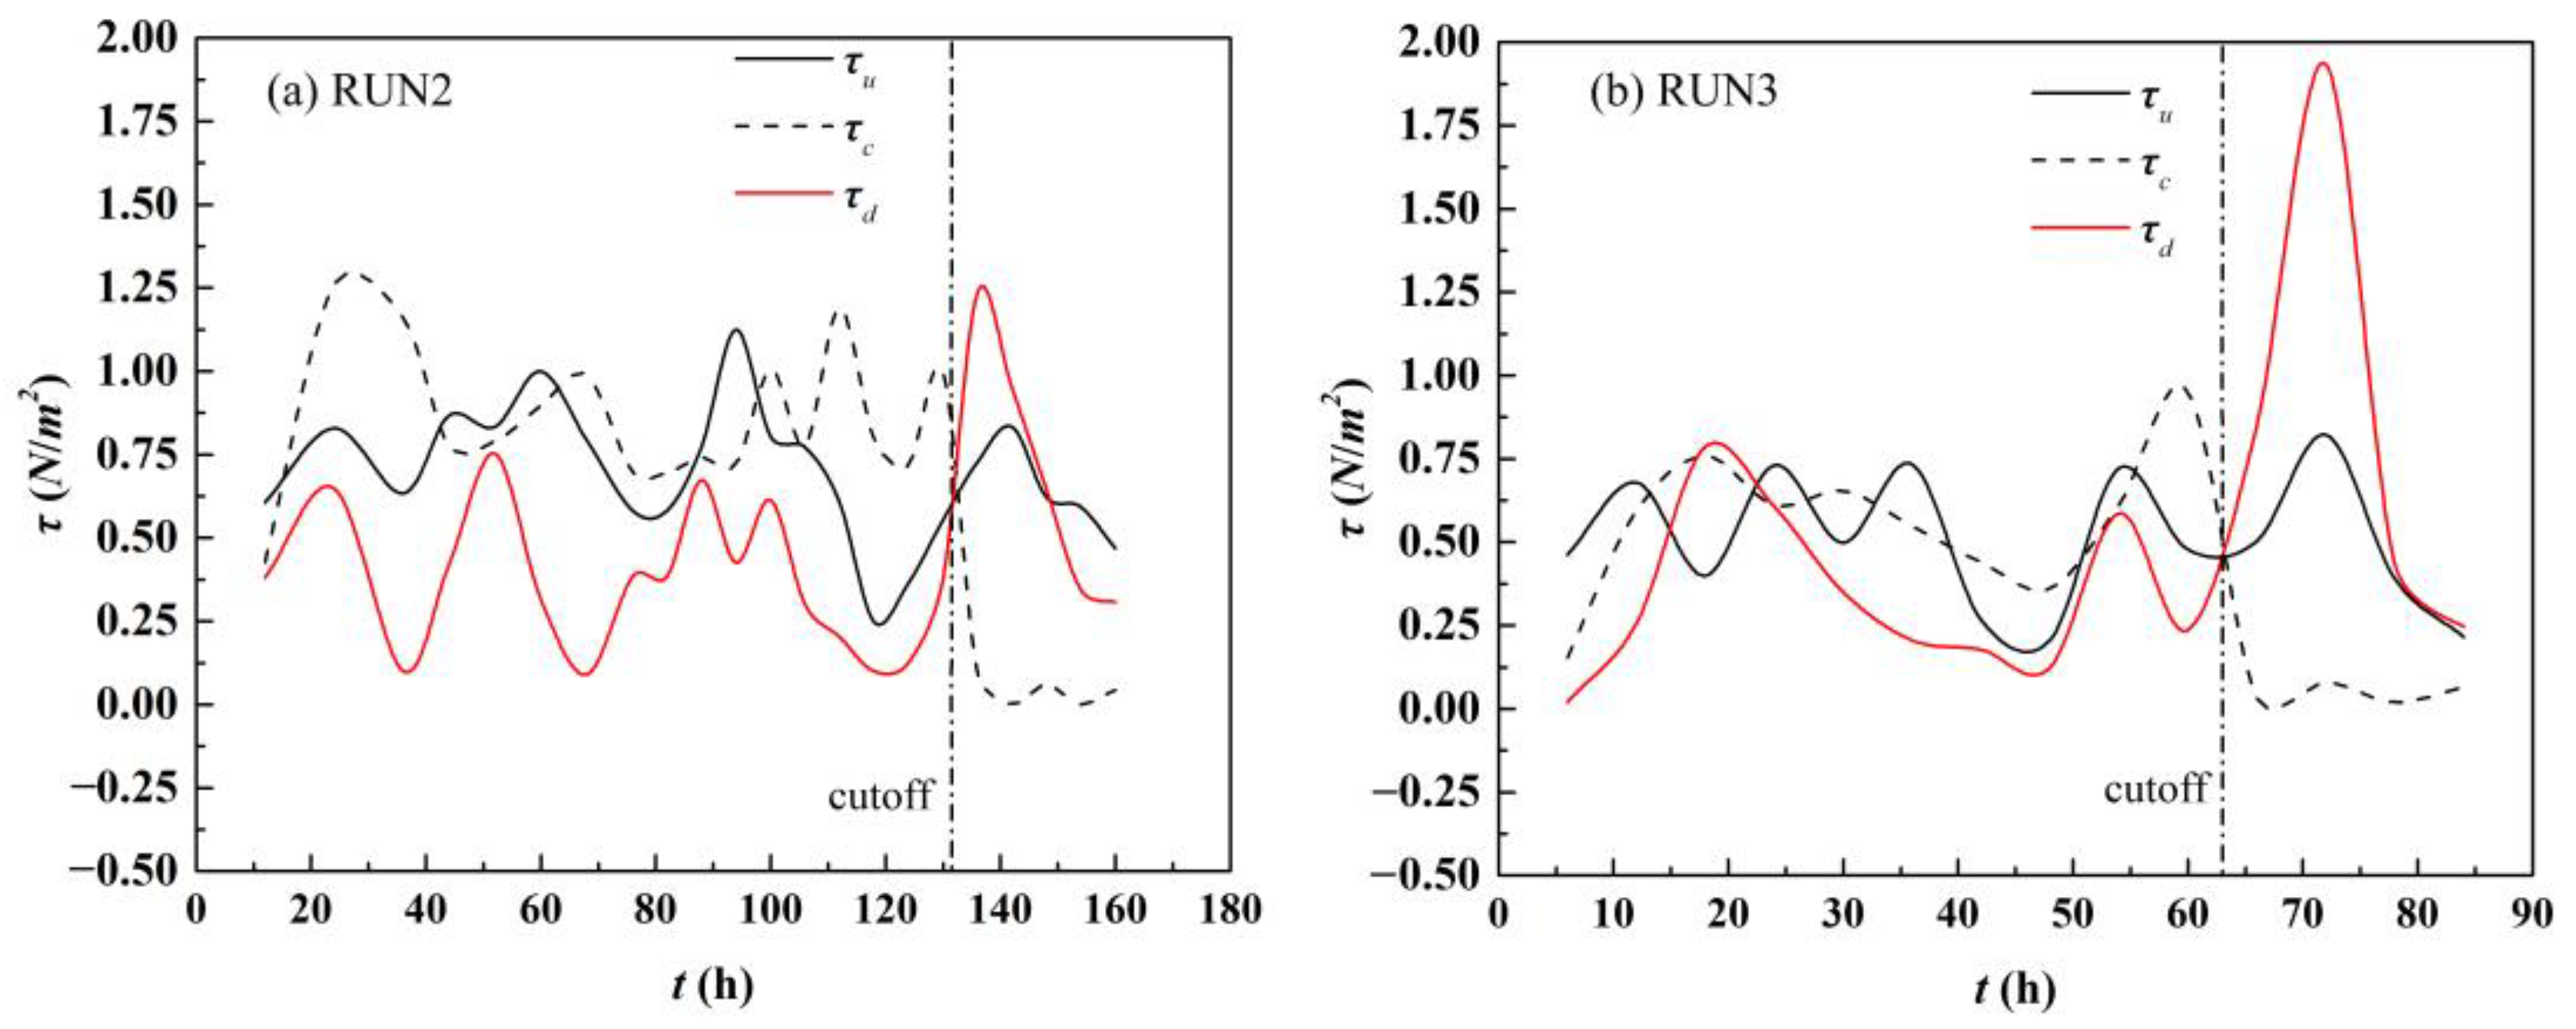
The average shear stress in the upstream area S7–S13, bend area S13–S21, and downstream area S21–S26 were represented by τu, τc, and τd, respectively. The variations in these three average shear stresses are shown in Figure 11. Before cutoff, the change trend of the average shear stress was the same as that of discharge. When cutoff occurred, τc was the highest, and τd was the lowest. After cutoff, τc sharply decreased, while both τu and τd increased. In RUN2, within t = 0–130 h before cutoff, the variation range of the three average shear forces was 0.25–1.12 N·m−2, 0.43–1.26 N·m−2, and 0.1–0.75 N·m−2, respectively. The experimental duration before cutoff was t = 0–130 h, and the shear forces in the three areas were 0.55, 1.00, and 0.38 N·m−2, respectively, of which the average shear force in the bend area τc was the highest. After cutoff, when the experimental duration reached t = 136 h, τu and τd increased to 0.73 and 1.24 N·m−2, respectively, which were 31.3% and 228.9% higher than those before cutoff, respectively. Moreover, τc was reduced to 0.09 N·m−2, which was 90.7% lower than that before cutoff. At t = 0–60 h before cutoff in RUN3, the three average shear stress ranges were 0.21–0.73 N·m−2, 0.15–0.95 N·m−2, and 0.02–0.79 N·m−2, respectively. Before cutoff, when the experimental duration reached t = 60 h, τu, τc, and τd were 0.48, 0.95, and 0.24 N·m−2, respectively, of which τc was still the highest. After cutoff, when the experimental duration was t = 66 h, τu and τd increased to 0.50 and 0.85 N·m−2, respectively, which were 5.3% and 258.6% higher than those before cutoff, respectively; τc was reduced to 0.03 N·m−2, which was 96.5% lower than that before cutoff.
4. Discussion
Similar to the experiments of Han [46] and Li [45], we also achieved neck cutoff. The observed phenomena during experimentation revealed that the external factor that caused cutoff was continuous scouring due to the flow of river banks on both sides upstream and downstream of the neck. The neck width was continuously reduced until cutoff occurred. Similar results were obtained in field observations [53]. The maintenance of meandering rivers does not require varied discharge [28]. Similarly, we found that varied discharge was not a necessary condition for the occurrence of cutoff, and continuous scouring in the neck section under medium flow could also lead to neck cutoff. The experiments indicated that medium and high discharge significantly contributed to cutoff, and cutoff generally occurred during the high-discharge period. These results are the same as those of field observations [9,10,24]. The effective discharge was defined as the discharge that contributed to the scouring of the neck section, and the duration of effective discharge directly affected the cutoff time and location. The initial topographies in the two runs of variable-discharge experiments were the same, the durations of effective discharge and the cutoff position were similar, the durations differed by only 0.5 h, and the cutoff positions were only 0.055 m apart; these results verified that the experiment is repeatable. Interesting phenomena were observed during the experiment. The scouring distance of the upstream and downstream sides of the neck was closely related to the cutoff position. The closer the cutoff position occurred to the downstream, the greater the downstream scouring distance of the neck. When cutoff occurred, the plane shape of the river channel also changed, the sinuosity increased, and the river bend rotated downstream. In three experimental runs, the river bend rotated downstream at the same angle.
This study attempted to explain the internal factors of cutoff from the perspective of energy consumption. The energy of a river system itself also changes in the evolution process, and the cutoff phenomenon, as a sudden event, is accompanied by energy changes. Therefore, the internal factor causing cutoff is the internal energy variations in the river. According to the minimum energy dissipation theory, meandering rivers can adjust any possible factors to achieve the purpose of transporting water and sediment at the minimum energy dissipation rate [54,55,56]. The river adjustment process can be divided into short- and long-term adjustment processes. The ultimate goal of this adjustment process is to attain a relative equilibrium state, which is a dynamic equilibrium state. When a river is adjusted to a relatively balanced state, the energy consumption rate of flow should be the minimum value, and the stream power per unit length is equivalent to the energy consumption rate [57,58]. When the river reaches a relatively stable stage, although the river energy consumption rate occasionally fluctuates, it remains constant overall.
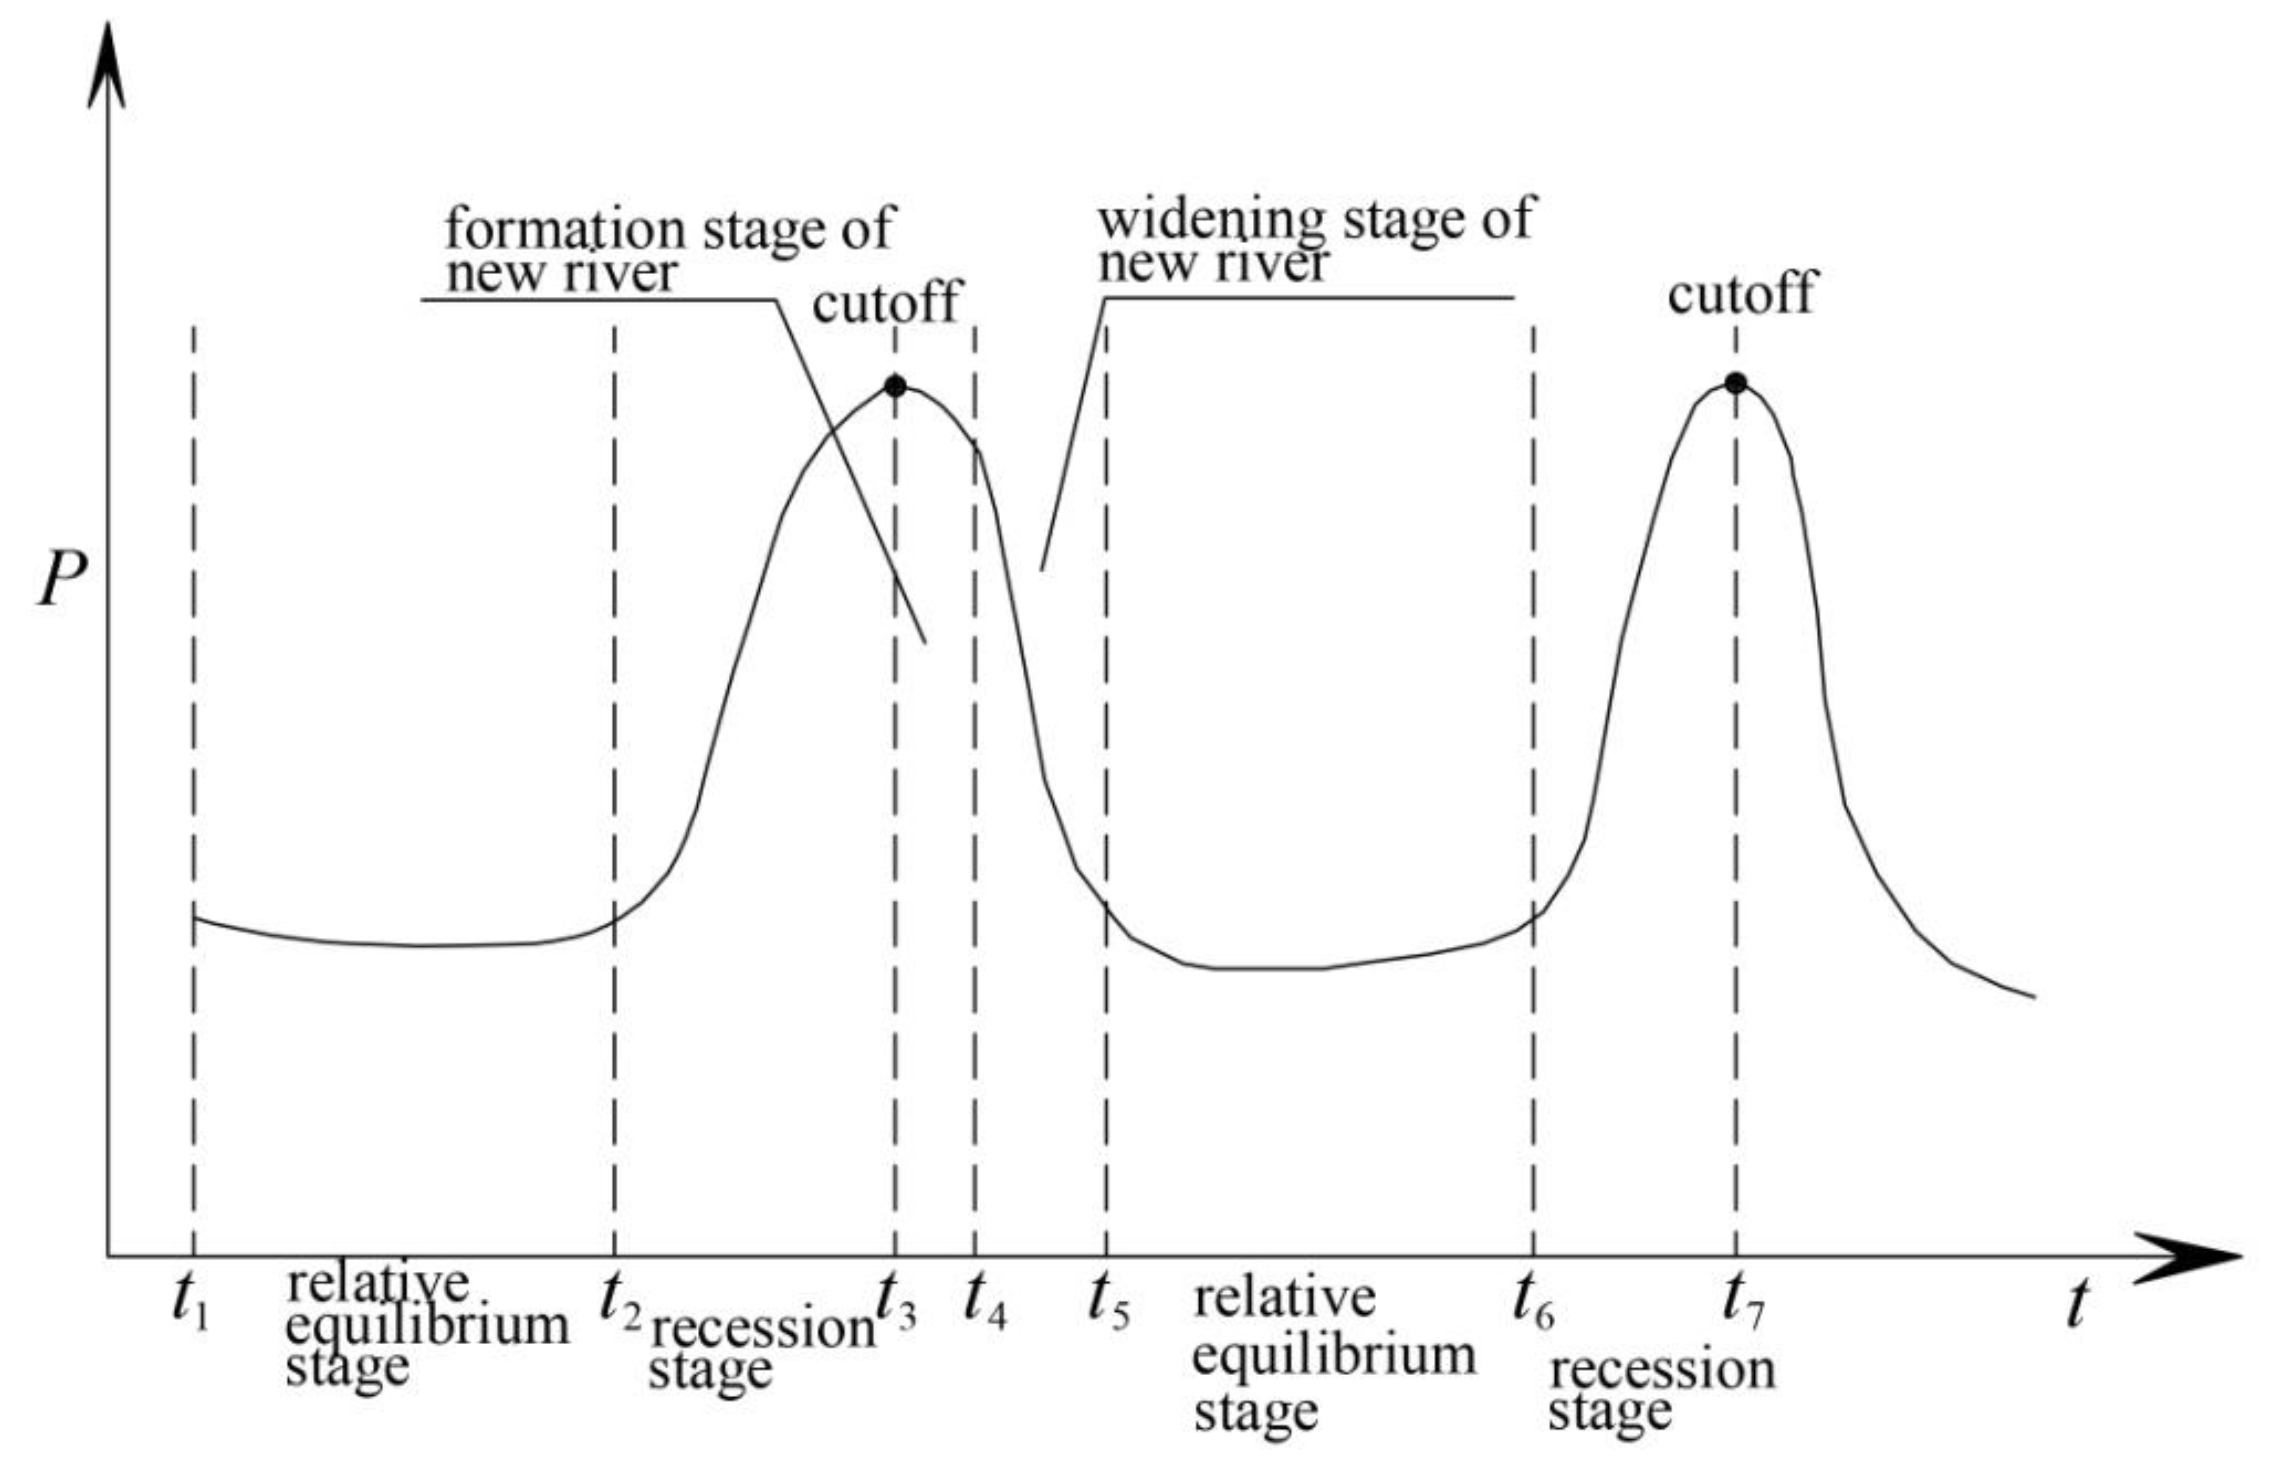
According to the variation in the stream power per unit length P over time in this experiment, the relationship between the P value at the different stages during the evolution of meandering rivers and cutoff occurrence was summarized, as shown in Figure 12. The river was initially at a relative equilibrium stage (t1 – t2), and the P value was maintained at the minimum value. At this stage, the sinuosity gradually increased, forming a river with a high sinuosity suitable for the occurrence of neck cutoff. This stage persisted for a very long time. When the boundary conditions or flow conditions changed, the relative equilibrium stage was disrupted, and the river started to readjust the boundary and flow conditions. The boundary condition of a high-sinuosity river determined that the river was adjusted toward neck cutoff, and gradually moved away from the equilibrium zone. The variation in boundary conditions greatly impacted the riverbed erosion and deposition processes, and the change in P value exhibited an increasing trend overall, although it occasionally decreased in the middle at a certain time; the increased energy consumption was mainly used to adjust the channel shape, scouring and shortening the neck section, which was referred to as the recession stage (t2–t3). When the P value increased to its maximum, a sudden change occurred (at time t3 in the figure), the neck width decreased to zero, and cutoff occurred. After cutoff occurrence, a new river channel was formed; the P value gradually decreased; and the river channel entered a new evolution period, evolving toward a relatively balanced stage. This stage ended quickly, and the river channel mainly adjusted its longitudinal shape. The P value was relatively large, which indicated the formation stage of a new river channel (t3–t4). The widening stage of the new river occurred next (t4–t5). The channel mainly adjusted the shape of the transverse section. This stage persisted for a long time, and the P value gradually decreased. When the river was adjusted to adapt to the new boundary and flow conditions, it entered a new relative equilibrium stage (t5–t6), and the P value again decreased to its minimum, with no major changes. This period was also long. The P value at the new relative equilibrium stage was not directly related to that at the previous relative equilibrium stage, and they were not necessarily equal. When the new relative equilibrium stage was disrupted, the river channel again entered the recession stage. Cutoff could occur again. This cycle could be repeated. Thus, neck cutoff was a sudden event that occurred when the energy consumption of a meandering river increased to its maximum value upon entry to the recession stage from the relative equilibrium stage.
5. Conclusions
Neck cutoff experiments under constant- and variable-flow conditions were conducted in a flume. The main conclusions were as follows: under controllable experimental conditions, neck cutoff could be realized. The main factor that caused cutoff was erosion of the neck due to water flow, and this erosion occurred on both the upstream and downstream banks of the neck. The variable discharge affected the channel erosion rate during a certain period but did not affect the overall trend in the neck width. Before cutoff, the change trend in the neck width and the overall change trend in the new channel width after cutoff were the same. After cutoff, the development of a new channel experienced three stages: (a) the very short-term vertical drawing stage, (b) the long-term horizontal widening stage, and (c) the long-term slow development stage (normal evolution stage). The discharge resulting in neck scouring was defined as the effective discharge, which contributed to cutoff, and this discharge directly affected the cutoff time and position. Neck cutoff is a phenomenon that occurs when the energy consumption of a meandering river increases to its maximum value upon entry to the recession stage from the relative equilibrium stage.
In natural rivers, the factors impacting cutoff are very complex, such as the material composition of the riverbank, changes in incoming water and sand, boundary conditions, and vegetation. Therefore, it is difficult to compare laboratory experiments with natural river phenomena. Even though it is highly challenging to capture the neck cutoff phenomenon of natural rivers, the conclusions of this research could still provide a reference for the study of neck cutoff events in natural rivers.
Author Contributions
Writing—original draft preparation, X.W.; writing—review and editing, X.Z.; project administration, X.H. All authors have read and agreed to the published version of the manuscript.
Funding
This research was supported by the Open Project of the Key Laboratory/Engineering Technology Center of the Yellow River Water Conservancy Research Institute, grant number LYRCER202203; Scientific Research Initiation Project of North China University of Water Resources and Electric Power, grant number 40830; Henan Science and Technology Project, grant number 222102330195; and Special Funds for Basic Scientific Research Business Expenses of Central-Level Public Welfare Scientific Research Institutes, grant number HKY-JBYW-2020-15 and HKY-JBYW-2023-22.
Institutional Review Board Statement
Not applicable.
Informed Consent Statement
Not applicable.
Data Availability Statement
Not applicable.
Conflicts of Interest
The authors declare no conflict of interest.
References
- Kleinhans, M.G. Sorting out river channel patterns. Prog. Phys. Geogr. 2010, 34, 287–326. [Google Scholar] [CrossRef]
- Yin, X.; Liang, Z.; Chen, J.; Liu, X. River Patterns and Their Changes. J. Sediment. Res. 1999, 13–19. [Google Scholar]
- Schumm, S.A. Patterns of Alluvial Rivers. Annu. Rev. Earth Planet. Sci. 1985, 13, 5–27. [Google Scholar] [CrossRef]
- Güneralp, İ.; Abad, J.D.; Zolezzi, G.; Hooke, J. Advances and challenges in meandering channels research. Geomorphology 2012, 163-164, 1–9. [Google Scholar] [CrossRef]
- Seminara, G. Meanders. J. Fluid Mech. 2006, 554, 271–297. [Google Scholar] [CrossRef]
- Callander, R.A. River Meandering. Ann. Rev. Fluid Mech. 1978, 10, 129–158. [Google Scholar] [CrossRef]
- Parker, G. On the cause and characteristic scales of meandering and braiding in rivers. J. Fluid Mech. 1976, 76, 457–480. [Google Scholar] [CrossRef]
- Richang, T. Preliminary analysis of the cause of meandering river section and experimental study of bed making. Acta Geol. Sin.-Engl. Ed. 1963, 29, 13–21. [Google Scholar]
- Hooke, J.M. Cutoffs galore!: Occurrence and causes of multiple cutoffs on a meandering river. Geomorphology 2004, 61, 225–238. [Google Scholar] [CrossRef]
- Hooke, J.M. River channel adjustment to meander cutoffs on the River Bollin and River Dane, northwest England. Geomorphology 1995, 14, 235–253. [Google Scholar] [CrossRef]
- Micheli, E.R.; Larsen, E.W. River channel cutoff dynamics, Sacramento River, California, USA. River Res. Appl. 2015, 27, 328–344. [Google Scholar] [CrossRef]
- Zinger, J.A.; Rhoads, B.L.; Best, J.L.; Johnson, K.K. Flow structure and channel morphodynamics of meander bend chute cutoffs: A case study of the Wabash River, USA. J. Geophys. Res. Earth Surf. 2013, 118, 2468–2487. [Google Scholar] [CrossRef]
- Qiao, Q.; Chun-guang, L.; He-fang, J.; Ling-xiao, H.; Cheng, Y. Impact of an artificial chute cutoff on the river morphology and flow structure in Sipaikou area of the Upper Yellow River. J. Mt. Sci. 2021, 18, 3275–3290. [Google Scholar] [CrossRef]
- Fuller, I.C.; Large, A.R.G.; Milan, D.J. Quantifying channel development and sediment transfer following chute cutoff in a wandering gravel-bed river. Geomorphology 2003, 54, 307–323. [Google Scholar] [CrossRef]
- Constantine, J.A.; McLean, S.R.; Dunn, T. A mechanism of chute cutoff along large meandering rivers with uniform floodplain topography. Geol. Soc. Am. Bull. 2010, 122, 855–869. [Google Scholar] [CrossRef] [Green Version]
- Eekhout, J.P.C.; Hoitink, A.J.F. Chute cutoff as a morphological response to stream reconstruction: The possible role of backwater. Water Resour. Res. 2015, 51, 3339–3352. [Google Scholar] [CrossRef]
- Viero, D.P.; Dubon, S.L.; Lanzoni, S. Chute cutoffs in meandering rivers: Formative mechanisms and hydrodynamic forcing. Int. Assoc. Sedimentol. Spec. Publ. 2018, 48, 201–230. [Google Scholar]
- Richards, D.; Konsoer, K. Morphologic adjustments of actively evolving highly curved neck cutoffs. Earth Surf. Proc. Land. 2020, 45, 1067–1081. [Google Scholar] [CrossRef] [Green Version]
- Li, Z.; Gao, P.; You, Y.; Finotello, A.; Ielpi, A. Delayed neck cutoff in the meandering Black River of the Qinghai–Tibet plateau. Earth Surf. Proc. Land. 2022, 1–12. [Google Scholar] [CrossRef]
- Li, Z.; Wu, X.; Gao, P. Experimental study on the process of neck cutoff and channel adjustment in a highly sinuous meander under constant discharges. Geomorphology 2018, 327, 215–229. [Google Scholar] [CrossRef]
- Li, Z.; Yang, H.; Xia, J.; Zhou, M.; Wang, Y. Channel morphologic processes of a highly sinuous bend approaching neck cutoff by bank erosion in the middle Yangtze River. Int. J. Sediment Res. 2021, 36, 457–467. [Google Scholar] [CrossRef]
- Gay, G.R.; Gay, H.H.; Gay, W.H.; Martinson, H.A.; Meade, R.H.; Moody, J.A. Evolution of cutoffs across meander necks in Powder River, Montana, USA. Earth Surf. Proc. Land. 2015, 23, 651–662. [Google Scholar] [CrossRef]
- Slowik, M. The influence of meander bend evolution on the formation of multiple cutoffs: Findings inferred from floodplain architecture and bend geometry. Earth Surf. Proc. Land. 2015, 41, 626–641. [Google Scholar] [CrossRef]
- Hooke, J.M. Complexity, self-organisation and variation in behaviour in meandering rivers. Geomorphology 2007, 91, 236–258. [Google Scholar] [CrossRef]
- Gautier, E.; Brunstein, D.; Vauchel, P.; Roulet, M.; Fuertes, O.; Guyot, L.; Darozzes, J.; Bourrel, L. Temporal relations between meander deformation, water discharge and sediment fluxes in the floodplain of the Rio Beni (Bolivian Amazonia). Earth Surf. Proc. Land. 2010, 32, 230–248. [Google Scholar] [CrossRef]
- Thompson, D.M. A Geomorphic Explanation for a Meander Cutoff Following Channel Relocation of a Coarse-Bedded River. Environ. Manag. 2003, 31, 385–400. [Google Scholar] [CrossRef]
- Braudrick, C.A.; Dietrich, W.E.; Leverich, G.T.; Sklar, L.S. Experimental evidence for the conditions necessary to sustain meandering in coarse-bedded rivers. Proc. Natl. Acad. Sci. USA 2009, 106, 16936–16941. [Google Scholar] [CrossRef] [Green Version]
- Visconti, F.; Camporeale, C.; Ridolfi, L. Role of discharge variability on pseudomeandering channel morphodynamics: Results from laboratory experiments. J. Geophys. Res. 2010, 115, 1–18. [Google Scholar] [CrossRef] [Green Version]
- Monegaglia, F.; Tubino, M. The Hydraulic Geometry of Evolving Meandering Rivers. J. Geophys. Res. Earth Surf. 2019, 124, 2723–2748. [Google Scholar] [CrossRef]
- Dulal, K.P.; Shimizu, Y. Experimental simulation of meandering in clay mixed sediments. J. Hydro-Environ. Res. 2010, 4, 329–343. [Google Scholar] [CrossRef]
- Van Dijk, W.M.; van de Lageweg, W.I.; Kleinhans, M.G. Formation of a cohesive floodplain in a dynamic experimental meandering river. Earth Surf. Proc. Land. 2013, 38, 1550–1565. [Google Scholar]
- Peakall, J.; Ashworth, P.J.; Best, J.L. Meander-Bend Evolution, Alluvial Architecture, and the Role of Cohesion in Sinuous River Channels: A Flume Study. J. Sediment. Res. 2007, 77, 197–212. [Google Scholar] [CrossRef]
- Smith, C.E. Modeling high sinuosity meanders in a small flume. Geomorphology 1998, 25, 19–30. [Google Scholar] [CrossRef]
- Dijk, W.M.V.; van de Lageweg, W.I.; Kleinhans, M.G. Experimental meandering river with chute cutoffs. J. Geophys. Res. 2012, 117, 1–18. [Google Scholar]
- Xu, D.; Bai, Y. Experimental study on the bed topography evolution in alluvial meandering rivers with various sinuousnesses. J. Hydro-Environ. Res. 2013, 7, 92–102. [Google Scholar] [CrossRef]
- Song, X.; Xu, G.; Bai, Y.; Xu, D. Experiments on the short-term development of sine-generated meandering rivers. J. Hydro-Environ. Res. 2016, 11, 42–58. [Google Scholar] [CrossRef]
- Eaton, B.C.; Giles, T.R. Assessing the effect of vegetation-related bank strength on channel morphology and stability in gravel-bed streams using numerical models. Earth Surf. Proc. Land. 2009, 34, 712–724. [Google Scholar] [CrossRef]
- Eaton, B.C. Bank stability analysis for regime models of vegetated gravel bed rivers. Earth Surf. Proc. Land. 2006, 31, 1438–1444. [Google Scholar] [CrossRef]
- Tal, M.; Paola, C. Effects of vegetation on channel morphodynamics: Results and insights from laboratory experiments. Earth Surf. Proc. Land. 2010, 35, 1014–1028. [Google Scholar] [CrossRef]
- Polvi, L.E.; Wohl, E.; Merritt, D.M. Modeling the functional influence of vegetation type on streambank cohesion. Earth Surf. Proc. Land. 2014, 39, 1245–1258. [Google Scholar] [CrossRef]
- Millar, R.G. Influence of bank vegetation on alluvial channel patterns. Water Resour. Res. 2000, 36, 1109–1118. [Google Scholar] [CrossRef]
- Gran, K.; Paola, C. Riparian vegetation controls on braided stream dynamics. Water Resour. Res. 2001, 37, 3275–3283. [Google Scholar] [CrossRef] [Green Version]
- Corenblit, D.; Steiger, J.; Gurnell, A.M.; Tabacchi, E.; Roques, L. Control of sediment dynamics by vegetation as a key function driving biogeomorphic succession. Earth Surf. Proc. Land. 2009, 34, 1790–1810. [Google Scholar] [CrossRef]
- Tal, M.; Paola, C. Dynamic single-thread channels maintained by the interaction of flow and vegetation. Geology 2007, 35, 1651–1656. [Google Scholar] [CrossRef]
- Li, Z.; Gao, P.; Wu, X. Processes of neck cutoff and channel adjustment affected by seeding herbaceous vegetation and variable discharges. CATENA 2022, 208, 105731. [Google Scholar] [CrossRef]
- Han, B.; Endreny, T.A. Detailed river stage mapping and head gradient analysisduring meander cutoff in a laboratory river. Water Resour. Res. 2014, 50, 1689–1703. [Google Scholar] [CrossRef]
- Kleinhans, M.G.; van den Berg, J.H. River channel and bar patterns explained and predicted by an empirical and a physics-based method. Earth Surf. Proc. Land. 2011, 36, 721–738. [Google Scholar] [CrossRef]
- Lague, D. The stream power river incision model: Evidence, theory and beyond. Earth Surf. Proc. Land. 2014, 39, 38–61. [Google Scholar] [CrossRef]
- Petit, F.; Gob, F.; Houbrechts, G.; Assani, A.A. Critical specific stream power in gravel-bed rivers. Geomorphology 2005, 69, 92–101. [Google Scholar] [CrossRef]
- Moore, I.D.; Burch, G.J. Sediment Transport Capacity of Sheet and Rill Flow: Application of Unit Stream Power Theory. Water Resour. Res. 1986, 22, 1350–1360. [Google Scholar] [CrossRef]
- Yang, C.T.; Stall, J.B. Applicability of Unit Stream Power Equation. ASCE 1976, 102, 559–568. [Google Scholar] [CrossRef]
- Bendix, J. Stream power influence on southern Californian riparian vegetation. J. Veg. Sci. 1999, 10, 243–252. [Google Scholar] [CrossRef]
- Stolum, H.H. Planform geometry and dynamics of meandering rivers. Geol. Soc. Am. Bull. 1998, 110, 1485–1498. [Google Scholar] [CrossRef]
- Yang, C.T. Unit stream power equations for total load. J. Hydrol. 1979, 40, 123–138. [Google Scholar] [CrossRef]
- Chang, H.H. Analysis of River Meanders. J. Hydraul. Eng. 1984, 110, 37–50. [Google Scholar] [CrossRef]
- Yang, C.T.; Song, C.C.S.; Woldenberg, M.J. Hydraulic geometry and minimum rate of energy dissipation. Water Resour. Res 1981, 17, 1014–1018. [Google Scholar] [CrossRef]
- Xu, G.; Zhao, L.; Yang, C.T. Derivation and verification of minimum energy dissipation rate principle of fluid based on minimum entropy production rate principle. Int. J. Sediment Res. 2016, 31, 16–24. [Google Scholar] [CrossRef]
- Xu, G.; Lian, J. Changes of the entropy, the entropy production and the rate of energy dissipation in river adjustment. Adv. Water Sci. 2004, 11, 3933–4024. [Google Scholar]
Figure 1.
(a) Experimental system and (b) particle size distribution curve.

Figure 2.
(a) The setup of the experiment was based on Qigongling Bend, a highly curved channel at the end of the lower Jingjiang River in the middle reaches of the Yangtze River, with a sinuosity of approximately 7. (b) Overall schematic diagram of the experimental system. (c) Enlarged schematic diagram of neck width Wnc, which was the shortest channel width through the cutoff position; points A and B were possible cutoff locations, and the neck width was the length of section MN. (d) Schematic diagram of the new river width Wnr formed after cutoff.

Figure 3.
Variable discharges in (a) RUN2 and (b) RUN3.

Figure 4.
Temporal variations in the neck width Wnc before cutoff.

Figure 5.
Reduction rates for the neck width MD during different periods with (a) RUN1, (b) RUN2, and (c) RUN3; the variation in MD was closely related to the discharge and increased to different degrees when approaching cutoff in all three runs.
Figure 5.
Reduction rates for the neck width MD during different periods with (a) RUN1, (b) RUN2, and (c) RUN3; the variation in MD was closely related to the discharge and increased to different degrees when approaching cutoff in all three runs.

Figure 6.
Variation in the (a) water level and (b) water level drop from upstream to downstream of the neck.
Figure 6.
Variation in the (a) water level and (b) water level drop from upstream to downstream of the neck.

Figure 7.
Temporal variation in the stream power per unit length.

Figure 8.
(a) Width of the new channel Wnr and (b) the average broadening rate Mn and corresponding discharge during different periods.
Figure 8.
(a) Width of the new channel Wnr and (b) the average broadening rate Mn and corresponding discharge during different periods.

Figure 9.
Comparison between (a) the initial terrain and the final terrain after cutoff with (b) the topography of the relative equilibrium in RUN2 and (c) the topography of the relative equilibrium in RUN3. The white line represents the measured cross section. The yellow line on the right marks the length.

Figure 10.
Variations in the water surface gradient during (a) RUN2 and (b) RUN3. Su and Sd showed similar trends, while Sc had the opposite trend. After cutoff, Sc sharply dropped, while both Su and Sd increased.
Figure 10.
Variations in the water surface gradient during (a) RUN2 and (b) RUN3. Su and Sd showed similar trends, while Sc had the opposite trend. After cutoff, Sc sharply dropped, while both Su and Sd increased.

Figure 11.
Variations in three average shear stresses during (a) RUN2 and (b) RUN3. When cutoff occurred, τc was the highest and τd was the lowest. After cutoff, τc sharply decreased, while both τu and τd increased.
Figure 11.
Variations in three average shear stresses during (a) RUN2 and (b) RUN3. When cutoff occurred, τc was the highest and τd was the lowest. After cutoff, τc sharply decreased, while both τu and τd increased.

Figure 12.
Schematic representation of the stream power values at the different stages of the river evolution.
Figure 12.
Schematic representation of the stream power values at the different stages of the river evolution.


Table 1.
Experimental runs.
| RUN | Initial Slope Sr | Discharge Q (L/s) | Re | Duration t (h) |
|---|---|---|---|---|
| 1 | 1.0‰ | Constant | 7473–8315 | 85.45 |
| 2 | 1.0‰ | Low–middle–high–high | 1454–5157 | 160 |
| 3 | 1.0‰ | High–high | 1436–5369 | 84 |
Table 2.
Scour distances upstream and downstream of the neck.
| Run | Wu (m) | Wd (m) | Wnc (m) | Cutoff Location | Wu/Wd |
|---|---|---|---|---|---|
| 1 | 0.140 | 0.150 | 0.290 | 0.320 m downstream from S13 | 0.93 |
| 2 | 0.190 | 0.070 | 0.260 | 0.029 m upstream from S13 | 2.71 |
| 3 | 0.092 | 0.148 | 0.240 | 0.026 m downstream from S13 | 0.62 |
Table 3.
Critical stream power per unit length at neck cutoff occurrence.
| RUN | γ (N∙m−3) | Q (m3/s) | Water Head (cm) | Distance (m) | J | P (W∙m−1) |
|---|---|---|---|---|---|---|
| 1 | 9800 | 0.0020 | 2.07 | 7.667 | 0.00270 | 0.0530 |
| 2 | 9800 | 0.0030 | 1.85 | 5.355 | 0.0035 | 0.1097 |
| 3 | 9800 | 0.0035 | 1.58 | 5.355 | 0.0030 | 0.1012 |
Table 4.
Sinuosity and rotation angle of bend B4 upon cutoff occurrence.
| RUN | Sinuosity | Angle of Rotation Downstream (°) | ||
|---|---|---|---|---|
| Initial | Cutoff | Increase Percentage (%) | ||
| 1 | 6.47 | 6.71 | 3.79 | 11 |
| 2 | 6.69 | 7.09 | 5.89 | 11 |
| 3 | 7.03 | 7.11 | 1.16 | 11 |
Disclaimer/Publisher’s Note: The statements, opinions and data contained in all publications are solely those of the individual author(s) and contributor(s) and not of MDPI and/or the editor(s). MDPI and/or the editor(s) disclaim responsibility for any injury to people or property resulting from any ideas, methods, instructions or products referred to in the content. |
© 2023 by the authors. Licensee MDPI, Basel, Switzerland. This article is an open access article distributed under the terms and conditions of the Creative Commons Attribution (CC BY) license (https://creativecommons.org/licenses/by/4.0/).
Share and Cite
MDPI and ACS Style
Wu, X.; Hu, X.; Zhang, X. Experimental Study on Neck Cutoff in Meandering River under Variable Discharges. Water 2023, 15, 841. https://doi.org/10.3390/w15050841
AMA Style
Wu X, Hu X, Zhang X. Experimental Study on Neck Cutoff in Meandering River under Variable Discharges. Water. 2023; 15(5):841. https://doi.org/10.3390/w15050841
Chicago/Turabian StyleWu, Xinyu, Xuyue Hu, and Xiang Zhang. 2023. "Experimental Study on Neck Cutoff in Meandering River under Variable Discharges" Water 15, no. 5: 841. https://doi.org/10.3390/w15050841
Note that from the first issue of 2016, this journal uses article numbers instead of page numbers. See further details here.