Article

Combining Full-Scale Ozonation and Biological Activated Carbon Filtration (O3-BAC) with Pilot-Scale Nanofiltration (NF) to Control Disinfection By-Product Formation for Treatment of Taihu Lake Water

1
Key Laboratory of Yellow River Water Environment in Gansu Province, Lanzhou Jiaotong University, Lanzhou 730070, China
2
School of Environment and Municipal Engineering, Lanzhou Jiaotong University, Lanzhou 730070, China
3
College of Environmental Science and Engineering, Tongji University, Shanghai 200092, China
4
Key Laboratory of Yangtze River Water Environment, Ministry of Education, Shanghai 200092, China
*
Author to whom correspondence should be addressed.
Water 2023, 15(5), 843; https://doi.org/10.3390/w15050843
Submission received: 16 January 2023 / Revised: 10 February 2023 / Accepted: 19 February 2023 / Published: 21 February 2023
(This article belongs to the Section Wastewater Treatment and Reuse)

Abstract

:
Nanofiltration (NF) membranes, which can consistently offer safe and reliable water quality, have become increasingly popular in drinking water treatment. In this study, the conventional (coagulation-sedimentation-sand filtration) and ozonation-biologically activated carbon filtration (O3-BAC) advanced treatment processes at a full-scale drinking water treatment plant (DWTP) were combined with a pilot-scale NF process for treatment of Taihu Lake water. The results showed that the “conventional + O3-BAC + NF” combined processes had superior effects on removing natural organic matter (NOM), Br, and other common water quality parameters (e.g., turbidity, conductivity, TDS, and total hardness) with efficiencies of 88.8–99.8%, for which the NF process played a critical role. The conventional plus O3-BAC processes effectively removed formation potential of chlorinated disinfection by-products (Cl-DBPFPs, by 28.0–46.6%), but had poorer effect in reducing formation potential of brominated DBPs (Br-DBPFPs, by −2637.2–17.3%). NOM concentrations (characterized by dissolved organic carbon (DOC), ultraviolet absorbance at 254 nm (UV254), and/or fluorescent components) were the driving factors for most DBPFP species, while elevation of [Br]/[DOC] ratio likely resulted in enhanced formation of brominated trihalomethanes (THMs) during chlorination of the BAC effluent. By adding the pilot-scale NF process, the “conventional + O3-BAC + NF” treatment train effectively controlled DBPFP, yielding the removal efficiencies of Cl-DBPFP and Br-DBPFP as 77.6–100% and 33.5–100%, respectively, with monochloroacetic acid, mono-bromo-acetic acid, and tribromomethane formation potentials (MCAA-FP, MBAA-FP, and TBM-FP) not detected in the final effluent. Low temperature in the winter season might be the primary reason for the rapid increase of transmembrane pressure when operating the NF membrane under flux of 25 L/(m2·h), which could be largely delayed by lowering the flux to 20 L/(m2·h). Characterization of the membrane cleaning solutions showed that macromolecular biopolymers (6000 Da–4000K Da) such as polysaccharides and proteins were the main contributors to membrane fouling.

1. Introduction

Natural organic matter (NOM), ubiquitously found in aqueous environments, is a heterogeneous mixture of humic acid, fulvic acid, proteins, polysaccharides, and other dissolved organic compounds of varying sizes [1,2,3]. NOM can affect the smell, color, and taste of water, cause bacterial re-growth in distribution systems [4,5], and unintentionally form disinfection byproducts (DBPs) during chlorine-based disinfection processes [4,5]. Nowadays approximately 600–700 DBPs have been detected in finished drinking waters, some of which are known or potential carcinogens related to bladder and colon cancers [6,7,8]. Therefore, many countries have regulated the maximum contaminant levels (MCLs) in finished water for DBPs with known health risks, such as trihalomethanes (THMs) and halo-acetic acids (HAAs): in the U.S., MCLs of total THMs (TTHMs, i.e., the sum of trichloromethane (TCM, or chloroform), tribromomethane (TBM, or bromoform), bromodichloromethane (BDCM), and dibromochloromethane (DBCM)) and HAA5 (the sum of five regulated HAAs, including mono-, di-, and trichloroacetic acid, and mono- and dibromo-acetic acid (MCAA, DCAA, TCAA, MBAA, and DBAA)) are regulated as 80 μg/L and 60 μg/L, respectively; in Japan, concentrations of TTHMs have to be controlled below 100 μg/L; in China, the sum of the ratios of the detected levels for individual trihalomethanes (THMs) over their respective MCLs (60–100 μg/L) should not exceed 1 [6,9,10].
Numerous methods to get rid of NOM have been employed to control DBP formation in drinking water treatment. Conventional water treatment processes including coagulation, flocculation, sedimentation, and sand filtration (SF) generally have limited effects [11,12], while the advanced treatment of ozonation-biological activated carbon filtration (O3-BAC) could significantly improve [13,14] elimination of DBP generation by removing their precursors. However, limitations have been found for O3-BAC when treating water containing bromide (Br) and/or algae, such as (i) increased generation of bromate (BrO3) and brominated DBPs (Br-DBPs) during the subsequent chlorination of ozonated water [15], with the latter being dozens to hundreds of times more toxic than chlorinated DBPs (Cl-DBPs) [16,17]; and (ii) destruction of algae cells by ozonation, releasing intracellular algal organics such as humus and bio-polymerin, which are important precursors to THMs and HAAs [18]. Moreover, with increasing service time of the BAC filter, the adsorption capacity of the activated carbon to retain NOM would decrease, likely leading to increased DBP precursors in the effluent [19]; and leakage of microorganisms (e.g., bacteria and invertebrates) into the BAC effluent and associated health risks could also occur, which has sparked widespread public concern [20]. As a result of these negative effects, further upgrade of the “conventional + O3-BAC” treatment processes is urgently needed to guarantee the health and safety of drinking water.
Previous studies have shown that nanofiltration (NF) technology can largely improve removal of DBP precursors. Siddique et al. [21] found that the removal efficiency of DBP precursors in surface water by ozonation integrated with NF reached 90–95%. Ersan et al. [22] reported that 72–91% of THM precursors in municipal wastewater were removed by various NF membranes. Kim et al. [23] discovered that the removal efficiencies of THM and HAA formation potentials (THM-FP and HAA-FP) using the ultrafiltration-nanofiltration (UF-NF) process for treatment of Han River water were 85–89%, the NF membrane playing the critical role. However, most of the above studies were based on laboratory experiments, with few in pilot or full scale, leading to a lack of practical value. Regardless of the merits listed above, membrane fouling still presents a challenge for application of this technology [24], and colloid and NOM are reported as the main causes of accelerated NF membrane fouling during treatment of surface water [25,26]. Thus, to maintain the stability of NF membrane operation, it is crucial to choose the appropriate pretreatment technology to remove NOM. Considering its effectiveness in NOM removal, the multi-step treatment consisting of conventional and O3-BAC treatment processes might serve as a promising pre-treatment for NF membrane operation [27], which to the best of our knowledge, has barely been reported in the literature.
In light of the above, this project installed a pilot-scale NF process following the existing processes at a full-scale drinking water treatment plant to form a “conventional + O3-BAC + NF” combined system, and evaluated its performance in improving water quality and controlling DBP formation. A commercially-available NF90 membrane that has been widely applied in lab-scale studies [28,29,30] was employed here for the pilot-scale NF process. Over the operation period of August 2020 to December 2021, a variety of water quality parameters were monitored to characterize NOM concentrations and compositions as well as inorganic components through the treatment train. Correlation analyses were performed to identify the monitored parameters associated with and/or responsible for formation potentials of TTHMs (TTHM-FP) and HAA5 (HAA5-FP) and their individual species. The mechanisms of NF membrane fouling using “conventional + O3-BAC” effluent as the feed water were also investigated. The ultimate goal of this study was to provide a meaningful reference for supply of high-quality drinking water in China and for other regions worldwide.

2. Materials and Methods

2.1. Operating Mode and Conditions

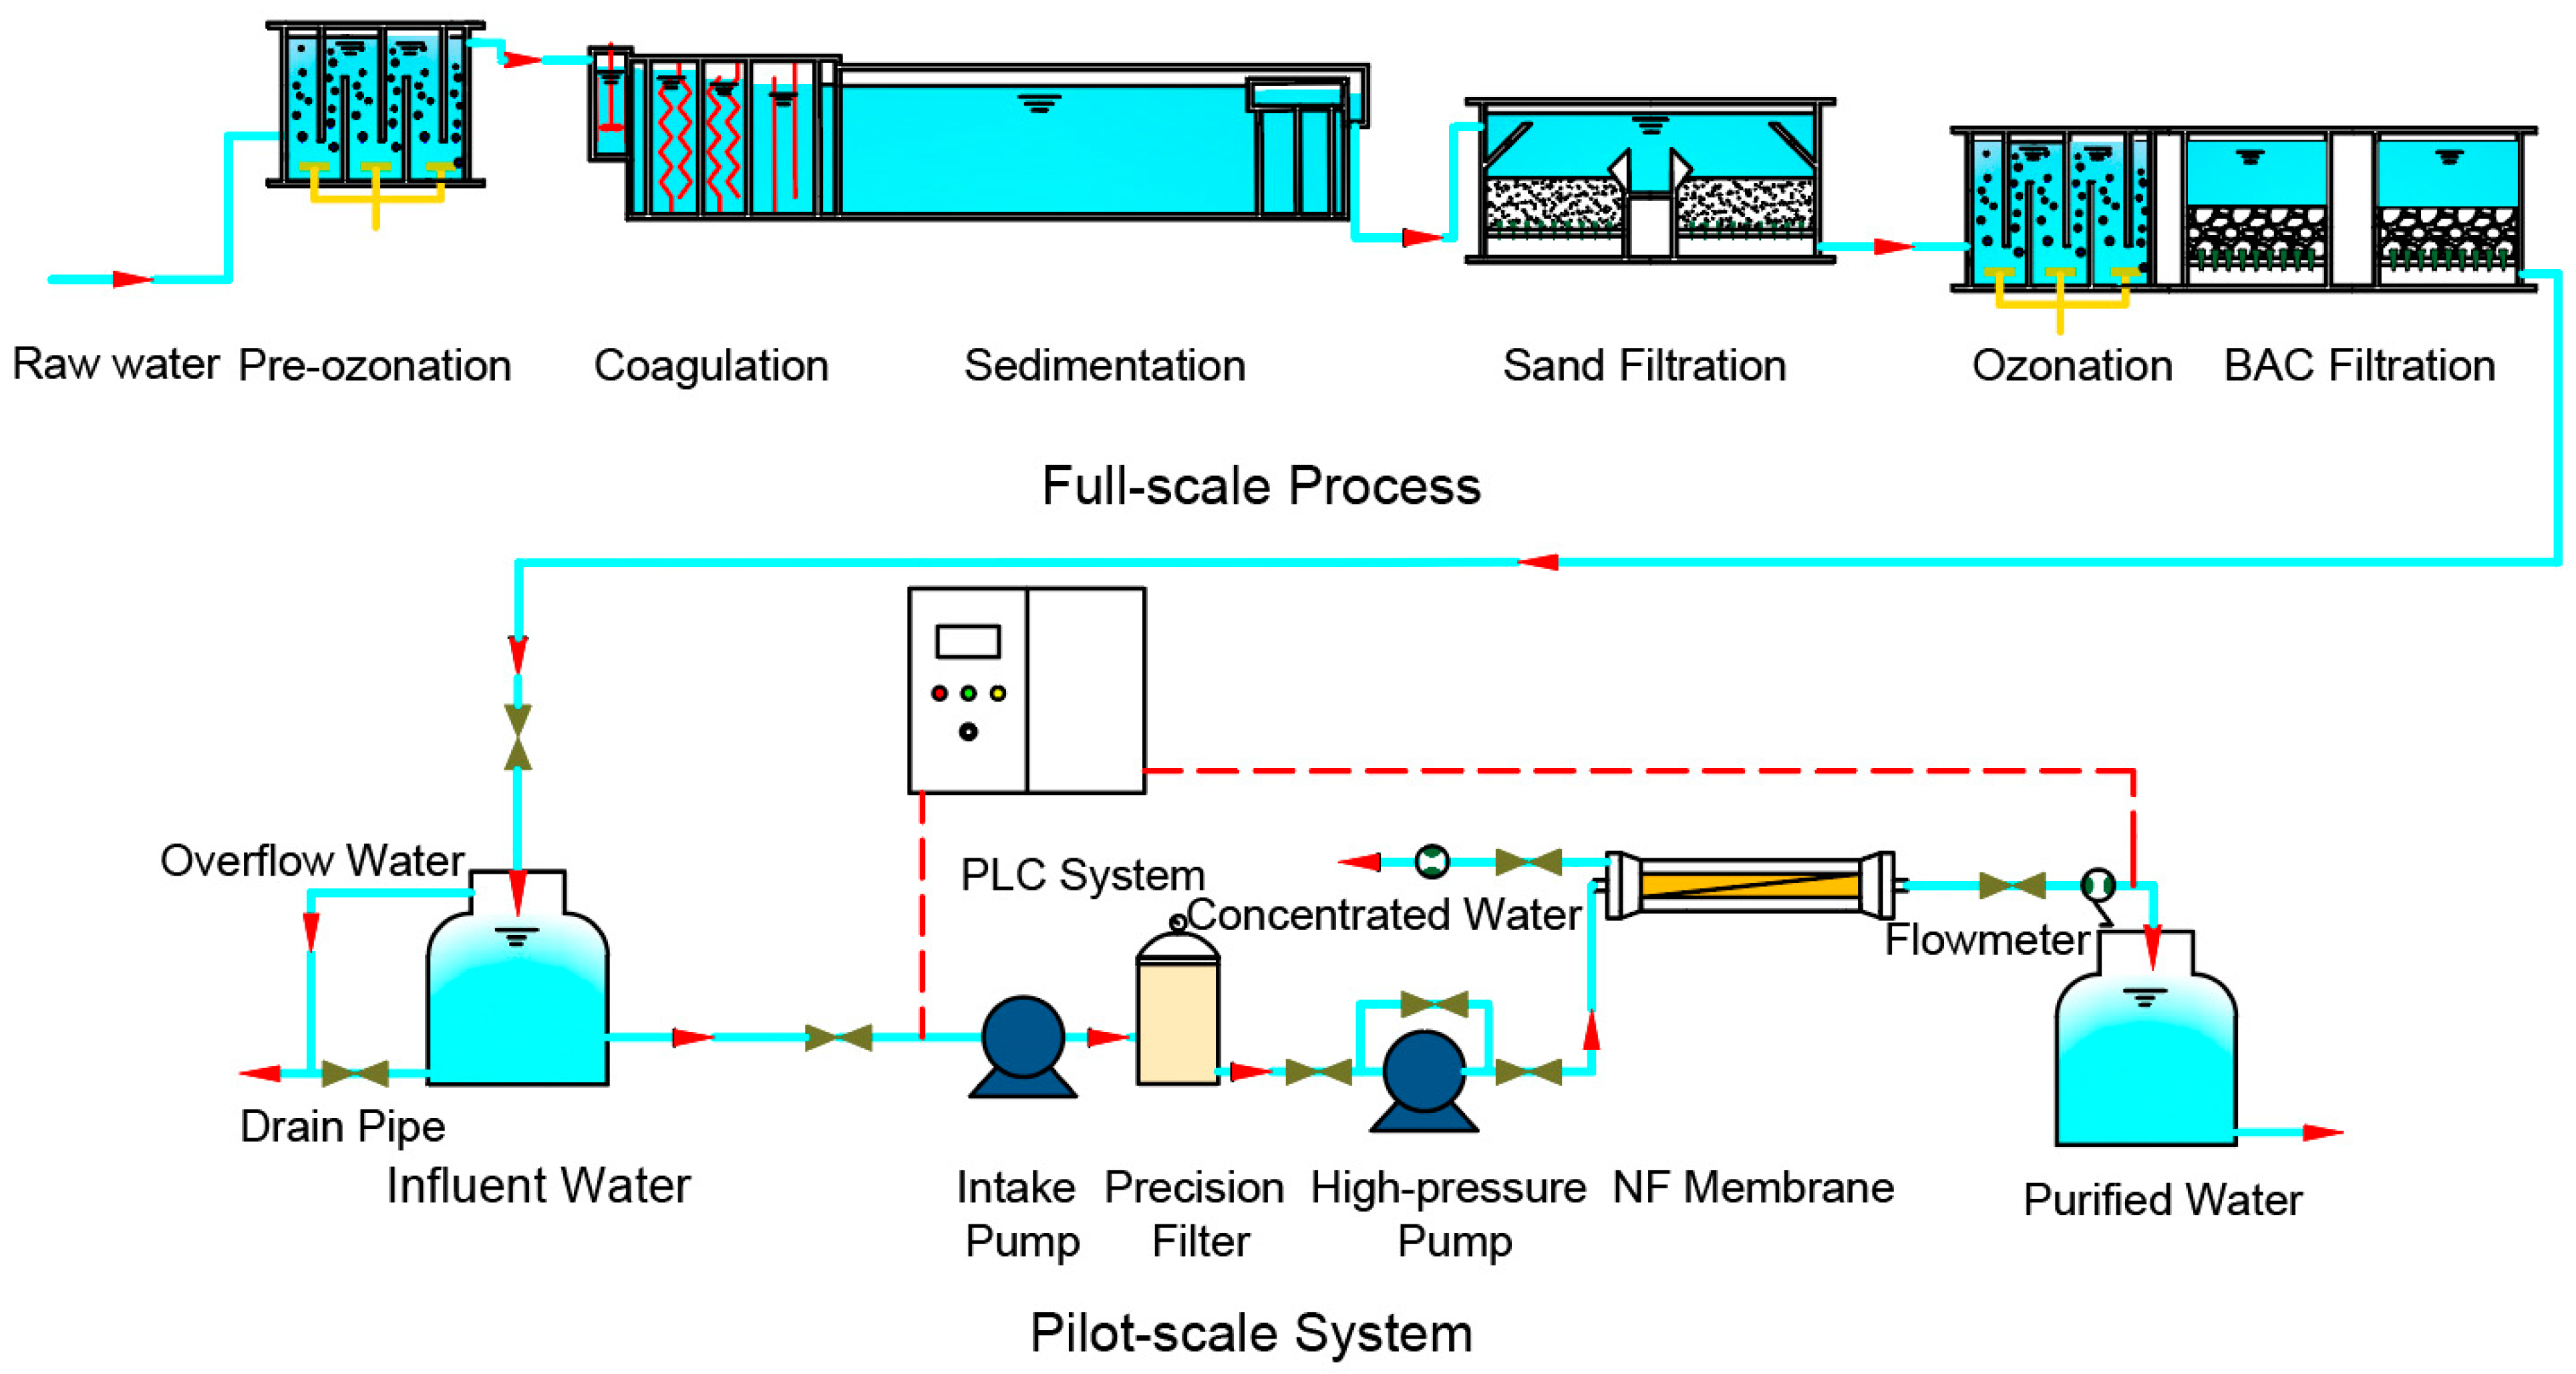
2.1.1. Full-Scale Processes at the Drinking Water Treatment Plant (DWTP)

The raw water of the drinking water treatment plant (DWTP) in this study comes from the East Taihu Lake, which is one of the primary drinking water sources in Suzhou City, Jiangsu Province, China. The full-scale system at the DWTP include two units: (1) conventional treatment processes of pre-ozonation, coagulation, sedimentation, sand filtration (SF); and (2) advanced treatment processes of ozonation followed by BAC (O3-BAC). Aluminum sulfate was used as the coagulant at a dosage of 42 mg/L. The pre-ozonation process was not under operation during the study period (i.e., ozone dose = 0 mg/L). For the post-ozonation process, 0.5 mg/L of ozone was applied with a contact time of 11.7 min. The BAC filter, with empty bed exposure time of 13.8 min and carbon layer depth of 2.1 m, was operated at a filtration rate of 9.2 m/h. The BAC filter had been operated for >1.5 years when this project initiated.

2.1.2. Pilot-Scale Nanofiltration (NF) Process

The BAC effluent of the DWTP was used as the feed water of the pilot-scale NF membrane system, which was installed with the commercially-available membrane NF90-4040 (Dow, USA). The NF system was operated continuously under the constant flux and variable pressure mode. Two different fluxes, 20 and 25 L/(m2·h), were employed with 30% recovery rate for both conditions. Other operation parameters of the NF membrane system are reported in Table S1. Trans-membrane pressure (TMP) of the NF system was automatically recorded by a programmable logic controller (PLC) system. Maximum TMP was limited to 0.5 MPa, at which the filtration operation was paused to conduct offline circulating chemical cleaning. The chemical cleaning was conducted using the following reagents in sequence: (i) hydrochloric acid (HCl) solution at pH 2.0 for 2 h; (ii) ultrapure water (produced from reverse osmosis equipment in the pilot system) for 15 min; (iii) sodium hydroxide (NaOH) solution at pH 12.0 for 2 h; and (iv) ultrapure water for 15 min. The acid and alkaline elution solutions were collected for analysis of membrane fouling as described below.
A scheme of the above full- and pilot-scale treatment processes is shown in Figure 1. During the period of August 2020 to December 2021, samples of the raw water and effluents of the conventional, O3-BAC (or O3 and BAC separately) and NF processes were collected regularly (as specified in the results) to monitor various water quality parameters, as described below.

2.2. Disinfection By-Product Formation Potential (DBPFP) Analysis

All water samples were amended with 10 mM phosphate buffer at pH 7.0 using sulfuric acid (H2SO4) and NaOH for pH adjustment [31]. Then each sample was dosed with sodium hypochlorite (NaOCl) at a final concentration of 20 mg/L as Cl2 and incubated at 25 ± 1 °C for 7 d in the dark [31]. The incubation was terminated by adding excessive ascorbic acid (molar ratio ≥ 20) [32]. To investigate the impact of bromide (Br) on DBPFP, selected samples were dosed with additional Br (final concentration ranging from 2–162 μg/L) and subjected to incubation in the presence of NaOCl as described above. Concentrations of TTHMs (including TCM, TBM, BDCM, and DBCM) and HAA5 (including MCAA, DCAA, TCAA, MBAA, and DBAA) in the incubated samples were determined using a gas chromatograph (GC) with a 7890A electron capture detector (ECD) equipped with an HP-5 column (Agilent, USA). For TTHMs, 5 mL solution was directly taken from each of the incubated samples and placed in a 7697A headspace sampler (Agilent, USA), where the volatile analytes including THMs in the headspace were swept into the GC-ECD system for analysis [33]. For HAA5, prior to analysis on the GC-ECD, the incubated water samples were processed with liquid/liquid extraction using methyl tertiary-butyl ether (MTBE) followed by derivatization with acidic methanol according to the HAA5 gas chromatography method, under Ministry of Environmental Protection [34].

2.3. Other Analytical Assays

Turbidity (Turb) was measured by a desktop turbidity meter (TL2300, Hach, Ames, IA, USA). Measurements of pH, total dissolved solids (TDS), and conductivity (Cond) were undertaken using a pHS-3C pH meter (Jingke, Shanghai, China). Chemical oxygen demand was assessed with the permanganate index (CODMn) using the acidic potassium permanganate method [35]. Total hardness (TH) was measured using the EDTA titration method [36]. Anions such as bromide (Br) and bromate (BrO3) were measured by an Integrion ion chromatography analyzer equipped with an AS19 column (Thermo Scientific, Waltham, MA, USA).
Ultraviolet absorbance at 254 nm (UV254) was measured using a 1-cm quartz cuvette on a UV/Vis spectrometer (Evolution 300, Thermo Fisher, Waltham, MA, USA). Dissolved organic carbon (DOC) concentration was measured with an Aurora 1030w total organic carbon (TOC) analyzer (OI Analytical Inc., College Station, TX, USA). Excitation-emission matrix (EEM) spectroscopy was measured with a F-7100 fluorescence spectrophotometer (Hitachi, Tokyo, Japan) (Excitation: 200–400 nm, 2 nm intervals; Emission: 250–550 nm, 2 nm increments). Major components of the fluorescent organic matters were extracted from the EEM spectra using the parallel factor (PARAFAC) analysis, and the maximum fluorescence intensity (Fmax) values were obtained for each component [37,38]; in addition, fluorescence regional integration (FRI) was performed by summarizing the EEM spectra into four regions according to Chen et al. [39]. Molecular weight (MW) distributions were determined with high-performance size exclusion chromatography (HPSEC), for which water samples were separated by a high-performance liquid chromatograph (HPLC, Waters e2695, Milford, MA, USA) system equipped with an SEC column (TSKgel G3000SWXL, Tosoh, Tokyo, Japan) and subsequently analyzed by a UV detector (Waters 2489, Milford, MA, USA) and a TOC-specific detector (Modified Sievers 900 Turbo, Boston, MA, USA) [40,41]. For determination of UV254, DOC, EEM spectra, and MW distributions, the water samples were prefiltered with 0.45-mm PVDF (Millipore Millex, Billerica, MA, USA) membranes prior to analysis.

2.4. Data Analysis

For each water quality parameter, the removal efficiency with a certain treatment process/unit was defined as the increment (either positive or negative) of its value before and after the treatment process/unit over its value measured in the raw water; thus, the summation of removal efficiencies by all the treatment unit/process is equal to the total removal efficiency by the whole treatment train. Origin Pro 2023 software was used for linear regression analysis, Pearson correlation analysis, and FRI analysis of EEM spectra. PARAFAC modelling was conducted using Matlab® R2017b according to the method described by Murphy et al. [42]. Statistical significance was defined as p values ≤ 0.05.

3. Results and Discussion

3.1. Water Quality Parameters

Measurements of water quality parameters in the raw water and effluents of the conventional, advanced O3-BAC, and pilot-scale NF processes (i.e., SF effluent, O3-BAC effluent, NF effluent, respectively) are shown in Table S2, and the average removal efficiencies of these parameters with the above processes, individually or accumulatively, are illustrated in Figure 2.

3.1.1. Basic Parameters (Turbidity, Conductivity, TDS, and TH)

As shown in Table S2 and Figure 2, the conventional treatment processes decreased turbidity by 62.7% from 2.23 ± 0.72 NTU to 0.76 ± 0.70 NTU, which satisfied the current national drinking water standard of China (1.0 NTU) [10], but did not reach the Suzhou high-quality drinking water quality standard (0.5 NTU) [43]. The subsequent O3-BAC and pilot-scale NF processes further decreased turbidity to 0.31 ± 0.15 NTU and 0.07 ± 0.02 NTU, by 21.9% and 12.1%, respectively. Turbidity was often positively associated with levels of microorganisms (viruses, bacteria, and parasites) including pathogenic ones [44]. The extremely low turbidity (0.07 ± 0.02 NTU) of the NF effluent indicated that NF could ensure biosafety of the finished water. Several other parameters, e.g., conductivity, TDS, and TH, were barely removed (within ±1%) by the conventional plus O3-BAC processes, though effectively removed by the pilot-scale NF process (>98%).

3.1.2. NOM Characterized by CODMn, DOC, UV254, SUVA, and EEM

As also shown in Figure 2 and Table S2, the conventional treatment processes exhibited moderate removal efficiencies for NOM characterized by CODMn (37.6%), DOC (23.4%), and UV254 (19.4%). The following O3-BAC advanced treatment did not largely improve NOM removal, after which the values of CODMn, DOC, and UV254 further decreased only by 4.5%, 4.2%, and 18.1%, respectively. For the fluorescence results, four components were obtained from the EEM spectra through PARAFAC analysis: tyrosine-like substances (Component 1, or C1) [45,46,47,48], tryptophan-like substances (C2) [49,50,51], humic-like substances (C3) [52,53,54], and free tyrosine (C4) [55,56] (see more details in Figure S1 and Table S3). The conventional treatment had limited effect (by 2.2–19.6%) on removing signals (here assessed using Fmax values) of the four fluorescent components, and the following O3-BAC treatment further decreased them by 28.0–46.1%.
It is notable that the O3-BAC advanced treatment had a better removal effect on UV254 (18.1%) than DOC (4.2%) (Figure 2b), likely because post-ozonation converted the highly UV-absorbing compounds (largely as humic and fulvic substances) into small and non-humic molecules that were more readily available toward biodegradation during the following BAC process [33]. It should also be of note that the accumulative removal efficiencies of DOC and UV254 by the “conventional + O3-BAC” processes turned out to be 27.6% and 37.5%, respectively (Figure 2a), both much lower than the values at the early stage of the BAC operation (42% and 64%, respectively; data provided by the DWTP). Assuming the conventional processes had performed stably through the DWTP’s operation period, this difference might be explained by the fact that the adsorption capacity of the long-term BAC filter (>1.5 years old here) had decreased significantly compared to a relatively new one, with NOM removal primarily maintained by microbial degradation [19].
The last NF process effectively removed NOM characterized by various parameters (43.4–71.5%), leading to total removal efficiencies by the whole treatment train from 77.2–99.3% (except 38.4% for SUVA) (Figure 2). In the NF effluent, CODMn was decreased to 0.32 ± 0.10 mg C/L, which was far below the criteria of Suzhou high-quality drinking water quality standard (≤2 mg C/L) [43]. Concentrations of UV254 and DOC were also found to be extremely low in the NF effluent (0.0004 ± 0.0006 cm−1 and 0.03 ± 0.05 mg/L, respectively). It has been well known that the taste of drinking water is related not only to content of inorganic ions and residual chlorine, but also to that of NOM [57,58]. This again implied that NF could not only ensure biological safety but also potentially improve the taste of drinking water.

3.1.3. Bromide (Br) and Bromate (BrO3)

Both conventional and O3-BAC advanced treatment processes had minimal effect on removal of Br (by 9.8% and −9.1%, respectively), while the following NF process performed high removal efficiency of Br (79.7%) (Figure 2). Though Br is harmless, it has been confirmed to participate in the formation of BrO3 and other harmful Br-DBPs during oxidation or chlorination [59]. BrO3 was not detected through the whole treatment train including the influent and effluent of O3-BAC, suggesting that low-dose ozone (0.5 mg/L for 2.41 ± 0.42 mg/L of DOC here) was insufficient to oxidize Br (0.065 ± 0.002 mg/L) into BrO3 (see Table S2) [60]. The very low concentration of Br in the NF effluent indicated that application of NF following the existing treatment processes at the DWTP was advantageous in lowering risks of Br-DBP formation during disinfection of the finished water.

3.2. DBPFP

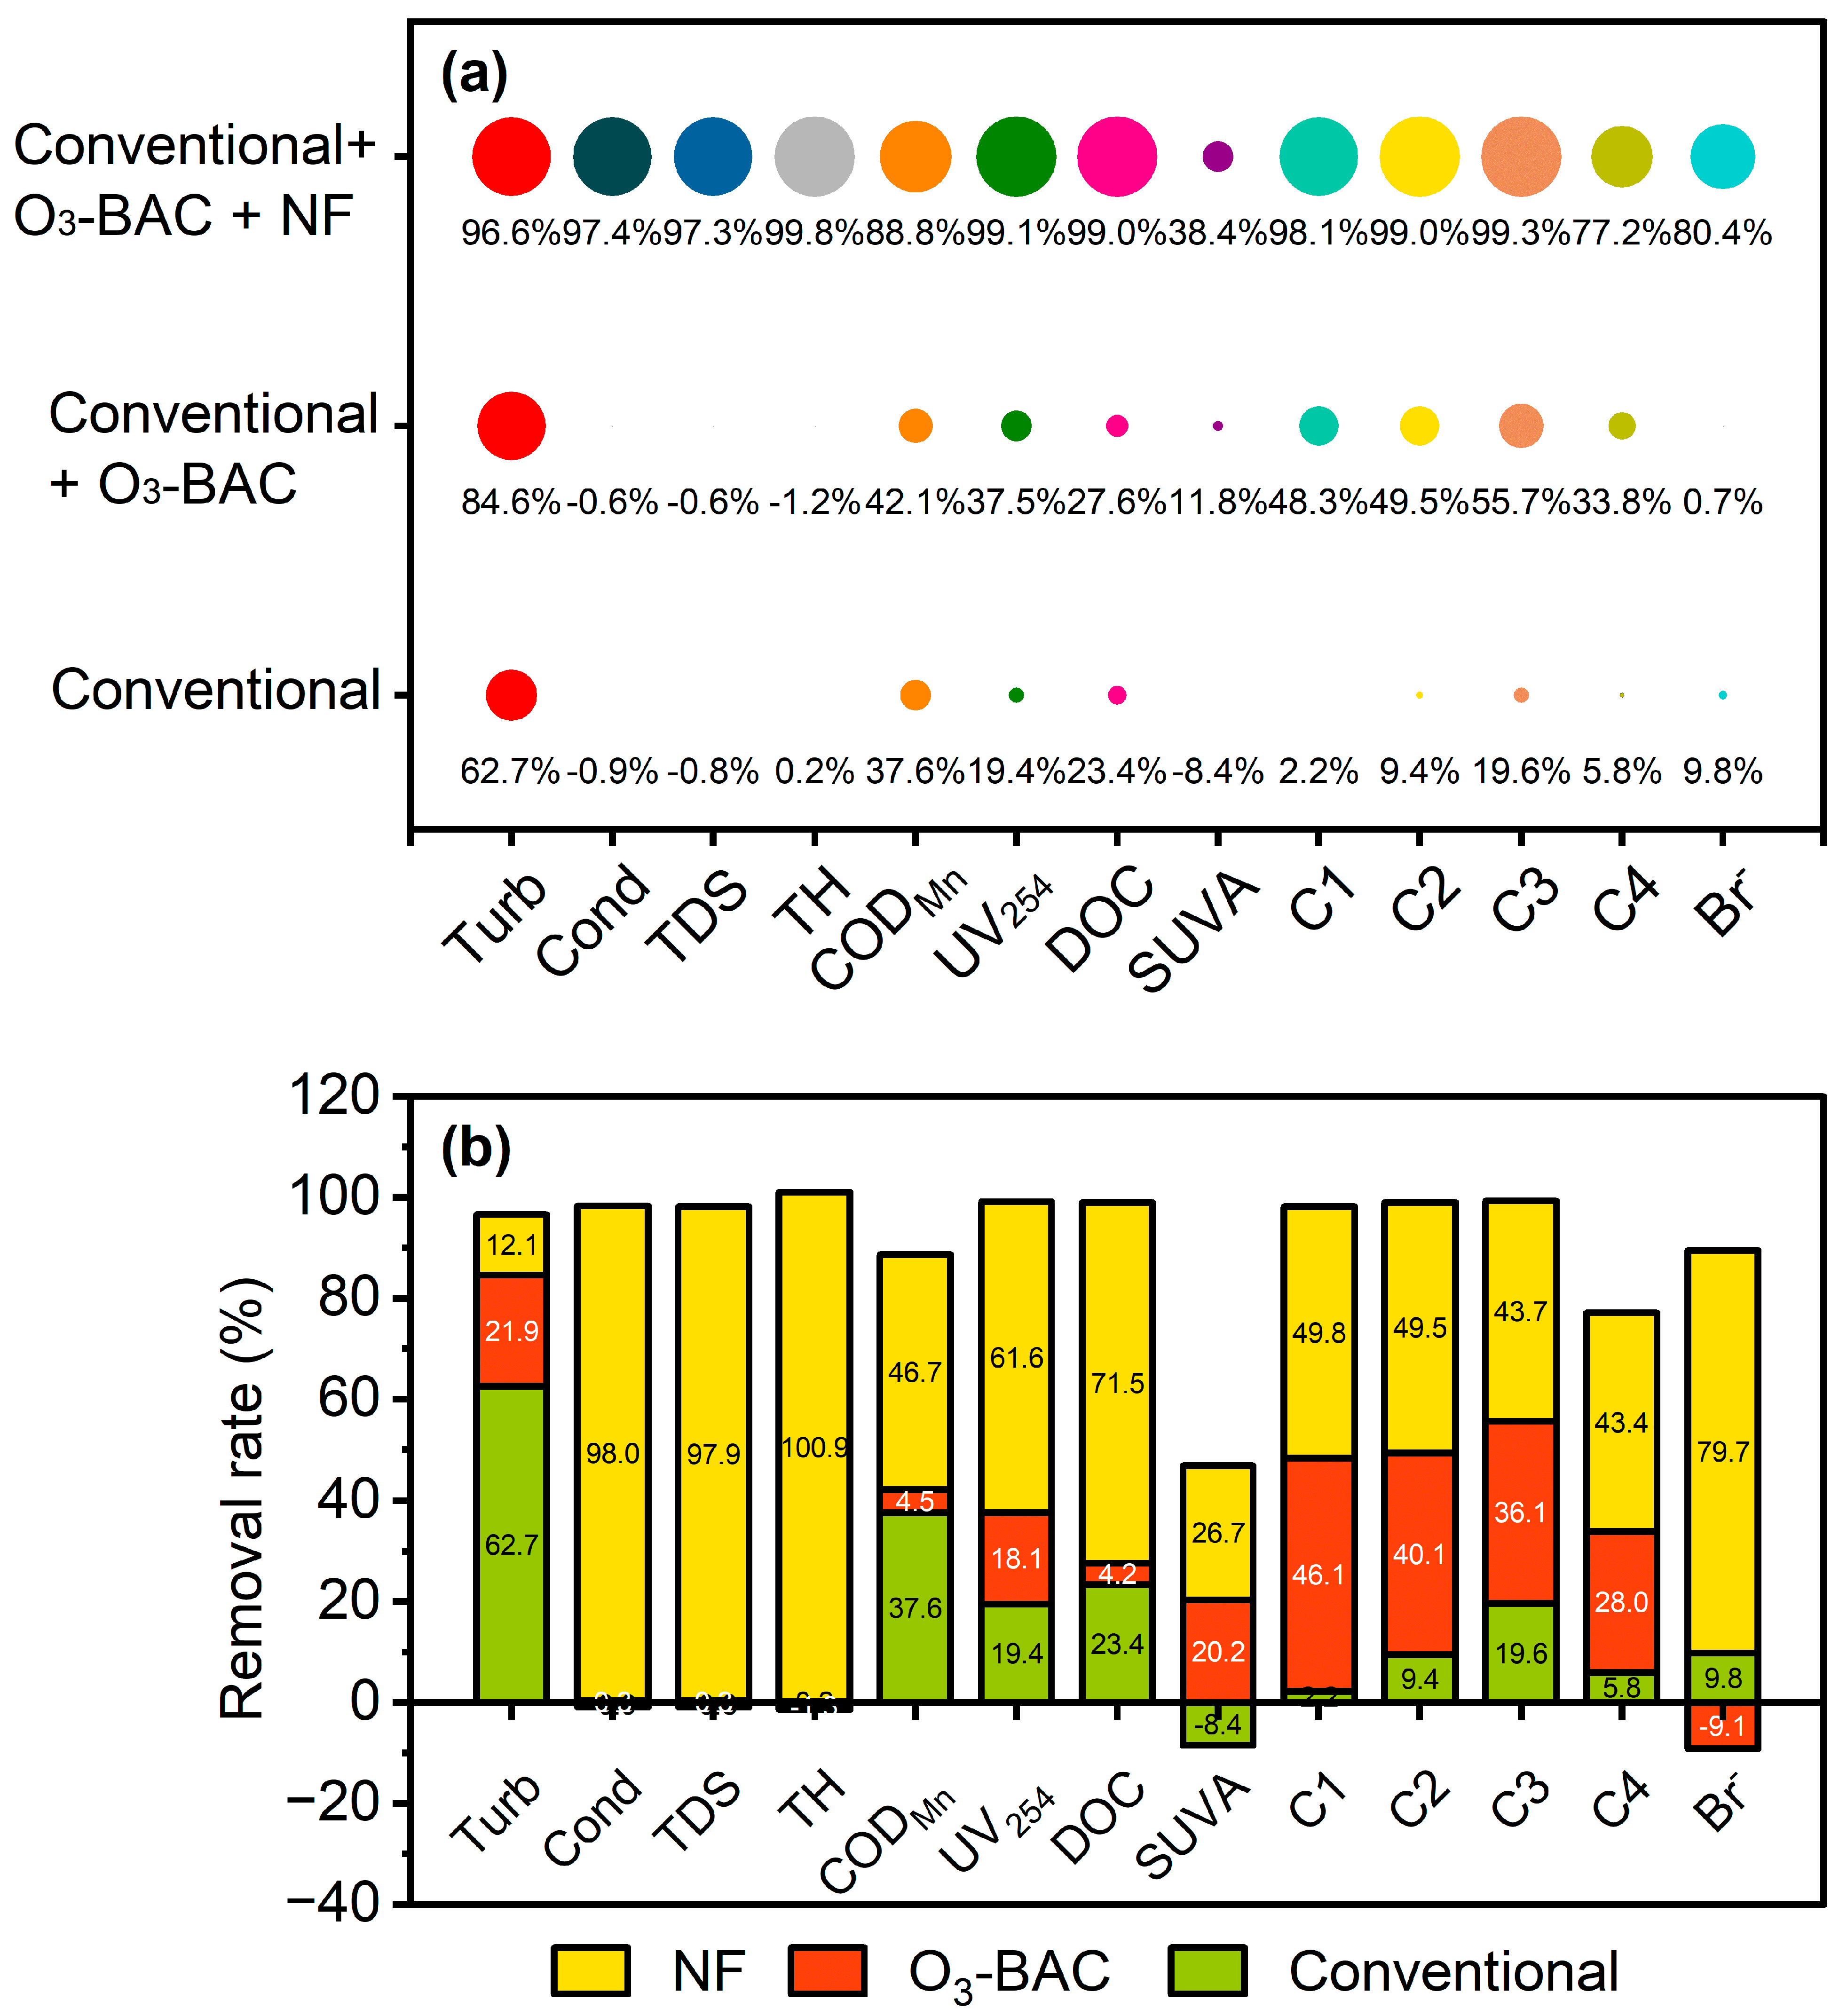
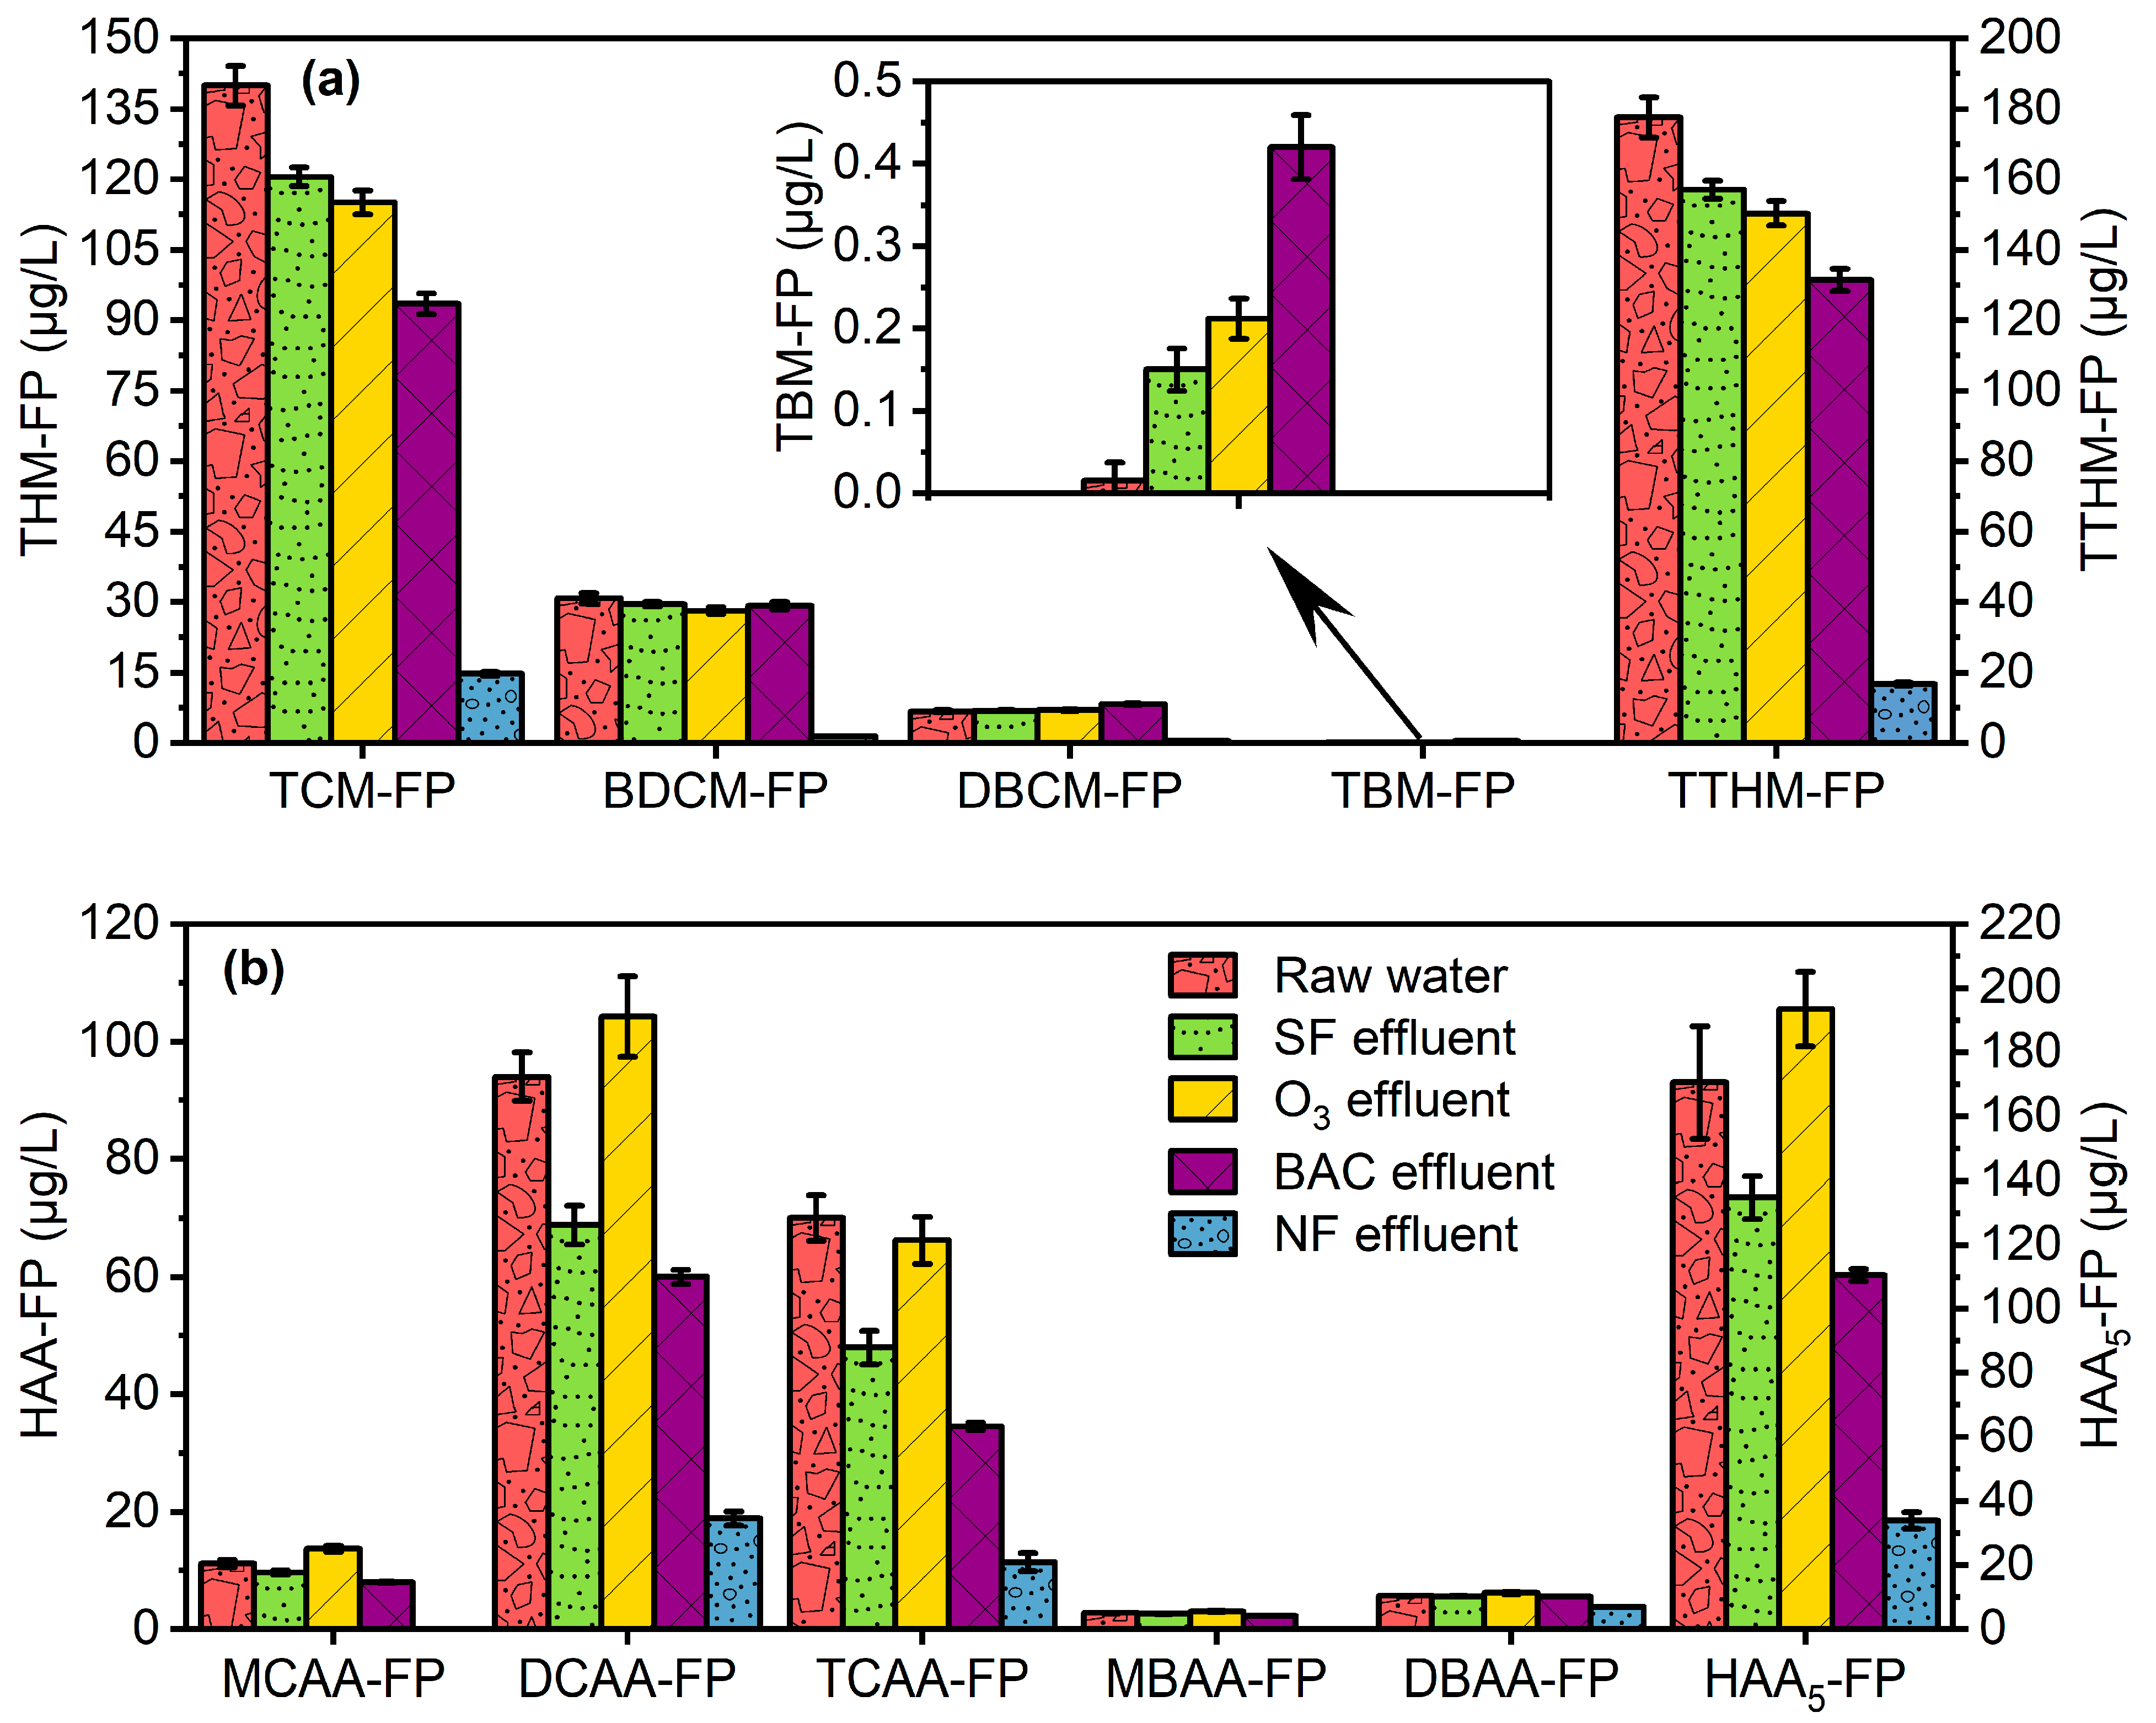
3.2.1. Profile and Variation of DBPFP during Treatment Processes

Results of THM-FPs and HAA-FPs measured for the raw water and effluents of each treatment unit/process are shown in Figure 3. Here, the results of O3 and BAC effluents are plotted separately to elucidate variations of THM-FPs and HAA-FPs in each step of the advanced treatment. Overall, in most of the samples after 7-day incubation, TTHM-FP was dominated by TCM-FP followed with BDCM-FP, and HAA5-FP were primarily in species of DCAA-FP and TCAA-FP, generally consistent with profiles of THM-FP and HAA-FP previously reported for other drinking water systems using surface or ground waters as sources [61,62].
Conventional treatment. After treatment with the conventional processes, TTHM-FP and HAA5-FP were decreased by 11.4% and 19.9%, respectively (Figure 3). Compared with its performance in removing formation potentials of Cl-DBPs (Cl-DBPFP; 12.9–25.6%), the conventional treatment was less effective in removing, or even dramatically increased, the formation potentials of the brominated species (Br-DBPFP; −877.2% for TBM-FP, and −2.3–5.1% for the others). DBPFP removal by the conventional treatment processes mainly resulted from coagulation/sedimentation, which preferentially removed hydrophobic NOMs due to their lower affinity with water, higher MWs, and higher charge density [63]. It has been reported that chlorine is typically more reactive toward hydrophobic precursors, while bromine is more reactive toward lower-MW and more hydrophilic precursors [64,65]. Thus, the lower removal of Br-DBPFP than Cl-DBPFP here was likely associated with the poorer removal effect of hydrophilic NOM than hydrophobic ones by the conventional treatment processes, such as coagulation/sedimentation. As regards to the dramatic increase of TBM-FP after conventional treatment, we found that TBM-FP had almost no change after “coagulation + sedimentation + SF” processes, while significant increase occurred from 0.015 to 0.34 μg/L after the raw water passed through the pre-ozonation tank (data not shown in Figure 3), likely due to ozone leakage. (Note that the pre-ozonation process was technically not in operation during this study).
O3-BAC advanced treatment. The following O3-BAC advanced treatment further reduced TTHM-FP and HAA5-FP by 14.4 and 14.6%, respectively, and in total, the “conventional + O3-BAC” processes removed TTHM-FP and HAA5-FP by 25.9% and 34.5%, respectively (Figure 3). Similar to the conventional treatment, O3-BAC also preferentially removed Cl-DBPFP (by 10.6–21.0%) over Br-DBPFP (by <2% for all the brominated species, except 12.3% for MBAA-FP). As evident from Figure 3, post-ozonation contributed to a significant increase of most DBPFP species (except TCM-FP and BDCM-FP), which can be explained by NOM transformation from hydrophobic and higher-MW molecules to more hydrophilic and lower-MW ones, and thus an increase of DBP precursors (especially those to Br-DBPs as discussed above) during this process [64,65]. Although the following BAC process effectively removed most of the DBPFP species, two of the brominated THM-FP (Br-THMFP) species, DBCM-FP and TBM-FP, were enhanced by BAC, leading to overall negative removals after the O3-BAC advanced treatment (−20.8% and −1760.1%, respectively). Some previous studies also reported elevation of Br-THMFP after granular activated carbon (GAC) or BAC treatment [66,67,68] and the explanations can be summarized from aspects: (1) With the service life of GAC/BAC increasing and other operation parameters (e.g., upstream ozone dosage) changing, its adsorption capacity would be weakened along with changes in microbial respiration, resulting in leakage/desorption of microorganisms, microbial products, and/or other organic pollutants, which ultimately alter NOM composition in the effluent and likely benefit the formation of Br-THMs (and N-DBPs) during chlorination afterwards [69,70,71]; (2) GAC/BAC retained NOM better than Br ion, leading to increased [Br]/[DOC] ratio in the effluent and, in turn, competitive formation advantage of brominated DBP species over chlorinated ones [66,67,68,72].
Pilot-scale NF treatment. The NF process had superior removal effects on TTHM-FP and HAA5-FP with efficiencies of 64.7% and 45.2%, respectively. In total, the whole treatment train of “conventional + O3-BAC + NF” removed TTHM-FP and HAA5-FP by 90.6% and 79.7%, respectively, and the removals for Cl-DBPFP (77.6–100%) and Br-DBPFP (33.5–100%) were both good. In the NF effluent, levels of TTHM-FP and HAA5-FP were decreased to 18 μg/L and 33 μg/L, respectively, with MCAA-FP, MBAA-FP, and TBM-FP not detected. The results demonstrated that the NF membrane could effectively remove NOM and control DBP formation in the finished water.

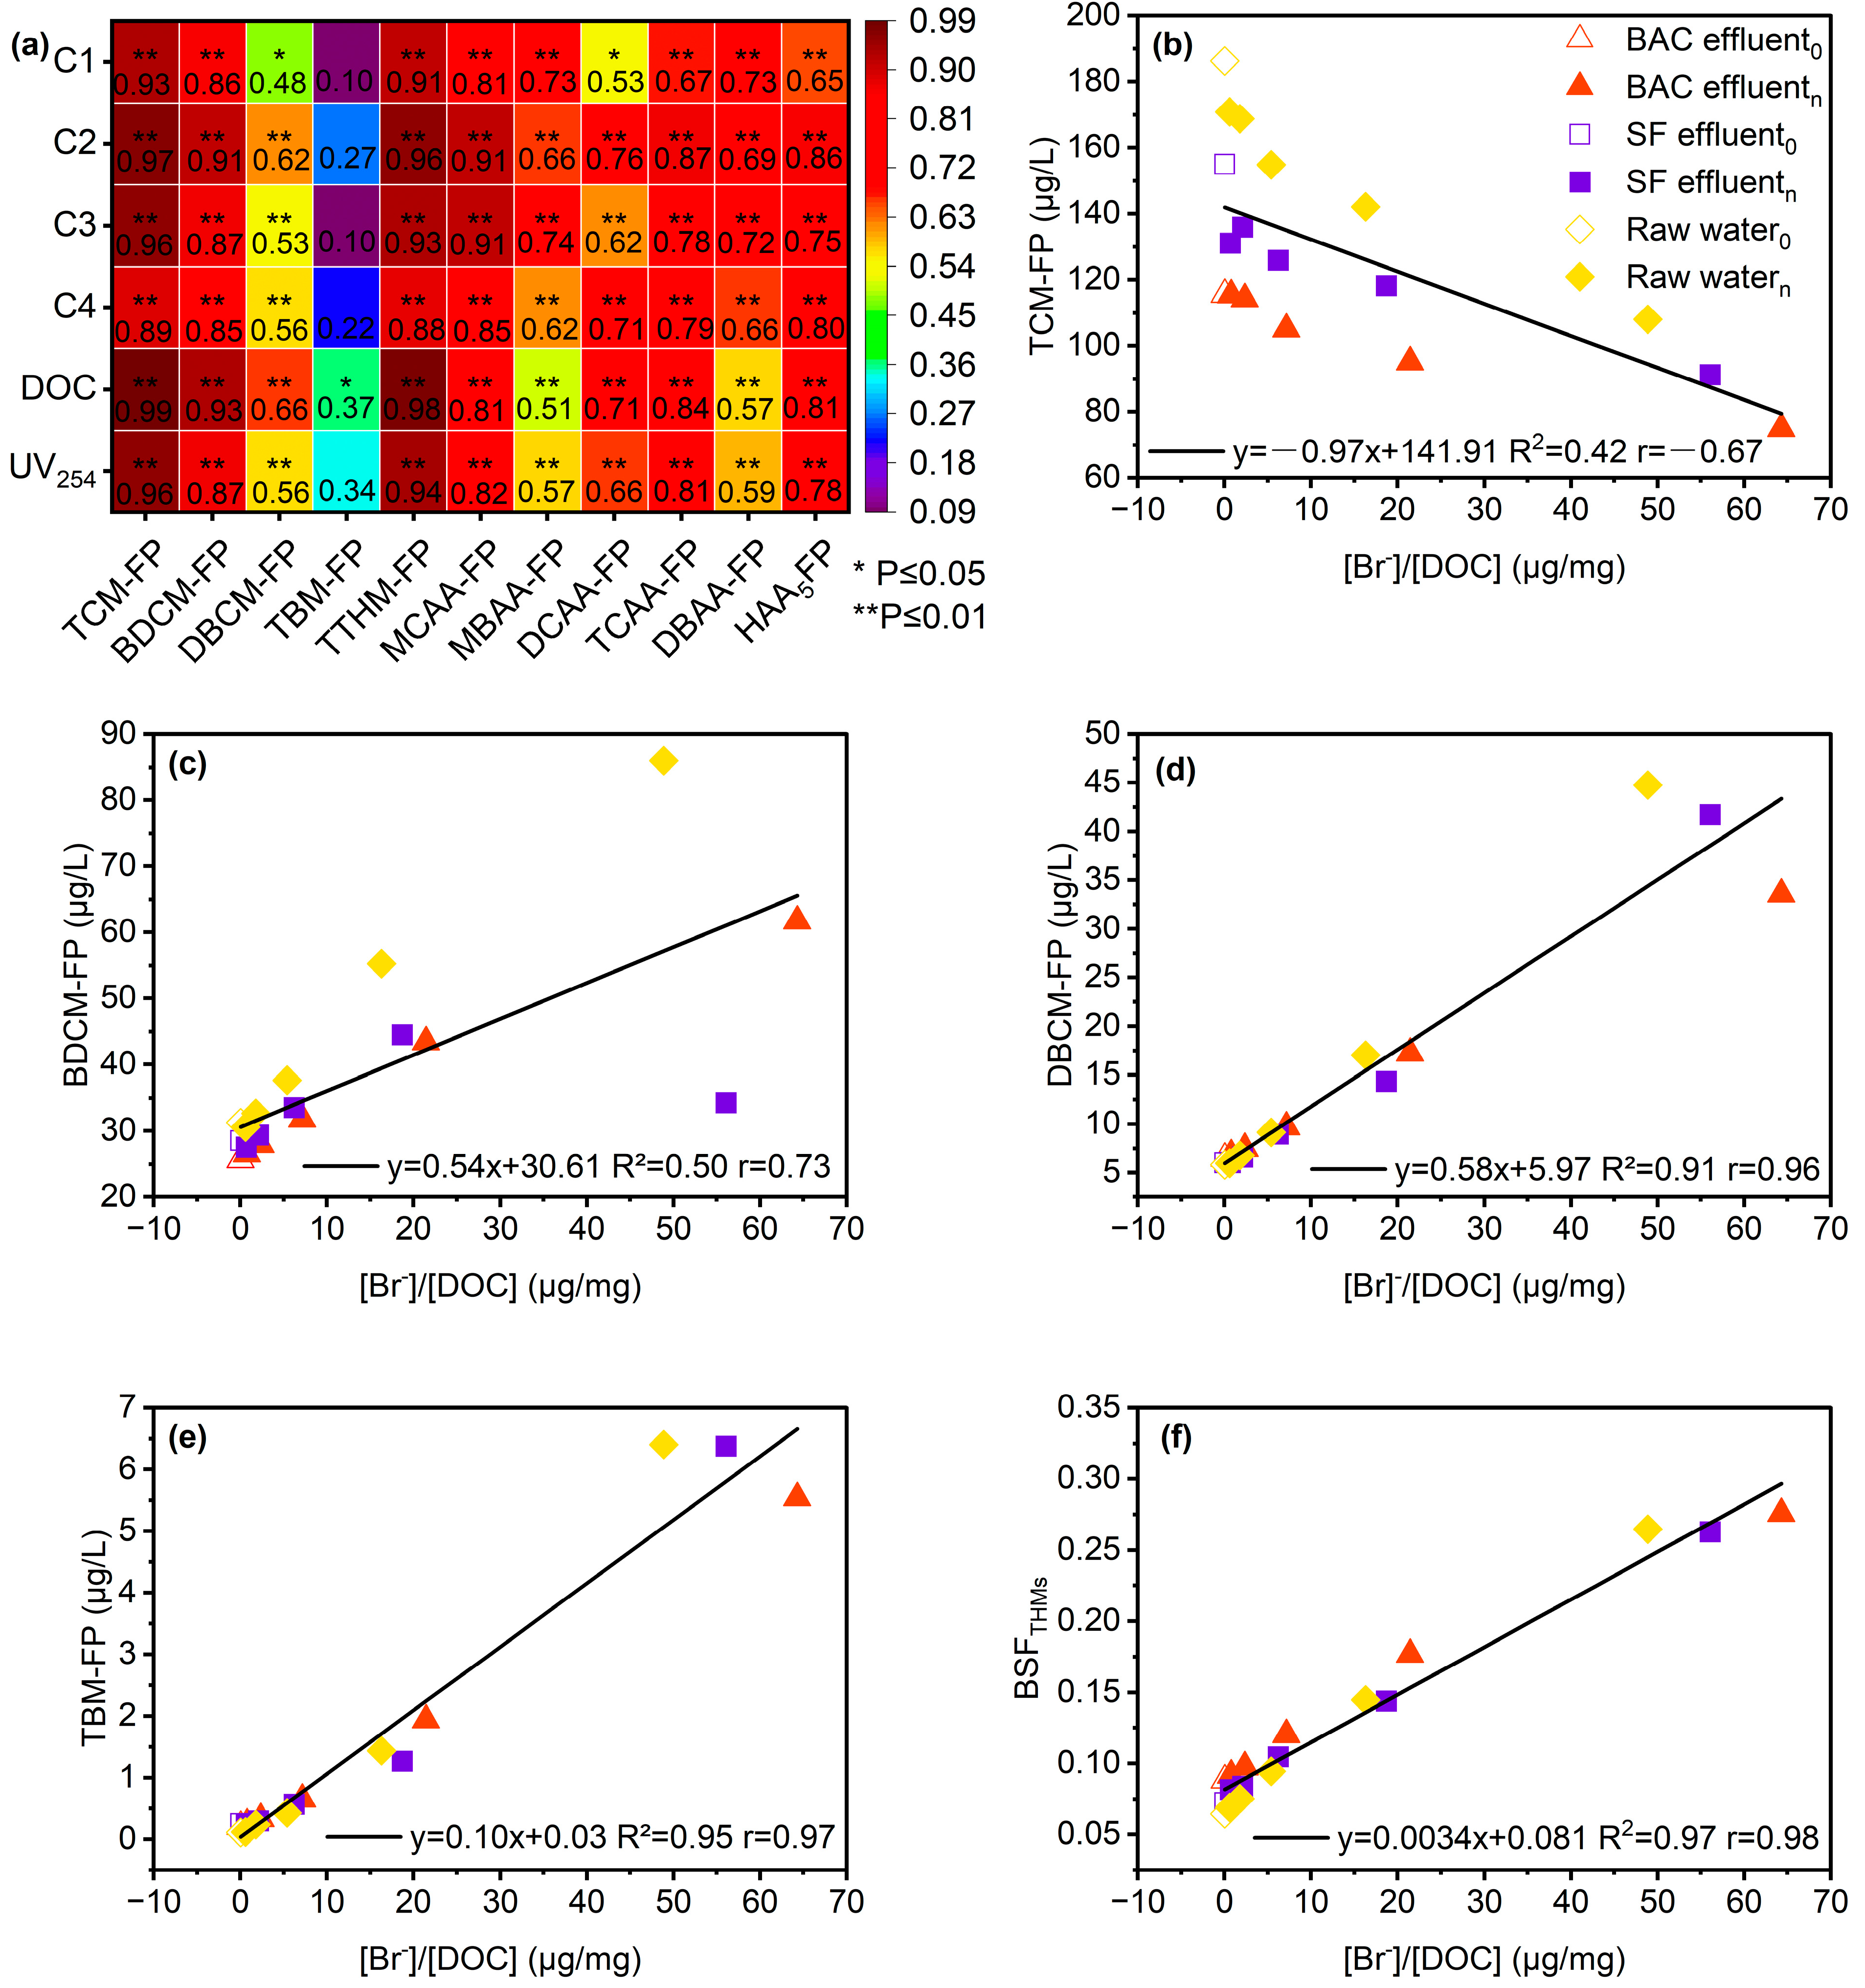
3.2.2. Correlation of DBPFP with Water Characteristics: Factors Driving Elevation of Br-THMFP Induced by O3-BAC

To further investigate factors responsible for DBPFP variations through the treatment train (especially for the significant increase of DBCM-FP and TBM-FP induced by the O3-BAC advanced treatment, as discussed above), Pearson correlation or linear regression analysis was performed for DBPFP (TTHM-FP, HAA5-FP, and their individual species) versus various NOM parameters (DOC, UV254, and Fmax values of fluorescence components), as well as the ratio of [Br]/[DOC]. Similar correlation analyses were also conducted for the bromine substitution factor of THMs ( BSF THMs ) versus [Br]/[DOC]. Here, BSF THMs , which describes the speciation of THM-FP, can be calculated according to Equation (1) [73]:
BSF THMs = n = 1 3 n × [ CHCl ( 3 n ) Br n ] 3 n = 0 3 CHCl ( 3 n ) Br n
The BSFTHMs values (ranging from 0–1) of the water samples typically declined in the order of BAC effluent > O3 effluent > SF effluent > raw water > NF effluent (see Table S4). Results of the above correlation/regression analyses are illustrated in Figure 4.
Correlation of DBPFP with NOM parameters. As shown in Figure 4a, TTHM-FP, HAA5-FP, and their individual species exhibited generally strong positive correlations (Pearson’s r = 0.51–0.99, median r = 0.81; p < 0.05) with DOC concentrations, UV254, and Fmax values of fluorescent components C1–C4, except that weaker or insignificant correlations (Pearson’s r = 0.095–0.66, median r = 0.43) were found for DBCM-FP and TBM-FP. The overall strong positive correlation of DBPFPs with various NOM parameters are in good agreement with many previous findings [32,38,62,69,74], which demonstrates the utility of these parameters in predicting DBPFP of drinking water systems (see linear regression results for selected datasets in Figure S2). In addition, for certain brominated HAA5-FP species (e.g., MBAA-FP and DBAA-FP), weaker correlations were found for DOC and UV254 than Fmax of specific fluorescent components (e.g., C2 and C3), suggesting that tryptophan and humic-like substances are important precursors for these Br-HAAs and useful indicators, instead of bulk DOC/UV254 concentrations, of their formation potentials [69].
The weaker/insignificant correlations of DBCM-FP and TBM-FP (even with specific fluorescent components) are consistent with their distinctive variation trends (i.e., significant increase after BAC) from the other DBPFP species, as discussed above. At first, we considered that this might be due to the failure in capturing important DBCM or TBM precursors by using the Fmax values obtained via PARAFAC analysis. However, this possibility was excluded by checking the EEM spectra (see Figure S3), where no new fluorescence peaks were observed in the BAC effluents, and further FRI analysis confirmed that signals of each fluorescent region in the BAC effluents were smaller than that in the SF and O3 effluents (see Table S5). Thus, beyond NOM parameters, we turned out eyes to [Br]/[DOC] in the following analysis to investigate its association with DBPFP.
Correlation of DBPFP with NOM parameters. As the [Br]/[DOC] ratios in the raw water and effluents were quite low (<0.35 μg/mg), selected samples were spiked with additional Br (2–160 g/L) to extend the range of [Br]/[DOC] up to 64.3 μg/mg. As shown in Figure 4b-e, pooling all the spiked and unspiked samples together, strong positive correlations were found for DBCM-FP and TBM-FP with [Br]/[DOC] (r ≥ 0.96), suggesting that the relative concentration of Br to DOC was the driving factor for their formation potentials; in comparison, the other two less brominated THM-FP species, which strongly correlated with various NOM parameters, did not exhibit such strong positive correlation (for BDCM-FP; r = 0.73) or even exhibit negative correlation (for TCM-FP; r = −0.67) with [Br]/[DOC], supporting that they were less favorably formed at higher [Br]/[DOC] ratios. In addition, strong correlation was also found for BSFTHMs versus [Br]/[DOC] (r = 0.98; Figure 4f), further implying that [Br−]/[DOC] has a decisive impact on speciation of THM-FP. Overall, the results above provide evidence that negative removal of BDCM-FP and TCM-FP by O3-BAC, largely due to their significant increase after BAC filtration, was likely to have resulted from the increase of [Br]/[DOC] induced by the BAC filter.
It should be noted that the correlations in Figure 4b–f were obtained excluding spiked/unspiked NF effluent samples, for which levels of TTHM-FP and its individual species were significantly lower than that of the other samples at equivalent [Br]/[DOC] levels (see Figure S4). This might come from the extremely low concentration and/or unique characteristics of NOM (e.g., very low content of THM and HAA precursors) in the NF effluent, which underwent limited reactions with bromine even at elevated (Br) conditions. This result also demonstrated that NF could be a promising process in controlling DBPFP, in particular Br-THMFP, regardless of its enhancement by the upstream O3-BAC treatment.

3.3. Membrane Fouling Analysis

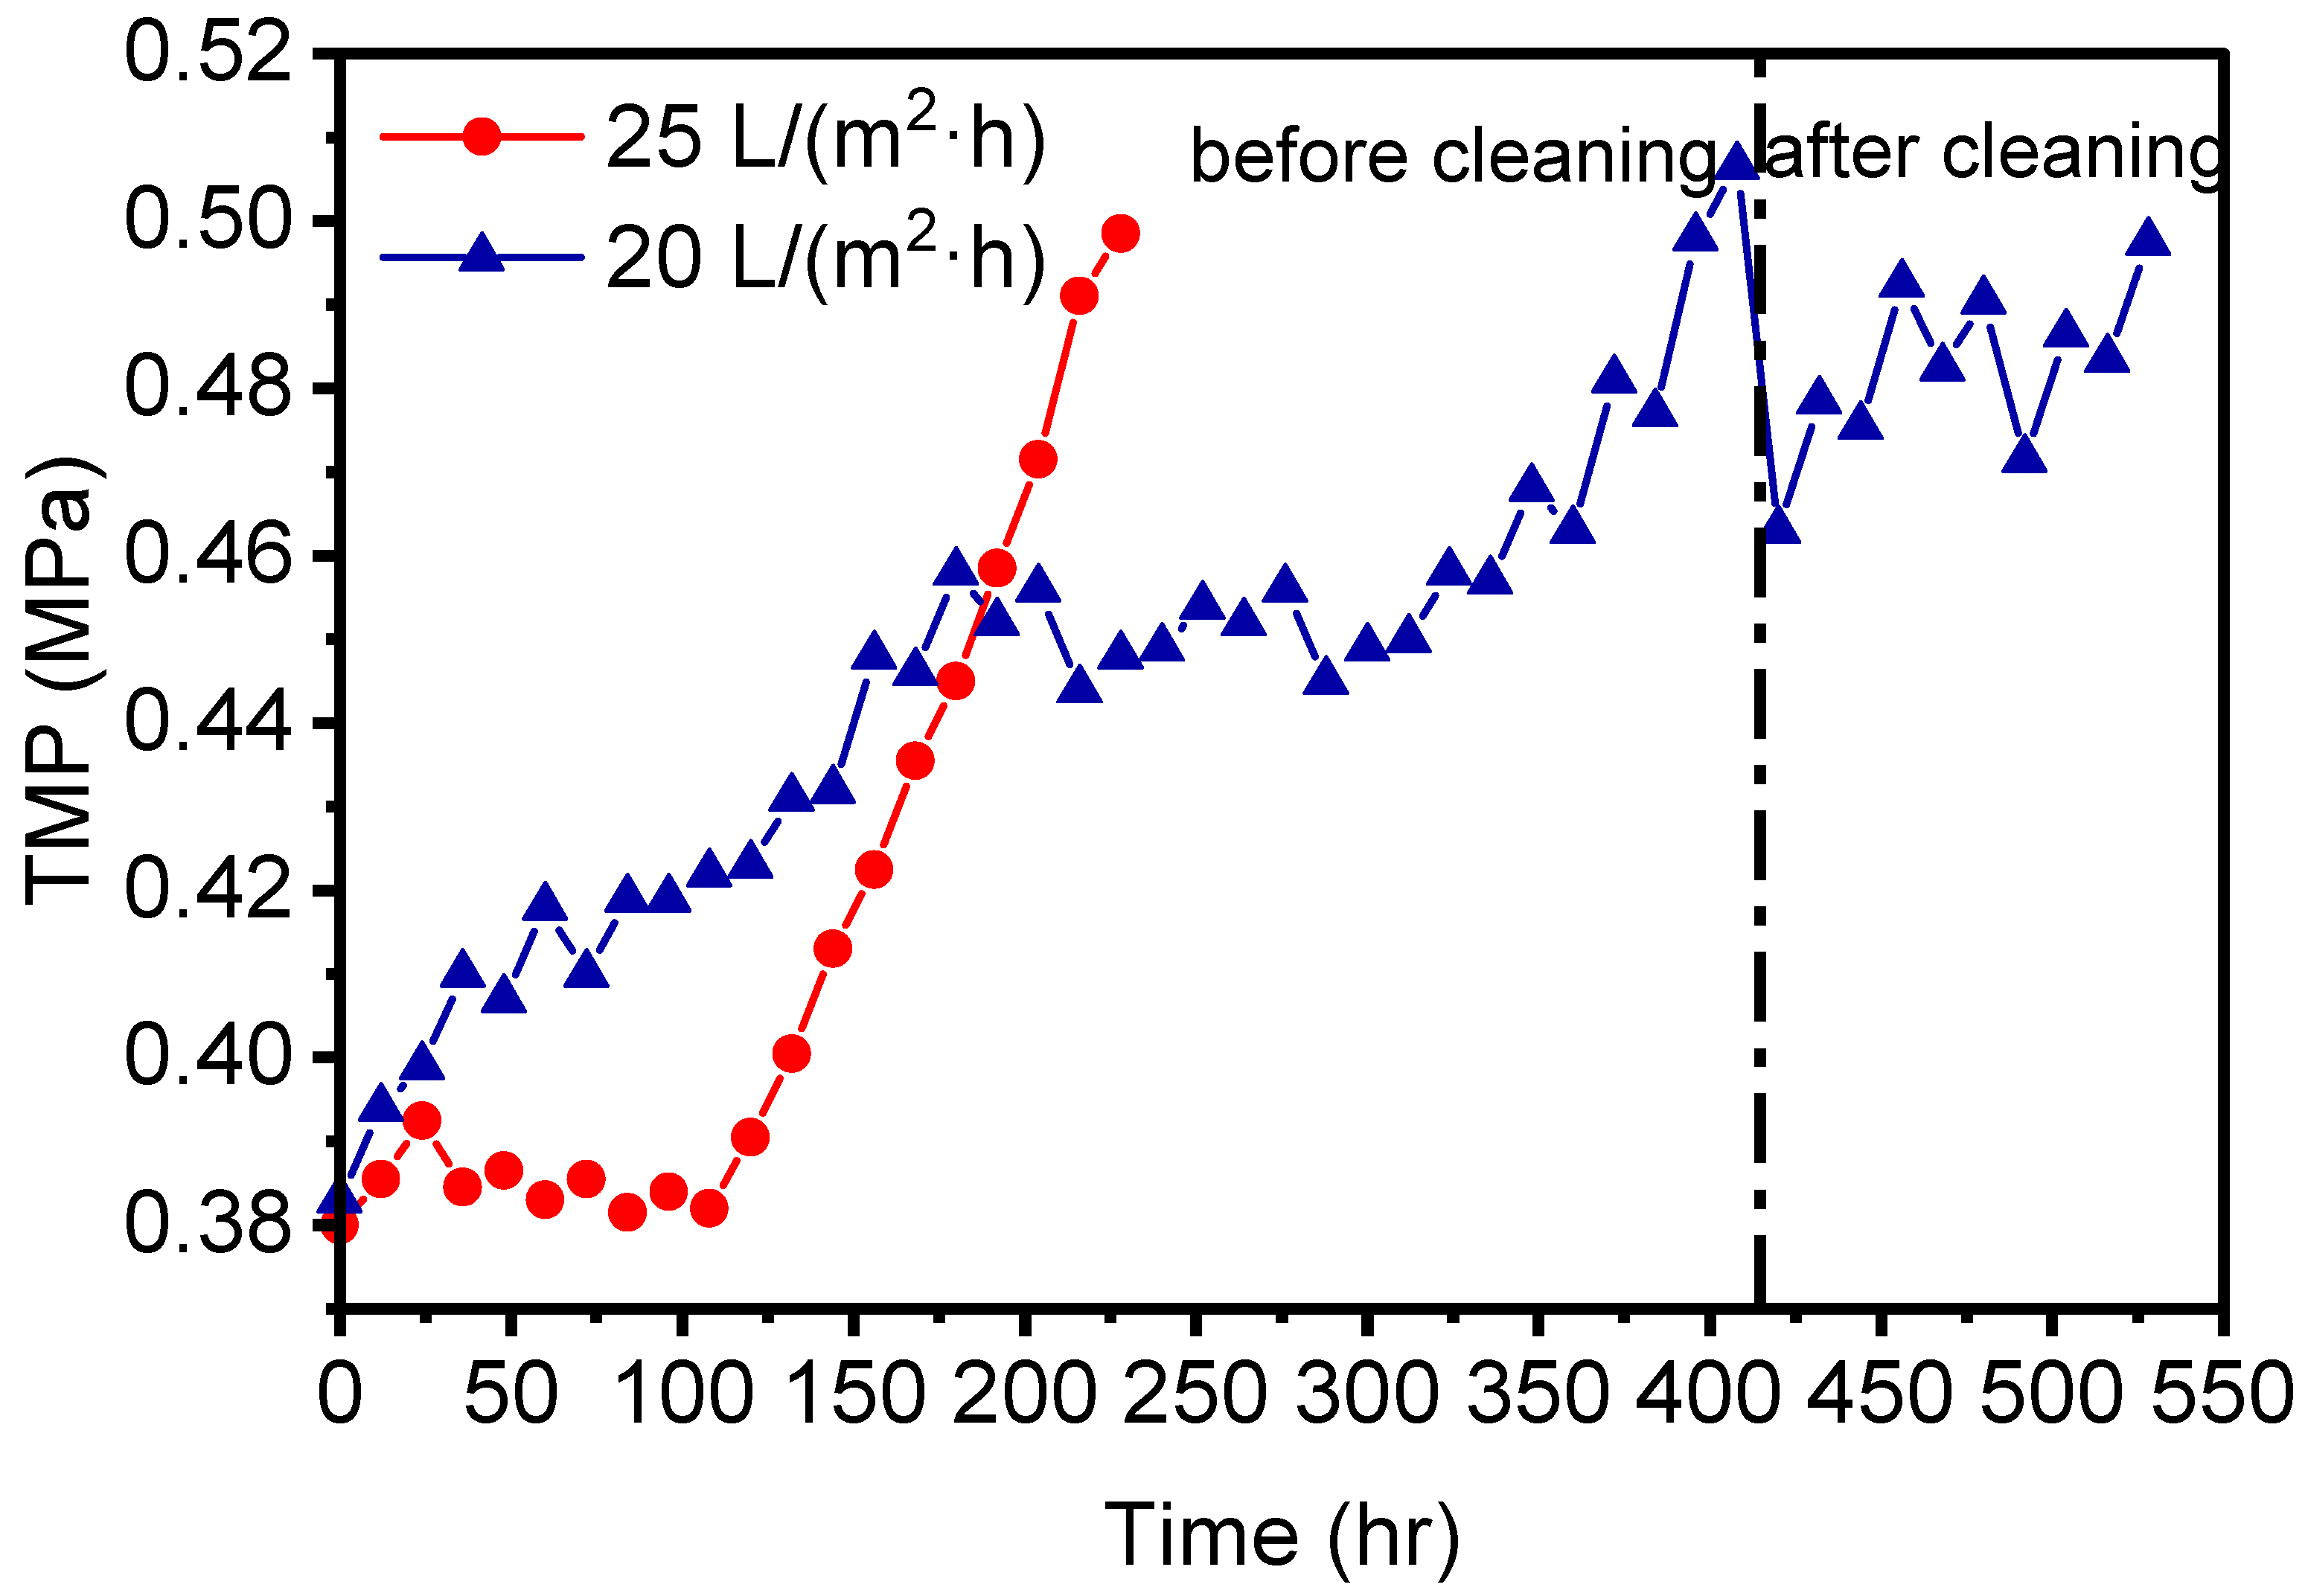
3.3.1. TMP Variation over Operational Time

In the membrane treatment processes, membrane flux and TMP were the most basic indicators for monitoring of membrane operational stability and fouling [75]. In this study, performance of the pilot-scale NF membrane system was investigated at two different fluxes, 25 and 20 L/(m2·h), and example plots of TMP versus operational time at the two conditions during November–December 2020 are shown in Figure 5. At flux of 25 L/(m2·h), TMP was stable within 108 h with nearly constant value of 0.38–0.39 MPa; afterwards, it rose rapidly and reached 0.50 MPa (i.e., the requirement for chemical cleaning) at 228 h, indicating that membrane fouling was quickly aggravated during this stage. In comparison, under the flux of 20L/(m2·h), the NF membrane was able to run continuously, with TMP increasing more slowly until 408 h, and afterwards TMP reached 0.5 MPa and off-line chemical cleaning was conducted. The chemical cleaning only recovered TMP down to 0.46 MPa, still much higher than its original value of ~0.38 MPa. Then, after only 120-h operation, TMP reached the requirement of 0.50 MPa for chemical cleaning again.
Although NOM was the main contributor to membrane fouling (as discussed below), the membrane fouling rate was probably accelerated by the low water temperature during the winter season, which was indicated by the strong negative correlation of TMP with influent water temperature (Pearson’s r = −0.82 for 20 L/(m2·h) and −0.96 for 25 L/(m2·h)) during this period. It is known that low temperature causes (i) increase in water density and viscosity, thus increasing the flow resistance [76]; and (ii) membrane structural alterations such as pore shrinkage, leading to pore size decrease and, accordingly, TMP increase to maintain the constant flux operation [77]. Although the NF membrane fouling could be delayed to some extent by reducing operational membrane flux, it could not be effectively alleviated by offline chemical cleaning (Figure 5).

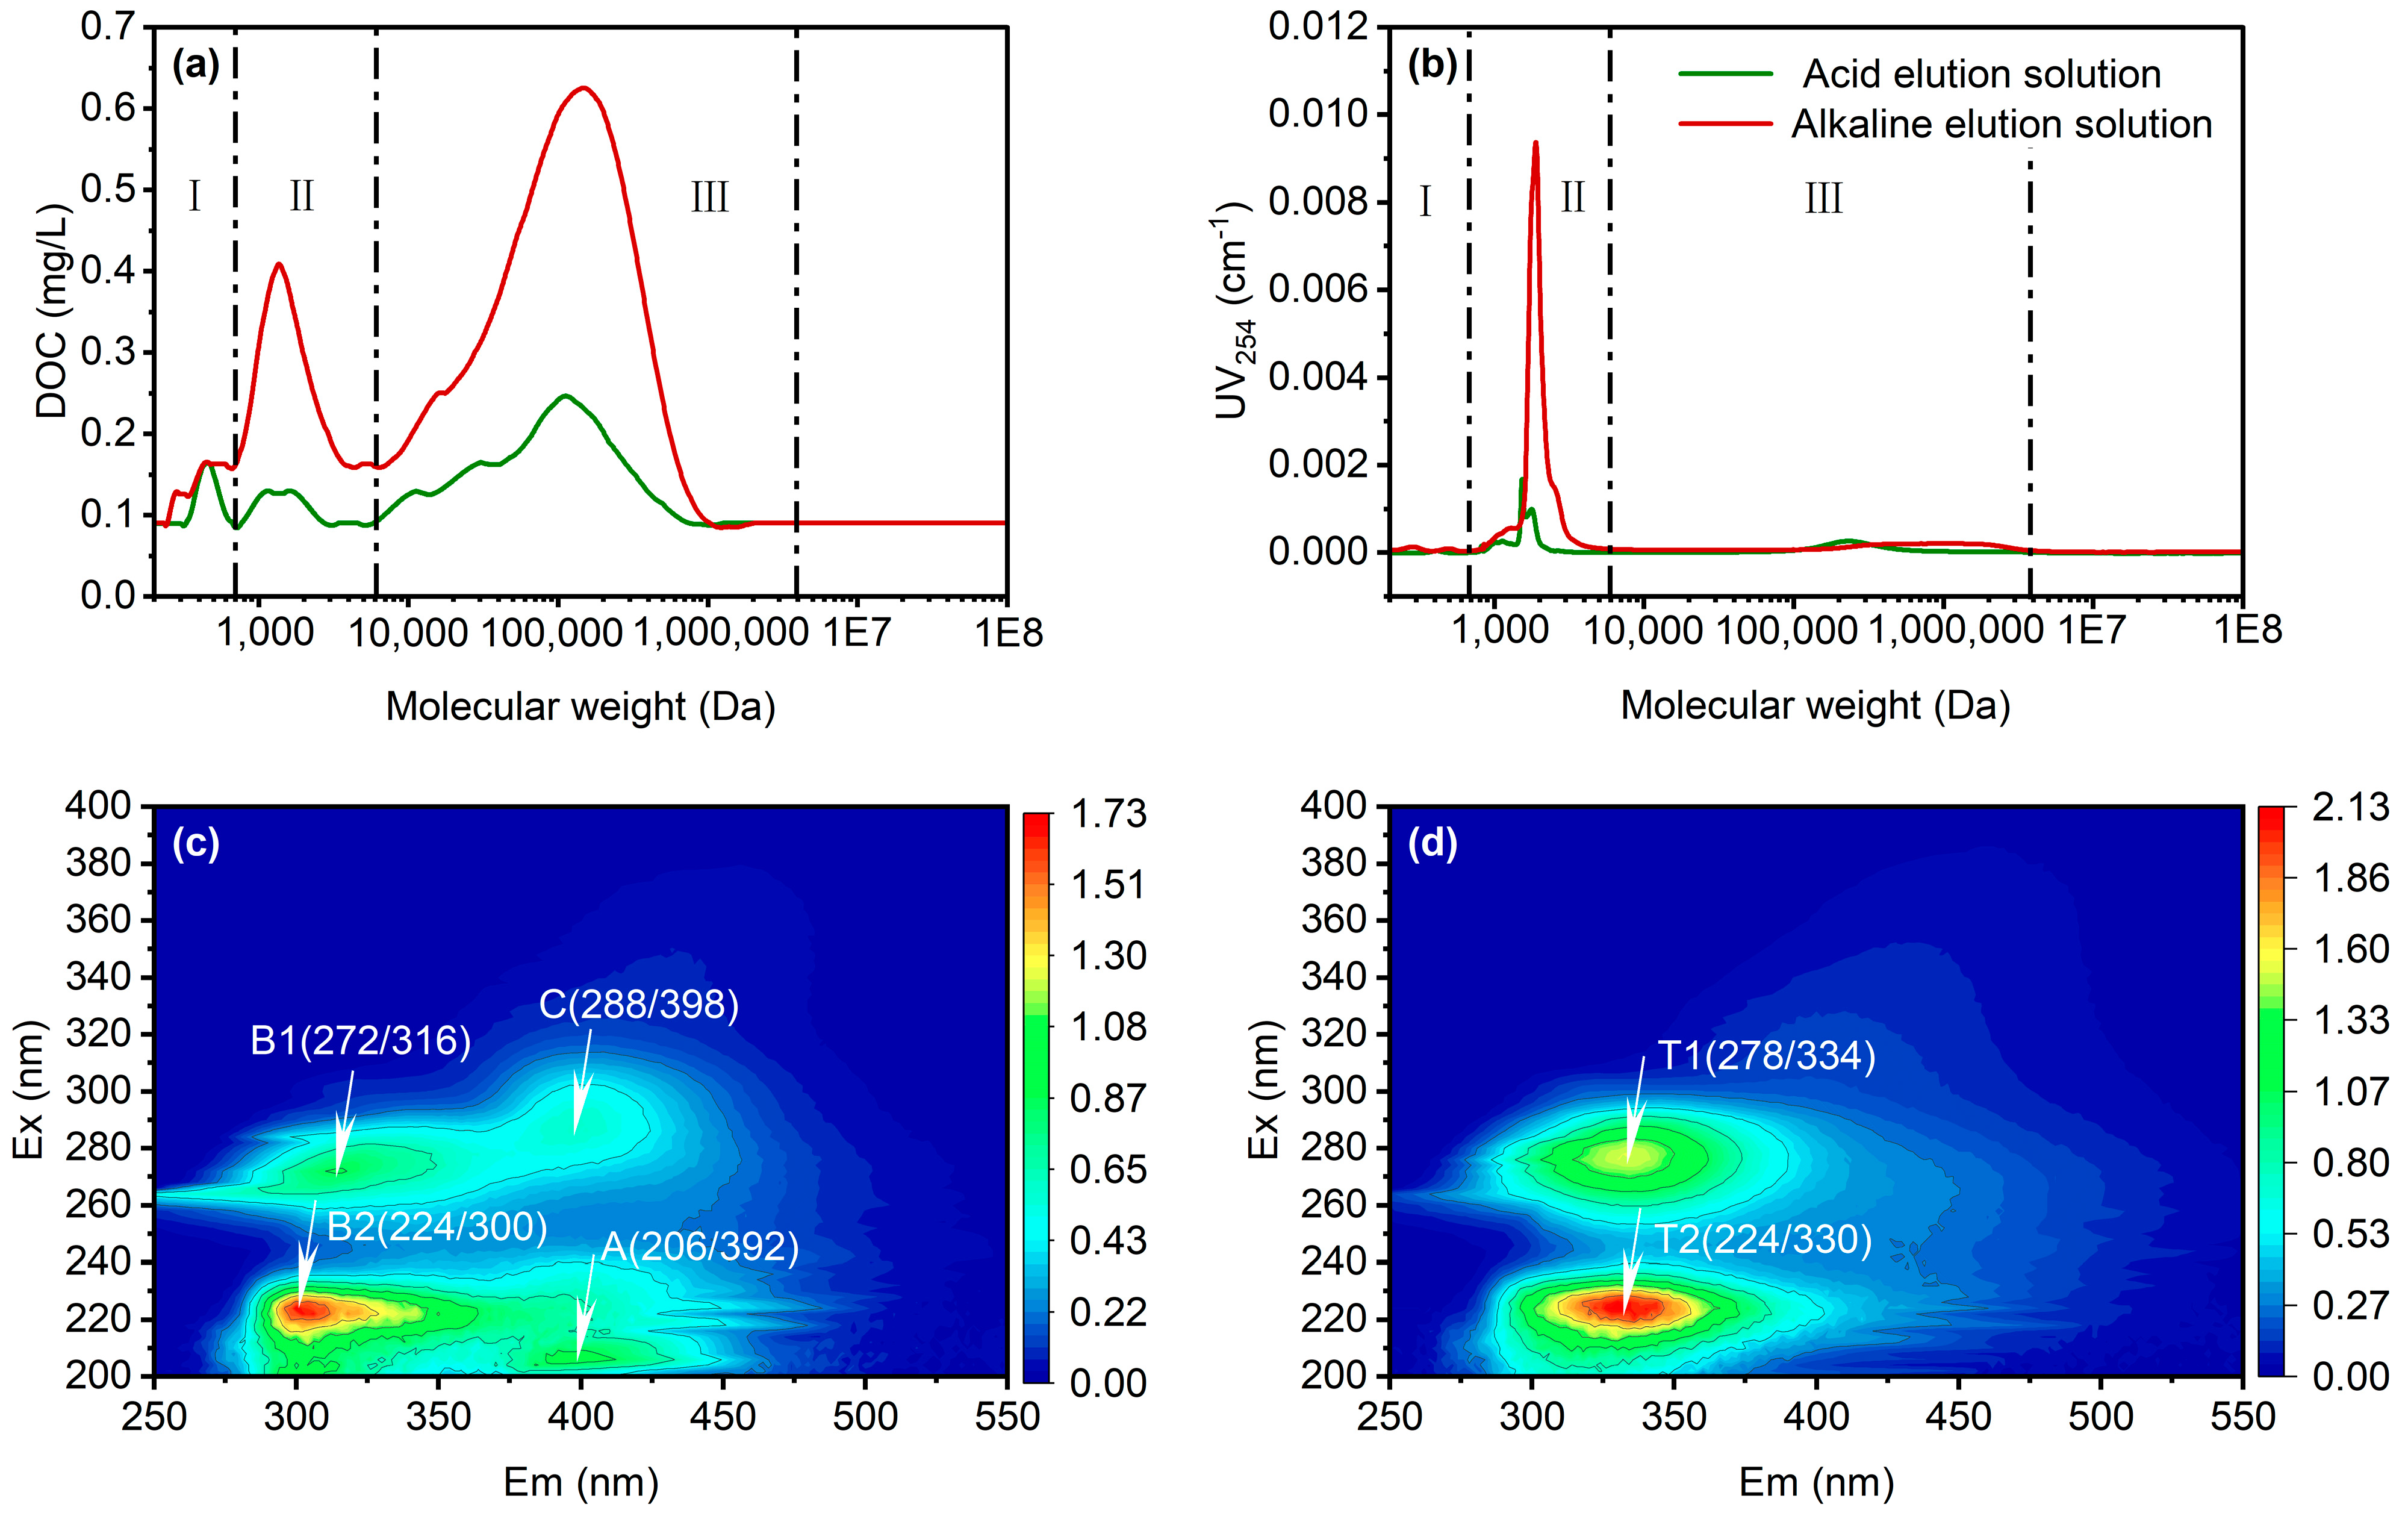
3.3.2. Characterization of Membrane Cleaning Solutions

To investigate mechanisms of NF membrane fouling following full-scale conventional plus O3-BAC processes, the NF membrane cleaning solutions were analyzed with EEM and HPSEC, with the results shown in Figure 6. MW distributions of organic matters eluted from chemical cleanings responded to three main peaks (Figure 6a,b): Region I (200–700 Da), with TOC response stronger than UV254, belonged to small-MW molecules, likely to be protein-like substances composed of hydrophilic tyrosine and/or tryptophan; Region II (700–6000 Da), with strong ultraviolet absorption, usually represented the medium-MW humic acid-like substances; Region III (6000 Da–4000K Da), with strong TOC response but no UV response, typically represented hydrophilic macromolecular biopolymers such as polysaccharides and protein-like substances [25,78]. The NF membrane cleaning solutions contained NOM across a wide MW range, and Region III had the highest signal abundance in response to TOC compared to the other two regions in both the acid and alkaline elution solutions. This indicated that hydrophilic macromolecular organics were the main NF membrane fouling contributor, and such foulants might not be effectively removed by the upstream processes of conventional plus O3-BAC advanced treatment.
Four fluorescent peaks were detected in the acid elution solution (Figure 6c), namely, peak A (Ex/Em = 206 nm/392 nm) and peak C (Ex/Em = 288 nm/398 nm), corresponding to humic/fulvic-like substances; and peak B1 (Ex/Em = 273 nm/316 nm) and peak B2 (Ex/Em = 224 nm/300 nm), usually attributed to tyrosine-like substances [79,80,81]. Two fluorescent peaks were detected in the alkaline elution solution (Figure 6d): peak T1(Ex/Em = 278 nm/334 nm) and peak T2 (Ex/Em = 224 nm/330 nm), likely belonging to tryptophan fluorophores [82]. These results showed that tyrosine and humic/fulvic-like substances were easily eluted during acid cleaning, while tryptophan compounds were more easily eluted by alkaline cleaning. In addition, it can be found that hydrophilic protein-like substances (in both the acid and alkaline elution solutions) yielded stronger fluorescent signals than those of hydrophobic humic-like substances (only found in the acid elution solution). This is consistent with the MW distribution results above and further supports that hydrophilic protein substances, being well retained by NF membranes, were the primary fouling contributors.

4. Conclusions

The “conventional + O3-BAC + NF” combined processes exhibited good performance in treating East Taihu Lake water. Compared to conventional treatment alone, addition of the O3-BAC advanced treatment significantly improved removal of turbidity and NOM, which could reduce the operational load of the downstream NF membrane. The NF process played an important role in further removing organic/inorganic constituents characterized by various water quality indicators, including those barely removed by the upstream processes (e.g., conductivity, TDS, TH, and Br). The removal efficiencies of CODMn, UV254, DOC, Br, and other common water quality indicators (including turbidity, conductivity, TDS, and TH) by the “conventional + O3-BAC + NF” combined process reached 88.8–99.8%. The quality of the NF effluent satisfied the requirements of the Suzhou high-quality drinking water quality standard.
The conventional plus O3-BAC advanced treatment processes effectively reduced Cl-DBPFP, but performed worse in removing Br-DBPFP; two of the brominated THM-FP species, DBCM-FP and TBM-FP, were significantly enhanced after the O3-BAC treatment, which was possibly ascribed to elevation of [Br]/[DOC] induced by the BAC filter. The following NF process effectively control formation potentials of all the THM-FP and HAA5-FP species investigated here by effectively reducing both NOM and Br and, accordingly, the reaction points of DOM and bromine during chlorination disinfection. The removal efficiencies of Cl-DBPFP and Br-DBPFP by the “conventional + O3-BAC + NF” combined process were 77.6–100% and 33.5–100%, respectively, with no detection of MCAA-FP, MBAA-FP, and TBM-FP in the NF effluent.
Low temperatures during the winter season likely caused the rapid growth of TMP during the operation of the NF membrane, and the membrane fouling could not be significantly alleviated despite offline chemical cleaning. The results of the membrane cleaning solution revealed that low-MW organic compounds, such as tyrosine-like, tryptophan-like, and humic-like acids, contributed to the membrane fouling, while macromolecular biopolymers (6000 Da–4000 KDa) such as polysaccharides and proteins were the major foulants.

Supplementary Materials

The following supporting information can be downloaded at: https://www.mdpi.com/article/10.3390/w15050843/s1, Tables and figures addressing details on characteristics of the NF90 membrane, measurements of water quality parameters, EEM spectra of selected samples and major fluorescent components identified via PARAFAC modeling, FRI results of EEM spectra, BSFTHMs values, linear regression results of DBPFP versus NOM parameters. References [29,45,46,47,48,49,50,51,52,53,54,55,56,83] are cited in the supplementary materials.

Author Contributions

Conceptualization, P.X., H.H., T.L., Y.C. and B.D.; Methodology, P.X.; Software, P.X.; Validation, H.H.; Formal Analysis, P.X. and H.H.; Investigation, P.X., H.H., T.L., Y.C. and B.D.; Resources, T.L., Y.C. and B.D.; Data Curation, P.X. and H.H.; Writing—Original Draft Preparation, P.X.; Writing—Review & Editing, H.H.; Visualization, P.X.; Supervision, H.H.; Project Administration, T.L. and B.D.; Funding Acquisition, Y.C. and B.D. All authors have read and agreed to the published version of the manuscript.

Funding

This work was supported by the Major Science and Technology Program for Water Pollution Control and Treatment in China (No:2017ZX07201-001). The authors would also like to gratefully acknowledge the financial support from the National Natural Science Foundation of China (No. 52100012), the Natural Science Foundation of Shanghai (No. 20ZR1460800), and the Foundation of Key Laboratory of Yangtze River Water Environment, Ministry of Education (Tongji University), China (No. YRWEF202104).

Conflicts of Interest

The authors declare no conflict of interest.

References

  1. Chen, W.; Yu, H.-Q. Advances in the characterization and monitoring of natural organic matter using spectroscopic approaches. Water Res. 2021, 190, 116759. [Google Scholar] [CrossRef] [PubMed]
  2. Li, T.; Zhang, Y.; Gui, B.; Gao, K.; Zhao, Q.; Qu, R.; Liu, T.; Hoffmann, M.; Staaks, C.; Dong, B. Application of coagulation-ultrafiltration-nanofiltration in a pilot study for Tai Lake water treatment. Water Environ. Res. 2019, 92, 579–5877. [Google Scholar] [CrossRef] [PubMed]
  3. Kurajica, L.; Bošnjak, M.U.; Kinsela, A.S.; Štiglić, J.; Waite, T.D.; Capak, K.; Pavlić, Z. Effects of changing supply water quality on drinking water distribution networks: Changes in NOM optical properties, disinfection byproduct formation, and Mn deposition and release. Sci. Total Environ. 2021, 762, 144159. [Google Scholar] [CrossRef] [PubMed]
  4. Slavik, I.; Müller, S.; Mokosch, R.; Azongbilla, J.A.; Uhl, W. Impact of shear stress and pH changes on floc size and removal of dissolved organic matter (DOM). Water Res. 2012, 46, 6543–6553. [Google Scholar] [CrossRef] [PubMed]
  5. Song, Q.; Graham, N.; Tang, Y.; Siddique, M.S.; Kimura, K.; Yu, W. The role of medium molecular weight organics on reducing disinfection by-products and fouling prevention in nanofiltration. Water Res. 2022, 215, 118263. [Google Scholar] [CrossRef]
  6. Qian, Y.; Chen, Y.; Hu, Y.; Hanigan, D.; Westerhoff, P.; An, D. Formation and control of C-and N-DBPs during disinfection of filter backwash and sedimentation sludge water in drinking water treatment. Water Res. 2021, 194, 116964. [Google Scholar] [CrossRef]
  7. Srivastav, A.L.; Patel, N.; Chaudhary, V.K. Disinfection by-products in drinking water: Occurrence, toxicity and abatement. Environ. Pollut. 2020, 267, 115474. [Google Scholar] [CrossRef]
  8. Geter, D.R.; Moore, T.M.; George, M.H.; Kilburn, S.R.; Allen, J.W.; Nelson, G.M.; Winkfield, E.; DeAngelo, A.B. Tribromomethane exposure and dietary folate deficiency in the formation of aberrant crypt foci in the colons of F344/N rats. Food Chem. Toxicol. 2005, 43, 1405–1412. [Google Scholar] [CrossRef]
  9. Bond, T.; Goslan, E.H.; Parsons, S.A.; Jefferson, B. Disinfection by-product formation of natural organic matter surrogates and treatment by coagulation, MIEX® and nanofiltration. Water Res. 2010, 44, 1645–1653. [Google Scholar] [CrossRef]
  10. GB 5749-2022; Standards for Drinking Water Quality. State Administration for Market Regulation & Standardization Administration: Beijing, China, 2022. Available online: https://mp.weixin.qq.com/s/UEEK6d1g97Jye4Ct6XEfKw (accessed on 1 October 2022)In Chinese.
  11. Zhang, Y.; Lu, Z.; Zhang, Z.; Shi, B.; Hu, C.; Lyu, L.; Zuo, P.; Metz, J.; Wang, H. Heterogeneous Fenton-like reaction followed by GAC filtration improved removal efficiency of NOM and DBPs without adjusting pH. Sep. Purif. Technol. 2020, 260, 118234. [Google Scholar] [CrossRef]
  12. Bond, T.; Huang, J.; Templeton, M.R.; Graham, N. Occurrence and control of nitrogenous disinfection by-products in drinking water—A review. Water Res. 2011, 45, 4341–4354. [Google Scholar] [CrossRef]
  13. Chen, H.; Lin, T.; Chen, W.; Tao, H.; Xu, H. Removal of disinfection byproduct precursors and reduction in additive toxicity of chlorinated and chloraminated waters by ozonation and up-flow biological activated carbon process. Chemosphere 2018, 216, 624–632. [Google Scholar] [CrossRef]
  14. Chu, W.; Gao, N.; Yin, D.; Deng, Y.; Templeton, M.R. Ozone–biological activated carbon integrated treatment for removal of precursors of halogenated nitrogenous disinfection by-products. Chemosphere 2012, 86, 1087–1091. [Google Scholar] [CrossRef]
  15. Sun, Y.; Angelotti, B.; Brooks, M.; Dowbiggin, B.; Evans, P.J.; Devins, B.; Wang, Z.W. A pilot-scale investigation of disinfection by-product precursors and trace organic removal mechanisms in ozone-biologically activated carbon treatment for potable reuse. Chemosphere 2018, 210, 539–549. [Google Scholar] [CrossRef]
  16. Li, P.; Wu, C.; Yang, Y.; Wang, Y.; Yu, S.; Xia, S.; Chu, W. Effects of microbubble ozonation on the formation of disinfection by-products in bromide-containing water from Tai Lake. Sep. Purif. Technol. 2018, 193, 408–414. [Google Scholar] [CrossRef]
  17. Wei, X.; Yang, M.; Zhu, Q.; Wagner, E.D.; Plewa, M.J. Comparative quantitative toxicology and QSAR modeling of the haloacetonitriles: Forcing agents of water disinfection byproduct toxicity. Environ. Sci. Technol. 2020, 54, 8909–8918. [Google Scholar] [CrossRef] [PubMed]
  18. Liu, H.; Zhang, X.; Fang, Y.; Fu, C.; Chen, Z. Trade-off control of organic matter and disinfection by-products in the drinking water treatment chain: Role of pre-ozonation. Sci. Total Environ. 2021, 770, 144767. [Google Scholar] [CrossRef]
  19. Yu, Y.; Huang, X.; Chen, R.; Pan, L.; Shi, B. Control of disinfection byproducts in drinking water treatment plants: Insight into activated carbon filter. Chemosphere 2021, 280, 130958. [Google Scholar] [CrossRef] [PubMed]
  20. Hong, S.; Tang, X.C.; Wu, N.X.; Chen, H.B. Leakage of soluble microbial products from biological activated carbon filtration in drinking water treatment plants and its influence on health risks. Chemosphere 2018, 202, 626–636. [Google Scholar] [CrossRef] [PubMed]
  21. Siddique, M.S.; Xiong, X.; Yang, H.; Maqbool, T.; Graham, N.; Yu, W. Dynamic variations in DOM and DBPs formation potential during surface water treatment by ozonation-nanofiltration: Using spectroscopic indices approach. Chem. Eng. J. 2021, 427, 132010. [Google Scholar] [CrossRef]
  22. Ersan, M.S.; Ladner, D.A.; Karanfil, T. The control of N-nitrosodimethylamine, halonitromethane, and trihalomethane precursors by nanofiltration. Water Res. 2016, 105, 274–281. [Google Scholar] [CrossRef] [Green Version]
  23. Kim, M.H.; Yu, M.J. Characterization of NOM in the Han River and evaluation of treatability using UF–NF membrane. Environ. Res. 2005, 97, 116–123. [Google Scholar] [PubMed]
  24. Wang, P.; Wang, F.; Jiang, H.; Zhang, Y.; Zhao, M.; Xiong, R.; Ma, J. Strong improvement of nanofiltration performance on micropollutant removal and reduction of membrane fouling by hydrolyzed-aluminum nanoparticles. Water Res. 2020, 175, 115649. [Google Scholar] [CrossRef] [PubMed]
  25. Yu, W.; Liu, T.; Crawshaw, J.; Liu, T.; Graham, N. Ultrafiltration and nanofiltration membrane fouling by natural organic matter: Mechanisms and mitigation by pre-ozonation and pH. Water Res. 2018, 139, 353–362. [Google Scholar] [CrossRef] [PubMed]
  26. Lin, D.; Bai, L.; Xu, D.; Zhang,, H.; Guo, T.; Li, G.; Liang, H. Effects of oxidation on humic-acid-enhanced gypsum scaling in different nanofiltration phases: Performance, mechanisms and prediction by differential log-transformed absorbance spectroscopy. Water Res. 2021, 195, 116989. [Google Scholar] [CrossRef] [PubMed]
  27. Krzeminski, P.; Vogelsang, C.; Meyn, T.; Köhler, S.J.; Poutanen, H.; Wit, H.D.; Uhl, W. Natural organic matter fractions and their removal in full-scale drinking water treatment under cold climate conditions in nordic capitals. J. Environ. Manag. 2019, 241, 427–438. [Google Scholar] [CrossRef] [PubMed]
  28. De la Rubia, A.; Rodríguez, M.; León, V.M.; Prats, D. Removal of natural organic matter and THM formation potential by ultra-and nanofiltration of surface water. Water Res. 2008, 42, 714–722. [Google Scholar] [CrossRef]
  29. Imbrogno, A.; Tiraferri, A.; Abbenante, S.; Weyand, S.; Schwaiger, R.; Luxbacher, T.; Schäfer, A.I. Organic fouling control through magnetic ion exchange-nanofiltration (MIEX-NF) in water treatment. J. Membr. Sci. 2018, 549, 474–485. [Google Scholar] [CrossRef]
  30. Zulaikha, S.; Lau, W.J.; Ismail, A.F.; Jaafar, J. Treatment of restaurant wastewater using ultrafiltration and nanofiltration membranes. J. Water Process. Eng. 2014, 2, 58–62. [Google Scholar] [CrossRef]
  31. Xue, S.; Jin, W.; Zhang, Z.; Liu, H. Reductions of dissolved organic matter and disinfection by-product precursors in full-scale wastewater treatment plants in winter. Chemosphere 2017, 179, 395–404. [Google Scholar] [CrossRef]
  32. Watson, K.; Farré, M.J.; Leusch, F.D.; Knight, N. Using fluorescence-parallel factor analysis for assessing disinfection by-product formation and natural organic matter removal efficiency in secondary treated synthetic drinking waters. Sci. Total Environ. 2018, 640, 31–40. [Google Scholar] [CrossRef] [PubMed]
  33. Xu, P.; Chen, Y.; Gui, B.; Guo, X.; Zhang, J. Pilot study on the treatment of lake water with algae by ultrafiltration–ozone–biologically activated carbon. J. Water Supply Res. Technol. 2021, 70, 1192–1203. [Google Scholar] [CrossRef]
  34. Ministry of Environmental Protection. Water Quality-Determination of Haloacetic Acids-Gas Chromatography; HJ758-2015; Ministry of Environmental Protection: Beijing, China, 2015. Available online: http://big5.mee.gov.cn/gate/big5/www.mee.gov.cn/ywgz/fgbz/bz/bzwb/jcffbz/201510/W020151030565342332739.pdf (accessed on 1 October 2022). (In Chinese)
  35. GB/T 5750.7-2006; Standard Examination Methods for Drinking Water—Aggregate Organic Parameters. Ministry of Health of the People’s Republic of China & Standardization Administration: Beijing, China, 2007. Available online: http://down.foodmate.net/standard/yulan.php?itemid=11213 (accessed on 1 October 2022). (In Chinese)
  36. GB/T 5750.4-2006; Standard Examination Methods for Drinking Water—Organoleptic and Physical Parameters. Ministry of Health of the People’s Republic of China & Standardization Administration: Beijing, China, 2007. Available online: http://down.foodmate.net/standard/yulan.php?itemid=11182 (accessed on 1 October 2022). (In Chinese)
  37. Xu, D.; Bai, L.; Tang, X.; Niu, D.; Luo, X.; Zhu, X.; Li, G.; Liang, H. A comparison study of sand filtration and ultrafiltration in drinking water treatment: Removal of organic foulants and disinfection by-product formation. Sci. Total Environ. 2019, 691, 322–331. [Google Scholar] [CrossRef]
  38. Xu, X.; Kang, J.; Shen, J.; Zhao, S.; Wang, B.; Zhang, X.; Chen, Z. EEM–PARAFAC characterization of dissolved organic matter and its relationship with disinfection by-products formation potential in drinking water sources of northeastern China. Sci. Total Environ. 2021, 774, 145297. [Google Scholar] [CrossRef]
  39. Chen, W.; Westerhoff, P.; Leenheer, J.A.; Booksh, K. Fluorescence excitation− emission matrix regional integration to quantify spectra for dissolved organic matter. Environ. Sci. Technol. 2003, 37, 5701–5710. [Google Scholar] [CrossRef] [PubMed]
  40. Kawasaki, N.; Matsushige, K.; Komatsu, K.; Kohzu, A.; Nara, F.W.; Ogishi, F.; Yahata, M.; Mikami, H.; Goto, T.; Imai, A. Fast and precise method for HPLC–size exclusion chromatography with UV and TOC (NDIR) detection: Importance of multiple detectors to evaluate the characteristics of dissolved organic matter. Water Res. 2011, 45, 6240–6248. [Google Scholar] [CrossRef] [PubMed]
  41. Wang, L.; Li, T.; Chu, H.; Zhang, W.; Huang, W.; Dong, B.; Wu, D.; Chen, F. Natural organic matter separation by forward osmosis: Performance and mechanisms. Water Res. 2021, 191, 116829. [Google Scholar] [CrossRef]
  42. Murphy, K.R.; Stedmon, C.A.; Graeber, D.; Bro, R. Fluorescence spectroscopy and multi-way techniques. parafac. Anal. Methods 2013, 5, 6557–6566. [Google Scholar] [CrossRef] [Green Version]
  43. Suzhou Water Bureau. Limit Value of Drinking Water Quality Indicators in Suzhou; Suzhou Water Bureau: Suzhou, China, 2021; Available online:https://www.cuwa.org.cn/Uploads/file/20210926/20210926104156_41592.pdf (accessed on 1 October 2022). (In Chinese)
  44. US EPA. National Primary Drinking Water Regulations. Available online: https://www.epa.gov/ground-water-and-drinking-water/national-primary-drinking-water-regulations (accessed on 1 October 2022).
  45. Ma, Y.; Mao, R.; Li, S. Hydrological seasonality largely contributes to riverine dissolved organic matter chemical composition: Insights from EEM-PARAFAC and optical indicators. J. Hydrol. 2021, 595, 125993. [Google Scholar] [CrossRef]
  46. Yang, L.; Chen, W.; Zhuang, W.E.; Cheng, Q.; Li, W.; Wang, H.; Guo, W.; Chen, C.T.A.; Liu, M. Characterization and bioavailability of rainwater dissolved organic matter at the southeast coast of China using absorption spectroscopy and fluorescence EEM-PARAFAC. Estuar. Coast. Shelf Sci. 2018, 217, 45–55. [Google Scholar] [CrossRef]
  47. Zhang, Y.; Liu, X.; Wang, M.; Qin, B. Compositional differences of chromophoric dissolved organic matter derived from phytoplankton and macrophytes. Org. Geochem. 2013, 55, 26–37. [Google Scholar] [CrossRef]
  48. Lapierre, J.F.; Frenette, J.J. Effects of macrophytes and terrestrial inputs on fluorescent dissolved organic matter in a large river system. Aquat. Sci. 2009, 71, 15–24. [Google Scholar] [CrossRef]
  49. Msssivotte, P.; Frenette, J. Spatial connectivity in a large river system: Resolving the sources and fate of dissolved organic matter. Ecol. Appl. 2011, 21, 2600–2617. [Google Scholar]
  50. Shen, J.; Liu, C.; Lv, Q.; Gu, J.; Su, M.; Wang, S.; Chai, Y.; Cheng, C.; Wu, J. Novel insights into impacts of the COVID-19 pandemic on aquatic environment of Beijing-Hangzhou Grand Canal in southern Jiangsu region. Water Res. 2021, 193, 116873. [Google Scholar] [CrossRef] [PubMed]
  51. Zhou, Y.; Jeppesen, E.; Zhang, Y.; Shi, K.; Liu, X.; Zhu, G. Dissolved organic matter fluorescence at wavelength 275/342nm as a key indicator for detection of point-source contamination in a large chinese drinking water lake. Chemosphere 2016, 144, 503–509. [Google Scholar] [CrossRef] [PubMed]
  52. He, W.; Hur, J. Conservative behavior of fluorescence eem-parafac components in resin fractionation processes and its applicability for characterizing dissolved organic matter. Water Res. 2015, 83, 217–226. [Google Scholar] [CrossRef] [PubMed]
  53. Baghoth, S.A.; Sharma, S.K.; Amy, G.L. Tracking natural organic matter (NOM) in a drinking water treatment plant using fluorescence excitation–emission matrices and PARAFAC. Water Res. 2011, 45, 797–809. [Google Scholar] [CrossRef] [PubMed]
  54. Stedmon, C.A.; Markager, S. Resolving the variability of dissolved organic matter fluorescence in a temperate estuary and its catchment using PARAFAC analysis. Limnol. Oceanogr. 2005, 50, 686–697. [Google Scholar] [CrossRef]
  55. Zhou, Y.; Shi, K.; Zhang, Y.; Jeppesen, E.; Liu, X.; Zhou, Q.; Wu, H.; Tang, X.; Zhu, G. Fluorescence peak integration ratio IC:IT as a new potential indicator tracing the compositional changes in chromophoric dissolved organic matter. Sci. Total Environ. 2017, 574, 1588–1598. [Google Scholar] [CrossRef]
  56. Liu, L.; Huang, Q.; Zhang, Y.; Qin, B.; Zhu, G. Excitation-emission matrix fluorescence and parallel factor analyses of the effects of N and P nutrients on the extracellular polymeric substances of microcystis aeruginosa. Limnologica 2017, 63, 18–26. [Google Scholar] [CrossRef]
  57. Devesa, R.; Dietrich, A.M. Guidance for optimizing drinking water taste by adjusting mineralization as measured by total dissolved solids (TDS). Desalination 2018, 439, 147–154. [Google Scholar] [CrossRef]
  58. Crider, Y.; Sultana, S.; Unicomb, L.; Davis, J.; Luby, S.P.; Pickering, A.J. Can you taste it? Taste detection and acceptability thresholds for chlorine residual in drinking water in Dhaka, Bangladesh. Sci. Total Environ. 2018, 613, 840–846. [Google Scholar] [CrossRef] [PubMed]
  59. Lin, D.; Liang, H.; Li, G. Factors affecting the removal of bromate and bromide in water by nanofiltration. Environ. Sci. Pollut. Res. 2019, 27, 24639–24649. [Google Scholar] [CrossRef] [PubMed]
  60. GB 50013-2018Standard for Design of Outdoor Water Supply Engineering; Ministry of Housing and Urban-Rural Development of the People’s Republic of China & State Administration for Market Regulation: Beijing, China, 2019. Available online: https://www.mohurd.gov.cn/gongkai/fdzdgknr/tzgg/201908/20190828_241590.html (accessed on 1 October 2022). (In Chinese)
  61. Park, K.Y.; Yu, Y.J.; Yun, S.J.; Kweon, J.H. Natural organic matter removal from algal-rich water and disinfection by-products formation potential reduction by powdered activated carbon adsorption. J. Environ. Manag. 2019, 235, 310–318. [Google Scholar] [CrossRef] [PubMed]
  62. Young, T.R.; Deem, S.; Leslie, J.C.; Salo-Zieman, V.; He, H.; Dodd, M.C. Drivers of disinfection byproduct formation and speciation in small, chlorinated coastal groundwater systems: Relative roles of bromide and organic matter, and the need for improved source water characterization and monitoring. Environ. Sci. Water Res. Technol. 2020, 6, 3361–3379. [Google Scholar] [CrossRef]
  63. Chaukura, N.; Marais, S.S.; Moyo, W.; Mbali, N.; Thakalekoala, L.C.; Ingwani, T.; Mamba, B.B.; Jarvis, P.; Nkambule, T.T. Contemporary issues on the occurrence and removal of disinfection byproducts in drinking water—A review. J. Environ. Chem. Eng. 2020, 8, 103659. [Google Scholar] [CrossRef]
  64. Arnold, M.; Batista, J.; Dickenson, E.; Gerrity, D. Use of ozone-biofiltration for bulk organic removal and disinfection byproduct mitigation in potable reuse applications. Chemosphere 2018, 202, 228–237. [Google Scholar] [CrossRef]
  65. Wert, E.C.; Rosario-Ortiz, F.L. Effect of Ozonation on Trihalomethane and Haloacetic Acid Formation and Speciation in a Full-Scale Distribution System. Ozone Sci. Eng. 2011, 33, 14–22. [Google Scholar] [CrossRef]
  66. Zhang, Y.; Chu, W.; Yao, D.; Yin, D. Control of aliphatic halogenated DBP precursors with multiple drinking water treatment processes: Formation potential and integrated toxicity. J. Environ. Sci. 2017, 58, 322–330. [Google Scholar] [CrossRef]
  67. MacKeown, H.; Gyamfi, J.A.; Schoutteten, K.V.K.M.; Dumoulin, D.; Verdickt, L.; Ouddane, B.; Criquet, J. Formation and removal of disinfection by-products in a full scale drinking water treatment plant. Sci. Total Environ. 2020, 704, 135280. [Google Scholar] [CrossRef]
  68. Krasner, S.W.; Lee, T.C.F.; Westerhoff, P.; Fischer, N.; Hanigan, D.; Karanfil, T.; Beita-Sandí, W.; Taylor-Edmonds, L.; Andrews, R.C. Granular activated carbon treatment may result in higher predicted genotoxicity in the presence of bromide. Environ. Sci. Technol. 2016, 50, 9583–9591. [Google Scholar] [CrossRef]
  69. Williams, C.J.; Conrad, D.; Kothawala, D.N.; Baulch, H.M. Selective removal of dissolved organic matter affects the production and speciation of disinfection byproducts. Sci. Total Environ. 2019, 652, 75–84. [Google Scholar] [CrossRef] [PubMed]
  70. Yan, M.; Wang, D.; Ma, X.; Ni, J.; Zhang, H. THMs precursor removal by an integrated process of ozonation and biological granular activated carbon for typical Northern China water. Sep. Purif. Technol. 2010, 72, 263–268. [Google Scholar] [CrossRef]
  71. Chu, W.; Li, C.; Gao, N.; Templeton, M.R.; Zhang, Y. Terminating pre-ozonation prior to biological activated carbon filtration results in increased formation of nitrogenous disinfection by-products upon subsequent chlorination. Chemosphere 2015, 121, 33–38. [Google Scholar] [CrossRef] [PubMed]
  72. Han, Q.; Yan, H.; Zhang, F.; Xue, N.; Wang, Y.; Chu, Y.; Gao, B. Trihalomethanes (THMs) precursor fractions removal by coagulation and adsorption for bio-treated municipal wastewater: Molecular weight, hydrophobicity/hydrophily and fluorescence. J. Hazard. Mater. 2015, 297, 119–126. [Google Scholar] [CrossRef] [PubMed]
  73. Hua, G.; Reckhow, D.A. Evaluation of bromine substitution factors of DBPs during chlorination and chloramination. Water Res. 2012, 46, 4208–4216. [Google Scholar] [CrossRef] [PubMed]
  74. Golea, D.M.; Upton, A.; Jarvis, P.; Moore, G.; Sutherland, S.; Parsons, S.A.; Judd, S.J. THM and HAA formation from NOM in raw and treated surface waters. Water Res. 2017, 112, 226–235. [Google Scholar] [CrossRef] [Green Version]
  75. Wang, Y.; Ju, L.; Xu, F.; Tian, L.; Jia, R.; Song, W.; Li, Y.; Liu, B. Effect of a nanofiltration combined process on the treatment of high-hardness and micropolluted water. Environ. Res. 2019, 182, 109063. [Google Scholar] [CrossRef]
  76. Cui, L.; Goodwin, C.; Gao, W.; Liao, B. Effect of cold water temperature on membrane structure and properties. J. Membr. Sci. 2017, 540, 19–26. [Google Scholar] [CrossRef]
  77. Tikka, A.; Gao, W.; Liao, B. Reversibility of membrane performance and structure changes caused by extreme cold water temperature and elevated conditioning water temperature. Water Res. 2018, 151, 260–270. [Google Scholar] [CrossRef]
  78. Su, Z.; Liu, T.; Li, X.; Graham, N.; Yu, W. Beneficial impacts of natural biopolymers during surface water purification by membrane nanofiltration. Water Res. 2021, 201, 117330. [Google Scholar] [CrossRef] [PubMed]
  79. Wang, S.; Yuan, R.; Chen, H.; Wang, F.; Zhou, B. Effect of sulfonamides on the dissolved organic matter fluorescence in biogas slurry during anaerobic fermentation according to the PARAFAC analysis. Process. Saf. Environ. Prot. 2020, 144, 253–262. [Google Scholar] [CrossRef]
  80. Zhang, L.; Liu, H.; Peng, Y.; Zhang, Y.; Sun, Q. Characteristics and significance of dissolved organic matter in river sediments of extremely water-deficient basins: A Beiyun River case study. J. Clean. Prod. 2020, 277, 123063. [Google Scholar] [CrossRef]
  81. Dong, Y.; Li, Y.; Kong, F.; Zhang, J.; Xi, M. Source, structural characteristics and ecological indication of dissolved organic matter extracted from sediments in the primary tributaries of the Dagu River. Ecol. Indic. 2019, 109, 105776. [Google Scholar] [CrossRef]
  82. He, Q.; Xiao, Q.; Fan, J.; Zhao, H.; Cao, M.; Zhang, C.; Jiang, Y. Excitation-emission matrix fluorescence spectra of chromophoric dissolved organic matter reflected the composition and origination of dissolved organic carbon in Lijiang River, Southwest China. J. Hydrol. 2021, 598, 126240. [Google Scholar] [CrossRef]
  83. DuPont Water Solutions. FilmTec™NF90-4040. Available online: https://www.dupont.com/products/filmtecnf904040.html (accessed on 1 October 2022).
Figure 1. Scheme of the full-scale treatment processes plus the pilot-scale NF system at the drinking water treatment plant (DWTP) in this study. Raw water of the DWTP comes from the East Taihu Lake, which is one of the primary drinking water sources in Suzhou City, Jiangsu Province, China. The pilot-scale NF system was operated during August 2020–December 2021, and the samples (from both the full-scale and pilot-scale processes) were collected regularly during this period. Pre-ozonation was not under operation (i.e., ozone dose was zero mg/L) during the period of this study.
Water 15 00843 g001
Figure 2. Removal efficiencies of water quality parameters by the treatment processes at the full-scale DWTP plus the pilot-scale NF system: (a) accumulative removal efficiencies by the conventional, conventional + O3-BAC, and conventional + O3-BAC + NF processes; and (b) individual removal efficiencies by conventional, O3-BAC, and NF processes. Samples from both the full-scale and pilot-scale processes were collected regularly (n = 3 for anions, n = 14 for fluorescence measurements, and n = 17 for the rest parameters) during August 2020–December 2021. For a specific indicator, the removal efficiencies were normalized to the values of the raw water as described in the main text). For panel (a), the circles are filled with different colors for different parameters, and their sizes (circle areas) represent removal efficiencies.
Water 15 00843 g002
Figure 3. Measurements of DBP formation potentials in samples of the raw water and effluents of each treatment unit: (a) THM-FP (including TTHM-FP and individual species) and (b) HAA5-FP (including HAA5-FP and individual species). Samples were collected for THM-FP analysis on March 18 2021, and for HAA5-FP analysis on 11 January 2021. Error bars represent standard deviations obtained from three independent assays for each sample.
Water 15 00843 g003
Figure 4. (a) Heatmap of Pearson correlation coefficients of DBPFP for different species versus water quality indicators characterizing NOMs; and plots of (b) TCM-FP, (c) BDCM-FP, (d) DBCM-FP, (e) TBM-FP, and (f) BSFTHMs versus [Br]/[DOC] with linear regression lines. In panel (a), the Pearson correlation analyses were performed by pooling data resulted from samples of the raw water and effluents of each treatment unit/process, which were collected regularly during August 2020–December 2021 (n = 42 for THM-FPs versus DOC or UV254; n = 28 for THM-FPs versus Fmax of C1–C4; n = 32 for HAA5-FPs versus DOC or UV254; n = 20 for HAA5-FPs versus Fmax of C1–C4). In panels (bf), NF effluent0, SF effluent0, BAC effluent0, and Raw water0 represent water samples without spiking additional Br, which were collected in November 2021; while NF effluentn, SF effluentn, BAC effluentn, and Raw watern represent those samples with spiking additional Br (bromide dosage, i.e., Δ[Br] = 2, 6, 18, 54, and 162 μg/L) (n = 15 in total). Linear regression analyses were performed by excluding samples of NF effluent0 and NF effluentn (see results with inclusion of NF samples in Figure S4).
Water 15 00843 g004
Figure 5. Example TMP variation curves of the pilot-scale NF process at two different fluxes of 20 and 25 L/(m2·h). The TMP data were obtained during the period November–December 2020.
Water 15 00843 g005
Figure 6. Plots of molecular weight (MW) distribution and EEM spectra of NF membrane cleaning solutions: MW distributions of (a) DOC and (b) UV responses for the acid and alkaline cleaning solutions; and EEM spectra of (c) acid cleaning solution and (d) alkaline cleaning solution. The membrane cleaning was performed after 408-h operation at flux of 20 L/(m2·h).
Water 15 00843 g006
Disclaimer/Publisher’s Note: The statements, opinions and data contained in all publications are solely those of the individual author(s) and contributor(s) and not of MDPI and/or the editor(s). MDPI and/or the editor(s) disclaim responsibility for any injury to people or property resulting from any ideas, methods, instructions or products referred to in the content.

