
Extreme Flood Levels during the Operation of Cascade Reservoirs: A Case Study of the Lower Yangtze River in 2020

1
Changjiang River Scientific Research Institute, Wuhan 430010, China
2
MWR Key Lab of River and Lake Regulation and Flood Control in the Middle and Lower Reaches of the Yangtze River, Wuhan 430010, China
3
Bureau of Hydrology, Changjiang Water Resources Commission, Wuhan 430010, China
*
Authors to whom correspondence should be addressed.
Water 2023, 15(5), 851; https://doi.org/10.3390/w15050851
Submission received: 8 February 2023
/
Revised: 16 February 2023
/
Accepted: 20 February 2023
/
Published: 22 February 2023
(This article belongs to the Special Issue New Challenges in the Planning, Design, Construction and Operation of Reservoirs in the Context of Climate Change)
Abstract
:Flood disasters related to climate change are becoming increasingly frequent, indicating the potential for repeated future incidence. It is essential to fully understand the causes and mechanisms of flood formation to reduce future losses. By taking the extreme flood in the lower Yangtze River in 2020 as an example and using hydrological and rainfall data of the basin, the formation process and triggering factors of a flood disaster were analyzed in this study. The flooding process can be divided into six typical stages, in which the long duration plum rain season, frequent and high-intensity rainstorms, and high overlapping rainfall areas are the preconditions for flood formation, whereas frequent encounters of floods in the main stream and tributaries of the middle and lower Yangtze River are the decisive factors. In addition, flood drainage along the lower reaches and the jacking effect of the downstream tide level play a role in promoting flooding. During this process, the joint operation of cascade reservoirs plays a key role in the prevention of catastrophic floods. The aforementioned results can provide a reference for flood control strategies in case of similar floods in the future.
1. Introduction
Extreme flood disasters caused by climate change are prevalent worldwide [1,2,3]. For example, climate change has exacerbated hydrological extremes in Tanzania, resulting in severe flood disasters [4], and changes in the sea surface temperature in the equatorial Pacific have led to extreme rainfall and floods in the Andes in Colombia [5]. River floods are particularly vulnerable to climate change, particularly in tropical and subtropical regions [6]. From 2010 to 2013, climate change aggravated flood disasters in northern Eurasia, parts of northwestern India, and large areas in central Africa [7]. In the past few decades, river flood losses caused by global climate change have been increasing dynamically and are expected to become more frequent in the next 100 years [8], and the resulting extreme floods will cause continuous disasters [9]. Relevant prediction studies in some regions show that due to the impact of climate change, the future rainfall intensity in the Philippines will increase by about 69%, resulting in a larger flood scale [10]. The rivers and coastal floods in the coastal estuaries of Newfoundland and Labrador in Canada will intensify [11], the scale of the annual average and maximum floods in Switzerland will increase [12], and the precipitation in Ecuador in South America will increase by 7%, which will increase the flood discharge by 10% [13]. In addition, it is expected that severe climate change in the Ba River and Penang River basins of Fiji Island will increase the annual loss by 300% in the future [14], and climate change in the Ebro River basin will lead to a significant increase in the number of potentially affected residents and cause economic losses due to flood risk [15]. Similar situations also occur in other Asian and European countries [16,17,18,19,20].
The Yangtze River, the third largest river in the world, also exhibits extreme floods caused by climate change. Abnormal precipitation caused by extreme climates is an important factor for floods in the Yangtze River basin [21]. In the past 3000 years, abnormal flood events have generally appeared to be related to climate change in the late Holocene [22]. For example, in 1849, extreme climate change caused super-heavy precipitation, resulting in extreme flood events in the Yangtze River basin [23]. In the past half-century, the flood risk in the Yangtze River basin has increased significantly [24,25]. During this period, the flood risk of the Jinsha River basin, which is a part of the Yangtze River basin in the upper basin, has increased due to changes in extreme hydrological conditions, and climate change was one of the main factors [26]. Similarly, the rainfall in summer and winter showed a significant increasing trend in the delta region of the lower Yangtze River [27]. The uneven spatial and temporal distribution of rainfall in space and time may be the main cause of flood disasters [28]. Its rainfall intensity at the sub-diurnal scale has become increasingly extreme, and short-term rainstorms have been considered to increase the peak flow and total flood volume in this region [29]. In the last 20 years, high flood levels in the lower Yangtze River have appeared more frequently [30]. In the future, under the influence of climate change, extreme precipitation and river flow in the Yangtze River basin will continue to increase, indicating that flood risk has the potential to increase [31,32,33]. Moreover, the extreme flood frequency in the Yangtze River basin, represented by the three hydrometric stations, namely, Cuntan, Yichang, and Datong, will increase significantly [34,35].
In this context, effectively improving the ability of human beings to cope with extreme floods and reducing the disasters caused by climate change has become an urgent challenge. Currently, the construction of water conservancy projects, especially large reservoir projects, has become an efficient and rapid approach and can change the landscape and climate conditions, leading to certain changes in the precipitation of the entire river basin [36]. The operation of reservoirs can also effectively control runoff, change the characteristics of the flood [37], and effectively mitigate the impact of climate change on the reaches downstream of the reservoir [38,39]; moreover, the joint operation of large reservoirs could be effective to achieve such effects [40]. Although the joint operation of large reservoirs had been implemented in the upper Yangtze River, the middle and lower Yangtze River still encountered a basin-type flood in 2020, which had been second in magnitude only to basin-type floods observed between 1954 and 1998, as per data recorded over the past 70 years. Although the maximum flood peak discharge (83,800 m3/s) of the lower Yangtze River in 2020 did not exceed that in 1954 (92,600 m3/s) and was comparable to that in 1998 (81,700 m3/s), the highest flood level from the Maanshan to Zhenyang reaches exceeded the historical highest. The recorded highest flood level at the Nanjing hydrometric station in 2020 was exceeded by 0.17 m and 0.25 m compared with 1954 and 1998, respectively. This abnormal phenomenon immediately attracted wide attention from river basin institutions and scholars. Studies have been performed on flood warnings, explored forecasting technology and capacity improvement [41], analyzed the joint operation of multi-reservoirs and the formation process, elucidated characteristics and causes of the high flood levels in the upper and middle Yangtze River [42,43,44], yielded a relatively in-depth understanding of the main characteristics of the 2020 flood [45], re-examined the overall layout of flood control in the Yangtze River Basin [46], and deeply considered the construction and improvement of the flood control system [47].
The aforementioned studies examined floods in 2020 from the perspective of the basin, analyzed their causes, and proposed some conceptual countermeasures. However, no reasonable explanation has been provided for the abnormal phenomena in local areas, i.e., the flood discharge did not exceed the historical maximum value, whereas the flood level did. Based on extensive hydrological data measured in the lower Yangtze River, using the Nanjing hydrometric station as an example, the formation and development process of the extreme flood level in 2020 and its internal mechanism were investigated in this study. The key role played by the cascade reservoirs in the upper Yangtze River has been discussed. The results can provide a reference for studying and judging the flood control situation in the lower Yangtze River and for formulating countermeasures when encountering similar extreme floods in the future.
2. Materials
2.1. Study Area
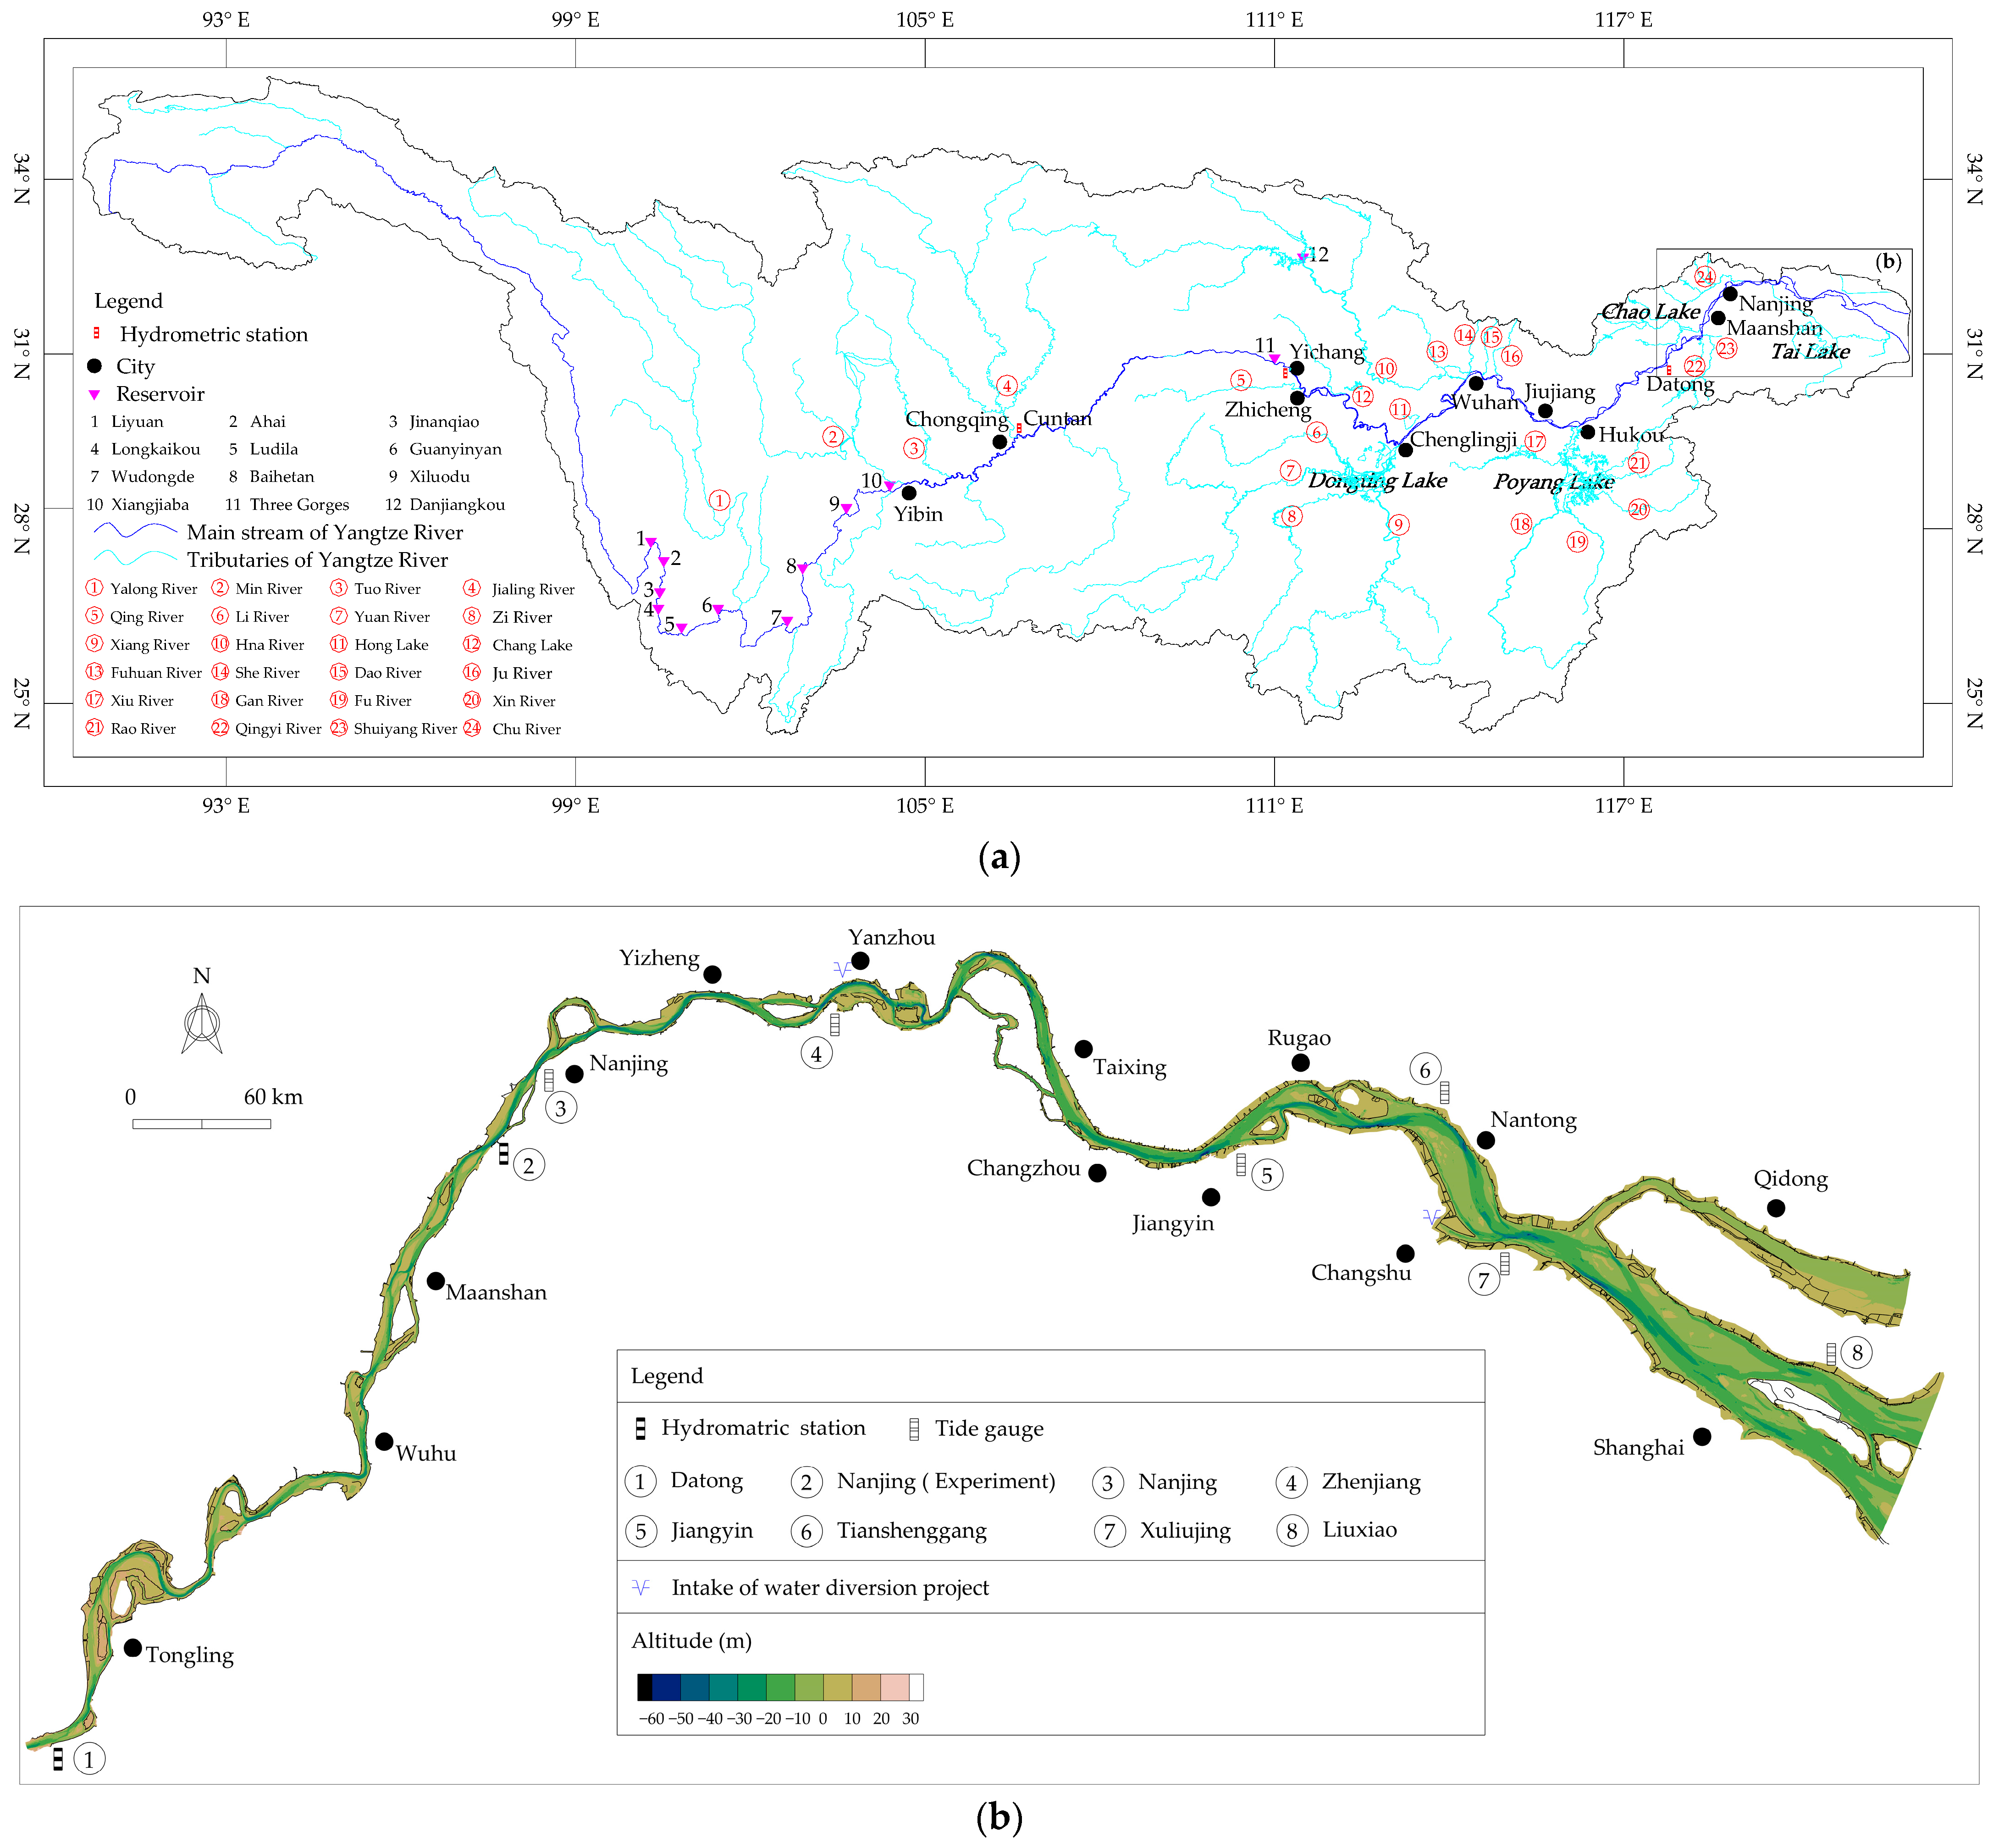
The Yangtze River is the largest in China, taking Yichang and Hukou as the dividing points of the upstream, midstream, and downstream regions (Figure 1a). The reach above Yibin is generally called the Jinsha River. The river basin is in the subtropical monsoon region of East Asia. It is a rain-flood river, and rainstorms account for 70–80% of annual runoff. The plain area in the middle and lower Yangtze River can form a huge flood discharge due to the confluence of rainstorms and floods in both the main river and its tributaries. To control the flooding of the Yangtze River and develop and utilize water resources, many large reservoirs have been built in the Yangtze River basin, which has formed the largest cascade reservoir system with joint operation in the world. Thus far, 52,000 large, medium, and small reservoirs have been built, accounting for 53% of the total number of reservoirs in China, with a total storage capacity of 360 billion m3 and a total flood control storage capacity of 77 billion m3, which have brought huge social and economic benefits. The Three Gorges Reservoir was completed and put into operation in 2003, reaching the normal pool level (175 m) for the first time after the flood season in 2010. Since 2010, six cascade reservoirs in the middle and four in the lower Jinsha River have been successively built and operated; they are named as follows: Liyuan, Ahai, Jinanqiao, Longkaikou, Ludila, Guanyinyan, Wudongde, Baihetan, Xiluodu, and Xiangjiaba. The Han River, the largest tributary of the middle and lower Yangtze River, has also built the Danjiangkou Reservoir, focusing on flood control. Under the joint operation of these large reservoirs, with the Three Gorges Reservoir as the core, the runoff process in the middle and lower Yangtze River has been strongly regulated.
The lower Yangtze River below Datong is not only the source of the eastern route of the South-to-North Water Diversion Project in China, but it is also the source of the three major water diversion systems in Jiangsu Province, namely, the Yangtze River to North Water Diversion Project, the Yangtze River to East Water Diversion Project, and the Yangtze River to Tai Lake Water Diversion Project (see Figure 1b). It is also the most economically developed area along the Yangtze River and plays a prominent role in flood control. As this reach is located in the lower Yangtze River after most of the tributaries converge, flood formation in it is affected by many factors, such as basin precipitation, flood encounter of main and tributaries, and joint operation of cascade reservoirs, resulting in flood disasters with complex causes. In 2020, an extreme flood level exceeding the highest level in history since the 1950s appeared in this reach and has caused widespread concern. Therefore, this section was selected as the study reach to comprehensively analyze the process and causes of the unusual flood level in 2020 from a broader perspective.
2.2. Data
In this study, by taking the reach of Datong to the estuary in the lower Yangtze River as the object and the record-breaking flood level of Nanjing on 21 July 2020 as the core, the flooding process and its causes in the flood season of 2020 were analyzed. As a result, the data measured at seven hydrometric stations and tide gauges were collected, including the flow discharge (tidal discharge) and water level (tidal level). The positions of these stations are shown in Figure 1b.
The measured data from the Datong hydrometric station contain the flow (tide) discharge and water (tide) levels. Two observation stations were located in the Nanjing reach: (1) the Nanjing hydrometric station in the experimental stage, expressed as Nanjing (Experiment), whose observation items are the same as those of Datong, and (2) the Nanjing tidal gauge, whose main observation items are the real-time tide level, similar to the Zhenjiang, Jiangyin, Tianshenggang, and Xuliujing tide gauges. Data for Datong, Nanjing (experiment), and Xuliujing were obtained from the Hydrological Bureau of the Yangtze River Water Conservancy Commission, and the data for others were obtained from the Hydrological Bureau of Jiangsu Province.
Several important water levels related to flood control were mentioned in this study. The first was the warning water level. After entering the flood season, the water levels of rivers and lakes start to rise, and flood control starts. Flood control began to enter an important period when the water level reached the warning level. The department needs to strengthen its vigilance, pay close attention to the development and changes in water hydrology and the dangerous situation, prepare human and material resources for flood control and rescue, and prepare for the possibility of a higher water level. The second water level is the safety-guaranteed water level. When the water level reaches this level, it indicates that the flood control project has reached the upper limit of safety defense. At this time, flood control projects may be in notable danger, which may cause river flooding and huge losses. Table 1 shows the above two water levels at the important nodes in the middle and lower Yangtze River.
To improve public awareness of flood control, the Ministry of Water Resources of the People’s Republic of China has formulated regulations for floods. The flood numbering standard from Cuntan to the estuary of the Yangtze River is such that the flow discharge of Cuntan or the inflow discharge of the Three Gorges Reservoir reaches 50,000 m3/s, the water level of Chenglingji or Wuhan reaches the warning level, and the water level of Jiujiang or Datong reaches the warning level. In 2020, there were five floods in the Yangtze River, as mentioned in the subsequent sections.
3. Results
3.1. Staged Flooding Process
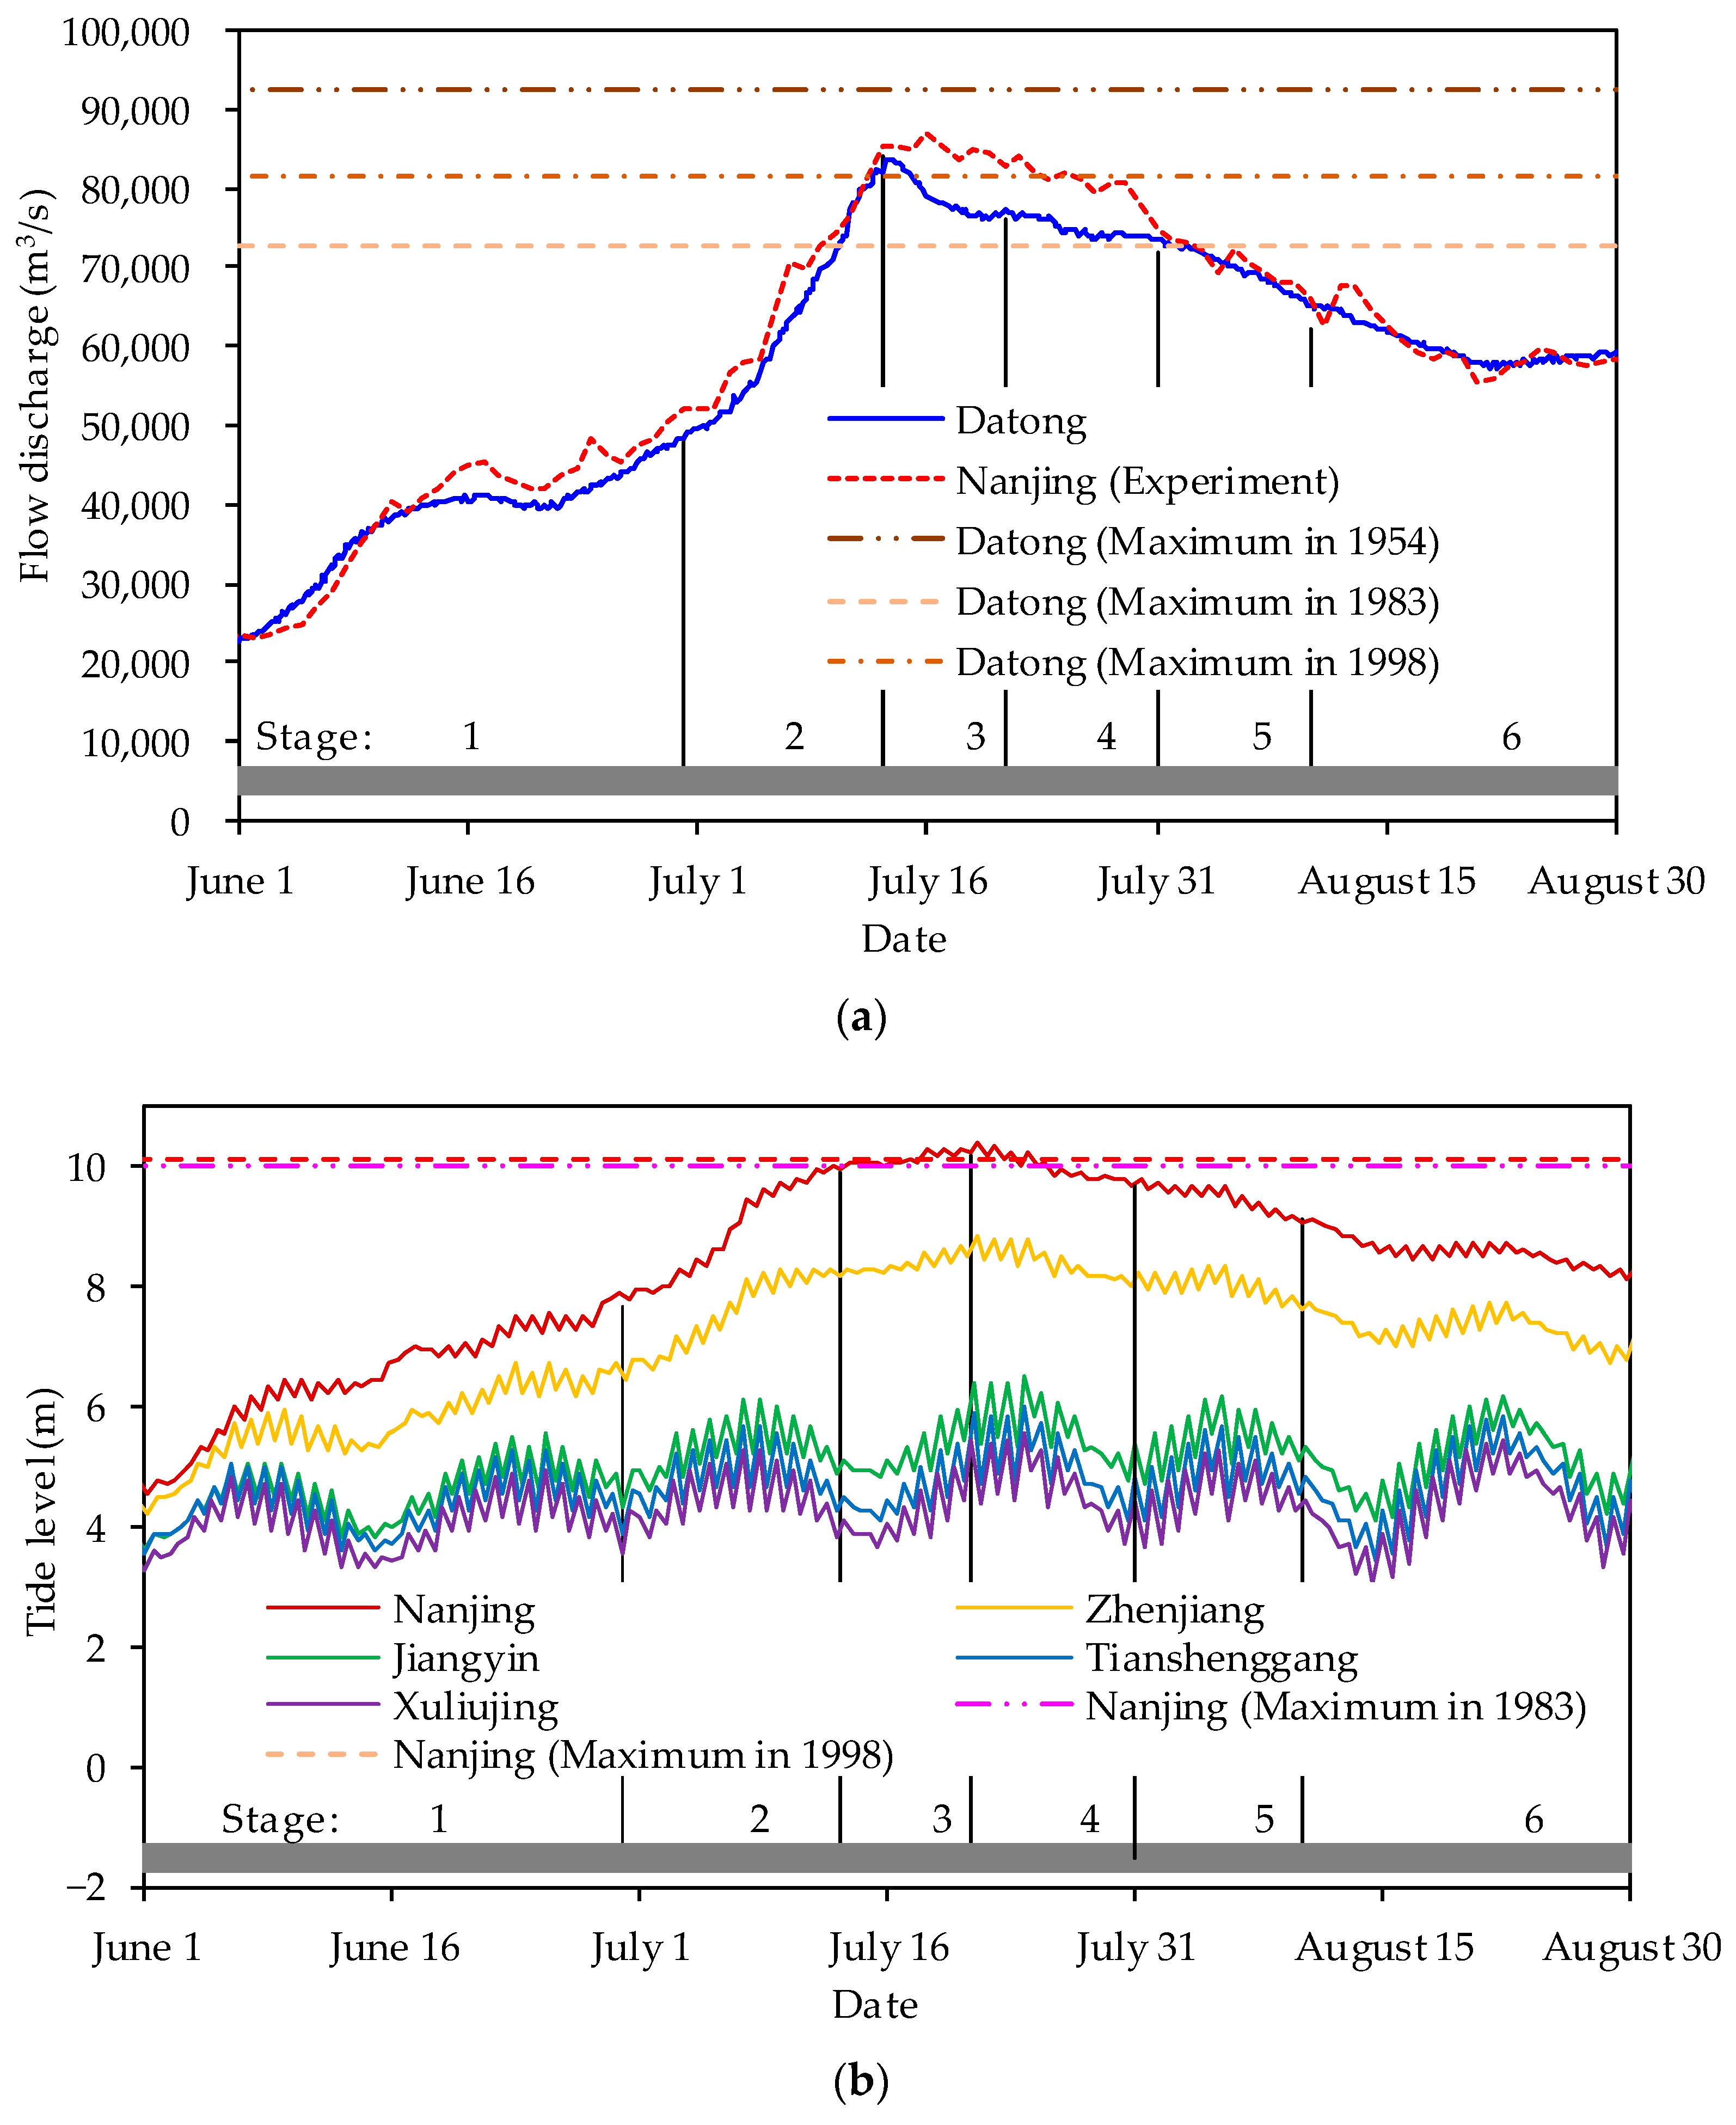
The flooding process from June to August in the flood season of the lower Yangtze River in 2020 can be divided into six characteristic stages, namely, the rising of the water level, the bank being filled by the channel and lakes, a lasting high flood level, a slow decrease in flood level after an initial increase, continuous decline in flood level, and withdrawal from the warning state, as shown in Figure 2. The detailed process of each stage is as follows.
- Rising of water level from 1 June to 30 June
During this period, several rounds of heavy rainfall occurred in the Yangtze River basin, with precipitation of 30% higher than the average value in the past 30 years, especially in the middle and lower reaches of the mainstream area, which was approximately 80% higher. Upstream, several tributaries burst into floods, and the amount of incoming water gradually increased. In the middle and lower reaches, the water system of the Qing River inlet near Zhicheng, the Dongting Lake inlet at Chenglingji, and the Poyang Lake inlet at Hukou also experienced flooding. Moreover, the tributaries of the Fuhuan River inlet in Wuhan, the Chao Lake inlet in Wuhu, and the Chu River inlet above Yizheng also experienced over-warning water level floods. After the flood convergence of the main and tributaries, the water levels of the main stream and the outlets of Dongting Lake and Poyang Lake in the middle and lower Yangtze River continued to rise, successively exceeding the historical average value during the same period. Among them, the highest tide level of Nanjing increased to 7.97 m on 1 July, which was about 0.34 m higher than the historical average value, laying a foundation for the later flood development.
- 2.
- Bankfull of the channel and lakes from 1 July to 13 July
In this stage, the main stream of the Yangtze River and the northern part of the Dongting and Poyang Lake drainage systems experienced concentrated heavy rainfall, which lasted for seven days from a rainstorm to a heavier one, and the rainfall area highly coincided with the previous period. At this time, the “No. 1 flood” formed on the upper Yangtze River. At 14:00 on 2 July, the maximum inflow discharge of the Three Gorges Reservoir reached 53,000 m3/s, and the maximum outflow discharge was reduced to 35,900 m3/s, with a peak clipping rate of approximately 34%. With the “No. 1 flood” evolving toward the middle and lower Yangtze River, impacted by the over-warning and over-safety guaranteed water level flood of the two lake systems and tributaries, the water level rise in the middle and lower main streams began to accelerate. The observed water levels of the main control hydrometric stations gradually exceeded the warning water level and approached the safety-guaranteed water level, forming a bankfull situation for both the channel and lakes. By 13 July, the highest flood level reached 16.24 m at Datong, and the tide level of Nanjing increased to 10.09 m, close to the highest level in 1998 (10.14 m).
- 3.
- Lasting high flood levels from 14 July to 21 July
The heavy rainfall area in the Yangtze River Basin was maintained upstream for four days and rapidly pushed southward to the middle and lower mainstream. At this time, the “No. 2 flood” formed upstream. On 18 July, the peak inflow discharge of the Three Gorges Reservoir was 61,000 m3/s, and the maximum outflow discharge was approximately 40,000 m3/s, with a peak clipping rate of approximately 46%. Many tributaries of the middle and lower reaches and Dongting Lake also experienced a process of water rise again. The water level at the tail of the tributaries of Dongting Lake, as well as in the lake area, was still at an over-warning value. The water level above Wuhan increased again. Affected by the flood effect of the pushing down in the upper and the jacking in the lower reaches, the highest tide level in the reach from Maanshan to Yangzhou exceeded the historical highest. For example, from 21 to 24 July, the tide levels at Nanjing and Zhenjiang exceeded the historical highest (see Table 2).
- 4.
- Slow falling after rising from 22 July to 31 July
After entering this stage, heavy rainfall occurred in the mainstream and north of the Yangtze River, forming the “No. 3 flood” in the upper Yangtze River. At 14:00 on 27 July, the peak inflow discharge of the Three Gorges Reservoir was 60,000 m3/s, the maximum outflow discharge was about 40,000 m3/s, and the clipping rate was approximately 36%. The Dongting Lake water system and several tributaries in the middle and lower Yangtze River experienced an obvious water-rising process. Among them, the water level of Chenglingji increased to the safety-guaranteed level (34.40 m). During this period, the water level above Wuhan continued to increase, while that below Jiujiang slowly decreased. By 31 July, the highest tide level at Nanjing had dropped to 9.78 m, with an average daily decline of 0.054 m, but it was still 1.08 m above the warning water level.
- 5.
- A continuous decline from 1 August to 10 August
The rainfall intensity of the Yangtze River Basin was generally weak during this period, and the rainfall centers began to disperse. Consequently, the inflow of the tributaries was stable, and the water levels of the middle and lower Yangtze River continued to decline. The Jingjiang reach (Zhicheng to Chenglingji), Luoshan to Wuhan, and Datong reach successively retreated below the warning water level. The highest tide level in Nanjing dropped to 9.07 m, with a daily average decline of 0.068 m, which was still above the warning water level.
- 6.
- Withdrawal from the warning state from 11 August to 22 August
Since 11 August, concentrated heavy rainfall occurred in the Jialing River and Min River basins in the upper Yangtze River. Incoming water was badly encountered, forming a relatively large repetitive water-rising process. The “No. 4 flood” and “No. 5 flood” appeared one after another. At 8:15 on 20 August, the flood peak water level at the Cuntan was 191.62 m, about 8.12 m more than the safety guaranteed level, just ranking second since 1892. During the “No. 5 flood” period, the Three Gorges Reservoir experienced a maximum inflow discharge of 75,000 m3/s after its construction. After the peak-shaving operation, the outflow discharge was only 49,400 m3/s, and the peak-shaving rate of the reservoir was approximately 34%. The water level of the Yichang to Jiujiang reaches increased back to different degrees but that below the Hukou was still in a falling process with small fluctuations. By 22 August, the highest tide level at Nanjing had dropped below the warning water level. Thus far, the flooding process in the lower Yangtze River has ended.
3.2. Causes of Extreme Flood Level at Nanjing
3.2.1. Preconditions
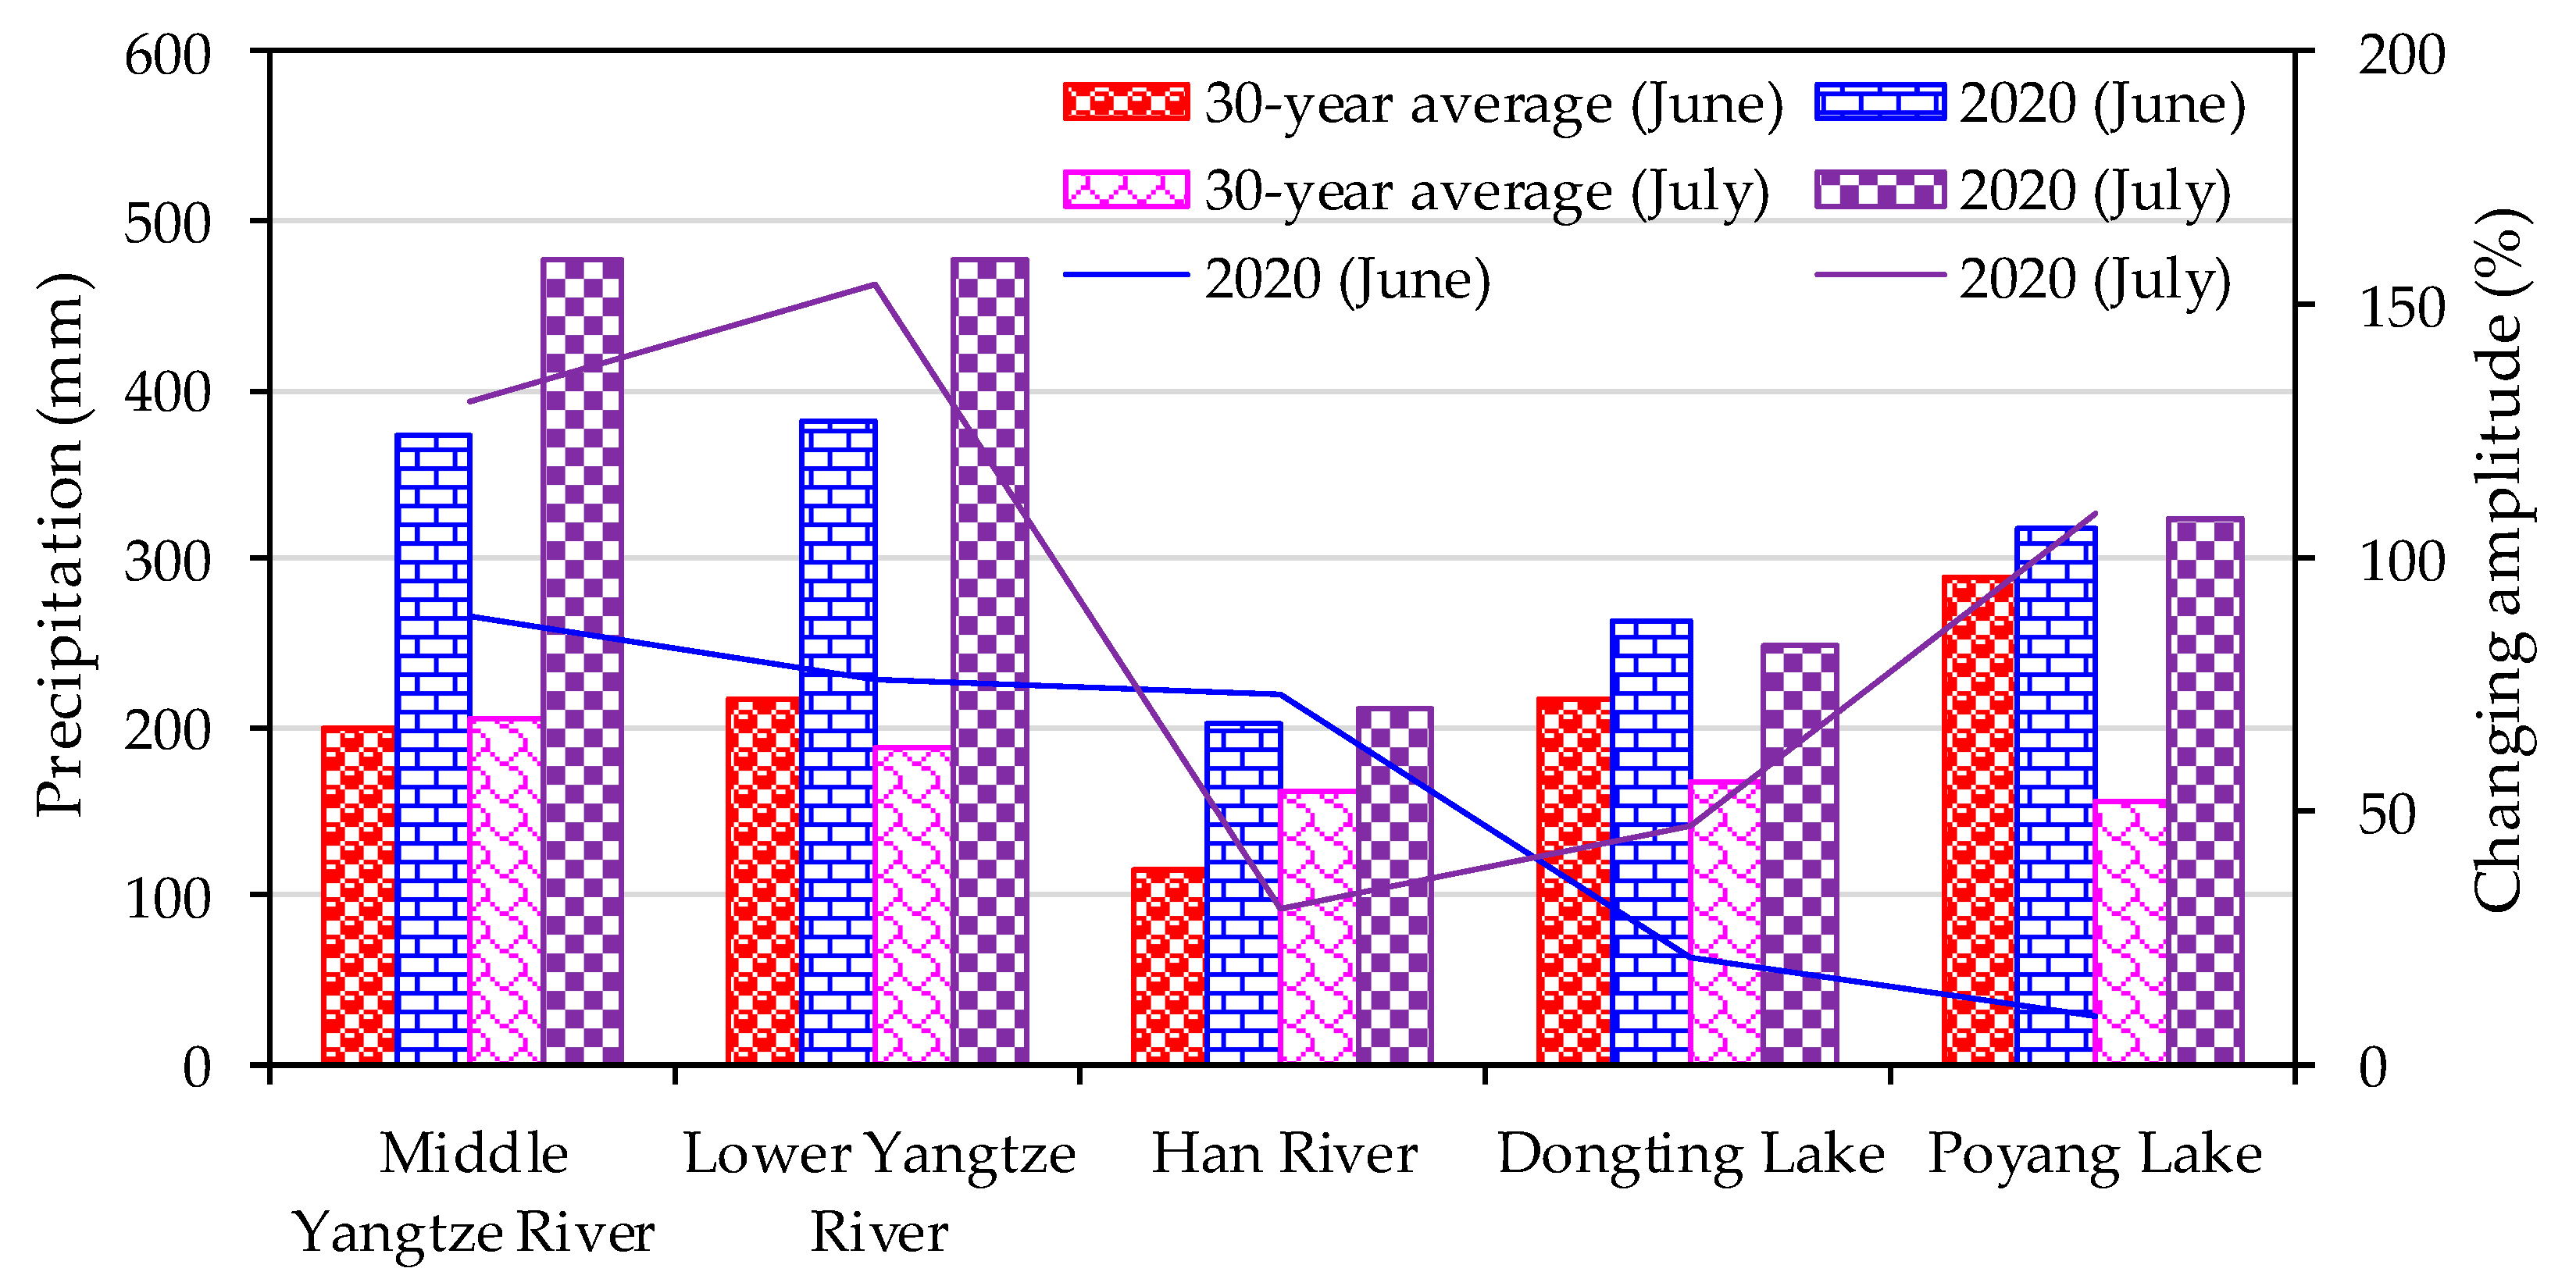
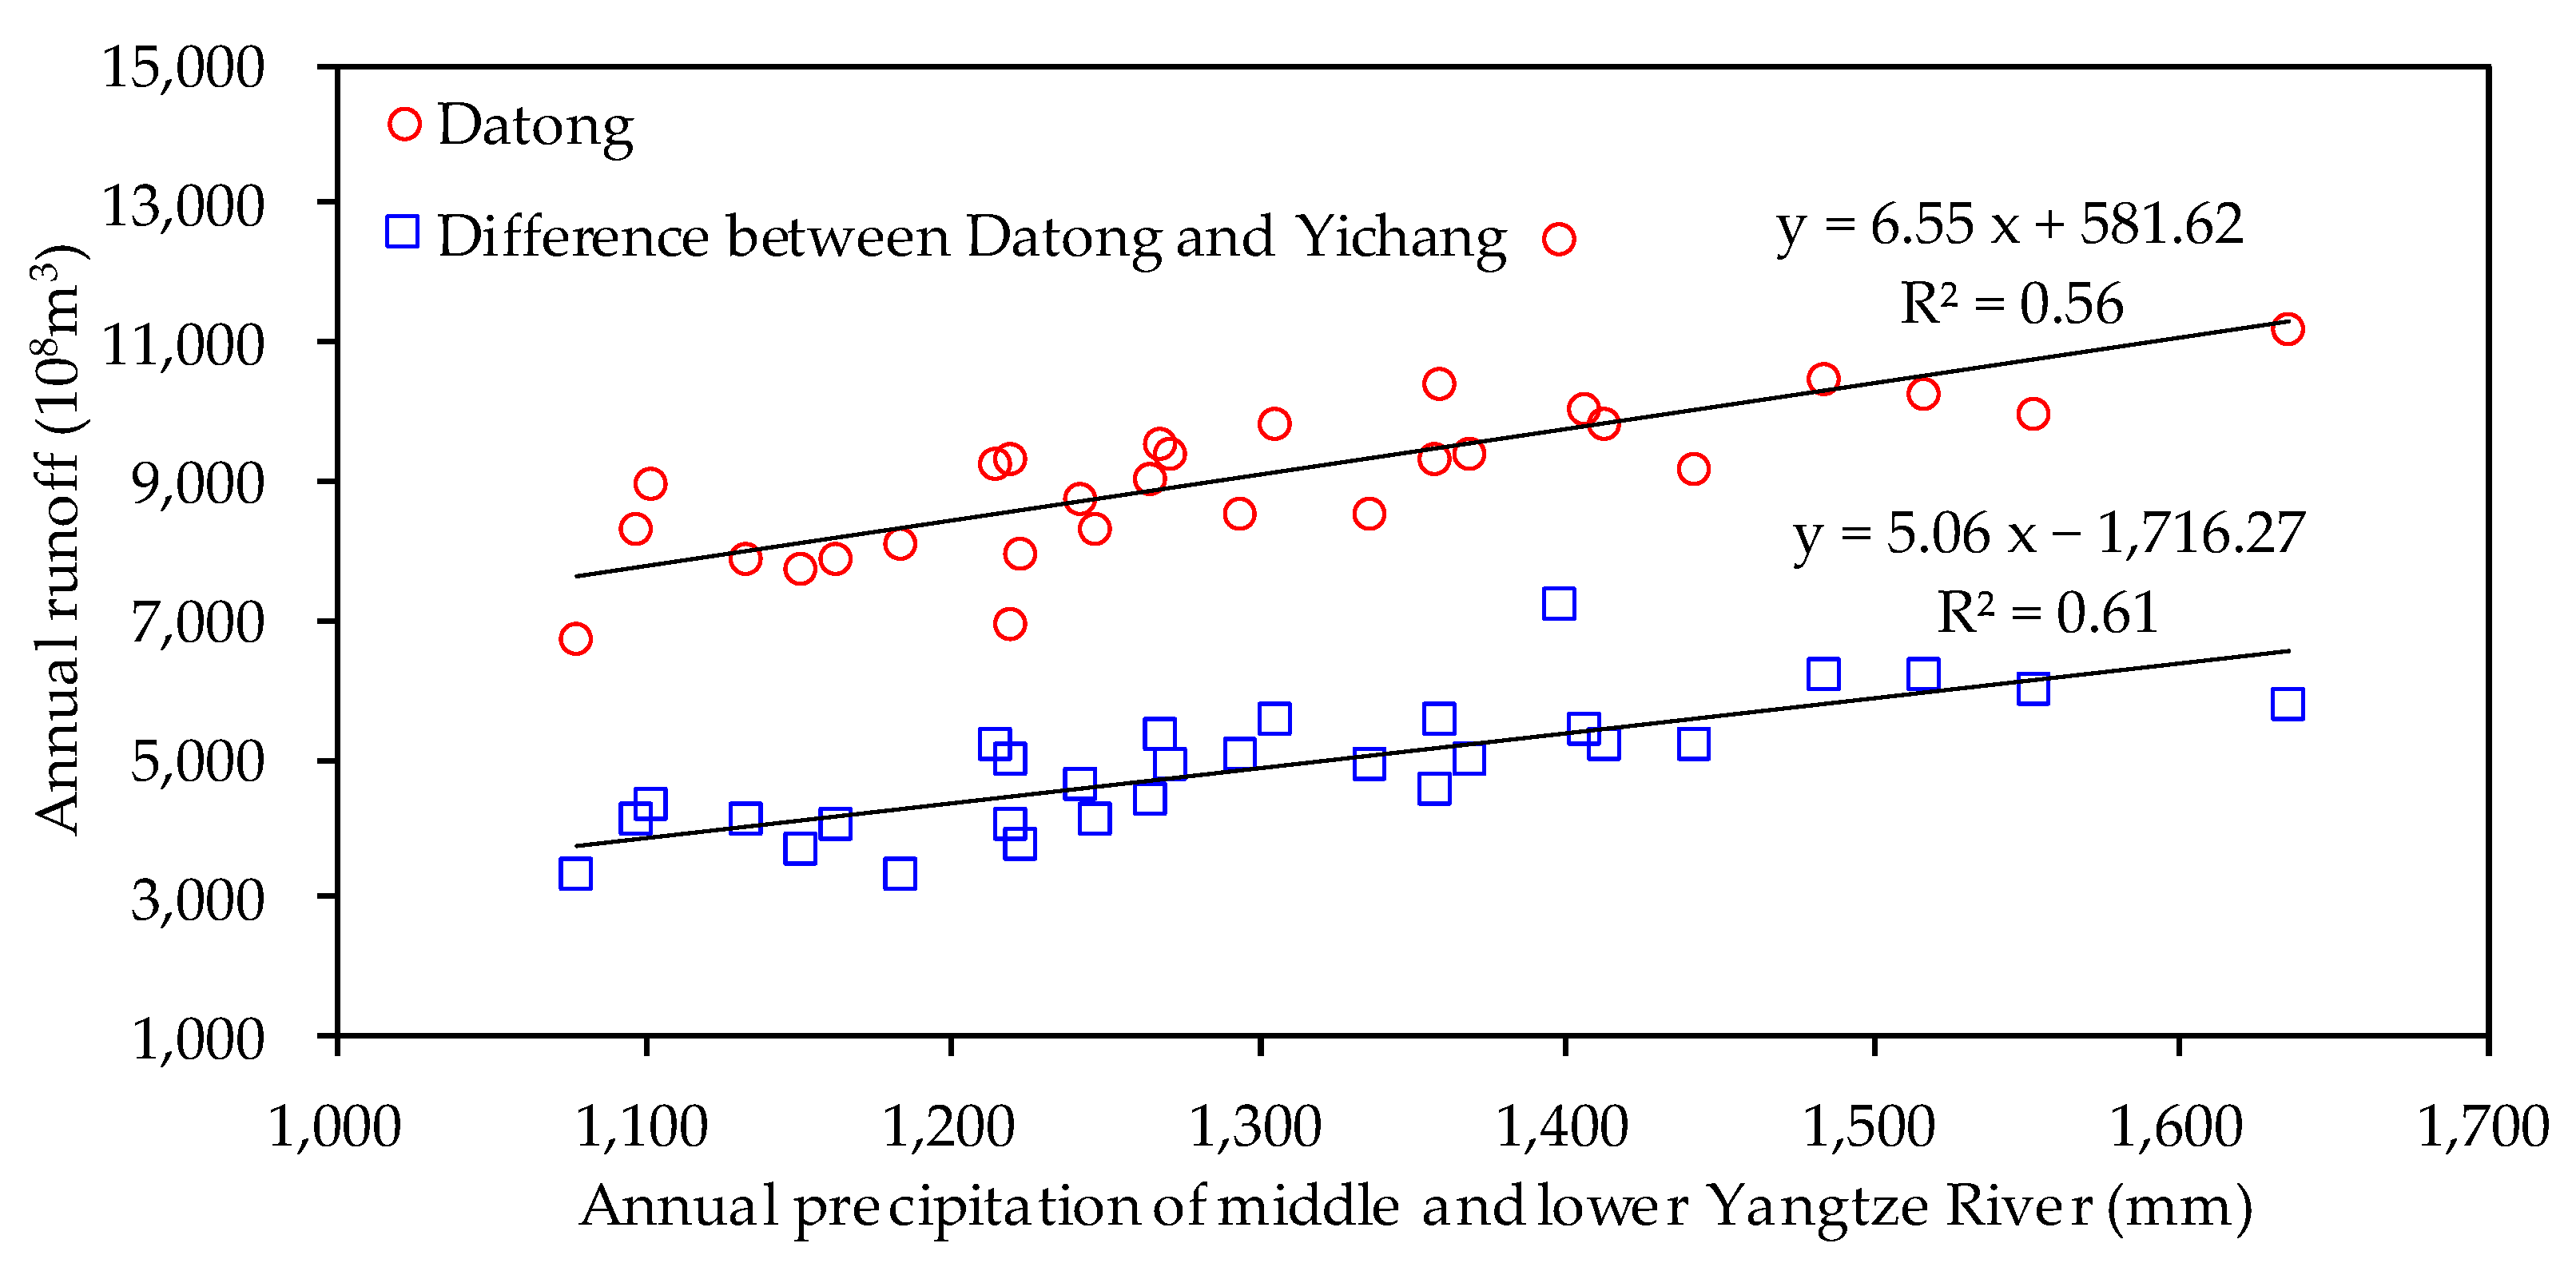
The long plum rain season and the frequent, intense, and overlapping rainstorms were the preconditions of the extreme flood. In 2020, according to the monitoring results of the China National Climate Center, the plum rain season in the Yangtze River basin started on June 1 and continued until 2 August. Compared with previous years, the plum rain season started earlier and ended later, with a duration of 62 days, which was 22 days longer than that of the normal year. Paralleled by 2015, it was the longest plum rain season in history since 1961. During this period, the precipitation reached 759.2 mm, second only to 1954, which directly led to abnormally high precipitation in the main stream of the middle and lower Yangtze River. The overall rainfall of the Yangtze River basin in June was 30.6% higher than the average over the past 30 years, being 88.5% and 75.7% higher in the middle and lower Yangtze River, respectively. It was also more than 20% higher in the other regions of the basin. In July, the rainfall increased further and was 55.4% higher than the multiyear average. Among them, rainfall in the mainstream areas of the middle and lower Yangtze River, as well as the Poyang Lake area, was more than twice, and rainfall in the other areas was more than 30% (see Figure 3). When the amount of rainfall was relatively large, the rainstorm process was also relatively frequent. The centers with heavy rain repeatedly appeared in the vicinity of Dongting Lake, the Poyang Lake water system, and the main stream of the middle and lower Yangtze River, with a high overlap of rainfall areas. Because the Yangtze River is a rain-flood river, heavy rainfall has become a precondition for flood formation. There was a significant correlation between rainfall and runoff (Figure 4).
3.2.2. Determination
In July, three floods occurred on the upper Yangtze River. After the peak-shaving operation, the outflow discharge of the Three Gorges Reservoir was limited to less than 40,000 m3/s. However, there have been a large number of tributary water systems flowing into the Yangtze River, such as the Dongting Lake, Han River, Hong Lake, and Chang Lake, which are distributed in the northeast of Hubei Province (Fuhuan, She, Dao, and Ju), Poyang Lake, Qingyi River, Shuiyang River, Chao Lake, and Chu River. In middle and late July, over-warning and over-safety guarantee floods occurred successively in these tributaries, and they repeatedly encountered the numbered floods of the main stream (as shown in Table 3), forming the extreme flood level near Nanjing. During the “No. 1 flood” period, the water system flood of Dongting Lake (Yuan River, Li River, Chang Lake) and Poyang Lake (Gan River, Xin River, Rao River, Xiu River) began to rise, forming an over-warning and over-safety guarantee flood, just meeting with the flood that occurred in the main Yangtze River before and after July 10. Subsequently, the “No. 2 flood”, which formed upstream, began to evolve downstream in mid-July. During this period, on the one hand, Dongting Lake and Poyang Lake continued to be in the state of warning water level flood, and on the other hand, the flood of Hong Lake and the rivers in the northeast of Hubei Province formed the over-warning water level flood. In particular, an over-safety guarantee water level flood also occurred in the Qingyi River and Shuiyang River, as well as in the Chaohu River system. In this stage, the interval inflow discharge between Datong and Nanjing reached 8600 m3/s on July 16, accounting for up to 10% of the daily average from Datong. From July 13 to 21, the interval inflow was 4.72 billion m3, accounting for 7.1% of Datong (Figure 2a). Affected by the flood effect of the pushing down in the upper and the jacking in the lower, the extreme flood level was determined at Nanjing and lasted for 5 days with a maximum of 0.25 m, exceeding the historical maximum highest tide level.
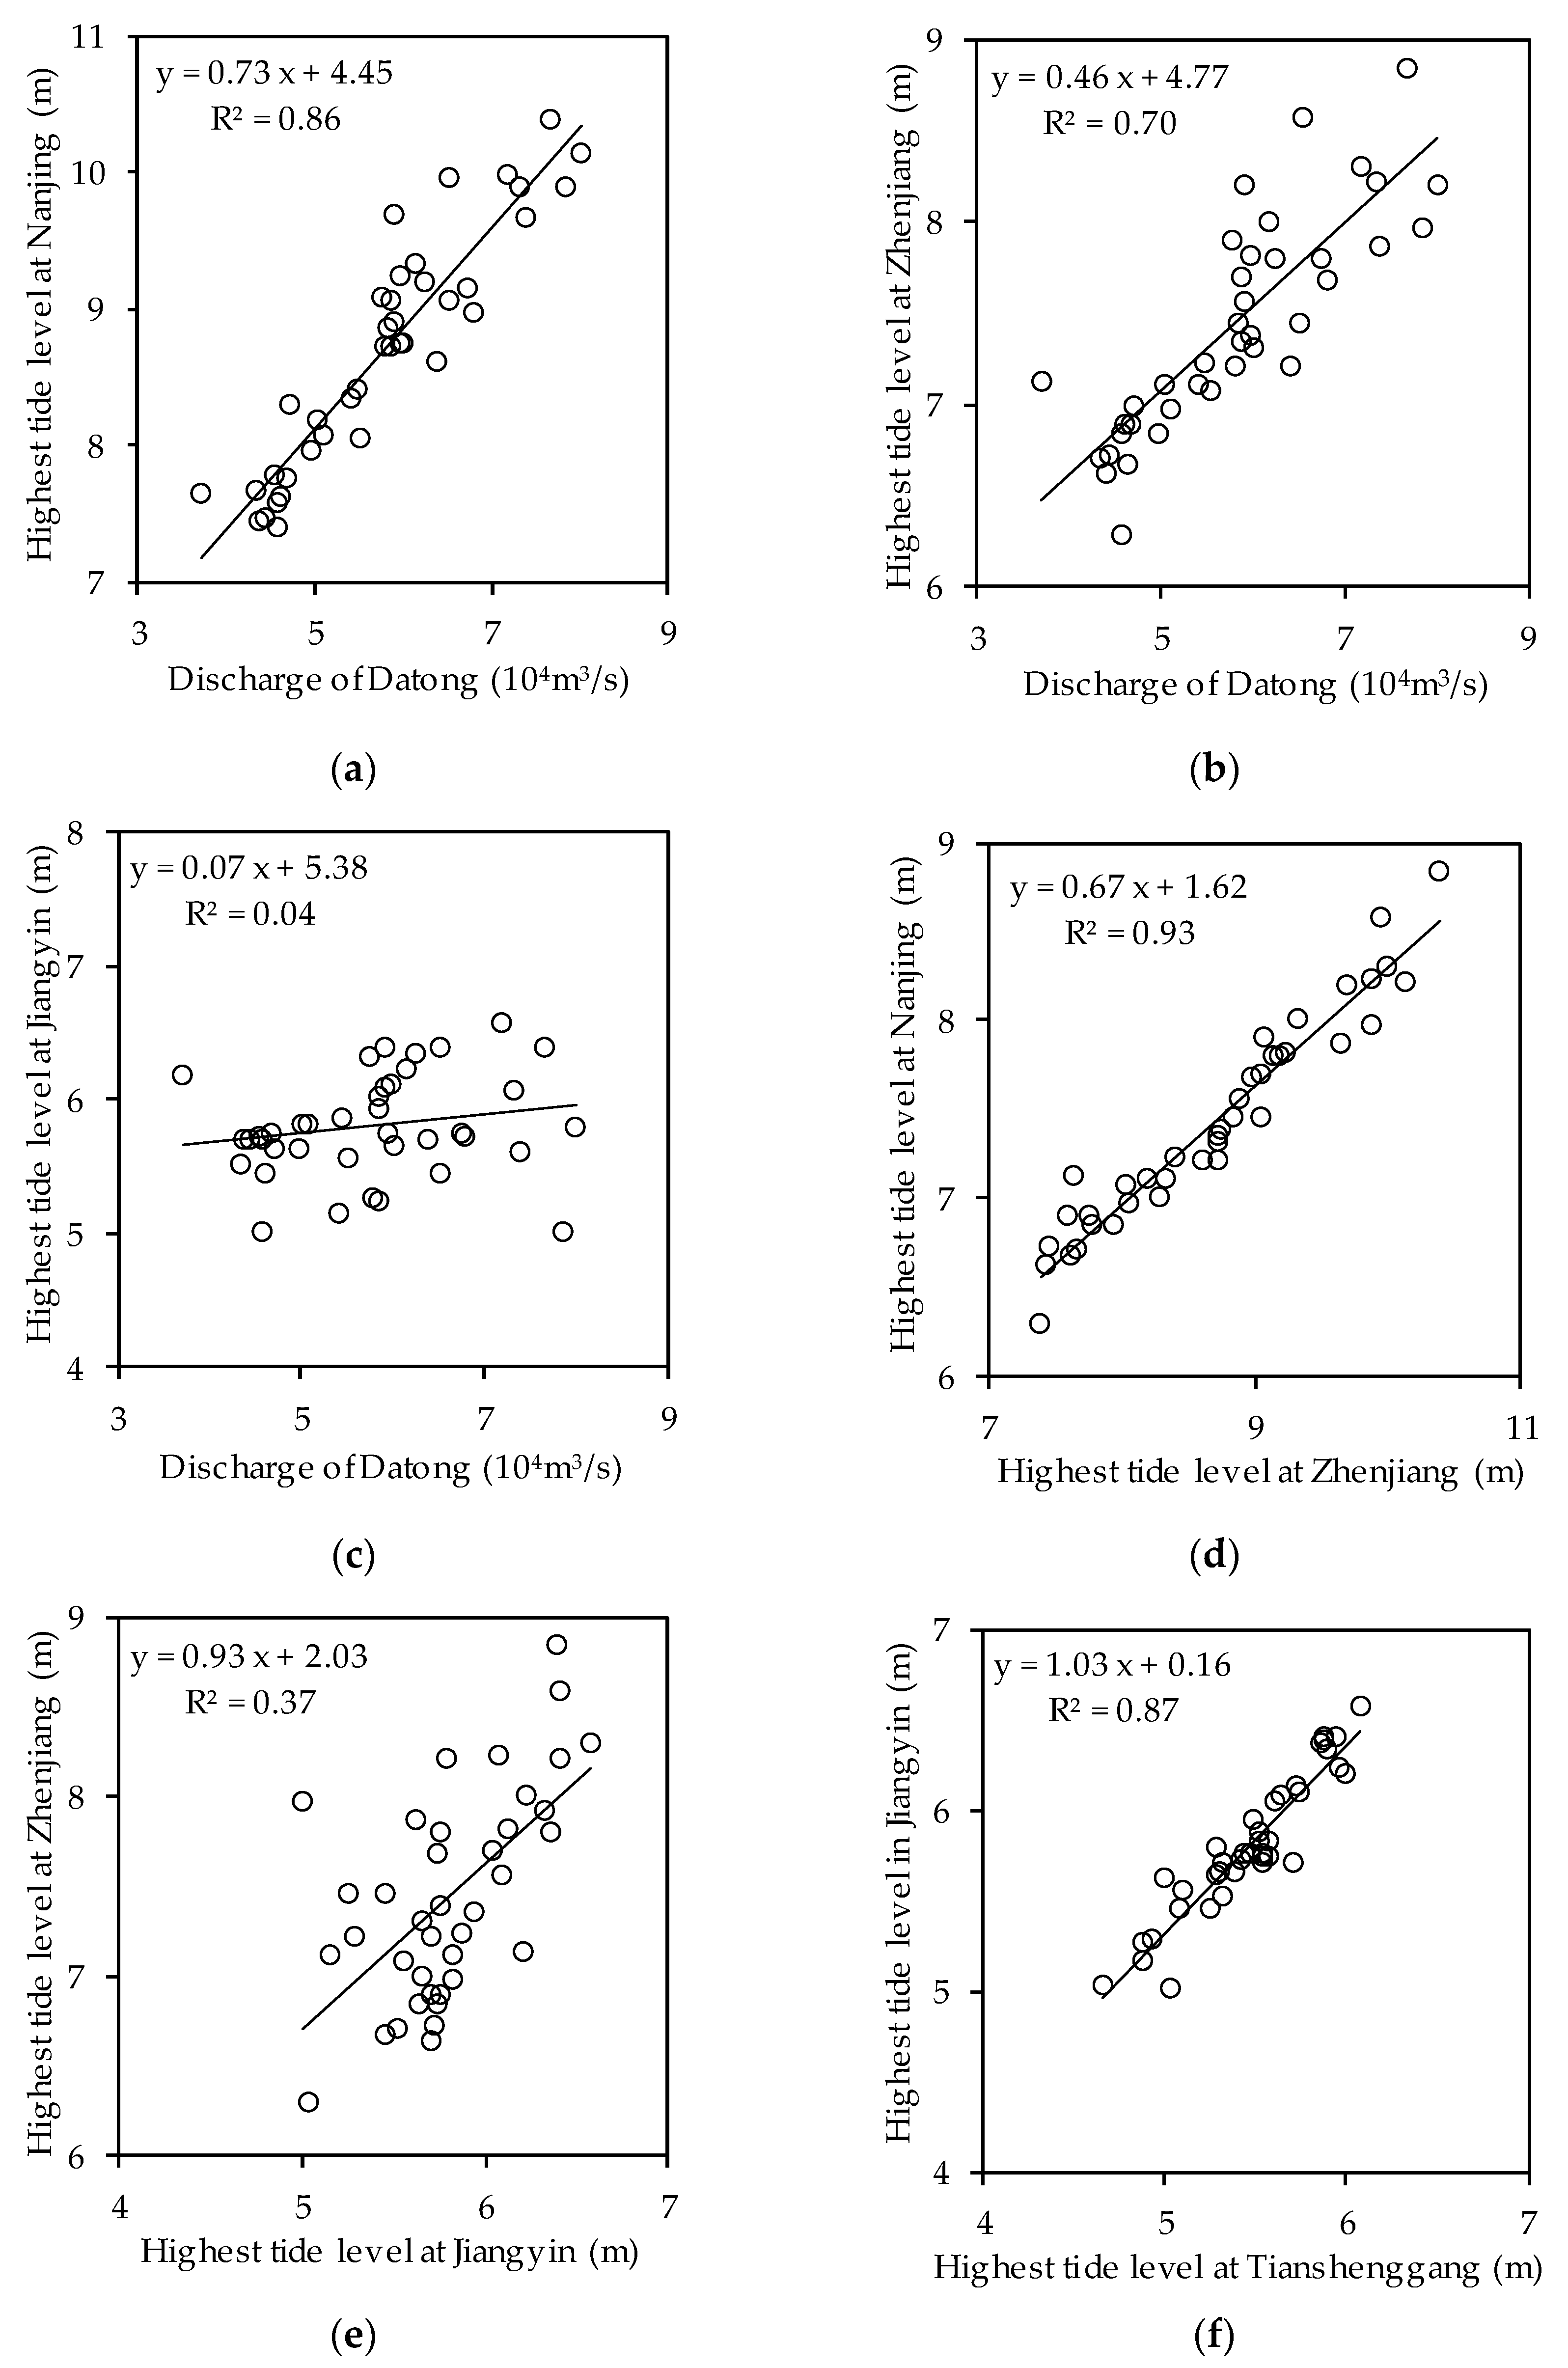
Although the extreme flood level was formed under the joint action of the income flow and jacking of the downstream water level, it is worth pointing out that there are still primary and secondary differences between the two. Figure 5 shows the relationship between the highest tide level and the daily income-averaged flow discharge of Datong on the same date, as well as the highest tide level in Jiangyin since 1980. There is a good linear correlation between the highest tide level and the income discharge for both Nanjing and Zhenjiang with an R2 = 0.70~0.86, as shown in Figure 5a,b, but relatively poor with Jiangyin in the lower reaches (Figure 5c). The correlation between the highest tide levels upstream and downstream was different for the different reaches. The tidal level correlation between Nanjing and Zhenjiang (Figure 5d), as well as between Jiangyin and Tianshenggang (Figure 5f), was significantly better than that between Zhenjiang and Jiangyin (Figure 5e). This may be because of two reasons. One is distance. The distance between Zhenjiang and Jiangyin was more than twice that of the other two. Therefore, due to the influence of tidal propagation, the influence of the downstream tidal level upstream may deteriorate with an increase in tidal propagation time. In addition, the closer to the estuary, the smaller the impact of runoff and the greater the impact of tides. This can be seen from the poor correlation between the Jiangyin tide level and Datong flow discharge, whereas Jiangyin and Tianshenggang near the estuary have a good correlation between tide levels. Overall, for the upstream, the impact of runoff on the tide level will be greater, which will change under the joint action of runoff and tide. The tide level will be more affected by the tide and will change under the guidance of the estuary tide for the reaches closer to the estuary.
3.2.3. Promotion
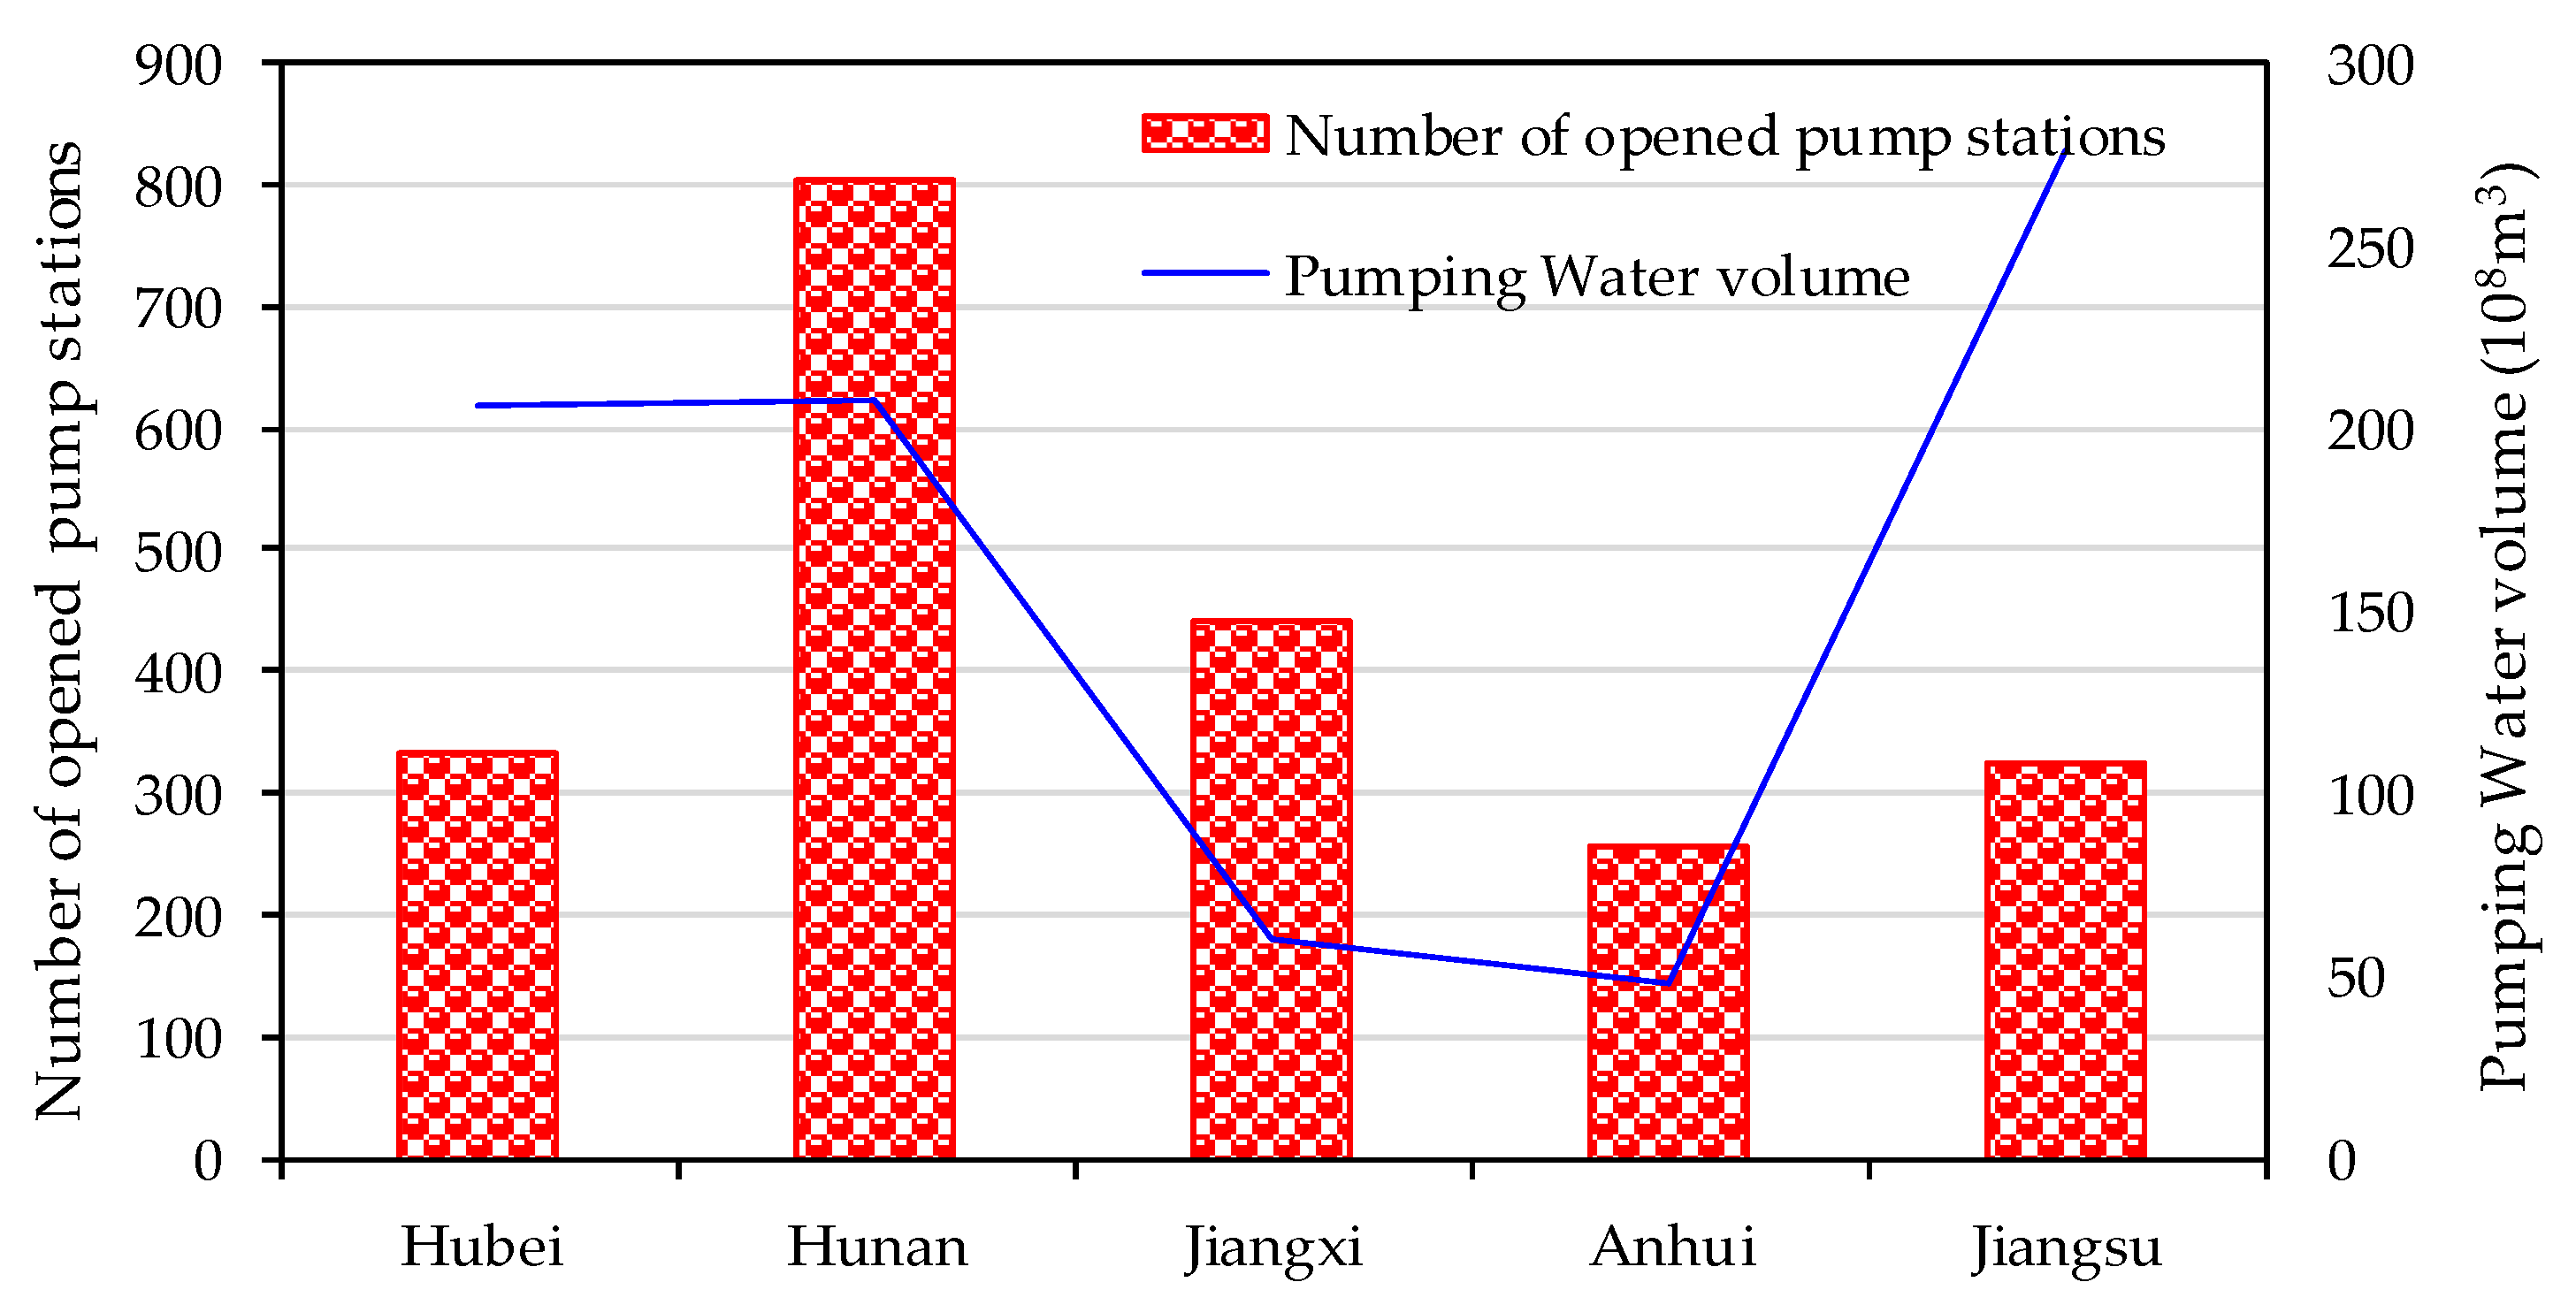
During periods of heavy rainfall, the logged water may directly enter the river channel through pumping. Considering Nanjing as an example, in 1999, the drainage capacity per square kilometer was only 1.03 m3/s. With the development of the social economy and the acceleration of urbanization, the drainage capacity along rivers (especially in cities) has been enhanced significantly. In 2020, the drainage modulus of the main urban area reached 3.16 m3/(s·km2) [48]. According to statistics reported by the Bureau of Hydrology, Changjiang Water Resources Commission, in the flood season of 2020, approximately 2160 river drainage pumping stations had been opened in the five provinces, including Hubei, Hunan, Jiangxi, Anhui, and Jiangsu, with a total drainage capacity of approximately 79.7 billion m3 (as shown in Figure 6). Among them, the total drainage volume of the four provinces, except Jiangsu Province, accounted for 6.7% of the total runoff of Datong from May to October, and the total drainage volume of Anhui and Jiangsu Province was 32.4 billion m3. The river length from Datong to Nanjing (experimental) accounted for approximately 48% of the total length from Anhui and Jiangsu, whose drainage volume was approximately 15.6 billion m3, accounting for 72.2%, which is the main source of the inflow runoff in this section. In 1998, the drainage volume was only 17.6 billion m3, which is significantly smaller than that in 2020. As a result, logged water in these areas played an important role in promoting extreme flood levels.
4. Discussion
Based on hydrological observation data, rainfall, drainage, and other data, the formation and causes of the 2020 extreme flood process are studied in detail by considering the lower Yangtze River as the object. This provides a clear stage division for the flooding process, and three reasons for this extreme flood level are pointed out. Previous studies have shown that rainfall caused by climate change is the main cause of record-breaking floods [49,50,51,52], and the composite effect of strong rainfall in local areas and extreme flow in the upstream and downstream regions have amplified the potential hazards of flooding [53]. These research results, focusing on the entire river basin, coincide with some of the results of this study. The more positive significance is to conduct a more detailed study on the formation in typical areas and to provide an explanation of the anomalous phenomenon, i.e., the historical record-breaking flood level with a flood peak less than the historical value.
The positive role played by the joint operation of cascade reservoirs having the Three Gorges Reservoir as the core of this flooding process is worth further discussion. The “No. 2 flood” can be taken as an example of the discussion. Affected by heavy rainfall, the inflow from the Jialing River and Wu River and the intermediate inflow of the Three Gorges Reservoir rapidly increased, being encountered in the middle of July 2020. At 10:00 on 17 July, the inflow discharge of the Three Gorges Reservoir increased to 50,000 m3/s and further reached 61,000 m3/s the next day. The outflow discharge of the Three Gorges Reservoir gradually increased from approximately 19,000 m3/s on 14 July. After the operation, the maximum outflow discharge was only approximately 40,000 m3/s, with a peak reduction rate of 46%. It can be inferred that the flow discharge at Datong Station would be increased by more than 20,000 m3/s, and exceed 90,000 m3/s on the basis of the measured 76,800 m3/s on 21 July without the peak cutting operation. This finding implies the occurrence of a record-breaking flood discharge, surpassing the measured maximum of 92,600 m3/s in 1954. According to the relationship between water level and discharge at Datong (Figure 7a) and the relationship between the highest tide level at Nanjing and Datong (Figure 7b), it would be very likely that an extreme flood level situation of 11.64 m above the safety guaranteed water level (10.60 m) would take place, which will cause a devastating flood disaster.
In 1998, the flood volume beyond the capacity of the river channel was absorbed through flood diversion of the detention basin or embankment collapse along the river, resulting in huge flood losses on both sides of the riverbank. In 2020, it was absorbed by the reservoirs in the basin. Their flood-control effect in Jiangsu Province was similar, but the cost was different. In the future, to cope with similar floods, it will be crucial to focus on the joint operation of cascade reservoirs in the upper Yangtze River [54,55,56].
It is worth pointing out that high tides have spring–neap cycles. Figure 8 shows the tide level process of the Liuxiao gauge in the estuary before and after the occurrence date of the historical extreme flood level in Nanjing. 21 July—when the historical extreme flood level occurred in Nanjing and Zhenjiang—is not the date and time when the spring tide occurred in the estuary. The spring tide occurred on 24 July in the estuary, which was the date when the extreme high tide level occurred at the Jiangyin and Tianshenggang gauges (as shown in Table 2), which are closer to the estuary. Therefore, if the occurrence date of the maximum runoff coincides with the occurrence date of the spring tide in the estuary, the flood level near the Nanjing reach, which is affected by both tides and runoff, may be higher than that measured in 2020. Simply calculated according to the tidal level difference between the two dates at the estuary, the highest flood level may reach 10.55 m, which is only 0.05 m from the safety-guaranteed water level at Nanjing.
5. Conclusions
- (1)
- The extreme flood process of 2020 in the lower Yangtze River followed six important stages: rising, bankfull, lasting, slow falling, continuous decline, and withdrawal. Although the peak discharge did not exceed the historical maximum value during this period, a record-breaking flood level occurred near Nanjing and lasted for five days.
- (2)
- The long duration of the plum rain season, frequent and high-intensity rainstorms, and high overlapping rainfall areas are preconditions for this phenomenon. Successive flood processes occurred in both the main and tributaries, as well as in the connected lake water systems, and their repeated encounters were explored. In addition, the intensive flood drainage of the cities and the jacking effect of the tide level in the lower reaches has also played a role in promoting flood drainage.
- (3)
- The flood detention and peak-shaving operations of cascade reservoirs having the Three Gorges Reservoir as the core play a very important role in controlling the water level in the lower Yangtze River. Otherwise, the flood level of Nanjing would exceed the safety-guaranteed water level, resulting in huge flood disasters. In the future, choosing to jointly operate the cascade reservoirs will be an important decision for comprehensive flood control measures in the Yangtze River basin.
Author Contributions
Conceptualization, H.G. and L.Z.; methodology, H.G.; formal analysis, H.G. and L.Z.; investigation, H.G.; resources, L.Z.; data curation, L.Z.; writing—original draft preparation, H.G.; writing—review and editing, L.Z.; visualization, H.G.; supervision, H.G.; project administration, H.G.; funding acquisition, H.G. All authors have read and agreed to the published version of the manuscript.
Funding
This research was funded by the Major Science and Technology Projects of the Ministry of Water Resources of China (grant number SKR-2022009), the National Science and Technology Support Program (grant number 2022YFC3202602), the Jiangsu Water Conservancy Science and Technology Project (grant number 2020001), the National Natural Science Foundation of China (grant numbers U2240224 and U2240206), and the Overall Planning Project for Succeeding Work of the Three Gorges Project (grant number CKSG2021257/HL).
Data Availability Statement
Not applicable.
Acknowledgments
This study was supported by the research and innovation team responsible for the river and lake protection and regulation in the middle and lower Yangtze River, led by Shiming Yao.
Conflicts of Interest
The authors declare no conflict of interest.
References
- Kundzewicz, Z.W.; Kanae, S.; Seneviratne, S.I.; Handmer, J.; Nicholls, N.; Peduzzi, P.; Mechler, R.; Bouwer, L.M.; Arnell, N.; Mach, K.; et al. Flood risk and climate change: Global and regional perspectives. Hydrol. Sci. J. 2014, 59, 1–28. [Google Scholar] [CrossRef] [Green Version]
- Manfreda, S.; Iacobellis, V.; Gioia, A.; Fiorentino, M.; Kochanek, K. The Impact of Climate on Hydrological Extremes. Water 2018, 10, 802. [Google Scholar] [CrossRef] [Green Version]
- Kundzewicz, Z.W.; Szwed, M.; Pinskwar, I. Climate Variability and Floods-A Global Review. Water 2019, 11, 1399. [Google Scholar] [CrossRef] [Green Version]
- Naschen, K.; Diekkruger, B.; Leemhuis, C.; Seregina, L.S.; van der Linden, R. Impact of Climate Change on Water Resources in the Kilombero Catchment in Tanzania. Water 2019, 11, 859. [Google Scholar] [CrossRef] [Green Version]
- Avila, A.; Guerrero, F.C.; Escobar, Y.C.; Justino, F. Recent Precipitation Trends and Floods in the Colombian Andes. Water 2019, 11, 379. [Google Scholar] [CrossRef] [Green Version]
- Eccles, R.; Zhang, H.; Hamilton, D. A review of the effects of climate change on riverine flooding in subtropical and tropical regions. J. Water Clim. Chang. 2019, 10, 687–707. [Google Scholar] [CrossRef] [Green Version]
- Hirabayashi, Y.; Alifu, H.; Yamazaki, D.; Imada, Y.; Shiogama, H.; Kimura, Y. Anthropogenic climate change has changed frequency of past flood during 2010–2013. Prog. Earth Planet. Sci. 2021, 8, 9. [Google Scholar] [CrossRef]
- Kundzewicz, Z.W.; Hirabayashi, Y.; Kanae, S. River Floods in the Changing Climate-Observations and Projections. Water Resour. Manag. 2010, 24, 2633–2646. [Google Scholar] [CrossRef]
- Markus, M.; Cai, X.M.; Sriver, R. Extreme Floods and Droughts under Future Climate Scenarios. Water 2019, 11, 1720. [Google Scholar] [CrossRef] [Green Version]
- Cabrera, J.S.; Lee, H.S. Impacts of Climate Change on Flood-Prone Areas in Davao Oriental, Philippines. Water 2018, 10, 893. [Google Scholar] [CrossRef] [Green Version]
- Wang, S.Y.; Najafi, M.R.; Cannon, A.J.; Khan, A.A. Uncertainties in Riverine and Coastal Flood Impacts under Climate Change. Water 2021, 13, 1774. [Google Scholar] [CrossRef]
- Koplin, N.; Schadler, B.; Viviroli, D.; Weingartner, R. Seasonality and magnitude of floods in Switzerland under future climate change. Hydrol. Process. 2014, 28, 2567–2578. [Google Scholar] [CrossRef]
- Ilbay-Yupa, M.; Ilbay, F.; Zubieta, R.; Garcia-Mora, M.; Chasi, P. Impacts of Climate Change on the Precipitation and Streamflow Regimes in Equatorial Regions: Guayas River Basin. Water 2021, 13, 3138. [Google Scholar] [CrossRef]
- Brown, P.; Daigneault, A.; Gawith, D. Climate change and the economic impacts of flooding on Fiji. Clim. Dev. 2017, 9, 493–504. [Google Scholar] [CrossRef]
- Lastrada, E.; Cobos, G.; Torrijo, F.J. Analysis of Climate Change’s Effect on Flood Risk. Case Study of Reinosa in the Ebro River Basin. Water 2020, 12, 1114. [Google Scholar] [CrossRef] [Green Version]
- Maghsood, F.F.; Moradi, H.; Bavani, A.R.M.; Panahi, M.; Berndtsson, R.; Hashemi, H. Climate Change Impact on Flood Frequency and Source Area in Northern Iran under CMIP5 Scenarios. Water 2019, 11, 273. [Google Scholar] [CrossRef] [Green Version]
- Han, H.; Kim, D.; Kim, H.S. Inundation Analysis of Coastal Urban Area under Climate Change Scenarios. Water 2022, 14, 1159. [Google Scholar] [CrossRef]
- Barbaro, G.; Bombino, G.; Foti, G.; Barilla, G.C.; Puntorieri, P.; Mancuso, P. Possible Increases in Floodable Areas Due to Climate Change: The Case Study of Calabria (Italy). Water 2022, 14, 2240. [Google Scholar] [CrossRef]
- Petpongpan, C.; Ekkawatpanit, C.; Visessri, S.; Kositgittiwong, D. Projection of Hydro-Climatic Extreme Events under Climate Change in Yom and Nan River Basins, Thailand. Water 2021, 13, 665. [Google Scholar] [CrossRef]
- Nguyen, T.T.; Nakatsugawa, M.; Yamada, T.J.; Hoshino, T. Flood Inundation Assessment in the Low-Lying River Basin Considering Extreme Rainfall Impacts and Topographic Vulnerability. Water 2021, 13, 896. [Google Scholar] [CrossRef]
- Cui, L.L.; He, M.R.; Zou, Z.B.; Yao, C.L.; Wang, S.P.; An, J.C.; Wang, X.L. The Influence of Climate Change on Droughts and Floods in the Yangtze River Basin from 2003 to 2020. Sensors 2022, 22, 8178. [Google Scholar] [CrossRef]
- Guo, Y.Q.; Huang, C.C.; Zhou, Y.L.; Pang, J.L.; Zha, X.C.; Zhou, L.; Mao, P.N. Extraordinary flood events and the response to monsoonal climatic change during the last 3000 years along the middle Yangtze River valley, China. Paleogeogr. Paleoclimatol. Paleoecol. 2016, 462, 70–84. [Google Scholar] [CrossRef] [Green Version]
- Yang, Y.D.; Xu, Z.R.; Zheng, W.W.; Wang, S.H.; Kang, Y.B. Rain Belt and Flood Peak: A Study of the Extreme Precipitation Event in the Yangtze River Basin in 1849. Water 2021, 13, 2677. [Google Scholar] [CrossRef]
- Qu, B.; Lv, A.F.; Jia, S.F.; Zhu, W.B. Daily Precipitation Changes over Large River Basins in China, 1960–2013. Water 2016, 8, 185. [Google Scholar] [CrossRef] [Green Version]
- Zhang, Z.X.; Zhang, Q.; Jiang, T. Changing features of extreme precipitation in the Yangtze River Basin during 1961–2002. J. Geogr. Sci. 2007, 17, 33–42. [Google Scholar] [CrossRef]
- Chen, Q.H.; Chen, H.; Wang, J.X.; Zhao, Y.; Chen, J.; Xu, C.Y. Impacts of Climate Change and Land-Use Change on Hydrological Extremes in the Jinsha River Basin. Water 2019, 11, 1398. [Google Scholar] [CrossRef] [Green Version]
- Han, L.F.; Xu, Y.P.; Pan, G.B.; Deng, X.J.; Hu, C.S.; Xu, H.L.; Shi, H.Y. Changing properties of precipitation extremes in the urban areas, Yangtze River Delta, China, during 1957–2013. Nat. Hazards 2015, 79, 437–454. [Google Scholar] [CrossRef]
- Bai, S.Y.; Gao, J.X.; Xue, Y.; Mansour, R. Spatial and Temporal Characteristics of Rainfall Anomalies in 1961-2010 in the Yangtze River Basin, China. Atmosphere 2021, 12, 960. [Google Scholar] [CrossRef]
- Wang, Q.; Xu, Y.P.; Wang, J.; Lin, Z.X.; Dai, X.Y.; Hu, Z.L. Assessing sub-daily rainstorm variability and its effects on flood processes in the Yangtze River Delta region. Hydrol. Sci. J. 2019, 64, 1972–1981. [Google Scholar] [CrossRef]
- Chuan, C.Y.; Jun, L.H. An analysis of the variation of maximum flood stage of Lower Yangtze River. J. Hydraul. Res. 2003, 41, 235–238. [Google Scholar] [CrossRef]
- Fang, J.; Kong, F.; Fang, J.Y.; Zhao, L. Observed changes in hydrological extremes and flood disaster in Yangtze River Basin: Spatial-temporal variability and climate change impacts. Nat. Hazards 2018, 93, 89–107. [Google Scholar] [CrossRef]
- He, Y.X.; Wang, Q.; Xu, Y.P.; Li, Z.Y.; Yuan, J.; Lu, M.; Lin, Z.X. Climate change increased the compound extreme precipitation-flood events in a representative watershed of the Yangtze River Delta, China. Stoch. Environ. Res. Risk Assess. 2022, 36, 3803–3818. [Google Scholar] [CrossRef]
- Zhang, C.; Sun, F.Y.; Sharma, S.; Zeng, P.; Mejia, A.; Lyu, Y.; Gao, J.; Zhou, R.; Che, Y. Projecting multi-attribute flood regime changes for the Yangtze River Basin. J. Hydrol. 2023, 617, 15. [Google Scholar] [CrossRef]
- Gu, H.H.; Yu, Z.B.; Wang, G.L.; Wang, J.G.; Ju, Q.; Yang, C.G.; Fan, C.H. Impact of climate change on hydrological extremes in the Yangtze River Basin, China. Stoch. Environ. Res. Risk Assess. 2015, 29, 693–707. [Google Scholar] [CrossRef]
- Ju, Q.; Yu, Z.B.; Hao, Z.C.; Ou, G.X.; Wu, Z.Y.; Yang, C.G.; Gu, H.H. Response of Hydrologic Processes to Future Climate Changes in the Yangtze River Basin. J. Hydrol. Eng. 2014, 19, 211–222. [Google Scholar] [CrossRef]
- Yin, L.R.; Wang, L.; Keim, B.D.; Konsoer, K.; Zheng, W.F. Wavelet Analysis of Dam Injection and Discharge in Three Gorges Dam and Reservoir with Precipitation and River Discharge. Water 2022, 14, 567. [Google Scholar] [CrossRef]
- Zhang, X.; Feng, B.F.; Zhang, J.; Xu, Y.S.; Li, J.; Niu, W.J.; Yang, Y.F. The Detection of Flood Characteristics Alteration Induced by the Danjiangkou Reservoir at Han River, China. Water 2021, 13, 496. [Google Scholar] [CrossRef]
- Men, B.H.; Liu, H.L.; Tian, W.; Wu, Z.J.; Hui, J. The Impact of Reservoirs on Runoff Under Climate Change: A Case of Nierji Reservoir in China. Water 2019, 11, 1005. [Google Scholar] [CrossRef] [Green Version]
- Gao, Y.J.; Zhang, Y.Q. Effects of the Three Gorges Project on Runoff and Related Benefits of the Key Regions along Main Branches of the Yangtze River. Water 2019, 11, 269. [Google Scholar] [CrossRef] [Green Version]
- Zha, G.; Zhou, J.Z.; Yang, X.; Fang, W.; Dai, L.; Wang, Q.N.; Ding, X.L. Modeling and Solving of Joint Flood Control Operation of Large-Scale Reservoirs: A Case Study in the Middle and Upper Yangtze River in China. Water 2021, 13, 41. [Google Scholar] [CrossRef]
- Chen, M. Characteristics and enlightenment of rainstorm and flood in Yangtze River in 2020. Yangtze River 2020, 51, 76–81. [Google Scholar] [CrossRef]
- Yao, S.; Guo, X.; Chen, D.; Liu, X. Analysis of the flood process and characteristics in the middle and lower reaches of the Yangtze River during the 2020 flood season. China Flood Drought Manag. 2021, 31, 5–10. [Google Scholar] [CrossRef]
- Bing, J.; Deng, P.; Xu, G.; Jia, J. Analysis on characteristics and causes of high flood level in middle and lower reaches of Yangtze River of 2020. EWRHI 2021, 42, 10–16. [Google Scholar] [CrossRef]
- Huang, Y. Practice and reflections on joint operation scheme of water projects of Changjiang River Basin: Flood control and water projects operation in 2020 flood. Yangtze River 2020, 51, 116–128+134. [Google Scholar] [CrossRef]
- Feng, B.; Xu, Y.; Chen, G. Flood control benefit of reservoir group in Changjiang River flood, 2020. Yangtze River 2020, 51, 88–93. [Google Scholar] [CrossRef]
- Ma, J. Practice and reflection on flood control and disaster mitigation in Changjiang River Basin in 2020. Yangtze River 2020, 51, 1–7. [Google Scholar] [CrossRef]
- Xu, J.; Song, L.; Wang, Y.; Yuan, J.; Chen, S. Enlightenment of Changjiang River flood in 2020 and suggestions for technology support. Yangtze River 2020, 51, 179–184. [Google Scholar] [CrossRef]
- Chen, L. Flood Control and Waterlogging Engineering of Urban District in Nanjing City. Urban Roads Bridges Flood Control 2003, 9–10+15. [Google Scholar] [CrossRef]
- Yin, X.X.; Zhou, L.T.; Liu, K.; Han, Y.Q.; Du, Z.Y. Record-breaking flood over the Yangtze River in early summer 2020: Role of the north Indian Ocean and north tropical Atlantic SST. Theor. Appl. Climatol. 2022, 150, 1173–1186. [Google Scholar] [CrossRef]
- Zhang, L.X.; Zhao, D.; Zhou, T.J.; Peng, D.D.; Xiao, C. Moisture Origins and Transport Processes for the 2020 Yangtze River Valley Record-Breaking Mei-yu Rainfall. Adv. Atmos. Sci. 2021, 38, 2125–2136. [Google Scholar] [CrossRef]
- Tang, S.L.; Luo, J.J.; He, J.Y.; Wu, J.Y.; Zhou, Y.; Ying, W.S. Toward Understanding the Extreme Floods over Yangtze River Valley in June–July 2020: Role of Tropical Oceans. Adv. Atmos. Sci. 2021, 38, 2023–2039. [Google Scholar] [CrossRef]
- Pan, X.; Li, T.; Sun, Y.; Zhu, Z.W. Cause of Extreme Heavy and Persistent Rainfall over Yangtze River in Summer 2020. Adv. Atmos. Sci. 2021, 38, 1994–2009. [Google Scholar] [CrossRef]
- Tao, K.; Fang, J.; Yang, W.T.; Fang, J.Y.; Liu, B.Y. Characterizing compound floods from heavy rainfall and upstream-downstream extreme flow in middle Yangtze River from 1980 to 2020. Nat. Hazards 2022, 18, 1–18. [Google Scholar] [CrossRef]
- Xiong, L.H.; Jiang, C.; Guo, S.L.; Li, S.; Li, R.R.; Li, W.B. Multivariate Dam-Site Flood Frequency Analysis of the Three Gorges Reservoir Considering Future Reservoir Regulation and Precipitation. Water 2022, 14, 138. [Google Scholar] [CrossRef]
- Xia, J.; Chen, J. A new era of flood control strategies from the perspective of managing the 2020 Yangtze River flood. Sci. China-Earth Sci. 2021, 64, 1–9. [Google Scholar] [CrossRef]
- Jing, Z.; Zhang, R.Q.; Bao, H.X.; Zhang, S.H. Joint flood control scheduling strategy of large cascade reservoirs: A case study of the cascade reservoirs in the upper reaches of the Yangtze River in China. J. Flood Risk Manag. 2022, 13, e12802. [Google Scholar] [CrossRef]
Figure 1.
The geographical location and river regime of the study area: (a) the Yangtze River basin; (b) the study reaches from Datong to the estuary in the lower Yangtze River.
Figure 1.
The geographical location and river regime of the study area: (a) the Yangtze River basin; (b) the study reaches from Datong to the estuary in the lower Yangtze River.

Figure 2.
Flood process below Datong: (a) flood discharge; (b) high tide level.

Figure 3.
Precipitation in typical areas of the Yangtze River Basin during the plum rain season of 2020.
Figure 3.
Precipitation in typical areas of the Yangtze River Basin during the plum rain season of 2020.

Figure 4.
Relationship between the precipitation and runoff since 1990.

Figure 5.
Relationship between the highest tide level, income flow discharge, and the downstream highest tide level: (a) highest tide level at Nanjing and discharge of Datong; (b) highest tide level at Zhenjiang and discharge of Datong; (c) highest tide level at Jiangyin and discharge of Datong; (d) highest tide level at Nanjing and Zhenjiang; (e) highest tide level at Zhenjiang and Jiangyin; (f) highest tide level at Jiangyin and Tianshenggang.

Figure 6.
Flood drainage of the middle and lower Yangtze River in the 2020 flood season.

Figure 7.
Analysis of maximum flood level without reservoir regulation. (a) Relationship between water level and discharge at Datong; (b) relationship of highest tide level between Nanjing and Datong.
Figure 7.
Analysis of maximum flood level without reservoir regulation. (a) Relationship between water level and discharge at Datong; (b) relationship of highest tide level between Nanjing and Datong.

Figure 8.
Tidal level process of Liuxiao gauge around the occurrence date of the extreme flood level at Nanjing.
Figure 8.
Tidal level process of Liuxiao gauge around the occurrence date of the extreme flood level at Nanjing.


Table 1.
Warning and safety guarantee water level in middle and lower Yangtze River.
| Type | Water Level (m) | |||||||
|---|---|---|---|---|---|---|---|---|
| Yichang | Chenglingji | Wuhan | Jiujiang | Hukou | Datong | Maanshan | Nanjing | |
| warning | 53.00 | 32.50 | 27.30 | 20.00 | 19.50 | 14.40 | 10.00 | 8.70 |
| safety guarantee | 55.73 | 34.40 | 29.73 | 23.25 | 22.50 | 17.10 | 11.95 | 10.60 |
Table 2.
Highest water (tide) level at different stations (gauges) and the date of occurrence in typical flood years since the 1980s.
Table 2.
Highest water (tide) level at different stations (gauges) and the date of occurrence in typical flood years since the 1980s.
| Year | Item | Datong | Nanjing | Zhenjiang | Jiangyin | Tianshenggang |
|---|---|---|---|---|---|---|
| 1954 | Value (m) | 16.64 | / * | |||
| Date | August 1 | |||||
| 1983 | Value (m) | 15.70 | 9.99 | 8.30 | 6.57 | 6.07 |
| Date | 13 July | 13 July | 13 July | 13 July | 13 July | |
| 1998 | Value (m) | 16.32 | 10.14 | 8.37 | 6.43 | 6.01 |
| Date | 2 August | 29 July | 24 August | 26 July | 26 July | |
| 2020 | Value (m) | 16.24 | 10.39 | 8.84 | 6.52 | 6.00 |
| Date | 13 July | 21 July | 21 July | 24 July | 24 July | |
Note: * Observations began in the 1980s.
Table 3.
Statistics of the over-warning and over-safety guarantee water level in 2020.
| Tributary Drainage System | Maximum Water Level (m) | Type | Occurrence Date | |
|---|---|---|---|---|
| Dongting Lake | Zi River | 41.35 | OW * | 27 July |
| Yuan River | 43.50 | OW | 9 July | |
| Li River | 58.93 | OW | 7 July | |
| Outlet | 34.74 | OG * | 28 July | |
| Hong Lake | 27.20 | OG | 21 July | |
| Chang Lake | 33.57 | OG | 12 July | |
| Rivers distributed in the northeast of Hubei Province | Fuhuan Lake | 30.03 | OG | 20 July |
| She River | 28.66 | OW | 19 July | |
| Dao River | 28.96 | OW | 19 July | |
| Ju River | 30.88 | OW | 19 July | |
| Poyang Lake | Gan River | 24.76 | OW | 11 July |
| Xin River | 27.66 | OW | 10 July | |
| Outlet | 22.49 | OW | 12 July | |
| Qingyi River | 16.84 | OG | 15 July | |
| Shuiyang River | 13.70 | OG | 11 July | |
| Chao Lake | Fengle River | 18.66 | OG | 20 July |
| Lake | 13.43 | OG | 22 July | |
| Xi River | 12.87 | OG | 19 July | |
| Chu River | 10.06 | OG | 20 July | |
Notes: * “OW” refers to over-warning water level and “OG” refers to over-safety guarantee water level.
Disclaimer/Publisher’s Note: The statements, opinions and data contained in all publications are solely those of the individual author(s) and contributor(s) and not of MDPI and/or the editor(s). MDPI and/or the editor(s) disclaim responsibility for any injury to people or property resulting from any ideas, methods, instructions or products referred to in the content. |
© 2023 by the authors. Licensee MDPI, Basel, Switzerland. This article is an open access article distributed under the terms and conditions of the Creative Commons Attribution (CC BY) license (https://creativecommons.org/licenses/by/4.0/).
Share and Cite
MDPI and ACS Style
Ge, H.; Zhu, L. Extreme Flood Levels during the Operation of Cascade Reservoirs: A Case Study of the Lower Yangtze River in 2020. Water 2023, 15, 851. https://doi.org/10.3390/w15050851
AMA Style
Ge H, Zhu L. Extreme Flood Levels during the Operation of Cascade Reservoirs: A Case Study of the Lower Yangtze River in 2020. Water. 2023; 15(5):851. https://doi.org/10.3390/w15050851
Chicago/Turabian StyleGe, Hua, and Lingling Zhu. 2023. "Extreme Flood Levels during the Operation of Cascade Reservoirs: A Case Study of the Lower Yangtze River in 2020" Water 15, no. 5: 851. https://doi.org/10.3390/w15050851
Note that from the first issue of 2016, this journal uses article numbers instead of page numbers. See further details here.