Article

Application of Response Surface Methodology to Optimize Coagulation Treatment Process of Urban Drinking Water Using Polyaluminium Chloride

1
College of Environmental Science and Engineering, Tongji University, Shanghai 200092, China
2
Shanghai Pudong Water Group, Shanghai 201300, China
3
Key Laboratory of Water Supply, Water Saving and Water Environment Treatment for Towns in the Yangtze River Delta, Ministry of Water Resources, Shanghai 200092, China
*
Author to whom correspondence should be addressed.
Water 2023, 15(5), 853; https://doi.org/10.3390/w15050853
Submission received: 19 December 2022 / Revised: 15 February 2023 / Accepted: 20 February 2023 / Published: 22 February 2023
(This article belongs to the Special Issue Drinking Water: Water Quality and Treatment)

Abstract

:
Many coagulants such as aluminium sulfate, ferric sulfate, and ferrous sulfate have been investigated in the past, but there is a lack of data on their effectiveness to some specific water quality parameters. This study aimed at investigating the efficiency of the coagulation water treatment process to remove pollutants such as total organic carbon (TOC), total nitrogen (TN), and total suspended solids (TSS) from urban drinking water. The polyaluminium chloride (PAC) coagulant was applied to determine the impact of the treatment process on the structure and diversity of these pollutants in urban drinking water. All water samples were collected from the Yangtze River, Baoshan district, Shanghai, China, over a period of three months which coincided with the late summer and early winter periods. Specific to different coagulant characterizations, a preliminary test was performed with three other coagulants, namely, aluminium sulfate, polyaluminium, silicate sulfate, and ferric sulfate to determine their optimal conditions for floc characterization and removal efficiencies. In summary, the overall performance of the PAC coagulant was better than that of the other three coagulants used in the pre-treatment of the sampled water. The obtained results revealed that under the optimum operating conditions, the doses of the PAC were as follows: 20, 35, 50, 65, and 80 mgL−1, respectively. The water temperature and pH were determined by using a pH meter, the TOC and TN determined by using a TOC analyzer, and the TSS by following the ASTM D2540 method. Furthermore, the response surface methodology by the Box–Behnken optimization analysis was applied to coagulant dosage, temperature, pH, and three corresponding dependent factors (TSS, TOC, and TN) to determine the best optimal conditions for the PAC performance. To determine whether or not the quadratic model adequately explained and predicted the response during the coagulation process, an analysis of variance was performed. Multiple optimal factors were identified for the urban drinking water treatment, including a pH value of 6.9, water temperature of 20.1 °C, and a coagulant dosage of 9.7 mgL−1.

1. Introduction

The water environment of developing nations such as China over the years has been polluted as the country has chased rapid economic growth, with little consideration given to the environmental threats of unregulated growth to the country’s water quality. Despite the Chinese government’s strict measures to control their water resources, their rivers continue to be addressed in terms of water pollution. The Yangtze River has a strong water intake rate and has played an essential part in Chinese history, society, and most significantly the economy. Nevertheless, it is one of Asia’s 29 main river systems that are highly polluted [1]. The river is China’s primary source of urban drinking water, and also used for irrigation, transportation, manufacturing, tourism [2], etc.; furthermore, it supports more than one-fifth of the country’s population [3]. China’s environmental science group conducted comprehensive research on the occurrence, causes, and dangers of non-point sources’ pollution in water bodies; the research culminated in the discovery of several pollutants using multiple adapted mass balance methods [4,5].
Non-point source pollutants such as nitrogen were estimated to be as high as 80% in most Chinese rivers [4]. According to the Chinese national quality standards for surface water with respect to the high percentage of nitrogen in these water bodies, the river’s water can only be used for industrial, agricultural, and landscaping purposes [6]. Ammonia, nitrite, nitrate, and organically bonded nitrogen are all constituents of nitrogen, but total nitrogen (TN) accounts for all of them. Water eutrophication brought on by TN pollution is a major ecological disruptor responsible for issues such as toxic algal blooms, oxygen depletion, and biodiversity loss [6]. Furthermore, total suspended solids (TSS), which are important carriers of pollutants [7] such as total organic carbon (TOC) were also found in the water bodies. The deposition of TSS in a water system can have a significant effect on the ecotoxic effects of the aquatic ecosystem. It can be used to estimate how far the water bodies have lost their purity as the result of runoff and suspended particulate matter. On the other hand, TOC measures the number of organic particles or pollutants present in water, regardless of how clean it is. It is a quantitative method for determining whether water is safe to drink or use for other purposes. To overcome these challenges, different applications of water treatment processes are used to supply urban populations with safe drinking water. The methods employed are often dependent on the source water’s quality, the level of water pollution, and the applicable requirements for protecting the public’s health. Hence, selecting a low-cost, efficient treatment method has become essential for sustainability in the urban drinking water sector.
Coagulation is a method of treating water that has been vital to the production of potable water for decades [8]. This method is frequently utilized in urban drinking water treatment systems across the world because it is an effective chemical treatment technique for urban water [9,10]. The methods employed mostly are physicochemical adsorption [11], reverse osmosis [12], nanofiltration [13], chemical treatment combined with filtration [14], etc. Its wide range of applications in water treatment processes is a result of its effectiveness and ease of use. Using this process, numerous experiments have been conducted to maximize the removal of pollutants [15] such as TSS, TN, TOC, natural organic matter, etc. This process could account for approximately 90% of the removal of pollutants in raw water [16]. Even so, the treatment factors such as coagulant dosage [17], temperature, and pH [18,19] influence its performance. To improve the effectiveness of the treatment process, these parameters must be improved. In most cases, to achieve optimal conditions, the conventional experimental approach known as one parameter at a time [9] by controlling pH and coagulant dosage to minimize the turbidity response [10]. However, the various impacts of coagulant dosage, temperature, and pH usually prevent the coagulation process from determining the link between multiple variables. As a result, the coagulation performance is frequently suboptimal because of various constraints associated with full-scale operation and water quality variations [19]. Other water characteristics, more than only turbidity removal, can be addressed to improve coagulation. The development and application of these approaches necessitate an increase in the number of key parameters (factors and responses) considered in the process. Some modeling tools can be used for this purpose [10] with respect to coagulant(s) with better performance.
Coagulants, which are hydrolyzing metal salts (Fe or Al), are often used in the coagulation process to destabilize colloids. To date, coagulants have been the subject of much study and development with the goal of creating a safer environment, having high stability, and more adaptable formulations that can withstand a wide range of processing conditions without compromising coagulation efficiency [20]. During water treatment processes, conventional coagulants such as iron and aluminium sulfate are typically used to stimulate particle formation. Alum has been used as a coagulant for a long time, but it has some limitations, including a narrow pH range (6.5 to 8.0) and the development of substantial amounts of aluminium residue during post-treatment [21]. Because of these challenges with alum, better aluminium-based polymers such as polyaluminium chloride (PAC), produced by the gradual titration of a base to aluminium salts, have been widely used in the last few decades to treat urban water because (i) they work well at lower doses, (ii) they have outstanding coagulation and sedimentation properties [22], and (iii) they have a wider pH and temperature range [21,23]. However, their chemistry and aggregation properties are not as well known, and specific information on using polyaluminium coagulants remains a viable approach [22].
For this study, response surface methodology (RSM), a technique based on mathematical statistical approaches, was further employed to optimize the multivariate response in the coagulation process. With the objective of optimizing the experimental parameters, obtaining the optimum conditions with a highlight on RSM is a useful design. The RSM can define the relationship between process-operating factors and evaluate their impacts to achieve optimal conditions for intended responses, thereby reducing the number of experimentations [10,19,24]. We investigated the impact of three independent factors (coagulant dose, temperature, and pH) and three corresponding dependent factors (TSS, TOC, and TN) using the Box–Behnken design approach. The choice of the use of the PAC coagulant was based on results obtained from the preliminary tests in jars with respect to the coagulant pH and temperature characteristics. The analysis of variance (ANOVA) was conducted to determine if the quadratic model adequately described and predicted the response in the coagulation process. The findings will contribute to a better knowledge of the experimental design that can predict values based on water characteristics to optimize the coagulation process by utilizing the PAC coagulant.

2. Materials and Methods

2.1. Materials

All water samples were collected from the Yangtze River basin located at Baoshan district, Shanghai (Figure S1) from September to December 2020 using a 25 L polyvinyl chloride bottle. Prior to sampling, a permanent sampling station was established for this study to obtain consistent samples from the same point source. In situ baseline measurements of the water samples’ turbidity, pH, temperature, TOC, TN, and TSS were determined as presented in Table 1. The PAC coagulant (Al = 9.0 ± 0.5 wt%, Cl = 22.0 ± 1.0 wt%, basicity = 40% ± 2) used in the experiment was obtained from Huayu water chemical, Jiangsu, China, and the other coagulations investigated during the pre-experiment such as aluminium sulfate (Al2O3 = ≥15.60%, Fe = ≤0.50%, granularity = ≤10 mm) from Shandong Aluminum Company, Shandong, China; ferric sulfate-Fe2(SO4)3 [Fe = 19% (min), Fe3+ = 0.15% (max), purity = 100%] from Sinopharm Chemical Reagent Co., Ltd., Shanghai, China; and polyaluminium silicate sulfate (Al = 5.0–5.5%, Al2O3 = 9.5–10.5%, basicity = 50–57%) from Inner Mongolia Hahe Environmental Protection Company, China were of technical grade. After the preliminary test, a 500 ppm (±0.005 mgL−1) standard stock solution of all the coagulants used was prepared using deionized water by diluting them in a 1000 mL volumetric flask and storing at room temperature (23 ± 1 °C).

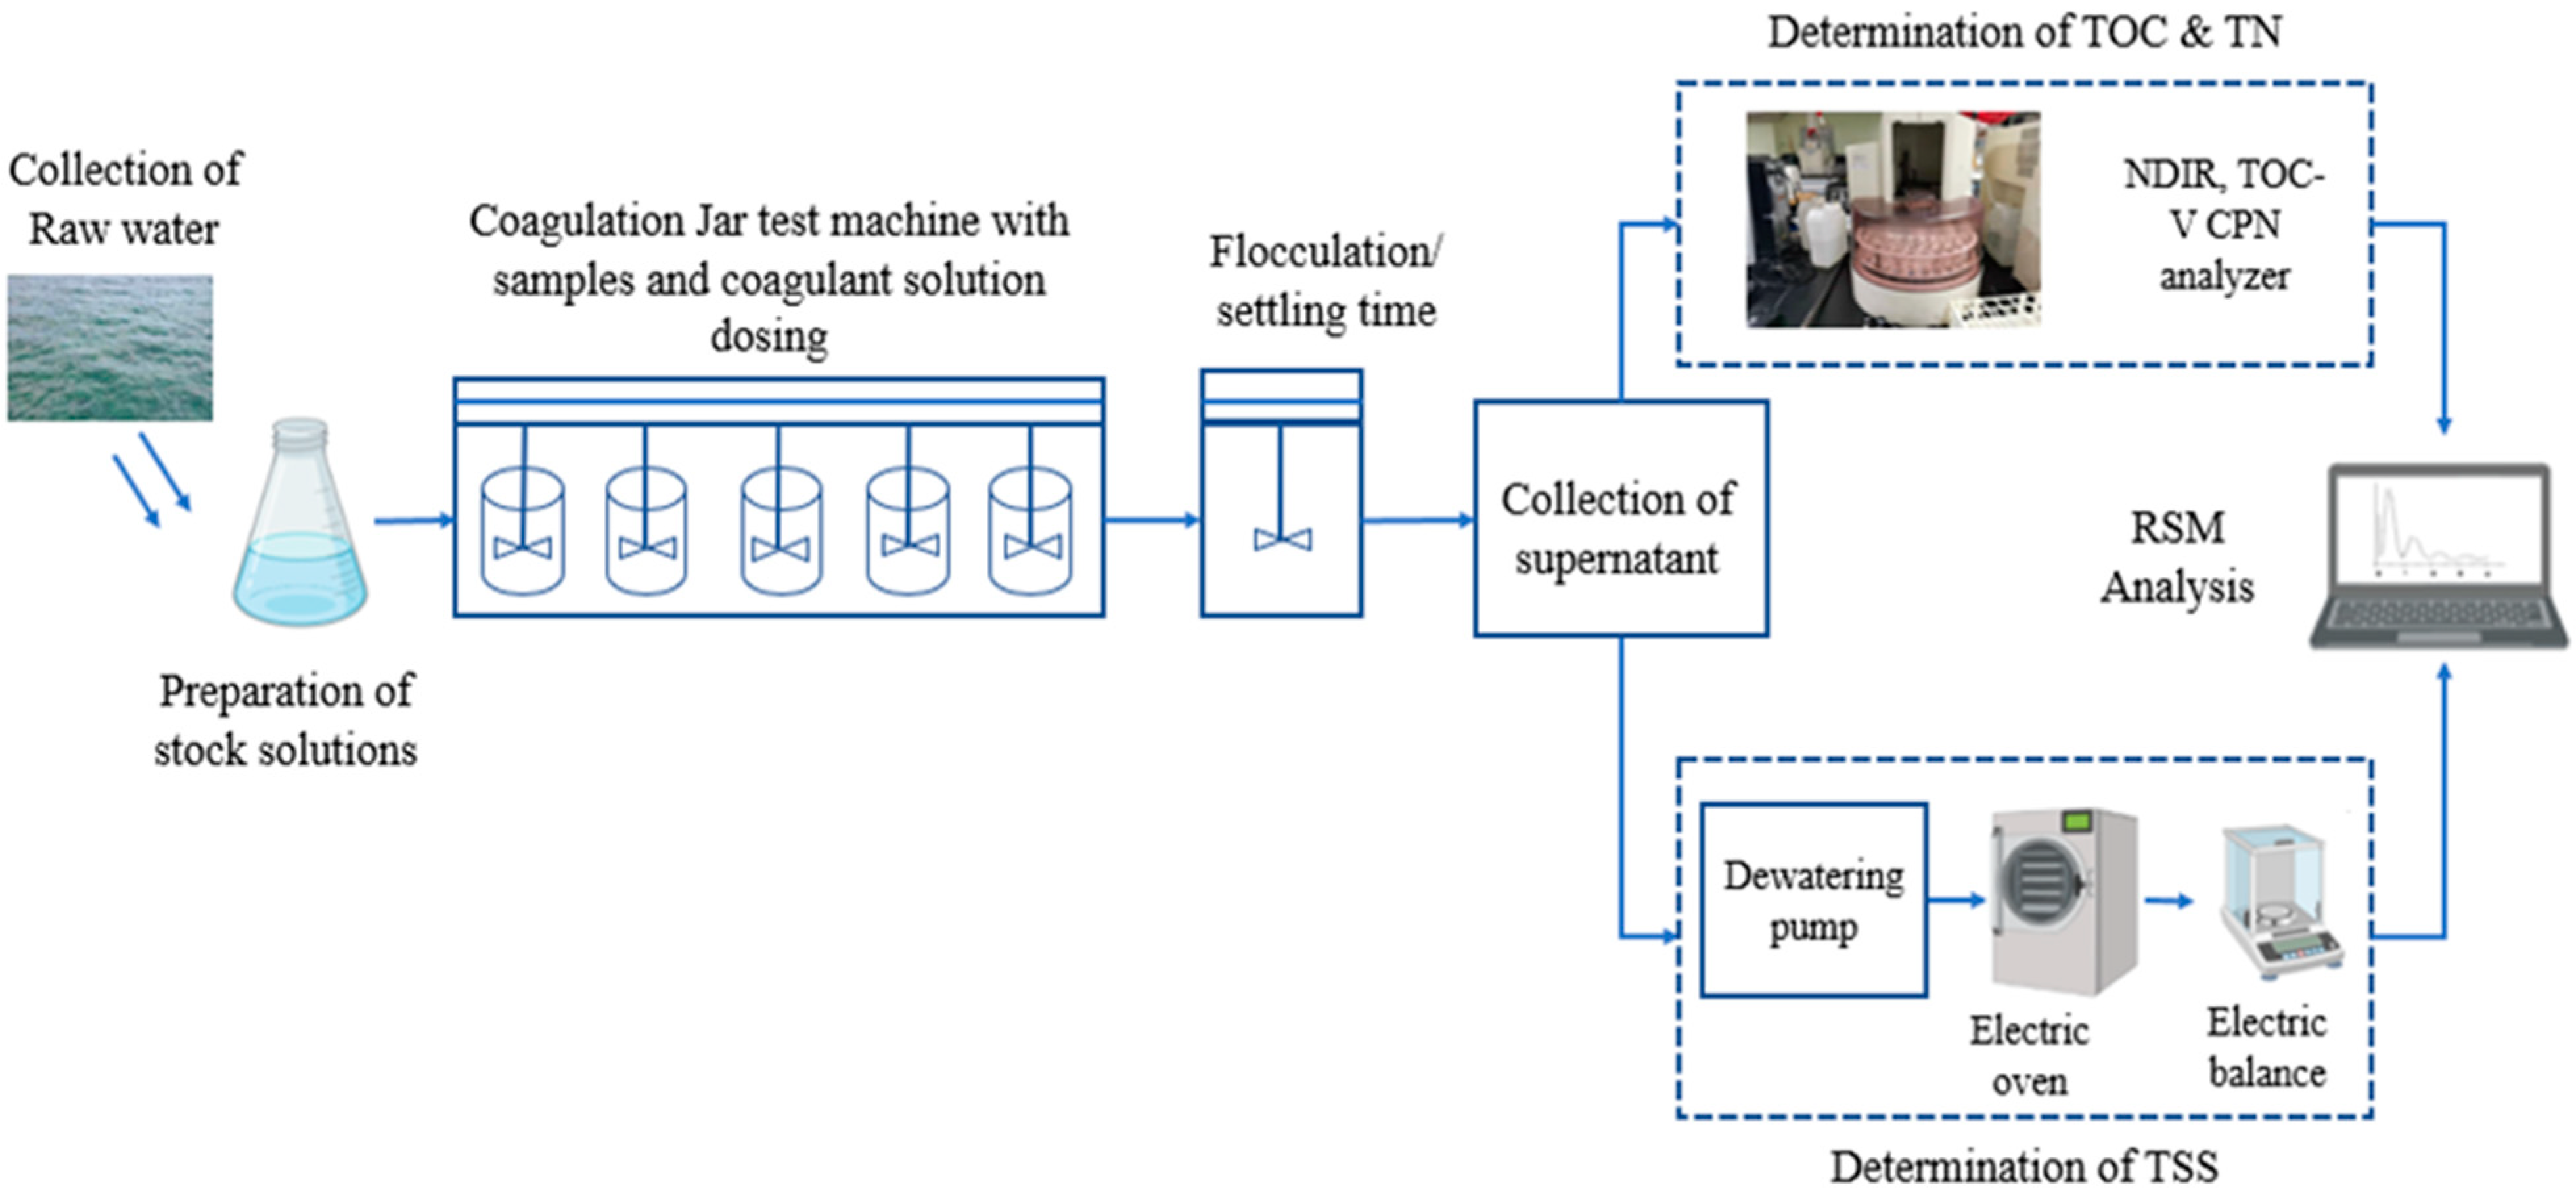
2.2. Jar Test Procedure

The ASTM D2035 coagulation technique was followed [27] using six stirred beakers in the Jar machine (ZR4-6 Intelligent Jar tester) of 500 mL capacity, with controlled mixing speed and time (Figure 1). The experimental setup consisted of five beakers with each of the beakers containing 300 mL of the sampled water. A preliminary Jar test was performed to determine the optimal conditions for floc synthesis and the concentration of each coagulant. The obtained results revealed that under the optimum operating conditions, the doses of the PAC, aluminium sulfate, polyaluminium silicate sulfate, and ferric sulfate coagulants used were as follows: 20, 35, 50, 65, and 80 mgL−1, respectively. After pre-experimentation, the analyses were carried out at room temperature using the PAC coagulant; the samples were stirred at 200 rpm for 2 min, to homogenize the coagulant, and then at 50 rpm for 10 min, before settling for 15 min. All tests were carried out in triplicate subject to physicochemical analyses. The turbidity was characterized with a turbidimeter (Hach 2100Q01, CO, USA). The temperature and pH were analyzed using a pH meter (Jenco model 6010M, San Diego, CA, USA). For the TOC and TN determination, a 24 mL vial of the sampled water from each beaker was analyzed using a TOC analyzer (TOC-V CPN, Shimadzu, Kyoto, Japan) [28] with a highlight to the non-purgeable organic carbon method. For this method, the organic carbon in an acidified sample after purging with a gas TOC analyzer was transformed to CO2 utilizing a catalytic oxidation combustion technique at high temperatures. A non-dispersive infrared sensor was then used to quantify the CO2 emitted by oxidation. The TOC analyzer then calculated the carbon and nitrogen concentration over an exceedingly wide range (ideally from 4 to 30,000 mg/L) using dilution techniques. Furthermore, a 100 mL portion of the treated samples from each beaker was decanted for the TSS analysis following the ASTM D2540 [29]. A dewatering pump (Cyangyi (VP-1, 3.6 m3h, 220 V-/50 Hz, 150 W)) was used to trap the suspended particulate matter in a ø9 cm filter media (porosity = 11 µm, ash (%) = ≤0.13). The filter media was then dried for 1 h 30 min at 105 °C in an oven and then cooled for 30 min in a desiccator before the final weight was determined with an electric mass balance. The TSS concentration was calculated following Equation (1).
T S S = W T ( g ) W I ( g ) V ( m L ) × 10 6
where WT is the weight of the filter media and dried residual, WI is the weight of the unused filter media, and V is the volume of the sample used.

2.3. Pre-Experiment

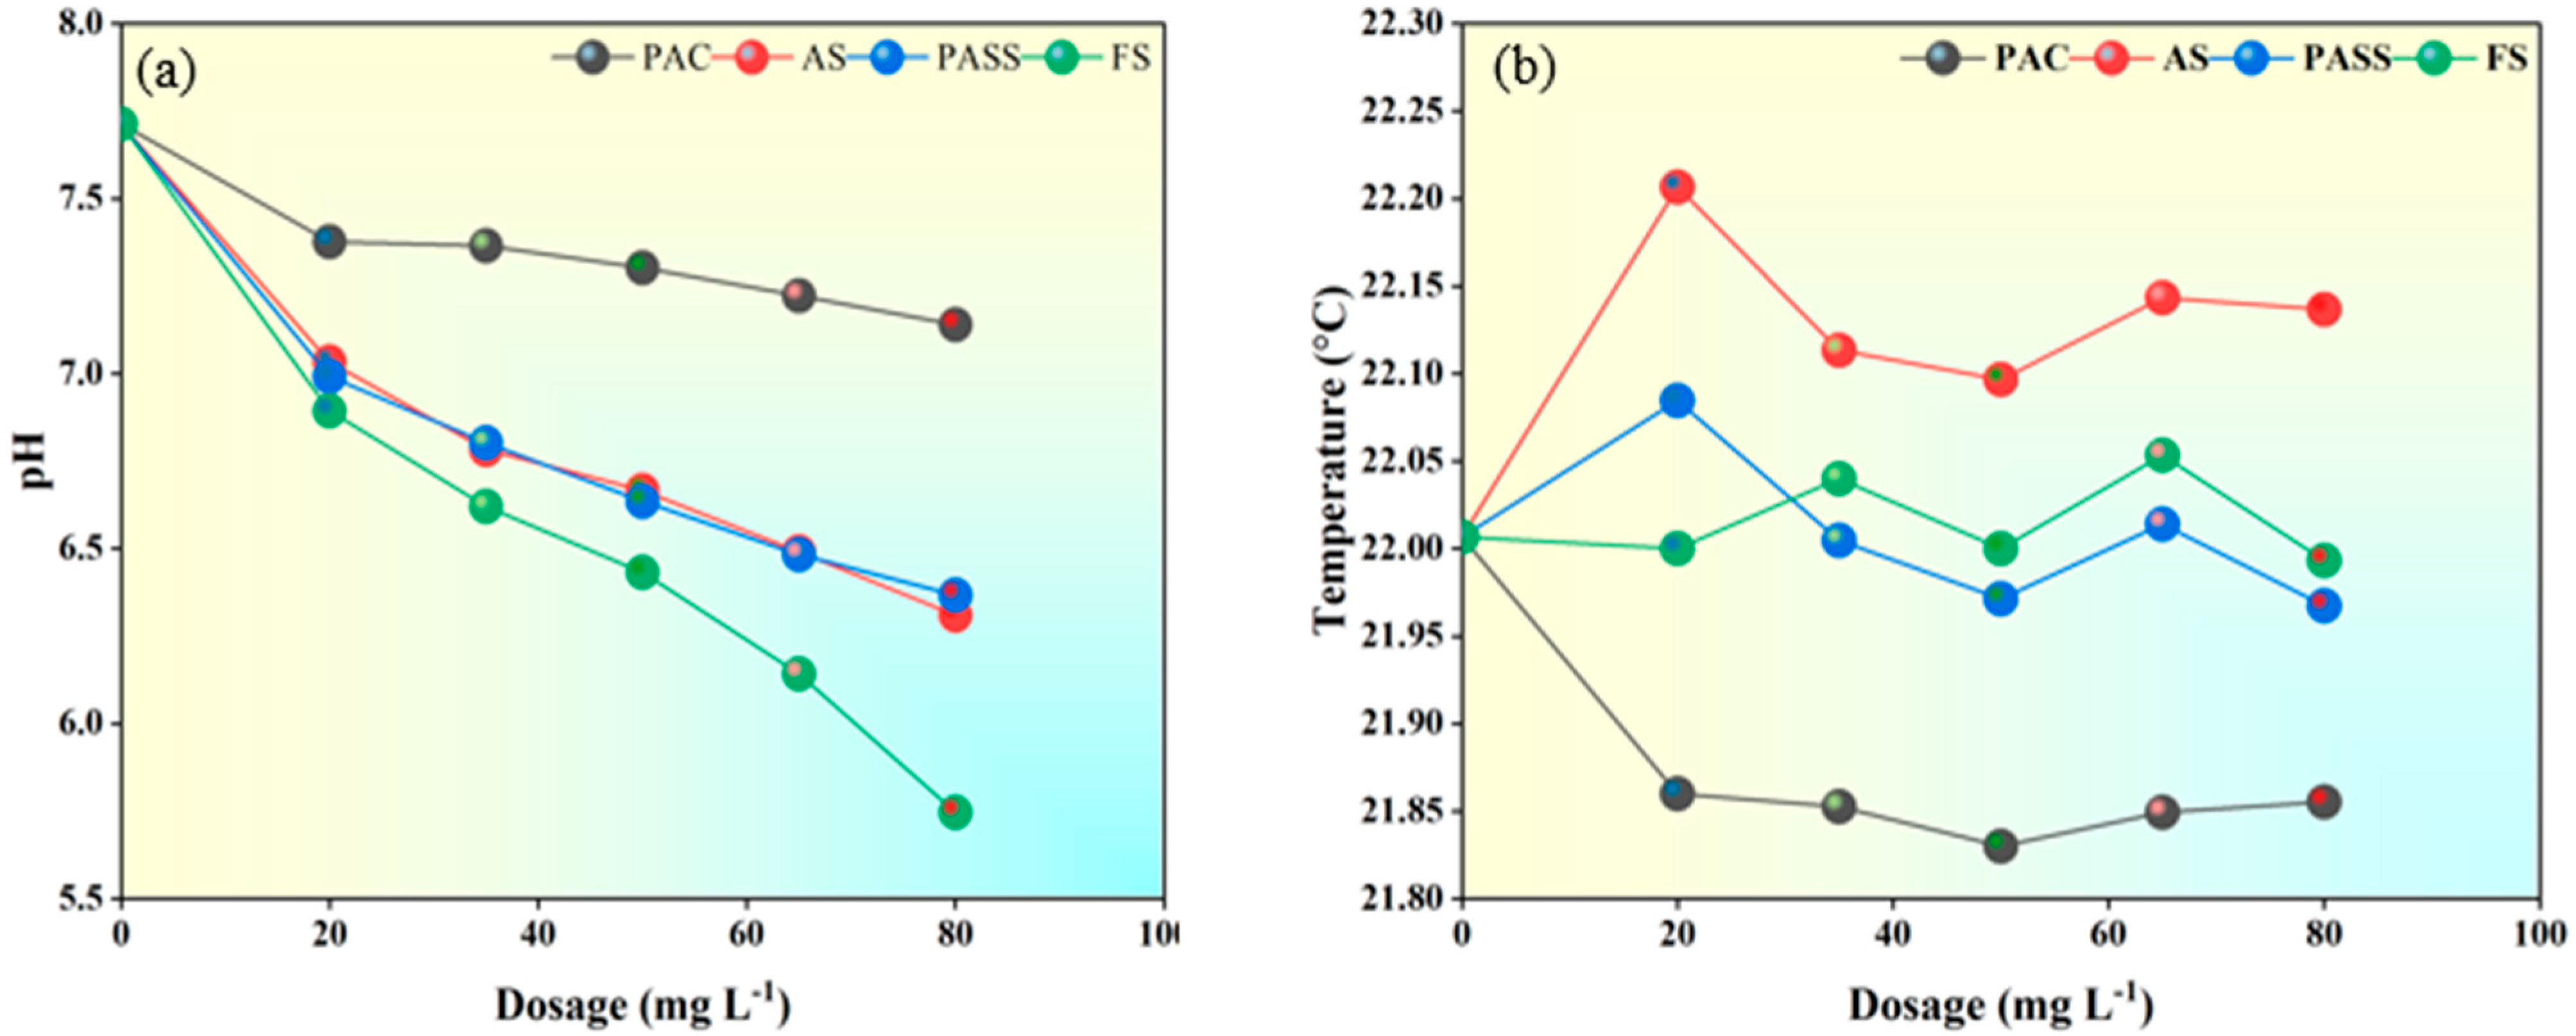
2.3.1. Coagulant Dosage vs. Raw Water pH

The pH of water is an important factor that impacts how reactive the functional groups of coagulants are with the organic matter in question. This is because the pH affects how organic compounds separate apart [30]. As can be seen in Figure 2a, the results of the pre-experiments of coagulant dosage and the pH strength of PAC (7.14), AS (6.31), and PASS (6.37) were all within the acceptable limit for drinking water (≥6.5 ≤8.5) according to Shanghai City [25] and China national standards [26], except for FS (5.75) which decreased significantly below the treatment standard as the coagulant dosage increased (from 20 to 80 mgL−1). It was also observed that an increase in the coagulant dosage of the AS and PASS coagulant decreased the water pH. However, the performance of PAC showed that it had strong hydrolyzing characteristics to control the water pH as the coagulant dosage increased. A pH of less than 6 showed that the treated water samples were acidic and that some contaminants were present [31], and could also lead to corrosion in metal pipes during water distribution. These findings show that the water pH and coagulant dosages have an impact on the efficacy of the selected responses (TSS, TOC, and TN) removal.

2.3.2. Coagulant Dosages vs. Raw Water Temperature

When using the conventional treatment approach, the temperature has been shown to influence not only flocculation [32] but also filtration efficiency, as lower temperature waters will slow down hydrolysis. According to the findings, the water temperature seemed to have minimal impact on coagulant dosages. This influence can be seen in any of the coagulants used in Figure 2b. However, PAC can be preferable to conventional coagulants in low-temperature conditions due to their hydrolyzed state. In contrast, it is a cost-effective treatment coagulant that does not significantly alter the water temperature and impact the coagulation mechanism.

2.4. Data and Statistical Analysis

All data curation was handled using Microsoft Excel 2016. OriginPro 2021 (OriginLab Corporation, Northampton, NH, USA) was used for the statistical analysis, and RSM was performed in Design-Expert 13 (Stat-Ease, Minneapolis, MN, USA).

2.5. Response Surface Methodology and Optimization

RSM was employed to determine optimal conditions for TN, TOC, and TSS removal over the PAC coagulant. Each run was independently conducted under previously described experimental conditions. The Box–Behnken experimental design in Design-Expert 13 was employed for the analysis. The number of experimental runs was determined following Equation (2) [33]. To determine the effects of pH, coagulant dosage, and temperature in Table 2 on TN, TOC, and TSS removal, 15 separate experiments were conducted. The experimental design (Table S1) to evaluate the relationship between the responses (y) and the set of independent values (x) is shown in Equation (2).
N = 2 K   ( K 1 ) + r
where N is the number of experiments, K is the number of factors, and r is the number of replicates.
y ( % ) = f   ( x ) = β 0 + i = 1 k β i   x i + i = 1 k β i i   x i 2 + i = 1 k i = j k β i j   x i   x j
where y is the predicted response, and x i and x j are the independent variables (i, j = 1, 2, 3, 4 …k). The parameter β o is the model constant, β i is the linear coefficient, βii is the second-order coefficient, and β i i is the interaction coefficient.

3. Results and Discussion
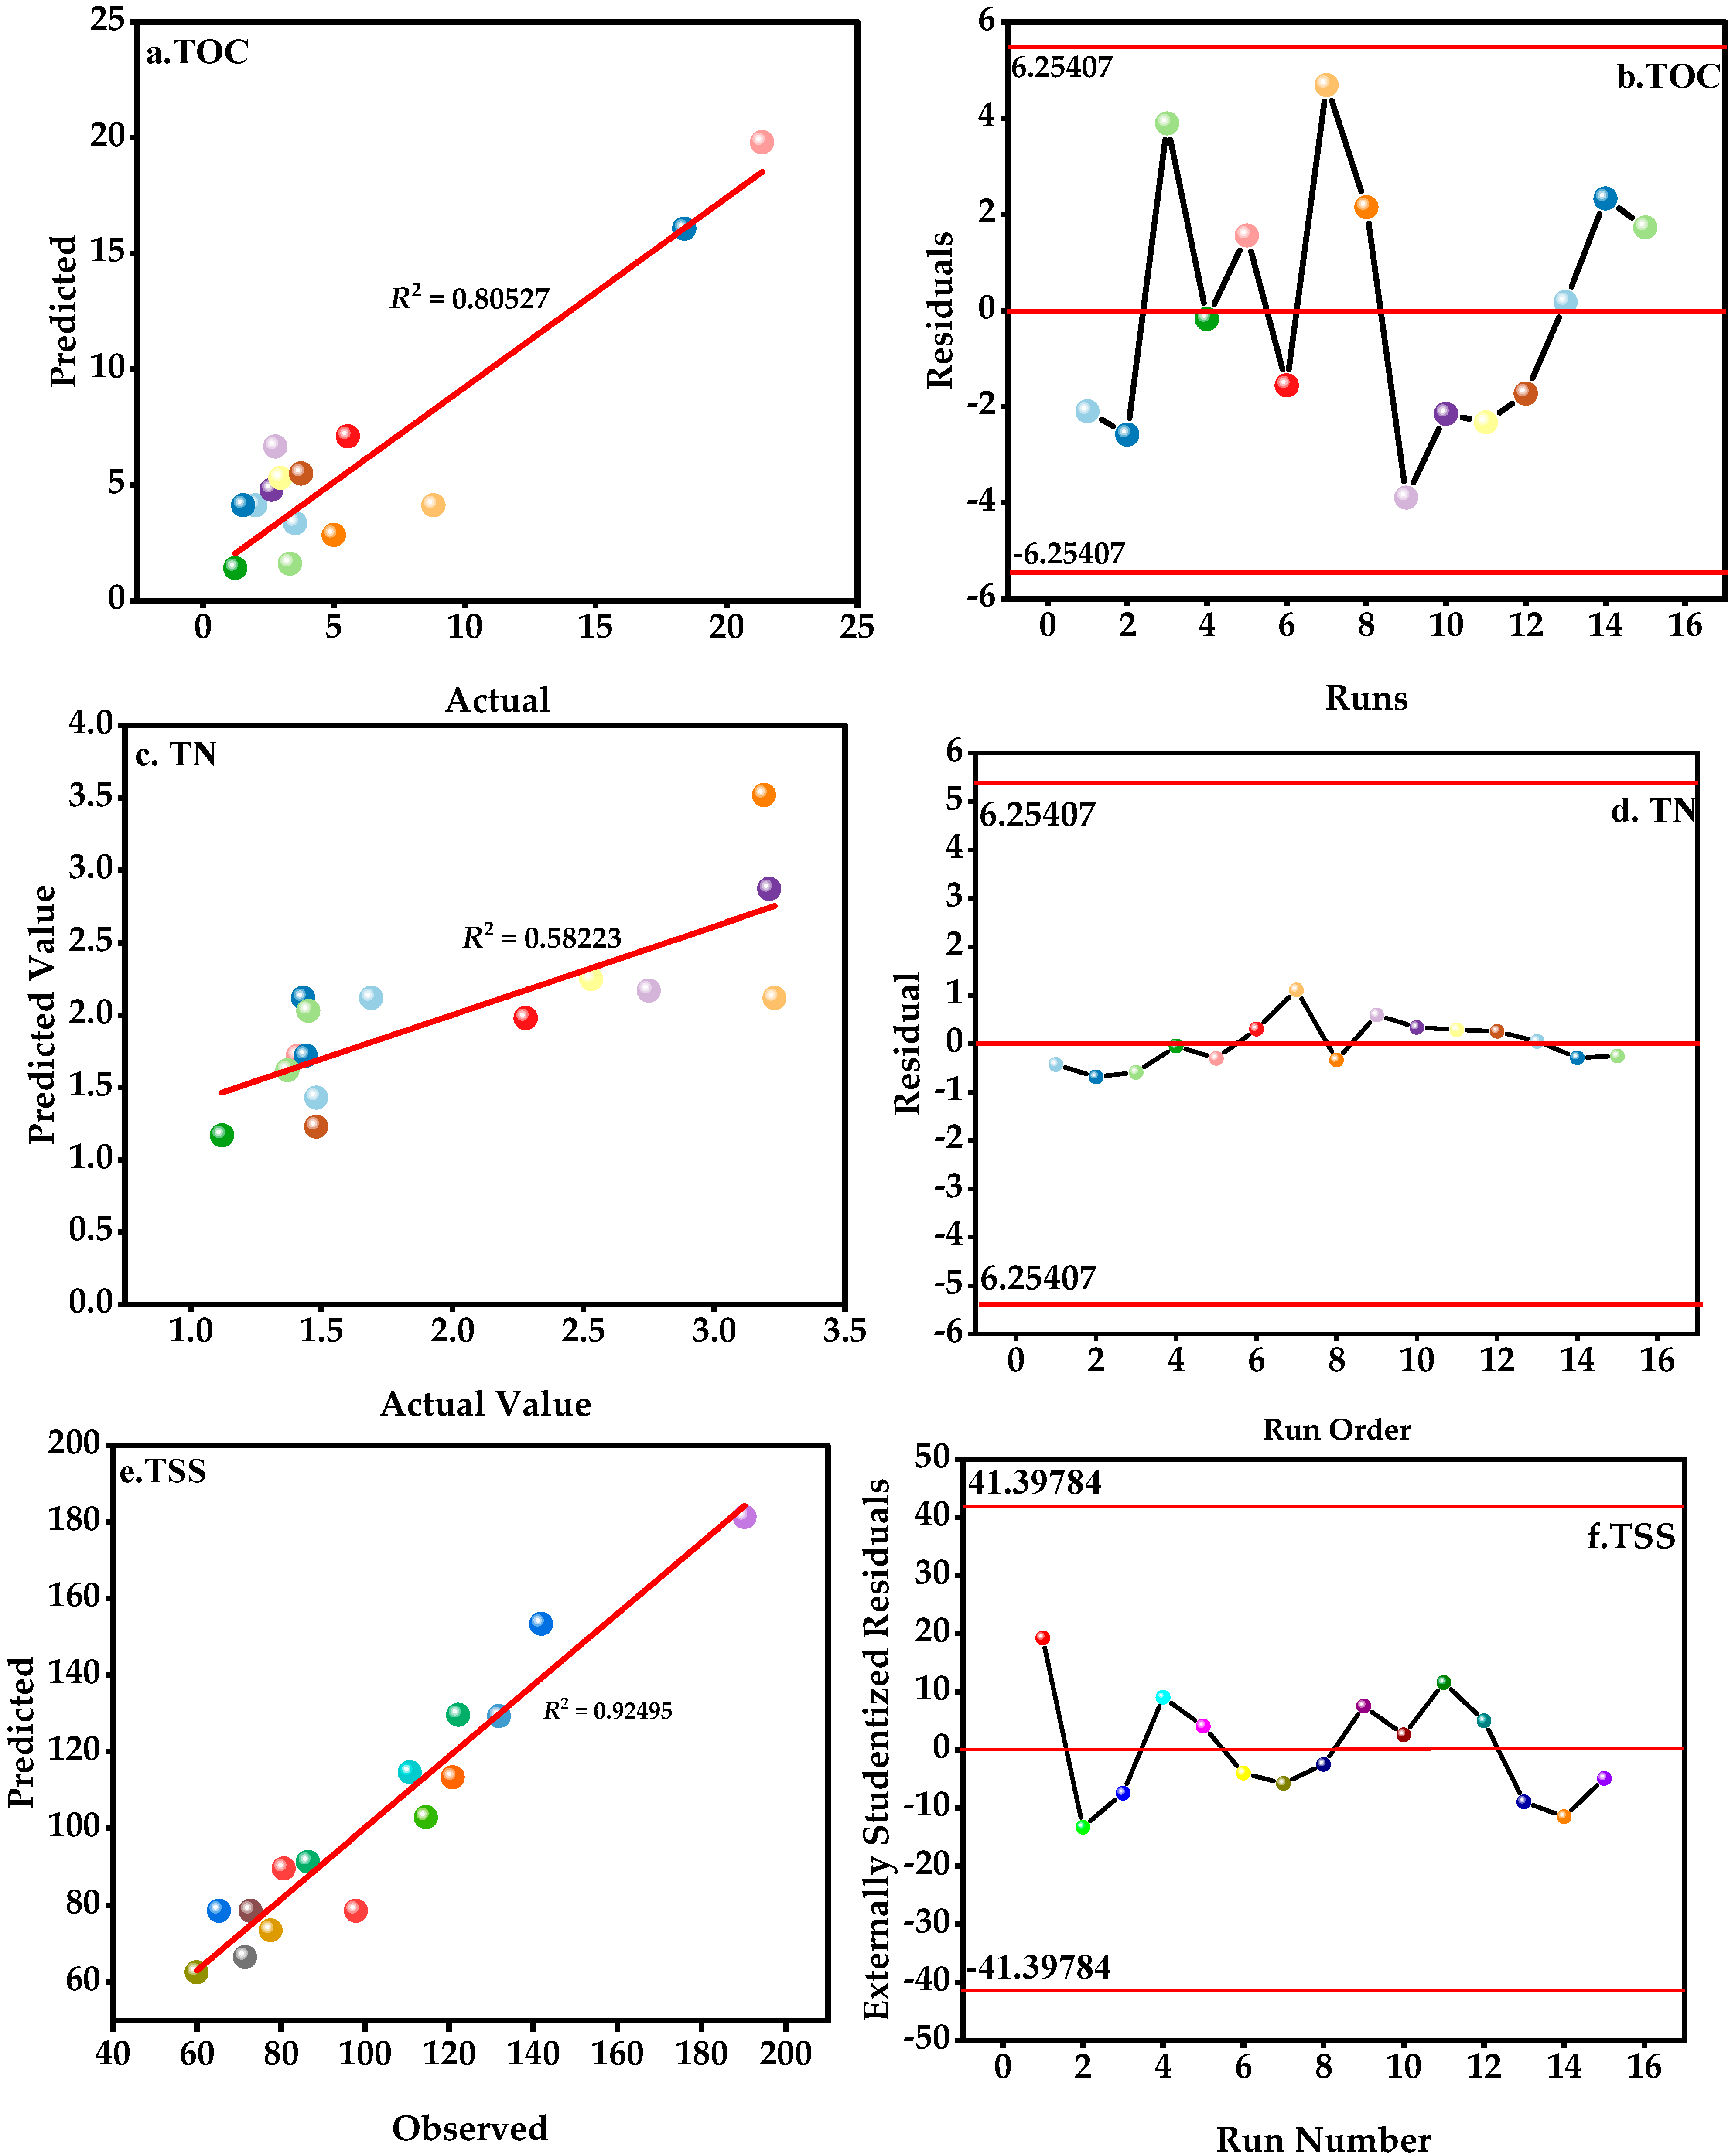
3.1. Fitting Models

To determine the interactions between the parameters contributing to the PAC coagulant for the removal of TN, TSS, and TOC in urban drinking water treatment, RSM modeling with a Box–Behnken analysis was used. Similar approaches were applied by Choi et al. 2022 and Barilla et al. 2022 to study the adsorption and interaction effects of multiple variables [34,35]. The regression equations (uncoded units) describing the relationship between the variables ( x 1 , x 2 , and x 3 ) for TOC, TN, and TSS are represented in Equations (4)–(6). Table 3 shows the matrix of observed and predicted values for TOC, TSS, and TN removal. Overall, it was observed that the predicted values were quite close to the actual values, revealing the model’s suitability to navigate the design space.
y ( T O C ) = 4.12 + 1.72 x 1 3.66 x 2 2.69 x 3 3.57 x 1 x 2 + 0.066 x 1 x 3 + 4.82 x 2 x 3 1.66 x 1 2 + 4.65 x 2 2 0.411 x 3 2
y ( T N ) = 2.12 0.031 x 1 + 0.229 x 2 0.097 x 3 0.280 x 1 x 2 0.400 x 1 x 3 0.675 x 2 x 3 0.619 x 1 2 + 0.204 x 2 2 + 0.199 x 3 2
y ( T S S ) = 78.62 + 188.82 x 1 6.4 x 2 26.98 x 2 24.6 x i x 2 6.98 x 1 x 2 0.919 x 2 x 3 29.21 x 1 2 4.25 x 2 2 + 20.5 x 3 2
Research using ANOVA (Table 4) was conducted to check if the quadratic model adequately described the data collected in the experiment. Modeling factors such as p-value (probability), R2 (coefficient), and the model’s adequate precision (Ad.p) are useful for evaluating the ‘significance level’ of any suggested model. To paraphrase some statistical theories, a highly significant model is defined by a large Fischer test (F-value) and a small probability (p-value) [36]. If the proposed model had an R2 of more than 0.9 and a p-value less than 0.05, it was deemed to be significant. There was no statistically significant misfit in the model’s ability to explain the data (p > 0.4762; see ANOVA), suggesting that the model was effective in guiding the response (Table S2). In addition, if (R2) was more than 0.8, the suggested model was considered to be a good match to the data collected; in this case, (R2) = 0.819 [37]. The Ad.p is a model’s signal-to-noise ratio, and a ratio higher than 4 is desirable. The Ad.p values of 6.188 and 9.3197 for TOC and TSS, respectively, suggest a sufficient signal, making this model appropriate for navigating the design space for TOC removal by PAC, except for TN, which had an Ad.p value slightly below 4. Individually, it was observed that the interactions between the studied variables were not significant for TOC and TN with p-values ranging from 0.0629 to 0.9527. The interactions between pH and coagulant dosage were significant with corresponding p-values ranging from 0.019 to 0.0045, respectively. The model lack-of-fit (LOF) values for TOC, TN, and TSS were non-significant with corresponding Fisher (F-test) values and p-values ranging for TOC (F = 1.24; p = 0.4762), for TN (F = 0.49; p = 0.7226), and TSS (F = 0.7273; p = 0.6231), respectively. Generally, a non-significant LOF implies the model is good.
In addition to the ‘observed versus predicted’ and ‘residuals versus run’ plots, we also determined other diagnostic signs to support the model’s suitability. In Figure 3a,c,e, the probability plot of 15 experimental results by different colored dots which were valued from 1.54 to 19.8 for TOC, 1.12 to 2.87 (Adj. R2 = 0.805) for TN (Adj. R2 = 0.58), and 60.0 to 181 (Adj. R2 = 0.92) for TSS are shown; except for TN, there was good adequacy of the model based on the ‘observed’ versus ‘predicted data’ distribution on the straight line. In addition, Figure 3b,d,f revealed that the plot of ‘residuals’ against ‘runs’ was randomly distributed without uniform patterns. This conforms to the hypothesis of chance in the reaction system during coagulant removal. Therefore, the quadratic model was utilized to define the relationship between the factors investigated and the responses.

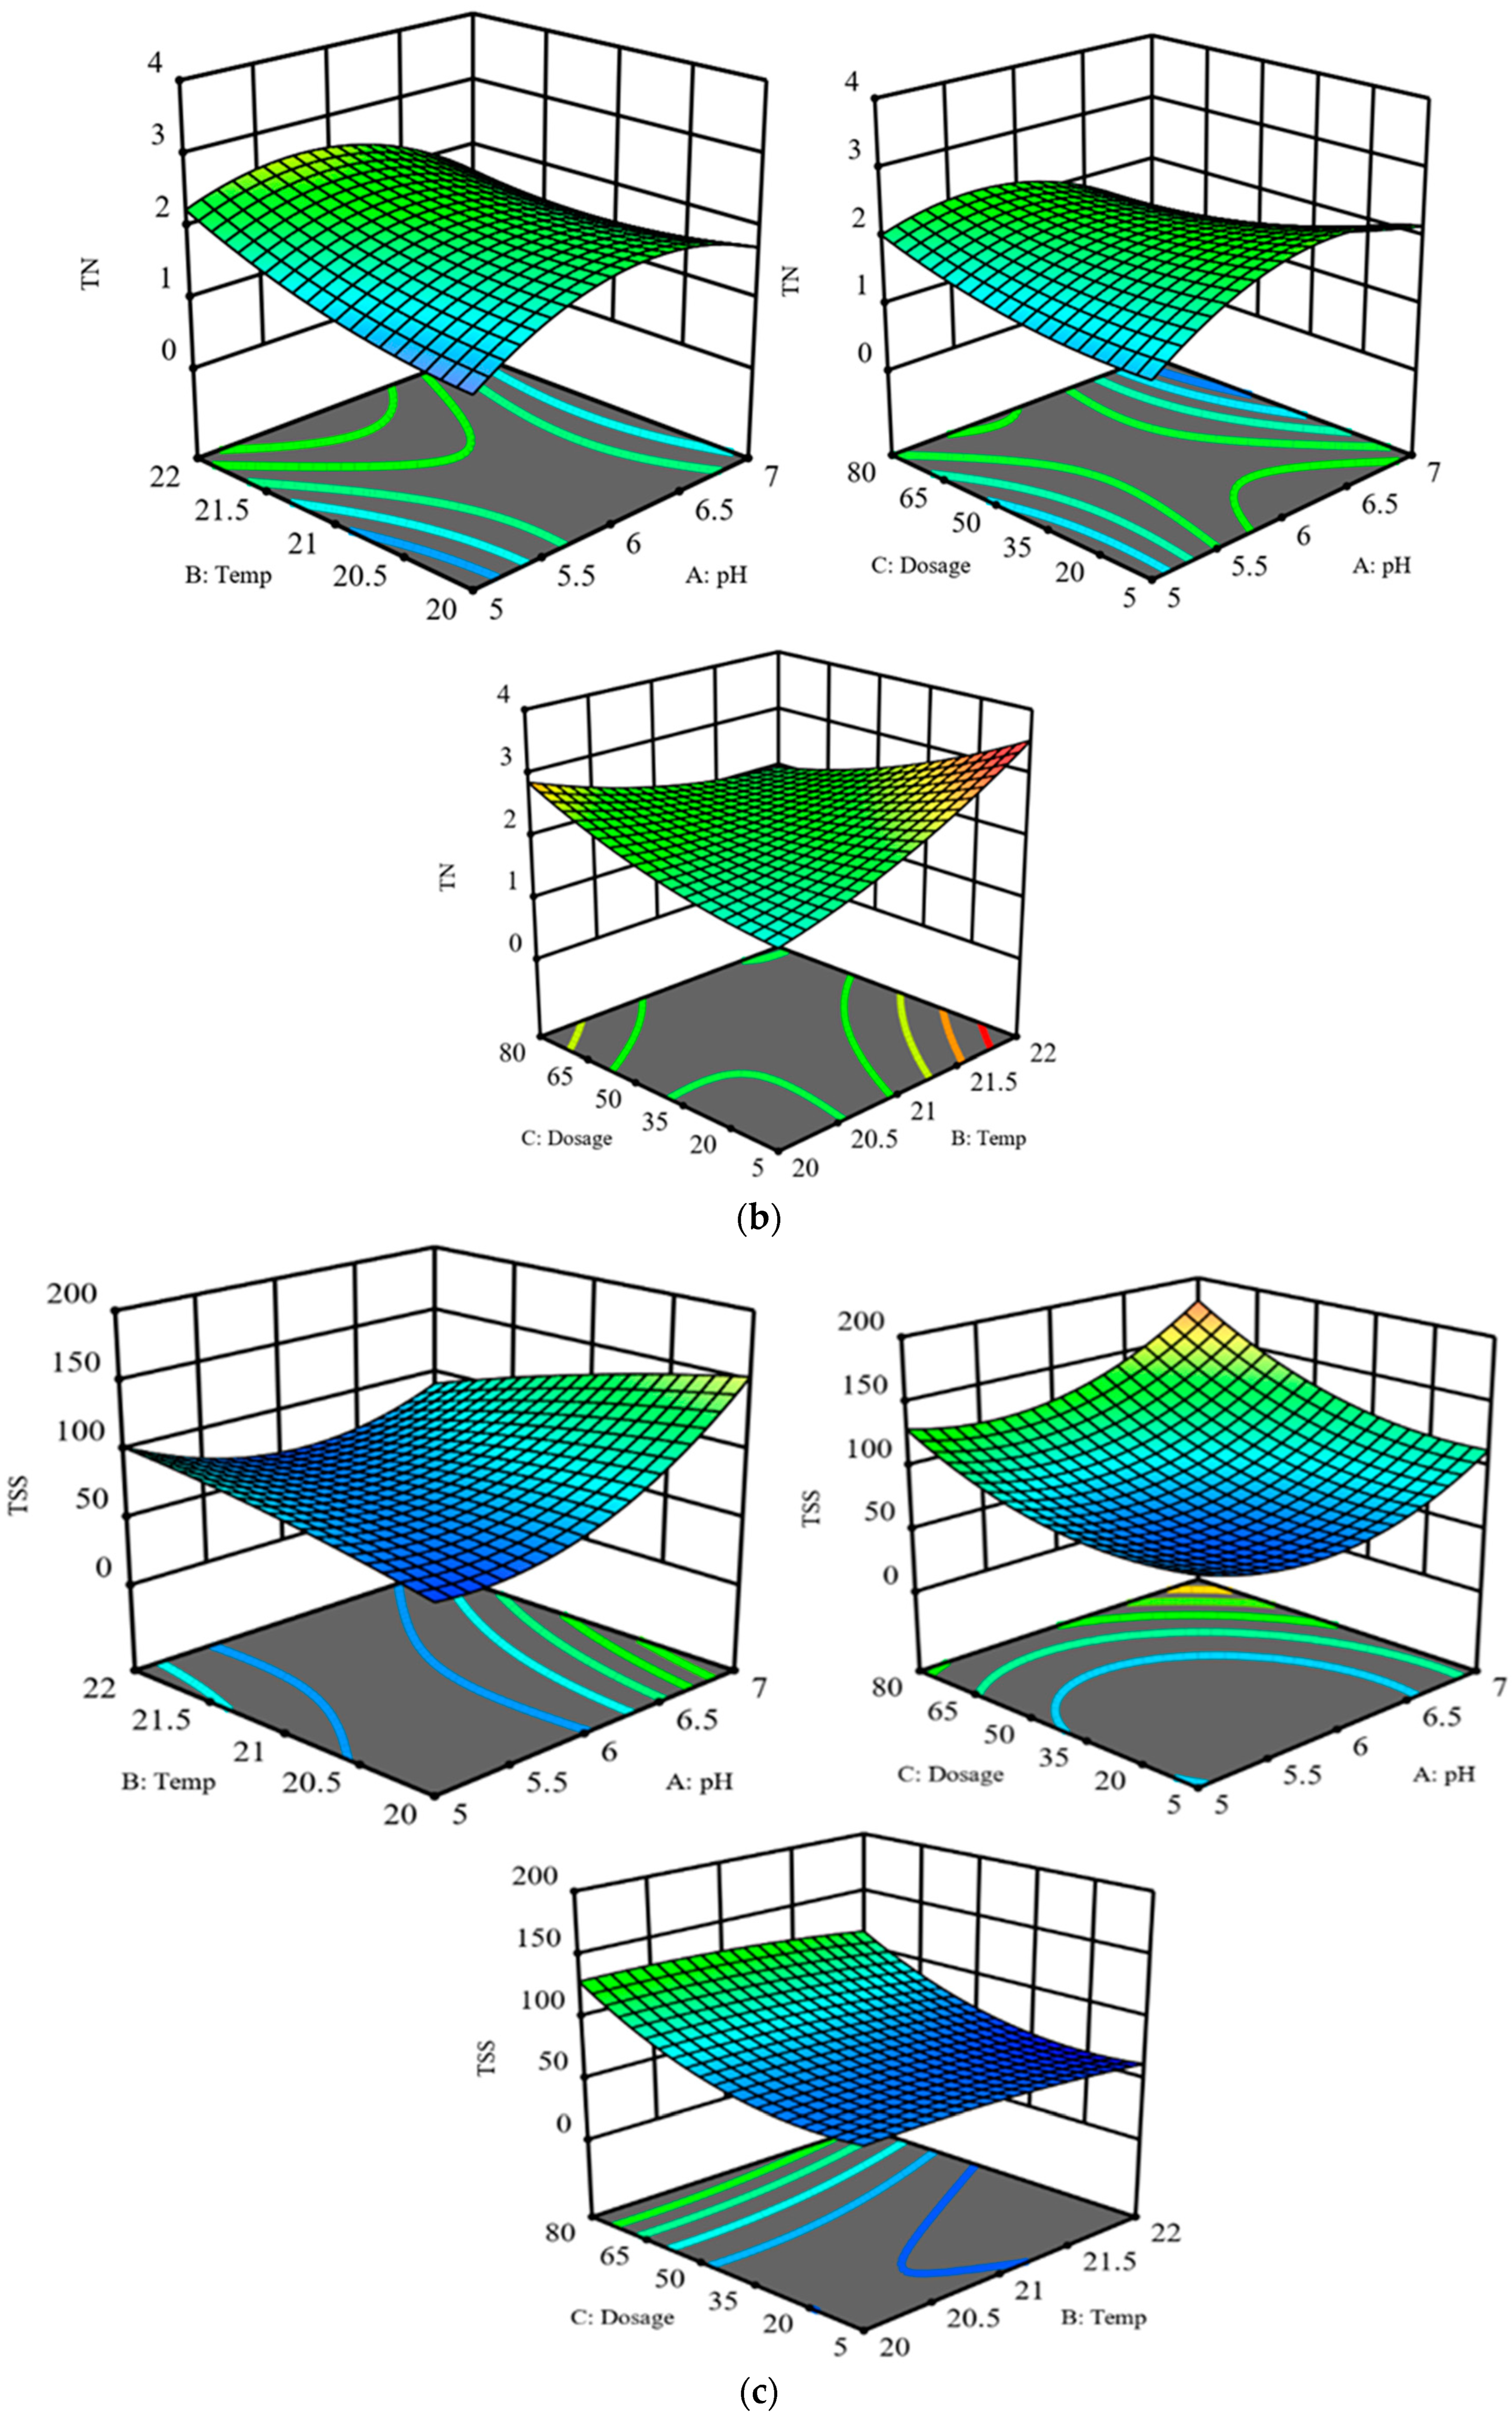
3.2. Process Analysis

A comparative analysis of the best conditions for TOC, TN, and TSS removal is shown in Figure 4. Figure 4a shows the 3D response surface plots of the quadratic models for TOC removal by PAC. It was observed that optimal conditions for TOC removal by PAC could lie in the ranges of pH (6) and temperature (21 °C) or pH (6) with a corresponding dosage (42.5 mgL−1). However, a combination of an increase in dosage and temperature was not the best condition to increase TOC removal efficiency by PAC. The colloidal particles are restabilized due to an excessive dose. Similarly, Figure 4b shows the surface plots of TN removal. The model revealed that temperature (21 °C) and corresponding pH (6) were the most optimal conditions for TN removal. Similar to TOC removal, a dosage of (42.5 mgL−1) and pH (6) could generate similar optimal results for TN removal. Figure 4c further shows the surface and contour plots of the quadratic models for TSS with maximum removal capacity at (114 mgL−1) with conditions pH (5) and temperature (22 °C). An increase in pH (7) with a corresponding increase in dosage (80 mgL−1) could attain the highest TSS removal capacity. The optimal conditions for (97.8 mgL−1) removal capacity were determined under the conditions of pH (6) and dosage (42.5 mgL−1). However, a lower dosage (5 mgL−1) and lower temperature (20 °C) could not yield a higher removal capacity. This indicates that for TSS, a high coagulant dosage, pH, and temperature conditions are necessary for the best removal capacities by a PAC coagulant.

3.3. Process Optimization

Because of the number of responses, Table 5 gives the optimal response limits for each parameter that was selected or chosen. Figure S2 graphically shows the circumstances in which the desired removal capabilities for TOC, TN, and TSS were concurrently reached by all parameters. Graphical optimization illustrates the area of viable response values in the factor space, with shaded portions indicating regions that meet the optimization requirements [38]. Using the optimization tool in Design-Expert 13, the optimization goal was set to ‘maximum’ to reveal the best conditions for TOC, TN, and TSS removal by PAC.

4. Conclusions

In this study, the coagulation method, which is simple and cost-efficient, is proven as an effective process to remove pollutants from urban drinking water. Although several coagulants have been experimented with for urban drinking water treatment, the PAC coagulant was investigated as efficient for TOC, TSS, and TN removal. To the best of our knowledge, very little literature has reported on the optimization of water quality parameters such as chemical oxygen demand and potassium permanganate using the Yangtze River water, with little knowledge on the research-corresponding dependent factors (TSS, TOC, and TN) employing the coagulation process. As a result, the statistical modeling and optimization of the coagulation process were investigated. The laboratory results were modeled in RSM using the Box–Behnken design to determine maximum optimum conditions. Based on the predicted R2 coefficients of plots, the experimental datasets were best fitted to the TSS and TOC predictive values, unlike TN which had a lower R2 value and did not show good agreement with the modeled results. The predictive optimum conditions where all parameters were suitable to yield maximum TOC, TSS, and TN removal were established as water pH (6.9), water temperature (20 °C), and coagulant dosage (9.7 mgL−1). It is recommended that the integration of RSM with coagulation and other downward treatment processes’ optimization to address the gap in the existing studies is a viable approach to monitor and possibly adjust the process’s interdependence factors and responses.

Supplementary Materials

The following supporting information can be downloaded at: https://www.mdpi.com/article/10.3390/w15050853/s1, Figure S1: Sampling Location; Figure S2: Graphical prediction plots; Table S1: Box–Behnken Design; Table S2: ANOVA Results.

Author Contributions

M.Y. (conceptualization, investigation, data curation, statistical analysis, writing—original draft preparation); G.L.-Y. (statistical analysis, writing—original draft preparation, review and editing); F.L. (project supervision, resources, funding, writing—review and editing); M.L. (writing—review and editing); Y.T. (project supervision, funding, writing—review and editing). All authors have read and agreed to the published version of the manuscript.

Funding

This research was funded by the Natural Science Foundation of Shanghai (21ZR1467300).

Data Availability Statement

The submitted manuscript contains all of the data generated or analyzed throughout this study.

Conflicts of Interest

The authors declare no conflict of interest.

References

  1. Xia, J.; Li, Z.; Zeng, S.; Zou, L.; She, D.; Cheng, D. Perspectives on eco-water security and sustainable development in the Yangtze River Basin. Geosci. Lett. 2021, 8, 18. [Google Scholar] [CrossRef]
  2. Wang, Y.; Dong, W.; Boelens, L. The Interaction of City and Water in the Yangtze River Delta, a Natural/Artificial Comparison with Euro Delta. Sustainability 2018, 10, 109. [Google Scholar] [CrossRef] [Green Version]
  3. Wang, Z.; Shao, D.; Westerhoff, P. Wastewater discharge impact on drinking water sources along the Yangtze River (China). Sci. Total Environ. 2017, 599–600, 1399–1407. [Google Scholar] [CrossRef] [PubMed]
  4. Chen, Y.; Zang, L.; Shen, G.; Liu, M.; Du, W.; Fei, J.; Yang, L.; Chen, L.; Wang, X.; Liu, W.; et al. Resolution of the Ongoing Challenge of Estimating Nonpoint Source Neonicotinoid Pollution in the Yangtze River Basin Using a Modified Mass Balance Approach. Environ. Sci. Technol. 2019, 53, 2539–2548. [Google Scholar] [CrossRef]
  5. Ding, X.; Liu, L. Long-Term Effects of Anthropogenic Factors on Nonpoint Source Pollution in the Upper Reaches of the Yangtze River. Sustainability 2019, 11, 2246. [Google Scholar] [CrossRef] [Green Version]
  6. Xu, Z.; Zhang, X.; Xie, J.; Yuan, G.; Tang, X.; Sun, X.; Yu, G. Total Nitrogen Concentrations in Surface Water of Typical Agro- and Forest Ecosystems in China, 2004–2009. PLoS ONE 2014, 9, e92850. [Google Scholar] [CrossRef]
  7. Villa, A.; Fölster, J.; Kyllmar, K. Determining suspended solids and total phosphorus from turbidity: Comparison of high-frequency sampling with conventional monitoring methods. Environ. Monit. Assess. 2019, 191, 605. [Google Scholar] [CrossRef] [Green Version]
  8. Ang, W.L.; Mohammad, A.W. State of the art and sustainability of natural coagulants in water and wastewater treatment. J. Clean. Prod. 2020, 262, 121267. [Google Scholar] [CrossRef]
  9. Corral Bobadilla, M.; Lorza, R.L.; Escribano García, R.; Somovilla Gómez, F.; Vergara González, E.P. Coagulation: Determination of Key Operating Parameters by Multi-Response Surface Methodology Using Desirability Functions. Water 2019, 11, 398. [Google Scholar] [CrossRef] [Green Version]
  10. Suquet, J.; Godo-Pla, L.; Valentí, M.; Verdaguer, M.; Martin, M.J.; Poch, M.; Monclús, H. Development of an environmental decision support system for enhanced coagulation in drinking water production. Water 2020, 12, 2115. [Google Scholar] [CrossRef]
  11. Chua, S.-C.; Chong, F.-K.; Malek, M.A.; Ul Mustafa, M.R.; Ismail, N.; Sujarwo, W.; Lim, J.-W.; Ho, Y.-C. Optimized Use of Ferric Chloride and Sesbania Seed Gum (SSG) as Sustainable Coagulant Aid for Turbidity Reduction in Drinking Water Treatment. Sustainability 2020, 12, 2273. [Google Scholar] [CrossRef] [Green Version]
  12. Guimarães, R.N.; Moreira, V.R.; Amaral, M.C.S. Membrane technology as an emergency response against drinking water shortage in scenarios of dam failure. Chemosphere 2022, 309, 136618. [Google Scholar] [CrossRef] [PubMed]
  13. Kwiecińska-Mydlaka, A.; Sieradzkib, W.; Jagustyna, B.; Wodzisławskaa, K. The use of membrane filtration for removal of aluminum from drinking water sources. Desalin. Water Treat. 2021, 243, 75–82. [Google Scholar] [CrossRef]
  14. Zhang, Y.; Peng, S.; Zhao, X.-H. Assessment of the value of NOM treatment processes based on a matter-element model. Water Supply 2016, 17, 870–878. [Google Scholar] [CrossRef]
  15. Saha, S.; Boro, R.; Das, C. Treatment of tea industry wastewater using coagulation-spinning basket membrane ultrafiltration hybrid system. J. Environ. Manag. 2019, 244, 180–188. [Google Scholar] [CrossRef] [PubMed]
  16. Dąbrowska, L. Removal of Organic Matter from Surface Water using Coagulants with Various Basicity. J. Ecol. Eng. 2016, 17, 66–72. [Google Scholar] [CrossRef]
  17. Tian, C.; Zhao, Y.-X. Dosage and pH dependence of coagulation with polytitanium salts for the treatment of Microcystis aeruginosa-laden and Microcystis wesenbergii-laden surface water: The influence of basicity. J. Water Process. Eng. 2021, 39, 101726. [Google Scholar] [CrossRef]
  18. Naceradska, J.; Pivokonska, L.; Pivokonsky, M. On the importance of pH value in coagulation. J. Water Supply Res. Technol. AQUA 2019, 68, 222–230. [Google Scholar] [CrossRef]
  19. Arruda, P.M.; Pereira-Filho, E.R.; Libânio, M.; Fagnani, E. Response surface methodology applied to tropical freshwater treatment. Environ. Technol. 2018, 41, 901–911. [Google Scholar] [CrossRef]
  20. Khairul Zaman, N.; Rohani, R.; Izni Yusoff, I.; Kamsol, M.A.; Basiron, S.A.; Abd Rashid, A.I. Eco-Friendly Coagulant versus Industrially Used Coagulants: Identification of Their Coagulation Performance, Mechanism and Optimization in Water Treatment Process. Int. J. Environ. Res. Public Health 2021, 18, 9164. [Google Scholar] [CrossRef]
  21. Nti, S.O.; Buamah, R.; Atebiya, J. Polyaluminium chloride dosing effects on coagulation performance: Case study, Barekese, Ghana. Water Pract. Technol. 2021, 16, 1215–1223. [Google Scholar] [CrossRef]
  22. Zarchi, I.; Friedler, E.; Rebhun, M. Polyaluminium chloride as an alternative to alum for the direct filtration of drinking water. Environ. Technol. 2013, 34, 1199–1209. [Google Scholar] [CrossRef] [PubMed]
  23. Abdo, S.M.; Mahmoud, R.H.; Youssef, M.; El-Naggar, M.E. Cationic Starch and Polyaluminum Chloride as Coagulants for River Nile Water Treatment. Groundw. Sustain. Dev. 2020, 10, 100331. [Google Scholar] [CrossRef]
  24. Khuri, A.I.; Cornell, J.A. Response Surfaces-Designs and Analyses: Revised and Expanded; CRC Press: Boca Raton, FL, USA, 2018. [Google Scholar] [CrossRef]
  25. DB, National Standard of Shanghai City: Living Drinking Water Quality Standard (DB31/T 1091-2018). Available online: https://dbba.sacinfo.org.cn/stdDetail/6930f2db356573fcc8d293c0783ab2e8 (accessed on 31 May 2020).
  26. GB, Standards for Drinking Water Quality (GB5749-2006): National Standard of the Peoples Republic of China. Available online: https://www.chinesestandard.net/PDF.aspx/GB5749-2006 (accessed on 5 May 2020).
  27. ASTMD2035, Standard Practice for Coagulation-Flocculation Jar Test of Water. Available online: https://global.ihs.com/doc_detail.cfm?document_name=ASTM%20D2035&item_s_key=00016243 (accessed on 7 June 2021).
  28. Potter, B.; Wimsatt, J. Method 415.3: Determination of Total Organic Carbon and Specific UV Absorbance at 254 nm in Source Water and Drinking Water; US Environmental Protection Agency: Cincinnati, OH, USA, 2005.
  29. ASTMD2540, Standard Test Method for Drop-Weight Sensitivity of Liquid Monopropellants. Available online: https://global.ihs.com/doc_detail.cfm?document_name=ASTM%20D2540&item_s_key=00016709 (accessed on 7 June 2021).
  30. Boughou, N.; Majdy, I.; Cherkaoui, E.; Khamar, M.; Abderrahman, N. Effect of pH and time on the treatment by coagulation from slaughterhouse of the city of Rabat. MATEC Web Conf. 2018, 149, 02091. [Google Scholar] [CrossRef]
  31. U.S. Environmental Protection Agency. Integrated Science Assessment for Oxides of Nitrogen and Sulfur: Ecological Criteria; EPA/600/R-08/082F; U.S. Environmental Protection Agency: Washington, DC, USA, 2008. Available online: https://www.epa.gov/caddis-vol2/ph (accessed on 17 June 2021).
  32. Kaji, A.; Taheriyoun, M.; Taebi, A.; Nazari-Sharabian, M. Comparison and optimization of the performance of natural-based non-conventional coagulants in a water treatment plant. J. Water Supply Res. Technol. AQUA 2019, 69, 28–38. [Google Scholar] [CrossRef]
  33. Lartey-Young, G.; Ma, L. Optimization, equilibrium, adsorption behaviour of Cu/Zn/Fe LDH and LDHBC composites towards atrazine reclamation in an aqueous environment. Chemosphere 2022, 293, 133526. [Google Scholar] [CrossRef]
  34. Choi, A.E.S.; Roces, S.A.; Dugos, N.P.; Wan, M.W. Ultrasound assisted oxidative desulfurization: A comprehensive optimization analysis using untreated diesel oil. Comput. Chem. Eng. 2022, 166, 107965. [Google Scholar] [CrossRef]
  35. Barilla, G.R.H.; Chen, C.A.W.; Valencia, M.Z.M.; Dugos, N.P.; Choi, A.E.S. Mixing assisted oxidative desulfurization using a synthesized catalyst of the activated carbon supported phosphotungstic acid: A process optimization study. S. Afr. J. Chem. Eng. 2022, 42, 61–71. [Google Scholar] [CrossRef]
  36. Dahiru, T. P-value, a true test of statistical significance? A cautionary note. Ann. Ib. Postgrad. Med. 2008, 6, 21–26. [Google Scholar] [CrossRef] [Green Version]
  37. Ölmez, T. The optimization of Cr(VI) reduction and removal by electrocoagulation using response surface methodology. J. Hazard. Mater. 2009, 162, 1371–1378. [Google Scholar] [CrossRef]
  38. Ghafari, S.; Aziz, H.A.; Isa, M.H.; Zinatizadeh, A.A. Application of response surface methodology (RSM) to optimize coagulation–flocculation treatment of leachate using poly-aluminum chloride (PAC) and alum. J. Hazard. Mater. 2009, 163, 650–656. [Google Scholar] [CrossRef] [PubMed]
Figure 1. Schematic illustration of the experimental setup.
Water 15 00853 g001
Figure 2. (a) pH and (b) temperature range as a function of each coagulant dose. Note(s): PAC = polyaluminium chloride; AS = aluminium sulfate; PASS = polyaluminium silicate sulfate; and FS = ferric sulfate.
Water 15 00853 g002
Figure 3. Predicted vs. residual values plots for TOC (a,b), TN (c,d), and TSS (e,f).
Water 15 00853 g003
Figure 4. (a) 3D surface plot for TOC removal, (b) 3D surface plot for TN removal, (c) 3D surface plot for TSS removal.
Water 15 00853 g004aWater 15 00853 g004b
Table 1. Characteristics of raw water from the Yangtze River (values are means ± standard deviation, where n = 15).
Samples’ ParametersUrban Drinking Water Treatment Standards
Shanghai Standard (DB31/T1091-2018) [25] China National Standard (GB5749-2006) [26]
pH7.71 ± 0.20≥6.5 ≤8.56.5–8.5
Temperature (°C)22.01 ± 1.05--
Turbidity (NTU)144.89 ± 96.44<0.53
TOC (mgL−1)6.54 ± 6.12<35
TN (mgL−1)2.52 ± 0.63<0.151
TSS (mgL−1)295.14 ± 140.62<5001000
Table 2. List of independent variables and their levels.
FactorsUnitCodeLevels
LowHigh
pH- x 1 57
Temperature°C x 2 2122
DosagemgL−1 x 3 580
Table 3. Matrix of observed and predicted values.
Runsx1x2x3TOCTNTSS
OPOPOP
162142.52.024.121.692.1297.878.6
262142.51.544.121.432.1265.378.6
3521801.74−2.151.452.03122.2129.7
4721801.241.411.121.17190.3181.3
5620521.3619.81.411.7277.673.5
6622805.547.12.281.98110.6114.7
762142.58.814.123.232.1272.878.6
8622552.843.193.5260.062.6
972152.776.662.752.17120.8113.3
10620802.634.793.212.87131.9129.3
1152242.52.975.32.532.25114.5103.0
1252042.53.755.491.481.2371.566.6
1352153.533.351.481.4380.789.7
1472042.518.3916.061.441.72141.9153.4
1572242.53.331.61.371.6286.591.4
Note(s): O = observed; P = predicted.
Table 4. Analysis of variance (ANOVA) data for PAC treatment of TOC, TN, and TSS.
TOCTNTSS
SourceF-Valuep-ValueF-Valuep-ValueF-Valuep-Value
A-pH1.250.3143 b0.01170.9181 b11.640.019 a
B-Temp5.680.0629 b0.64120.4596 b1.350.2984 b
C-Dosage3.060.1406 b0.11350.7499 b23.930.0045 a
AB2.70.1615 b0.4760.5209 b9.950.0253 a
AC0.00090.977 b0.97350.3691 b0.80060.4119 b
BC4.920.0774 b2.760.1574 b0.01390.9107 b
A20.54130.4949 b2.150.2026 b12.950.0156 a
B24.230.0947 b0.23360.6493 b0.27450.6227 b
C20.00390.9527 b0.22140.6578 b6.470.0517 b
Residual
Lack-of-Fit1.240.47620.49340.72260.72730.6231
p < 0.05 (significant); p > 0.05 (non-significant); a significant; b non-significant.
Model Parameters
ParameterR2Adjusted R2Adequate PrecisionPRESS
TOC0.81930.49416.18881055.62
TN0.60880.09543.549726.68
TSS0.93030.80489.319711467.34
Table 5. Optimized condition for TOC, TN, and TSS removal.
pHTemperature
(°C)
Dosage
(mgL−1)
TOC
(mgL−1)
TN
(mgL−1)
TSS
(mgL−1)
Desirability
6.9209.722.1741.753129.3581
Disclaimer/Publisher’s Note: The statements, opinions and data contained in all publications are solely those of the individual author(s) and contributor(s) and not of MDPI and/or the editor(s). MDPI and/or the editor(s) disclaim responsibility for any injury to people or property resulting from any ideas, methods, instructions or products referred to in the content.

