Article

Automated Mapping of Wetland Ecosystems: A Study Using Google Earth Engine and Machine Learning for Lotus Mapping in Central Vietnam

1
Faculty of Land Resources and Agricultural Environment, University of Agriculture and Forestry, Hue University, Hue City 530000, Vietnam
2
Laboratory of Environmental Sciences and Climate Change, Institute for Computational Science and Artificial Intelligence, Van Lang University, Ho Chi Minh City 700000, Vietnam
3
Faculty of Environment, School of Technology, Van Lang University, Ho Chi Minh City 700000, Vietnam
4
Faculty of Agronomy, University of Agriculture and Forestry, Hue University, Hue City 530000, Vietnam
5
Centre for Climate Change Study in Central Vietnam, University of Agriculture and Forestry, Hue University, Hue City 530000, Vietnam
6
Faculty of Fisheries, University of Agriculture and Forestry, Hue University, Hue City 530000, Vietnam
*
Author to whom correspondence should be addressed.
Water 2023, 15(5), 854; https://doi.org/10.3390/w15050854
Submission received: 17 January 2023 / Revised: 15 February 2023 / Accepted: 17 February 2023 / Published: 22 February 2023

Abstract

:
Wetlands are highly productive ecosystems with the capability of carbon sequestration, providing an effective solution for climate change. Recent advancements in remote sensing have improved the accuracy in the mapping of wetland types, but there remain challenges in accurate and automatic wetland mapping, with additional requirements for complex input data for a number of wetland types in natural habitats. Here, we propose a remote sensing approach using the Google Earth Engine (GEE) to automate the extraction of water bodies and mapping of growing lotus, a wetland type with high economic and cultural values in central Vietnam. Sentinel-1 was used for water extraction with the K-Means clustering, whilst Sentinel-2 was combined with the machine learning smile Random Forest (sRF) and smile Gradient Tree Boosting (sGTB) models to map areas with growing lotus. The water map was derived from S-1 images with high confidence (F1 = 0.97 and Kappa coefficient = 0.94). sGTB outperformed the sRF model to deliver a growth map with a high accuracy (overall accuracy = 0.95, Kappa coefficient = 0.92, Precision = 0.93, and F1 = 0.93). The total lotus area was estimated at 145 ha and was distributed in the low land of the study site. Our proposed framework is a simple and reliable mapping technique, has a scalable potential with the GEE, and is capable of extension to other wetland types for large-scale mapping worldwide.

Graphical Abstract

1. Introduction

Wetlands are a distinct ecosystem, permanently or seasonally covered by water with living vegetation, and are widely distributed across climatic regions in the forms of swamps, marshes, bogs, and similar areas [1]. Similar to seagrass meadows and mangrove forests, wetlands are considered an effective solution for climate change through the maintenance of wetland ecosystem services, including water filtration, providing habitats for aquatic animals, coastal protection, carbon stock, production, water storage, and cultural services (i.e., eco-tourism, education) [2,3]. The capability of carbon sequestration, promoted as a valuable wetland service, has been validated in several research works, with an emphasis on the requirement of maintaining a healthy and large area of wetland [4,5]. Despite an improved awareness of the central role of wetlands, the habitat is narrowing in both terms of area and living conditions worldwide [6,7], which is leading to potential CO2 emissions and the reversal of the effort of climate change [3,8]. Different approaches have been used to improve the conservation of wetland ecosystems, and remote-sensing-based mapping has been widely implemented to support the process of inventory, monitoring, and reporting on wetland dynamics. Remote sensing is an advanced approach used to monitor a variety of biophysical parameters, water quality, and ecosystem services worldwide [9,10].
During the last decade, the literature has revealed a variety of remote sensing techniques and satellite images used for the mapping and monitoring of wetlands [11,12]. Wetlands have been mapped using very high spatial resolution (VHR) imagery (WorldView, RapidEye, Quickbird) [13,14,15], LiDAR [15,16], ALOS–1 PALSAR, Radarsat–2 [17], and Sentinel and Landsat images, together with both traditional and machine learning (ML) classifications [18,19,20]. Despite the diverse approaches of remote sensing, the classification accuracy strongly varies by study site (46–94%) [13,19], with required budgets for the VHR image, and additional human resources for satellite image manual processing and analysis. We also note that mapping has been implemented for only a small number of wetland types in natural habitats [13,16,19], which indicates a literature gap in regard to the monitoring of wetland dynamics in large-scale production systems.
Together with the increase in big data, novel processing cloud-based workflows have been introduced in a manner of transition from manual to semi-automatic to automatic processing of remote sensing data to deliver results in a reliable and scalable framework [21]. Among the cloud-based processing services, the Google Earth Engine (GEE) provides a rational and scalable platform for Earth Observation (EO) and spatial data processing using qualified workflows and is capable of integrating the processing of big data and state-of-the-art data mining models to various scales. Recently, the GEE has been used in a variety of fields, from geology and biology to ecology, with varying levels of success [22,23]. Different applications have used the GEE to map the current distribution or the change detection of both large and small wetland dynamics [24,25,26,27,28], which indicates a great potential of the GEE for different scale mapping of wetland ecosystems. Despite this, almost all research requires complex input data (i.e., data transformation, LiDAR, and multi-source datasets), varying in classification accuracy (85–97%), and leverages the powerful prediction of the ML boosting algorithm to different extents. Other research papers have adapted the GEE for water body extraction using a variety of satellite sensors and delivery methods. The most recent papers have leveraged the GEE to process both multi-spectral Sentinel-2 (S-2), Landsat-8 and synthetic aperture radar (SAR) Sentinel-1 (S-1) images using deep learning (DL) frameworks [29,30,31]; similar data sources of satellite sensors, histogram based, machine learning (ML), and clustering (i.e., K-Means) classifications have been implemented [32,33,34] to derive a scalable water map. ML and DL coupled with the GEE has the potential to derive high quality maps of water distribution, despite the implementation of the model being very complex in practice. The clustering method, on the other hand, enable the fast, simple, and automatic mapping of water bodies with sufficient confidence [32].
Globally, wetlands are diverse in spatial distribution, with different types of ecological habitats [35]. Lotus (Nelumbo nucifera Gaertn.) [36] cultivation can be used in the sustainable conservation of wetland ecosystems [37,38] and provides high-value economic products to communities worldwide [37,39]. Rapid mapping and inventory of growing lotus habitats, therefore, are needed to find baseline data for further management of growing areas and the development of feasible livelihoods for farmers in different regions. In central Vietnam, lotus is recognized as a valuable native product whose production supports the long-term livelihood of local farmers [40]. As a type of wetland ecosystem, growing lotus secures the wetland areas for further climate change mitigation strategies. Field surveys reveal that lotus grows in a variety of shapes and sizes in the water bodies in areas of highly impacted anthropogenic activities. However, geographic information system (GIS) and remote sensing datasets of growing water bodies and growing lotus are unavailable, causing significant challenges for the effective management and long-term development of the growing area.
In this study, we developed a novel integrated approach to automate the mapping and inventory of growing lotus in a large production system. We validated the performance of the bagging and boosting models for lotus mapping using synthetic aperture radar (SAR) S-1 and multi-spectral S-2 images in the powerful cloud-based GEE environment. Because lotus grows in diverse shapes and sizes of water bodies, we proposed an automatic workflow in the two steps of (i) automatically deriving the water bodies from S-1; and (ii) automatically mapping the growing lotus from S-2 images in the GEE. The results are expected to provide an efficient, reliable, and simple approach for an accurate inventory and mapping of wetland ecosystems, especially for lotus habitat development at different scales worldwide.

2. Study Site and Methodology
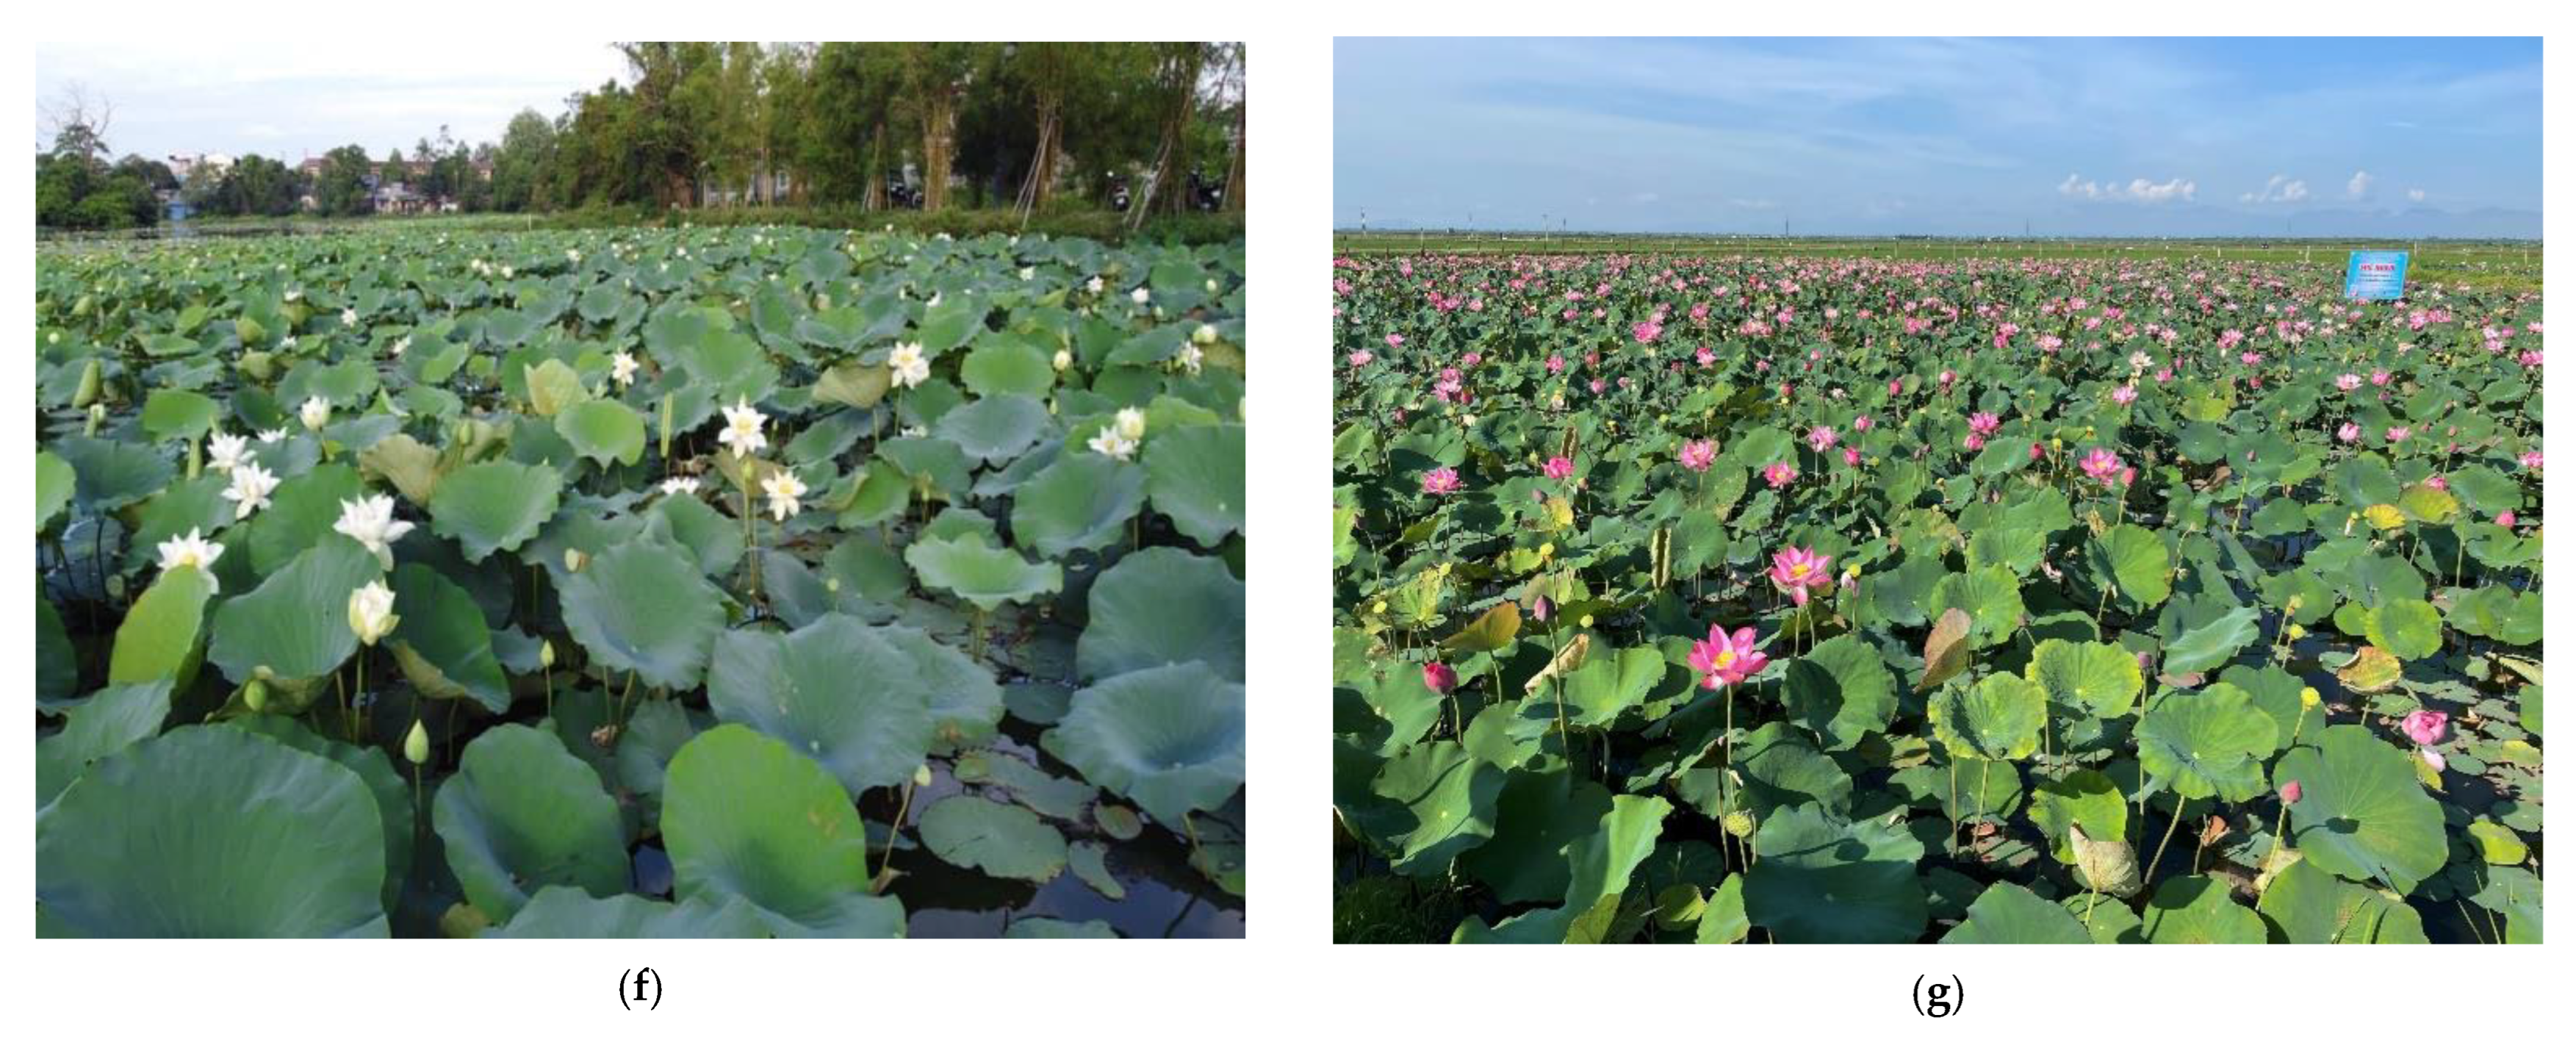
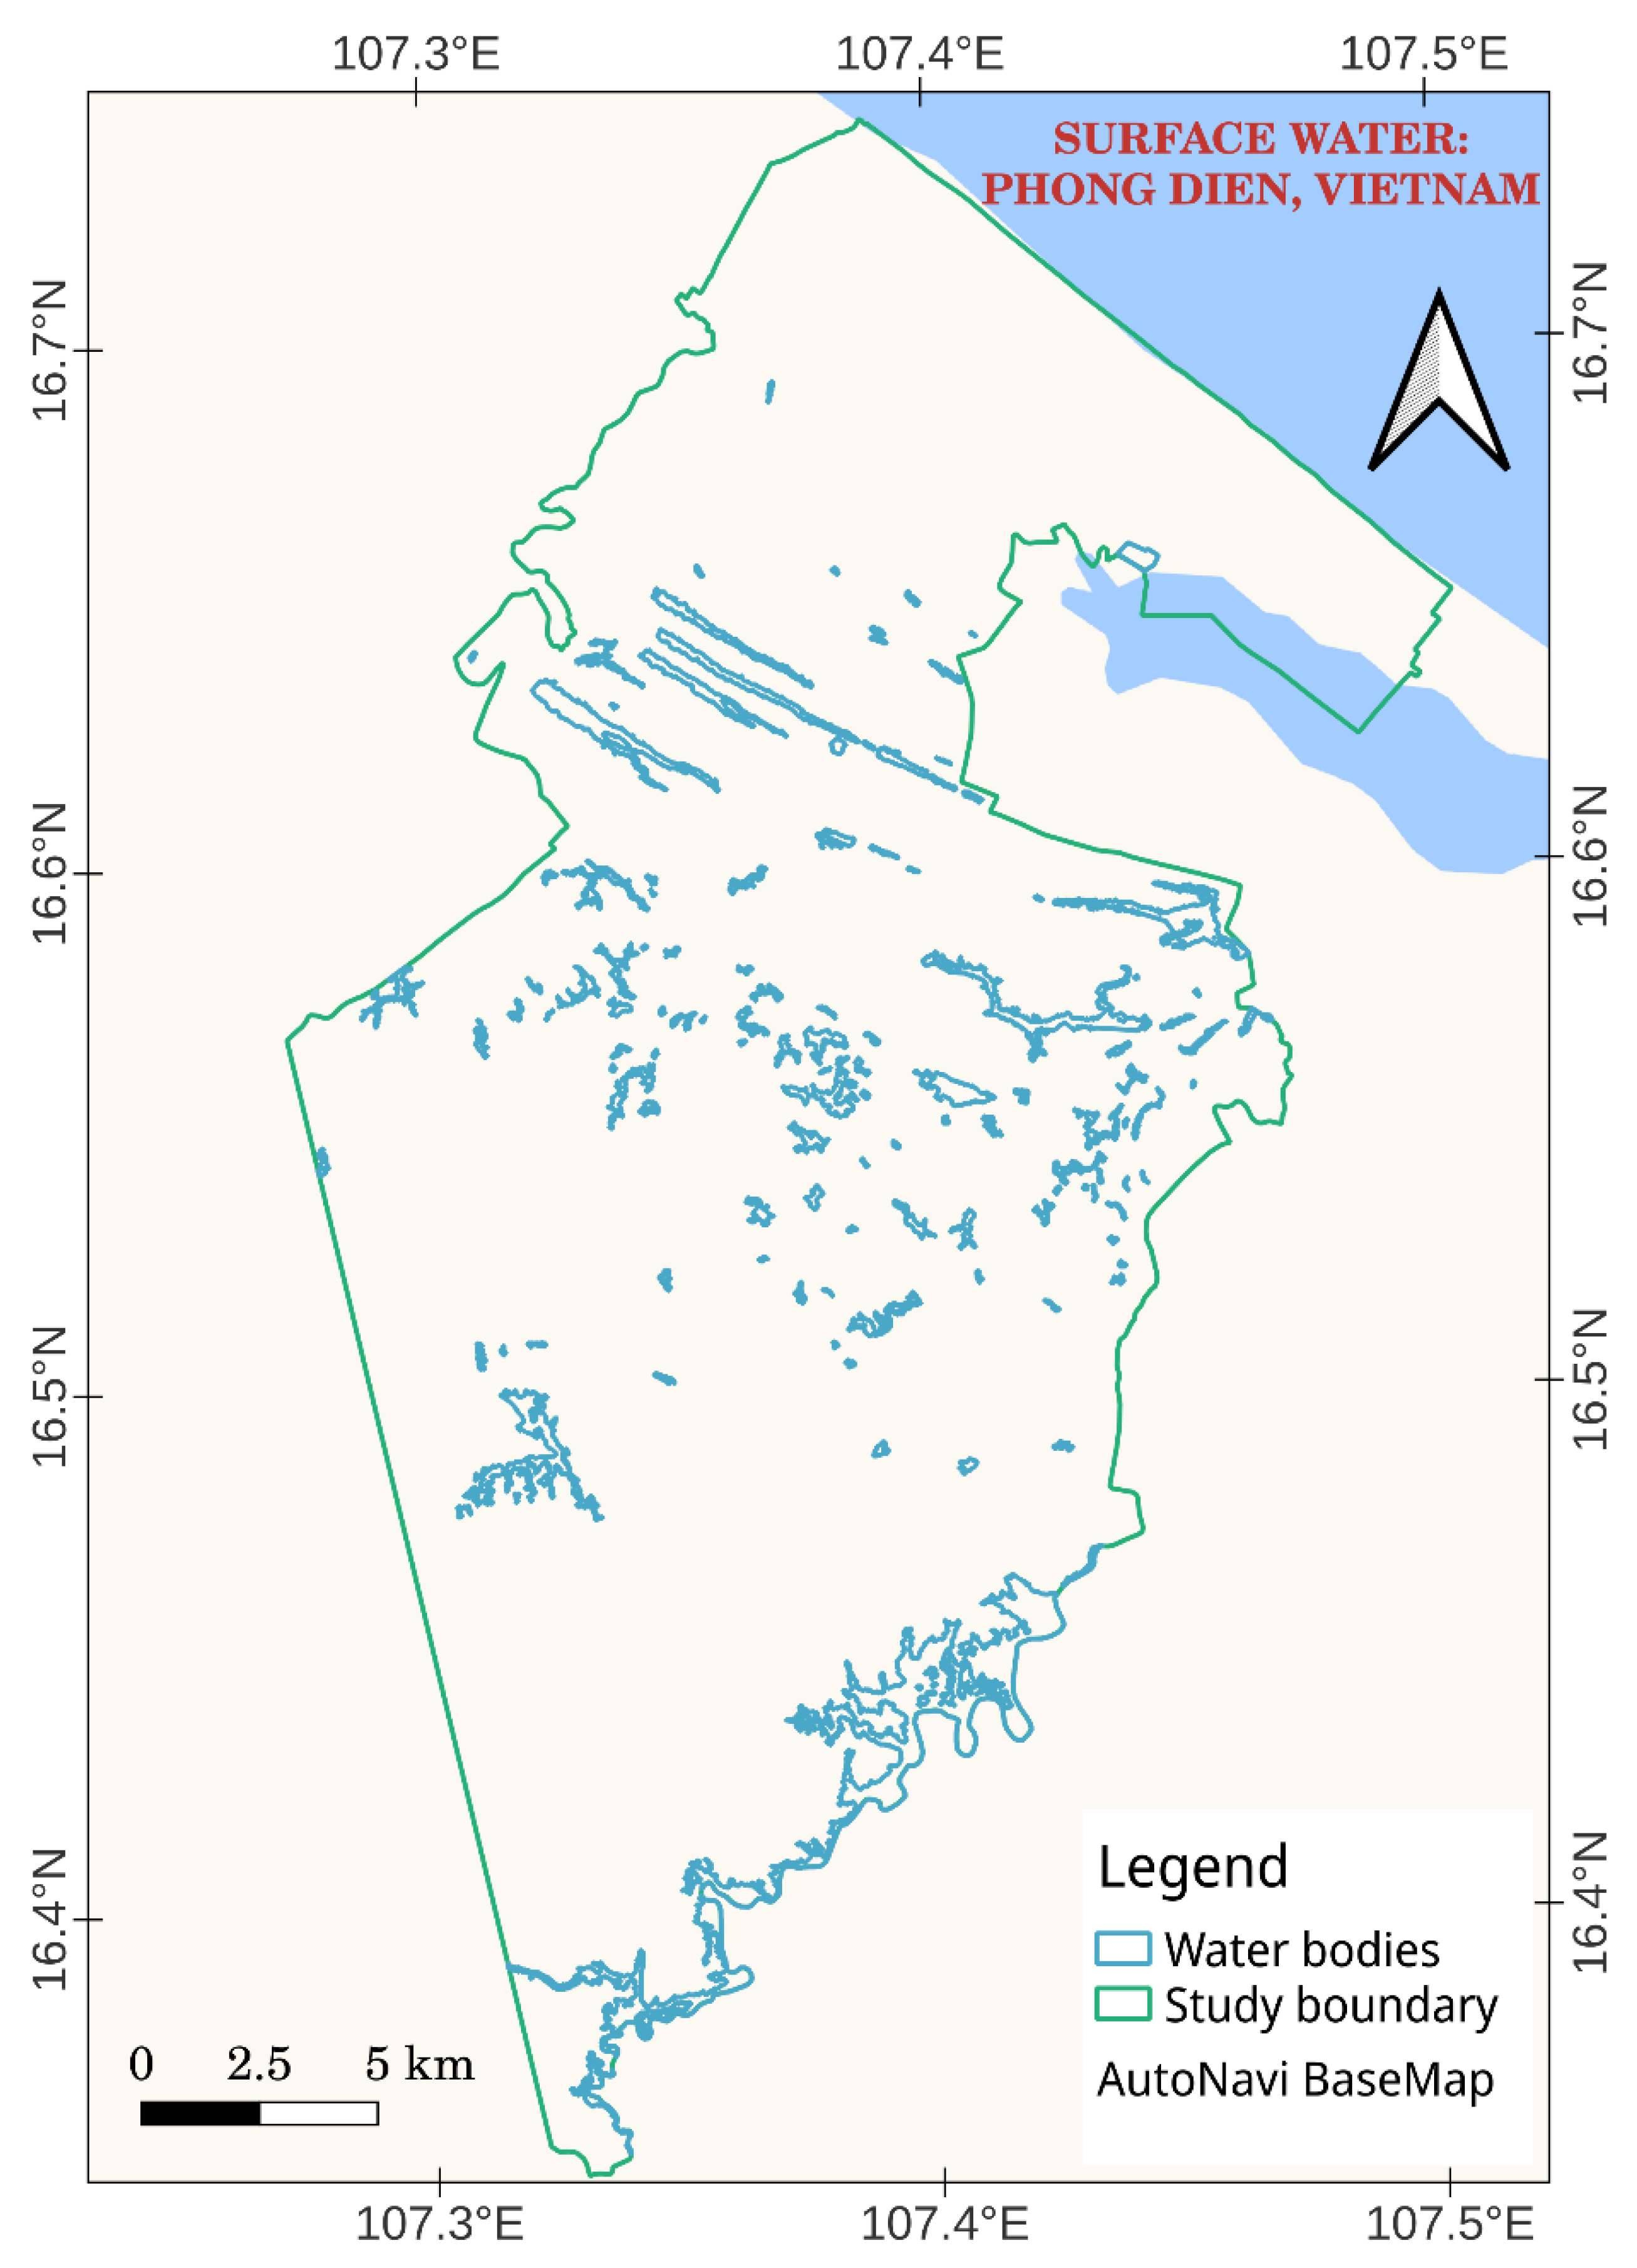
2.1. Study Site

Phong Dien, a district in central Vietnam, was selected as our study site (Figure 1). Here, lotus has been grown for a long time, with the largest growth area in Thua Thien Hue province, and is an important source of livelihood to local people. The lotus crop grows from February to August. The water bodies are diverse in shapes and sizes, spreading over the entire district, and are strong potential sites for growing lotus. Despite this, an official map of all water bodies is not available and raises the challenge of the accurate mapping of lotus-growing locations. The start dates of the lotus crop are different for local farmers; hence, lotus cover will differ in temporal and spatial distribution. During the productive season, the lotus area ranges from a few hectares (ha) to a maximum of 350 ha, and therefore requires a scalable method to spatially quantify the productive area.

2.2. Methodology

The mapping of the lotus area was implemented in a two-step framework, including (1) automatic extraction of water bodies (the habitat of lotus) from S-1 imagery and (2) automatic mapping of growing lotus area from S-2 imagery using the ground truth points (GTPs) of different classes with ML smile Random Forest (sRF) and smile Gradient Tree Boosting (sGTB) (Figure 2). Image processing and mapping were both automatically implemented in the GEE platform.

2.2.1. Ground Truth Points (GTPs) Collection

Given the characteristics of growing lotus and distribution, we collected the GTPs of the three classes of other vegetation (class 1), lotus (class 2), and water bodies (class 3). The field campaign ran from 15 June to 20 July, which overlapped with the S-2 image acquisition (19 June). The two-person team consented to collect the GTPs over the productive areas of lotus, in which additional GTPs were gathered in the case of closed habitats of class 1 and class 2. Because we used the spectral reflectance of the satellite image as input data for the classification, only areas with growing lotus were considered as class 2 (lotus), and otherwise were class 1 (other vegetation) or class 3 (water bodies). GTPs of water and non-water classes (i.e., lotus and vegetation classes) were collected in stable and large areas in the study site. There were 353 GTPs of lotus, 360 GTPs of other vegetation, and 380 GTPs of water bodies collected during the field survey (Figure 1).

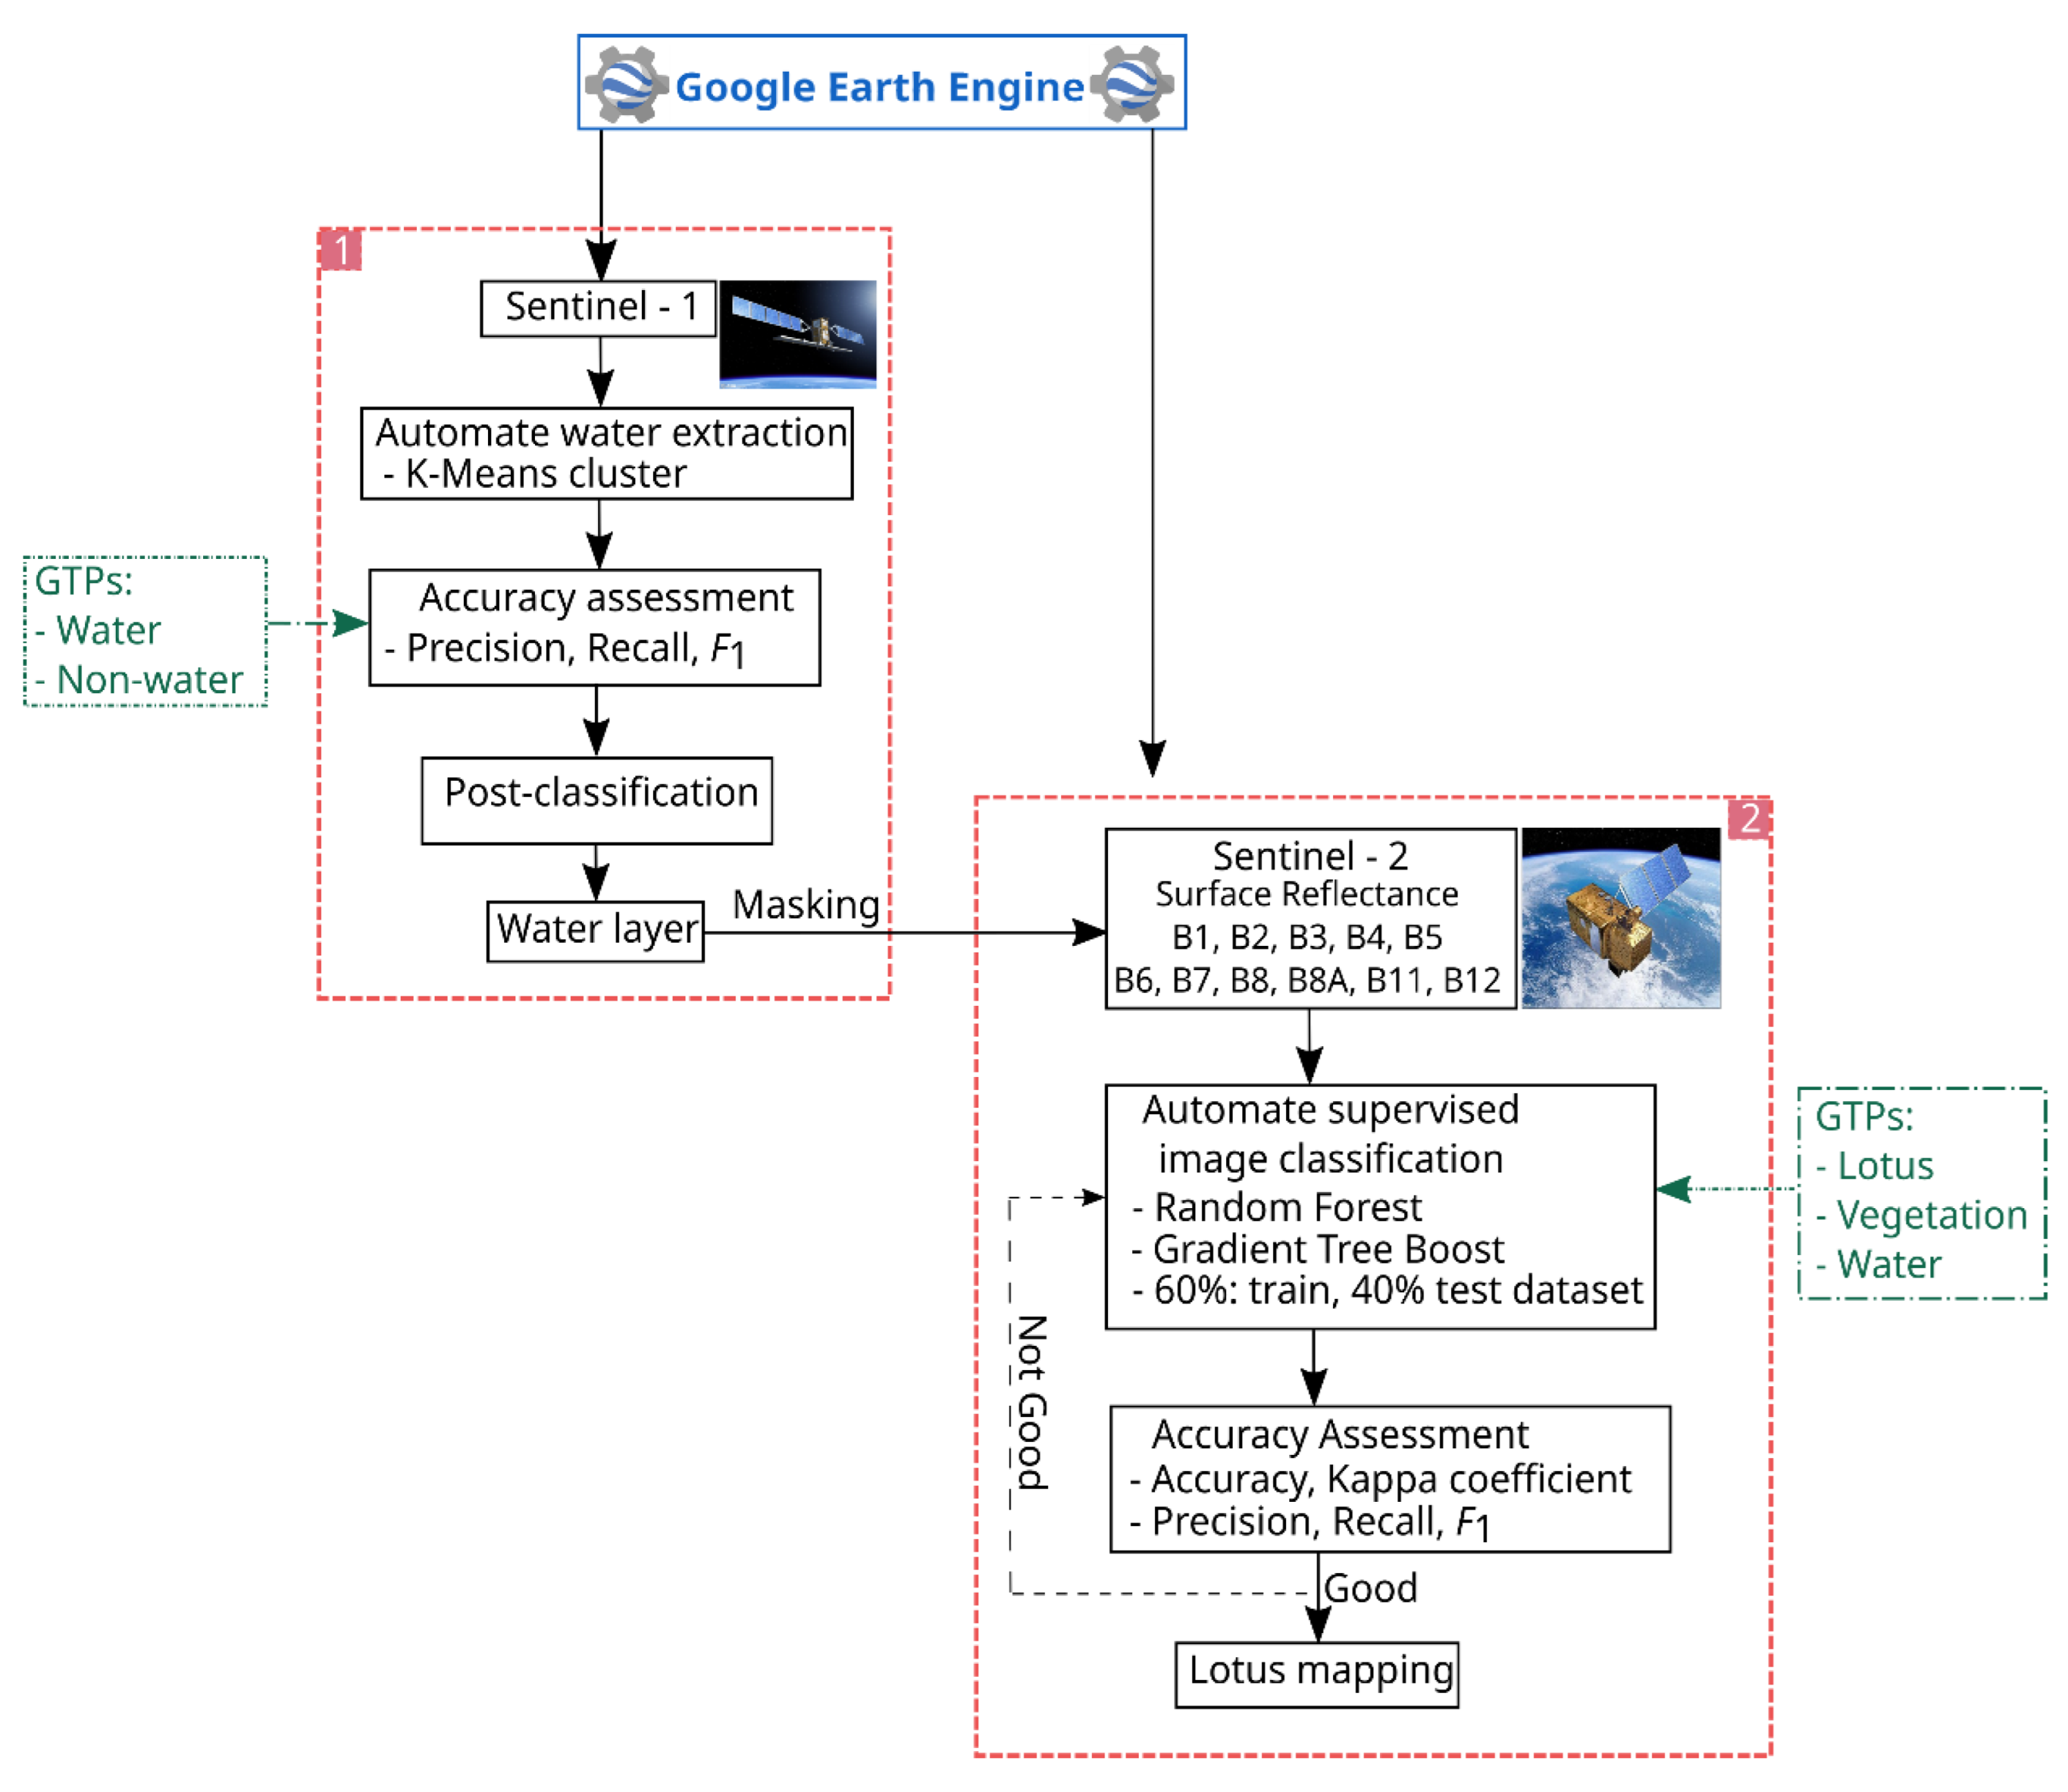
2.2.2. Satellite Image Acquisition

We collected the two scenes of S-1 and S-2 images for the presented procedures (Figure 1 and Figure 2). Considering the lotus’ growing season (February–August), the S-1 scene was selected in the local rainy season (September–December) (Table 1) to maximize the detection of water bodies without flooding. S-2 image was considered with cloud impactless and acquired in the growing season of lotus (Table 1). S-1 and S-2 images were pre-processed to the values of backscattering coefficient (σ0, decibel unit) and surface reflectance (unitless), and retrieved from the Earth Engine data catalog (https://developers.google.com/earth-engine/datasets/catalog, accessed on 10 December 2022), respectively using the GEE. Satellite images were automatically clipped within the study boundary and extracted to the desired bands (Table 1) in the GEE environment.

2.2.3. Water Extraction

We applied the K-Means clustering algorithm to detect the water cluster and extract to the water map in the GEE. The K-Means technique is a popular unsupervised classification technique, which has been widely applied in different research works with success [41,42]. The K-Means technique has no requirement for a labeled dataset, which makes the classification simpler, reducing the cost of field work and labeling data. During the implementation of the algorithm, K-Means randomly selects a potential centroid, which is characterized as the k centroids or k clusters, and then attempts to minimize the total sum of the squared errors. Given an assumption of xi observations in a range {x1, x2, …., xn}, and ci centroids in a range {c1, c2, …, ck}, the centroid C is found to minimize the total sum of squared error, as follows:
J ( x ) = j = 1 k i = 1 n x i ( j ) c j 2
and finally, assigning the observation xi to the cluster cj when the algorithm reaches the desired number of iterations.
Because the backscattering values of the water class are unique in the S-1 image, it can detect water bodies with a simple configuration of the K-Means (Table 2).
During the field survey, we validated the different functionalities of water bodies in the study site, e.g., the use of water for aquaculture industries, rice production, and the remaining open water for other purposes (i.e., lotus growing, free-use water, water storage). Therefore, the map of the water surfaces was processed (post-classification phase) to remove the water bodies that were specifically used for other industries (i.e., aquaculture, culture industry, and rice fields), to keep only the open water bodies, and was applied as a mask for the lotus mapping. The reason for using the K-Means rather than other ML models is due to validating the K-Means performance and suggesting an automatic approach for water body extraction. We extracted the water and non-water clusters, then evaluated the clustering accuracy using similar truth data from the field work (Figure 1).

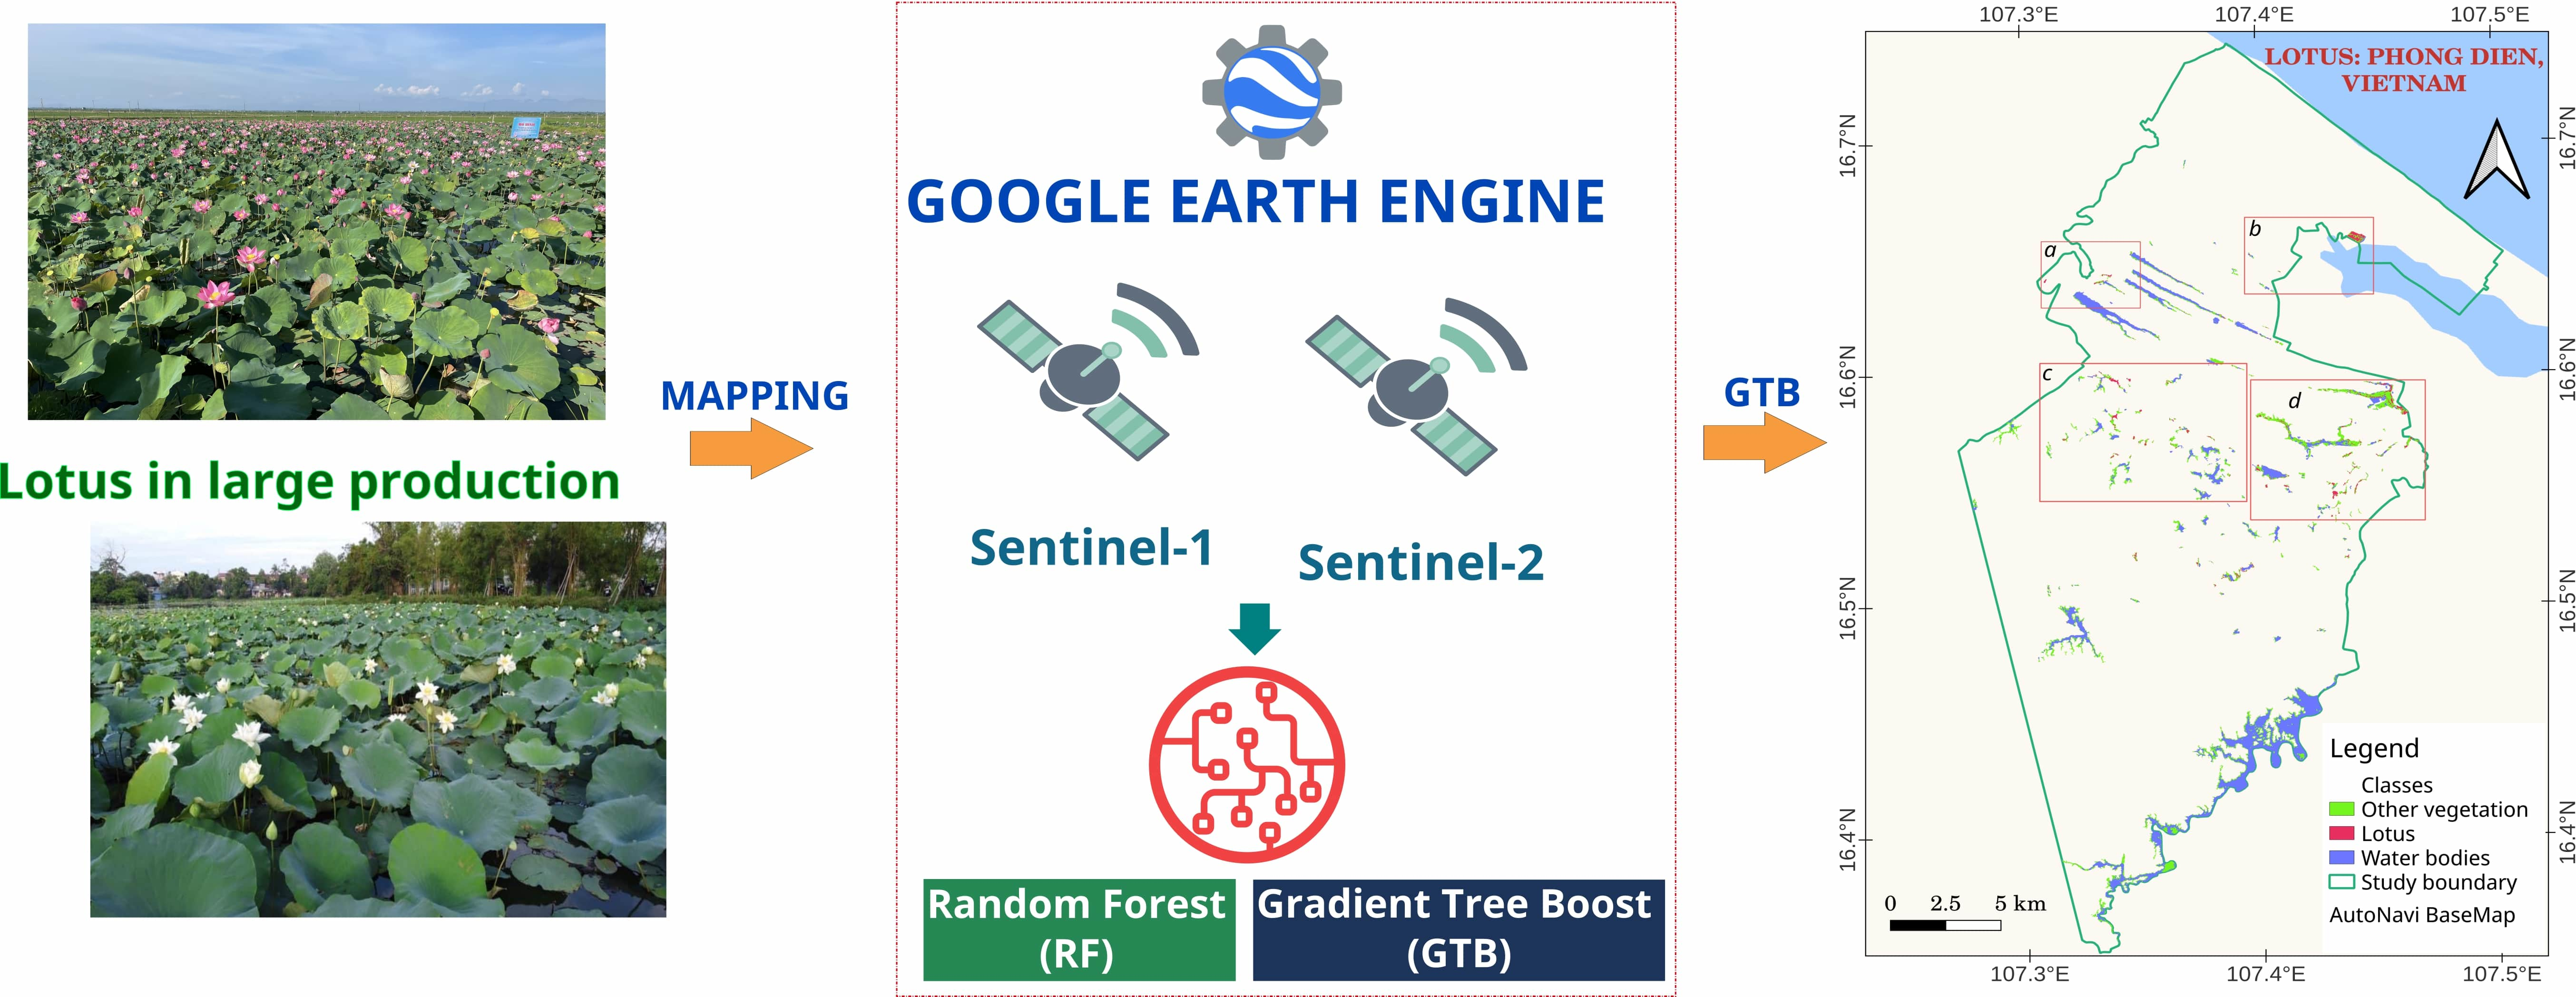
2.2.4. Lotus Mapping

Random Forest (RF)

RF is a common ML algorithm [43], which has been successfully deployed for a variety of ecosystem mapping and biophysical parameter retrieval studies [44]. As a non-parametric method, RF can deal with both noisy and non-linear data and works well with large datasets. In a classification scheme, RF derives the desired output using a forest of decision trees, in which the number of trees, maximum feature, and maximum depth are the most important parameters. The user validates the model performance over different combination of the model hyper-parameters using different optimization schemes (e.g., GridSearch or Bayesian optimizing). In the GEE, RF is introduced as a modified version under the name smile Random Forest (sRF) [45], which was created in the JavaScript language using the framework of statistical machine intelligent and learning engine (SMILE) [46]. sRF has a similar structure of the algorithm to the original RF, except for the tree size regularization using the parameters maxNode and nodeSize.

Gradient Boosting Tree (GBT)

GBT works in a different prediction structure from the RF, in which the RF trains the parallel models using a subset of the dataset whilst the GBT sequentially trains the model and aims to reduce the errors of previous predictive models [47]. In the GBT structure, decision trees are known as weak learners, of which the next decision trees are added into the model to minimize the loss function. Following this approach, additional sub-models (i.e., additional decision trees) improve the accuracy and reliability of the predictive results. GBT is characterized by three groups of parameters, including the structure of the decision tree (number of trees, depth, nodes, and splitting of tree), the weighting of the decision tree’s contribution (learning rate), and the constraining of the decision tree (random sub-sampling and adding the regularization parameter to avoid over-fitting). Similar to sRF, GBT is used in the GEE in the form of smile Gradient Tree Boost (sGTB) [48] using the SMILE framework and has similar parameters to the original GBT.
Given the diversity of the water bodies and the complex spatial distribution of the lotus and other vegetation, supervised ML models were implemented to improve the classification reliability. We compared the performance of the sRF and sGTB ML models in extracting the lotus from the classes of other vegetation and water bodies. The GTPs were used to derive the regions of interest (ROIs) within the study site. In total, there were 4424 (60%) and 2907 (40%) pixels extracted for the training and testing of the models. The mapping was implemented in the two following steps of (1) tuning the sRF and sGTB hyper-parameters (Table 3) and (2) training and validating the sRF and sGTB models to the S-2 image for the classification of growing lotus. We employed the built-in codes in the GEE environment to search for the best hyper-parameter spaces, used “ee.Classifier.smileRandomForest” and “ee.Classifier.smileGradientTreeBoost” for the classification, extracted the metrics, and compared the performance using the metrics of accuracy, Kappa coefficient, precision, recall, and F1 score.

2.3. Evaluation Metrics

We used the standard metrics for performance evaluation of the models, including the overall accuracy (OA), Kappa coefficient ( κ ), precision, recall and F1 scores (Equations (2)–(6)). Kappa coefficient measures the differences in agreement between the two rates of observed and expected agreement in a classification practice, in which a coefficient higher than 0.8 indicates sufficient confidence in the model’s performance [49]. F1 harmonizes the weighted means between precision and recall metrics and is used as a common score for validation of the accuracy in classification process [50]. The higher the values of the metrics, the higher the confidence of the model in delivering the designed classes in the study.
O A ( y i , y pred ) = 1 n samples i = 0 n samples 1 1 ( y predi = y i )
in which:
y pred : predicted value;
y i : corresponding true value;
nsamples: total number of validation samples.
κ = p o p e 1 p e
in which:
p o : probability of observed agreement;
p e : probability of expected agreement.
Precision = ( TP ) ( TP ) + ( FP )
Recall = ( TP ) ( TP ) + ( FN )
F 1 = 2 × Precision   ×   Recall Precision   +   Recall
in which:
TP : true positive;
FP : false positive;
FN : false negative.

3. Results and Discussion

3.1. Automated Water Extraction Using the GEE

The K-Means clustering method successfully derived the water map from S-1 imagery with a high confidence (Table 4). Given an S-1 scene in the rainy season (October 2020), the proposed technique was capable of identifying a large proportion of water bodies (recall 0.99) at a misclassification of 4% (precision 0.96, Table 4). The non-water class was classified at a high precision (0.99), but the model omitted 6% of the image pixels, which were assumed to be a confusion of inundated areas in the rainy month (areas were only covered with water in the rainy season).
Despite a rate of class omission, the Kappa coefficient indicates a good agreement (0.94) between the classified pixels and the truth data, which emphasizes the reliability of the method. Given the pixel size of S-1 imagery (10 m resampling), surface water area was estimated as 2695 ha with a high variety of spatial distribution, object shapes, and areas (Figure 3), in which a large proportion of water bodies were found in the middle region of the study site. Water bodies in the northern area, e.g., aquaculture ponds, artificial constructions for the aquaculture culture industry, and inundated rice fields, were removed from the map in the post-classification phase.

3.2. Automated Lotus Mapping Using the GEE

The lotus was extracted from other vegetation and water body classes at different levels of confidence. The sGTB detected the lotus distribution with precision and F1 scores of 0.93, which were higher than the sRF model of 14% and 10.7%, respectively. The model’s reliability and consistency were evaluated with the Kappa coefficient, which indicated a higher accuracy and reliable performance of the sGTB over the sRF model for lotus mapping (Table 5).
As a more reliable model, the feature importance was derived from the sGTB model to visualize the contribution of the input variables (Figure 4). We found that all the bands of the S-2 image had a level of contribution to the sGTB model. Accordingly, the coastal band had the greater importance (20.4%), followed by the blue (14.1%), the red (11%), the SWIR2 (9%), and the RE2 (8.3%). The green, RE1, RE3, NIR1, NIR2, and SWIR1 bands contributed approximately 30.1% to the model performance.
We noted that the first two coastal and blue bands accounted for approximately 34.5% and the red domain accounted for 32.4% of the performance of the sGTB model. The map of lotus was derived from the sGTB model (Figure 5), indicating approximately 145 ha of growing lotus area at the satellite image acquisition date.
Lotus was grown in a variety of water bodies and was almost distributed solely in the middle part of the study site, with estimated areas varying from ~0.01 ha to ~16 ha. The map determined an area of lotus (~16 ha) growing inside the rice fields in the northern part of the site.

3.3. Discussion

In this study, we presented an automatic approach to mapping the distribution of the water surface and the growing lotus areas using a range of both unsupervised and supervised classification methods in the GEE platform. Unsupervised K-Means is capable of detecting water bodies with high confidence (F1 score 0.97, Table 4) using an S-1 scene in the rainy season, in which lotus was not grown, to maximize the detection of all water bodies in the study site. This approach is automatic and appropriate for the mapping of water bodies of different shapes and sizes. The K-Means technique worked seamlessly with a few parameters (Table 2) to optimize the position of the potential centroids in a small number of iterations (n = 20). Considering recent research using the K-Means for creating training datasets [34] or classifications [32], which reached an accuracy of 0.95 for water mapping, our result is promising (precision 0.96, F1 0.97) given the diverse sizes and spatial distribution of the water bodies in the study sites. The K-Means technique coupled with S-1 imagery presented a great potential for automatic extraction of water from other surfaces, providing accurate detection of the water bodies as the input data for the mapping of the growing lotus. sRF and sGTB are validated ML models in the GEE, and the metrics indicated a greater performance of the sGTB than the sRF models for the three classes (lotus, water bodies, and other vegetation). The sGTB detected the growing lotus at ~11% higher confidence (Kappa coefficient 0.92) with closed ranges of the precision and recall metrics, which suggested that the sGTB was able to find and precisely classify all the potential growing lotus in a given site. sRF and sGTB are common and well-implemented bagging and boosting models in the literature of remote sensing applications, in which boosting has outperformed the bagging group in various case studies [51,52,53,54].
We observed that using the boosting approach, sGTB is efficient in algorithm implementation, reduces the overfitting, and improves the prediction accuracy. In Phong Dien, lotus grows in a variety of shapes and sizes in the water bodies, which increased the challenges for detecting the lotus patterns in the image. The field survey determined a discontinued distribution of growing lotus in small areas (100–300 m2), which was close to the size of one image pixel and increased the challenges for the model in terms of classification. Despite this, the sGTB model confidently derived the lotus map at a sufficient accuracy with the automatic processing workflow in the GEE. Similar research works using the GEE for wetland mapping have been deployed for natural wetland habitats using a variety of multi-source dataset of S-1, S-2, Landsat images, and LiDAR datasets for data transformation to extract the texture differences in time scales. The mapping accuracy varies with different transformed data and the classification models, ranging from 0.80–0.85 using the sRF and the boosting decision tree to 0.91–0.96 using the Classification and Regression Tree (CART), the sRF, and the adaptive-stacking classification models. Considering the heterogeneity in spatial distribution and diverse sizes of the water bodies with lotus in our study site, the success of the sGTB model in the lotus mapping (overall accuracy 0.95 and precision 0.93) suggested that it is a reliable technique to detect the lotus from other habitats using only the original bands of S-2 imagery. It is noted that the first group of the coastal (443 nm) band contributed roughly 20%, the second group of the blue, red, RE2, and SWIR2 bands covered approximately 43%, and the third group of the green, RE1, RE3, NIR1, NIR2, and SWIR1 bands extracted about 37% of the land cover differences (Figure 4), which coincided with the selection of S-2 bands in the literature [55,56] and provided a variety of input features for the sGTB model in this study. The coastal band was previously adapted to derive the MERIS global vegetation index (MGVI) [57] for vegetation detection and health assessment, and it has been specifically used for water detection and bathymetry mapping recently [58,59]. The blue, NIR2, SWIR1, and SWIR2 bands provided essential extraction of the differences of vegetation health (i.e., the greenish shades of the vegetation) and land cover textures [56], therefore presenting a higher impact on the implementation of the sGTB for the lotus mapping.
Our proposed workflow is simple in its implementation, without further requirements of input data transformation, is reliable with the state-of-the-art image processing and classification model, and is scalable using the GEE. We validated a high accuracy (F1 score 0.93) with S-2 imagery at a spatial resolution of 10 m with the ML boosting model (sGTB) for growing lotus mapping. Further improvement in the mapping confidence might be obtained with VHR and unmanned aircraft system (UAS) images, which have a great potential to be integrated with the GEE to improve its precision in recognizing water bodies and growing lotus [60]. VHR and UAS imagery offer a lower number of spectral bands but have a very fine scale of pixel size (centimeters to a few meters), and therefore might enable an accurate discrimination between lotus (a wetland type) and other vegetation. Here, our mapping of growing lotus provides baseline data for its further management, and for management of the wetland areas in general. Lotus is considered an effective approach to improve the livelihoods of local farmers in comparison to rice production and is an indirect way to maintain and develop the wetland habitats.
In the diverse repositories of remote sensing applications, the GEE provides an efficient and fast framework in computation, transparency in coding, and automatic processing workflows, leading to stable and scalable mapping and modeling of real-world data. We successfully proposed and implemented the processing framework for water bodies and lotus mapping using the free-of-charge S-1 and S-2 images, which requires only a simple configuration and basic coding with Java. S-1 and S-2 images are preprocessed to a ready-to-use level, and the user is encouraged to use the diverse built-in libraries of machine learning and processing for image analysis. Considering the list of cloud-based processing services, the GEE is a unique platform, providing a huge spatial dataset and qualified processing toolset without cost. Therefore, we strongly recommend further application of the GEE platform for change detection and conservation of wetland ecosystems worldwide.
Despite our success in model implementation and detection of a wetland type (i.e., growing lotus), the study comes with unavoidable limitations. Because multi-spectral S-2 imagery was used for the lotus mapping, the proposed method is only suitable for growing lotus, in which the green leaves of the lotus can be detected from S-2 image. In addition, we observed the size of some lotus ponds to be below 100 m2, which is smaller than the S-2 pixel size and may lead to the omission of these ponds during image classification. Future research to extend the proposed framework to other regions with other types of wetlands or large areas of growing lotus is ongoing and has the potential to be integrated into the digital management systems of agriculture worldwide.

4. Conclusions

Lotus production is emerging as an effective business model in countries worldwide, and in Vietnam in particular it may secure a sustainable livelihood for farmers and is a potential method for the long-term maintenance of wetland areas.
We proposed an accurate, simple, and scalable approach to automate the mapping of water bodies and growing lotus areas in the GEE platform in central Vietnam. The K-Means clustering technique derived the distribution of water bodies from S-1 imagery with high confidence (precision = 0.96, F1 = 0.97, Kappa coefficient = 0.94). sGTB successfully extracted the growing lotus from other water surfaces and vegetation classes using a scene of the S-2 sensor with a precision of 0.93, F1 of 0.93, and Kappa coefficient of 0.92, which was superior to the performance of sRF. Different contributions of input data were found for the spectral bands of the S-2 image, of which approximately 55% of the contribution was attributed to coastal, blue, red, and SWIR2, and roughly 45% of the information was collected from the green, RE1, RE2, RE3, NIR1, NIR2, and SWIR1.
The workflow presented here is simple, fast, and applicable to various domains of remote sensing applications. The workflow is automatic and has the potential to be integrated into the management systems of precision agriculture in countries worldwide. Integration of the GEE with VHR and UAS imagery will be carried out in a future study to validate the performance of the proposed methods and improve the mapping accuracy of wetland types.

Author Contributions

Conceptualization, H.-T.P. and N.-T.H.; data curation, K.-P.L., T.-P.T. and N.-T.H.; formal analysis, H.-Q.N. and N.-T.H.; methodology, H.-T.P. and N.-T.H.; resources, K.-P.L. and T.-P.T.; software, H.-Q.N.; validation, H.-Q.N. and N.-T.H.; writing–original draft, H.-T.P. and N.-T.H.; writing–review and editing, H.-T.P. All authors have read and agreed to the published version of the manuscript.

Funding

This work was supported by the University of Agriculture and Forestry, Hue University, under the Strategic Research Group Program, Grant No. NCM.ĐHNL.2021.03: GIS, remote sensing, and precision farming.

Data Availability Statement

The data that support the findings of this study are available from the corresponding author, (N.-T.H.), upon reasonable request.

Acknowledgments

The authors acknowledge the support of the University of Agriculture and Forestry, Hue University, under the Strategic Research Group Program, Grant No. NCM.ĐHNL.2021.03: GIS, remote sensing, and precision farming.

Conflicts of Interest

The authors declare no conflict of interest.

References

  1. Schlesinger, W.H.; Bernhardt, E.S. Wetland Ecosystems. In Biogeochemistry; Elsevier: Amsterdam, The Netherlands, 2020; pp. 249–291. ISBN 978-0-12-814608-8. [Google Scholar]
  2. Mitsch, W.J.; Bernal, B.; Hernandez, M.E. Ecosystem Services of Wetlands. Int. J. Biodivers. Sci. Ecosyst. Serv. Manag. 2015, 11, 1–4. [Google Scholar] [CrossRef] [Green Version]
  3. Salimi, S.; Almuktar, S.A.A.A.N.; Scholz, M. Impact of Climate Change on Wetland Ecosystems: A Critical Review of Experimental Wetlands. J. Environ. Manag. 2021, 286, 112160. [Google Scholar] [CrossRef] [PubMed]
  4. Nahlik, A.M.; Fennessy, M.S. Carbon Storage in US Wetlands. Nat. Commun. 2016, 7, 13835. [Google Scholar] [CrossRef] [PubMed] [Green Version]
  5. Were, D.; Kansiime, F.; Fetahi, T.; Cooper, A.; Jjuuko, C. Carbon Sequestration by Wetlands: A Critical Review of Enhancement Measures for Climate Change Mitigation. Earth Syst. Environ. 2019, 3, 327–340. [Google Scholar] [CrossRef]
  6. Davidson, N.C. How Much Wetland Has the World Lost? Long-Term and Recent Trends in Global Wetland Area. Mar. Freshw. Res. 2014, 65, 934–941. [Google Scholar] [CrossRef] [Green Version]
  7. Ramsar Convention on Wetlands. Global Wetland Outlook: State of the World’s Wetlands and Their Services to People. 2018, p. 88. Available online: https://ramsar.org/sites/default/files/documents/library/gwo_e.pdf (accessed on 23 November 2022).
  8. Hilmi, N.; Chami, R.; Sutherland, M.D.; Hall-Spencer, J.M.; Lebleu, L.; Benitez, M.B.; Levin, L.A. The Role of Blue Carbon in Climate Change Mitigation and Carbon Stock Conservation. Front. Clim. 2021, 3, 1–18. [Google Scholar] [CrossRef]
  9. Alexandridis, T.K.; Monachou, S.; Skoulikaris, C.; Kalopesa, E.; Zalidis, G.C. Investigation of the Temporal Relation of Remotely Sensed Coastal Water Quality with GIS Modelled Upstream Soil Erosion. Hydrol. Process. 2015, 29, 2373–2384. [Google Scholar] [CrossRef]
  10. Pham, T.D.; Xia, J.; Ha, N.T.; Bui, D.T.; Le, N.N.; Tekeuchi, W. A Review of Remote Sensing Approaches for Monitoring Blue Carbon Ecosystems: Mangroves, Seagrassesand Salt Marshes during 2010–2018. Sensors 2019, 19, 1933. [Google Scholar] [CrossRef] [Green Version]
  11. Guo, M.; Li, J.; Sheng, C.; Xu, J.; Wu, L. A Review of Wetland Remote Sensing. Sensors 2017, 17, 777. [Google Scholar] [CrossRef] [Green Version]
  12. Mahdavi, S.; Salehi, B.; Granger, J.; Amani, M.; Brisco, B.; Huang, W. Remote Sensing for Wetland Classification: A Comprehensive Review. GISci. Remote Sens. 2018, 55, 623–658. [Google Scholar] [CrossRef]
  13. McCarthy, M.J.; Merton, E.J.; Muller-Karger, F.E. Improved Coastal Wetland Mapping Using Very-High 2-Meter Spatial Resolution Imagery. Int. J. Appl. Earth Obs. Geoinf. 2015, 40, 11–18. [Google Scholar] [CrossRef]
  14. Amani, M.; Salehi, B.; Mahdavi, S.; Granger, J.E.; Brisco, B.; Hanson, A. Wetland Classification Using Multi-Source and Multi-Temporal Optical Remote Sensing Data in Newfoundland and Labrador, Canada. Can. J. Remote Sens. 2017, 43, 360–373. [Google Scholar] [CrossRef]
  15. Jahncke, R.; Leblon, B.; Bush, P.; LaRocque, A. Mapping Wetlands in Nova Scotia with Multi-Beam RADARSAT-2 Polarimetric SAR, Optical Satellite Imagery, and Lidar Data. Int. J. Appl. Earth Obs. Geoinf. 2018, 68, 139–156. [Google Scholar] [CrossRef]
  16. Whiteside, T.G.; Bartolo, R.E. Mapping Aquatic Vegetation in a Tropical Wetland Using High Spatial Resolution Multispectral Satellite Imagery. Remote Sens. 2015, 7, 11664. [Google Scholar] [CrossRef] [Green Version]
  17. LaRocque, A.; Leblon, B.; Woodward, R.; Bourgeau-Chavez, L. Wetland Mapping in New Brunswick, Canada with Landsat5-TM, ALOS-PALSAR, and RADARSAT-2 Imagery. In Proceedings of the ISPRS Annals of the Photogrammetry, Remote Sensing and Spatial Information Sciences, Nice, France, 3 August 2020; Volume V-3–2020, pp. 301–308. [Google Scholar]
  18. Merchant, M.A.; Warren, R.K.; Edwards, R.; Kenyon, J.K. An Object-Based Assessment of Multi-Wavelength SAR, Optical Imagery and Topographical Datasets for Operational Wetland Mapping in Boreal Yukon, Canada. Can. J. Remote Sens. 2019, 45, 308–332. [Google Scholar] [CrossRef]
  19. LaRocque, A.; Phiri, C.; Leblon, B.; Pirotti, F.; Connor, K.; Hanson, A. Wetland Mapping with Landsat 8 OLI, Sentinel-1, ALOS-1 PALSAR, and LiDAR Data in Southern New Brunswick, Canada. Remote Sens. 2020, 12, 2095. [Google Scholar] [CrossRef]
  20. Onojeghuo, A.O.; Onojeghuo, A.R.; Cotton, M.; Potter, J.; Jones, B. Wetland Mapping with Multi-Temporal Sentinel-1 & -2 Imagery (2017–2020) and LiDAR Data in the Grassland Natural Region of Alberta. GISci. Remote Sens. 2021, 58, 999–1021. [Google Scholar] [CrossRef]
  21. Berisha, B.; Mëziu, E.; Shabani, I. Big Data Analytics in Cloud Computing: An Overview. J. Cloud Comput. 2022, 11, 24. [Google Scholar] [CrossRef]
  22. Kwong, I.H.Y.; Wong, F.K.K.; Fung, T. Automatic Mapping and Monitoring of Marine Water Quality Parameters in Hong Kong Using Sentinel-2 Image Time-Series and Google Earth Engine Cloud Computing. Front. Mar. Sci. 2022, 9, 1–18. [Google Scholar] [CrossRef]
  23. Kavzoglu, T.; Goral, M. Google Earth Engine for Monitoring Marine Mucilage: Izmit Bay in Spring 2021. Hydrology 2022, 9, 135. [Google Scholar] [CrossRef]
  24. Farda, N.M. Multi-Temporal Land Use Mapping of Coastal Wetlands Area Using Machine Learning in Google Earth Engine. IOP Conf. Ser. Earth Environ. Sci. 2017, 98, 012042. [Google Scholar] [CrossRef]
  25. Hird, J.N.; DeLancey, E.R.; McDermid, G.J.; Kariyeva, J. Google Earth Engine, Open-Access Satellite Data, and Machine Learning in Support of Large-Area Probabilistic Wetland Mapping. Remote Sens. 2017, 9, 1315. [Google Scholar] [CrossRef] [Green Version]
  26. Long, X.; Li, X.; Lin, H.; Zhang, M. Mapping the Vegetation Distribution and Dynamics of a Wetland Using Adaptive-Stacking and Google Earth Engine Based on Multi-Source Remote Sensing Data. Int. J. Appl. Earth Obs. Geoinf. 2021, 102, 102453. [Google Scholar] [CrossRef]
  27. Wang, M.; Mao, D.; Wang, Y.; Song, K.; Yan, H.; Jia, M.; Wang, Z. Annual Wetland Mapping in Metropolis by Temporal Sample Migration and Random Forest Classification with Time Series Landsat Data and Google Earth Engine. Remote Sens. 2022, 14, 3191. [Google Scholar] [CrossRef]
  28. Gxokwe, S.; Dube, T.; Mazvimavi, D. Leveraging Google Earth Engine Platform to Characterize and Map Small Seasonal Wetlands in the Semi-Arid Environments of South Africa. Sci. Total Environ. 2022, 803, 150139. [Google Scholar] [CrossRef]
  29. Wang, Y.; Li, Z.; Zeng, C.; Xia, G.-S.; Shen, H. An Urban Water Extraction Method Combining Deep Learning and Google Earth Engine. IEEE J. Sel. Top. Appl. Earth Obs. Remote Sens. 2020, 13, 769–782. [Google Scholar] [CrossRef]
  30. Mayer, T.; Poortinga, A.; Bhandari, B.; Nicolau, A.P.; Markert, K.; Thwal, N.S.; Markert, A.; Haag, A.; Kilbride, J.; Chishtie, F.; et al. Deep Learning Approach for Sentinel-1 Surface Water Mapping Leveraging Google Earth Engine. ISPRS Open J. Photogramm. Remote Sens. 2021, 2, 100005. [Google Scholar] [CrossRef]
  31. Li, K.; Wang, J.; Cheng, W.; Wang, Y.; Zhou, Y.; Altansukh, O. Deep Learning Empowers the Google Earth Engine for Automated Water Extraction in the Lake Baikal Basin. Int. J. Appl. Earth Obs. Geoinf. 2022, 112, 102928. [Google Scholar] [CrossRef]
  32. Gulácsi, A.; Kovács, F. Sentinel-1-Imagery-Based High-Resolution Water Cover Detection on Wetlands, Aided by Google Earth Engine. Remote Sens. 2020, 12, 1614. [Google Scholar] [CrossRef]
  33. Li, J.; Peng, B.; Wei, Y.; Ye, H. Accurate Extraction of Surface Water in Complex Environment Based on Google Earth Engine and Sentinel-2. PLoS ONE 2021, 16, e0253209. [Google Scholar] [CrossRef]
  34. Taheri Dehkordi, A.; Valadan Zoej, M.J.; Ghasemi, H.; Ghaderpour, E.; Hassan, Q.K. A New Clustering Method to Generate Training Samples for Supervised Monitoring of Long-Term Water Surface Dynamics Using Landsat Data through Google Earth Engine. Sustainability 2022, 14, 8046. [Google Scholar] [CrossRef]
  35. Gerbeaux, P.; Finlayson, C.M.; van Dam, A.A. Wetland Classification: Overview. In The Wetland Book: I: Structure and Function, Management and Methods; Finlayson, C.M., Everard, M., Irvine, K., McInnes, R.J., Middleton, B.A., van Dam, A.A., Davidson, N.C., Eds.; Springer Netherlands: Dordrecht, The Netherlands, 2016; pp. 1–8. ISBN 978-94-007-6172-8. [Google Scholar]
  36. Kew Science Nelumbo Nucifera Gaertn. Available online: http://powo.science.kew.org/taxon/urn:lsid:ipni.org:names:605422-1 (accessed on 6 February 2023).
  37. Lu, H.-F.; Tan, Y.-W.; Zhang, W.-S.; Qiao, Y.-C.; Campbell, D.E.; Zhou, L.; Ren, H. Integrated Emergy and Economic Evaluation of Lotus-Root Production Systems on Reclaimed Wetlands Surrounding the Pearl River Estuary, China. J. Clean. Prod. 2017, 158, 367–379. [Google Scholar] [CrossRef]
  38. Vo, H.T.M.; van Halsema, G.; Hellegers, P.; Wyatt, A.; Nguyen, Q.H. The Emergence of Lotus Farming as an Innovation for Adapting to Climate Change in the Upper Vietnamese Mekong Delta. Land 2021, 10, 350. [Google Scholar] [CrossRef]
  39. Arooj, M.; Imran, S.; Inam-ur-Raheem, M.; Rajoka, M.S.R.; Sameen, A.; Siddique, R.; Sahar, A.; Tariq, S.; Riaz, A.; Hussain, A.; et al. Lotus Seeds (Nelumbinis Semen) as an Emerging Therapeutic Seed: A Comprehensive Review. Food Sci. Nutr. 2021, 9, 3971–3987. [Google Scholar] [CrossRef]
  40. Harutyunyan, N.; Mar, C.; Muhammad, N.; Anusha, P.; Tigis, K.; Mohamed, A.; Elsalam, T. Aung Lotus Value-Chain Enhancement in Dong Thap, Vietnam. Case-Study Report; Can Tho, Vietnam. 2020. Available online: https://www.researchgate.net/profile/Naira-Harutyunyan-2/publication/341463131_LOTUS_value-chain_enhancement_in_Dong_Thap_Vietnam_Case-Study_Report/links/5ec2d605a6fdcc90d67ecb1e/LOTUS-value-chain-enhancement-in-Dong-Thap-Vietnam-Case-Study-Report.pdf (accessed on 6 February 2023).
  41. Ahmed, M.; Seraj, R.; Islam, S.M.S. The K-Means Algorithm: A Comprehensive Survey and Performance Evaluation. Electronics 2020, 9, 1295. [Google Scholar] [CrossRef]
  42. Jie, C.; Jiyue, Z.; Junhui, W.; Yusheng, W.; Huiping, S.; Kaiyan, L. Review on the Research of K-Means Clustering Algorithm in Big Data. In Proceedings of the 2020 IEEE 3rd International Conference on Electronics and Communication Engineering (ICECE), Xi’an, China, 14–16 December 2020; pp. 107–111. [Google Scholar]
  43. Breiman, L. Random Forest. Mach. Learn. 2001, 45, 5–32. [Google Scholar] [CrossRef] [Green Version]
  44. Belgiu, M.; Drăguţ, L. Random Forest in Remote Sensing: A Review of Applications and Future Directions. ISPRS J. Photogramm. Remote Sens. 2016, 114, 24–31. [Google Scholar] [CrossRef]
  45. Google Earth Engine. Ee.Classifier.SmileRandomForest. Available online: https://developers.google.com/earth-engine/apidocs/ee-classifier-smilerandomforest (accessed on 4 February 2023).
  46. Li, H. Smile. Available online: https://haifengl.github.io (accessed on 10 March 2022).
  47. Natekin, A.; Knoll, A. Gradient Boosting Machines, a Tutorial. Front. Neurorobot. 2013, 7, 21. [Google Scholar] [CrossRef] [Green Version]
  48. Google Earth Engine. Ee.Classifier.SmileGradientTreeBoost. Available online: https://developers.google.com/earth-engine/apidocs/ee-classifier-smilegradienttreeboost (accessed on 4 February 2023).
  49. McHugh, M.L. Interrater Reliability: The Kappa Statistic. Biochem. Med. 2012, 22, 276–282. [Google Scholar] [CrossRef]
  50. Hossin, M.; Sulaiman, M.N. A Review on Evaluation Metrics for Data Classification Evaluations. IJDKP 2015, 5, 01–11. [Google Scholar] [CrossRef]
  51. Sahin, E.K. Assessing the Predictive Capability of Ensemble Tree Methods for Landslide Susceptibility Mapping Using XGBoost, Gradient Boosting Machine, and Random Forest. SN Appl. Sci. 2020, 2, 1308. [Google Scholar] [CrossRef]
  52. Le, N.N.; Pham, T.D.; Yokoya, N.; Ha, N.T.; Nguyen, T.T.T.; Tran, T.D.T.; Pham, T.D. Learning from Multimodal and Multisensor Earth Observation Dataset for Improving Estimates of Mangrove Soil Organic Carbon in Vietnam. Int. J. Remote Sens. 2021, 42, 6866–6890. [Google Scholar] [CrossRef]
  53. Ha, N.-T.; Manley-Harris, M.; Pham, T.-D.; Hawes, I. Detecting Multi-Decadal Changes in Seagrass Cover in Tauranga Harbour, New Zealand, Using Landsat Imagery and Boosting Ensemble Classification Techniques. IJGI 2021, 10, 371. [Google Scholar] [CrossRef]
  54. Rao, P.; Wang, Y.; Liu, Y.; Wang, X.; Hou, Y.; Pan, S.; Wang, F.; Zhu, D. A Comparison of Multiple Methods for Mapping Groundwater Levels in the Mu Us Sandy Land, China. J. Hydrol. Reg. Stud. 2022, 43, 101189. [Google Scholar] [CrossRef]
  55. Zhang, T.; Su, J.; Liu, C.; Chen, W.-H.; Liu, H.; Liu, G. Band Selection in Sentinel-2 Satellite for Agriculture Applications. In Proceedings of the 2017 23rd International Conference on Automation and Computing (ICAC), Huddersfield, UK, 7–8 September 2017; pp. 1–6. [Google Scholar]
  56. Zhang, T.-X.; Su, J.-Y.; Liu, C.-J.; Chen, W.-H. Potential Bands of Sentinel-2A Satellite for Classification Problems in Precision Agriculture. Int. J. Autom. Comput. 2019, 16, 16–26. [Google Scholar] [CrossRef] [Green Version]
  57. Gobron, N.; Pinty, B.; Verstraete, M.; Govaerts, Y. The MERIS Global Vegetation Index (MGVI): Description and Preliminary Application. Int. J. Remote Sens. 1999, 20, 1917–1927. [Google Scholar] [CrossRef]
  58. Traganos, D.; Poursanidis, D.; Aggarwal, B.; Chrysoulakis, N.; Reinartz, P. Estimating Satellite-Derived Bathymetry (SDB) with the Google Earth Engine and Sentinel-2. Remote Sens. 2018, 10, 859. [Google Scholar] [CrossRef] [Green Version]
  59. Poursanidis, D.; Traganos, D.; Reinartz, P.; Chrysoulakis, N. On the Use of Sentinel-2 for Coastal Habitat Mapping and Satellite-Derived Bathymetry Estimation Using Downscaled Coastal Aerosol Band. Int. J. Appl. Earth Obs. Geoinf. 2019, 80, 58–70. [Google Scholar] [CrossRef]
  60. Lippitt, C.D.; Zhang, S. The Impact of Small Unmanned Airborne Platforms on Passive Optical Remote Sensing: A Conceptual Perspective. Int. J. Remote Sens. 2018, 39, 4852–4868. [Google Scholar] [CrossRef]
Figure 1. Study site with ground truth points (GTPs). The red rectangles indicate the location of Thua Thien Hue province in Vietnam (a), Phong Dien district in the boundary of Thua Thien Hue province (b), and the study site (c). Sentinel-1 (d) and Sentinel-2 (e) scenes used in the study. Field images (taken by K.P.L and N.T.H) of growing lotus (f,g).
Water 15 00854 g001aWater 15 00854 g001b
Figure 2. Proposed workflow of water extraction and lotus mapping from satellite image data.
Water 15 00854 g002
Figure 3. Water bodies extracted from Sentinel-1 imagery with the K-Means clustering.
Water 15 00854 g003
Figure 4. Contribution of features in lotus mapping derived from the sGTB model.
Water 15 00854 g004
Figure 5. Lotus distribution mapping derived from the sGTB model and Sentinel-2 imagery with the four enlarged areas (ad).
Water 15 00854 g005aWater 15 00854 g005b
Table 1. S-1 and S-2 image properties for water extraction and lotus mapping.
SensorLevel of ProcessingAcquisition DateCloud Coverage (%)Spatial Resolution (m)Bands
Sentinel-1Ground range detected (GRD) level 1 sensor mode: Interferometric wide swath (IW)10 October 2020 20 m × 22 m–
resampling to 10
VH, VV
Sentinel-2Level 2A19 June 2021010Band 1–Band 12 *
* Note: Band 1: coastal, band 2: blue, band 3: green, band 4: red, band 5: red edge 1 (RE1), band 6: red edge 2 (RE2), band 7: red edge 3 (RE3), band 8: near infrared 1 (NIR1), band 8A: near infrared 2 (NIR2), band 11: short wave infrared 1 (SWIR1), band 12: short wave infrared 2 (SWIR2).
Table 2. K-Means cluster applied for water extraction.
ParameterValueParameterValue
Number of cluster5Periodic pruning1000
Maximum candidate100Distance functionEuclidean
Maximum iteration20
Table 3. sRF and sGTB hyper-parameters used in the study.
Smile Random Forest (sRF)
ParameterValueParameterValue
Number of tree110Minimum leaf population17
Variable per split11Maximum node20
Bag fraction0.3
Smile Gradient Tree Boost (sGTB)
Number of Tree100Shrinkage0.05
Sampling rate0.7Max Node20
Table 4. Accuracy of water extraction from S-1 imagery in the GEE.
PrecisionRecallF1OA κ
Non-water0.990.940.970.970.94
Water0.960.990.97
Table 5. Accuracy assessment of lotus mapping.
PrecisionRecallF1OA κ
sRFsGTBsRFsGTBsRFsGTBsRFsGTBsRFsGTB
Other vegetation0.880.930.850.960.870.950.880.950.820.92
Lotus0.800.930.850.920.830.93
Water bodies0.970.990.970.980.970.99
Disclaimer/Publisher’s Note: The statements, opinions and data contained in all publications are solely those of the individual author(s) and contributor(s) and not of MDPI and/or the editor(s). MDPI and/or the editor(s) disclaim responsibility for any injury to people or property resulting from any ideas, methods, instructions or products referred to in the content.

