
Water Quality Indicator for Adaptability to Global Climate Change in Andean Highland Ecosystems

1
Facultad de Ingeniería, Carrera de Ingeniería Ambiental, Universidad Nacional de Chimborazo, Riobamba EC060108, Ecuador
2
Facultad de Ingeniería, Carrera de Ingeniería Civil, Universidad Nacional de Chimborazo, Riobamba EC060108, Ecuador
*
Author to whom correspondence should be addressed.
Water 2023, 15(5), 857; https://doi.org/10.3390/w15050857
Submission received: 15 January 2023
/
Revised: 14 February 2023
/
Accepted: 17 February 2023
/
Published: 22 February 2023
(This article belongs to the Special Issue Water Quality, Ecological Health and Ecosystem Restoration)
Abstract
:In the face of ongoing anthropogenic climate change, river water quality assessment has become increasingly important for maintaining ecological balance and supporting local and downstream livelihoods. This research aims to create a new water quality index (WQI) to assess water quality in the Andean highlands (>2000 m.a.s.l.) for climate change adaptation and mitigation. We examined water physicochemical and bacteriological parameters and the benthic macroinvertebrate (BM) community in three micro-watersheds in Achupallas, Ecuador, to achieve our goal. We analyzed water quality at 41 sampling points, and samples (replicates) were taken for nine consecutive months. In addition, we evaluated the accuracy of the WQI developed by the U.S. National Sanitation Foundation (NSF) in 1970 (WQINSF). The BM community in the Andes highlands was used to develop and calibrate a new WQI, the Andean Biotic Index* (ABI*). We calibrated the ABI* taxon score in the area where the WQINSF made the most accurate water quality measurements. Our results show that the sigma value framework quantifies WQINSF accuracy. Therefore, a higher sigma value means we measured water quality more accurately. There was no correlation between the WQINSF and the Andean Biotic Index (ABI). The ABI* considers the presence of BMs and their sensitivity to pollution to measure water quality. The results also show a strong statistical link between the ABI* and the WQINSF. The ABI* can aid mountain communities in adjusting to climate change. Mountain dwellers can monitor a stream’s water quality by observing the BM communities. However, the ABI* is not a substitute for the WQINSF or biological studies.
1. Introduction
As the climate crisis intensifies and the human population expands, water quality degradation in aquatic ecosystems has become a global concern. Unfortunately, natural processes, afforestation, deforestation, agriculture, and overdevelopment have degraded river water quality globally [1]. Therefore, assessing river water quality has become increasingly important in maintaining ecological balance and supporting local and downstream livelihoods in the face of ongoing anthropogenic climate change [2]. Consequently, routine monitoring and protection of river water quality have become necessary [3]. However, monitoring river water quality is challenging [4]. The foundations of water valuation are accurate water measurement, modeling, and accounting [5]. A scientific method for judging river water quality can give a fair assessment of the water environment’s quality, assure the sustainable use of water resources, and serve as a basis for environmental management and decision-making [6].
On the other hand, with a broader recognition of the interdependency of societal well-being and ecosystem health, it is imperative to address people’s critical role in protecting, conserving, and restoring nature and ecosystems, delivering benefits for climate adaptation and mitigation while ensuring social and environmental safeguards [7]. Therefore, scientific research must equip locals (mountain dwellers) with the means to protect and monitor the water quality of rivers. Integrating the WQI, based on physicochemical parameters, with a biotic index (BI) may be necessary, to involve locals in protecting and monitoring the river’s water quality and for mountain communities’ climate adaptation and mitigation. Communities could independently conduct a reliable assessment of water quality by becoming familiar with the community of BMs in the Andes highlands.
A WQI converts multiple environmental parameter (water quality indicators) data into a single number using mathematical algorithms to assess water quality and ecosystem health. WQI models typically include indicator selection, sub-indexing, weighting, and index aggregation [8]. On a global scale, many WQI models exist, but no single WQI is universally accepted [1]. The WQI models are not generic because they are typically based on site-specific parameters for a region. However, most of these indices are based on the WQINSF, which is used worldwide [3]. The WQINSF model has evolved in numerous ways to adapt it to a particular region or optimize the set of parameters to be measured for cost reduction. It needs analytical facilities and many measurements. Noori et al. [9] evaluated the WQINSF’s application. They found that the WQINSF results changed significantly when orthophosphate and total suspended solids were used instead of total phosphorous and total solids, respectively. However, using total dissolved solids instead of total solids and FC-MPN (fecal coliform based on the maximum probable number) rather than FC-CPU (fecal coliform based on the colony forming unit) resulted in fewer changes. Uddin et al. [10] reported a comprehensive review of existing WQI models and their evolution and a critical discussion of model structures, applications, sources of model uncertainty, and eclipse problems. Uddin et al. [10] found that over 35 WQI models have been introduced to evaluate surface water quality worldwide. Furthermore, 82% of WQI models have been used to assess river water quality. Additionally, 50% of reviewed studies used the Canadian Council of Ministers of the Environment (CCME) and NSF models.
Current WQI model research focuses on mitigating the uncertainty and eclipse effect, reducing analytical costs, and improving analysis efficiency [1,11,12]. Therefore, principal component analysis (PCA), factor analysis (FA), canonical correlation analysis (CCA), stepwise multiple linear regression (SMLR), and machine learning algorithm extreme gradient boosting (XGBoost), among others, are used instead of the Delphi method traditionally used in WQI models, to reduce the WQI models uncertainty, indicators (parameters) and bias [1,4,8,13,14]. Similarly, a few studies have revealed that the equal weighting approach is more effective than other techniques in reducing the uncertainty of WQI models [4,8]. Unfortunately, the upgraded WQI models are still out of reach for mountain communities.
Recent techniques for assessing and categorizing water quality include remote sensing and Monte Carlo simulation (MCS). Zhang et al. [15] reported a short review of studies concerning remote sensing to categorize water quality. They concluded that these studies have developed to an acceptable extent and can provide significant and synoptic views of various types of water. However, Zhang et al. [15] reported that using satellite images to monitor water quality change in situ and in real time is impossible. Despite this, Kulk et al. [16] used Sentinel-2 and Landsat-8 multispectral remote sensing and in situ observations to analyze changes in five WQIs.
On the other hand, Jin et al. [17] used a WQI model and MCS to evaluate the water quality of the East Tioxi River in China. Jin et al. [17] determined, by performing 10,000 MCS on primary river water quality data, the mean and standard deviation of all possible pollution indicators and probabilities. However, despite the emphasis on improving water quality assessment and categorization, monitoring tools like those shown above for water quality are unavailable to locals.
Integrating a WQI model based on a few physicochemical parameters with a BI is a promising method for mountain communities to protect and monitor river water quality. A BI makes it easier to detect disturbances at a site by looking at how one or more components of the biota are affected by the disturbance. Bacteria, protozoans, diatoms, algae, macrophytes, macroinvertebrates, and fish are used to assess aquatic ecosystems’ water quality and ecological integrity. BMs is the most widely used group, especially for lotic systems and lentic habitats. BMs have life cycles long enough to detect disturbance-induced temporal changes but short enough to observe recolonization patterns. Qualitative sampling makes them easy and cheap to collect, making them ideal for biomonitoring water quality. Both lotic and lentic habitats have abundant, nonmobile BMs [18]. BMs are currently considered bioindicators of water quality due to their varied sensitivity to different types of pollution. BM community distribution and structure is an essential ecological tool for defining spatial and temporal changes in water bodies [19]. For the Andean highlands (>2000 m.a.s.l.), Rios-Touma et al. [20] proposed the ABI. They included several BM families found in the Andean highlands.
Sparse research has been conducted on the relationship between the Index of Biotic Integrity (IBI) and WQI model assessment techniques. However, since WQIs and IBIs reflect the water quality conditions of bodies of water at limited temporal scales, it is essential to evaluate their performance. Wu et al. [21] compared the performance of a phytoplankton-based index of biotic integrity (P-IBI) to a WQI based on physicochemical parameters. Wu et al. [21] reported that the water quality was generally worse when using the P-IBI. Atazadeh et al. [22] found that the trophic diatom index correlates significantly well with WQIs.
However, the WQINSF is a stressor-focused approach based on physicochemical parameters. The ABI, in contrast, is a WQI built on the BM response to any event that modifies the physical environment, substrate accessibility, or water quality. The ABI index reflects not only the current water quality but also the overall ecosystem health of a water body and the cumulative effects of factors impacting that habitat or ecosystem over time. Therefore, water quality management can be accomplished through stressor- and response-oriented approaches. The WQINSF is widely used but requires many measurements, making it costly. In contrast, the ABI costs less [18].
This research examines WQINSF and ABI integration. The objective was to create a new ABI which works as a tool that communities might use to assess water quality in the Andean highlands for climate change adaptation and mitigation. To achieve our goal, first, we examined the accuracy with which the WQINSF categorizes the water quality of three micro-watersheds within the Ecuadorian parish of Achupallas. Second, we selected the region where the WQINSF made the most accurate water quality categorization. Finally, we used this region to create and calibrate a new ABI* that locals can use.
2. Materials and Methods
2.1. The Study Area
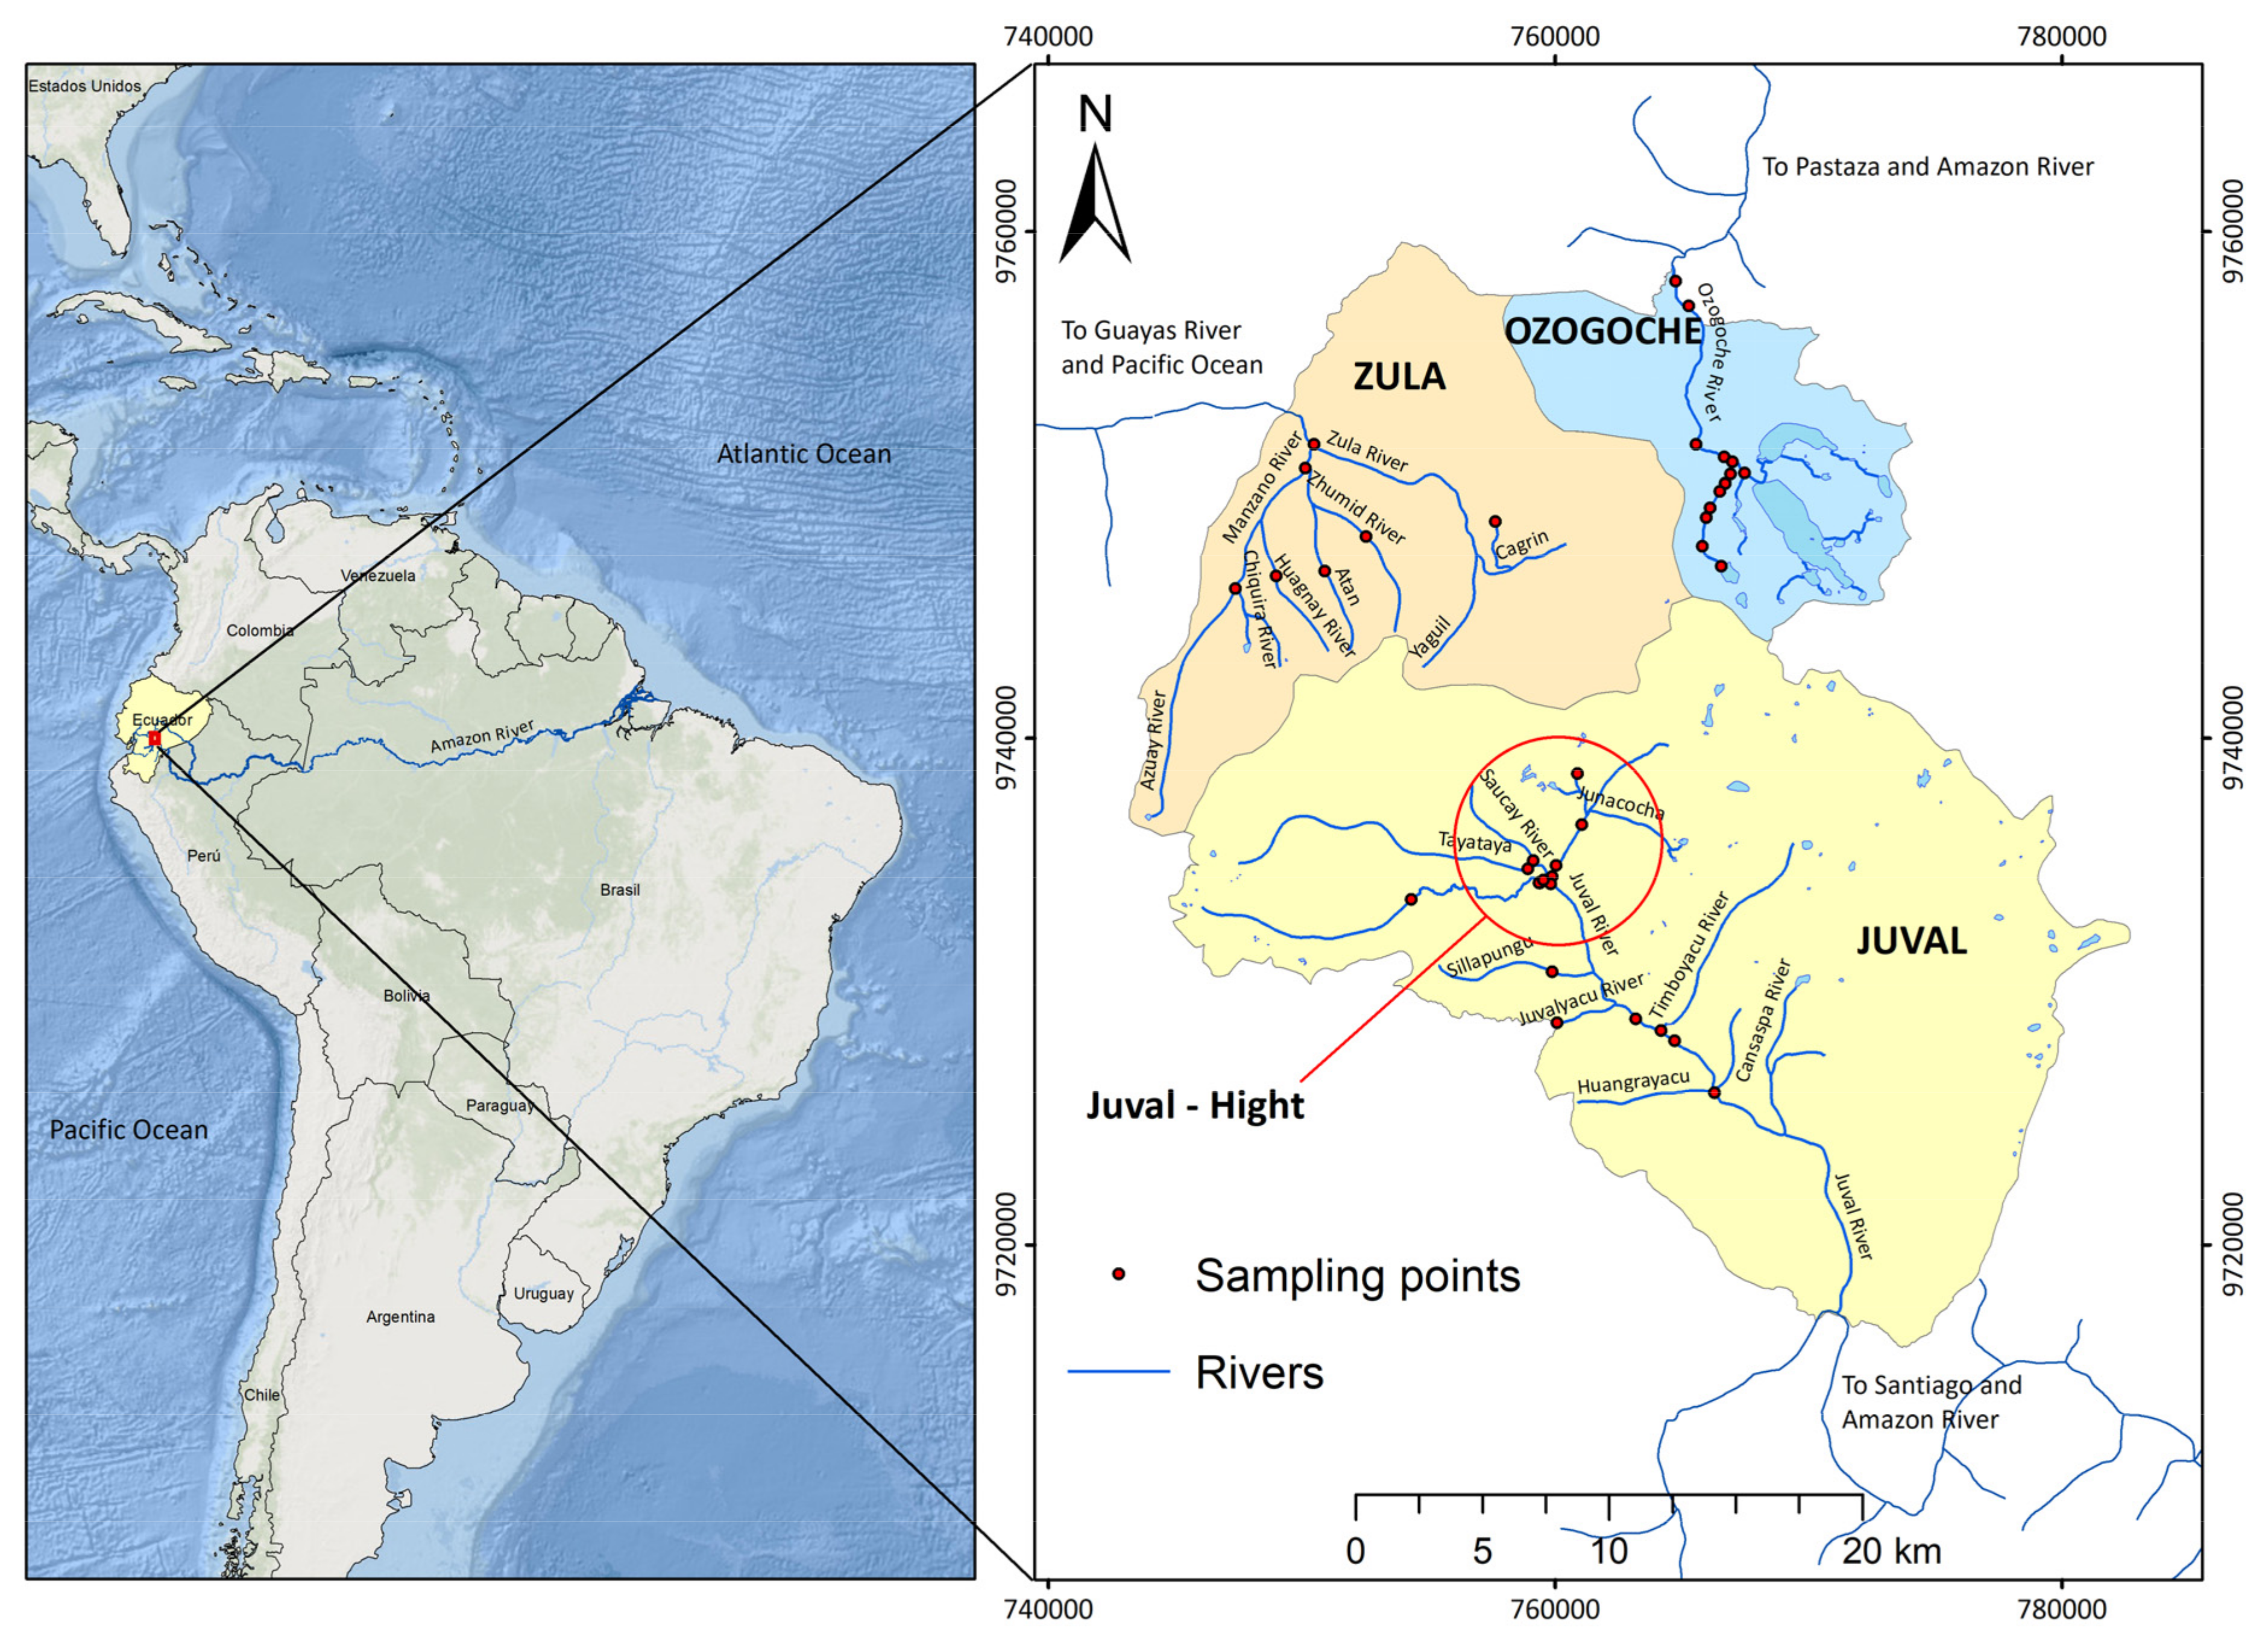
The study took place in Ecuador’s Achupallas parish. The Achupallas parish has an area of 972 km2, located within the southwestern zone of Sangay National Park, Ecuador. We monitored three micro-watersheds (Ozogoche, Juval, and Zula) to assess the water quality of their major rivers and tributaries (Figure 1).
The Ozogoche micro-watershed is located in the Pastaza river basin. The Juval micro-watershed is part of the Santiago basin. The Pastaza and Santiago rivers flow eastward to the Amazon river and the Atlantic Ocean. Finally, the Zula micro-watershed is situated in the Guayas river basin, which flows westward to the Pacific Ocean. The Juval micro-watershed study area was divided into two sections based on altitude: Juval-Hight and Juval. Table 1 displays the attributes of interest in each study area.
2.2. Experimental Design
Forty-one monitoring points were established based on their accessibility, height, vegetation type, and presence of settlements (Figure 1). We collected nine replicates at each sampling location over a year, spanning the dry and wet seasons. For the WQINSF calculation, samples were taken in 1 L plastic bottles rinsed with water from the sampling site [23]. The bottles were then filled and sealed to keep air out. For ABI calculation, the technician in charge of sampling was placed on the side of the net to avoid impeding the water flow and allowing silt to enter the net. Then, within a 20-m radius of the established monitoring point, different substrata, including sand, gravel, boulders, and vegetation, were sampled. The duration of monitoring at each location was 5 min, proportional to the sampled area of each substrate. The BM specimens were preserved in a 5% formalin solution in 1 L wide-mouth plastic bottles used to transport the samples to the laboratory after being separated from stones and leaf litter.
The physicochemical data gathered in situ were pH, temperature, and dissolved oxygen. In addition, in the lab, APHA [24] methodology was used to measure DO, pH, turbidity, total dissolved solids, phosphates, nitrates, BOD5, total coliforms, and fecal coliforms.
2.3. Determination of Water Quality
Three indicators were employed to assess the water quality: The WQINSF [25], the Andean Biotic Index (ABI) [20], and the proposed new indicator of water quality (ABI*).
2.3.1. Water Quality Index—National Sanitation Foundation
Brown created the WQINSF in 1965 with NSF sponsorship as a modified version of the Horton model [10]. To develop the WQINSF, the NSF selected 142 water quality experts who performed the parameter selection and weighting [26]. As a result, nine crucial biological, chemical, and physical indicators of water quality were found. Then, based on its potential as an indicator of water quality, each marker was assigned a quality factor Qi and relative relevance weight wi (Table 2).
Expert opinion was graded on a scale that quantifies water quality at the sampling time, ranging from 0 to 100 (Equation (1)).
Initially, figures with characteristic plots were provided to graphically obtain each quality marker’s numerical value Qi as a function of the indicator’s measured value [27,28]. However, these characteristic plots have been digitalized and adjusted to mathematical functions. As a result, websites provide the numerical value of each quality indicator (https://www.knowyourh2o.com/outdoor-3/water-quality-index-calculator-for-surface-water, accessed on 10 January 2023). Considering the practical merits of the WQINSF and its scientific foundations, the WQINSF has become a popular tool for assessing water quality worldwide, particularly in rivers. The classification of water quality according to the numerical value of the WQINSF is presented in Table 3. [28]. The water quality classification helps to identify river water requiring immediate attention based on a prioritization plan.
2.3.2. Andean Biotic Index (ABI)
The ABI uses the bioassessment of the ecological condition of waters and is a region-specific index. It is based on the BMs’ natural sensitivity and response to eventual or permanent disturbances of their natural habitats in the Andean highlands. The ABI is an adaptation of the Biological Monitoring Working Party (BMWP) to the Andean highlands made by Ríos-Touma et al. [20]. Ríos-Touma et al. [20] quantified pollutant sensitivity by assigning an ABI score to each taxon reported in the Andes highlands (Table 4).
Ríos-Touma et al. [20] assigned a score between 1 and 10 to each taxon, corresponding to its sensitivity to pollutants. A value of 10 corresponds to a highly susceptible taxon. In contrast, a value of 1 corresponds to a highly pollutant-tolerant taxon—the ABI value results from summing the existing taxon scores at the study site (Equation (2)).
where n represents the total number of taxons present; fi is 1 if the taxon i is present and 0 if it is not. The Pi value is equal to the taxon ABI score given in Table 4. Following the indications of the Water Framework Directive, Ríos-Touma et al. [20] defined five water quality classes (Table 5).
2.3.3. The New Andean Biotic Index, ABI*
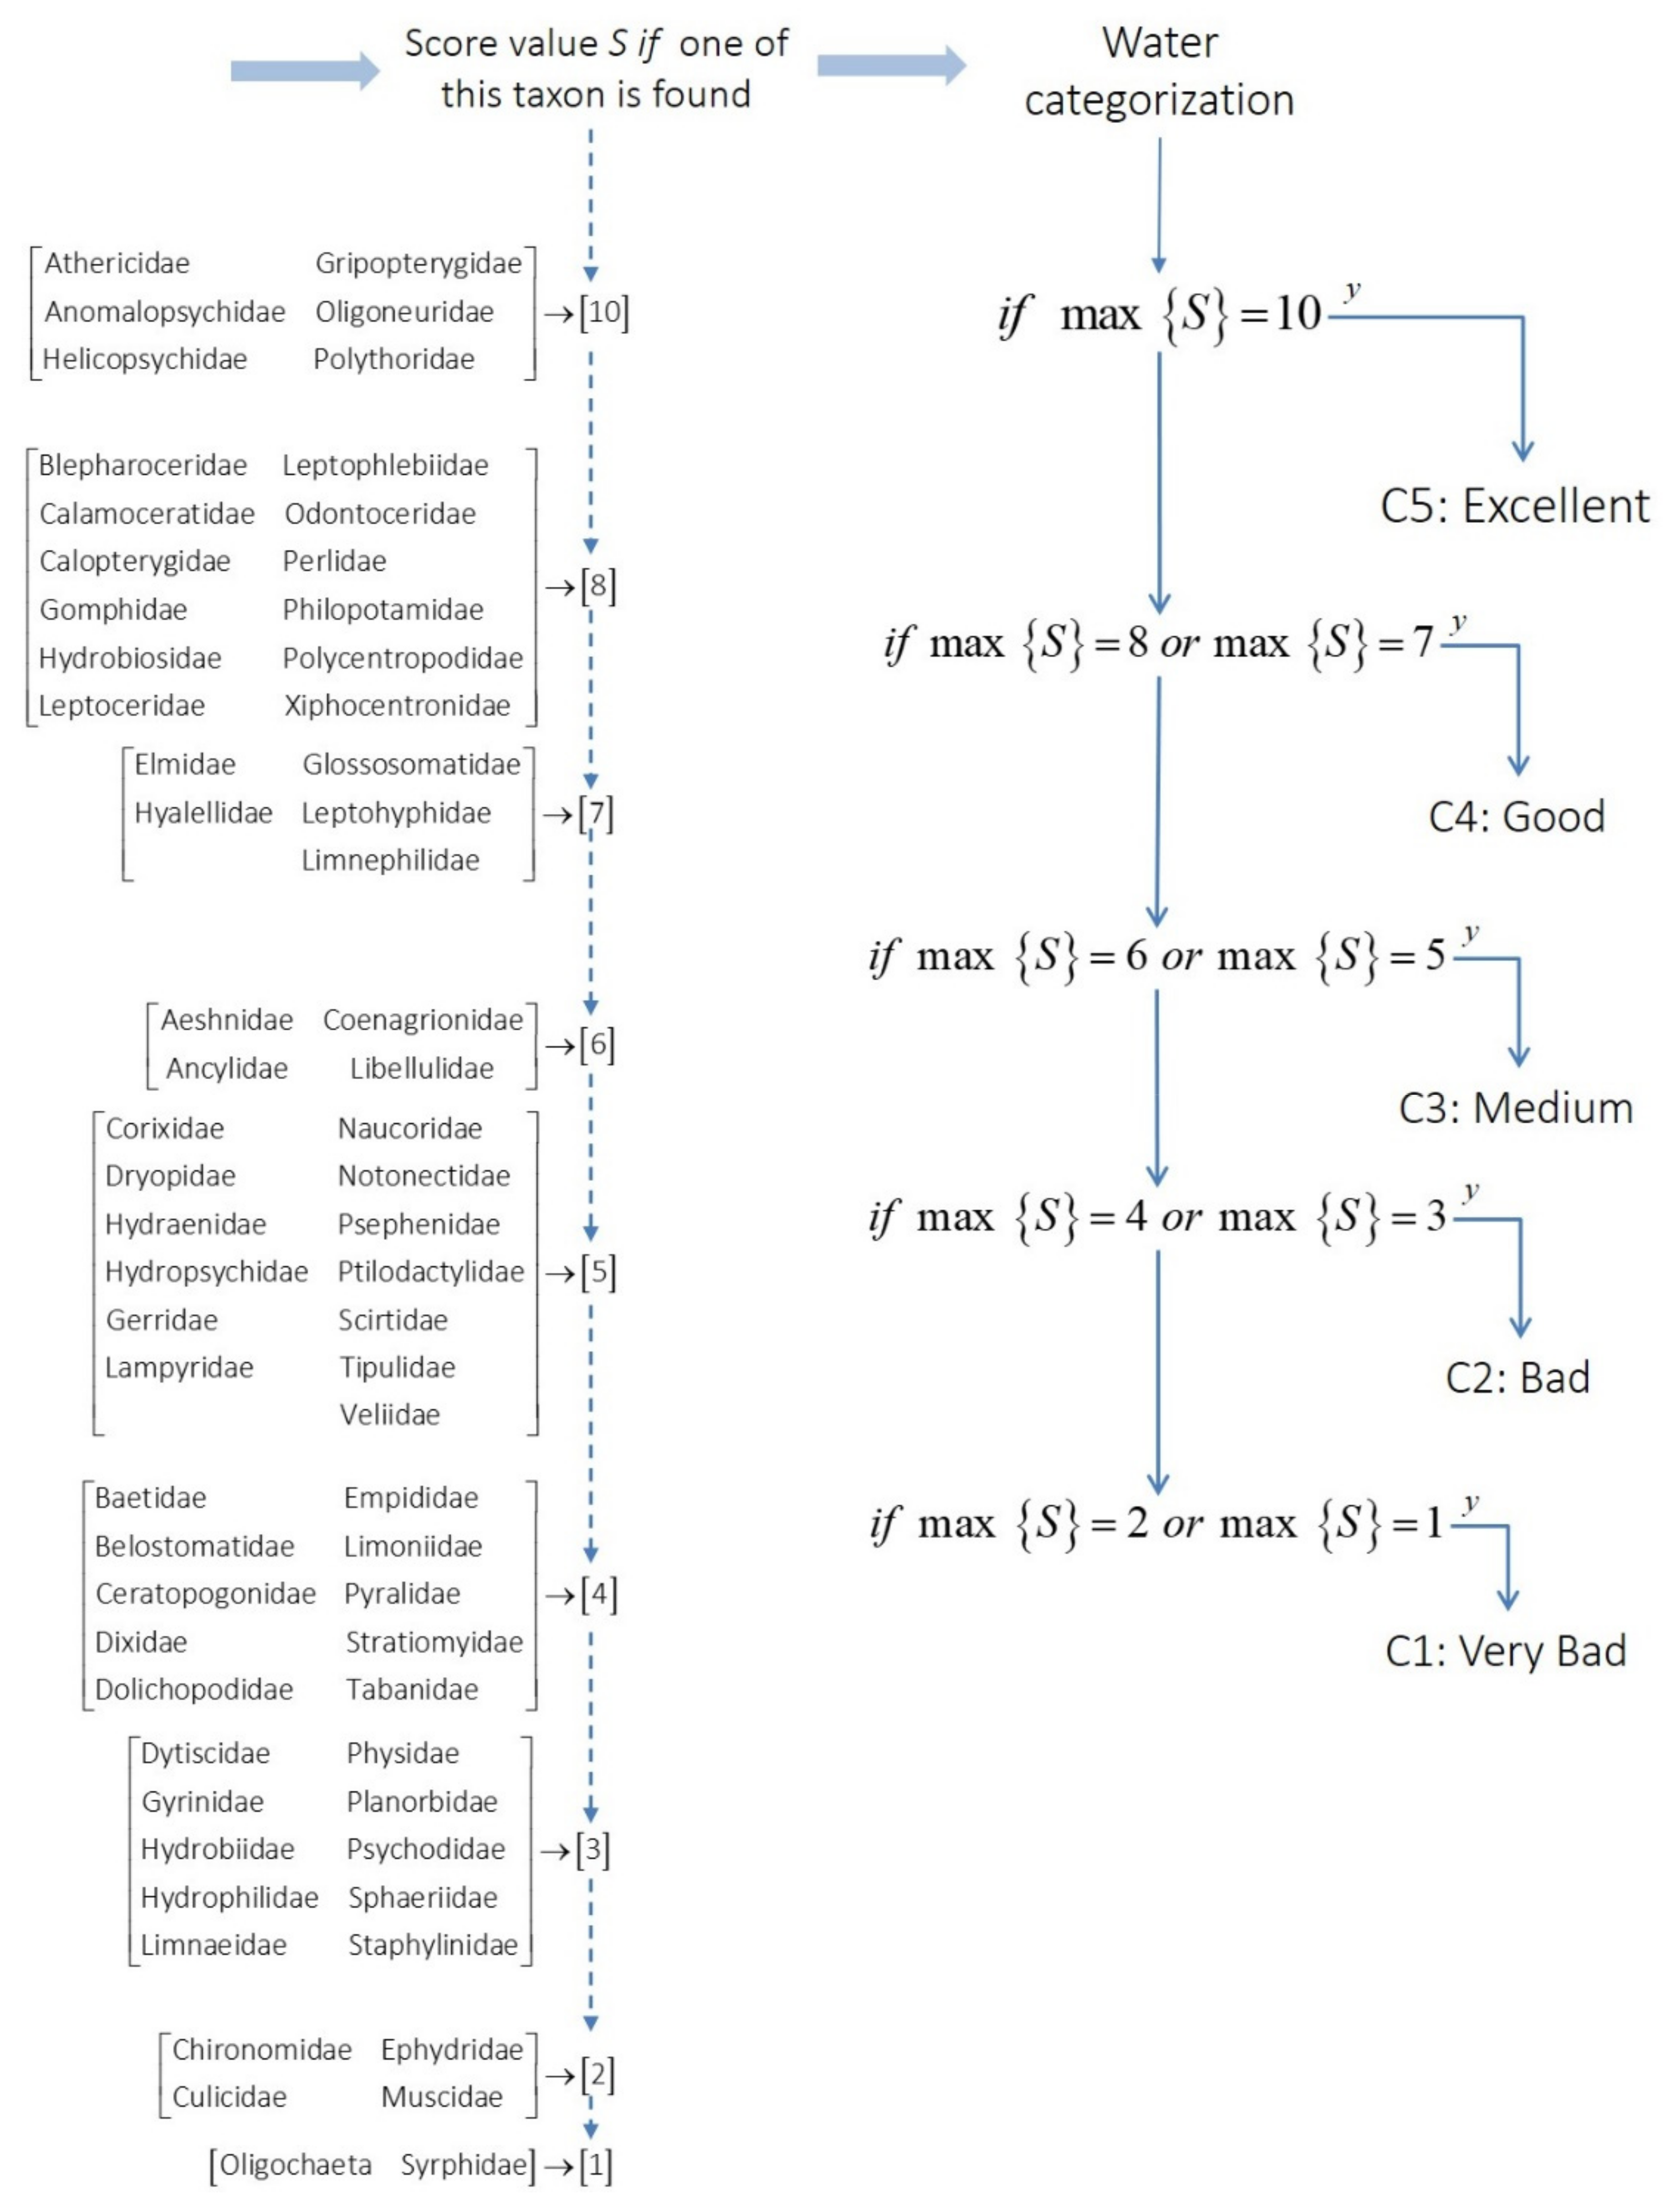
The proposed new ABI*, like the ABI, is based on the BM’s natural sensitivity to respond to eventual or permanent disturbance of their natural habitats in the Andean highlands. The ABI* is founded on the presence of the taxon in the study region and the taxon score (Table 4). The ABI* water quality categorization considers the presence of the very susceptible taxons (Figure 2). For example, suppose a taxon with a score of 10 is found; the taxon indicates water quality C5 or a “very good” water quality. The water quality is C4 or “good” if we cannot find any taxon with a score of 10, and we find a taxon with a score of 8 or 7. In Table 4, the ABI score does not show any taxon with a score of 9. Water quality is “medium” if we cannot find any taxon with a score of 10, 8, or 7, and we find a taxon with a score of 6 or 5.
Similarly, water quality is “bad” if we cannot find any taxon with a score of 10, 8, 7, 6, or 5, and we find a taxon with a score of 4 or 3. Finally, water quality is “very bad” if we cannot find any taxon with a score of 10, 8, 7, 6, 5, 4, or 3, and we find a taxon with a score of 2 or 1. Figure 2 displays the procedure for water quality categorization following ABI* principles. The ABI* score in Table 4 was determined by adjusting ABI score values such that a strong correlation exists between the WQINSF and the ABI*.
The ABI* calibration involved two consecutive stages: (1) identifying the reference region and (2) the ABI* calibration.
- Identifying the best region for ABI* calibration.
- a.
- The raw data from each replicate were transformed into a single WQINSF numerical value (Equation (1)).
- b.
- The WQINSF values were grouped according to each study region.
- c.
- An Anderson–Darling normality test was conducted to determine if the WQINSF values in each study region followed a normal distribution.
- d.
- The probability of water quality being C5, C4, C3, C2, and C1 in each study region was calculated following Equation (12).
- e.
- The water quality category with the highest probability was assigned to each study region.
- f.
- The study region’s sigma level value associated with the highest probability class was calculated following Equation (13).
- g.
- The region in which the water quality was measured with the highest degree of precision, indicated by the highest sigma level value, was designated as the reference region for ABI* calibration.
- ABI* calibration
- a.
- Raw data were transformed into a numerical value in correspondence with WQINSF, ABI, and ABI* non-calibrated (ABI*NC) (initially using the score values provided by ABI) (Figure 2).
- b.
- c.
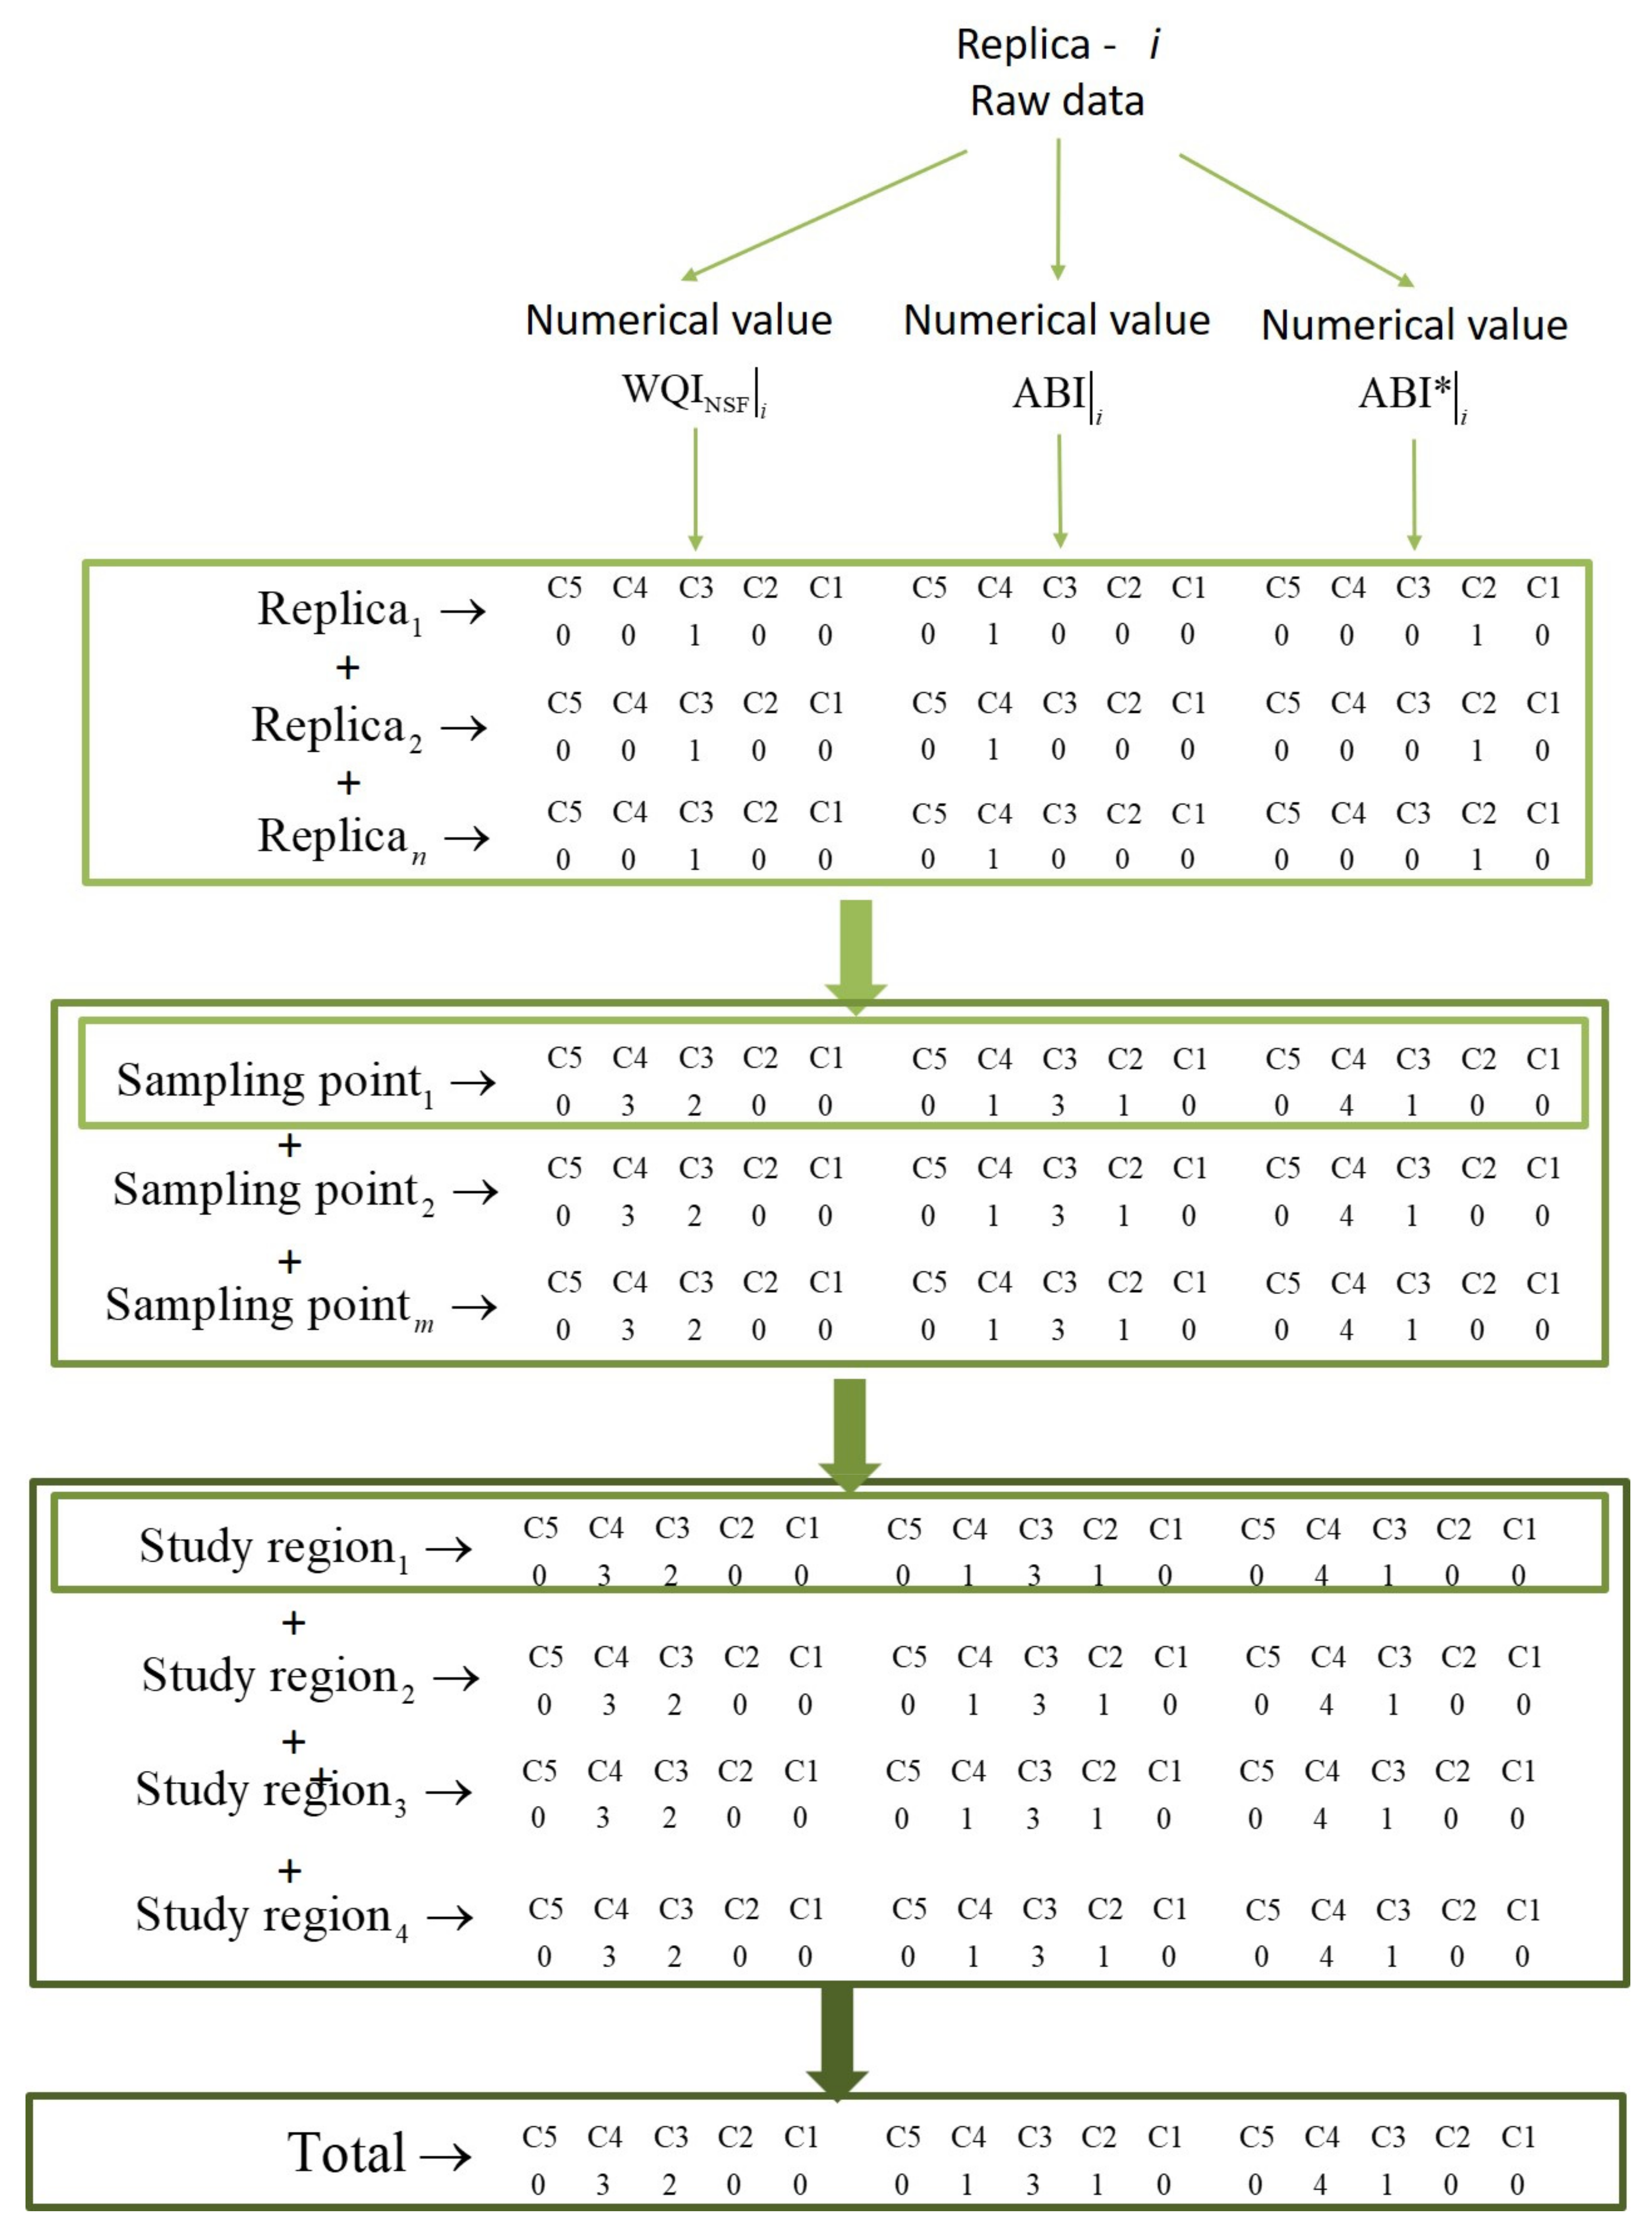
- The total number of classes obtained for each sampling point was achieved by summing the classes in each replicate. The results for each replicate were organized as shown in Figure 3.
- d.
- The total classes obtained for each study region were achieved by summing the classes at each sampling point. The results for each replicate were organized as shown in Figure 3.
- e.
- The total classes obtained for the entire study region were achieved by summing the classes in each study region. The total results were organized as shown in Figure 3.
- f.
- Spearman’s correlation coefficient between pairs of indicators in each study region and the entire data set was determined.
- g.
- The ABI* scores were adjusted so that when applied following the ABI* calibration process, the correlation between the results of applying the ABI* and the WQINSF in the reference region is one.
- h.
- The calibrated ABI* was applied to the remaining study regions, and the correlation between the three indicators was confirmed.
2.4. Data Processing
We explored the WQINSF uncertainty by scanning the original plot of the WQI given by Effendy and Romano [27] and Otto [28]. Then, analytical functions were fitted to the numerical values to incorporate uncertainty. The medium quadratic errors associated with each analytical function gave the uncertainty. Finally, we found the uncertainty associated with a given WQINSF value, calculated using the analytical functions of each water quality indicator.
The accuracy associated with water categorization by the WQINSF value and the water quality classes given in Table 3 was explored by (1) studying the uncertainty effects on the variability of the WQINSF values, (2) confirming that WQINSF values follow a normal distribution, (3) using thresholds defining water quality classes in Table 3 to find a mathematical expression for the probability of a given water quality class given many WQINSF numerical values, and (4) recursively finding the sigma level to better understand the accuracy of a water quality class given by the WQINSF.
Statistical analysis was performed using Minitab software, Minitab® 20.4 (Mintab Inc., State College, PA, USA). The results were presented in a box plot using OrigPro 9.1.0 (OriginLab Corporation, Northampton, MA, USA). An Anderson–Darling normality test was performed to determine whether data do not follow a normal distribution. For a normality test, the hypotheses are as follows. H0: Data follow a normal distribution. H1: Data do not follow a normal distribution. To determine whether the data do not follow a normal distribution, we compared the p-value to the significance level. We selected a significance level α = 0.05. A Spearman correlation analysis was conducted to assess the strength of the monotonic relationship between water quality indices. We selected a confidence level of 95%.
Figure 3 illustrates the arrangement of the results. First, we determined the number of water quality classes at each sampling point by adding the classes in each replica. Next, we added the classes at each sampling point to calculate each study region’s total class count. Finally, adding the classes from each study region resulted in the total number of classes for the entire study region.
3. Results
3.1. The WQINSF Uncertainty
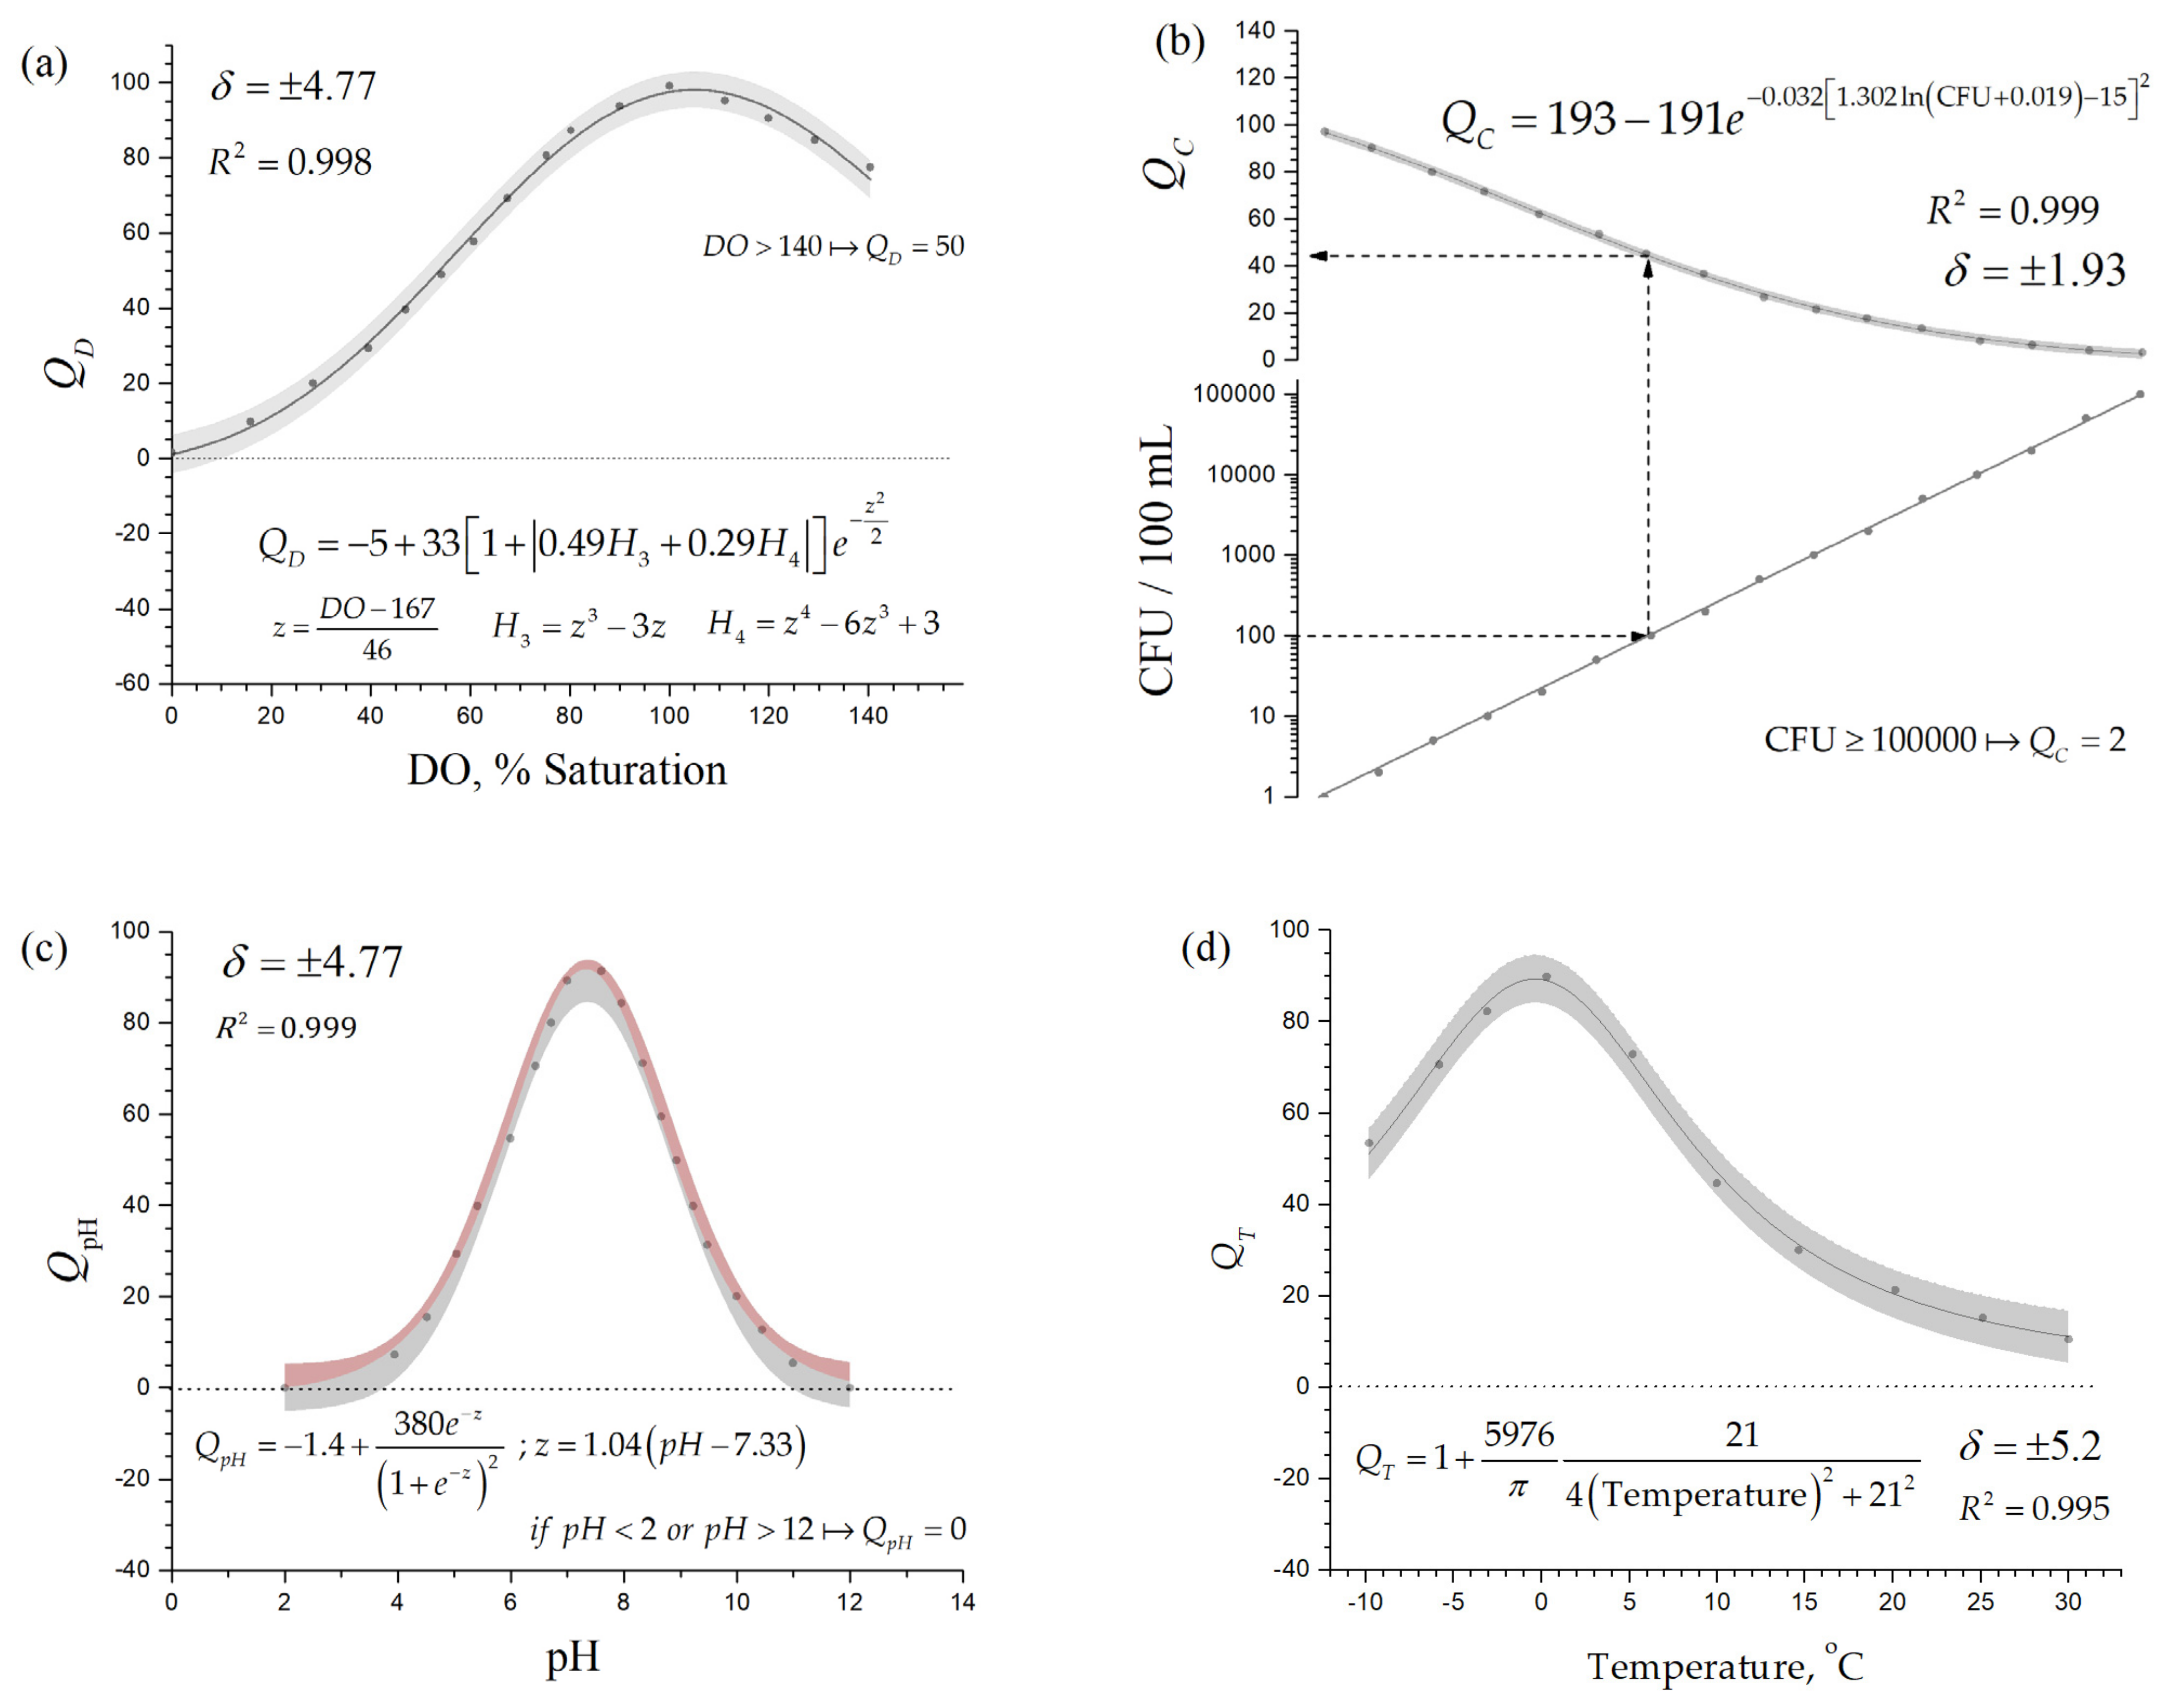
Figure 4 and Figure 5 depict the mathematical functions, the uncertainty in value prediction with a 95% confidence margin, and the mean squared deviation (MSD) in estimating each water quality indicator of the WQINSF. Therefore, any WQINSF value must be expressed as shown in Equation (3).
The MSD illustrates the uncertainty effect in prediction (±δ value in Figure 4 and Figure 5) and the interval where 95% of experimental data from repeated measurements are expected to lie. Thus, the uncertainty associated with the water quality categorization by the WQINSF is labeled δWQINSF and computed according to Equation (4). Therefore, individual WQINSF values must be expressed together with their uncertainty, as shown in Equation (5).
Equation (4) shows that the global uncertainty value due to the digitalization and fitting process is constant. However, each water quality indicator has a different uncertainty value (±δ value in Figure 3 and Figure 4). Additionally, it can be shown that the average of many values has the same degree of uncertainty (Equation (6)).
3.2. The WQINSF Accuracy
Standard deviations and variances in WQINSF measurements are not affected by uncertainty , as shown by Equation (7).
Thus, let us consider that WQINSF is a normally distributed random variable with mean and standard deviation (SD) σ (Figure 6). For clarity, let us consider that the mean values are within the interval suggested in Table 3 for “Good water quality.” Figure 6 shows the upper and lower limits for a “good” water quality class, and
, respectively. The probability (Pr) of the WQINSF value being in any water quality class is written as Equation (8).
Considering we have enough WQINSF values, the probability that the water quality class is “good” is given by Equation (9). At the same time, the probability that the water quality is “not good” is .
Let us define the upper zu and lower zl sigma level as in Equations (10) and (11), respectively; thus, Equation (9) can be rewritten as Equation (12).
The erf is the label for the error function [30]. Finally, by knowing Pr and recursively using Equation (12), we find the sigma value zSL that yields the Pr value.
The zSL sigma value dictates–considering that the water quality is good–the probability Pr of “good” and the probability of “no good” water quality 1 − Pr. For example, Table 6 lists the water quality class Pr regarding the sigma level. Therefore, if zSL = 3 (3 sigmas or 3S), there is a 99.73% probability that the water quality is good. However, at the same time, there is a 0.27% probability that the water quality is no good. In other words, we have a change in 1 water quality measurement yielding a “no good water quality” out of 370 water quality measurements. Therefore a high-accuracy water quality measurement would be expressed as, for example, a 4 sigma or 4S measurement.
The zSL sigma or (zSL)S expresses the accuracy of a given water quality class, the Pr value. The Central Limit Theorem states that WQINSF value distribution approximates a normal distribution as the available WQINSF values increase, regardless of population distribution. Typically, 30 or more WQINSF values are deemed sufficient for the Central Limit Theorem. The fact that the sample means () and standard deviations (σ) are equal to the population means and standard deviations is a crucial aspect of the Central Limit Theorem. Therefore, with a sufficiently large number of WQINSF values, it is possible to express water quality more precisely. However, any interpretation of the WQINSF is restricted to the parameters measured.
3.3. Parameters Measured and Water Quality
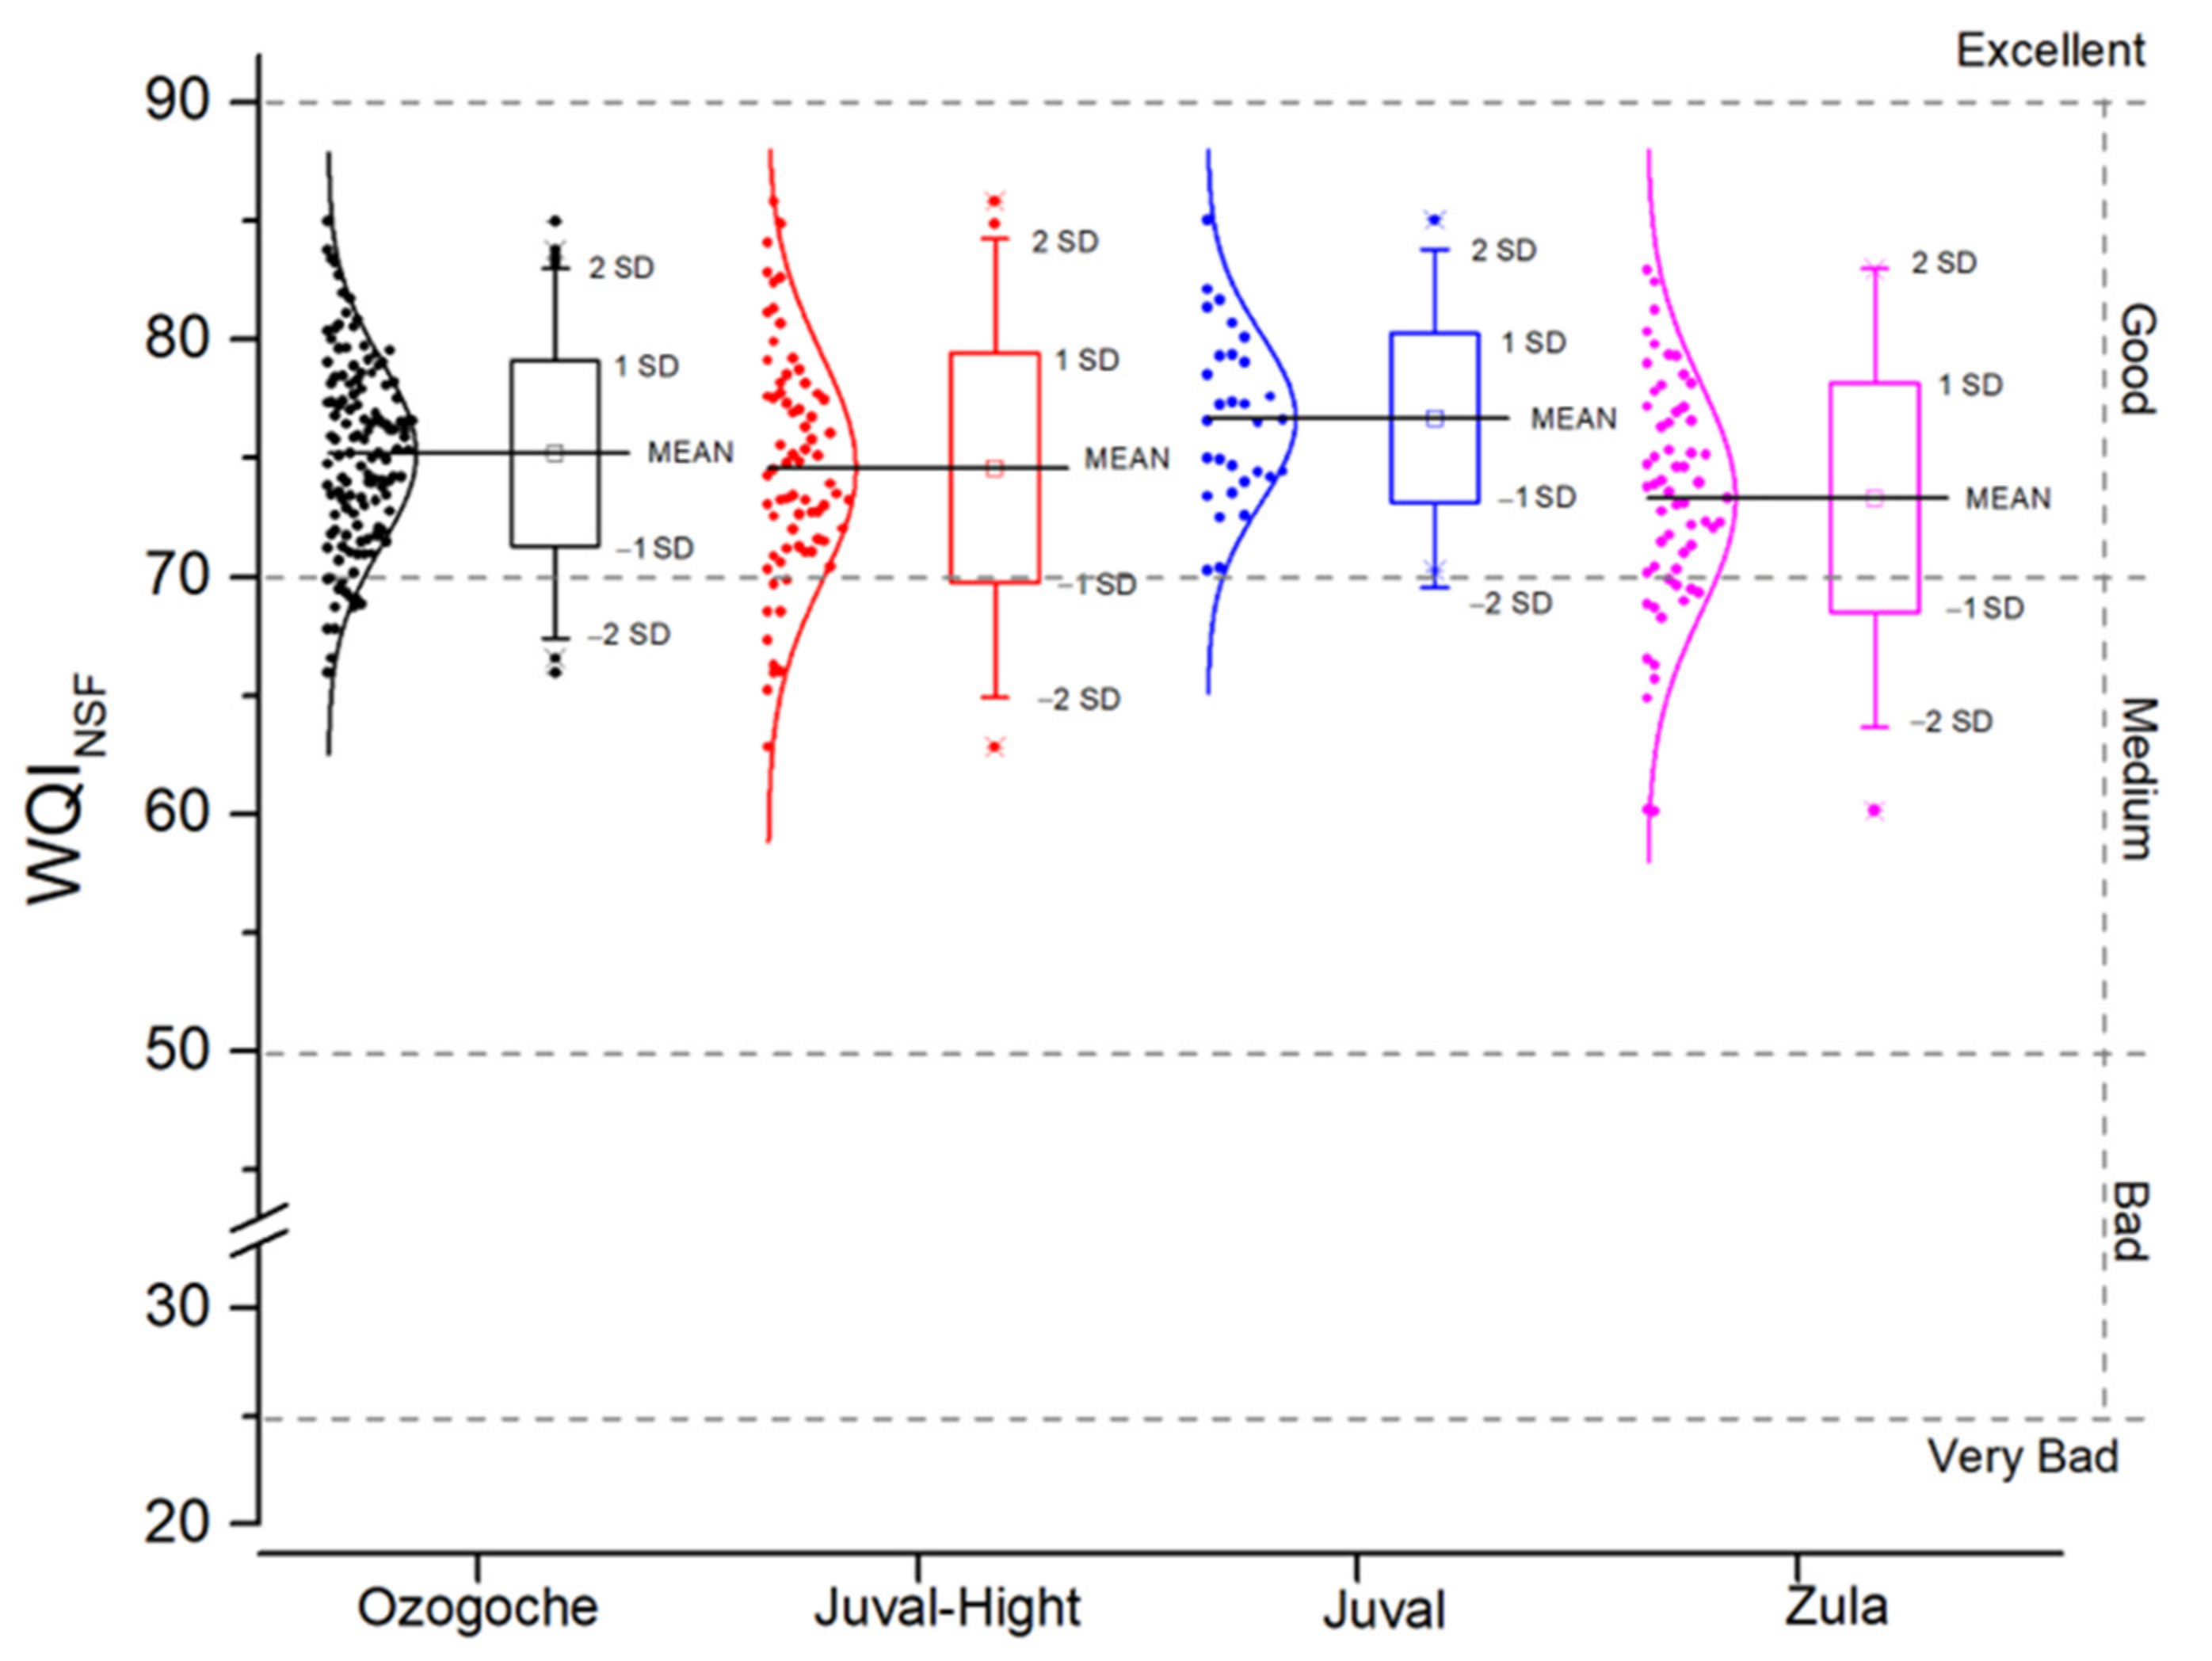
Table 7 and Figure 7 show that the mean water quality calculated by the WQINSF in the four study areas is good (Table 3).
The normality test revealed that WQINSF values at each study region follow a normal distribution (p-value is shown between parentheses): Ozogoche (0.952), Juval-Hight (0.856), Juval (0.586), Zula (0.801). Thus, we do not have enough evidence to conclude that the data do not follow a normal distribution (p-value > 0.05). The mean WQINSF values are between 75.21 and 76.69 (Figure 7, Table 7).
The calculated zSL sigma value was higher (2.10) in the Juval region. A sigma value of 2.10 dictates that there can only be a margin of error up to 2.10 standard deviations from the mean. This sigma value means that 97% of all outcomes fall within the accuracy range (WQINSF—good water quality class) (Table 6 and Table 7).
Table 8 lists the outcomes of categorizing the water quality at each sampling location. As an illustration of how to read Table 8, the water quality at all nine replicates classified by the WQINSF at the first coordinate point (COP01) was C4 or “GOOD.” However, the ABI classification at the same sample site yielded five replicates of C1 or “VERY BAD” quality and four of “BAD” quality. In contrast, the non-calibrated ABI* (ABI*NC) classification produced eight replicates of C3 or “MEDIUM” quality and one replicate of C4 or “GOOD” quality. For index performance comparison, Table 8’s final row shows the overall number of each water quality class obtained by each water quality index. The results show that 87% of the WQINSF measurement yielded good (C4) water quality. In comparison, 2% and 51% of ABI measurements yielded good (C4) and bad (C2) water quality classes, respectively. Similarly, 14%, 51%, and 32% of ABI*NC measurements yield very good (C5), good (C4), and medium (C3) water quality classes, respectively. Therefore, there is a discrepancy in the water categorization results of the WQINSF and the ABI.
At the Juval region, where water quality determination by the WQINSF shows the highest accuracy sigma level, 100% of the WQINSF measurements yielded good water quality (C4). However, 7% and 33% of ABI measurements yielded good (C3) and bad (C2) water quality classes, respectively. Similarly, 47% and 50% of ABI*NC measurements yielded an excellent (C5) and good (C4) water quality class, respectively (Table 8). The differences in amounts of the WQINSF, ABI, and ABI*NC were still evident. However, upon calibrating the ABI*NC (ABI*), we obtained a complete correspondence between the WQINSF and the ABI* (Juval’s data in Table 8). The adjustment was performed on the taxon pollutant sensitivity score, so that we do not introduce changes in water categorization in the other region. Therefore, when we used the ABI* in the Ozogoche, Juval-Hight, and Zula regions, we still obtained a significant correlation between the WQINSF and the ABI* (Table 8). Table 8’s highlighted rows feed a pairwise Spearman correlation analysis. The main idea was to gauge monotonic correlations between indices and determine the statistical significance of the link between water quality indices (Table 9).
The correlations of ABI–WQINSF, ABI*NC–ABI, and ABI*–ABI in all the study regions is not statistically significant (p-value > 0.05). Furthermore, all the Spearman correlation coefficients are negative except for the correlation between ABI* and ABI at Juval-Hight. Thus, one water quality index increases while the other decreases. Thus, we do not have enough evidence to conclude that the correlations of ABI–WQINSF, ABI*NC–ABI, and ABI*–ABI in all the study region are statistically significant (Table 9). However, the strength of the correlations between ABI*NC and WQINSF and ABI* and WQINSF is high and close to 1. High positive correlation values for ABI*NC–WQINSF and ABI*–WQINSF suggest that WQINSF, ABI*NC, and ABI* are statistically related with respect to the same attribute (water quality). Furthermore, the correlation values are positive, implying that the two correlated water quality indices rise and fall together (Table 9). However, in the Juval region, the correlation between ABI*NC and WQINSF is not statistically significant (p-value = 0.165), although there is a high and positive correlation value. Furthermore, adjusting some taxon pollutant sensitivity scores, we obtained statistically significant high positive Spearman correlation values between ABI* and WQINSF (Table 4). Therefore we obtained high positive and statistically significant (p-value ≤ 0.05) correlation values between ABI* and WQINSF in all the study regions.
4. Discussion and Conclusions
The results in Table 7 show that the mean pH values are between 7.77 and 8.09, considered typical values for high-quality water. Similarly, the average water temperature varies between 10.69 and 11.95; temperatures below 15 °C un-favor microorganism development and intensified odors and flavor. Dissolved oxygen governs most processes that produce or consume oxygen in aquatic ecosystems. Its concentration results from physical, chemical, and biological processes that consume oxygen. The results obtained vary between 6.68–7.50 mg L−1 of dissolved oxygen. Thus, the dissolved oxygen is adequate for the growth and development of aquatic organisms. The electrical conductivity (EC) for good quality natural waters should be between 50 and 1500 µS cm−1. However, the sampled waters of the study area are within the lower range of 105.93 µS cm−1. The highest turbidimetry measurements, above the WHO’s 5 NTU limit [31], were found in the Juval-Hight and Zula micro-watersheds; these results demonstrate the sediment-dragging effects of surface runoff from rain. The Juval-Hight and Zula micro-basins show the greatest EC values. The same behavior was observed for dissolved solids, although all the average values are within the permissible range (500 mg L−1). Thus, the mean water quality characterized by the WQINSF is good. This result suggests significant water quality changes began due to environmental degradation and contact with domestic and agricultural wastes [10,28,29].
4.1. The WQINSF Uncertainty and Accuracy
Many recent studies discuss the uncertainty issues associated with the WQINSF model [10]. Knowing the uncertainty improves accuracy and gives users a sense of its potential impact. While uncertainty is unavoidable in any mathematical model [32], there are multiple sources of uncertainty in categorizing water quality throughout the WQINSF. First is the uncertainty given by the specific set of indicators used to calculate the WQINSF. Second, uncertainty is introduced by reading raw indicator data and converting them to a single value. The third is the uncertainty due to using a specific weighting factor for each water quality parameter (WQP). Fourth is the uncertainty due to the aggregation function used to obtain a single value for the WQI using the WQPs and weighting factors for all WQPs [10]. Fifth, threshold values defining the water quality class could introduce ambiguity (uncertainty). Sixth, natural systems’ inherent randomness, unpredictability, and non-stationarity introduce natural variability (uncertainty) [32,33]. The first four sources of uncertainty fall into the category of epistemic uncertainty, which can be reduced by getting more information, but it is impossible to separate the epistemic uncertainty caused by how the model is built [10,32]. Moreover, we always have ambiguities due to categorizing the water quality into a finite number of classes and inherent randomness and natural variability. Furthermore, little was found in the literature on quantifying WQINSF accuracy. Hence, one of the aims of this study was to quantify WQINSF accuracy [10].
This study found that the sigma value (Table 6) can quantify WQINSF accuracy. Therefore, a higher sigma value dictates that we had measured water quality with higher accuracy. One interesting finding is that the variability of the WQINSF is not affected by the uncertainty of its measured value () (Equation (6)). This finding is somewhat interesting, given that other research mentions the problem with handling WQINSF uncertainty [10], but this issue has not been pursued further to the authors’ knowledge.
Hence, it is possible to consider the ambiguities introduced by the thresholds defining water quality classes and manage the unpredictability and natural variability of the water body’s natural system. However, with a small sample size, caution must be applied, as the distribution of the WQI values must follow a normal distribution. According to these results, the sigma value framework may also control uncertainty when categorizing water quality using other indices (see Table 4 in Uddin et al. [8]).
4.2. The Proposed Water Quality Index ABI*
This study aimed to integrate the WQINSF and the ABI into an indicator that incorporates the benefits of both methodologies in categorizing water quality in high mountain regions. However, we did not find any correlation between WQINSF and ABI. The ABI may have been affected by the aggregation function’s eclipse effect [10,20]. However, we were expecting some coincidence and not such a large difference, despite the differences between the two approaches to water quality categorization, but we found something else that was important. In three of the study areas, the correlation between the WQINSF and ABI*NC was close to one (Table 9). It happened when we used the presence of BMs and pollutant sensitivity given by the ABI score of BMs (Figure 2 and Table 4) to measure water quality, the ABI*NC [18,20,34]. Although, the WQINSF sigma value in these three areas was low, we found an excellent statistical correlation between the WQINSF and the ABI* in the four areas of study when we calibrated the ABI*NC. After adjusting the sensitivity to pollutants of the BMs found in the Juval region (Table 4), the correlation between the WQINSF and ABI* substantially improved.
The use of the presence of specific BMs as an indicator of water quality is an old concept that originates from the Saprobien or Saprobic system implemented on German rivers in the early 1900s [18,35,36]. Additionally, after reviewing more than 500 reports, Ríos-Touma et al. [20] show that the sensitivity to pollutants of some BMs differs from those reported in other areas and the biotic index. Moreover, the area of Juval is the only study region between 2000 to 2800 m.a.s.l. Thus, a decrement in the BM sensitivity to pollutants suggests taxon adaptation to slightly contaminated water (Leptophlebiidae, Perlidae, Calamoceratidae, Odontoceridae, and Blepharoceridae, Table 4). At the same time, an increment in BM pollutant sensitivity suggests that the taxon is conquering a new environment (Elmidae, Hyalellidae, Table 4). Therefore, local communities could independently assess water quality by becoming familiar with the BM community in the Andes highlands. Thus, integrating the WQINSF and ABI led to the new ABI*. The ABI* is a tool that communities can use to independently conduct a reliable water quality assessment to protect and monitor river water quality and for climate adaptation and mitigation. Therefore, communities could monitor territorial management plans oriented to mitigate and adapt to climate change and the progress of agricultural frontiers. However, this result hasn’t been described before, and caution must be used, because the ABI* is not a substitute for the WQINSF or more detailed biological studies but a precursor. Moreover, the ABI* should be used in conjunction with, and is not a replacement for, the WQINSF.
Author Contributions
Conceptualization, C.O.M., V.J.G. and A.C.R.; writing—original draft preparation, C.O.M. and V.J.G.; writing—review and editing, C.O.M. and V.J.G. All authors have read and agreed to the published version of the manuscript.
Funding
This research was funded by the Universidad Nacional de Chimborazo, Dirección de Investigación del Vicerrectorado de Investigación, Vinculación y Posgrado.
Institutional Review Board Statement
Not applicable.
Informed Consent Statement
Not applicable.
Data Availability Statement
The data presented in this study are available upon request from the corresponding author.
Acknowledgments
We gratefully acknowledge the assistance of the lab staff and the Interdisciplinary Studies Research Group (Grupo de Investigación Estudios Interdisciplinarios) throughout the investigation.
Conflicts of Interest
The authors declare no conflict of interest.
References
- Wu, Z.; Lai, X.; Li, K. Water Quality Assessment of Rivers in Lake Chaohu Basin (China) Using Water Quality Index. Ecol. Indic. 2021, 121, 107021. [Google Scholar] [CrossRef]
- Zhang, F.; Zeng, C.; Zhang, Q.; Yao, T. Securing Water Quality of the Asian Water Tower. Nat. Rev. Earth Environ. 2022, 3, 611–612. [Google Scholar] [CrossRef]
- Ustaoğlu, F.; Tepe, Y.; Taş, B. Assessment of Stream Quality and Health Risk in a Subtropical Turkey River System: A Combined Approach Using Statistical Analysis and Water Quality Index. Ecol. Indic. 2020, 113, 105815. [Google Scholar] [CrossRef]
- Parween, S.; Siddique, N.A.; Mahammad Diganta, M.T.; Olbert, A.I.; Uddin, M.G. Assessment of Urban River Water Quality Using Modified NSF Water Quality Index Model at Siliguri City, West Bengal, India. Environ. Sustain. Indic. 2022, 16, 100202. [Google Scholar] [CrossRef]
- Garrick, D.E.; Hall, J.W.; Dobson, A.; Damania, R.; Grafton, R.Q.; Hope, R.; Hepburn, C.; Bark, R.; Boltz, F.; De Stefano, L.; et al. Valuing Water for Sustainable Development. Science 2017, 358, 1003–1005. [Google Scholar] [CrossRef] [Green Version]
- Su, K.; Wang, Q.; Li, L.; Cao, R.; Xi, Y. Water Quality Assessment of Lugu Lake Based on Nemerow Pollution Index Method. Sci. Rep. 2022, 12, 13613. [Google Scholar] [CrossRef]
- Seddon, N. Harnessing the Potential of Nature-Based Solutions for Mitigating and Adapting to Climate Change. Science 2022, 376, 1410–1416. [Google Scholar] [CrossRef]
- Uddin, M.G.; Nash, S.; Rahman, A.; Olbert, A.I. A Comprehensive Method for Improvement of Water Quality Index (WQI) Models for Coastal Water Quality Assessment. Water Res. 2022, 219, 118532. [Google Scholar] [CrossRef]
- Noori, R.; Berndtsson, R.; Hosseinzadeh, M.; Adamowski, J.F.; Abyaneh, M.R. A Critical Review on the Application of the National Sanitation Foundation Water Quality Index. Environ. Pollut. 2019, 244, 575–587. [Google Scholar] [CrossRef]
- Uddin, M.G.; Nash, S.; Olbert, A.I. A Review of Water Quality Index Models and Their Use for Assessing Surface Water Quality. Ecol. Indic. 2021, 122, 107218. [Google Scholar] [CrossRef]
- Nong, X.; Shao, D.; Zhong, H.; Liang, J. Evaluation of Water Quality in the South-to-North Water Diversion Project of China Using the Water Quality Index (WQI) Method. Water Res. 2020, 178, 115781. [Google Scholar] [CrossRef]
- Sun, W.; Xia, C.; Xu, M.; Guo, J.; Sun, G. Application of Modified Water Quality Indices as Indicators to Assess the Spatial and Temporal Trends of Water Quality in the Dongjiang River. Ecol. Indic. 2016, 66, 306–312. [Google Scholar] [CrossRef]
- Noori, R.; Karbassi, A.; Khakpour, A.; Shahbazbegian, M.; Badam, H.M.K.; Vesali-Naseh, M. Chemometric Analysis of Surface Water Quality Data: Case Study of the Gorganrud River Basin, Iran. Environ. Model. Assess. 2012, 17, 411–420. [Google Scholar] [CrossRef]
- Noori, R.; Sabahi, M.S.; Karbassi, A.R.; Baghvand, A.; Zadeh, H.T. Multivariate Statistical Analysis of Surface Water Quality Based on Correlations and Variations in the Data Set. Desalination 2010, 260, 129–136. [Google Scholar] [CrossRef]
- Zhang, Y.; Wu, L.; Ren, H.; Deng, L.; Zhang, P. Retrieval of Water Quality Parameters from Hyperspectral Images Using Hybrid Bayesian Probabilistic Neural Network. Remote Sens. 2020, 12, 1567. [Google Scholar] [CrossRef]
- Kulk, G.; George, G.; Abdulaziz, A.; Menon, N.; Theenathayalan, V.; Jayaram, C.; Brewin, R.J.W.; Sathyendranath, S. Effect of Reduced Anthropogenic Activities on Water Quality in Lake Vembanad, India. Remote Sens. 2021, 13, 1631. [Google Scholar] [CrossRef]
- Jin, W.; Li, Y.; Lu, L.; Zhang, D.; He, S.; Shentu, J.; Chai, Q.; Huang, L. Water Quality Assessment of East Tiaoxi River, China, Based on a Comprehensive Water Quality Index Model and Monte-Carlo Simulation. Sci. Rep. 2022, 12, 10042. [Google Scholar] [CrossRef]
- Abbasi, T.; Abbasi, S.A. Water Quality Indices; Elsevier, B.V.: Oxford, UK, 2012; p. 0536. ISBN 9781119130536. [Google Scholar]
- Bhadrecha, M.H.; Khatri, N.; Tyagi, S. Rapid Integrated Water Quality Evaluation of Mahisagar River Using Benthic Macroinvertebrates. Environ. Monit. Assess. 2016, 188, 254. [Google Scholar] [CrossRef]
- Ríos-Touma, B.; Acosta, R.; Prat, N. The Andean Biotic Index (ABI): Revised Tolerance to Pollution Values for Macroinvertebrate Families and Index Performance Evaluation. Rev. Biol. Trop. 2014, 62, 249–273. [Google Scholar] [CrossRef]
- Wu, Z.; Kong, M.; Cai, Y.; Wang, X.; Li, K. Index of Biotic Integrity Based on Phytoplankton and Water Quality Index: Do They Have a Similar Pattern on Water Quality Assessment? A Study of Rivers in Lake Taihu Basin, China. Sci. Total Environ. 2019, 658, 395–404. [Google Scholar] [CrossRef]
- Atazadeh, I.; Sharifi, M.; Kelly, M.G. Evaluation of the Trophic Diatom Index for Assessing Water Quality in River Gharasou, Western Iran. Hydrobiologia 2007, 589, 165–173. [Google Scholar] [CrossRef]
- Coletti, C.; Testezlaf, R.; Ribeiro, T.A.; de Souza, R.T.G.; Pereira, D.D.A. a Water Quality Index Using Multivariate Factorial Analysis. Rev. Bras. Eng. Agric. Ambient. 2010, 14, 517–522. [Google Scholar] [CrossRef] [Green Version]
- APHA. Standard Methods for the Examination of Water and Wastewater, 21st ed; American Public Health Association: Washington, DC, USA, 2005. [Google Scholar]
- Oram, B. Calculating NSF Water Quality Index. Water Research Center: Monitoring the Quality of Surface Waters. Available online: https://water-research.net/index.php/water-treatment/water-monitoring/monitoring-the-quality-of-surfacewaters (accessed on 10 January 2023).
- Bhuyan, N.K.; Sahu, B.; Rout, S.P. Assessment of Water Quality Index in Subarnarekha River Basin in and around Jharkhand Area. IOSR J. Environ. Sci. Toxicol. Food Technol. 2014, 8, 39–45. [Google Scholar] [CrossRef]
- Effendi, H.; Romanto, Y.W. Water Quality Status of Ciambulawung River, Banten Province, Based on Pollution Index and NSF-WQI. Procedia Environ. Sci. 2015, 24, 228–237. [Google Scholar] [CrossRef] [Green Version]
- Otto, W.R. Environmental Indices: Theory and Practice; Ann Arbor Science Publischer Inc.: Ann Arbor, MI, USA, 1978. [Google Scholar]
- Sharifi, M. Assessment of Surface Water Quality by an Index System in Anzali Basin. In Proceedings of the Hydrological Basis for Water Resources Management, Beijing, China, 23–26 October 1990; IAHS; IAHS Publication: Wallingford, UK, 1990; Volume 197, pp. 163–171. [Google Scholar]
- Weisstein, E.W. CRC Concise Encyclopedia of Mathematics; Chapman and Hall/CRC: Boca Raton, FL, USA, 2002. [Google Scholar]
- WHO. Guidelines for Drinking-Water Quality, 4th ed.World Health Organization: Geneva, Switzerland, 2017. [Google Scholar]
- Lowe, L.; Szemis, J.; Webb, J.A. Uncertainty and Environmental Water; Elsevier Inc.: Amsterdam, The Netherlands, 2017; ISBN 9780128039458. [Google Scholar]
- Beven, K. Facets of Uncertainty: Epistemic Uncertainty, Non-Stationarity, Likelihood, Hypothesis Testing, and Communication. Hydrol. Sci. J. 2016, 61, 1652–1665. [Google Scholar] [CrossRef] [Green Version]
- Ollis, D.J.; Dalls, H.F.; Esler, K.; Boucher, C. Bioassessment of the ecological integrity of river ecosystems using aquatic macroinvertebrates: An overview with a focus on South Africa. Afr. J. Aquat. Sci. 2006, 31, 205–227. [Google Scholar] [CrossRef]
- Sandin, L.; Hering, D.; BuffagnI, A.; Lorenz, A.; Moog, O.; Rolauffs, P.; Stubauer, I. The Development and Testing of an Integrated Assessment System for the Ecological Quality of Streams and Rivers throughout Europe, Using Benthic Macroinvertebrates; AQEM: Montréal, QC, Canada, 2001. [Google Scholar]
- Metzeling, L.; Chessman, B.; Hardwick, R.; Wong, V. Rapid Assessment of Rivers Using Macroinvertebrates: The Role of Experience, and Comparisons with Quantitative Methods. Hydrobiologia 2003, 510, 39–52. [Google Scholar] [CrossRef]
Figure 1.
Study area and location of sampling points. The red circle shows a subregion of the Juval micro-watershed, labeled Juval–Hight.
Figure 1.
Study area and location of sampling points. The red circle shows a subregion of the Juval micro-watershed, labeled Juval–Hight.

Figure 2.
ABI* water quality classifications.

Figure 3.
Water quality data per replica, sampling point, study region, and total. Data from Juval—Hight has been re-grouped as a fourth study region.
Figure 3.
Water quality data per replica, sampling point, study region, and total. Data from Juval—Hight has been re-grouped as a fourth study region.

Figure 4.
Analytical expressions and uncertainty in value prediction with a margin of 95% confidence for predictor variables utilized in WQINSF estimations. Dissolved Oxygen (a), Fecal Coliforms (b), pH (c), and Temperature (d).
Figure 4.
Analytical expressions and uncertainty in value prediction with a margin of 95% confidence for predictor variables utilized in WQINSF estimations. Dissolved Oxygen (a), Fecal Coliforms (b), pH (c), and Temperature (d).

Figure 5.
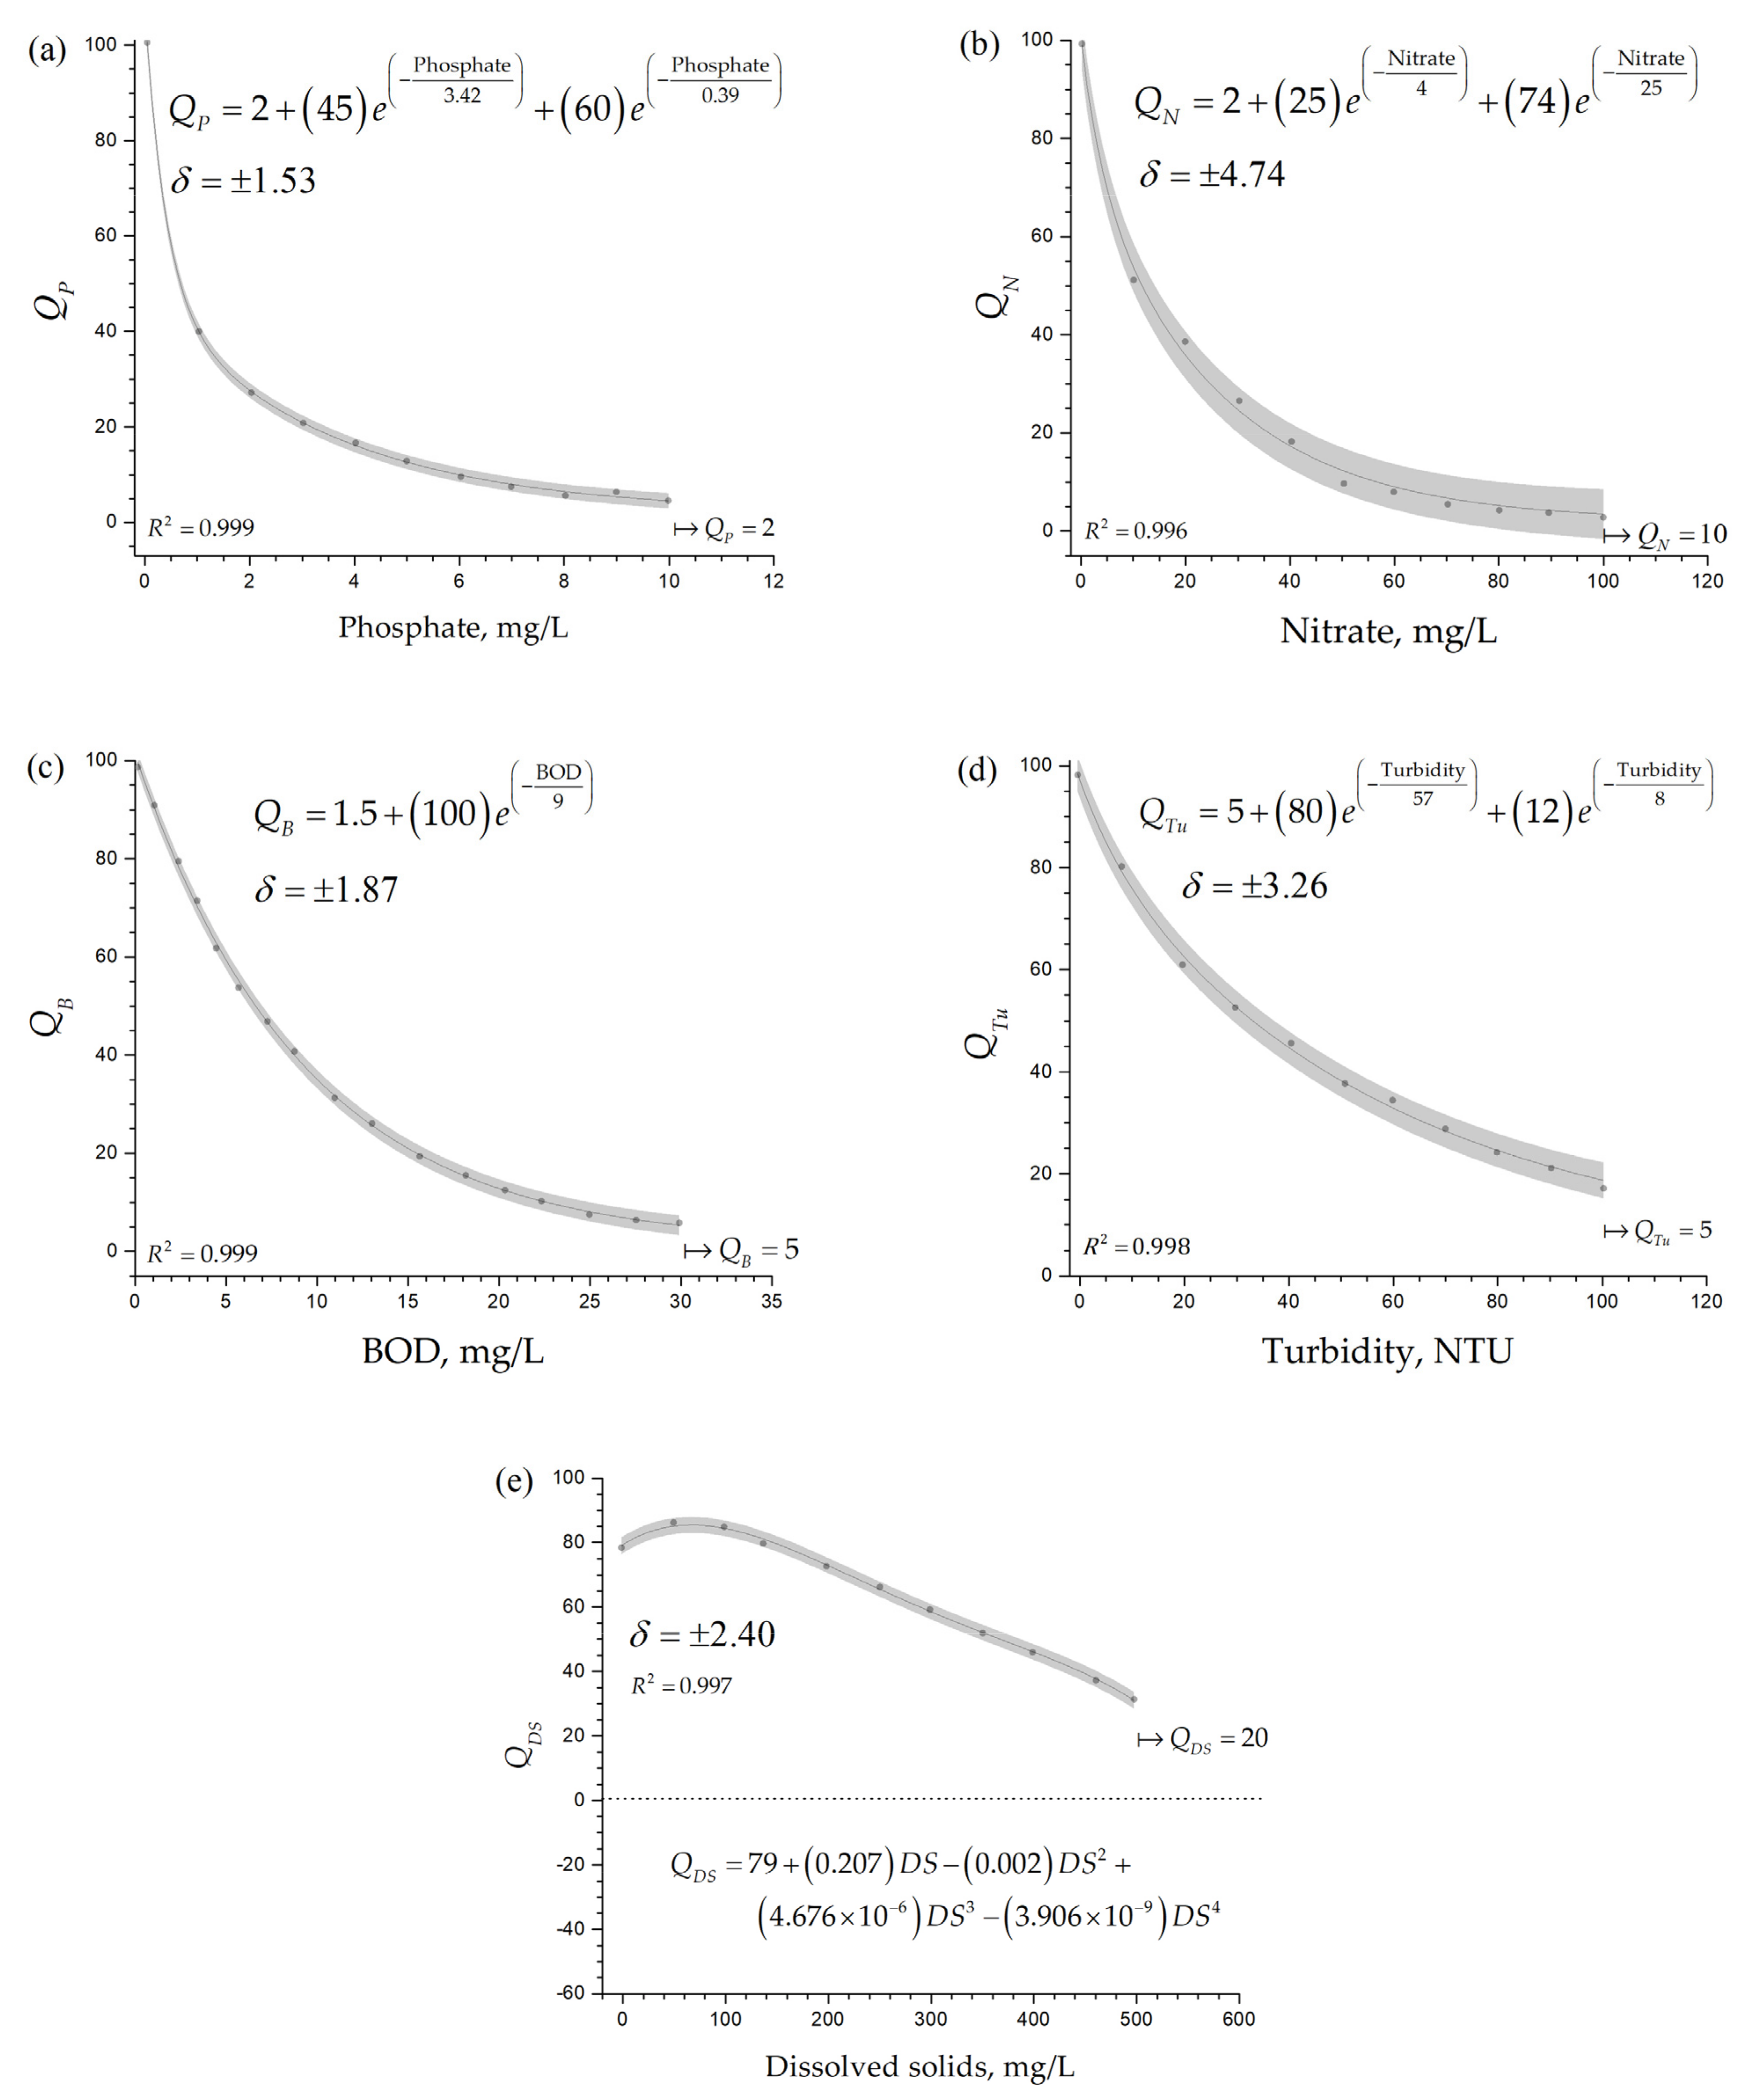
Analytical expressions and uncertainty in value prediction with a margin of 95% confidence for predictor variables utilized in WQINSF estimations. Phosphate (a), Nitrate (b), Biochemical Oxygen Demand (c), Turbidity (d), and Dissolved Solids (e).
Figure 5.
Analytical expressions and uncertainty in value prediction with a margin of 95% confidence for predictor variables utilized in WQINSF estimations. Phosphate (a), Nitrate (b), Biochemical Oxygen Demand (c), Turbidity (d), and Dissolved Solids (e).

Figure 6.
The distribution function of a set of WQINSF values with a mean of 75. The threshold values from Table 3 define good water quality.
Figure 6.
The distribution function of a set of WQINSF values with a mean of 75. The threshold values from Table 3 define good water quality.

Figure 7.
Boxplot showing the distribution of the WQINSF values, the mean value (MEAN), one standard deviation (1 SD), and two standard deviations (2 SD).
Figure 7.
Boxplot showing the distribution of the WQINSF values, the mean value (MEAN), one standard deviation (1 SD), and two standard deviations (2 SD).


Table 1.
Attributes of interest in the three studied micro-watersheds.
| Ozogoche | Juval | Zula | |
|---|---|---|---|
| UTM coordinates South Zone 17, Datum WGS84 | X: 766830 Y: 9751550 | X: 765232 Y: 9732190 | X: 754418 Y: 9747920 |
| Area, ha | 12088 | 59271 | 25330 |
| Altitude, m.a.s.l. | 3760–4600 | 2000–3765 | 2690–4420 |
| Precipitation, mm/year | 1000–1200 | 1500–2500 | 600–1200 |
| Population, people | 6190 | 854 | 752 |
| Ecosystem | Herbaceos páramo | Ceja Andina Andean Evergreen Forest. Montane Andean Evergreen Forest. Herbaceous páramo | Herbaceous páramo |
| Productive activity | Agriculture, livestock, and fish farming | Agriculture and grazing | Agriculture, grazing, and forest plantations |
| Parameters | Unit | Weights, wi |
|---|---|---|
| Dissolved oxygen (DO) | % Saturation (DO%) | 0.17 |
| Fecal coliform density (FC) | CFU/100 mL | 0.15 |
| pH | u.a. | 0.12 |
| Biochemical oxygen demand at 5 days (BOD5) | mg L−1 | 0.10 |
| Nitrate—nitrogen | mg L−1 (N) | 0.10 |
| Total Phosphate | mg L−1 (P) | 0.10 |
| Temperature (T) | °C | 0.10 |
| Turbidity | NTU | 0.08 |
| Total solids (TS) | mg L−1 | 0.08 |
| Classes | Water quality | Range | Comment |
|---|---|---|---|
| C5 | Excellent | 90 < WQINSF ≤ 100 | Clear water is ideal for fish and wildlife without contact with domestic waste. |
| C4 | Good | 70 < WQINSF ≤ 90 | Significant water quality changes begin due to environmental degradation and contact with domestic and agricultural wastes. |
| C3 | Medium | 50 < WQINSF ≤ 70 | Drastic changes in water quality begin to occur. Some natural functions may be affected. Some of the biotic communities may begin to shift. Structural changes in the benthic macroinvertebrate community are likely to occur. |
| C2 | Bad | 25 < WQINSF ≤ 50 | Dangerous changes can occur in the ecosystem. Groups resistant to contamination colonize the ecosystem. May cause the death of vertebrates and other consumers. |
| C1 | Very Bad | 0 ≤ WQINSF ≤ 25 | Unacceptable levels of contamination. Represents a threat in whatever form it is consumed. It creates a heterotrophic community in water. |
Table 4.
Family and Order of Benthic Macroinvertebrates considered in the ABI; also listed are the quantified values of the pollutant sensitivity (ABI score) [20]. Between parenthesis are the ABI* scores.
Table 4.
Family and Order of Benthic Macroinvertebrates considered in the ABI; also listed are the quantified values of the pollutant sensitivity (ABI score) [20]. Between parenthesis are the ABI* scores.
| Order | Family | ABI Score (ABI* Score) | Order | Family | ABI Score (ABI* Score) |
|---|---|---|---|---|---|
| Turbellaria | 5 | Trichoptera | Helicopsychidae | 10 | |
| Hirudinea | 3 | Calamoceratidae | 10 (8) | ||
| Oligochaeta | 1 | Odontoceridae | 10 (8) | ||
| Gastropoda | Ancylidae | 6 | Leptoceridae | 8 | |
| Physidae | 3 | Polycentropodidae | 8 | ||
| Hyrobiidae | 3 | Hydroptilidae | 8 | ||
| Limnaedae | 3 | Xiphocentronidae | 7 | ||
| Planorbidae | 3 | Hydrobiosidae | 5 | ||
| Ostracoda | 3 | Glossosomatidae | 7 | ||
| Ephemeroptera | Beatidae | 4 | Hydropsychidae | 5 | |
| Leptophlebiidae | 10 (8) | Anomalopsychidae | 10 | ||
| Leptohyphidae | 7 | Anomalopsychidae | 8 | ||
| Oligoneuridae | 10 | Limnephilidae | 7 | ||
| Odonata | Aeshnidae | 6 | Lepidoptera | Pyralidae | 4 |
| Gomphidae | 8 | Hydrophilidae | 3 | ||
| Libellulidae | 6 | Hydraenidae | 5 | ||
| Coenagrionidae | 6 | Diptera | Blepharoceridae | 10 (8) | |
| Caloterygidae | 8 | Simuliidae | 5 | ||
| Polythoridae | 10 | Tabanidae | 4 | ||
| Plecoptera | Perlidae | 10 (8) | Tipulidae | 5 | |
| Gripopterygidae | 10 | Limoniidae | 4 | ||
| Coleoptera | Ptilodactylidae | 5 | Ceratopogonidae | 4 | |
| Lampyridae | 5 | Dixidae | 4 | ||
| Psephenidae | 5 | Psychodidae | 3 | ||
| Scirtidae | 5 | Dolichopodidae | 4 | ||
| Staphylinidae | 3 | Stratiomyidae | 4 | ||
| Elmidae | 5 (7) | Empididae | 4 | ||
| Dryopidae | 5 | Chironomidae | 2 | ||
| Gyrinidae | 3 | Culicidae | 2 | ||
| Dytiscidae | 3 | Muscidae | 2 | ||
| Heteroptera | Veliidae | 5 | Ephydridae | 2 | |
| Gerridae | 5 | Athericidae | 10 | ||
| Corixidae | 5 | Syrphidae | 1 | ||
| Notonectidae | 5 | Bivalvia | Sphaeriidae | 3 | |
| Belostomatidae | 4 | Amphipoda | Hyalellidae | 6 (7) | |
| Naucoridae | 5 | Hydracarina | 4 |
Table 5.
Water quality classification according to the ABI value [20].
Table 5.
Water quality classification according to the ABI value [20].
| Class | Classification | Range |
|---|---|---|
| C5 | Excellent | 96 < ABI |
| C4 | Good | 61 < ABI ≤ 96 |
| C3 | Medium | 36 < ABI ≤ 61 |
| C2 | Bad | 15 < ABI ≤ 36 |
| C1 | Very Bad | ABI ≤ 15 |
Table 6.
Water quality class probability regarding sigma level.
| zSL Sigma. | “Water Quality Class” Probability, Pr | “No Water Class ”Probability, 1 − Pr | X water Class Outcome Wrong out of Y Outcome, X/Y |
|---|---|---|---|
| 1 | 0.6827 | 0.3173 | 1/3 |
| 2 | 0.9545 | 0.0455 | 1/22 |
| 3 | 0.9973 | 0.0027 | 1/370 |
| 4 | 0.9999 | 0.0001 | 1/15787 |
Table 7.
Mean and standard deviation of physical, chemical, and microbiological parameters.
| Parameter | Ozogoche | Juval-Hight | Juval | Zula |
|---|---|---|---|---|
| Samples, N | 129 | 71 | 30 | 60 |
| Physical | ||||
| Temperature, °C | 10.87 (2.24) | 10.70 (1.90) | 11.74 (1.15) | 11.95 (2.25) |
| Turbidity, NTU | 1.82 (2.13) | 12.01 (36.93) | 1.57 (1.40) | 17.48 (57.69) |
| Total Solids, mg L−1 | 141.57 (139.02) | 216.04 (247.57) | 119.77 (45.51) | 214.77 (161.65) |
| Chemical | ||||
| pH | 7.77 (0.46) | 7.81 (0.59) | 7.93 (0.39) | 8.09 (0.32) |
| Electrical Conductivity μS cm−1 | 57.44 (14.88) | 101.41 (35.16) | 79.52 (41.49) | 105.93 (62.48) |
| Dissolved Oxigen,% saturation | 60.34 (11.21) | 62.95 (10.03) | 69.85 (5.36) | 63.81 (7.60) |
| Total Phosphates, mg L−1 | 1.12 (1.17) | 2.52 (12.12) | 1.29 (0.72) | 1.34 (1.41) |
| Nitrates , mg L−1 | 0.18 (0.34) | 0.20 (0.39) | 0.03 (0.02) | 0.10 (0.17) |
| Microbiological | ||||
| 5-day Biochemical Oxygen Demand (BOD5), mg L−1 | 1.99 (1.47) | 2.13 (1.56) | 2.49 (1.04) | 1.81 (0.81) |
| Fecal Coliform density, CFU/100 mL | 4.57 (6.05) | 4.85 (4.81) | 2.47 (2.00) | 6.08 (5.44) |
| Mean WQINSF (standard deviation, σ) | 75.21 (3.88) | 74.59 (4.80) | 76.69 (3.50) | 73.33 (4.80) |
| ± 3.46 | ± 3.46 | ± 3.46 | ± 3.46 | |
| Mean water class | C4 (Good) | C4 (Good) | C4 (Good) | C4 (Good) |
| WQINSF values are normally distributed | yes | yes | yes | yes |
| C5, “excellent” class probability Pr (1 − Pr) | 0.000 (1.000) | 0.001 (0.999) | 0.000 (1.000) | 0.000 (1.000) |
| C4, “good” class probability Pr (1 − Pr) | 0.910 (0.090) | 0.830 (0.170) | 0.972 (0.028) | 0.755 (0.244) |
| C3, ”medium” class probability Pr (1 − Pr) | 0.000 (1.000) | 0.170 (0.830) | 0.028 (0.972) | 0.028 (0.972) |
| C2, ”bad” class probability Pr (1 − Pr) | 0.000 (1.000) | 0.000 (1.000) | 0.000 (1.000) | 0.000 (1.000) |
| C1, “very bad” probability Pr (1 −Pr) | 0.000 (1.000) | 0.000 (1.000) | 0.000 (1.000) | 0.000 (1.000) |
| X1 “No good” outcome up to X2 “good” outcome water quality class, X1/X2 | 1/11 | 1/6 | 1/36 | 1/5 |
| Sigma-level zSL for C4 “good” water quality | 1.75 | 1.35 | 2.10 | 1.10 |
Table 8.
The water quality at the 41 sampling stations and each water quality class frequency for the WQINSF, ABI, ABI*NC before calibration, and ABI* after calibration. At station COP01, the water quality measured by WQINSF was eight times in the C4 class and twice in the C3 class.
Table 8.
The water quality at the 41 sampling stations and each water quality class frequency for the WQINSF, ABI, ABI*NC before calibration, and ABI* after calibration. At station COP01, the water quality measured by WQINSF was eight times in the C4 class and twice in the C3 class.
| WQINSF | ABI | ABI* Before Calibration, ABI*NC | ABI* After Calibration, ABI* | |||||||||||||||||||||||
|---|---|---|---|---|---|---|---|---|---|---|---|---|---|---|---|---|---|---|---|---|---|---|---|---|---|---|
| Label | River Current Feature | Height (m.a.s.l.) | C5 | C4 | C3 | C2 | C1 | C5 | C4 | C3 | C2 | C1 | C5 | C4 | C3 | C2 | C1 | C5 | C4 | C3 | C2 | C1 | ||||
| Ozogoche | ||||||||||||||||||||||||||
| COP01 | flat | 3759 | 0 | 8 | 2 | 0 | 0 | 0 | 0 | 1 | 4 | 5 | 0 | 1 | 8 | 1 | 0 | 0 | 9 | 0 | 1 | 0 | ||||
| COP02 | flat | 3737 | 0 | 11 | 0 | 0 | 0 | 0 | 0 | 1 | 5 | 5 | 0 | 5 | 5 | 1 | 0 | 0 | 10 | 0 | 1 | 0 | ||||
| COP03 | flat | 3709 | 0 | 10 | 1 | 0 | 0 | 0 | 0 | 0 | 8 | 3 | 0 | 4 | 6 | 0 | 1 | 0 | 10 | 0 | 0 | 1 | ||||
| COP04 | flat | 3520 | 0 | 9 | 2 | 0 | 0 | 0 | 0 | 3 | 4 | 4 | 0 | 6 | 5 | 0 | 0 | 0 | 10 | 1 | 0 | 0 | ||||
| COP05 | flat | 3538 | 0 | 7 | 4 | 0 | 0 | 0 | 0 | 2 | 5 | 4 | 1 | 8 | 2 | 0 | 0 | 0 | 11 | 0 | 0 | 0 | ||||
| COP06 | flat | 3484 | 0 | 7 | 4 | 0 | 0 | 0 | 0 | 1 | 7 | 3 | 0 | 2 | 9 | 0 | 0 | 0 | 8 | 3 | 0 | 0 | ||||
| CPIP1 | flat | 3948 | 0 | 8 | 0 | 0 | 0 | 0 | 0 | 0 | 6 | 2 | 0 | 4 | 4 | 0 | 0 | 0 | 8 | 0 | 0 | 0 | ||||
| CPIP2 | rapid | 3867 | 0 | 8 | 0 | 0 | 0 | 0 | 0 | 0 | 5 | 3 | 0 | 3 | 5 | 0 | 0 | 0 | 8 | 0 | 0 | 0 | ||||
| CPIP3 | rapid | 3861 | 0 | 8 | 0 | 0 | 0 | 0 | 0 | 1 | 6 | 1 | 1 | 5 | 2 | 0 | 0 | 0 | 8 | 0 | 0 | 0 | ||||
| CPIP4 | rapid | 3853 | 0 | 8 | 0 | 0 | 0 | 0 | 0 | 0 | 8 | 0 | 0 | 8 | 0 | 0 | 0 | 0 | 8 | 0 | 0 | 0 | ||||
| CPIP5 | flat | 3812 | 0 | 8 | 0 | 0 | 0 | 0 | 0 | 2 | 5 | 1 | 2 | 5 | 1 | 0 | 0 | 0 | 8 | 0 | 0 | 0 | ||||
| CPIP6 | flat | 3794 | 0 | 8 | 0 | 0 | 0 | 0 | 0 | 1 | 6 | 1 | 2 | 5 | 1 | 0 | 0 | 0 | 8 | 0 | 0 | 0 | ||||
| CPIP7 | flat | 3692 | 0 | 8 | 0 | 0 | 0 | 0 | 0 | 1 | 4 | 3 | 1 | 5 | 2 | 0 | 0 | 0 | 8 | 0 | 0 | 0 | ||||
| CPIP8 | rapid | 3601 | 0 | 7 | 1 | 0 | 0 | 0 | 0 | 1 | 4 | 3 | 0 | 4 | 4 | 0 | 0 | 0 | 7 | 1 | 0 | 0 | ||||
| Average Height → | 3727 | 0 | 115 | 14 | 0 | 0 | 0 | 0 | 14 | 77 | 38 | 7 | 65 | 54 | 2 | 1 | 0 | 121 | 5 | 2 | 1 | |||||
| Juval-Hight | ||||||||||||||||||||||||||
| CJP00 | flat | 3130 | 0 | 1 | 0 | 0 | 0 | 0 | 0 | 1 | 0 | 0 | 0 | 1 | 0 | 0 | 0 | 0 | 1 | 0 | 0 | 0 | ||||
| CJP01 | flat | 3130 | 0 | 5 | 0 | 0 | 0 | 0 | 0 | 0 | 5 | 0 | 2 | 2 | 1 | 0 | 0 | 0 | 4 | 1 | 0 | 0 | ||||
| CJP02 | flat | 3123 | 0 | 3 | 0 | 0 | 0 | 0 | 0 | 0 | 2 | 1 | 1 | 0 | 2 | 0 | 0 | 0 | 2 | 1 | 0 | 0 | ||||
| CJP03 | flat | 3160 | 0 | 3 | 1 | 0 | 0 | 0 | 0 | 1 | 3 | 0 | 1 | 3 | 0 | 0 | 0 | 0 | 4 | 0 | 0 | 0 | ||||
| CJP04 | flat | 3117 | 0 | 3 | 1 | 0 | 0 | 0 | 0 | 1 | 2 | 1 | 1 | 0 | 3 | 0 | 0 | 0 | 4 | 0 | 0 | 0 | ||||
| CPP01 | flat | 3697 | 0 | 9 | 0 | 0 | 0 | 0 | 1 | 1 | 5 | 2 | 1 | 4 | 4 | 0 | 0 | 0 | 7 | 2 | 0 | 0 | ||||
| CPP02 | flat | 3233 | 0 | 7 | 1 | 0 | 0 | 0 | 0 | 2 | 4 | 2 | 0 | 7 | 1 | 0 | 0 | 0 | 7 | 1 | 0 | 0 | ||||
| CPP03 | flat | 3180 | 0 | 8 | 1 | 0 | 0 | 0 | 0 | 2 | 3 | 4 | 0 | 9 | 0 | 0 | 0 | 0 | 9 | 0 | 0 | 0 | ||||
| CPP04 | flat | 3114 | 0 | 8 | 1 | 0 | 0 | 0 | 0 | 0 | 6 | 3 | 1 | 6 | 1 | 1 | 0 | 0 | 7 | 1 | 1 | 0 | ||||
| CSP01 | rapid | 3181 | 0 | 4 | 3 | 0 | 0 | 0 | 0 | 2 | 1 | 4 | 1 | 4 | 1 | 1 | 0 | 0 | 5 | 1 | 1 | 0 | ||||
| CSP02 | rapid | 3131 | 0 | 4 | 1 | 0 | 0 | 0 | 0 | 1 | 3 | 1 | 1 | 3 | 1 | 0 | 0 | 0 | 4 | 1 | 0 | 0 | ||||
| CTP01 | rapid | 3186 | 0 | 6 | 1 | 0 | 0 | 0 | 0 | 2 | 2 | 3 | 2 | 4 | 0 | 0 | 1 | 0 | 6 | 0 | 0 | 1 | ||||
| Average Height → | 3199 | 0 | 61 | 10 | 0 | 0 | 0 | 1 | 13 | 36 | 21 | 11 | 43 | 14 | 2 | 1 | 0 | 60 | 8 | 2 | 1 | |||||
| Juval | ||||||||||||||||||||||||||
| QHUP1 | rapid | 2513 | 0 | 4 | 0 | 0 | 0 | 0 | 1 | 1 | 2 | 0 | 3 | 1 | 0 | 0 | 0 | 0 | 4 | 0 | 0 | 0 | ||||
| CJP05 | rapid | 2603 | 0 | 4 | 0 | 0 | 0 | 0 | 0 | 2 | 2 | 0 | 2 | 2 | 0 | 0 | 0 | 0 | 4 | 0 | 0 | 0 | ||||
| CJP06 | rapid | 2513 | 0 | 4 | 0 | 0 | 0 | 0 | 0 | 2 | 2 | 0 | 2 | 2 | 0 | 0 | 0 | 0 | 4 | 0 | 0 | 0 | ||||
| CJU01 | flat | 3350 | 0 | 4 | 0 | 0 | 0 | 0 | 0 | 1 | 3 | 0 | 0 | 4 | 0 | 0 | 0 | 0 | 4 | 0 | 0 | 0 | ||||
| QSCP1 | rapid | 2756 | 0 | 4 | 0 | 0 | 0 | 0 | 0 | 3 | 0 | 1 | 3 | 0 | 1 | 0 | 0 | 0 | 4 | 0 | 0 | 0 | ||||
| CTIP1 | flat | 2656 | 0 | 4 | 0 | 0 | 0 | 0 | 1 | 2 | 0 | 1 | 3 | 1 | 0 | 0 | 0 | 0 | 4 | 0 | 0 | 0 | ||||
| CYUP1 | flat | 3339 | 0 | 2 | 0 | 0 | 0 | 0 | 0 | 1 | 0 | 1 | 1 | 1 | 0 | 0 | 0 | 0 | 2 | 0 | 0 | 0 | ||||
| CYP01 | rapid | 3329 | 0 | 4 | 0 | 0 | 0 | 0 | 0 | 2 | 1 | 1 | 0 | 4 | 0 | 0 | 0 | 0 | 4 | 0 | 0 | 0 | ||||
| Average Height → | 2882 | 0 | 30 | 0 | 0 | 0 | 0 | 2 | 14 | 10 | 4 | 14 | 15 | 1 | 0 | 0 | 0 | 30 | 0 | 0 | 0 | |||||
| Zula | ||||||||||||||||||||||||||
| QAP01 | rapid | 3691 | 0 | 6 | 3 | 0 | 0 | 0 | 1 | 2 | 5 | 1 | 2 | 6 | 1 | 0 | 0 | 0 | 9 | 0 | 0 | 0 | ||||
| CAP01 | rapid | 3492 | 0 | 9 | 0 | 0 | 0 | 0 | 2 | 1 | 2 | 4 | 2 | 3 | 4 | 0 | 0 | 0 | 7 | 2 | 0 | 0 | ||||
| QHP01 | flat | 3451 | 0 | 7 | 2 | 0 | 0 | 0 | 1 | 2 | 5 | 1 | 1 | 3 | 5 | 0 | 0 | 0 | 7 | 2 | 0 | 0 | ||||
| CMP01 | rapid | 2691 | 0 | 6 | 2 | 0 | 0 | 0 | 0 | 3 | 2 | 3 | 3 | 1 | 4 | 0 | 0 | 0 | 6 | 2 | 0 | 0 | ||||
| CMP02 | rapid | 2655 | 0 | 6 | 2 | 0 | 0 | 0 | 0 | 2 | 0 | 6 | 2 | 0 | 4 | 1 | 1 | 0 | 4 | 2 | 1 | 1 | ||||
| QZP01 | flat | 3657 | 0 | 5 | 4 | 0 | 0 | 0 | 0 | 2 | 6 | 1 | 0 | 6 | 3 | 0 | 0 | 0 | 9 | 0 | 0 | 0 | ||||
| CZP01 | flat | 3630 | 0 | 7 | 1 | 0 | 0 | 0 | 0 | 1 | 5 | 2 | 0 | 5 | 2 | 1 | 0 | 0 | 6 | 1 | 1 | 0 | ||||
| Average Height → | 3324 | 0 | 46 | 14 | 0 | 0 | 0 | 4 | 13 | 25 | 18 | 10 | 24 | 23 | 2 | 1 | 0 | 48 | 9 | 2 | 1 | |||||
| Total → | 0 | 252 | 38 | 0 | 0 | 0 | 7 | 54 | 148 | 81 | 42 | 147 | 92 | 6 | 3 | 0 | 259 | 22 | 6 | 3 | ||||||
Table 9.
Pairwise Spearman correlation between water quality indicator before and after calibration.
Table 9.
Pairwise Spearman correlation between water quality indicator before and after calibration.
| Ozogoche | Juval-Hight | Juval | Zula | Total | ||
|---|---|---|---|---|---|---|
| ABI-WQINSF | Spearman correlation coefficient | −0.516 | −0.335 | −0.354 | −0.335 | −0.335 |
| p-Value | 0.373 | 0.581 | 0.559 | 0.581 | 0.581 | |
| ABI*NC-WQINSF | Spearman correlation coefficient | 0.894 | 0.894 | 0.725 | 0.894 | 0.894 |
| p-Value | 0.041 | 0.041 | 0.165 | 0.041 | 0.041 | |
| ABI*-WQINSF | Spearman correlation coefficient | 0.894 | 0.894 | 1 | 0.894 | 0.894 |
| p-Value | 0.041 | 0.041 | 0.001 | 0.041 | 0.041 | |
| ABI*NC-ABI | Spearman correlation coefficient | −0.718 | −0.600 | −0.564 | −0.600 | −0.600 |
| p-Value | 0.172 | 0.285 | 0.322 | 0.285 | 0.285 | |
| ABI*-ABI | Spearman correlation coefficient | −0.103 | 0.100 | −0.354 | 0.100 | 0.100 |
| p-Value | 0.870 | 0.873 | 0.559 | 0.873 | 0.873 |
Disclaimer/Publisher’s Note: The statements, opinions and data contained in all publications are solely those of the individual author(s) and contributor(s) and not of MDPI and/or the editor(s). MDPI and/or the editor(s) disclaim responsibility for any injury to people or property resulting from any ideas, methods, instructions or products referred to in the content. |
© 2023 by the authors. Licensee MDPI, Basel, Switzerland. This article is an open access article distributed under the terms and conditions of the Creative Commons Attribution (CC BY) license (https://creativecommons.org/licenses/by/4.0/).
Share and Cite
MDPI and ACS Style
Márquez, C.O.; García, V.J.; Ríos, A.C. Water Quality Indicator for Adaptability to Global Climate Change in Andean Highland Ecosystems. Water 2023, 15, 857. https://doi.org/10.3390/w15050857
AMA Style
Márquez CO, García VJ, Ríos AC. Water Quality Indicator for Adaptability to Global Climate Change in Andean Highland Ecosystems. Water. 2023; 15(5):857. https://doi.org/10.3390/w15050857
Chicago/Turabian StyleMárquez, Carmen O., Victor J. García, and Anita C. Ríos. 2023. "Water Quality Indicator for Adaptability to Global Climate Change in Andean Highland Ecosystems" Water 15, no. 5: 857. https://doi.org/10.3390/w15050857
Note that from the first issue of 2016, this journal uses article numbers instead of page numbers. See further details here.