

Study on the Adsorption Relationship between Organic Matter and Particulate Matter in Water Distribution Pipes

1
College of Civil Engineering, Huaqiao University, 668 Jimei Road, Xiamen 361021, China
2
School of Environment, Harbin Institute of Technology, Harbin 150090, China
3
Logistics and Asset Management Department, Huaqiao University, 668 Jimei Road, Xiamen 361021, China
*
Author to whom correspondence should be addressed.
Water 2023, 15(5), 859; https://doi.org/10.3390/w15050859
Submission received: 4 January 2023
/
Revised: 27 January 2023
/
Accepted: 7 February 2023
/
Published: 23 February 2023
(This article belongs to the Special Issue Drinking Water Pipe Network and Water Quality Safety)
Abstract
:In the process of water distribution, the secondary pollution of drinking water cannot be ignored. There are many organic substances in the water supply network, some of which exist in a dissolved state in the water as dissolved organic matter (DOM), and some of which are adsorbed on the particulate matter to form particulate organic matter (POM). With the flow of water, the particles will be brought into the end user, and threaten the life and health of the user. In this study, two forms of organic matter in distributed water were comprehensively analyzed through micro-filtration membrane filtration, ultrasonic extraction, C18 column solid phase extraction, and GC-MS detection, and their changes in the flow process were explored. The results show that, as the sampling point moves away from the water source, the DOM decreases and the POM increases, and in all there were fewer DOM species than POM, indicating that more organic matter existed on particulate matter or in particle form, and relatively less organic matter existed in a dissolved state. POM in water mainly includes alcohol, ketone, ester, nitrogen, sulfur compounds, and benzene, and the content of POM in different particle size ranges is not the same. Some small particle size ranges have a higher content of POM, while some large particle size ranges have a higher content of POM, which does not show obvious regularity.
1. Introduction
Particulate matter can pollute water supply networks, and this includes bacteria, micro-organisms, and algae, and it greatly affects the safety and quality of urban drinking water. Suspended particulate matter settles in pipes and is adsorbed by the pipe wall, gradually forming corrosion scales that destroy the distribution function of the water supply network. Simultaneously, particulate matter greatly affects the post-precipitation of the pipe network and accelerates pipe corrosion [1,2,3,4,5,6,7,8]. After a membrane treats the water in a plant, particulate matter still has a crucial impact on the water distribution system. In a relatively static water body, particles will slowly settle and deposit on the bottom of the water body, aggregating the pollutants. When the environmental conditions suddenly change or the pollutants undergo a chemical conversion, they may be released into the water, causing a water pollution problem [9,10,11]. This issue occurs widely and is difficult to solve, so in water treatment processes the particulate matter index should be strictly controlled.
The rapid development of industry and agriculture has increased the standard of living, but has also brought more toxic substances into the water supply, constantly expanding and intensifying the scope of water pollution [12]. Research on secondary pollution in drinking water and water transportation processes must consider particulate organic matter (POM) in water [13,14,15,16,17]. A multi-tracer study was carried out on the impacts of reservoirs on the sources and transport of riverine organic carbon in the Karst area [18]. It is necessary to study the existence of organic matter in water in the form of particles, especially in comparison with dissolved organic matter (DOM) in water. The current research is mainly on the composition of sediments in the water supply pipe network. Some researchers [6] have found that the main components of loose sediments in water supply pipes are particles such as iron and manganese, which are derived from raw water. If ultra-filtration is added to remove particles in water, the loose sediments formed will be mainly organic matter. Another study took loose sediment samples from four water supply network systems in different cities in Canada. The analysis found that the main components of the loose sediments were iron corrosion (38% to 72%), organic matter (14% to 24%), silicon (aluminum) acid salt (7~16%) and other materials. There are large differences in the components of loose sediment in different pipe networks, which are related to factors such as water source, front-end processing technology, pipe material, water hardness, and residual chlorine concentration [19]. In addition, the effects of iron bacteria on cast-iron pipe corrosion and water quality in water distribution systems demonstrate the importance of particulate matter in the pipe network [20]. However, there has been no research on the occurrence of and relationship between DOM and POM in water distribution pipelines.
The purpose of this research was to explore the relationship between DOM and POM in the water distribution pipe network, by separately comparing the quantity and proportion of DOM and POM types in the pipe network to obtain the change rule of organic matter in the pipe section along the direction of water flow. The study of particulate matter is very important, and we also conducted a separate study on the number and proportion of different particle size POM in the pipe section.
2. Materials and Methods
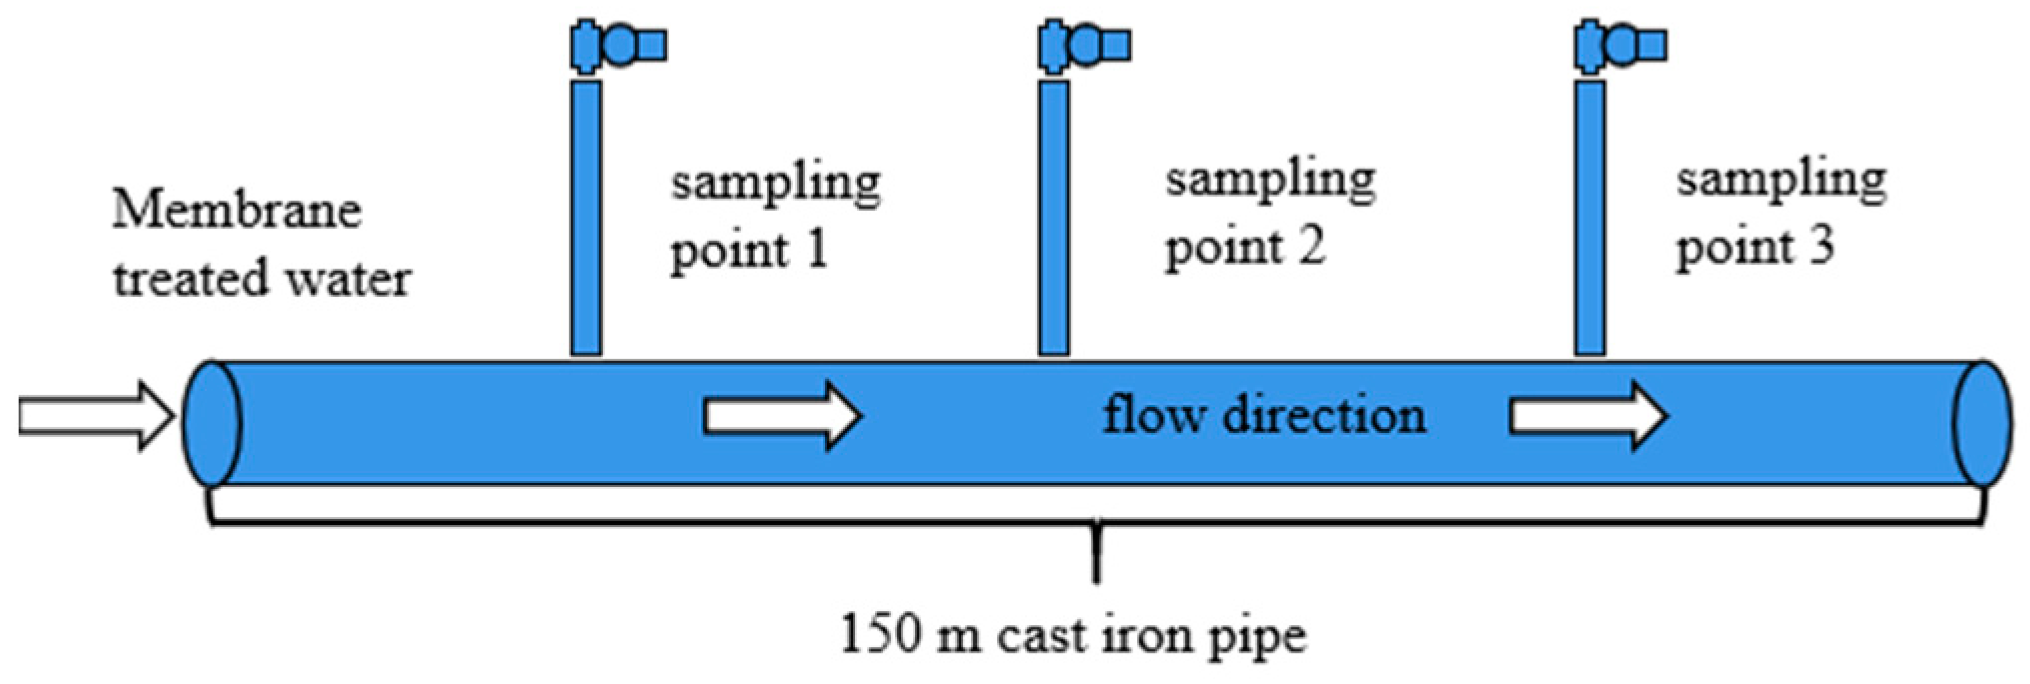
This experiment simulates the relationship between DOM and POM in a water pipeline. The simulated pipe is an old cast-iron pipe with a diameter of 63 mm and a length of 150 m in the water distribution network of a university campus; the water supply is treated by membrane filtration. Three sampling and monitoring points were set in the middle of the pipe section (numbered 1, 2 and 3) along the flow direction. Water samples were collected at 3 sampling points of the simulated transmission and distribution pipeline that had been running stably for 6 months, once every 3 days, a total of 5 times, and the monitoring period was half a month. Pipeline sampling points are shown in Figure 1.
At first, a 5 μm glass fiber filter membrane was used to filter each water sampling point until the number of particles in the water sample could meet the needs of analysis. Each sampling point was used to filter a 4 L water sample; the filtered water passed through glass fiber filtration membranes of 2 μm and 0.45 μm, respectively, to get >5 μm, 2~5 μm, 0.45~2 μm particulates. One liter of water filtered by a 0.45 μm filter membrane was enriched with C18 solid phase extraction column. After elution with 1:1 acetone and methylene chloride, excessive anhydrous sodium sulfate was added to the eluent. The water in the solution was removed for one day, and the solution was stored in a 50 mL brown concentrated bottle. After the nitrogen was blown off, the concentrated solution was put into a special chromatographic injection bottle with calibration and filled to 1 mL with acetone. Finally, the DOM was detected by GC-MS (Agilent 7890A/5975C, Santa Clara, CA, USA). The particulate matter trapped in the glass fiber was separated by ultrasonic extraction, the extraction liquid was dried and concentrated, and the POM sample was detected by GC-MS with acetone constant volume. An appropriate amount of filtered water with various particle sizes was placed into a 10 mL centrifugal bottle for TOC determination by total Organic carbon tester (TOC-V CPH, Japan).
2.1. Correlation Analysis of DOM and POM in TOC
TOC is one of the conventional indicators reflecting the situation of organic matter in water. Therefore, by detecting the TOC value of the water sample in the simulated water transmission and distribution pipeline section, the existence of organic matter in the water can be understood. This paper reflects the relationship between DOM and POM in water through the detection of TOC; the POM retained by the 0.45 μm micro-filtration membrane was compared and analyzed, and the proportion of POM in the total organic matter in the water was calculated. The DOM of the water sample was reflected by detecting the TOC value of the water filtered by the 0.45 μm micro-filtration membrane. The POM of the water sample was measured by the difference between the TOC detection value of the tap water in the pipeline and the detection value of the water filtered by the 0.45 μm micro-filtration membrane.
Figure 2a shows the TOC values detected at three sampling points after 0.45 μm, 2 μm and 5 μm filtration membranes, respectively. Based on the TOC results of each water sample detected above, the relationship between DOM in the simulated water distribution pipeline and POM intercepted by 0.45 μm micro-filtration membranes was compared and analyzed. TOC content at point 1 was the lowest (0.792 mg/L), while TOC content at point 3 was the highest (0.875 mg/L), which indicates that TOC increased along the path of water flow through the pipe. Figure 2b shows the proportion of DOM and POM in TOC at sampling points 1, 2 and 3, and also reflects the changes of DOM and POM at different sampling points. Water sample No. 1 was closest to the source and had the lowest POM ratio, while water sample No. 3 was farthest from the source and had the highest POM ratio. In the process of water flow, due to hydraulic erosion, the sediment on the pipe wall falls into the water body and increases its particulate matter, and part of DOM will convert to POM.
2.2. Contrasting the Relationship between DOM and POM in Water Delivery and Distribution
Tap water was extracted from three sample points of the simulated pipe section and filtered through a 0.45 μm micro-filtration membrane. Using an ultrasound extract membrane, the POM was intercepted on the membrane, and the type and quantity of the DOM in the water samples was detected by GC-MS. The mass spectrogram was retrieved from the standard spectrum library, and the material type and peak area data that achieved matching requirements were saved. The relationship between the DOM and POM in the water was analyzed. The types and proportions of DOM and POM of each water sample are shown in Figure 2, Figure 3 and Figure 4.
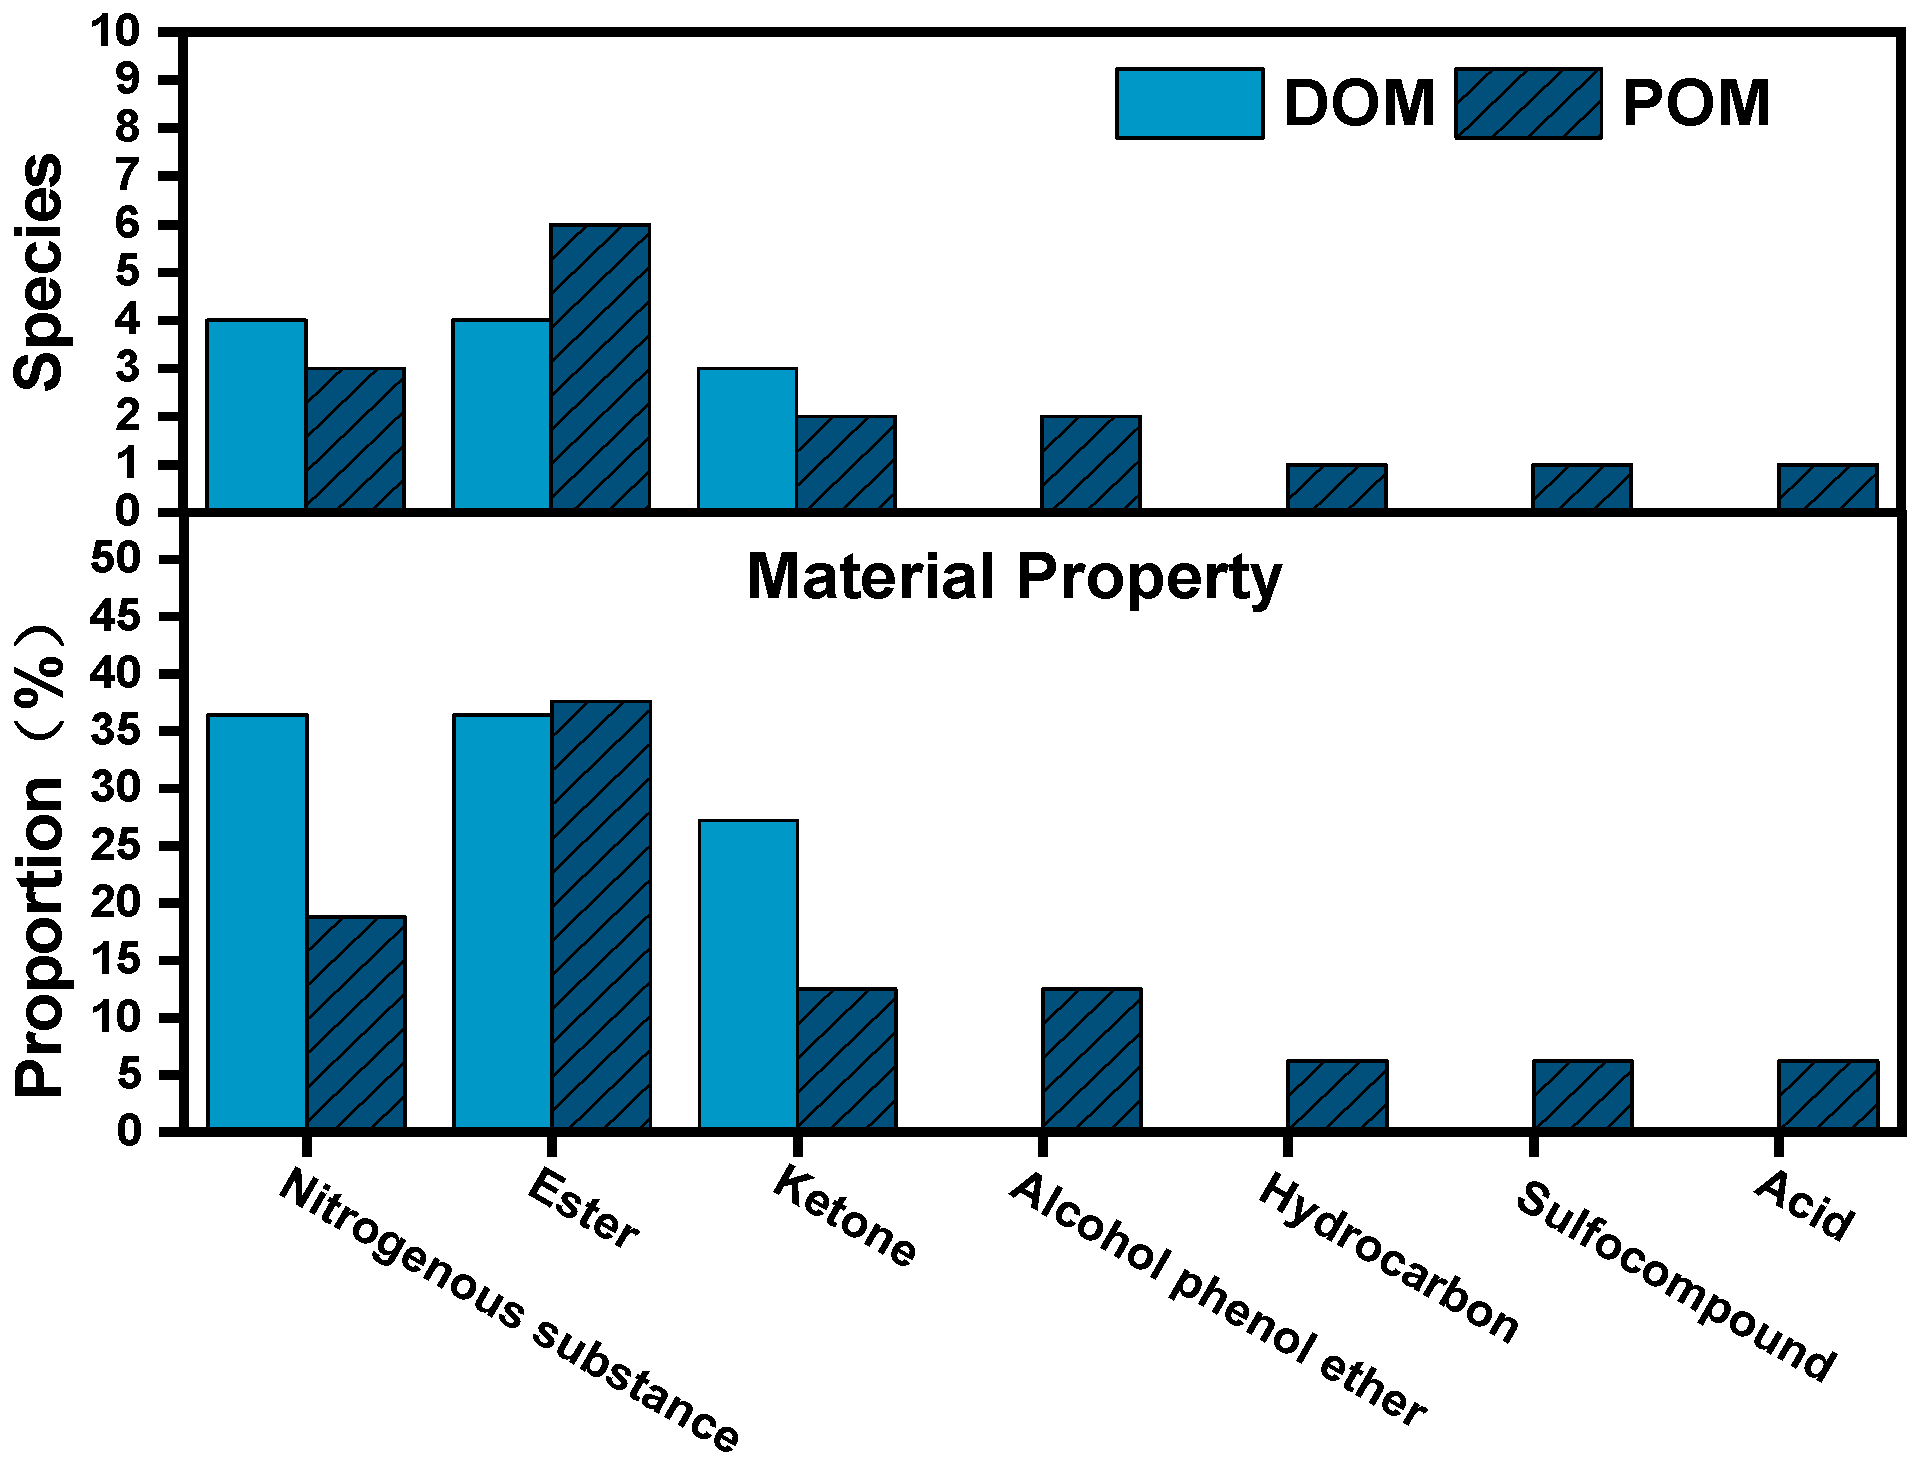
It is seen from Figure 3, that at sample point 1, there are 11 types of DOM. The most are four types each of nitrogen compounds and esters, accounting for 36.4% each, and three types of ketones, accounting for 27.2%. There are 16 types of POM, with lipids accounting for the largest proportion, with six types accounting for 37.6%, and only one type of hydrocarbon and sulfur compound, accounting for 6.2%. There are five types of organic compounds in both the dissolved and insoluble phases, accounting for 22.7% of the TOC in the water, including three lipids and two nitrogen compounds. The content of the five organic substances in the insoluble phase is much higher than that in the dissolved phase, four of the substances account for more than 95% of the content in the insoluble phase, and the lowest content in the insoluble phase is 77.5%.
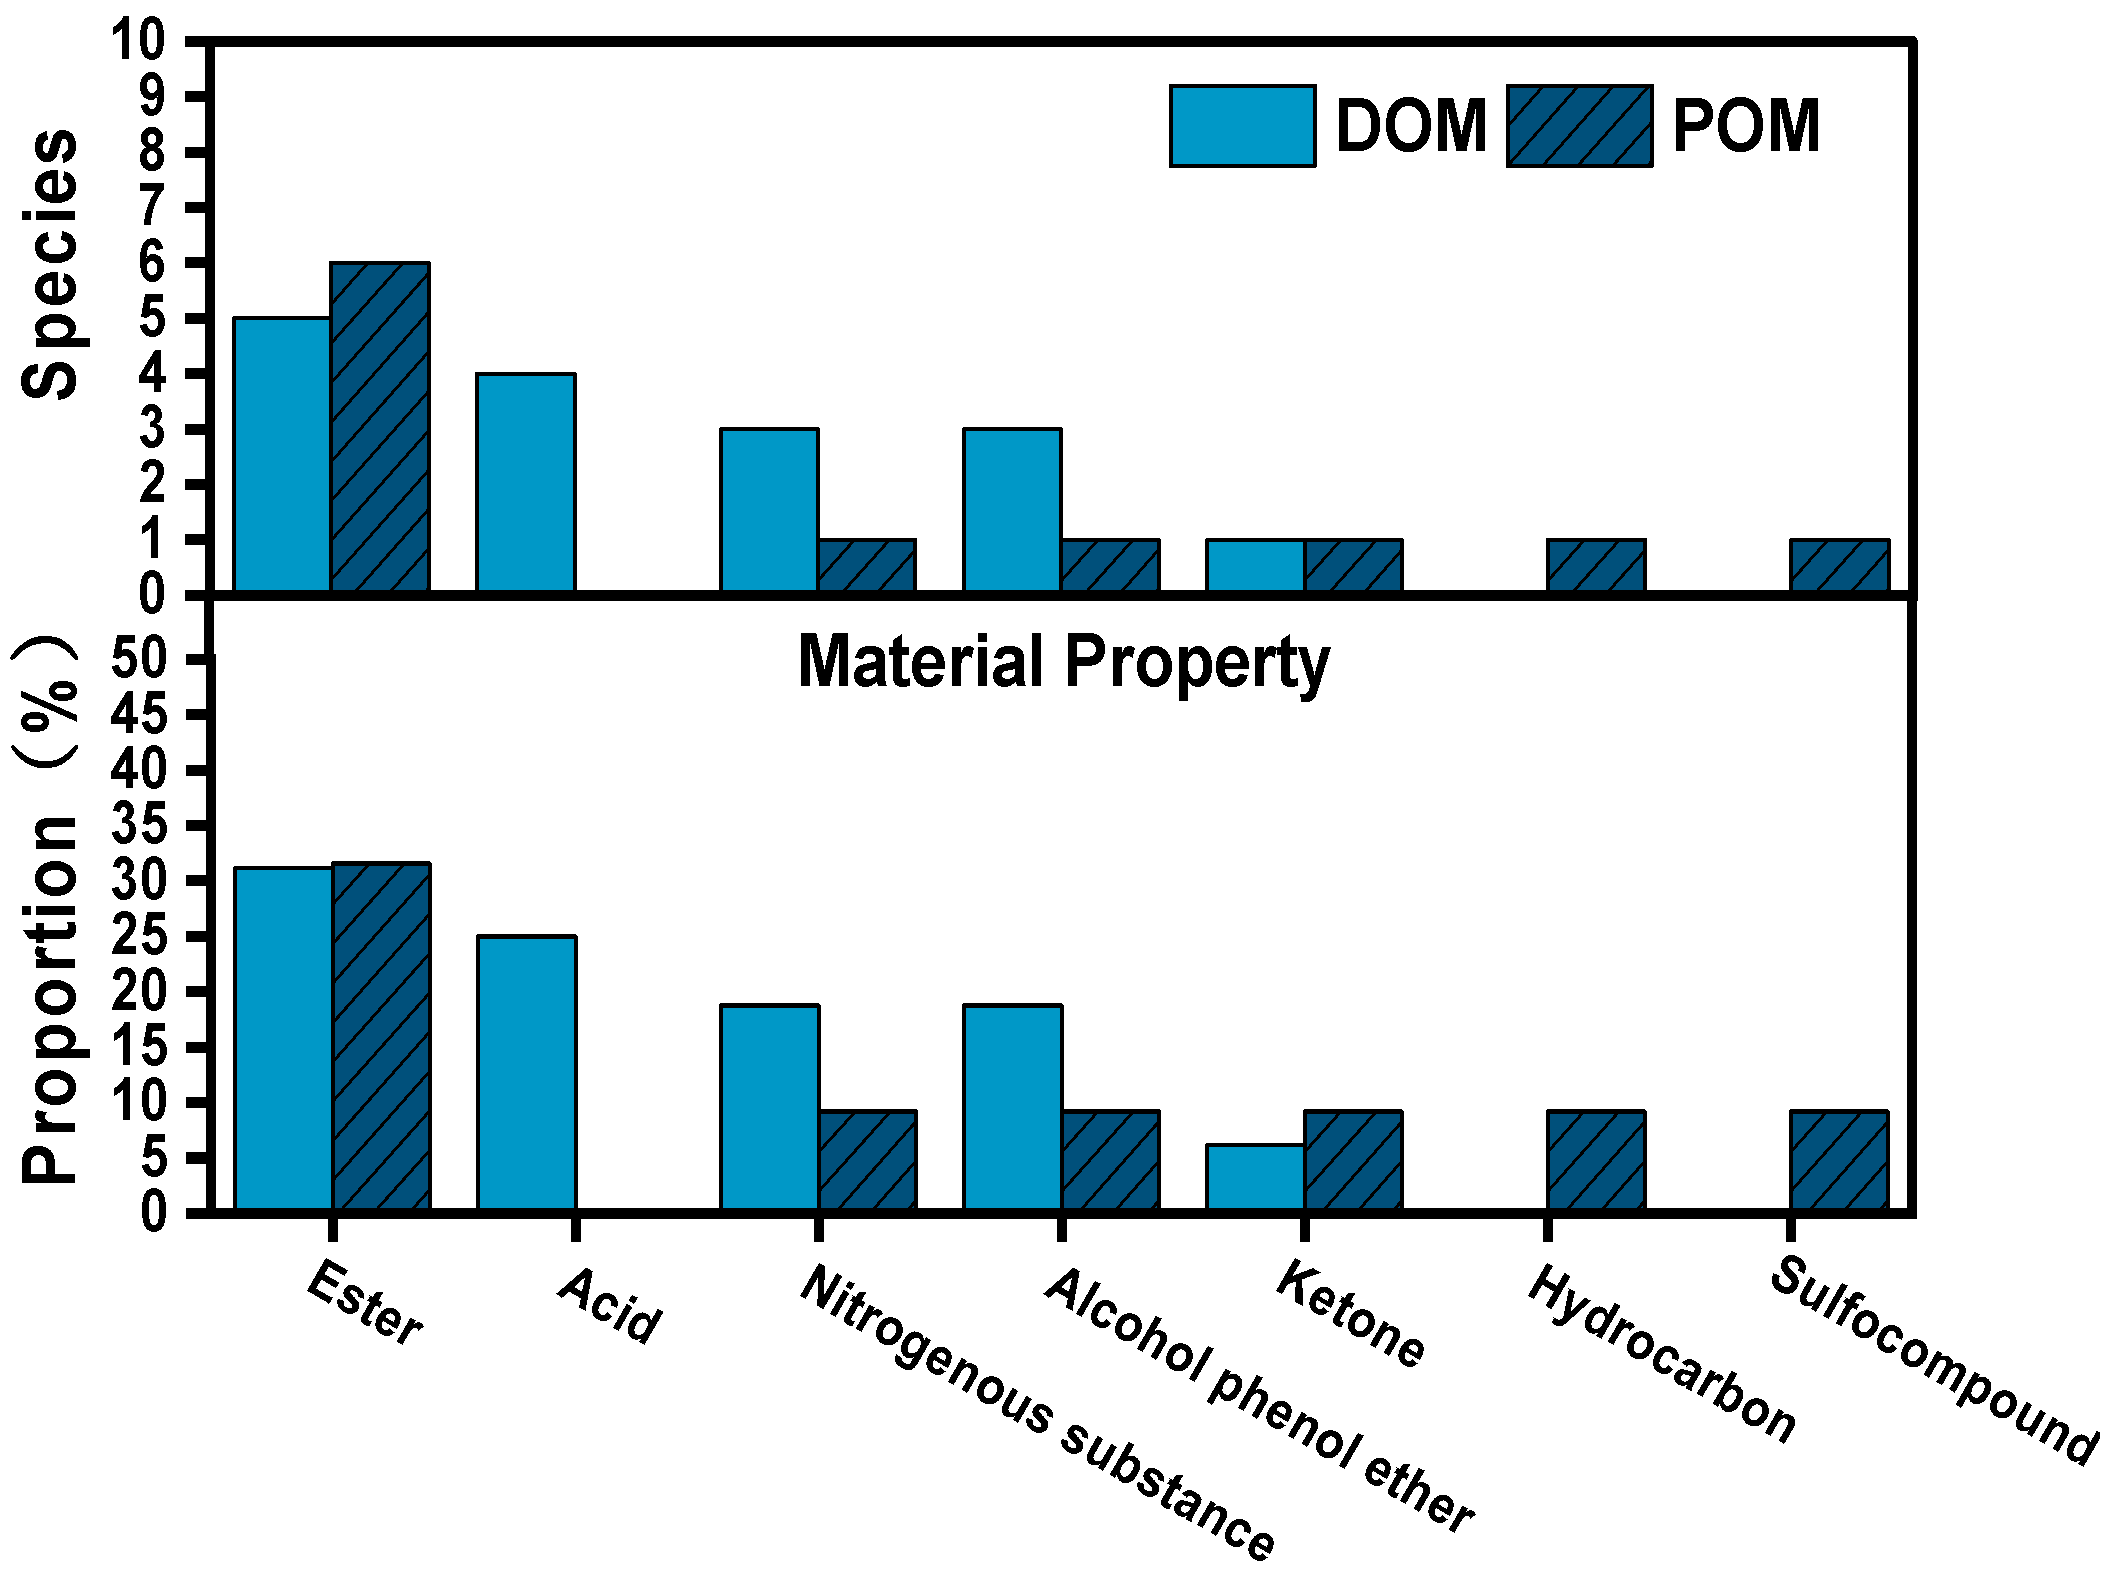
As shown in Figure 4, at sample point 2 there are 13 species of DOM in total. Esters are the most abundant with five types, accounting for 38.5%. In contrast, acids, alcohols, phenols, ethers, and benzenes are the least prevalent, with only one species for each, all with a proportional ratio of 7.7%. There are 19 different species of POM, with lipids making up the largest proportion with seven types and accounting for 36.8%, and only one type of benzene, accounting for 5.3%. The nine types of coexisting organic compounds in both dissolved and insoluble phases comprise 39.1% of the TOC in water and consist of one alcohol, one ketone, one acid, one benzene, two nitrogen-containing compounds, and three esters. When comparing content, the first five organic compounds occur more in the insoluble phase, while the latter three have a higher content in the dissolved phase; the remaining compound has an equal amount of content in both phases.
It is seen from Figure 5, that at sampling point 3, there are 16 types of DOM in total. Lipids are the most abundant of the five types, accounting for 31.2%, and only one type of ketone accounts for 5.3%. There are 19 different types of POM, with six types each of lipids and ketones accounting for 31.6%. Hydrocarbon, alcohol phenol ether, nitrogen compounds and sulfur compounds are the least, with only one each, accounting for 9.2%. The five types of coexisting organic compounds in both dissolved and insoluble phases comprise 16.7%, including one alcohol and four types of esters; all five of the organic compounds have a higher content in the non-dissolved phase than in the dissolved phase.
In all three water samples, there are fewer DOM types than POM species, which indicates that more organic matter exists in particulate matter or in particle form, and less organic matter exists in a dissolved state. The content of most POM is higher than that of DOM, and only three types of organic matter have higher content in the dissolved phase at sample site No. 2. The results show that organic matter existing in both dissolved and insoluble phases is more likely to exist in the form of particles or adsorbed on particles. Therefore, POM in water is an important part of the total organic matter in water, and it is also a necessary part to be considered in the process of detecting organic matter in water.
2.3. The Variation Law of DOM and POM along the Simulated Water Distribution Pipeline Path
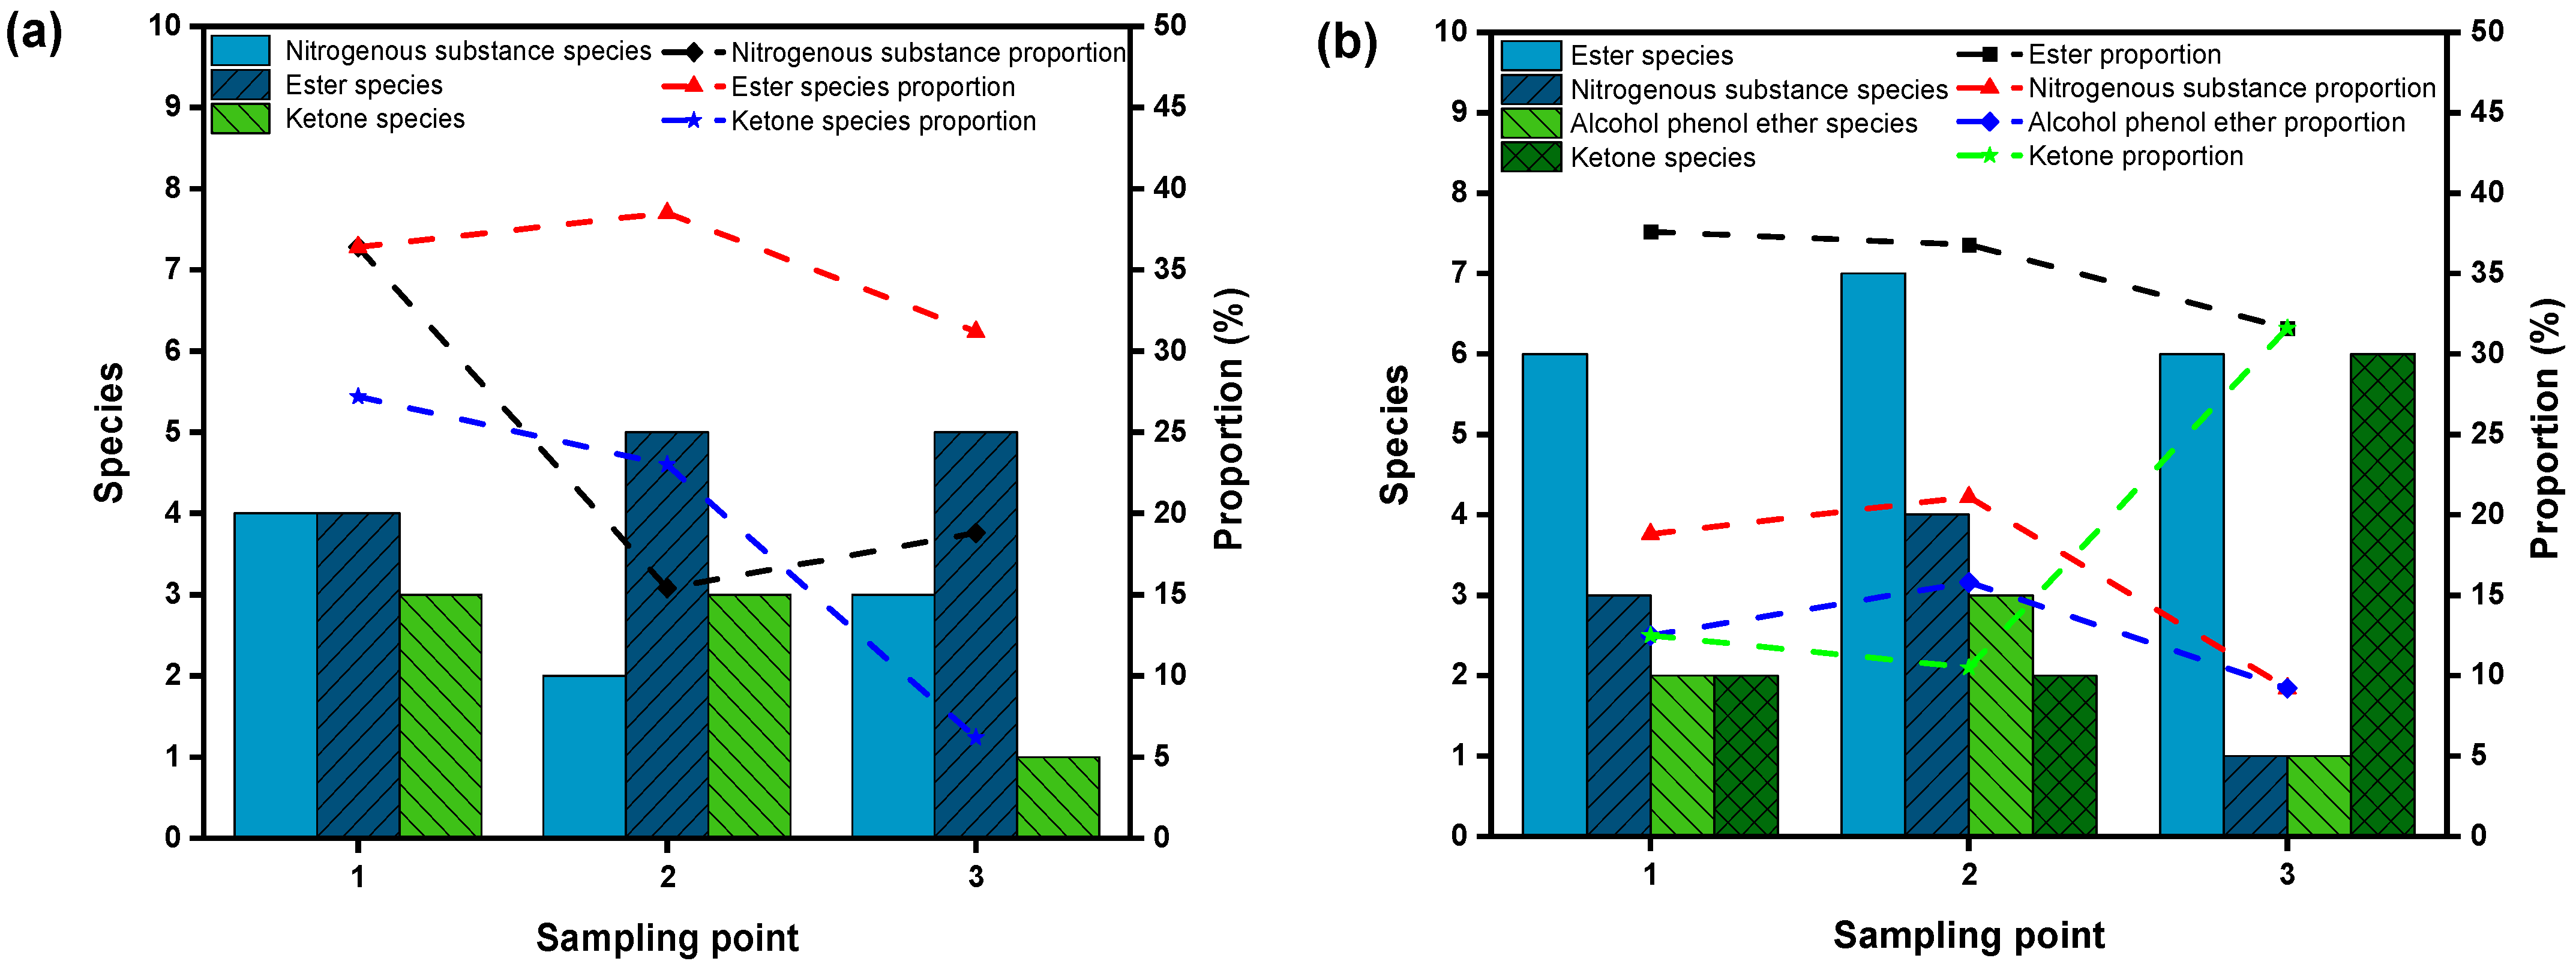
The organic compounds contained in the three sampling points were selected for DOM and POM analysis along the way. As shown in Figure 6a, the types of nitrogen-containing compounds decreased first and then increased, the types of esters increased by one and then remained unchanged, and the types of ketones decreased to one. The proportion of esters and ketones increased first and then decreased, while the proportion of nitrogen compounds decreased first and then increased. As can be seen from Figure 6b, the types of esters first increased and then remained flat, the types of nitrogen-containing compounds and alcohol phenol ether first increased and then decreased, and the types of ketones increased from two to six. The proportion of ester, nitrogen compounds, and alcohol phenol ether increased first and then decreased, and the proportion of ketone decreased first and then increased to 31.6%.
This indicates that along with the pipeline distribution some DOM in the water underwent chemical reactions to generate new substances, which were either adsorbed by particulate matter or converted into new substances under the action of microbial metabolism in the water and dissolved in the water. The number of particulate organic matter species increased slightly along the pipe, but the POM species changed greatly. The content also varied greatly, and the proportion of different particle size ranges was also very different, which may be due to the different particle size adsorption performance of organic matter.
2.4. Variation of POM of Different Particle Sizes along the Path
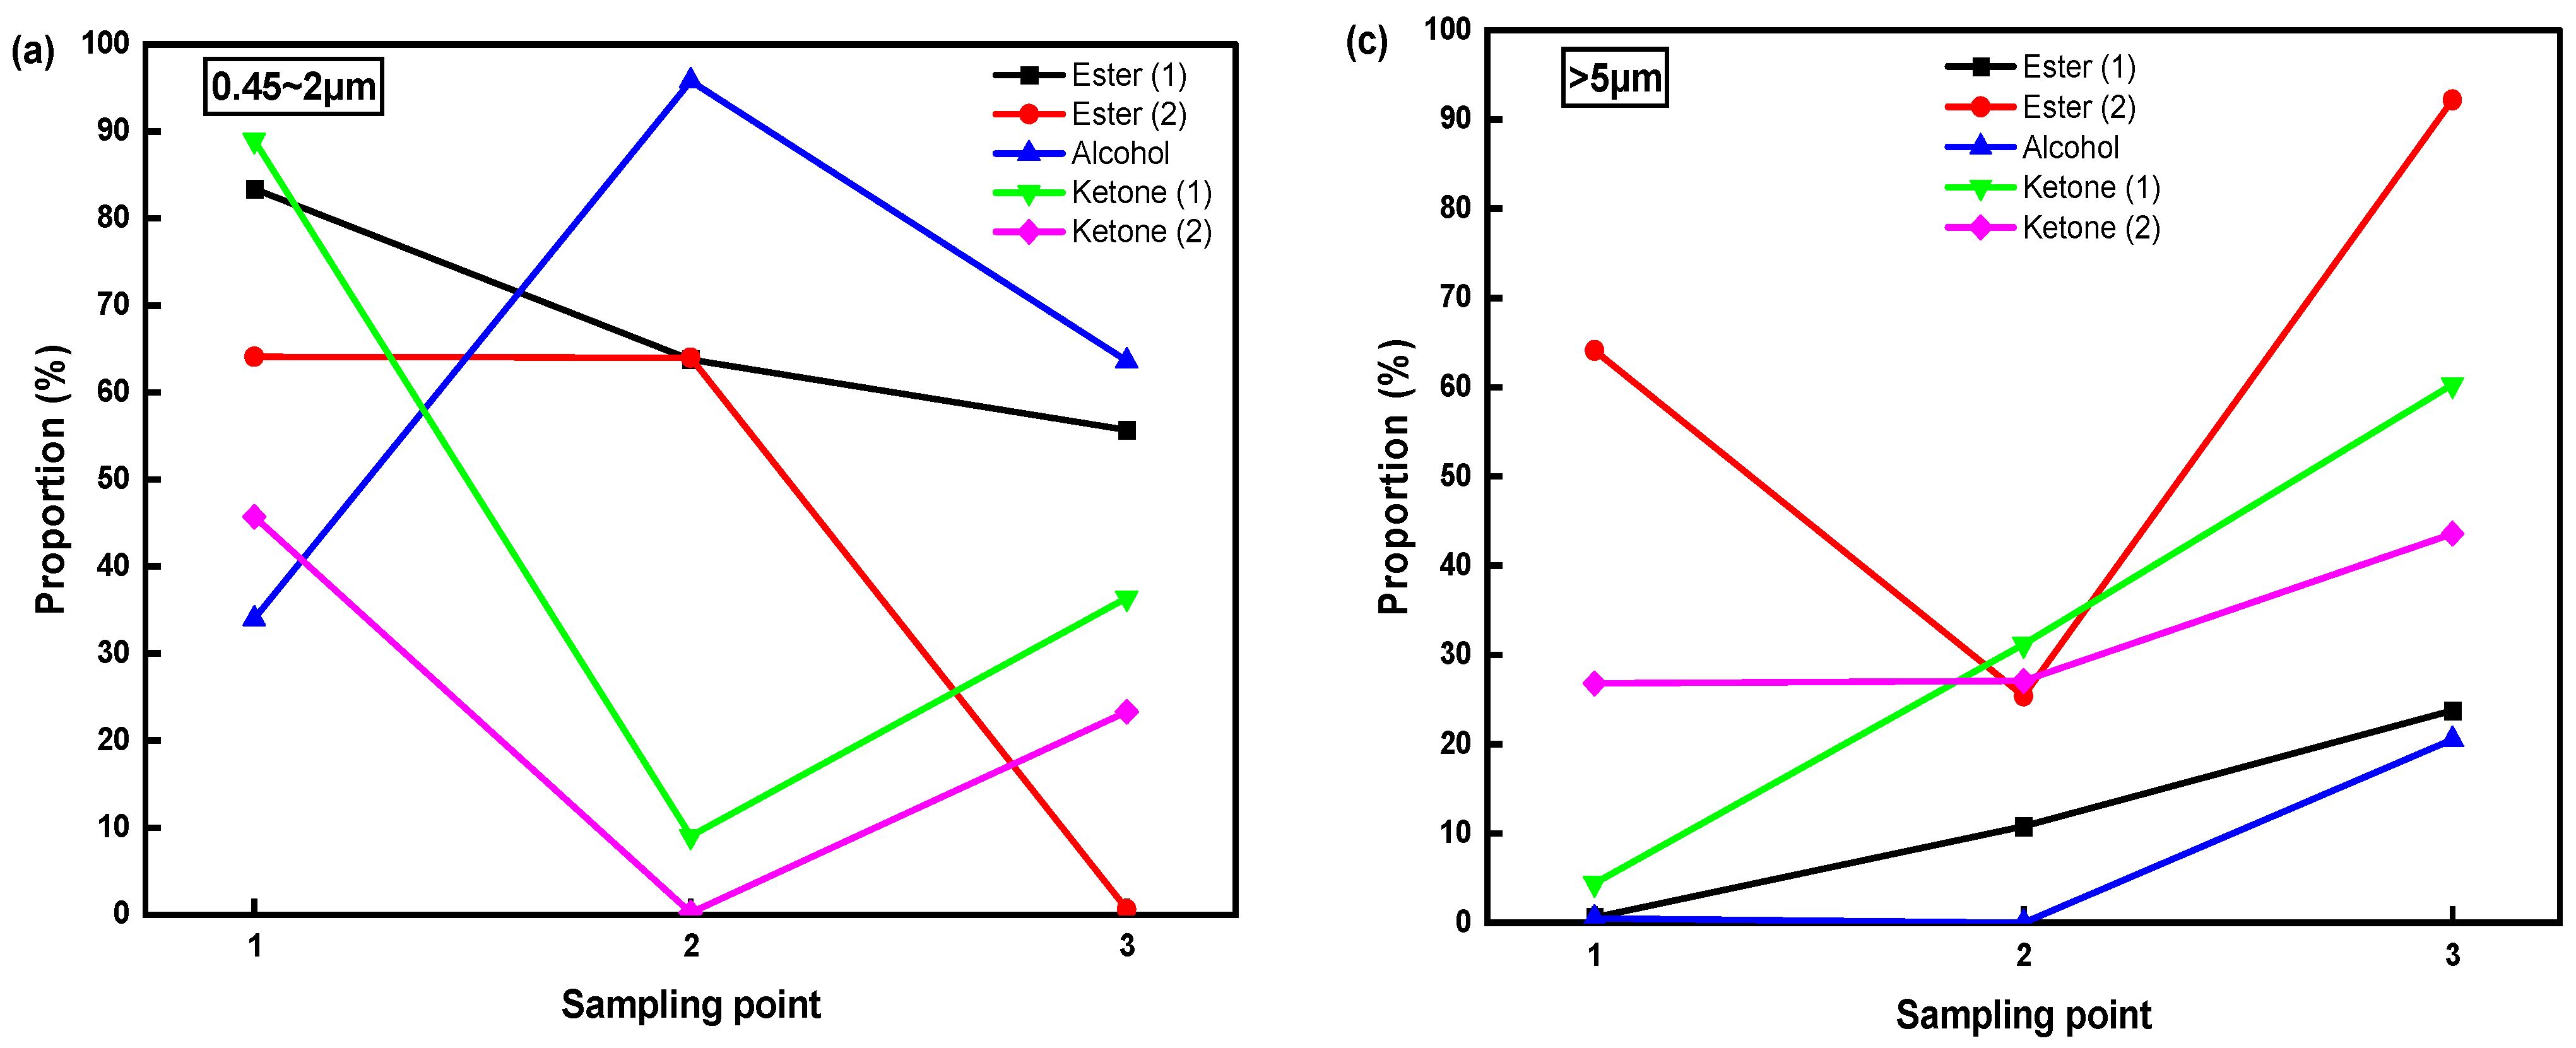
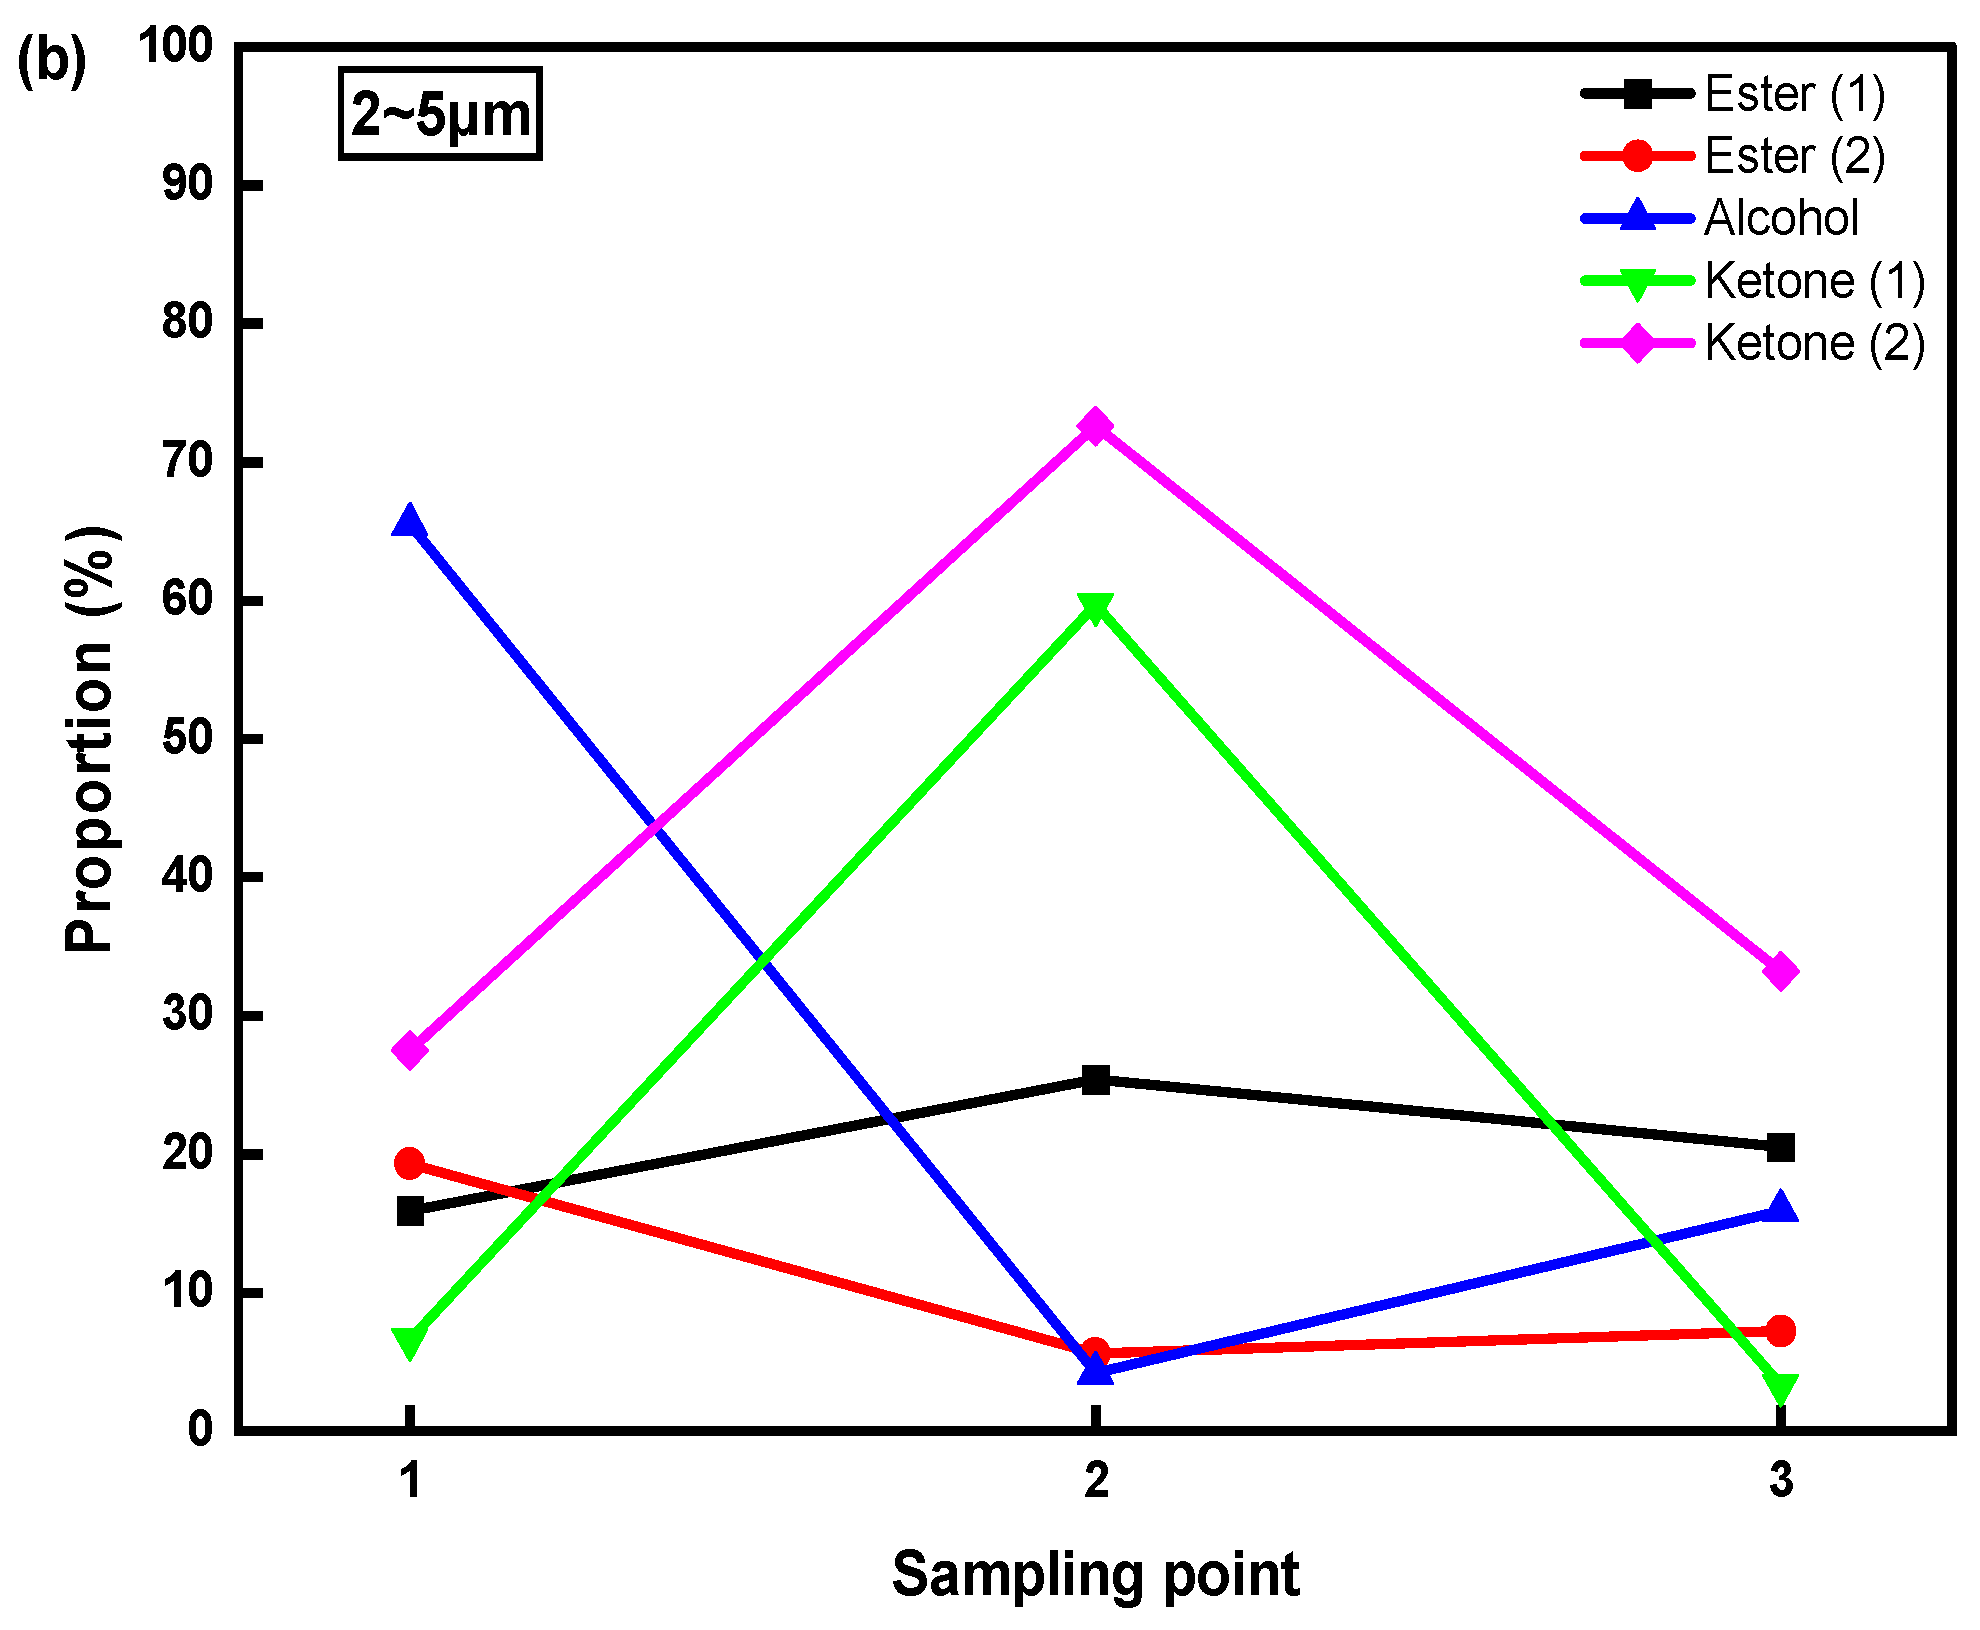
The particle size classification methods are 0.45~2.0 μm, 2~5 μm, >5 μm, and the study and analysis of POM in different particle size ranges will help to promote the continuous optimization of the water treatment process, and provide guidance for the removal of organic pollutants in the process of water treatment. The POM intercepted by micro-filtration membranes with different pore sizes was detected by GC-MS, and the species and proportion of POM in different particle size ranges were statistically obtained. According to the different POM types detected at the three sampling points, five co-existing organic compounds, as shown in Table 1, were selected for analysis. Sample points 1~3 contained different POM types with different particle sizes, as shown in Figure 7a–c.
From Figure 7a–c, it can be seen that in the particle size of 0.45~2 μm POM the proportions of the two esters decrease, and the proportions of the two ketones first decreased and then increased, but neither increased to the initial ratio. The alcohol ratio increased from 34% to 95.8% and then decreased to 63.8. In the particle size of 2~5 μm POM, the proportion of ester increased and decreased slowly, and the proportion of ketone decreased sharply after increasing to 60–70%, which was close to the proportion of the initial sampling point. The proportion of alcohol increased slowly from 65.5% to 4.2%. In the particle size of 5 μm POM, the proportion of one or two organic compounds decreased slightly in the middle, but the overall trend was to increase.
These results indicate that POM of different particle sizes also has a certain correlation, and the adsorption properties are also different. Alcohol organic compounds are more easily adsorbed on 0.45~2 μm particles, and ester compounds are more easily adsorbed on 0.45~2 μm and >5 μm particles, while ketones are adsorbed in particulate matter of 5 μm and are more stable.
3. Conclusions
This paper compares and analyzes the relationship between the DOM and POM in water distribution pipelines through the conventional water quality testing index TOC. Moreover, the species and proportion of DOM and POM in the water and the variation laws along the path were studied by GC-MS. This study draws the conclusion that, in the analog transmission and distribution section, the number of DOM types of the three sample points is less than that of the POM. The content of most types of POM is higher than that of the DOM, and only three types of organic substances in the sample point 2 are higher in the dissolved phase. The particulate state is the predominant form of organic matter where the dissolved phase and the non-dissolved phases coexist. Specifically, the types of POM decrease along the water delivering path, while the types of DOM increase slightly, with the types and contents of POM and DOM varying greatly. The ratio of different particle sizes of POM varies widely, which may be due to the adsorption properties of the particles in different size ranges being different from that of the organic matter. In addition, it is worth paying attention to the new types of DOM formed through chemical reactions, the release of particulate matter, and the action of microorganisms. This knowledge will help to improve people’s understanding of the water quality change law of the pipe network, and provide a reference for the optimal operation of water treatment processes and water distribution systems.
Author Contributions
Data curation, L.W. and T.L.; Formal analysis, L.W. and D.W.; Methodology, Z.Z.; Writing—original draft preparation, Z.Z. and D.W.; writing—review and editing, Z.Z. and L.W.; funding acquisition, Z.Z. Please turn to the CRediT taxonomy for the term explanation. All authors have read and agreed to the published version of the manuscript.
Funding
Approval No. 51278206 Interaction analysis and dynamic simulation study of particulate matter and secondary pollution in water supply pipe network National Natural Science Foundation of China.
Conflicts of Interest
The authors declare no conflict of interest.
References
- Kurajica, L.; Bošnjak, M.U.; Kinsela, A.; Štiglić, J.; Waite, T.D.; Capak, K.; Pavlić, Z. Effects of changing supply water quality on drinking water distribution networks: Changes in NOM optical properties, disinfection byproduct formation, and Mn deposition and release. Sci. Total Environ. 2021, 762, 144159. [Google Scholar] [CrossRef] [PubMed]
- Tong, H.Y.; Zhao, P.; Zhang, H.W.; Tian, Y.M.; Chen, X.; Zhao, W.G.; Li, M. Identification and characterization of steady and occluded water in drinking water distribution systems. Chemosphere 2015, 119, 1141–1147. [Google Scholar] [CrossRef] [PubMed]
- Liu, G.; Lut, M.C.; Verberk, J.Q.J.C.; Van Dijk, J.C. A comparison of additional treatment processes to limit particle accumulation and microbial growth during drinking water distribution. Water Res. 2013, 47, 2719–2728. [Google Scholar] [CrossRef] [PubMed]
- Vreeburg, I.J.H.B.; Boxall, D.J.B. Discolouration in potable water distribution systems: A review. Water Res. 2007, 41, 519–529. [Google Scholar] [CrossRef] [PubMed]
- Monnin, L.; Ciffroy, P.; Garnier, J.-M.; Ambrosi, J.-P.; Radakovitch, O. Remobilization of trace metals during laboratory resuspension of contaminated sediments from a dam reservoir. J. Soils Sediments 2018, 18, 2596–2613. [Google Scholar] [CrossRef]
- Gao, J.L.; Liu, Q.L.; Song, L.Z.; Shi, B.Y. Risk assessment of heavy metals in pipe scales and loose deposits formed in drinking water distribution systems. Sci. Total Environ. 2019, 652, 1387–1395. [Google Scholar] [CrossRef] [PubMed]
- Nhongo, K.; Hoko, Z.; Kugara, J. Investigating disinfectant by-products in Harare potable water supply, Zimbabwe. J. Water Sanit. Hyg. Dev. 2018, 8, 415–428. [Google Scholar] [CrossRef]
- Schmidt, P.J.; Emelko, M.B.; Reilly, P.M. Quantification of Analytical Recovery in Particle and Microorganism Enumeration Methods. Environ. Sci. Technol. 2010, 44, 1705–1712. [Google Scholar] [CrossRef] [PubMed]
- Dong, F.; Li, C.; Lin, Q.; Duan, H. Effect of pipe materials on disinfection by-products and bacterial communities during sulfamethazine chlorination in a pilot-scale water distribution system. Environ. Chem. Lett. 2019, 17, 1039–1044. [Google Scholar] [CrossRef]
- Khan, S.; Beattie, T.K.; Knapp, C.W. Rapid selection of antimicrobial-resistant bacteria in complex water systems by chlorine and pipe materials. Environ. Chem. Lett. 2019, 17, 1367–1373. [Google Scholar] [CrossRef] [Green Version]
- Li, M.J.; Liu, Z.W.; Chen, Y.C. Physico-chemical Characteristics of Corrosion Scales from Different Pipes in Drinking Water Distribution Systems. Water 2018, 10, 931. [Google Scholar] [CrossRef] [Green Version]
- Lytle, D.A.; Tang, M.; Francis, A.T.; O’Donnell, A.J.; Newton, J.L. The effect of chloride, sulfate and dissolved inorganic carbon on iron release from cast iron. Water Res. 2020, 183, 116037. [Google Scholar] [CrossRef]
- Chen, R.Y.; Li, G.W.; He, Y.T.; Pan, L.L.; Yu, Y.; Shi, B.Y. Field study on the transportation characteristics of PFASs from water source to tap water. Water Res. 2021, 198, 117162. [Google Scholar] [CrossRef]
- Husband, S.; Boxall, J. Understanding and managing discolouration risk in trunk mains. Water Res. 2016, 107, 127–140. [Google Scholar] [CrossRef] [PubMed] [Green Version]
- Chae, S.-H.; Kim, D.-H.; Choi, D.Y.; Bae, C.-H. Establishment of a Practical Approach for Characterizing the Source of Particulates in Water Distribution Systems. Water 2016, 8, 49. [Google Scholar] [CrossRef] [Green Version]
- Wang, J.; Tao, T.; Yan, H. Effects of Sulfate, Chloride, and Bicarbonate on Iron Stability in a PVC-U Drinking Pipe. Int. J. Environ. Res. Public Health 2017, 14, 660. [Google Scholar] [CrossRef] [PubMed] [Green Version]
- Zheng, Q.; Yang, X.; Deng, W.; Le, X.C.; Li, X.-F. Characterization of natural organic matter in water for optimizing water treatment and minimizing disinfection by-product formation. J. Environ. Sci. 2016, 42, 1–5. [Google Scholar] [CrossRef] [PubMed]
- Yi, Y.B.; Zhong, J.; Bao, H.; Mostofa, K.M.; Xu, S.; Xiao, H.-Y.; Li, S.-L. The impacts of reservoirs on the sources and transport of riverine organic carbon in the karst area: A multi-tracer study. Water Res. 2021, 194, 116933. [Google Scholar] [CrossRef]
- Verberk, J.; Hamilton, L.A.; O’Halloran, K.J.; Van Der Horst, W.; Vreeburg, J. Analysis of particle numbers, size and composition in drinking water transportation pipelines: Results of online measurements. Water Supply 2006, 6, 35–43. [Google Scholar] [CrossRef]
- Li, W.Y.; Tian, Y.; Chen, J.P.; Wang, X.M.; Zhou, Y.; Shi, N. Synergistic effects of sodium hypochlorite disinfection and iron-oxidizing bacteria on early corrosion in cast iron pipes. Front. Environ. Sci. Eng. 2022, 16, 72. [Google Scholar] [CrossRef]
Figure 1.
Pipeline sampling point setting diagram.

Figure 2.
TOC test results of simulated water distribution pipeline (a); DOM and POM ratio in TOC (b).
Figure 2.
TOC test results of simulated water distribution pipeline (a); DOM and POM ratio in TOC (b).

Figure 3.
DOM and POM types and proportions in sample point 1.

Figure 4.
DOM and POM types and proportions in sample point 2.

Figure 5.
DOM and POM types and proportions in sample point 3.

Figure 6.
The species number and proportion of DOM along the water distribution pipe (a); the species number and proportion of POM along the water distribution pipe (b).
Figure 6.
The species number and proportion of DOM along the water distribution pipe (a); the species number and proportion of POM along the water distribution pipe (b).

Figure 7.
The proportion of POM with particle size of 0.45~2 μm along the path (a); the proportion of POM with particle size of 2~5 μm along the path (b); the proportion of POM with particle size of >5 μm along the path (c).
Figure 7.
The proportion of POM with particle size of 0.45~2 μm along the path (a); the proportion of POM with particle size of 2~5 μm along the path (b); the proportion of POM with particle size of >5 μm along the path (c).


Table 1.
Species of POM co-existing along the water distribution pipeline.
| Attribute | Number | Structural Formula | Attribute | Number | Structural Formula |
|---|---|---|---|---|---|
| Ester | (1) |  | Ketone | (1) |  |
| (2) |  | (2) |  | ||
| Alcohol | (1) |  | |||
Disclaimer/Publisher’s Note: The statements, opinions and data contained in all publications are solely those of the individual author(s) and contributor(s) and not of MDPI and/or the editor(s). MDPI and/or the editor(s) disclaim responsibility for any injury to people or property resulting from any ideas, methods, instructions or products referred to in the content. |
© 2023 by the authors. Licensee MDPI, Basel, Switzerland. This article is an open access article distributed under the terms and conditions of the Creative Commons Attribution (CC BY) license (https://creativecommons.org/licenses/by/4.0/).
Share and Cite
MDPI and ACS Style
Zhao, Z.; Wang, L.; Wang, D.; Lai, T. Study on the Adsorption Relationship between Organic Matter and Particulate Matter in Water Distribution Pipes. Water 2023, 15, 859. https://doi.org/10.3390/w15050859
AMA Style
Zhao Z, Wang L, Wang D, Lai T. Study on the Adsorption Relationship between Organic Matter and Particulate Matter in Water Distribution Pipes. Water. 2023; 15(5):859. https://doi.org/10.3390/w15050859
Chicago/Turabian StyleZhao, Zhiling, Lu Wang, Dongdong Wang, and Tianneng Lai. 2023. "Study on the Adsorption Relationship between Organic Matter and Particulate Matter in Water Distribution Pipes" Water 15, no. 5: 859. https://doi.org/10.3390/w15050859
Note that from the first issue of 2016, this journal uses article numbers instead of page numbers. See further details here.