Article

Evapotranspiration Partitioning Using a Process-Based Model over a Rainfed Maize Farmland in Northeast China

1
Institute of Atmospheric Environment, China Meteorological Administration, Shenyang/Liaoning Provincial Key Laboratory of Agrometeorological Disasters, Shenyang 110166, China
2
Yale School of the Environment, Yale University, New Haven, CT 06511, USA
3
Center for Adaptable Western Landscapes, Northern Arizona University, Flagstaff, AZ 86011, USA
4
Institute of Agricultural Resources and Environment, Hebei Academy of Agricultural and Forestry Sciences, Shijiazhuang 050051, China
5
Department of Botany, University of Wyoming, Laramie, WY 82071, USA
*
Authors to whom correspondence should be addressed.
Water 2023, 15(5), 869; https://doi.org/10.3390/w15050869
Submission received: 31 January 2023 / Revised: 19 February 2023 / Accepted: 22 February 2023 / Published: 23 February 2023
(This article belongs to the Section Ecohydrology)

Abstract

:
The Northeast China maize belt is one of the three major golden maize belts in the world and has been severely affected by climate change, however, the evapotranspiration (ET) partitioning is not clear. It is important to study ET and its components under climate change. In this paper, the water balance model SOILWAT2 was used to estimate ET partitioning in drought and humid years, seasons, and maize growth stages from 1989 to 2018 over rainfed maize farmland. The results indicated that the SOILWAT2 model performed well for the prediction of ET and its partitioning compared with eddy covariance measurements. The mean yearly ET, transpiration (T), soil evaporation (Es), and canopy interception evaporation (Int) were 432.3 mm, 197.6 mm, 204.7 mm and 19.2 mm, respectively, over 30 years. Es/ET was 6.3% lower in drought years than in humid years, T/ET was conversely higher (6.2% higher in drought years). There was no clear difference of Int/ET between humid and drought years. In the growing season, T/ET, Es/ET, and Int/ET varied from 40.0% to 75.0%, 22.8% to 55.7%, and 0.7% to 7.0%, respectively. T/ET decreased along with the growth of maize and was greatest at the greening–jointing stage. Es/ET was smallest at the greening–jointing stage. We found a power function relationship between T/ET, Es/ET, and leaf area index (LAI) and above-ground biomass. Our results indicated that for the rainfed farmland, drought may limit maize yield by increasing water loss of maize through increasing T under climate change conditions. Therefore, securing food yield will depend on increases in water-use efficiency and other adaptive strategies, such as drought-resistant varieties, and irrigation.

1. Introduction

Evapotranspiration (ET) is the main driver of water transfer in the soil–vegetation–atmosphere system, and it is important for water balance in farmland ecosystems [1]. Most water is returned to the atmosphere by ET, and an in-depth understanding of its characteristics is important to address environmental challenges such as extreme wetness and drought [2]. In recent years, more and more studies have been focused on the differentiation and quantification of ET components [3,4,5], which has become one of the most important eco-hydrological challenges. ET processes occur simultaneously, and there is no easy way to distinguish between them [6].
Current research methods on ET and its components in agroecosystems include field observations [7,8], isotope methods [9,10,11], and model estimation methods [12,13,14,15,16]. Among these, model simulations are an effective way to estimate ET and its components over months and growing seasons. The SOILWAT2 model is a process-based ecosystem water budget model, which includes five sub-modules: atmosphere, vegetation, precipitation, soil, and evapotranspiration. ET and its components (transpiration, soil evaporation, and canopy interception evaporation) can be simulated with a few easy access parameters. The model has been widely used in grassland and forest ecosystems in terms of water budgets of ecosystems and soil water budgets due to climate change [17,18,19,20,21,22].
Maize has a high yield per unit area, a huge potential for increasing production, and plays an important role in human food security. The Northeast China maize belt is one of the three major maize belts in the world and occupies an important position in China’s grain production [23]. The maize planting area exceeds 6 million hectares, and 94% is rainfed [24]. The main water input of rainfed farmland ecosystems is rainfall, which is directly affected by climate change. Under the influence of climate change, ET and its components in rainfed maize fields are unclear.
Studies on ET and its components focus on the characteristics of ET [25], comparative application of ET methods [26,27], the proportions of ET components (transpiration, soil evaporation, and interception) [9], and their influencing factors [28,29]. What are the proportions of ET components (transpiration, soil evaporation, and canopy interception evaporation) in a rainfed maize farmland under climate change? In this study, we employed the SOILWAT2 model to address three objectives: (1) quantify the long-term components of water balance; (2) quantify ET partitioning and its characteristics during seasons, maize growth stages, and yearly; and (3) reveal the relationship between LAI, above-ground biomass, and ET partitioning.

2. Material and Methods

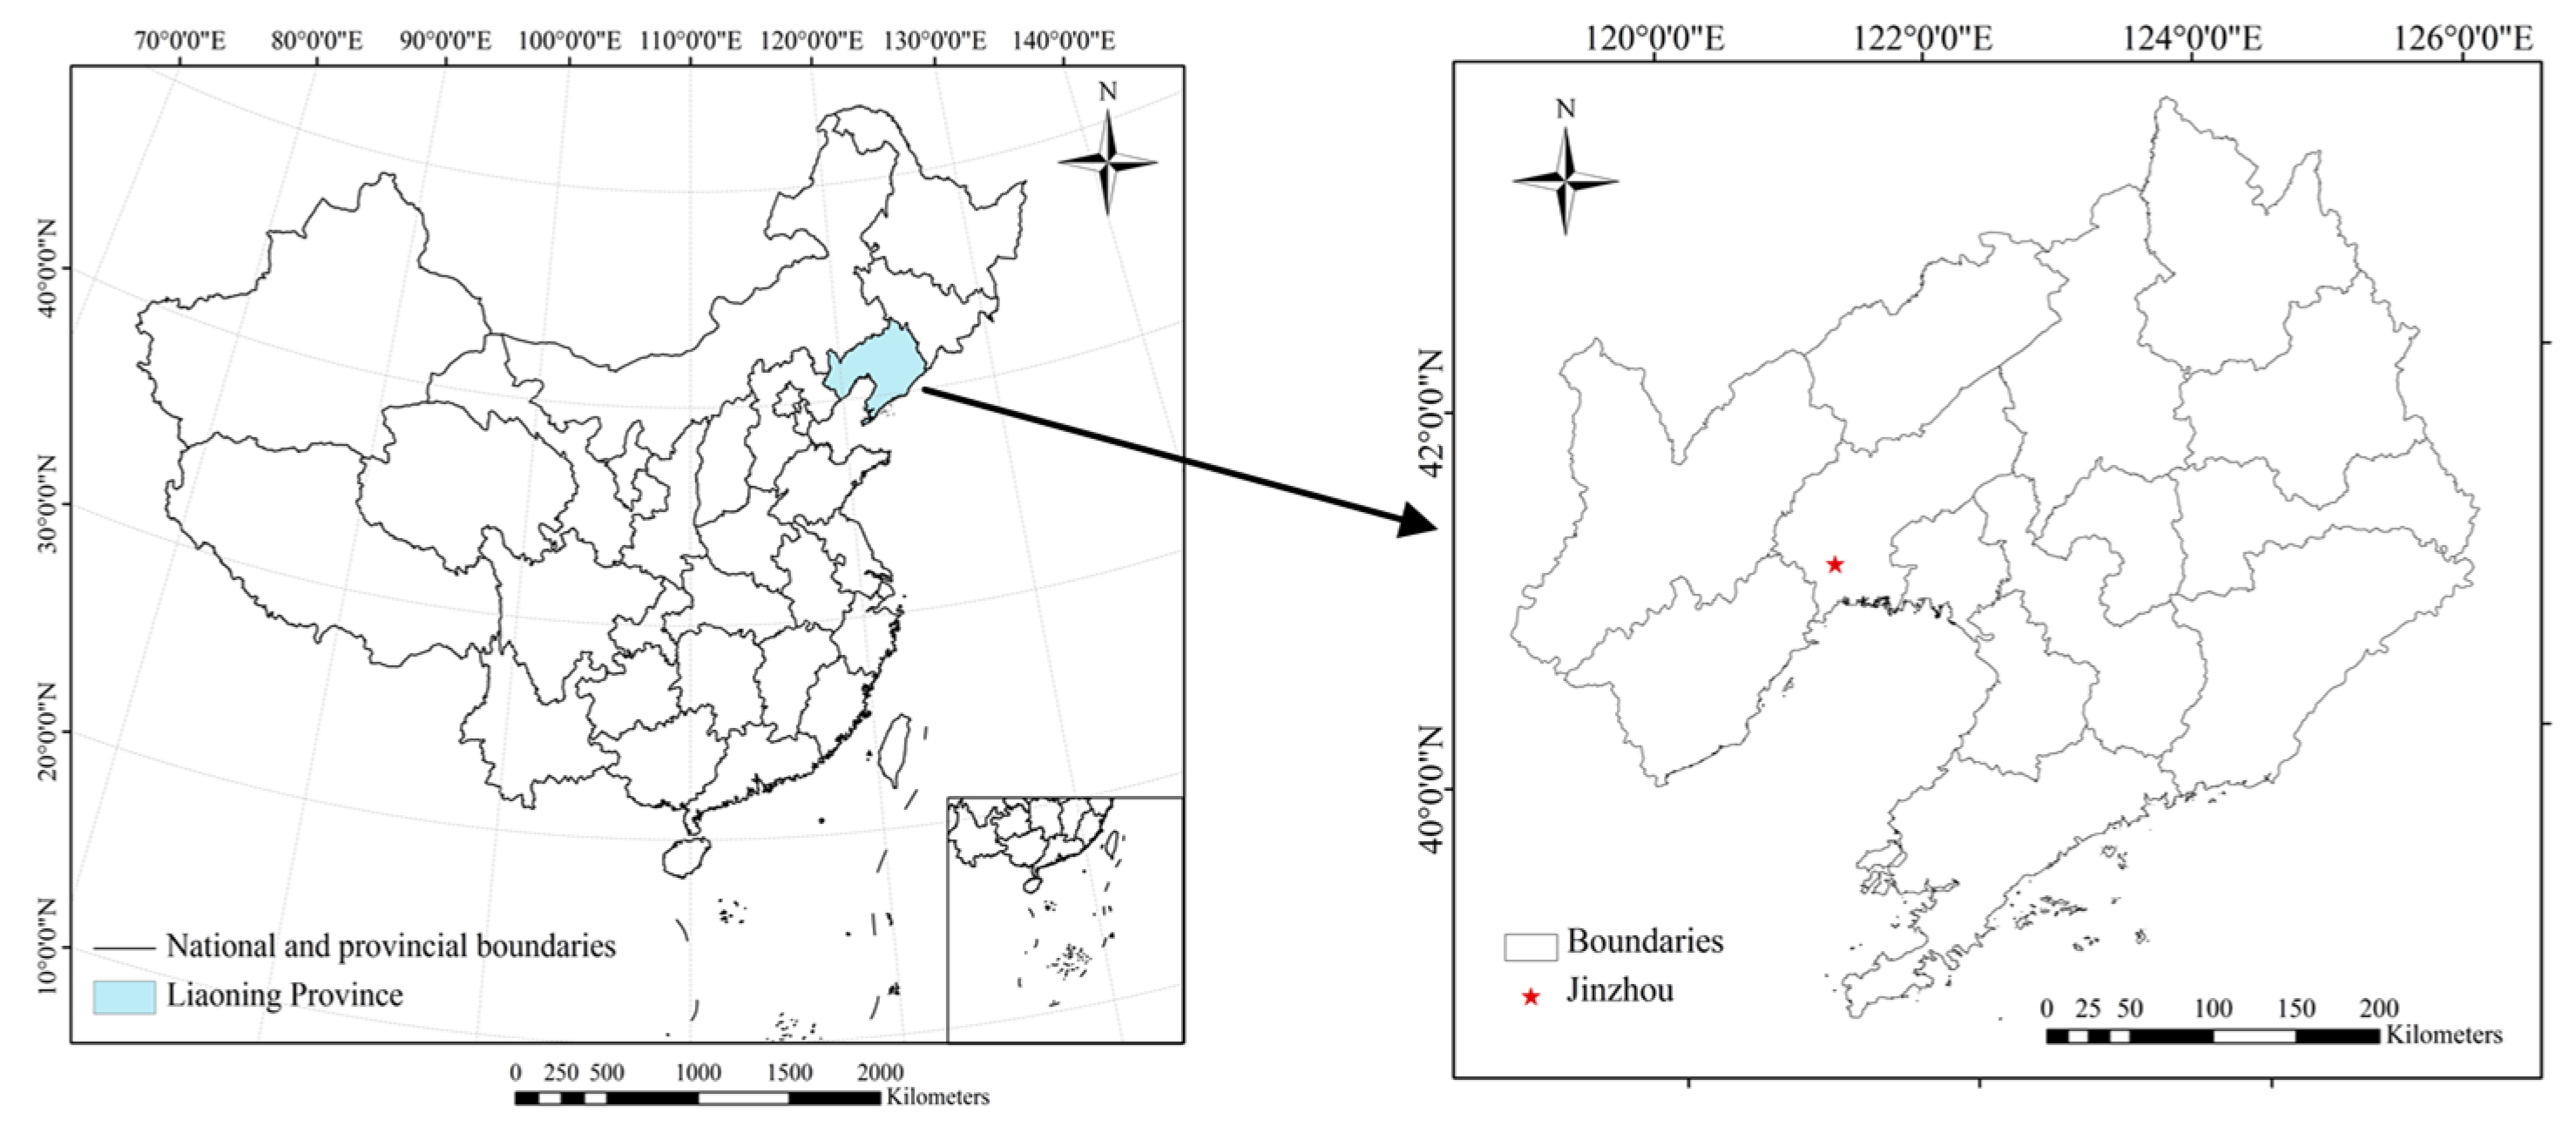
2.1. Site Description

The study site is located at the Jinzhou Agricultural Ecosystem Research Station (41°08′ N, 121°10′ E; elevation 17 m) in Northeast China (Figure 1). It is a typical semiarid rainfed maize farmland. The region has a continental monsoon climate with four distinct seasons. The mean annual temperature is 10.4 °C and the mean annual precipitation is 549 mm (average of 1989–2018). About 60% of the precipitation is received between July and September. The soil is brown loam and slightly acidic (pH of 6.3), typical of the region, with the following nutritional composition: organic matter, 15.24 g·kg−1; nitrogen, 1.04 g·kg−1; phosphorus, 0.50 g·kg−1; and potassium, 22.62 g·kg−1 [30].

2.2. Observation Method

Eddy covariance and microclimatic instruments were installed on a meteorological tower at the experiment site and have been in operation since 2004. The instrumentation is detailed in Table 1.
Leaf area index (LAI) was measured using a leaf area meter (LAI-2000, LiCor Inc., Lincoln, NE, USA) during the growing season about once during each maize growth stage from 2005 to 2018. The averaged LAI for six maize plants was used in this study.
Above-ground biomass (AGB) was measured as follows. The fresh above-ground parts of maize plants were selected, dried at 65 °C at a constant temperature to constant weight, and then the dry mass was measured and recorded. The average AGB for six maize plants was used in this study.

2.3. Model Description

We used the SOILWAT2 model v3.4.0 (details available in Github repositories: [31]). SOILWAT2 is a daily time step, multiple-layer soil water model developed for semiarid grasslands [32] and adapted for a wide range of ecosystems [19,20,21,22]. Input information required includes daily weather and vegetation and soil properties. Weather inputs include daily precipitation, daily maximum and minimum air temperatures, mean monthly relative humidity, mean monthly wind speed, and mean monthly cloud cover. The weather data were obtained from Jinzhou meteorological station (41°8′ N, 121°7′ E; elevation 23 m) from 1989–2018 from the China Meteorological Administration, which is the nearest station to our site. Vegetation in SOILWAT2 consists of monthly above-ground plant biomass (total and live), above-ground litter biomass, and root water uptake capacity by depth implemented as transpiration coefficients for each soil layer. Average monthly biomass data were measured from May to September from 2005 to 2018 at the Jinzhou Agricultural Ecosystem Research Station. We simulated soil water in eight layers (0–5, 5–10, 10–20, 20–30, 30–40, 40–60, 60–80, and 80–100 cm). Properties for each soil layer consist of texture (percentage sand, silt, and clay), bulk density, and gravel content.
Outputs include interception and subsequent evaporation from the plant canopy and litter layer, water infiltration into the soil, water flow among soil layers, deep drainage (water that leaves the simulated soil profile at the lower margin), evaporation and transpiration from each layer, and soil water content by layer. We conducted a corroboration test for this study by comparing our modeled ET to ET obtained from the eddy covariance data, and the results showed that they had a good linear relationship (R2 = 0.64) (Figure 2).

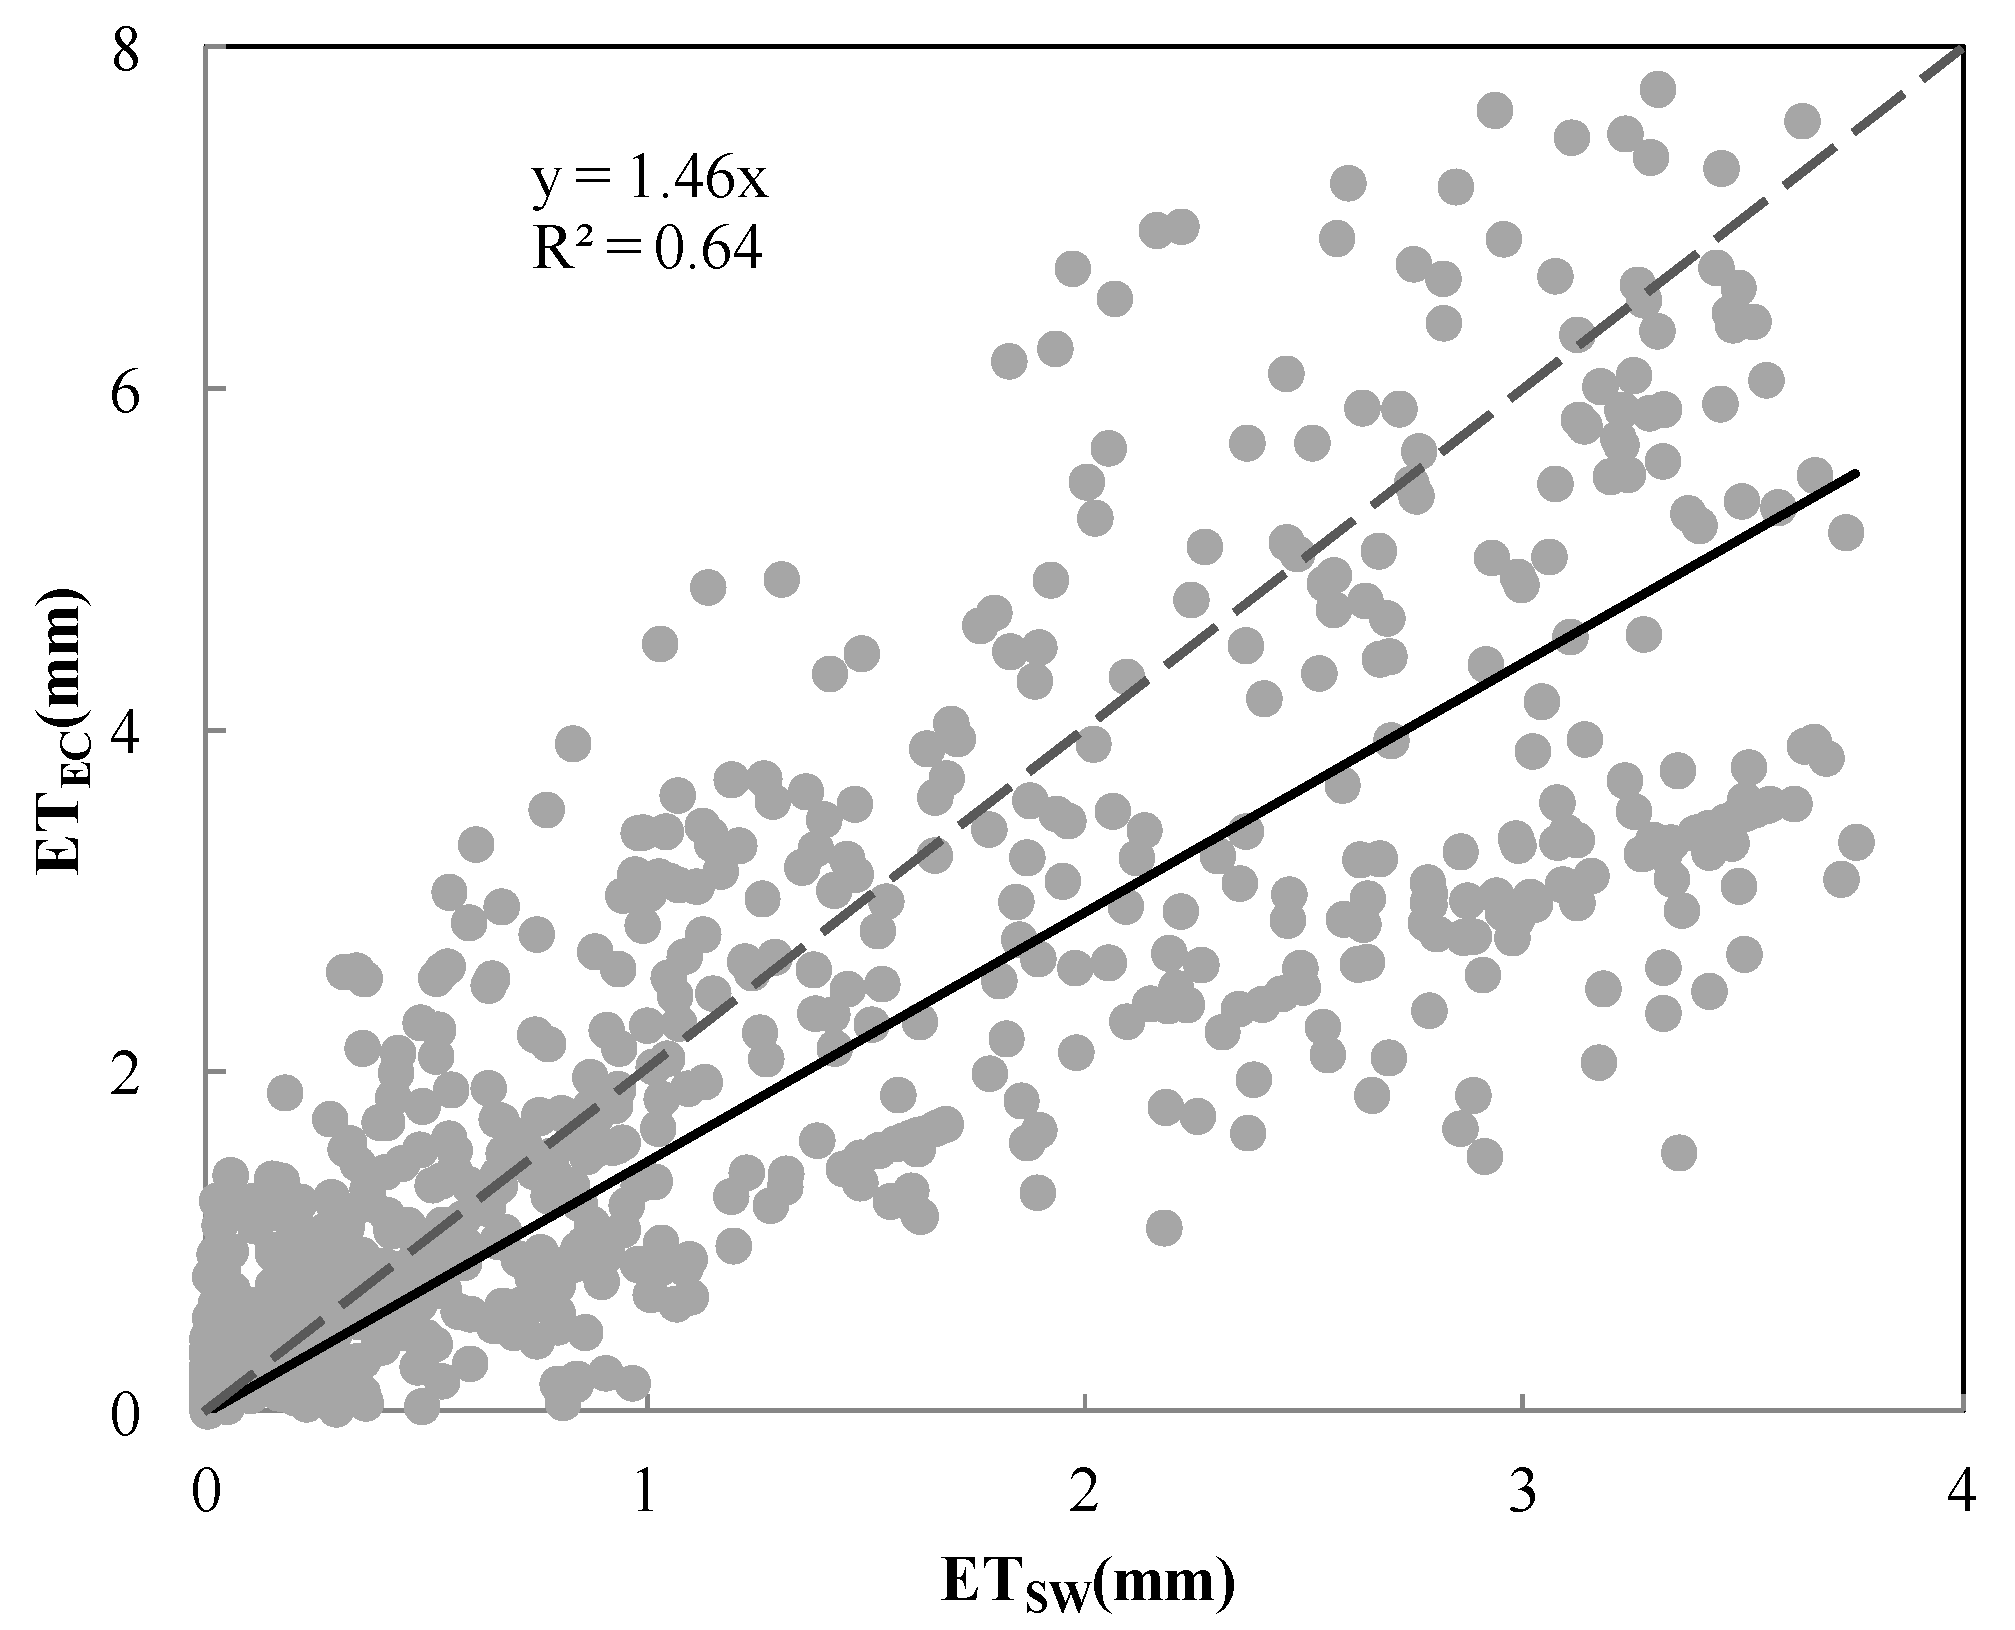
2.4. Model Evaluation

Correlation coefficient of linear regression, mean absolute error (MAE), root mean square error (RMSE), and normal root mean square error (NRMSE) were used in model evaluation. MAE, RMSE, and NRMSE were calculated as follows:
M A E = 1 n i = 1 n P i O i
R M S E = 1 n i = 1 n P i O i 2
N R M S E = 1 n i = 1 n P i O i 2 × 100 O a v g
where Pi is the value estimated by the SOILWAT2 model; Oi is the observed value; Oavg is the average observed value; and n is the number of Pi or Oi.

3. Results

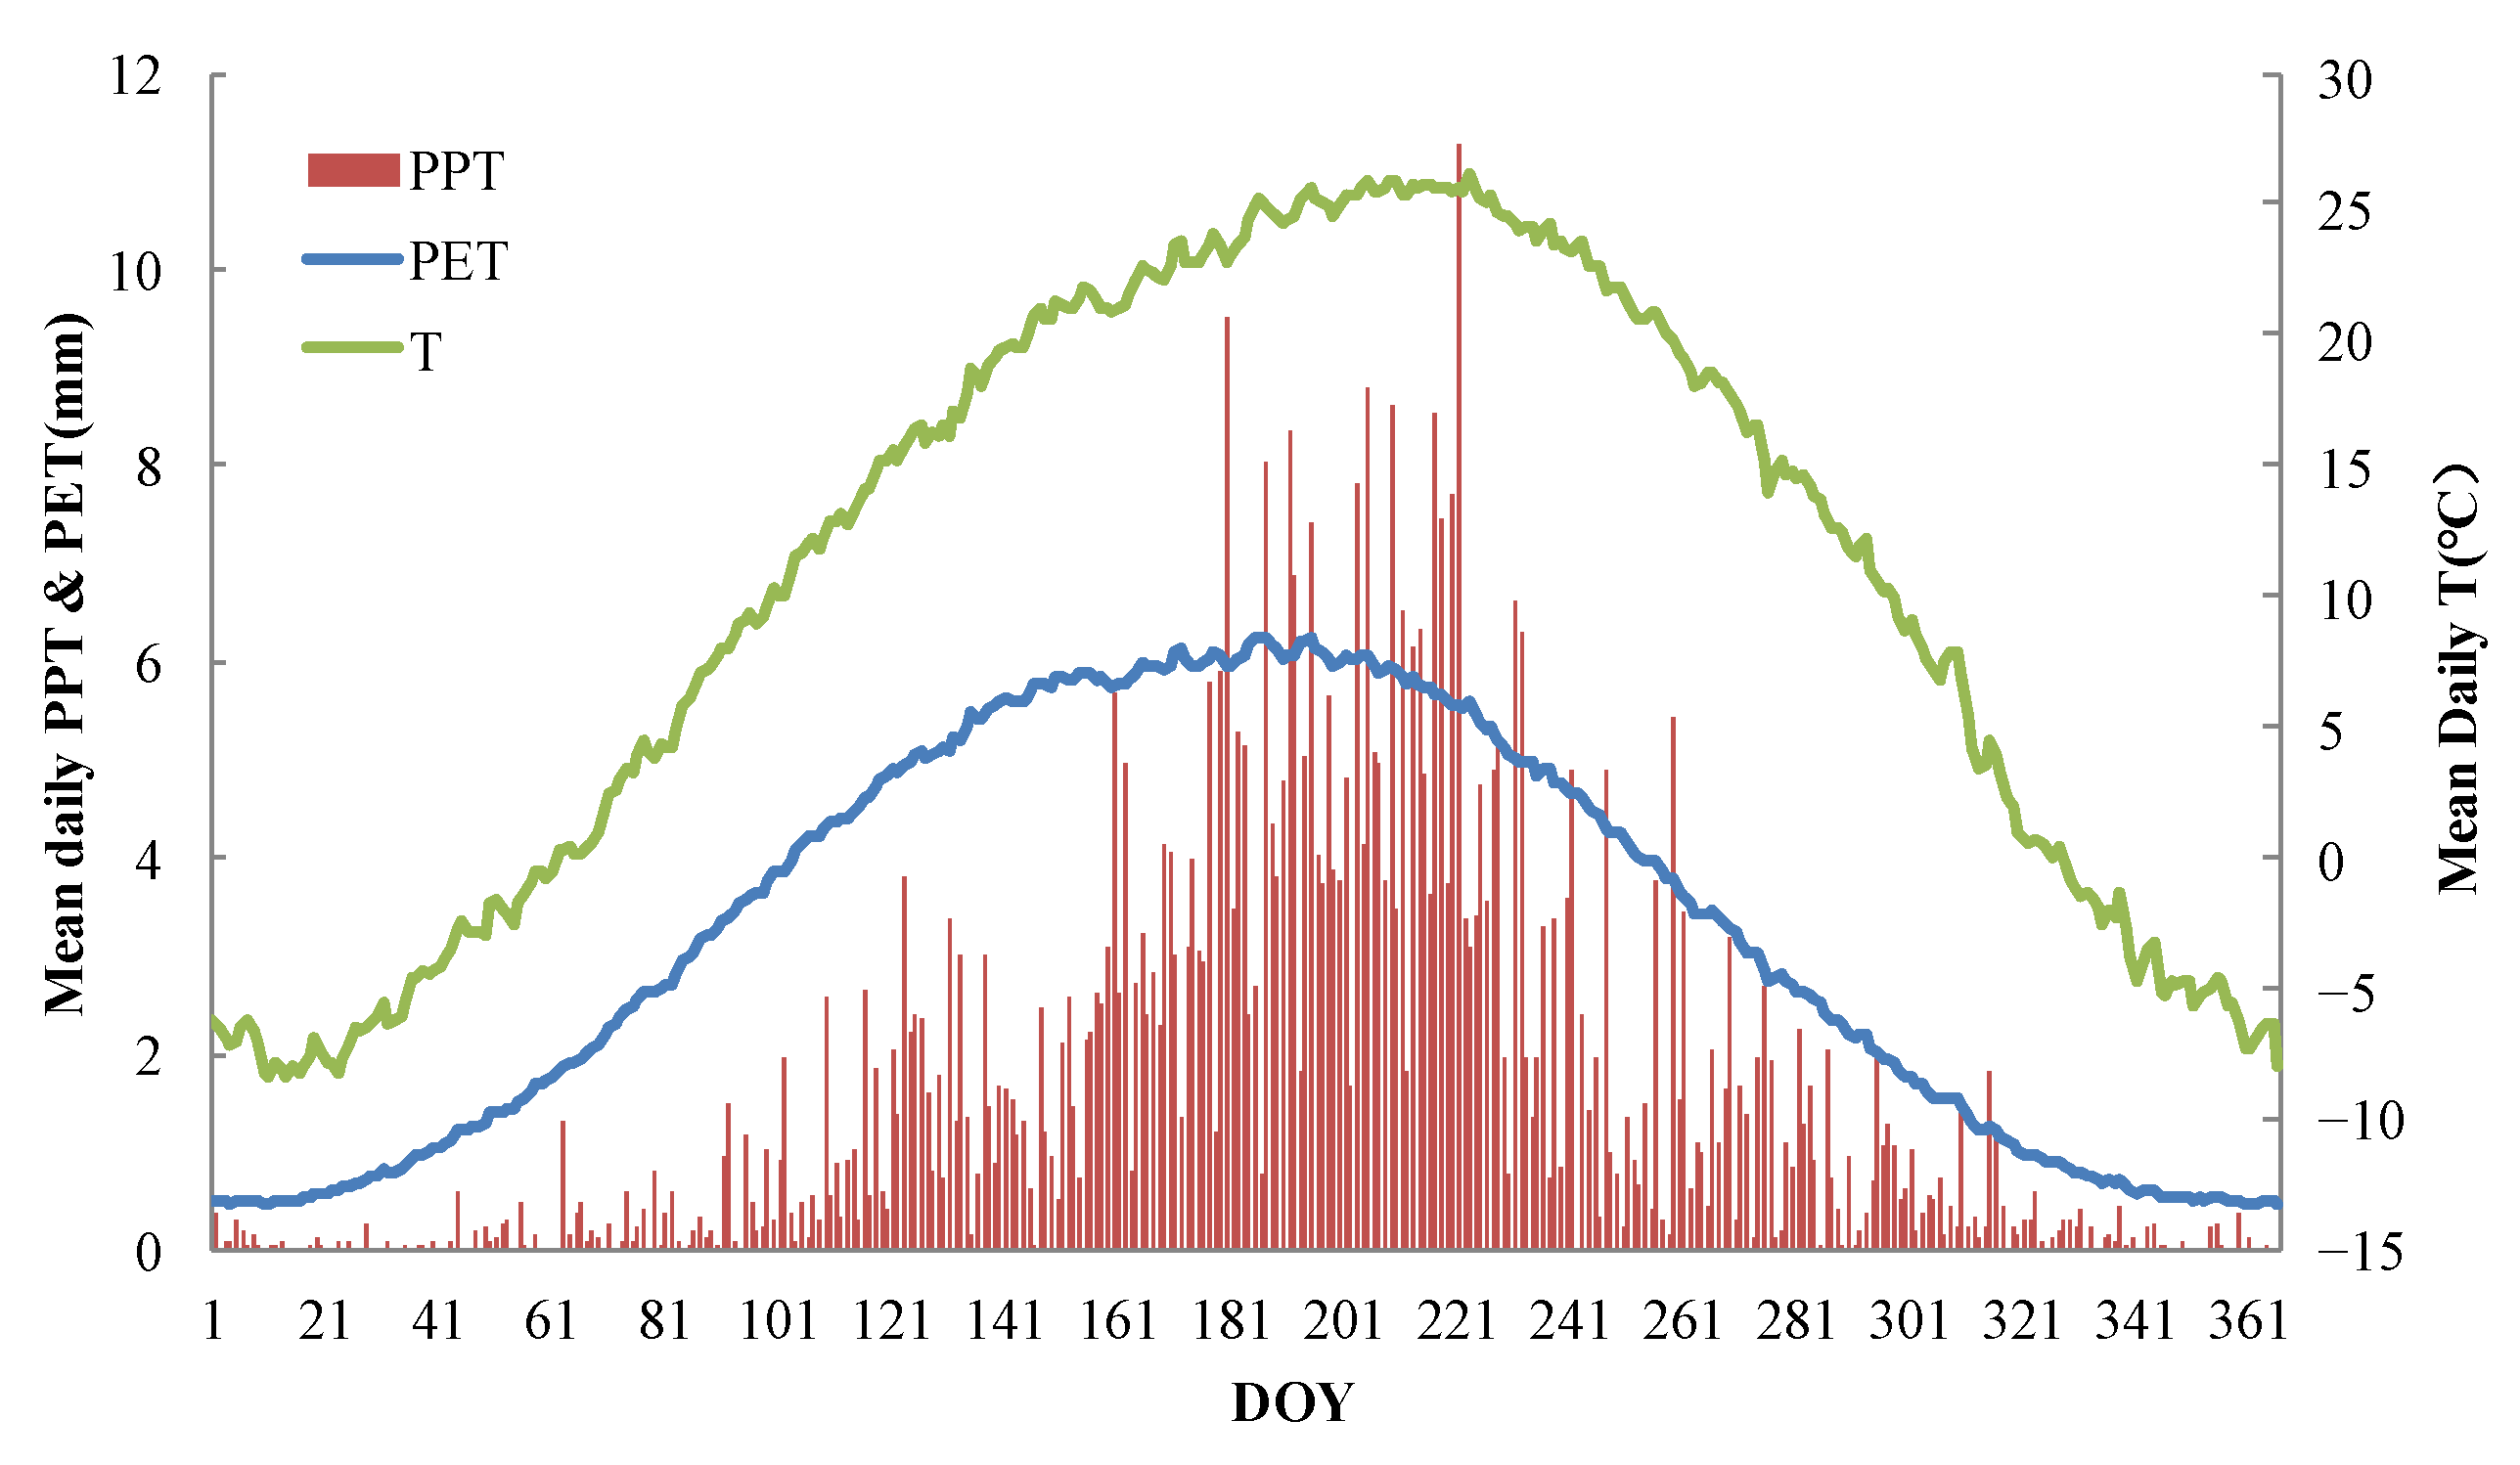
3.1. Climates of the Site

Water input to the ecosystem was represented by precipitation (PPT). The annual PPT ranged from 338 to 899 mm during our study period, with an average of 549 mm and a CV of 32% (30 years). Water demand by the atmosphere was represented by potential evapotranspiration (PET). It was highest in summer and lowest in winter (Figure 3). Average annual PET over the 30 years was 1180 mm with a CV of 2%. Mean daily PET was frequently less than mean daily PPT in the warm season (late June–early September) and greater than PPT during the cold season (other months). Maximum PET and PPT occurred in the summer months and the minima for both occurred in winter. The maximum daily mean temperature was 26.1 °C in August, and the minimum was −8.4 °C in January. The high temperatures coincided with high PPT and PET. Summer was the wet and warm season, and winter was the dry and cold season.

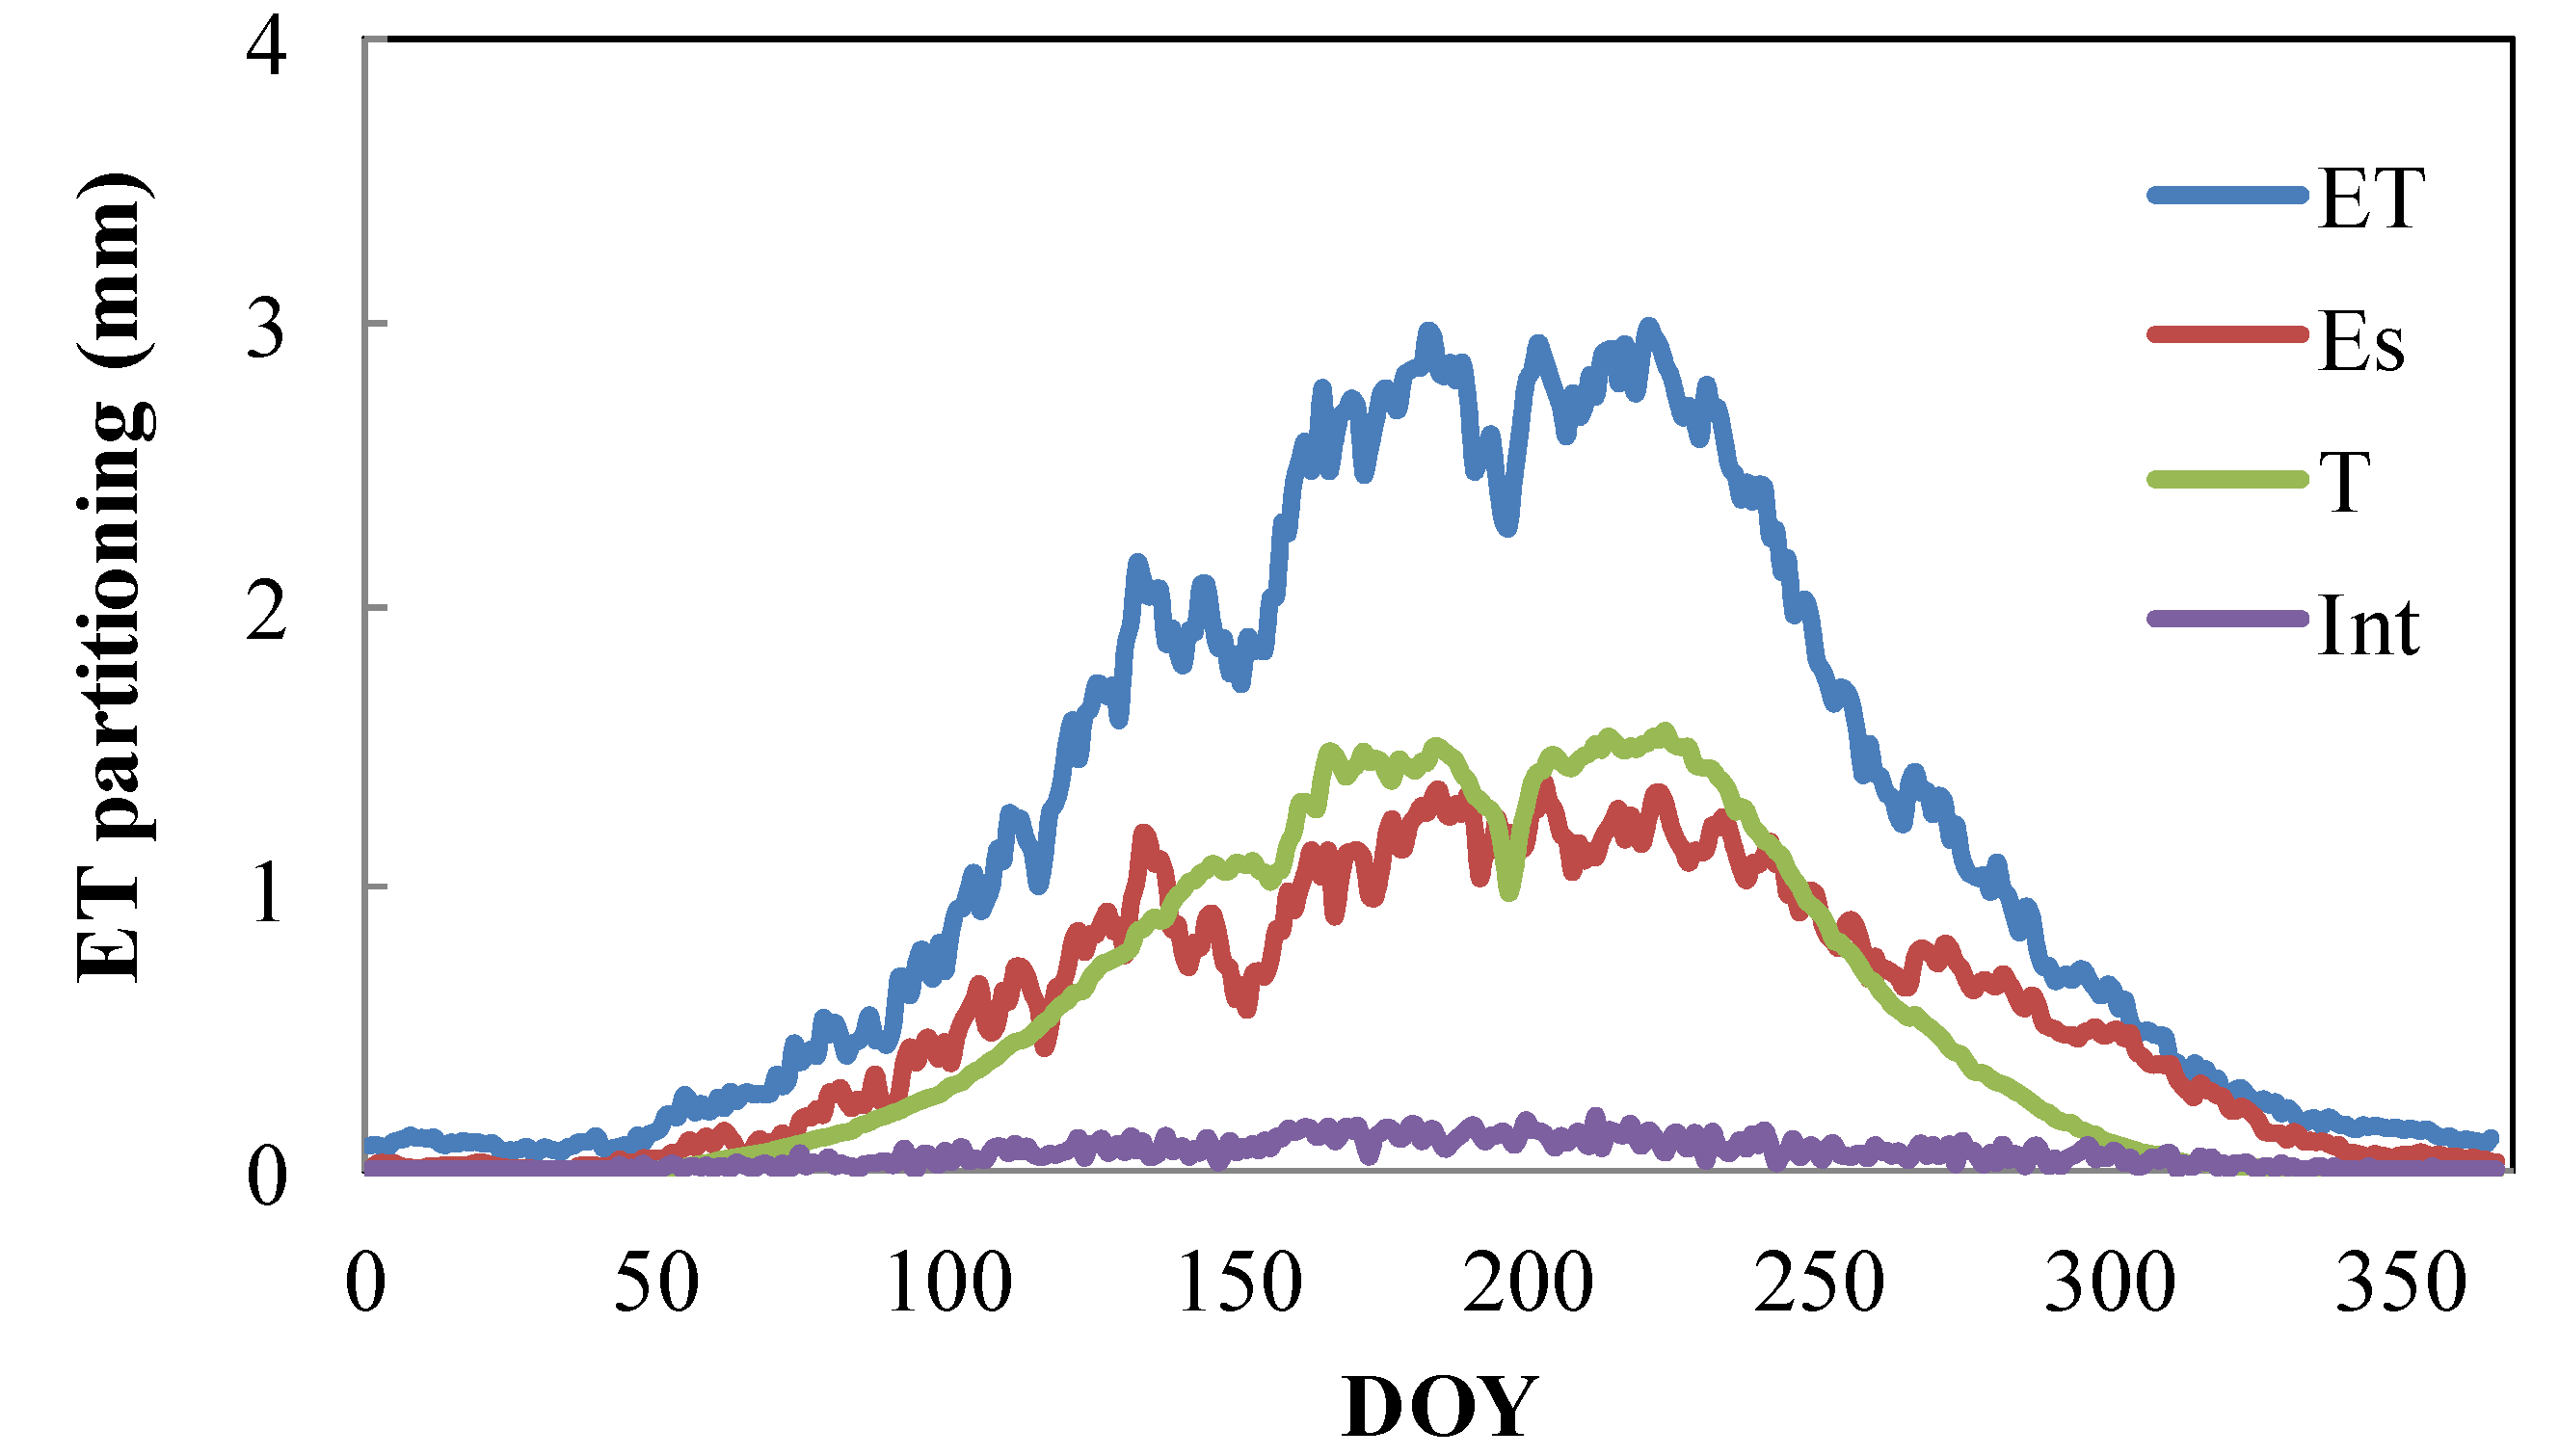
3.2. Evapotranspiration Partitioning

Evapotranspiration can be partitioned into soil evaporation (Es), transpiration (T), and canopy interception evaporation (Int) (Figure 4). Annual dynamics of ET approximately followed a parabolic relationship with large day-to-day variation during the growing season (May to September). ET started to increase in May, reached its highest value in July and August, and decreased rapidly after early October. The mean yearly value of ET was 432.3 mm over 30 years and the maximum daily value of ET was 3.0 mm in August. The majority of ET occurred in the growing season and averaged 344.9 mm, accounting for nearly 80% of annual ET. The ratio of ET to PPT was 83.6%, with an STDEV of 17.2 mm (Table 2).
There were no significant differences in the annual variation of each of the components of ET partitioning from 1989 to 2018. The annual change in Es, T, and Int were parabolic similar to ET. Their maximum daily values were 1.4 mm, 1.6 mm, and 0.2 mm, respectively, in July, August, and July. The mean yearly values of each ET component were 204.7, 197.6, and 19.2 mm, respectively, over 30 years. During the growing season, they were 155.2 mm, 174.9 mm, and 14.8 mm, respectively, accounting for 75.8%, 88.5%, and 77.1% of the annual values.
The ratios of Es, T, and Int to ET were 47.1%, 45.9%, and 4.4%, with an STDEV of 3.3%, 3.7%, and 0.5%.

3.3. Variations of Evapotranspiration Partitioning

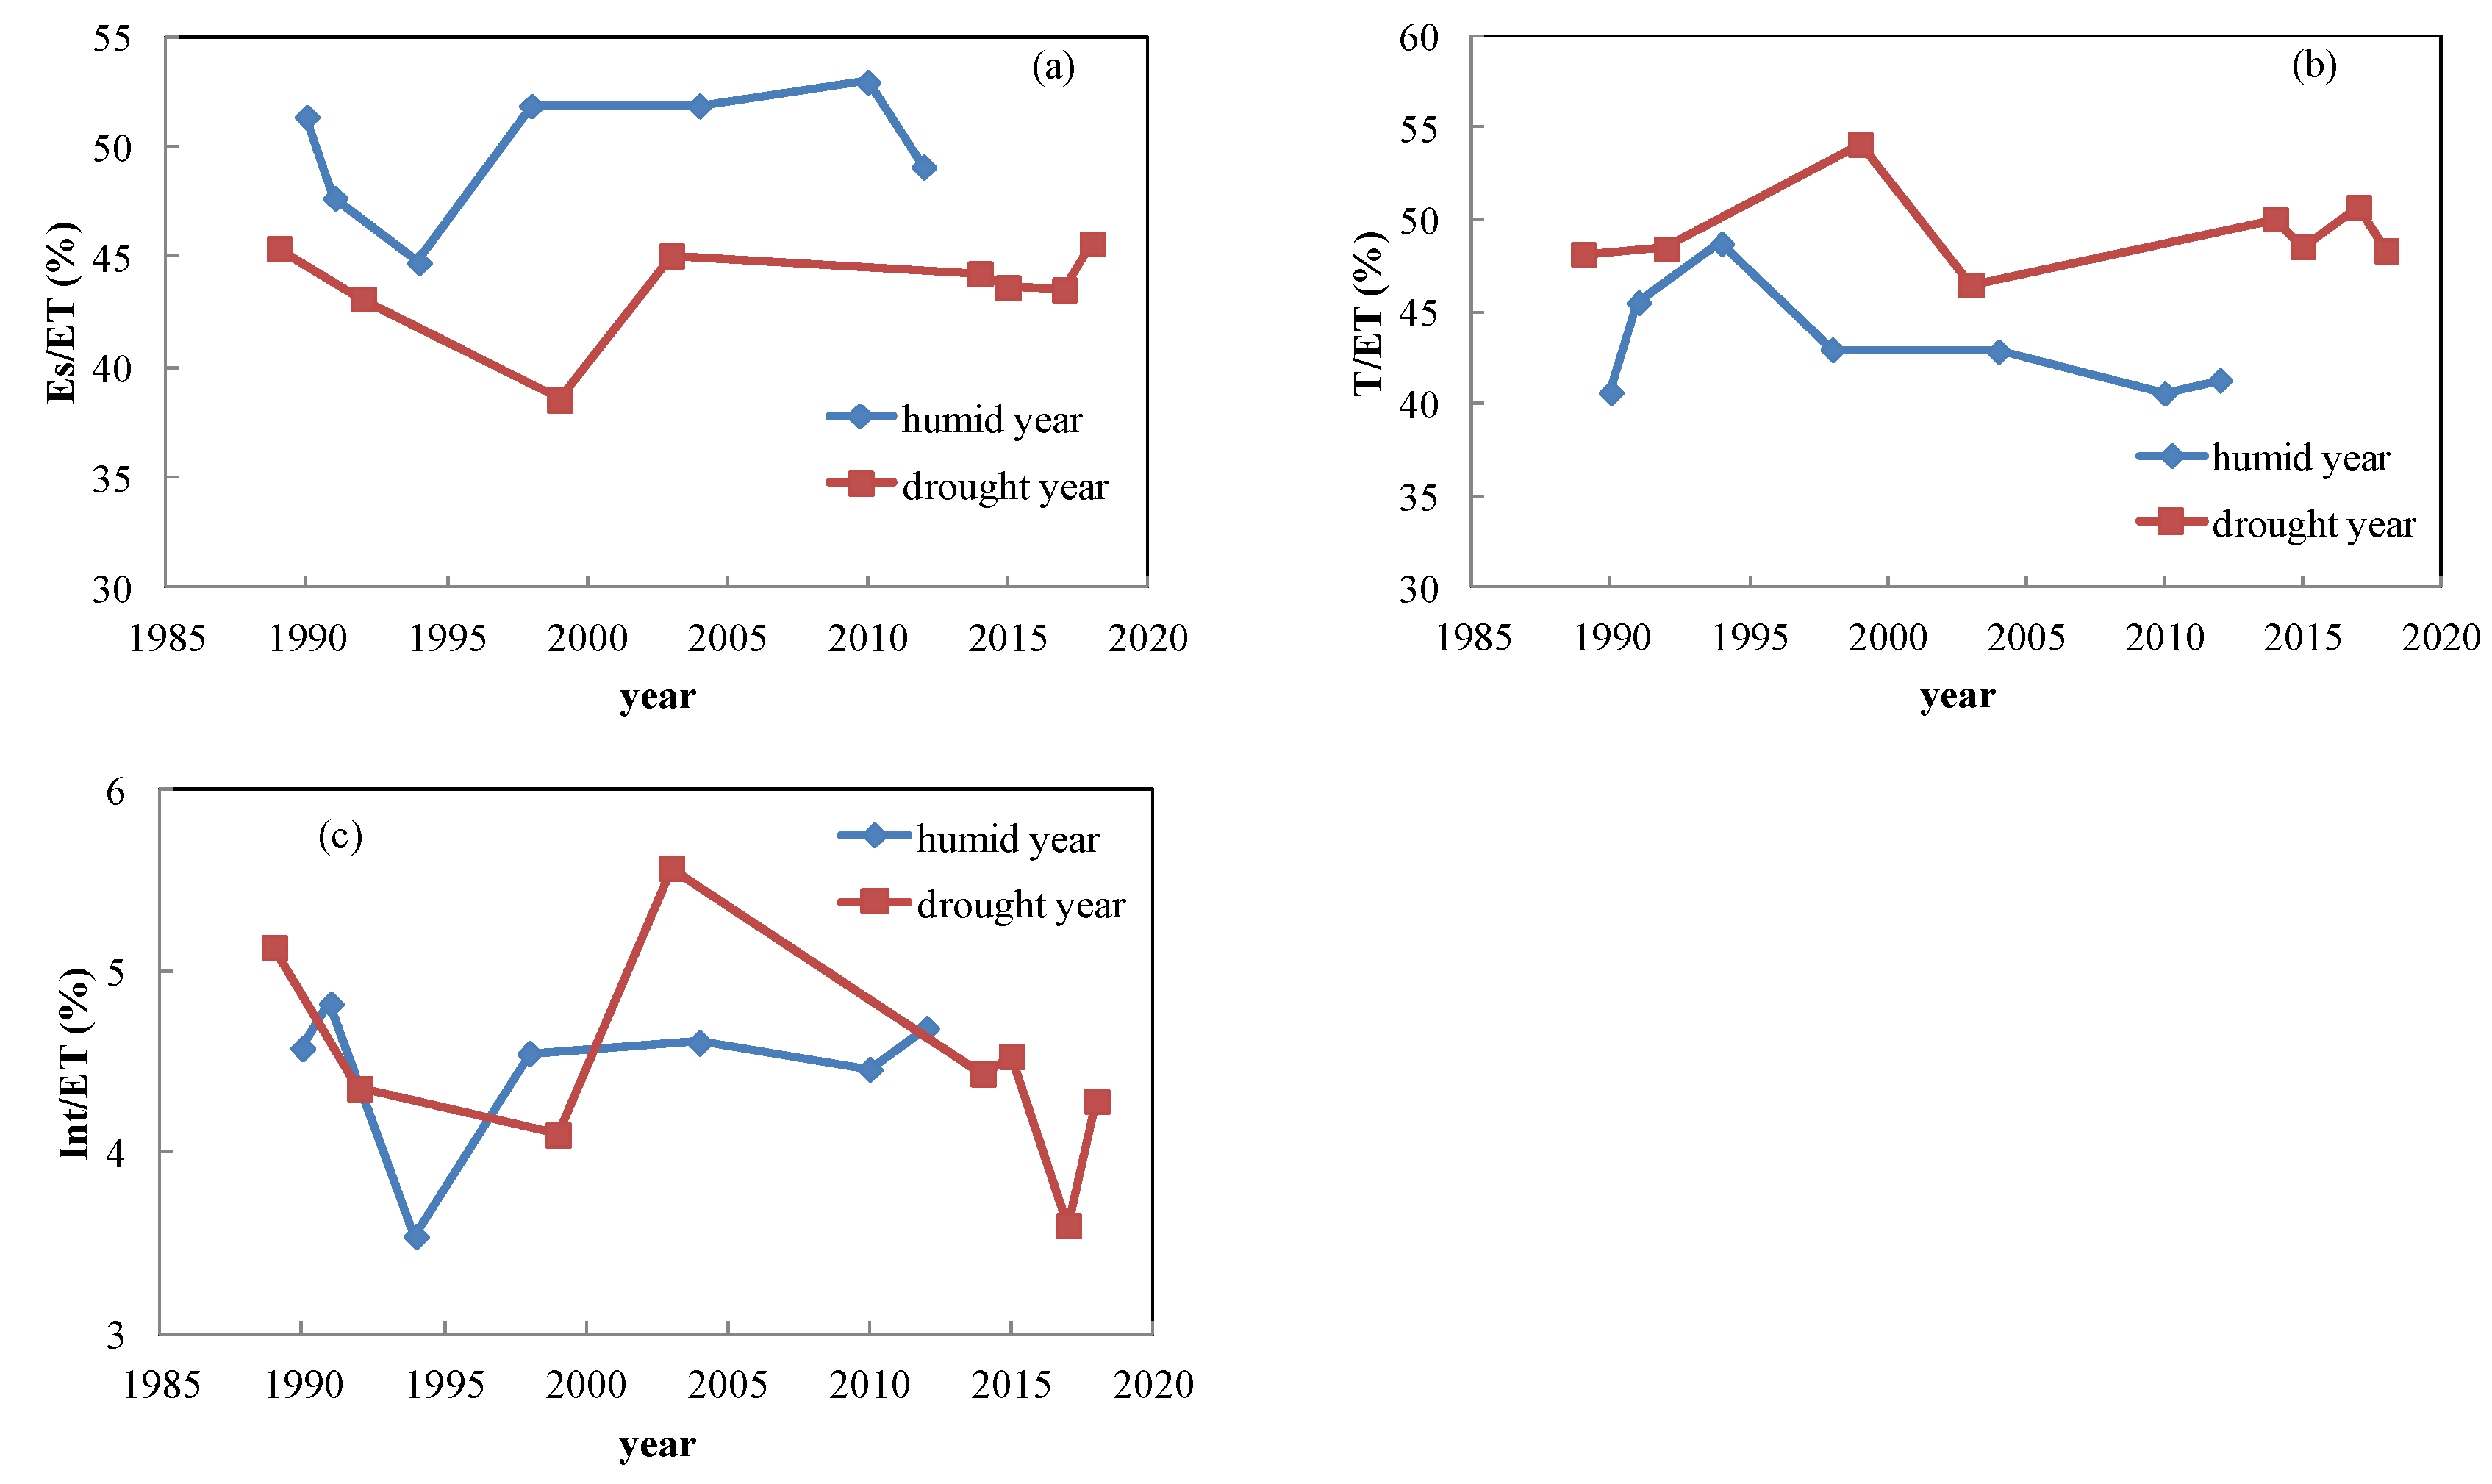
3.3.1. ET Partitioning in Humid and Drought Years

We used the standardized rainfall index (SPI), first proposed by Mckee et al. [33], to define humid years (SPI ≥ 1) and drought years (SPI ≤ −1). According to the SPI classification, the following years can be defined as humid: 1990, 1991, 1994, 1998, 2004, 2010, and 2012, and these years can be defined as drought years: 1989, 1992, 1999, 2003, 2014, 2015, 2017, and 2018.
Es/ET was 6.3% higher in humid years than in drought years (Figure 5). The average values of Es/ET were 49.9% and 43.6%, with an STDEV of 2.9% and 2.3%, respectively, in humid and drought years. T/ET was the inverse and was 6.2% lower in humid years than in drought years. This means transpiration was the main water loss in drought years. Drought caused the maize to lose more water. The average values of T/ET were 43.2% and 49.4% with an STDEV of 3.0% and 2.3%, respectively, in humid and drought years. There was no clear difference of Int/ET between humid and drought years. The average values of Int/ET were both 4.5%.

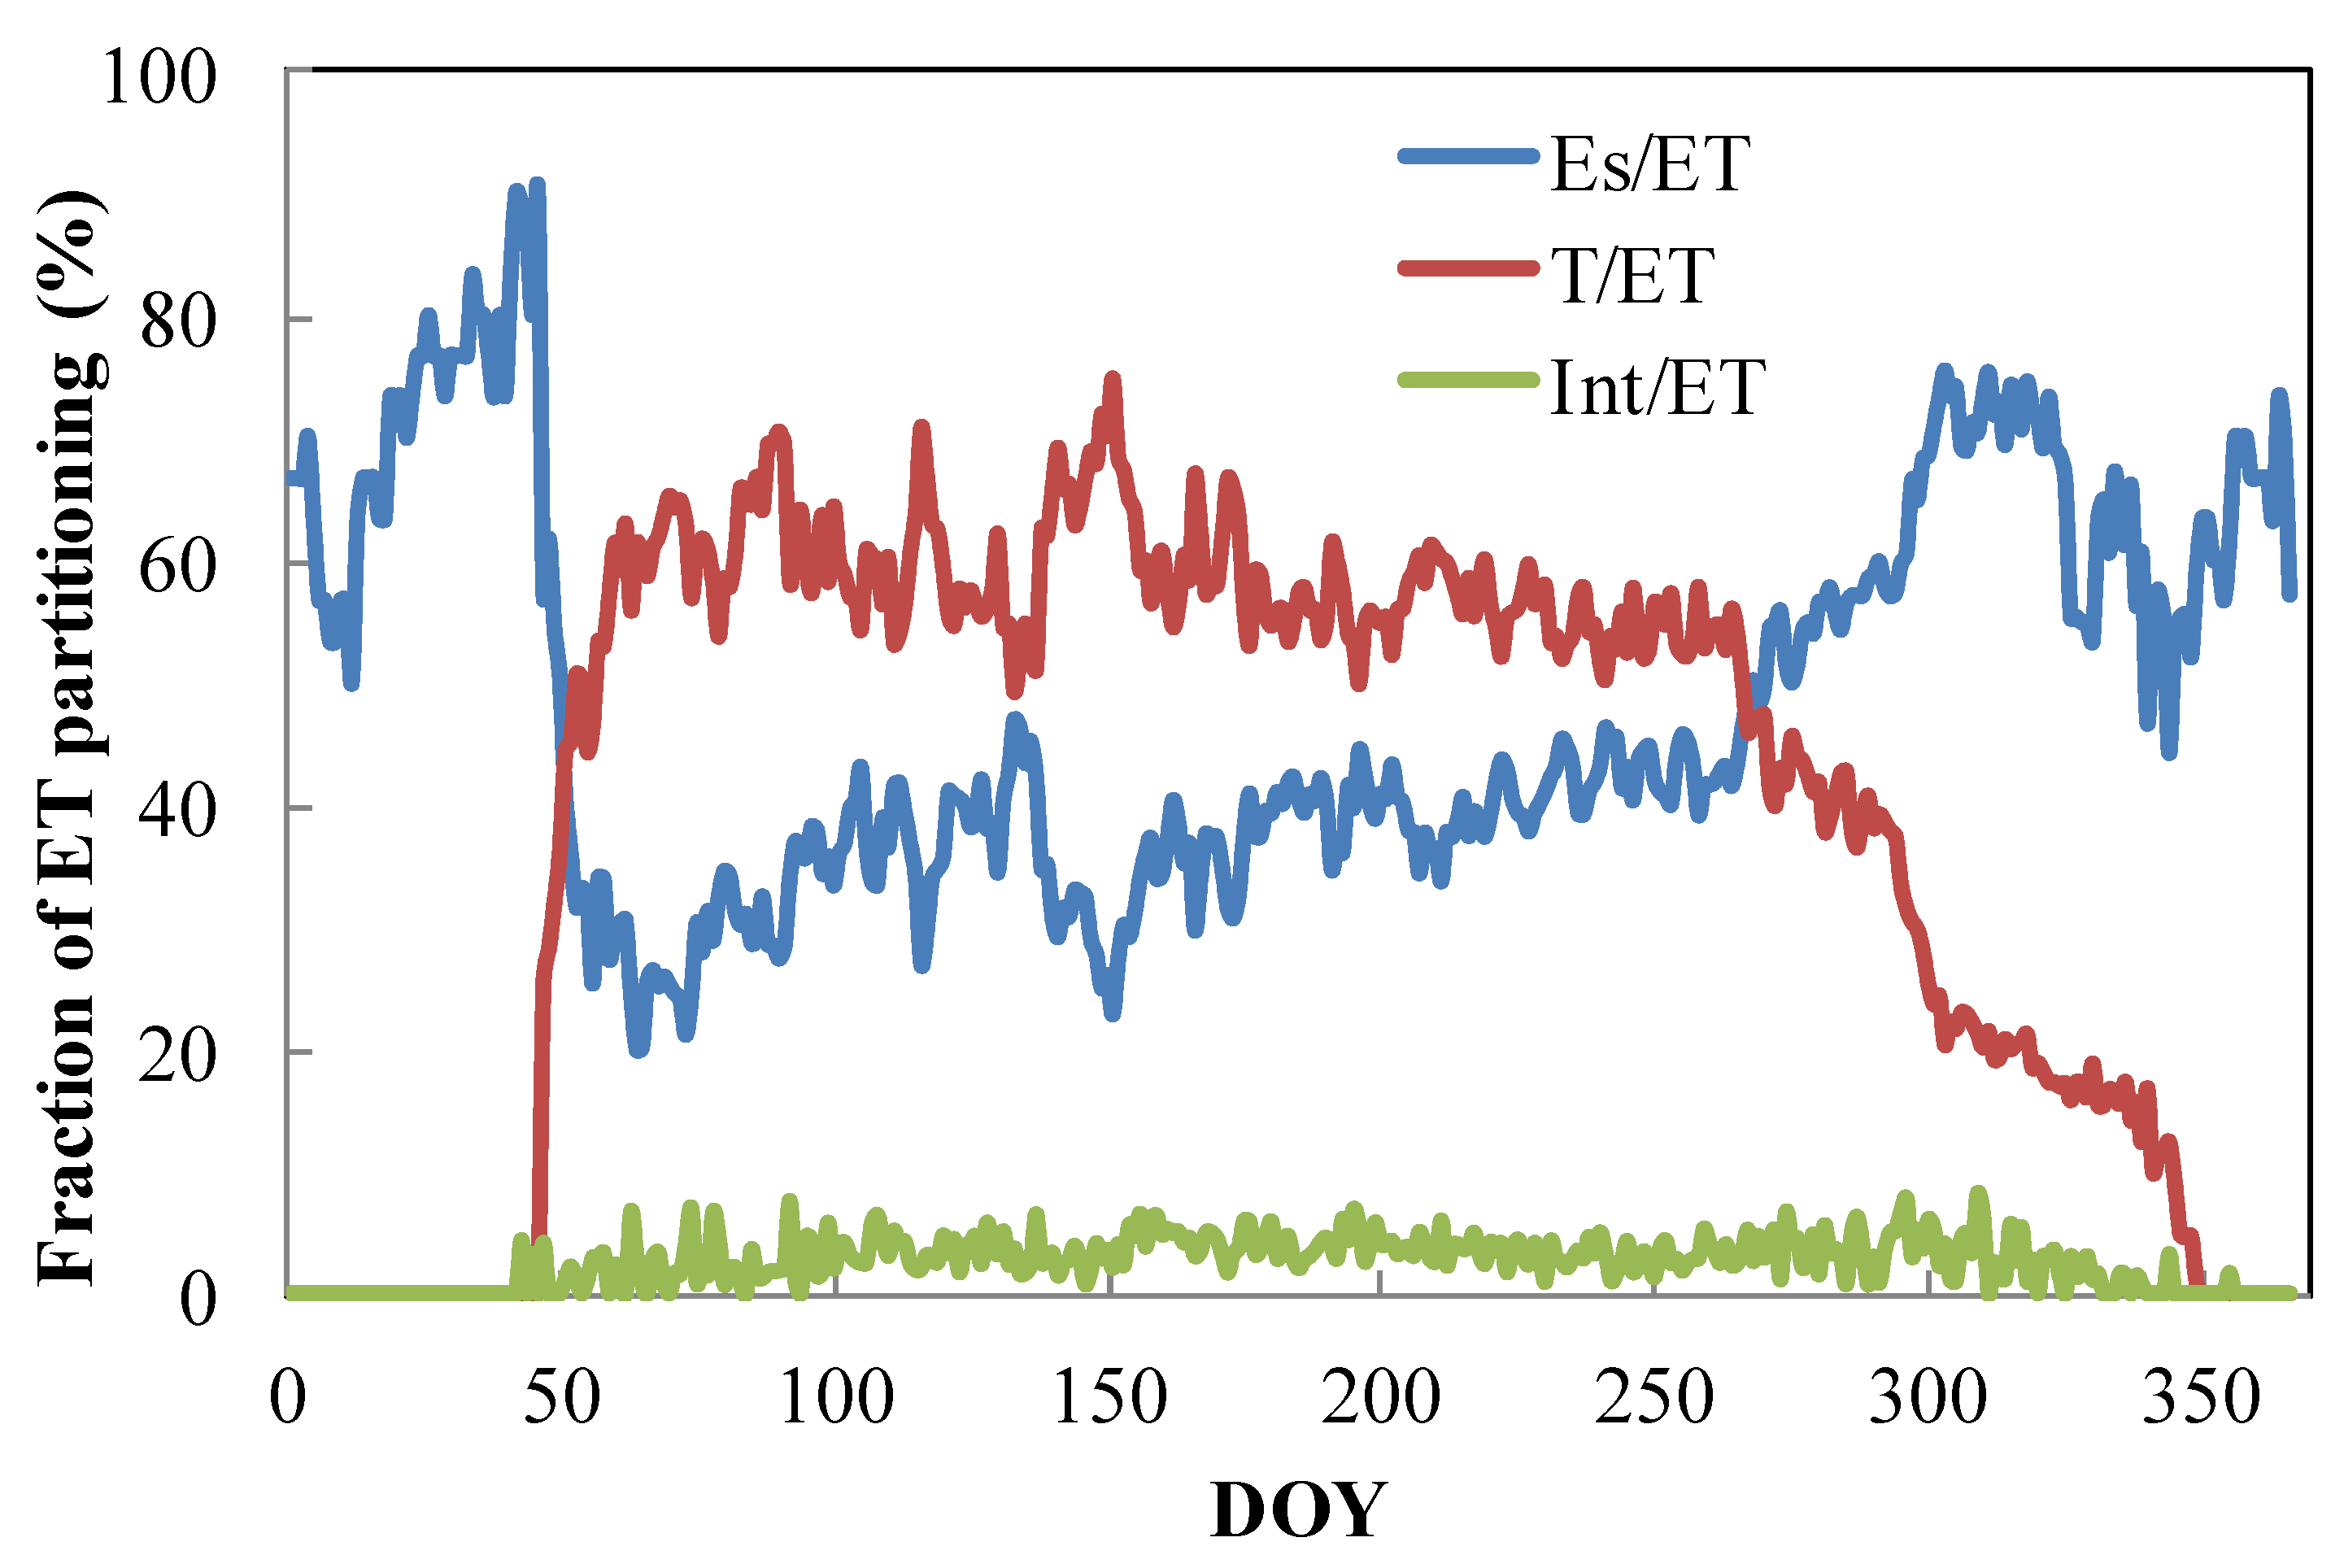
3.3.2. Seasonal Variation of ET Partitioning

Es/ET varied from 20.0% to 90.0% during the year (Figure 6) with an average of 48.1%. It was large in the non-growing season and small in growing season. It decreased in late February, reached a minimum in March, and began increasing in October. The maximum value was 90.0% in February. Seasonal variation of T/ET was opposite to that of Es/ET. T/ET varied from 0% to 75.0%, with an average of 40.7%. It started to increase in mid-February, reached a maximum value in May, and started to decrease near the end of October. The seasonal variation of Int/ET was similar to that of T/ET. It varied from 0% to 8.3%, with an average of 2.7%: large in the growing season and low in the non-growing season. During the growing season [DOY 121–273], T/ET varied from 40.0% to 75.0%, with an average of 57.0%. Es/ET varied from 22.8% to 55.7%, with an average of 39.3%. Int/ET varied from 0.7% to 7.0%, with an average of 3.7%.

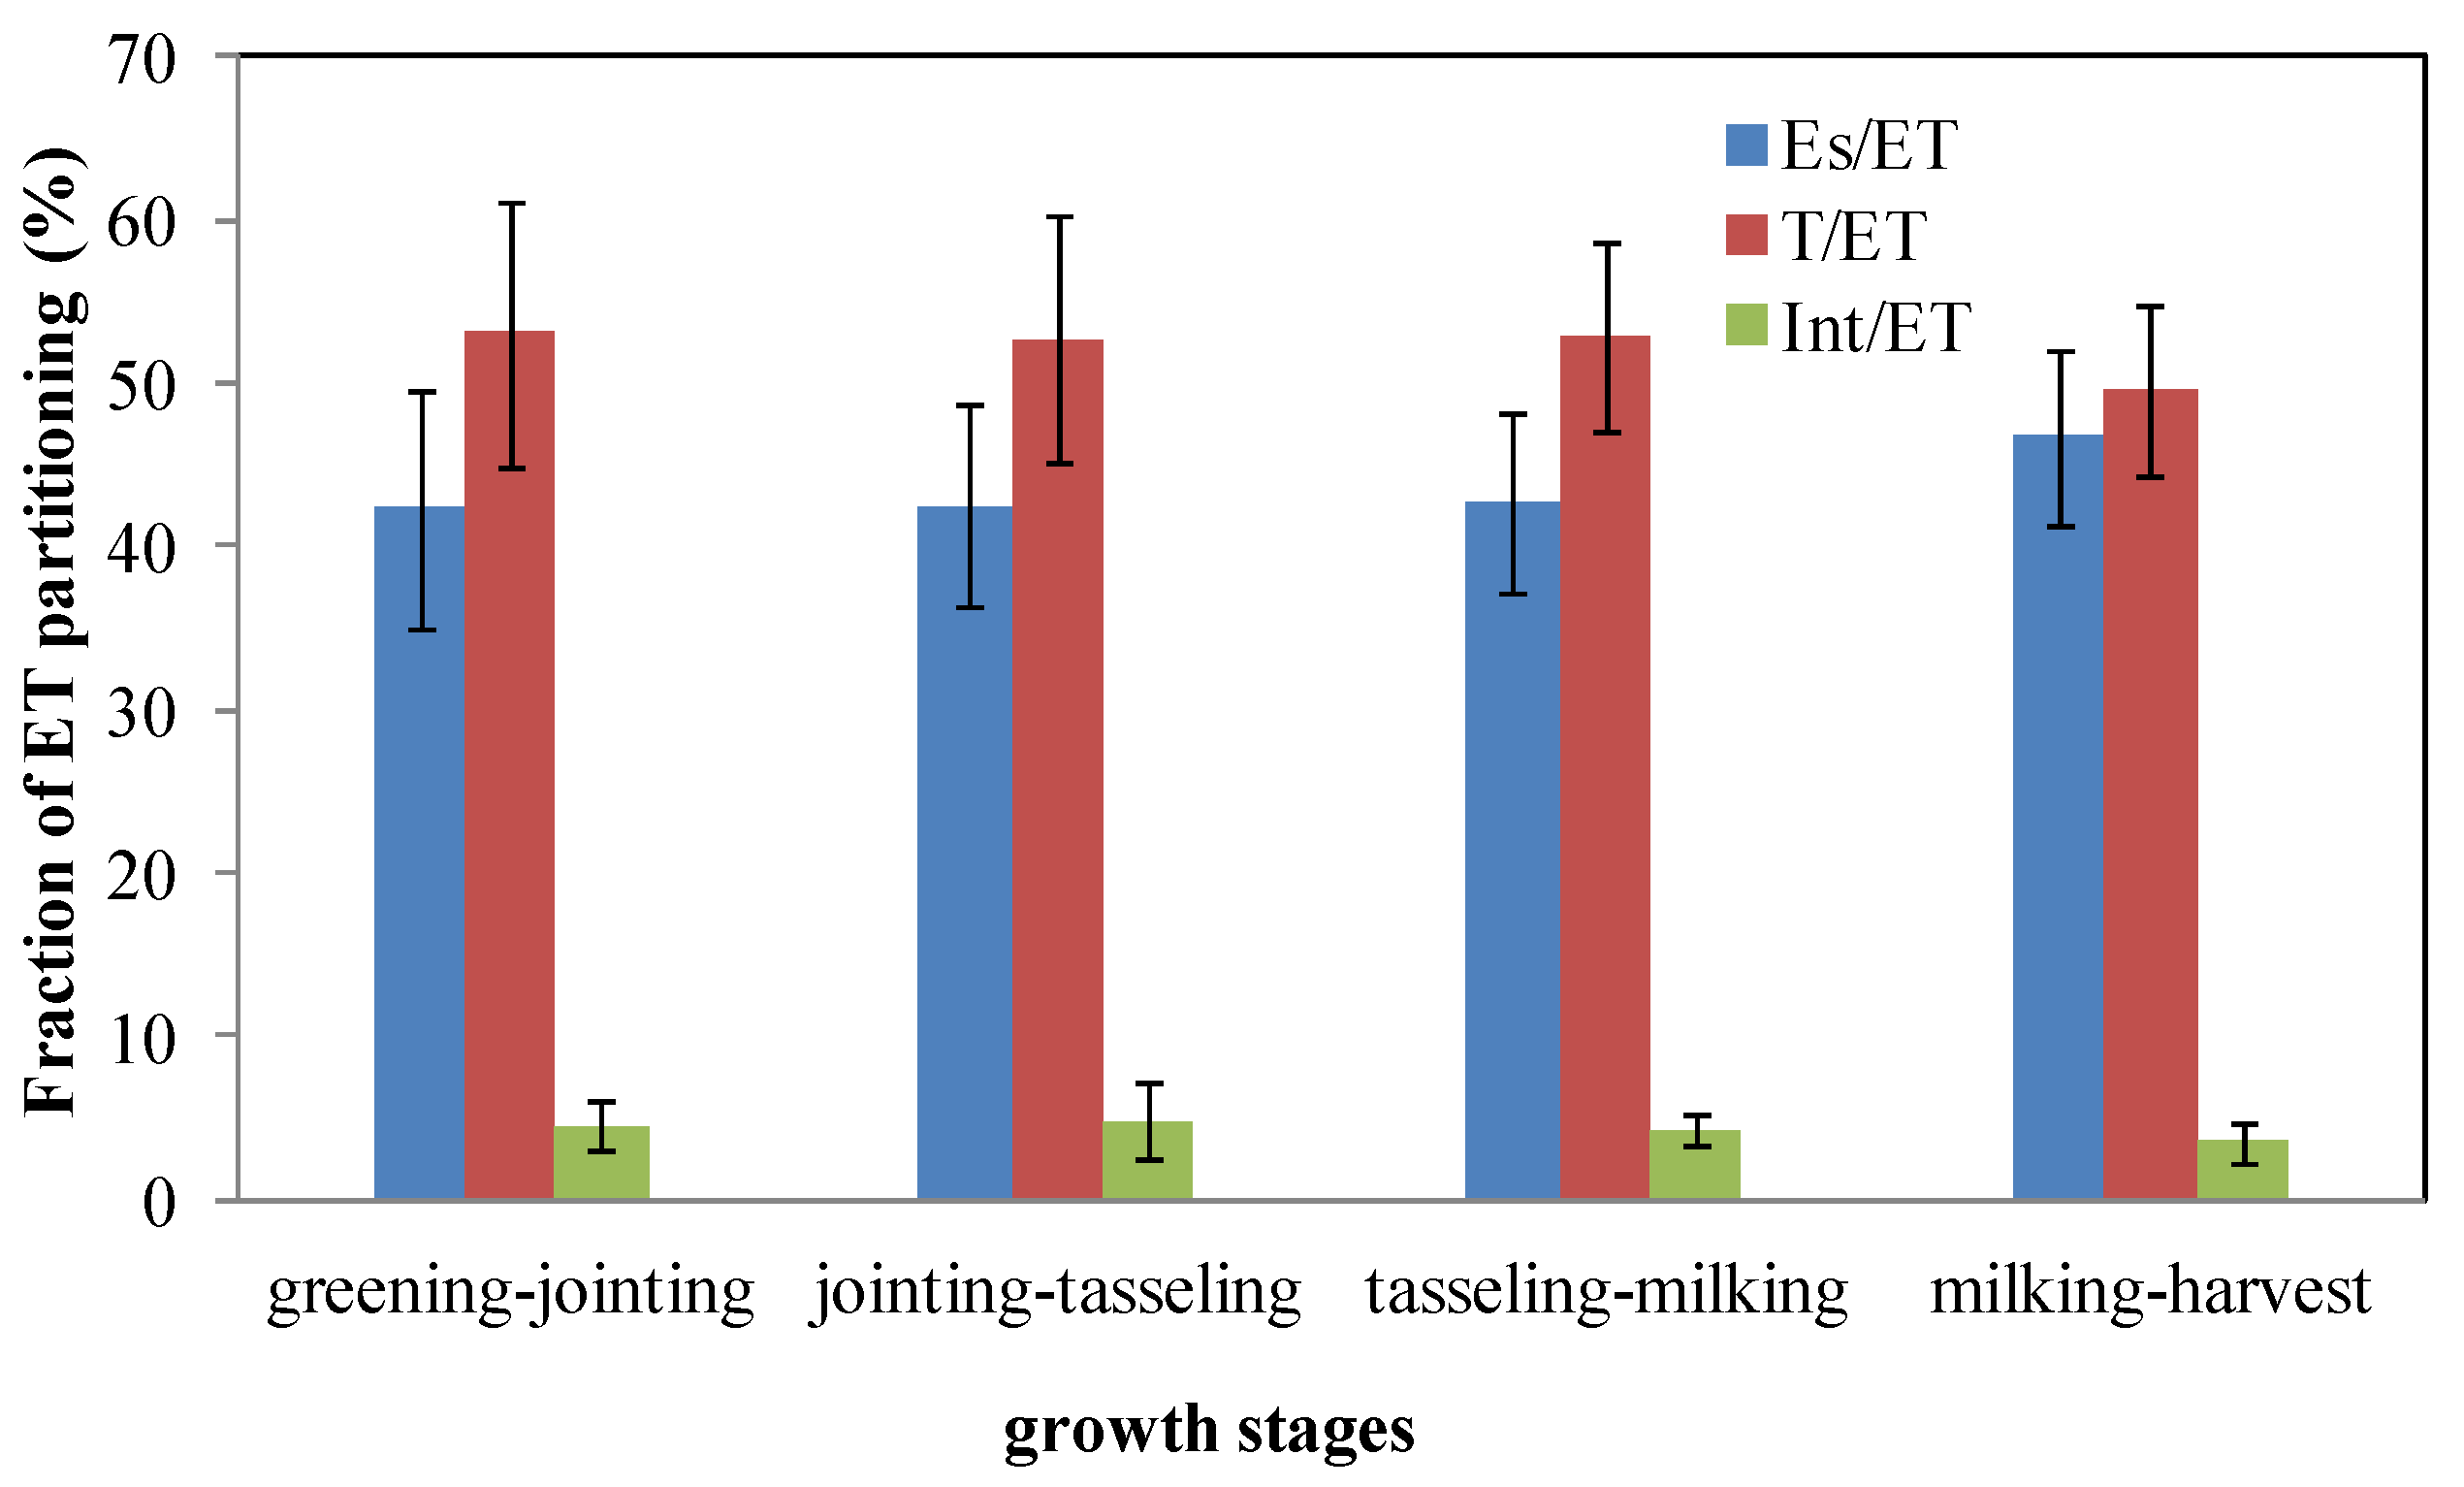
3.3.3. ET Partitioning in Different Maize Stages

To analyze the variation of ET partitioning in different maize growth stages, we combined the growth stages into four developmental stages: greening–jointing (11 May to 14 June), jointing–tasseling (15 June to 9 July), tasseling–milking (10 July to 17 August), and milking–harvest (18 August to 20 September), according to growth stage observations [34] for more than 30 years.
The average values of Es/ET, T/ET, and Int/ET in the four stages (Figure 7) were 43.6%, 52.1%, and 4.3%, with an STDEV of 2.1%, 1.6%, and 0.5%, respectively. This means T was the main water loss during the maize growth stages. Es/ET increased a small amount over the growth of the maize. It was smallest at the greening–jointing stage, at 42.3%, and reached the maximum at the milking–harvest stage, at 46.8%. T/ET decreased a small amount over the growth of the maize. It was largest at the greening–jointing stage, at 53.1%, and reached the minimum at the milking–harvest stage, at 49.7%. Int/ET was the greatest at the jointing–tasseling stage, at 4.9%, and smallest at the milking–harvest stage, at 3.6%.

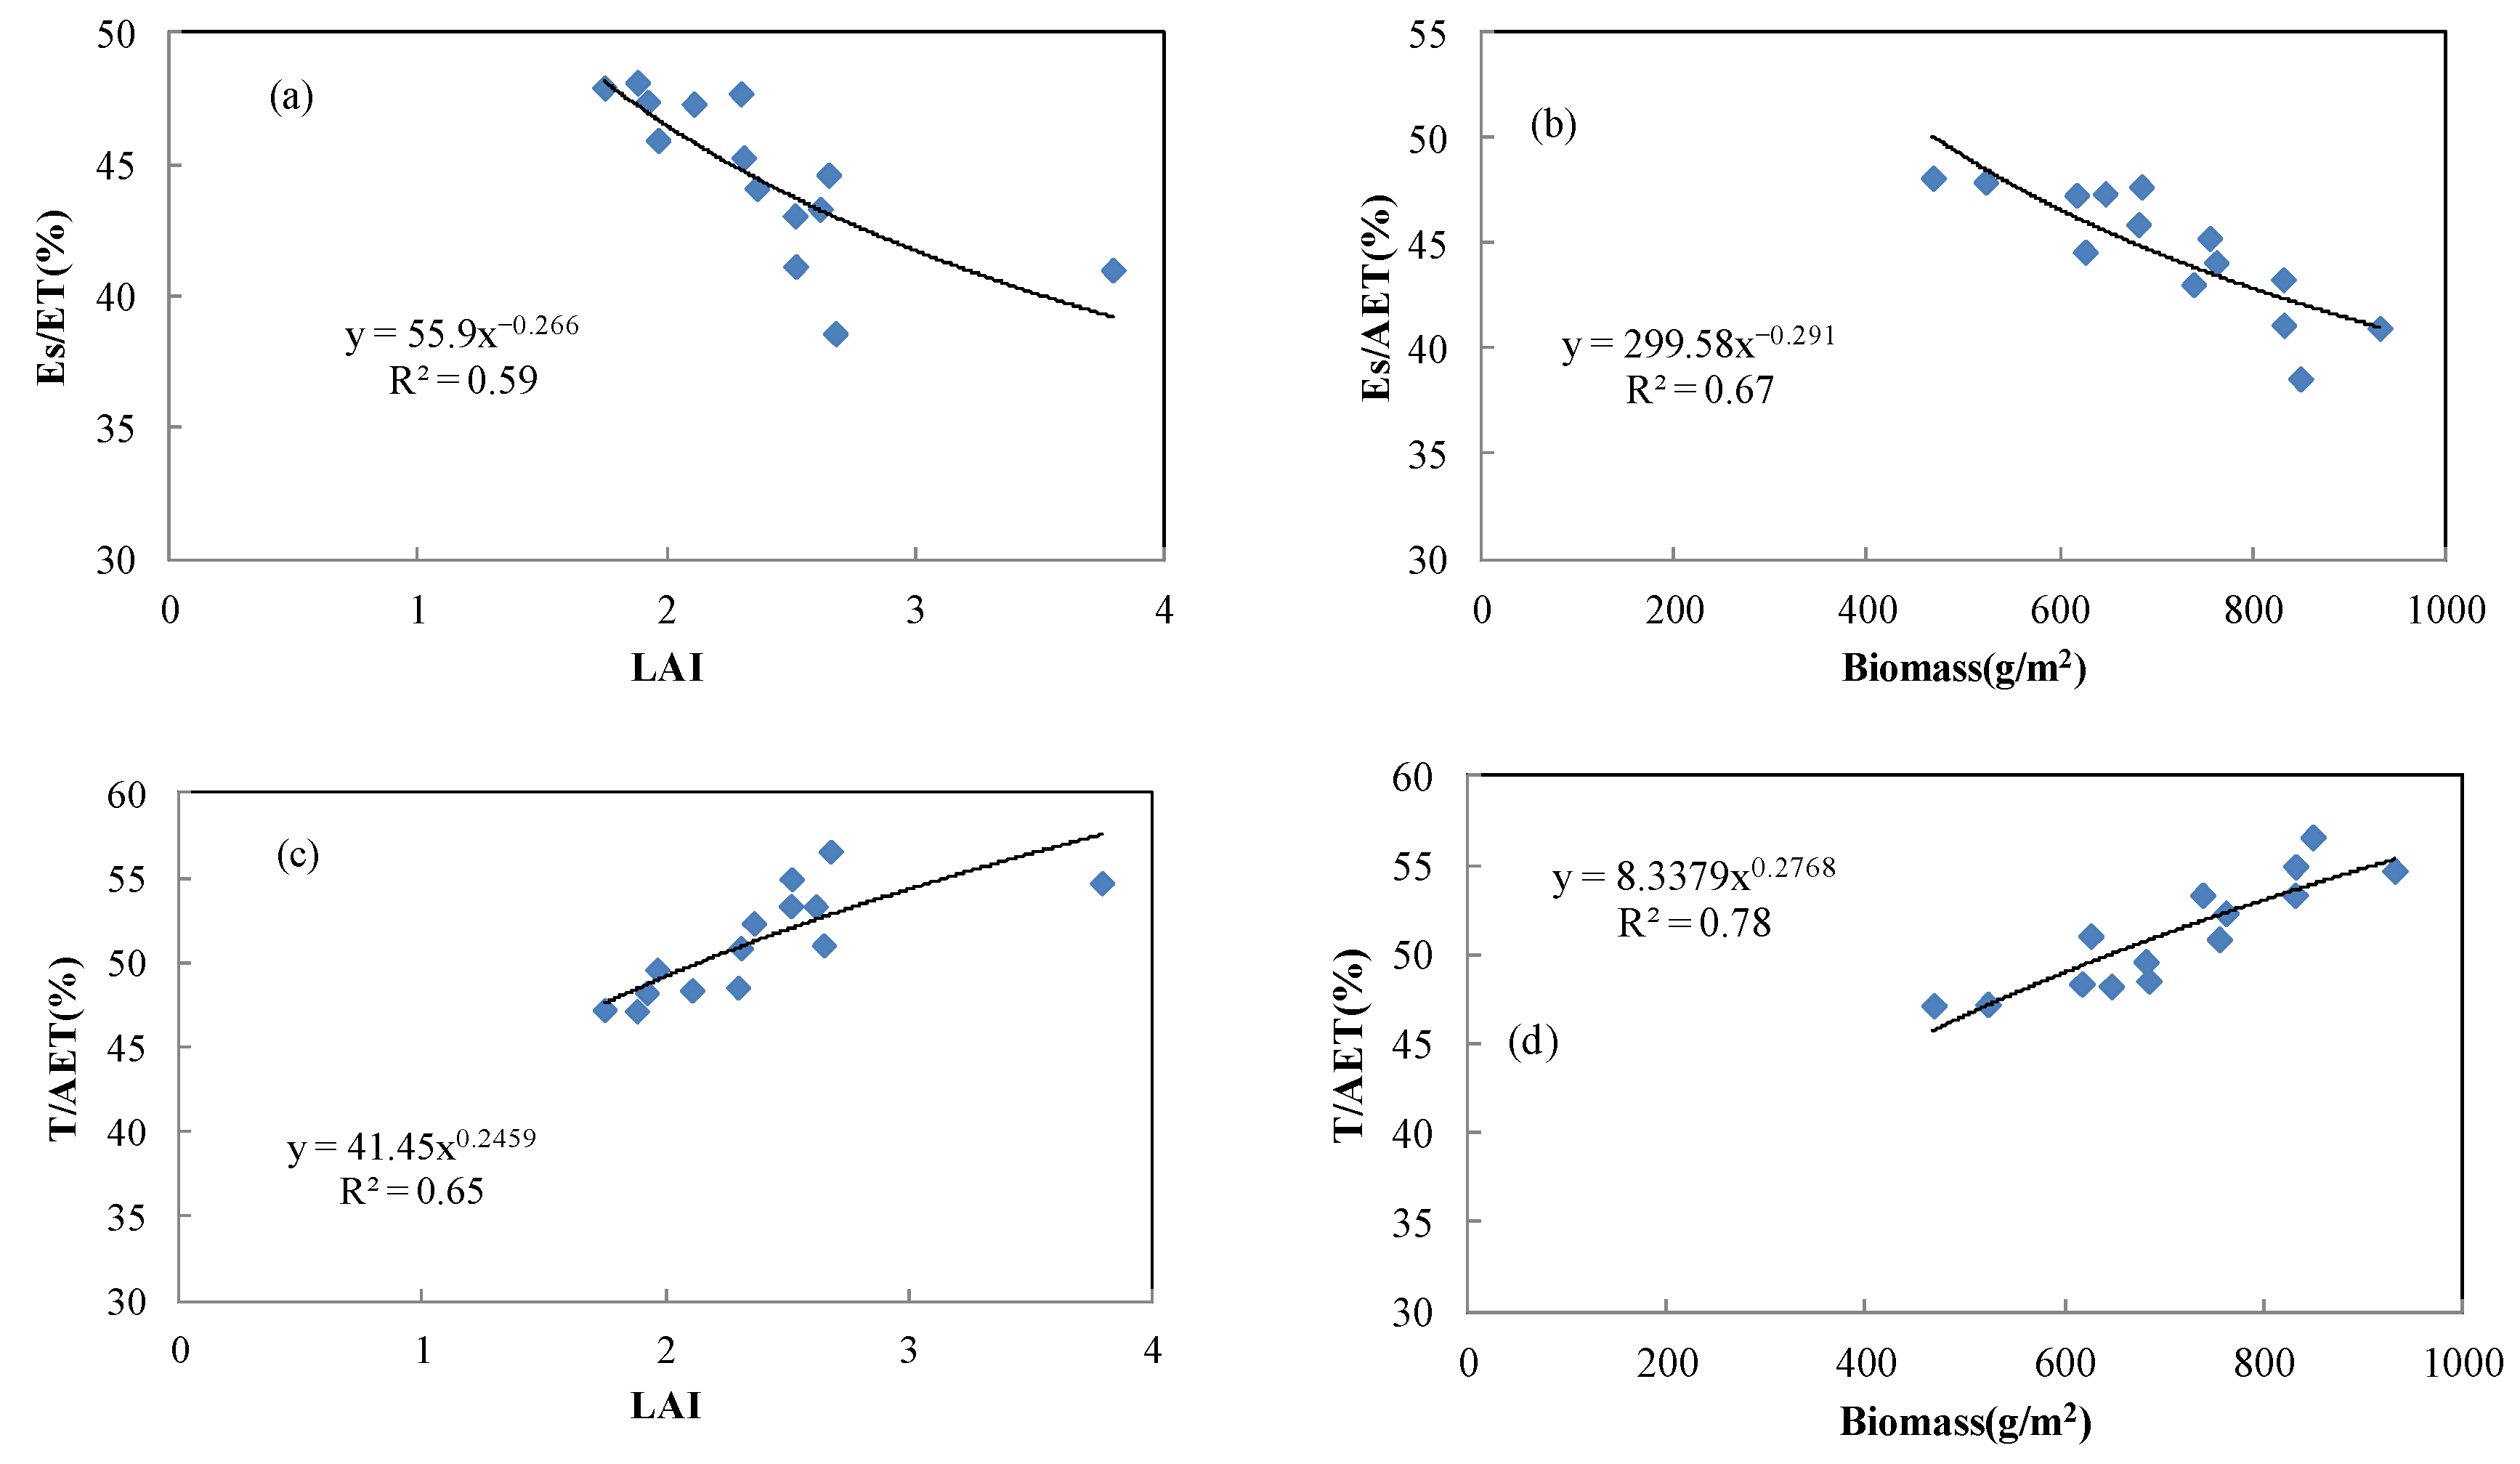
3.4. Relationships between LAI, Above-Ground Biomass, and Evapotranspiration Partitioning

We conducted a regression analysis of the average ratio of ET partitioning (Es/ET) with LAI and above-ground biomass during the growing season. Es/ET decreased with both the increase of LAI and above-ground biomass (Figure 8a,b). There was a power function relationship between them (R2 was 0.59 and 0.67, respectively, for LAI and biomass). T/ET increased as both LAI and above-ground biomass increased (Figure 8c,d). There was also a power function between LAI and biomass (R2 was 0.65 and 0.78, respectively). However, there was no relationship between Int/ET and LAI or biomass (R2 was 0.10 and 0.24, respectively, for LAI and biomass). The effects of biomass on evapotranspiration partitioning were greater than LAI.

4. Discussion

4.1. Simulation of SOILWAT2 Model

The SOILWAT2 water balance model has been widely used to simulate ET and water balance in a range of dryland ecosystems globally, including dry grasslands, big sagebrush ecosystems [20], croplands [35], low-elevation forests [17], degraded meadows, and artificial pastures [21,22].
To verify the performance of SOILWAT2 over the rainfed maize farmland, we compared the ET estimated by SOILWAT2 (ETSW) to that measured by the eddy covariance method (ETEC) (Figure 2). Overall, there was a good agreement between ETSW and ETEC in the study period (R2 = 0.64). ETSW underestimated ET compared to ETEC. Zhang et al. [22] also found that the results of the SOILWAT2 model were not significantly different from the EC-observed values (y = 0.78x − 0.02, R2 = 0.54) in a degraded meadow. This R2 was lower than for the Shuttleworth–Wallace energy balance model (R2 = 0.81) because the EC method is also based on the energy balance principle. SOILWAT2 performed well for the simulation of ET because it considers water balance explicitly. In addition to ET, it also calculated the daily vertical soil water movement using the soil’s physical properties. Water exited the SOILWAT2 soil profile through ET and deep drainage (Appendix S1 of [20]). Compared with MERRA-2 ET data [21], ET simulated by SOILWAT2 had a good linear relationship with R2 ranging from 0.86 to 0.88 for a degraded meadow and from 0.95 to 0.96 for an artificial pasture.

4.2. Evapotranspiration Partitioning of Maize

ET partitioning of maize varied over growth stages, seasons, and years [36,37,38]. Interception was an important part of rainfall that returned to the atmosphere. For maize farmlands, interception by maize canopies can reduce natural rainfall by 19.9% and for global crop canopies it was 11–32% of rainfall [28,39]. In our study, growing season Int/ET varied from 0.7% to 7.0%, with an average of 3.7%. T/ET varied from 40.0% to 75.0%, with an average of 57.0%. The large seasonal variability in daily T/ET was also found within maize fields (52.0–96.0%) using an isotopic technique in China [9,40]. By using N18 and a newly developed method, Hu and Lei [41] found that the multi-year mean growing season T/ET (±standard deviation) was 72.0% ± 3% for maize. The ratio of T/ET was smaller in our study because we calculated T/ET from DOY 121 to 273. LAI in our study was low before the jointing stage (DOY 164) and after DOY 229 when maize had completed the milking stage. On the other hand, we partitioned ET into T, Es, and Int, while Hu and Lei [41] did not consider canopy interception evaporation. Zheng et al. [29] partitioned ET into T, Es, and Int in rainfed maize fields under four mulching conditions in Northwest China, reporting that T/ET ranged from 52.4% to 73.2%, Es/ET ranged from 11.3% to 34.5%, and Int/ET ranged from 13.0% to 19.3%, which were similar to our results.

4.3. Factors Affecting Evapotranspiration Partitioning

Many factors affect ET partitioning including vegetation, meteorology, and soil. Vegetation plays a key role in ecosystem water balance through its effects on the soil–vegetation–atmosphere continuum and has a significant impact on ET partitioning [42]. LAI has been recognized as the main driving factor of ET partitioning by many researchers [43,44]. As LAI increases, T/ET will also increase [45]. We found a similar relationship between LAI and T/ET (Figure 8). Furthermore, we found a power function relationship between them (R2 was 0.65). Ma and Song [46] also reported a power function relationship between T/ET and LAI using stable isotopes in winter wheat cropland. However, some studies have found that evapotranspiration partitioning was not sensitive to LAI [47]. Li et al. [48] reported that LAI could only explain 20% of annual A/ET, but that T/ET and LAI showed a nonlinear increase on the seasonal scale. At our study site, there was also a power function between ET partitioning and above-ground biomass (Figure 8) and the correlation coefficient was higher than with LAI. Zhang et al. [21] found that T/ET in an artificial pasture was a linear function of biomass (R2 = 0.96), while no such strong relationship held for a degraded meadow (R2 = 0.43).
Many studies have reported that ET partitioning depended on the local climate. Niu et al. [49] indicated that climate change explained 36.8% of the change in T/ET. In our study, T/ET was higher in the drought years than in the humid years, and T/ET was also higher than Es/ET. Scott and Biederman [50] reported that T/ET was higher in arid regions. Zhang et al. [51] found that the contribution of T was smaller than E in a wetland ecosystem under a drought climate. Li et al. [48] suggested that the effects of precipitation on T/ET were small.

5. Conclusions

We estimated ET and its partitioning using a water balance model, SOILWAT2, in a rainfed maize farmland in Northeast China. We compared our simulated results with data obtained from eddy covariance measurements. This validation confirmed the good performance of the SOILWAT2 model for the prediction of ET and its partitioning in this study.
Annual change in ET and its partitioning approximately followed a parabolic shape with large day-to-day variation during the growing season (May to September). The mean yearly value of ET, T, Es, and Int were 432.3 mm, 197.6 mm, 204.7 mm and 19.2 mm, respectively, over 30 years, and their maximum daily values were 3.0 mm, 1.6 mm, 1.4 mm, and 0.2 mm, respectively. ET partitioning varied among years, seasons, and maize growth stages. Es/ET was higher (6.3%) in humid years than in drought years, and T/ET was the opposite. Transpiration was the main water loss in drought years. There was no clear difference in Int/ET between humid and drought years. During the year, Es/ET was large in the non-growing season and low in the growing season. Seasonal variation of T/ET and Int/ET were opposite to that of Es/ET. During the growing season [DOY 121-273], T/ET varied from 40.0% to 75.0%, Es/ET varied from 22.8% to 55.7%, and Int/ET varied from 0.7% to 7.0%. T/ET decreased along with the growth of maize, and it was greatest at the greening–jointing stage. Es/ET slowly increased along with the growth of maize and was smallest at the greening–jointing stage. Int/ET was largest at the jointing–tasseling stage (4.9%) and smallest at the milking–harvest stage (3.6%).
We found a power function relationship between T/ET and Es/ET and both LAI and above-ground biomass. The relationship between ET partitioning and above-ground biomass was much stronger than with LAI.

Author Contributions

Conceptualization, N.C., W.K.L. and N.M.; methodology, N.C., L.Z. and W.K.L.; data collection, N.C., N.M. and R.J.; data analysis, N.C., L.Z. and D.R.S.; writing, review and editing, N.C., N.M., W.K.L. and Y.Z.; supervision, W.K.L. and N.M. All authors have read and agreed to the published version of the manuscript.

Funding

This work was funded by the Liaoning Province Natural Science Foundation (2021-MS-358), the Shenyang Science and Technology Talents Project (RC210326), the Surplus fund items of the Institute of Atmospheric Environment, China Meteorological Administration, Shenyang (2022SYIAEJY10), and the National Natural Science Foundation of China (41705094, 41975149, 42275202).

Institutional Review Board Statement

Not applicable.

Informed Consent Statement

Not applicable.

Data Availability Statement

The data in this study are available from the corresponding authors upon request.

Acknowledgments

We thank the School of the Environment, Yale University.

Conflicts of Interest

The authors declare no conflict of interest.

References

  1. Burchard-Levine, V.; Nieto, H.; Kustas, W.P.; Gao, F.; Alfieri, J.G.; Prueger, J.H.; Hipps, L.E.; Bambach-Ortiz, N.; McElrone, A.J.; Castro, S.J.; et al. Application of a remote-sensing three-source energy balance model to improve evapotranspiration partitioning in vineyards. Irrig. Sci. 2022, 40, 593–608. [Google Scholar] [CrossRef] [PubMed]
  2. Kool, D.; Agam, N.; Lazarovitch, N.; Heitman, J.L.; Sauer, T.J.; Ben-Gal, A. A review of approaches for evapotranspiration partitioning. Agric. For. Meteorol. 2014, 184, 56–70. [Google Scholar] [CrossRef]
  3. Ren, X.; Lu, Q.; He, H.; Zhang, L.; Niu, Z. Estimation and analysis of the ratio of transpiration to evapotranspiration in forest ecosystems along the North-South Transect of East China. J. Geogr. Sci. 2019, 29, 1807–1822. [Google Scholar] [CrossRef] [Green Version]
  4. Bao, Y.; Duan, L.; Tong, X.; Liu, T.; Wang, G.; Zhang, L.; Singh, V.P. Simulation and partition evapotranspiration for the representative landform-soil-vegetation formations in Horqin Sandy Land, China. Theor. Appl. Climatol. 2020, 140, 1221–1232. [Google Scholar] [CrossRef]
  5. Bambach, N.; Kustas, W.; Alfieri, J.; Prueger, J.; Hipps, L.; McKee, L.; Castro, S.J.; Volk, J.; Alsina, M.M.; McElrone, A.J. Evapotranspiration uncertainty at micrometeorological scales: The impact of the eddy covariance energy imbalance and correction methods. Irrig. Sci. 2022, 40, 445–461. [Google Scholar] [CrossRef]
  6. Lai, J.; Liu, T.; Luo, Y. Evapotranspiration partitioning for winter wheat with shallow groundwater in the lower reach of the Yellow River Basin. Agr. Water Manag. 2022, 266, 107561. [Google Scholar] [CrossRef]
  7. Lei, H.; Yang, D. Interannual and seasonal variability in evapotranspiration and energy partitioning over an irrigated cropland in the North China Plain. Agric. For. Meteorol. 2010, 150, 581–589. [Google Scholar] [CrossRef]
  8. Zuniga, M.; Ortega-Farías, S.; Poblete-Echeverría, C. Use of sap flow sensors to determine transpiration of a young drip-irrigated olive orchard (‘Arbequina’) under semi-arid conditions. Acta Hortic. 2014, 1057, 405–410. [Google Scholar] [CrossRef]
  9. Wen, X.; Yang, B.; Sun, X.; Lee, X. Evapotranspiration partitioning through in-situ oxygen isotope measurements in an oasis cropland. Agric. For. Meteorol. 2016, 230–231, 89–96. [Google Scholar] [CrossRef] [Green Version]
  10. Han, J.; Tian, L.; Cai, Z. Season-specific evapotranspiration partitioning using dual water isotopes in a Pinus yunnanensis ecosystem, southwest China. J. Hydrol. 2022, 608, 127672. [Google Scholar] [CrossRef]
  11. Yuan, Y.; Wang, L.; Wang, H. A modified isotope-based method for potential high-frequency evapotranspiration partitioning. Adv. Water Resour. 2022, 160, 104103. [Google Scholar] [CrossRef]
  12. Xu, T.; Bateni, S.M.; Margulis, S.A.; Song, L.; Liu, S.; Xu, Z. Partitioning evapotranspiration into soil evaporation and canopy transpiration via a two-source variational data assimilation system. J. Hydrometeorol. 2016, 17, 2353–2370. [Google Scholar] [CrossRef]
  13. Yang, B.; Wang, P.; You, D.; Liu, W. Coupling evapotranspiration partitioning with root water uptake to identify the water consumption characteristics of winter wheat: A case study in the North China Plain. Agric. For. Meteorol. 2018, 259, 296–304. [Google Scholar] [CrossRef]
  14. Chen, H.; Huang, J.J.; McBean, E. Partitioning of daily evapotranspiration using a modified shuttleworth-wallace model, random forest and support vector regression, for a cabbage farmland. Agricu. Water Manag. 2020, 228, 105923. [Google Scholar] [CrossRef]
  15. Hadiwijaya, B.; Isabelle, P.-E.; Nadeau, D.F.; Pepin, S. Can a physically-based land surface model accurately represent evapotranspiration partitioning? A case study in a humid boreal forest. Agric. For. Meteorol. 2021, 304–305, 108410. [Google Scholar] [CrossRef]
  16. Jiang, S.; Liang, C.; Zhao, L. Energy and evapotranspiration partitioning over a humid region orchard: Field measurements and partitioning model comparisons. J. Hydrol. 2022, 610, 127890. [Google Scholar] [CrossRef]
  17. Bradford, M.A.; Warren, R.J.; Baldrian, P.; Crowther, T.W.; Maynard, D.S.; Oldfield, E.E.; Wieder, W.R.; Wood, S.A.; King, J.R. Climate fails to predict wood decomposition at regional scales. Nat. Clim. Chang. 2014, 4, 625–630. [Google Scholar] [CrossRef] [Green Version]
  18. Palmquist, K.A.; Schlaepfer, D.R.; Bradford, J.B. Spatial and ecological variation in dryland ecohydrological responses to climate change: Implications for management. Ecosphere 2016, 7, e01590. [Google Scholar] [CrossRef]
  19. Schlaepfer, D.R.; Bradford, J.B.; Lauenroth, W.K.; Munson, S.M.; Tietjen, B.; Hall, S.A.; Wilson, S.D.; Duniway, M.C.; Jia, G.; Pyke, D.A. Climate change reduces extent of temperate drylands and intensifies drought in deep soils. Nat. Commun. 2017, 8, 14196. [Google Scholar] [CrossRef] [Green Version]
  20. Palmquist, K.A.; Bradford, J.B.; Martyn, T.E.; Schlaepfer, D.R.; Lauenroth, W.K. STEPWAT2: An individual-based model for exploring the impact of climate and disturbance on dryland plant communities. Ecosphere 2018, 9, e02394. [Google Scholar] [CrossRef] [Green Version]
  21. Zhang, L.; Schlaepfer, D.R.; Chen, N.; Lauenroth, W.K.; Gu, S. Comparison of ET partitioning and water balance between degraded meadow and artificial pasture in three-river source region on the Qinghai-Tibetan Plateau. Ecohydrology 2021, 14, e2329. [Google Scholar] [CrossRef]
  22. Zhang, L.; Schlaepfer, D.R.; Chen, Z.; Zhao, L.; Li, Q.; Gu, S.; Lauenroth, W.K. Precipitation and evapotranspiration partitioning on the Three-River Source Region: A comparison between water balance and energy balance models. J. Hydrol. Reg. Stud. 2021, 38, 100936. [Google Scholar] [CrossRef]
  23. Mi, N.; Cai, F.; Zhang, S.; Zhang, Y.; Ji, R.; Chen, N.; Ji, Y.; Wang, D. Thermal time requirements for maize growth in northeast China and their effects on yield andwater supply under climate change conditions. Water 2021, 13, 2612. [Google Scholar] [CrossRef]
  24. Liu, Z.; Yang, X.; Lin, X.; Hubbard, K.G.; Lv, S.; Wang, J. Narrowing the agronomic yield gaps of maize by improved soil, cultivar, and agricultural management practices in different climate zones of northeast China. Earth Interact. 2016, 20, 1–18. [Google Scholar] [CrossRef] [Green Version]
  25. Wang, P.; Yamanaka, T.; Li, X.Y.; Wei, Z. Partitioning evapotranspiration in a temperate grassland ecosystem: Numerical modeling with isotopic tracers. Agric. For. Meteorol. 2015, 208, 16–31. [Google Scholar] [CrossRef]
  26. Chen, N.; Zhang, Y.; Jin, C.; Wang, A.; Guan, D.; Tian, L. Intercomparison of three methods to estimate evapotranspiration over temperate meadow in Inner Mongolia: Penman–Monteith, Makkink and Priestley-Taylor equation. Water Environ. J. 2018, 32, 500–507. [Google Scholar] [CrossRef]
  27. Chen, N.; Zhang, Y.; Jin, C.; Wang, A.; Guan, D.; Mi, N.; Zhou, B. Performance of Priestley-Taylor model for estimating evaporation with and without snow coverage over a temperate meadow in Inner Mongolia, China. Water Environ. J. 2019, 33, 241–251. [Google Scholar] [CrossRef]
  28. Nazari, M.; Sadeghi, S.M.M.; Stan, J.T.V.; Chaichi, M.R. Rainfall interception and redistribution by maize farmland in central Iran. J. Hydrol. Reg. Stud. 2020, 27, 100656. [Google Scholar] [CrossRef]
  29. Zheng, J.; Fan, J.; Zhang, F.; Zhuang, Q. Evapotranspiration partitioning and water productivity of rainfed maize under contrasting mulching conditions in Northwest China. Agric. Water Manag. 2021, 243, 106473. [Google Scholar] [CrossRef]
  30. Cai, F.; Ming, H.; Mi, N.; Xie, Y.; Zhang, Y. Comparison of effects of root water uptake functions for simulating surface water and heat fluxes within a corn farmland ecosystem in Northeast China. J. Irrig. Drain. Eng. 2017, 143, 04017040. [Google Scholar] [CrossRef]
  31. Schlaepfer, D.R.; Murphy, R. rSOILWAT2: An Ecohydrological Ecosystem-Scale Water Balance Simulation Model; R Package Version 3.4.0, Github Repositories. 2018. Available online: https://www.r-project.org/ (accessed on 30 January 2023).
  32. Parton, W.J. Abiotic Section of ELM. In Grassland Simulation Model; Innis, G.S., Ed.; volume 26 of Ecological Studies; Springer: New York, NY, USA, 1978; pp. 31–53. [Google Scholar]
  33. McKee, T.; Doesken, N.J.; Kleist, J. The relationship of drought frequency and duration to time scales. In Proceedings of the 8th Conference of Applied Climatology, Anaheim, CA, USA, 17–22 January 1993; American Meteorological Society: Boston, MA, USA, 1993; pp. 179–184. [Google Scholar]
  34. China Meteorological Administration. Specifications for Agrometeorological Observation; China Meteorological Press: Beijing, China, 1993. (In Chinese) [Google Scholar]
  35. Bradford, J.B.; Schlaepfer, D.R.; Lauenroth, W.K.; Yackulic, C.B.; Duniway, M.; Hall, S.; Jia, G.; Jamiyansharav, K.; Munson, S.M.; Wilson, S.D. Future soil moisture and temperature extremes imply expanding suitability for rainfed agriculture in temperate drylands. Sci. Rep. 2017, 7, 12923. [Google Scholar] [CrossRef] [Green Version]
  36. Ding, R.; Kang, S.; Zhang, Y.; Hao, X.; Tong, L.; Du, T. Partitioning evapotranspiration into soil evaporation and transpiration using a modified dual crop coefficient model in irrigated maize field with ground-mulching. Agric. Water Manag. 2017, 127, 85–96. [Google Scholar] [CrossRef]
  37. Fang, H.; Li, Y.; Gu, X.; Yu, M.; Li, Y. Evapotranspiration partitioning, water use efficiency, and maize yield under different film mulching and nitrogen application in northwest China. Field Crop. Res. 2021, 264, 108103. [Google Scholar] [CrossRef]
  38. Gao, G.; Wang, D.; Zha, T.; Wang, L.; Fu, B. A global synthesis of transpiration rate and evapotranspiration partitioning in the shrub ecosystems. J. Hydrol. 2022, 606, 127417. [Google Scholar] [CrossRef]
  39. Lin, M.; Sadeghi, S.M.M.; Stan, J.T.V. Partitioning of rainfall and sprinkler-irrigation by crop canopies: A global review and evaluation of available research. Hydrology 2020, 7, 76. [Google Scholar] [CrossRef]
  40. Wu, Y.; Du, T.; Ding, R.; Tong, L.; Li, S.; Wang, L. Multiple methods to partition evapotranspiration in a maize field. J. Hydrometeorol. 2017, 18, 139–149. [Google Scholar] [CrossRef] [Green Version]
  41. Hu, X.; Lei, H. Evapotranspiration partitioning and its interannual variability over a winter wheat-summer maize rotation system in the North China Plain. Agric. For. Meteorol. 2021, 310, 108635. [Google Scholar] [CrossRef]
  42. García-Leoz, V.; Villegas, J.C.; Suescún, D.; Flórez, C.P.; Merino-Martín, L.; Betancur, T.; León, J.D. Land cover effects on water balance partitioning in the Colombian Andes: Improved water availability in early stages of natural vegetation recovery. Reg. Environ. Chang. 2018, 18, 1117–1129. [Google Scholar] [CrossRef]
  43. Wang, L.; Good, S.P.; Caylor, K.K. Global synthesis of vegetation control on evapotranspiration partitioning. Geophys. Res. Lett. 2014, 41, 6753–6757. [Google Scholar] [CrossRef]
  44. Lian, X.; Piao, S.L.; Huntingford, C.; Li, Y.; Zeng, Z.; Wang, X.; Ciais, P.; McVicar, T.R.; Peng, S.; Ottlé, C. Partitioning global land evapotranspiration using CMIP5 models contrained by observations. Nat. Clim. Chang. 2018, 8, 640–646. [Google Scholar] [CrossRef]
  45. Alam, M.S.; Lamb, D.W.; Rahman, M.M. In-situ partitioning of evaporation and transpiration components using a portable evapotranspiration dome—A case study in Tall Fescue (Festuca arundinacea). Agri. Water Manag. 2018, 213, 352–357. [Google Scholar] [CrossRef]
  46. Ma, Y.; Song, X.F. Applying stable isotopes to determine seasonal variability in evapotranspiration partitioning of winter wheat for optimizing agricultural management practices. Sci. Total Environ. 2019, 654, 633–642. [Google Scholar] [CrossRef] [PubMed]
  47. Fatichi, S.; Pappas, C. Constrained variability of modeled T:ET ratio across biome. Geophys. Res. Lett. 2017, 44, 6795–6803. [Google Scholar] [CrossRef]
  48. Li, X.; Gentine, P.; Lin, C.; Zhou, S.; Sun, Z.; Zheng, Y.; Liu, J.; Zheng, C. A simple and objective method to partition evapotranspiration into transpiration and evaporation at eddy-covariance sites. Agric. For. Meteorol. 2019, 265, 171–182. [Google Scholar] [CrossRef]
  49. Niu, Z.; He, H.; Zhu, G.; Ren, X.; Zhang, L.; Zhang, K.; Yu, G.; Ge, R.; Li, P.; Zeng, N.; et al. An increasing trend in the ratio of transpiration to total terrestrial evapotranspiration in China from 1982 to 2015 caused by greening and warming. Agric. For. Meteorol. 2019, 279, 107701. [Google Scholar] [CrossRef]
  50. Scott, R.L.; Biederman, J.A. Partitioning evapotranspiration using long-term carbon dioxide and water vapor fluxes. Geophys. Res. Lett. 2017, 44, 6833–6840. [Google Scholar] [CrossRef]
  51. Zhang, J.; Zhang, S.; Zhang, W.; Liu, B.; Gong, C.; Jiang, M.; Lv, X.; Sheng, L. Partitioning daily evapotranspiration from a marsh wetland using stable isotopes in a semiarid region. Hydrol. Res. 2018, 49, 1005–1015. [Google Scholar] [CrossRef]
Figure 1. Location of the study site in the maize belt of northeast China.
Water 15 00869 g001
Figure 2. Comparison between SOILWAT2 based daily ET (ETSW) versus eddy covariance-based values (ETEC) for the period from May to September, 2016–2018. The dashed lines represent the 1:1 relation.
Water 15 00869 g002
Figure 3. Mean daily precipitation (PPT), temperature (T), and potential evapotranspiration (PET) in rainfed maize farmland from 1989 to 2018. DOY is the day of the year, counting the number of days from January 1 of the current year, the same as follows.
Water 15 00869 g003
Figure 4. Evapotranspiration and its components estimated by the SOILWAT2 model in rainfed maize farmland during the year.
Water 15 00869 g004
Figure 5. Fraction of AET partitioning in rainfed maize farmland during humid and drought years (a) Es/AET (b) T/AET (c) Int/AET.
Water 15 00869 g005
Figure 6. Fraction of ET partitioning in rainfed maize farmland during the year.
Water 15 00869 g006
Figure 7. Fraction of ET partitioning in rainfed maize farmland during different maize growth stages.
Water 15 00869 g007
Figure 8. Relationships between LAI, above ground biomass, and evapotranspiration partitioning. (a) LAI and Es/AET, (b) above ground biomass and Es/AET, (c) LAI and T/AET, and (d) above ground biomass and T/AET.
Water 15 00869 g008
Table 1. Description of eddy covariance and microclimatic and solar radiation instruments.
Measurement FactorsInstrumentHeights
Air humidity and temperatureHMP60C, Vaisala, Helsinki, Finland4.2 m
PrecipitationTE525MM, Campbell Scientific, Logan, UT, USA1.5 m
Photosynthetic active radiationLI190SB, LiCor Inc., Lincoln, NE, USA4.2 m
Net radiationNR01, Hukseflux, Delft, The Netherlands4.2 m
Soil moistureML2, DELTA-T, Inc., Cambridge, UK0, 5, 10, 20, and 40 cm below ground
Soil temperatureTM-L20, DYNAMAX, Inc., Elkhart, IN, USA0, 5, 10, 20, and 40 cm below ground
Soil heat fluxHFP01, HukseFlux, Delft, The Netherlands5 cm below ground
Latent heat flux Sensible heat fluxCSAT3, Campbell Scientific, Logan, UT, USALi-7500, LiCor Inc., Lincoln, NE, USA4.2 m
Data collector and communicationModel CR1000, Campbell Scientific, Logan, UT, USA
Table 2. Evapotranspiration and its components estimated by the SOILWAT2 model in rainfed maize farmland from 1989 to 2018.
YearAET
(mm)
AET/
PPT(%)
Es
(mm)
Es/
AET (%)
T
(mm)
T/
AET (%)
Int
(mm)
Int/
AET (%)
1989338.3 94.7 153.6 45.4 162.9 48.2 17.4 5.1
1990517.8 72.7 265.9 51.4 210.5 40.6 23.7 4.6
1991476.6 61.1 227.3 47.7 217.0 45.5 23.0 4.8
1992395.7 109.3 170.6 43.1 191.7 48.4 17.2 4.4
1993418.5 77.7 199.9 47.8 183.9 43.9 19.9 4.8
1994464.3 55.8 207.9 44.8 226.3 48.7 16.4 3.5
1995463.9 74.4 230.7 49.7 200.0 43.1 23.0 5.0
1996442.1 67.1 213.6 48.3 206.2 46.6 21.2 4.8
1997356.0 84.5 153.4 43.1 185.9 52.2 13.8 3.9
1998507.8 56.5 263.4 51.9 218.2 43.0 23.1 4.6
1999394.6 106.7 152.1 38.5 213.6 54.1 16.2 4.1
2000368.5 83.7 184.8 50.1 143.6 39.0 16.9 4.6
2001426.0 102.7 191.1 44.9 203.6 47.8 18.9 4.4
2002411.8 98.1 185.8 45.1 204.9 49.8 18.2 4.4
2003373.3 96.5 168.2 45.1 173.6 46.5 20.8 5.6
2004422.0 57.7 218.9 51.9 180.9 42.9 19.4 4.6
2005497.4 75.6 249.1 50.1 216.7 43.6 23.1 4.7
2006412.6 82.0 199.4 48.3 181.2 43.9 16.5 4.0
2007489.4 86.8 231.3 47.3 215.2 44.0 16.4 3.3
2008459.2 72.1 224.7 48.9 215.5 46.9 18.8 4.1
2009453.2 102.0 201.4 44.4 208.7 46.1 17.1 3.8
2010517.4 63.9 273.9 52.9 210.0 40.6 23.1 4.5
2011449.4 100.6 214.2 47.7 213.7 47.5 21.4 4.8
2012507.5 58.4 249.2 49.1 209.7 41.3 23.8 4.7
2013426.8 92.2 203.3 47.6 191.9 45.0 19.3 4.5
2014365.4 108.1 161.7 44.3 182.9 50.1 16.2 4.4
2015377.9 98.5 164.9 43.6 183.5 48.6 17.1 4.5
2016447.4 72.3 228.6 51.1 185.5 41.5 22.8 5.1
2017383.5 96.8 166.9 43.5 194.6 50.7 13.8 3.6
2018403.8 100.5 184.2 45.6 195.2 48.3 17.3 4.3
Average432.3 83.6 204.7 47.1 197.6 45.9 19.2 4.4
STDEV51.2 17.2 35.2 3.3 18.7 3.7 3.0 0.5
Disclaimer/Publisher’s Note: The statements, opinions and data contained in all publications are solely those of the individual author(s) and contributor(s) and not of MDPI and/or the editor(s). MDPI and/or the editor(s) disclaim responsibility for any injury to people or property resulting from any ideas, methods, instructions or products referred to in the content.

