
Morphometric Parameters and Geospatial Analysis for Flash Flood Susceptibility Assessment: A Case Study of Jeddah City along the Red Sea Coast, Saudi Arabia


Department of Civil Engineering, College of Engineering, King Saud University, P.O. Box 800, Riyadh 11421, Saudi Arabia
Water 2023, 15(5), 870; https://doi.org/10.3390/w15050870
Submission received: 21 January 2023
/
Revised: 18 February 2023
/
Accepted: 20 February 2023
/
Published: 23 February 2023
(This article belongs to the Special Issue Flood Frequency Analysis and Modelling)
Abstract
:Flash floods are one of the most common and destructive natural hazards, and recent flood events show their severe impact on Saudi Arabia. Flash floods are increasing year by year in duration and intensity, resulting in huge destructive impacts for the nation concerned. Anticipating the spatial patterns and occurrence of rainfall-induced floods is in high demand. Recent technique-based studies and their comprehensive results aid in understanding the flood potential of the drainage basins and in minimizing the risks of a threat to humans and of economic damage. Jeddah City is located at the western coast of the Red Sea in Saudi Arabia and is one of the most important coastal cities in the Arabian Kingdom. It has experienced several destructive flash flood events, particularly in 2009 and 2011, causing serious damage and significant loss of life. An analysis of the morphometric parameters using geospatial techniques provides significant insights into the hydrological response of the drainage basins to major heavy rainfall events. In this paper, two relative flood susceptibility scenarios were produced: drainage basin levels and very accurate pixel-level conditions. The morphometric comparison levels suggest that basins 1 and 7 are very high, whereas the other basins have moderate and low levels. The derived flood susceptibility map was integrated with the topographic position and wetness algorithms (TPI and TWI) through overlay processing. The integration analysis aids in realizing the relationship between the general basin morphometric characteristics and the in situ relief for producing the flood susceptibility spots over the entire basins. Thus, the method of this paper can be applied to evaluate the site-specific plan minimizing the effects of flash flood risks in similar areas.
1. Introduction
Natural hazards are global events that can reshape the landscape of the Earth and influence the human environment significantly. Although water is essential for the sustenance of life and the environment [1], sudden and huge amounts may cause a serious catastrophe. Flash floods are one of the most world’s deadliest hazards causing about 85% of flooding and more than 5000 deaths every year [2]. They also generate public health problems and unemployment, harm the ecosystems, affect socioeconomic conditions, etc. [3]. Recently, global and local institutions and scientific schools have been devoting more attention to evaluate risk management and build up complete adjustment plans, involving systems for flash flood prediction and advanced early warning systems with land-use planning and urbanization patterns in wake of urban flash flooding [3,4]. Globally, decision makers face significant difficulties mitigating the harmful effects of natural hazards and disasters. Accordingly, nations with stable economic structures and expert administrations suffer less severe socioeconomic damage than developing nations [3,5,6].
Worldwide, several countries suffer regularly from flash flood events. In European countries, just in the last four decades, flood events led to about 2466 recorded lives lost [7,8]. In Jordon, Ma’an City was flooded by the March 1966 flash flood event, which left around 200 fatalities and up to 250 people injured [9]. In addition, up to 3000 people became homeless, and most of the buildings were entirely destroyed [9,10]. Egypt has also reported many destructive flash flood events; for example, the Sinai Peninsula was attacked by the January 2010 event that caused many deaths and missing people [10,11,12]. Regarding areas eastward of the study region, flash flood events have been an interesting topic to discuss and manage. For example, Shiraz was hit by a strong flood on 25 March 2019 that caused 21 fatalities and around 164 injured [13]. After investigating this flood, the authors in Ref. [13] concluded that the Shiraz infrastructure was not suitable for strong flood control and must be expanded to facilitate water flow discharge from the basins. In August 2010, Pakistan was affected by one of the most serious flash floods in its long history that caused around 1800 deaths and about tens of billions of US dollars in economic damage [3]. During the last 5 years, Saudi Arabia has recorded many flood events destroying more than 10,000 homes and causing about 113 fatalities [14].
The Red Sea Coast and surroundings are among the most flood-prone regions in the world that have been affected by almost all kinds of flooding [15,16,17,18]. Having a long history of climate-related hazards, the Red Sea Coast of Saudi Arabia has witnessed various flood events in recent times. The many examples of flash flood events, such as in 1972, 1979, 1985, 2009, 2010, and 2011 (Table 1), are indications for the seriousness of destructive flash flooding during the last 50 years [14,19,20]. The two major flash floods recorded in November 2009 and January 2011 were the most destructive flash flood events that hit Jeddah and the regions of Makkah province during the last 15 years [14,20]. They affected more than 5 million people and caused 113 deaths and major damage to homes and infrastructure [14,20,21]. This was followed by another destructive flash flood event in January 2010 that killed about 122 people, and more than 350 people were reported missing. Another heavy rainfall triggered a flash flood event on 26 January 2011 that travelled toward the Red Sea Cost for about 13 km [22]. This flash flood event inundated about 80% of the Jeddah region, including roads, cars, and buildings. In addition, the 111 mm of heavy rain in January 2011 in just 3–4 h damaged hundreds of buildings and killed many people [22,23].
Flash flood hazard events are generally associated with high-intensity and short-duration storms, mainly from convective origin that occur locally in small basins (between 100 and 500 km2) [24,25,26]. Regarding the natural hazards, the investigation of flash flood events is very important because these sudden hazards provide aspects of various hydrological behaviors that were either unexpected or the least expected as documented by hydrometeorology phenomena [24,26,27]. Although monitoring rainfall intensity is highly recommend, basin morphometry parameters are very important factors for detecting the intensity of the flood hazards. Observing the behavior of a basin during flash flood events provides important insights into rate-limited processes for high-intensity flood event response and how they depend on basin characteristics and flash rainfall intensity [24,25,28]. The fundamental approaches by Refs. [29,30,31,32] have long been applied to figure out the morphometric characters of drainage basins. Recently, a quantitative analysis of the morphotectonic and morphometric properties through a number of mathematical equations was effectively estimated and calculated for many tasks, including the assessment of relative tectonic activity and flood hazard mapping [33,34,35,36]. Applying modern techniques, including remote sensing and geographic information systems (GISs) helps investigate the geological and tectonic aspects of at-risk regions and assess the various geological hazards [37,38,39,40]. Flash floods usually harm communities very much. Therefore, giving damage reimbursements to flood sufferers is not a solution; the government needs to give more attention to solving this problem effectively. Globally, many nations established effective methods and solutions to face this problem. For example, in Pakistan, many effective solutions for water management and sustainable flash flood control were suggested. These suggestions include establishing dams and reservoir lakes and awareness initiatives for the public to state the harmful effects of the flood [3]. In Egypt, an early warning system was developed and examined for the Sinai Peninsula in northern Egypt as a very effective method to help in minimizing floods. [41]. In Europe, the authors in Ref. [42] gave more emphasis to some selected flash floods and their risk management. They applied the most advanced data on around 25 floods across Europe to examine the characterization of the events in terms of climatic change and basin morphology.
Climatic change and global warming are significant topics concerning natural hazards. Global warming could be the direct cause of floods, which leads to an increase in the frequency of glacier-related natural hazards [3]. The recent long-term studies of Saudi Arabia indicate that increases in heat and humidity will lead to extreme flash flood events that could threaten human life, economy, and infrastructure. Therefore, high-resolution climatic models are needed to cover the study area and focus on monitoring regularly the Arabian Kingdom’s dry, hot, and wet seasons and observing the extreme flood events.
This paper aims to apply a quantitative scheme through calculating and analyzing the most effective hydrological morphometric parameters in order to provide insights into the nature of basin development and help in understanding variations in hydrological behavior and basin evolution. In addition, it aims to examine the flow velocity, immersion, and water discharge affecting the morphometric factors and topographic aspects in order to model the flash flood hazard susceptibility map, thereby enriching our understanding about the morphological changes under the effect of a flash flood hazard. Finally, this study tries to establish an understanding of the importance of flash flood problems, where impact investigations will provide the need to give more attention to the study area and neighboring areas.
2. Study Region
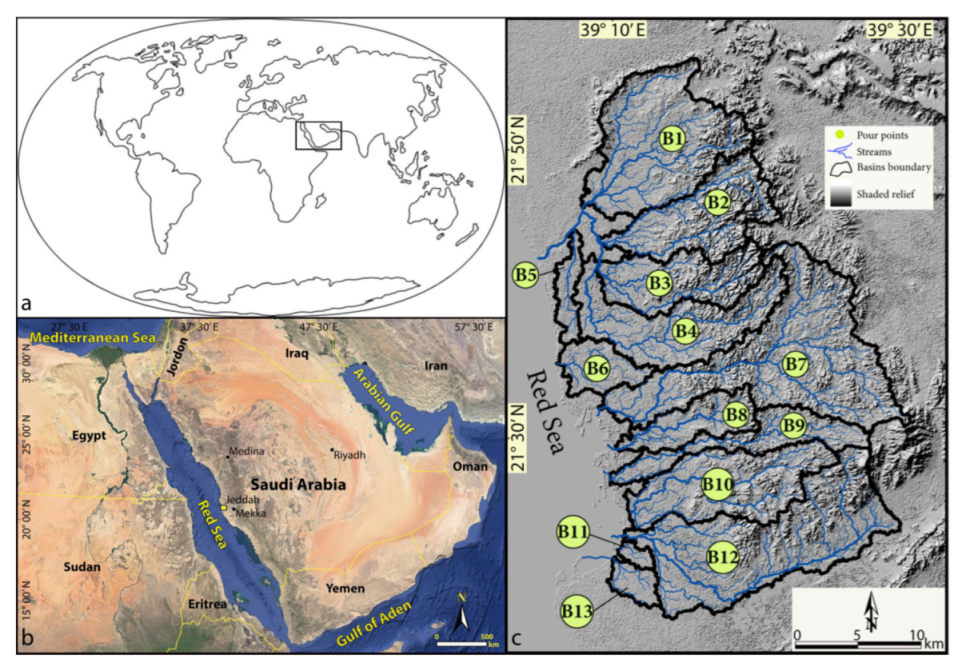
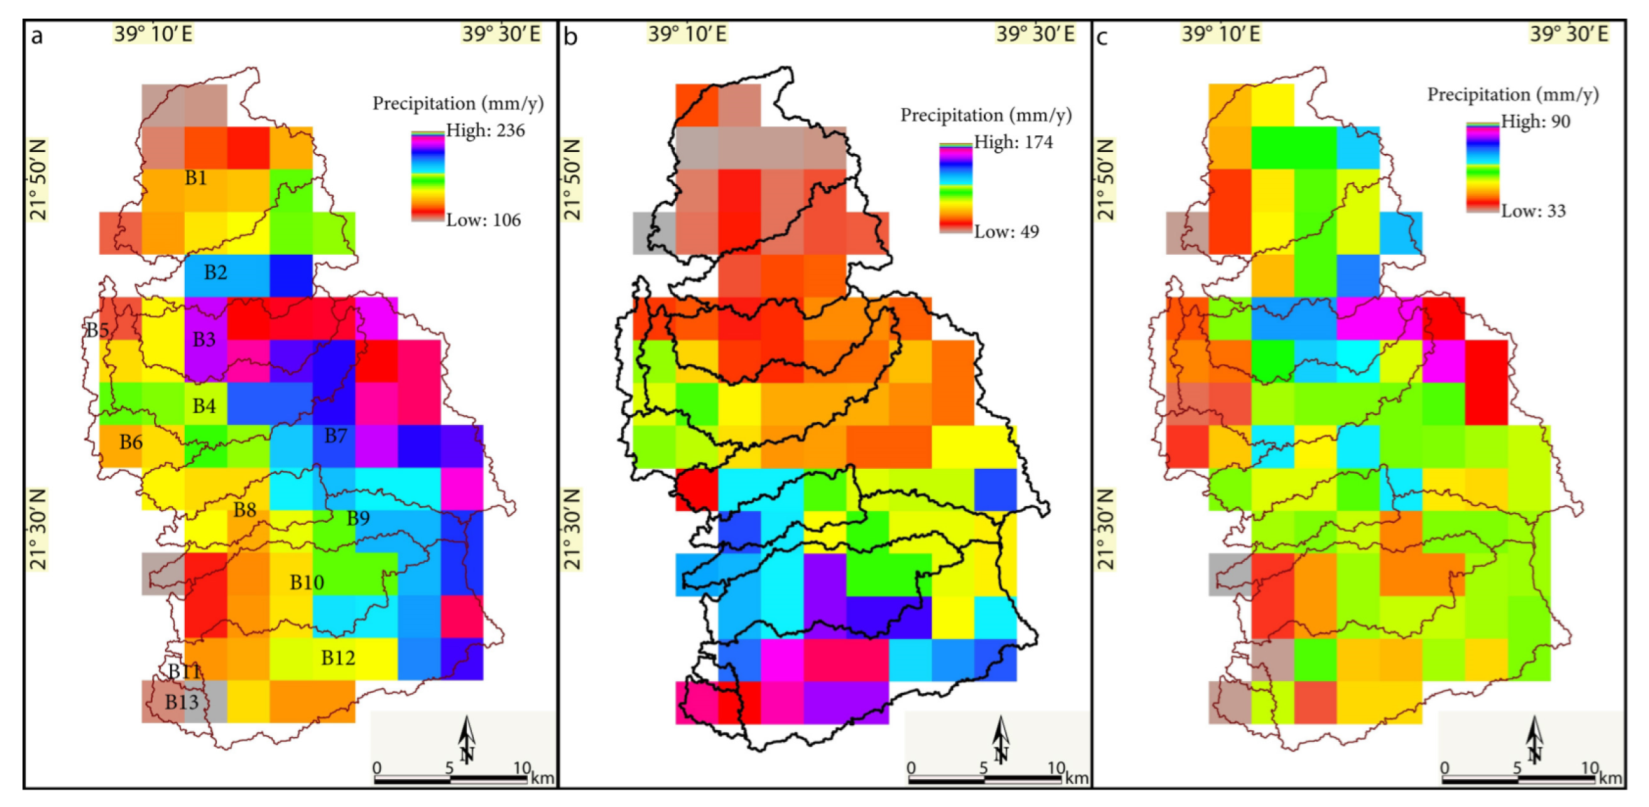
Jeddah City is a coastal city located in the western part of Saudi Arabia. It is the biggest costal city along the eastern coast of the Red Sea and the second largest city in the Saudi kingdom. It is situated between 21°15′0″–21°55′00″ N and 39°00′00″–39°30′00″ E and covers a total area of 1600 km2 (Figure 1). Jeddah City lies between the Red Sea Coast and the mountain chain of Hijaz that reaches 500 m as a mean elevation above sea level [14]. Regarding the population growth rate, the estimation comes from the municipality of Jeddah City that the population jumped from 1 million in 1970s to 3.5 million in 2022, representing about 14% of the total population of Saudi Arabia with a growth rate of 3.5% [40]. The geological setting of the study area provides various distinct geological units from oldest to youngest as follow: the Precambrian–Cambrian rocks, Cretaceous–Tertiary sedimentary units, Tertiary–Quaternary flow, and Holocene alluvial deposits and sabkhas [14], [43]. Volcanic lava extensions are characterized by different trending lineaments and ancient valleys. Theses lava units run along the traces of the paleorivers providing the direction of the water movement [43]. Because of existence of volcanic tuffs and quaternary sediments, loose fertile soils and springs prevail in the study area providing suitable conditions for population settlements and human activity [43]. This study region has different morphological features, including flat sandy beaches, sabkhas, lagoons, sea islands, spits, bars, and mountain chains [40]. The eastern zone of the study region shows high mountain chains with steep slopes (Figure 2a–c). The area has 13 basins (B1:B13) with sizes varying from 8.24 km2 to 298.22 km2 being a coastal region elevation and stretches from 0 to 688 m above sea level. In addition, the study region encompasses the Tihamah coastal plain with 40 km as a maximum width, situated along the foot of the Alhijaz Precambrian granitic mountain chains whose peaks are several hundred meters [40,43,44]. Precipitation records in the area provide a specific spatial pattern; the eastern parts of the study basin indicate relatively higher annual rainfall than the western parts (Figure 3). The Jeddah region experiences flood events during the monsoon periods; the most recent significant flash flood events were those of 2009 and 2011. During those two major events, much damage and many losses were recorded and documented. Many buildings were destroyed and/or filled by a huge quantity of water covering the basements and first floors. Several vehicles and small homes were dramatically washed away [14]. In some areas, heavy water grooved deep trenches in the streets that led to more damage and erosion [22]. Some authors, such as the authors of Refs. [14,20,43], attributed the huge losses and damage caused by the flash floods in Saudi Arabia to the lack of any early warning systems.
3. Materials and Methods
3.1. Materials
For flash flood susceptibility mapping in the proposed region, different raster and vector data were considered. These data include (Shuttle Radar Topography Mission (SRTM) data, and topographical (Scale; 1:500,000) maps were collected, investigated, and analyzed to estimate the different morphometric and topographic parameters. Shuttle Radar Topography mission data with 30 m spatial resolution were acquired from the USGS Earth Explorer community and analyzed for the digital elevation and hill shade models. The resolution of the digital elevation model limited the level of uncertainty accompanied by the morphometric indices. Therefore, we did not notice an uncertainty to our morphometric indices as in other works [45,46].
3.2. Methods
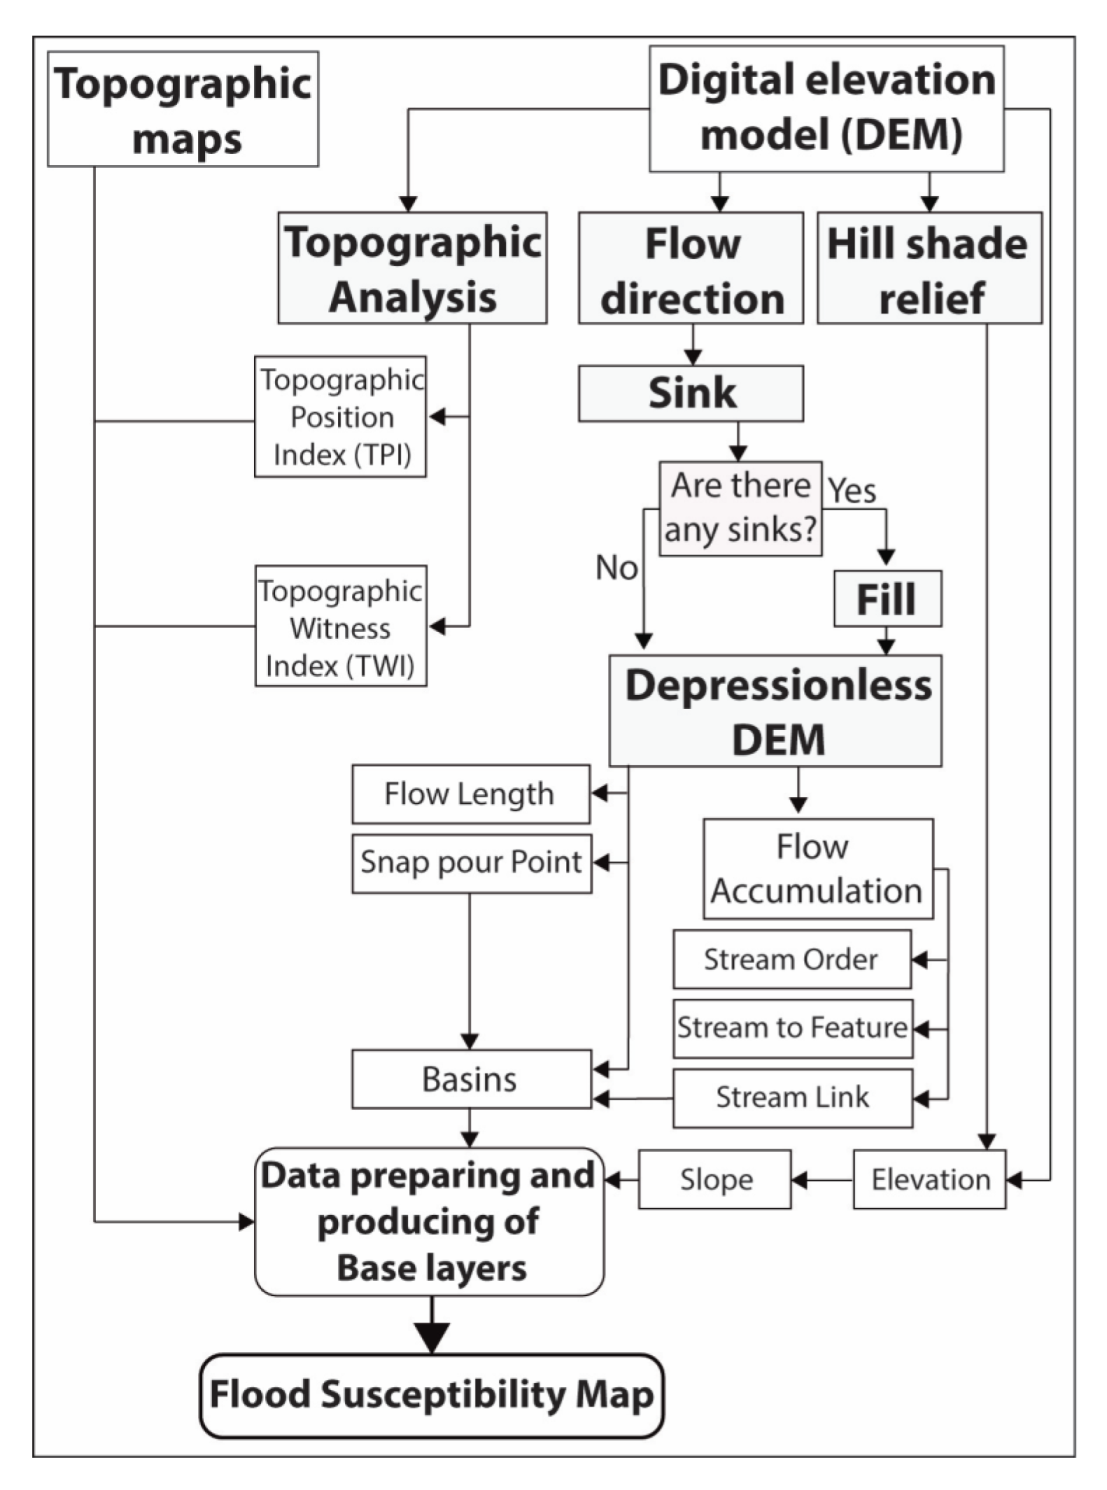
In the first stage, a flash flood-related spatial and spectral database was arranged and created in ArcGIS 10.4 and QGIS 3.16.3. The maps influencing flood characteristics, such as elevation, hill shade, and slope (degree), were considered. Elevation map is one of the most important keys for flash flood risk assessment. The elevation map of the proposed region was extracted from the SRTM digital elevation model. In this work, the Jeddah region was classified into 13 basins with utilization of greater than the third order. The drainage systems and watershed delineations were extracted using the hydrology analyst toolbar of ArcGIS v.10.4. In this work, 13 quantitative morphometric parameters were calculated and evaluated using both ArcGIS and QGIS. Finally, following the effective method that was applied in Ref. [45], two analysis models were presented in this work. Model one aims to study variations in the relative flood risks of the studied basins by extracting values from basic geometric parameters (Table 2). For an appropriate comparison model, the obtained results from the morphometric analysis of each single basin were modeled to a common evolution scheme of 1–3 on the scale of flash flood susceptibility decreasing from 3 to 1. Due to the plus or minus relationship of the flash flood event susceptibility, an obtained value was assigned to each morphometric parameter of all basins. Then, a cumulative distinct value was applied to produce a general flash flood susceptibility map. The second model merged the flood susceptibility map with the surface and witnessed topographic parameters providing an identifying model to compare the flood hazard signals of different basins and assign the exact flood hazard signals for every level of the flash flood events. The methodological steps are charted in Figure 4.
4. Results and Discussion
4.1. Morphometric Analysis
The quantitative results of the morphometric parameters have long been estimated to test the primary flood vulnerability signatures and examine the nature and origin of the drainage basins [7,45,52,53]. Due to the general impact of the morphometric behaviors on the hydrological characteristics of the basins, many studies have discussed how the drainage basin morphometry provides an important key in the occurrence and intensity of flash flood events [7,45]. Although evaluating the morphometric parameters to examine the flood hazard potential of the drainage basins has been widely used, there is no general consensus on a schematic morphometric model that could particularly be used to investigate the flood susceptibility models of the drainage basins [45,54]. Thus, using the analysis of the morphometric analysis usually provides variable information to a significant level.
4.1.1. Basic Morphometric Parameters
In this paper, the values of the basic morphometric parameters including area (A), perimeter (P), length (L), and elevation (H) of the studied basins were collected and are tabulated in Table 3. The biggest area and perimeter were recorded in basin 7 with 298.2 km2 and 147.78 km, respectively. Basin 11 was measured to be the smallest basin in the area with an area of 8.24 km2 and a perimeter of 16.15 km. Basin 4 was observed as the longest basin in the studied area (L = 34.41 m), while the shortest basin was recognized as basin 11 (4.36 m). In addition, the results of the quantitative analysis of the morphometric parameters, topographic analysis, and flash flood susceptibility are discussed in the current section.
4.1.2. Stream Number (Nu)
The stream number parameter indicates the count number of rivers and streams for all orders in a given basin [32,45]. Generally, drainage systems carry large stream numbers; the rivers and streams produce high runoff conditions and reach a peak flow during flash flood events [7,55]. The total stream number is 1096 with its highest value in basin 7, while the lowest value was recorded for basin 11, indicating the least runoff capacity conditions (Table 4).
4.1.3. Stream Length (Lu)
The stream length (Lu) parameter is recognized as a dimensional factor providing the general characteristic size of the drainage system and its impact on the basin surface [55]. This parameter is extracted by dividing the total length of the streams in a given order by the total number of stream lengths in the order. The stream length analysis records 1407.7 m as the total length of all basins. The stream length parameter values range from 6.73 m (basin 11) to 281.85 m in basin 7 (Table 4). The stream length index is one of the important parameters defining surface runoff conditions. A long Lu is a very effective indicator of less infiltration and high runoff conditions [27]. The results of this parameter indicate that there is an agreement with the results from the stream number parameter; they recorded the lowest and highest values of them in basins 11 and 7, respectively.
4.1.4. Stream Order (Su)
The utilization of stream order (Su) is the primary step in the processes of a drainage basin analysis. The first step in network basin analysis is to extract stream order. The stream order index is one of the most significant parameters of hydrogeomorphology to investigate and measure the size of the catchment water paths. It classifies streams and rivers according to the count of stream segments (1st, 2nd, 3rd, etc.) and the nature of the confluence (1st with 1st, 2nd with 2nd, 3rd with 3rd, etc.) [45,55]. It is applied to provide a classification of the rank of rivers and streams [28]. In this work, basin 2 provides the highest stream order (IV), whereas basin 11 records just the 2nd order (Table 4). Generally, higher stream orders are associated with high levels of discharge. Therefore, a high rank of stream order indicates the presence of large rivers and streams in the basins fed by several streams and small rivers providing high potentialities of water discharge and flow velocities due to the examined relief conditions [45].

Table 4.
Stream orders (Su), stream numbers (Nu), and stream lengths (Lu) of the studied basins.
| Basins | I | II | III | IV | V | Total Stream Order | Total Stream Length |
|---|---|---|---|---|---|---|---|
| B1 | 72 | 31 | 33 | 8 | 0 | 144 | 211.854 |
| B2 | 44 | 26 | 15 | 2 | 1 | 88 | 129.31 |
| B3 | 36 | 17 | 17 | 3 | 0 | 73 | 105.96 |
| B4 | 56 | 23 | 24 | 10 | 0 | 113 | 136.74 |
| B5 | 13 | 8 | 4 | 0 | 0 | 25 | 25.85 |
| B6 | 14 | 9 | 2 | 0 | 0 | 25 | 39.80 |
| B7 | 117 | 58 | 31 | 25 | 0 | 231 | 281.85 |
| B8 | 27 | 12 | 11 | 3 | 0 | 53 | 60.77 |
| B9 | 27 | 13 | 12 | 0 | 0 | 52 | 87.50 |
| B10 | 49 | 23 | 19 | 5 | 0 | 96 | 100.41 |
| B11 | 3 | 1 | 0 | 0 | 0 | 4 | 6.73 |
| B12 | 89 | 49 | 21 | 20 | 0 | 179 | 200.80 |
| B13 | 7 | 5 | 1 | 0 | 0 | 13 | 20.13 |
4.1.5. Bifurcation Ratio (Rb)
The bifurcation ratio (Rb) parameter is a very effective scale recognizing the level of ramification of the basin drainage systems [32]. This factor is defined as a dimensionless factor estimating the ratio of the stream/river number of a given order (Nu) to the number of stream/river of the next higher order (Nu + 1). In this paper, the highest mean bifurcation ratio results were recorded for basin 12 as 13.76. The lowest value of the Rb was observed for basin 13 as 0.11 (Table 5; Figure 5). The authors of [45] and [28] observed that the bifurcation ratio parameter generally records high values in mountainous and dissected basins, while providing low values in rolling and flat drainage basins. Thus, the southern part of the study area, including basins 10, 11, 12, and 13, has all the condition levels of runoff generation potential. Only basin 10 shows a high level of runoff generation potential in association with a low lag time for producing flash floods during rainy storm events. In addition, the northern part of the study area gives less runoff flash flood signals.
4.1.6. Stream Frequency (Fs)
The stream frequency (Fs) parameter is defined as the ratio of the total number of stream segments of all basin orders to the total basin area [28]. In this work, the stream frequency parameter result for all basin is 8.629. The Fs parameter indicates its highest value in basin 8 located in the middle part of the study area as 0.854, while the lowest value of this parameter was recorded as 0.483 for basin 6 (Table 5; Figure 5). The Fs parameter has been long used in several studies to indicate that the high results of the Fs usually suggest a huge quantity of runoff delivery, which is a parameter of the impermeable surface of rocks and soils, high topography conditions, and sparse vegetation extensions [39,45,56].
4.1.7. Form Factor (F)
The form factor (F) parameter is a mathematical factor that defines the ratio between the area of a basin and the square of that basin’s length [27,45]. This factor has been used effectively for predicting the intensity of the direct flow of a basin [57]. The results of this parameter recorded the highest value of F in basin 1 as 0.511 in the northern terminal of the area, while the lowest F values were observed in basins 3, 5, and 4 as 0.109, 0.2036, 0.2037, respectively. More than half of the basins show moderate values between 0.210 and 0.344 (Table 5; Figure 5). The authors in Refs. [45,57] used this parameter in various studies and state that the high digits of F provide a high level of discharge conditions of short-duration events, while low F results indicate low discharge conditions.
4.1.8. Texture Ratio (Rt)
The texture ratio index (Rt) describes the ratio of the total number of all streams to the basin perimeter [28]. It is an interaction among climate, rainfall, slope, topography, rocks, soil, and vegetation [45,58]. While soft formations covered by a vegetation blanket are associated with no relief surface and provide a fine texture, hard rock terrain (consolidated rocks) produces a coarse texture [58]. The Rt paramter recorded its highest results in basins 1, 7, and 12 with values of 1.595, 1.563, and 1.522 (Table 5; Figure 5), respectively; thus, they are the only basins showing intermediate texture and providing a high peak discharge response. The basin indicates a corse texture with the lowest result being that of the basin 11 with 0.247. The Rt parameter is classified due to its values into four texture classes: very fine texture (Rt > 15 per km); fine texture (Rt between 10 and 15 per km); intermediate texture (Rt between 4 and 10 per km); and coarse texture (Rt < 4 per km) [49].
4.1.9. Drainage Density (Dd)
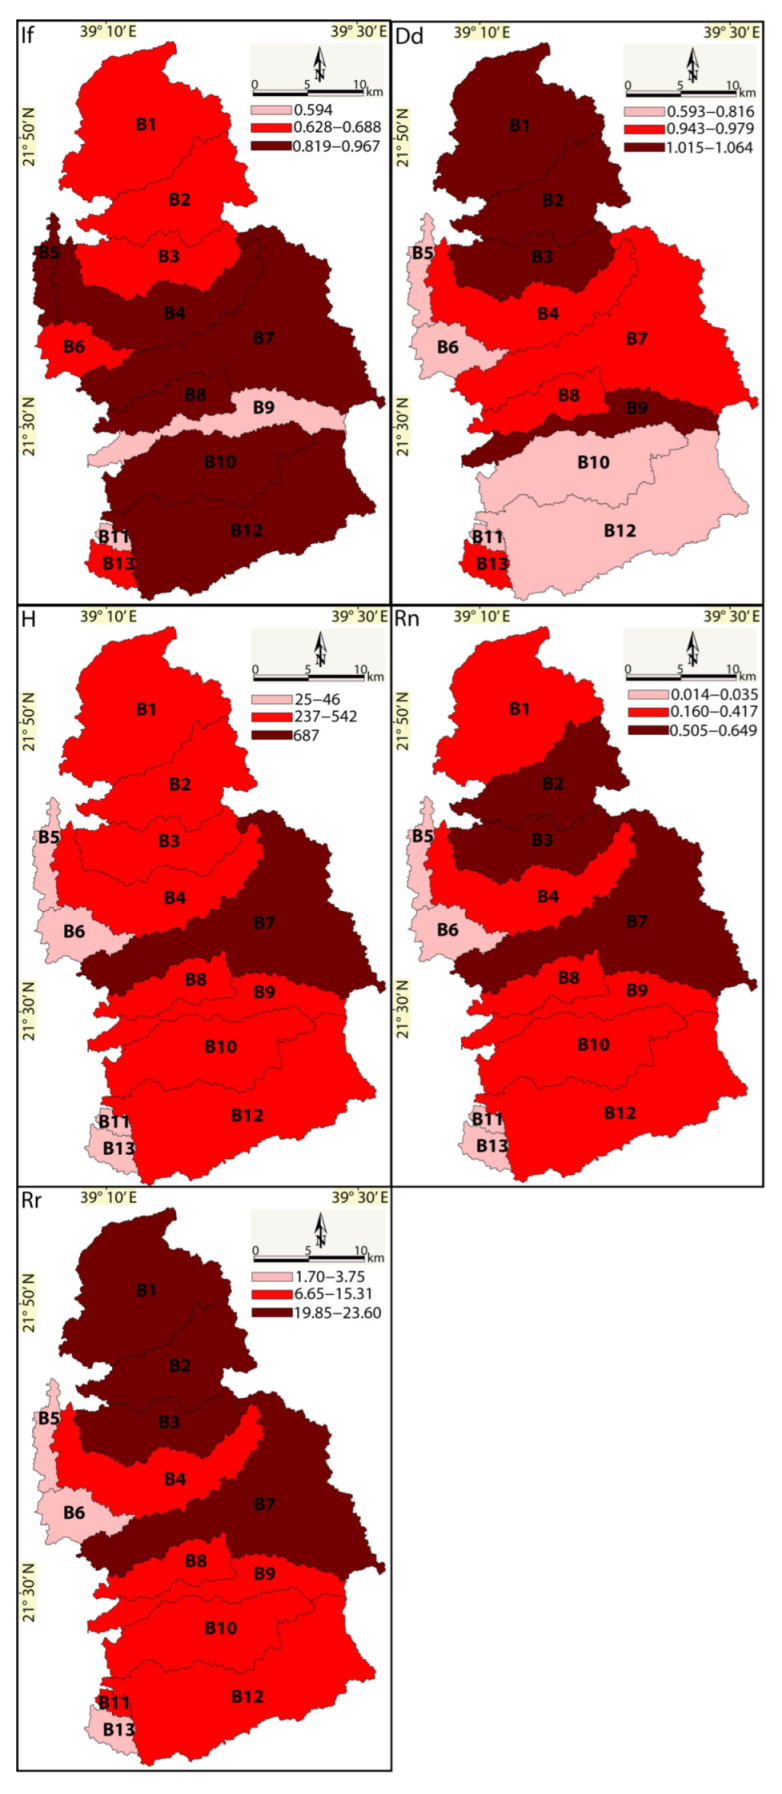
The drainage density parameter (Dd) was first known and used by the authors in Refs. [27,28] to express the drainage basin characteristics. The authors in Refs [59,60] defined Dd as the ratio of total stream segment lengths against the entire area of the basin. In addition, another definition was presented by Ref. [45] as the total length of all the extracted orders divided by the total area of the examined basin. In the current paper, the drainage density paramter results range between 0.593 and 1.064 (Table 5; Figure 5). This was observed to be the highest in basins 1, 2, 3, and 9 with values of 1.015, 1.020, 1.031, and 1.064, respectively; thus, these basins cover the entire northern part of the study area and likely provide the highest runoff signals, whereas basin 5 recorded the lowest Dd value as 0.593. Accordingly, the entire southern part reflects low Dd values and the lowest runoff signals.
Figure 5.
Models of morphometric parameters; stream number (Nu), stream length (Lu), bifurcation ratio (Rb), stream frequency (Fs), form factor (F), and texture ratio (Rt). Drainage density (Dd), infiltration ratio (If), basin relief (H), ruggedness number (Rn), and relief ratio (Rr).
Figure 5.
Models of morphometric parameters; stream number (Nu), stream length (Lu), bifurcation ratio (Rb), stream frequency (Fs), form factor (F), and texture ratio (Rt). Drainage density (Dd), infiltration ratio (If), basin relief (H), ruggedness number (Rn), and relief ratio (Rr).


4.1.10. Infiltration Number (If)
With most morphometry studies, the infiltration number parameter (If) is used to identify the infiltration characteristics of different basins [45,48]. This parameter represents a relationship between the stream density and frequency of a specific basin [34]. The highest infiltration number results were extracted for basin 5 as 0.967, indicating suitable conditions for a high ratio value of the infiltration process and a high quantity of runoff [34]. The relative minimum infiltration condition was recorded over basins 9 and 11, indicating the same minimum infiltration ratio values as 0.594 (Table 5; Figure 5).
4.1.11. Basin Relief (H)
The basin relief (H) parameter aids in recognizing the general river denudation, landform evolution, and runoff amount of the examined basins. This parameter evaluates the elevation difference between the lowest and highest elevations in a given basin [47]. The results extracted from these parameters indicate that the highest value of the H parameter was recorded only for basin 7 in the middle part of the study area as 687, while the lowest values were observed for basins 5 and 13 as 25 for both (Table 5; Figure 5). The results of this parameter are very valuable in recognizing the probability levels of flash flooding. The high results suggest a high degree, while the lowers results indicate a low-level possibility for any flash flood events [45]. The final observation shows that the moderate values of the H parameter prevail over the entire study area. Only basin 7 prevents the connection between the northern and southern basins.
4.1.12. Ruggedness Number (Rn)
The ruggedness number (Rn) parameter defines the slope steepness and length describing the extent of the surface instability [29,61]. The author in Ref. [62] recognized this index as a dimensionless factor of topography and stream density. In the case of the examined basins, the Rn parameter result values range from 0.014 (basin 5) to 0.649 in basin 13. High Rn results usually describe basins characterized by steep and long slopes, highly erosion, and quick peak flow signatures [63]. The higher ruggedness results are 0.505, 0.546, and 0.649 for basins 2, 3, and 7 (Table 5; Figure 5), respectively, while the basins described by low values of Rn are 5, 6, 11, and 13. The basins with high Rn values provide a rugged relief surface that is susceptible to processes of erosion and is structurally complex. The authors in Ref. [54] categorized the surface relief due to the ruggedness number parameter into flat relief surface (Rn < 1); undulating relief surface (1:Rn:2); and badland relief surface (Rn > 2) [45].
4.1.13. Relief Ratio (Rr)
The relief ratio (Rr) parameter represents one of the effective relief parameters that recognizes the relief properties of the drainage basins [45,61]. It defines the ratio between the total surface of a basin topography and the length of the longest path of the examined basin parallel to the main stream inside the basin [47]. Regarding the results obtained from the current analysis, the values of Rr range from 1.70 to 23.60. The highest value was observed and recorded for basin 3, while lower results were observed for basins 5, 13, and 6 as 1.70, 350, and 3.75, respectively (Table 5; Figure 5). The relief ratio parameter aids in instigating and understanding the relative topography in the basins regarding the topographical difference scale [62]. Thus, higher Rr parameter results define low lag times, sudden peak discharge events, and high potentialities of flash flood conditions [56].
Table 5.
Extracted values of all the morphometric parameters for each basin.
| Basin | Stream Number, Nu | Stream Length, Lu | Bifurcation Ratio, Rb | Stream Frequency, Fs | Form Factor, F | Texture Ratio, R | Drainage Density, Dd | Infiltration Number, If | Basin Relief, H | Ruggedness Number, Rn | Relief Ratio, Rr |
|---|---|---|---|---|---|---|---|---|---|---|---|
| 1 | 144 | 211.85 | 1.636 | 0.699 | 0.511 | 0.595 | 1.015 | 0.679 | 401 | 0.407 | 19.85 |
| 2 | 88 | 129.31 | 1.205 | 0.694 | 0.243 | 0.161 | 1.020 | 0.680 | 496 | 0.505 | 21.74 |
| 3 | 73 | 105.96 | 0.646 | 0.710 | 0.203 | 1.100 | 1.031 | 0.688 | 530 | 0.546 | 23.60 |
| 4 | 113 | 136.74 | 4.52 | 0.779 | 0.109 | 1.089 | 0.943 | 0.826 | 356 | 0.335 | 9.777 |
| 5 | 25 | 25.85 | 1 | 0.574 | 0.203 | 0.836 | 0.593 | 0.967 | 25 | 0.014 | 1.709 |
| 6 | 25 | 39.8 | 0.108 | 0.483 | 0.344 | 0.398 | 0.769 | 0.628 | 46 | 0.035 | 3.755 |
| 7 | 231 | 281.85 | 4.35 | 0.774 | 0.303. | 1.563 | 0.945 | 0.819 | 687 | 0.649 | 21.92 |
| 8 | 53 | 60.77 | 1.019 | 0.854 | 0.210 | 0.929 | 0.979 | 0.872 | 240 | 0.235 | 13.98 |
| 9 | 52 | 87.5 | 0.541 | 0.632 | 0.079 | 0.558 | 1.064 | 0.594 | 392 | 0.417 | 12.17 |
| 10 | 96 | 100.41 | 24 | 0.684 | 0.221 | 1.166 | 0.678 | 0.956 | 237 | 0.160 | 9.168 |
| 11 | 4 | 6.73 | 0.022 | 0.485 | 0.433 | 0.247 | 0.816 | 0.594 | 29 | 0.023 | 6.651 |
| 12 | 179 | 200.8 | 13.76 | 0.676 | 0.211 | 1.522 | 0.758 | 0.891 | 542 | 0.411 | 15.31 |
| 13 | 13 | 20.13 | 0.011 | 0.624 | 0.409 | 0.506 | 0.967 | 0.645 | 25 | 0.024 | 3.506 |
4.2. Topographic Position and Wetness Indices
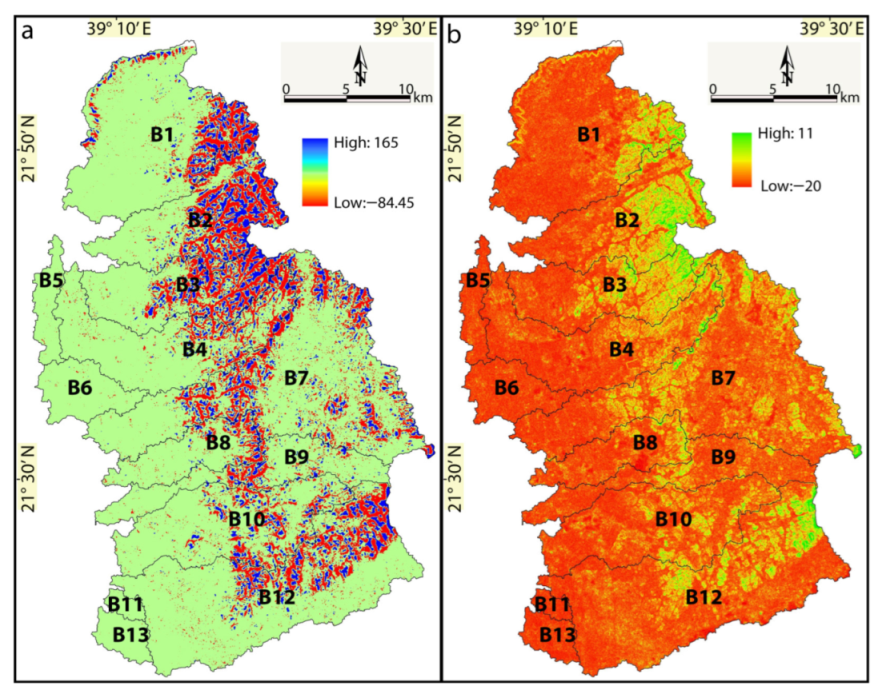
The topographic position index (TPI) is a simple, repeatable, and very effective method to classify landforms into slope positions and surface sections [45]. It compares the cell elevation and the elevation average of the specific neighboring cells [52]. The TPI factor values help in recognizing and defining various relief landforms comprising valleys, slopes, and relief ridges [64,65,66]. In this paper, the TPI analysis provides three levels of waterlogging probability between −84.45 and 165 (Figure 6a). The steep mountain edge zones usually indicate the least potential to produce topographic immersion rather than regions characterized by a low topography relief. The topographic wetness index (TWI) represents a hydrological factor, which is widely applied to calculate relief controls on surface runoff and wetness [45,67,68,69]. This parameter helps in the delineation of a specific part of the basin potentiality exposed to flood immersion or flash flood events [45,70]. The TWI is estimated as a factor of the slope β and upstream controlling area/unit width, which is orthogonal to the flow direction factor [64,71]. In the present study, the TWI provides values between −20 and 11 (Figure 6b), where high values show suitable properties of the highest immersion and low values state the least likelihood of immersion. In this paper, the TWI analysis shows that all basins share a substantial area with low TWI values.
The topographic position and wetness indices (TPI and TWI) are valuable parameters to investigate and understand the classes of topographic positions and the topographic-driven balance of the local water basins and supply drainage systems, respectively [72]. The TPI (+values) indicates a higher central point than its average surroundings, whereas negative values indicate lower positions than their surrounding regions (Figure 6a). The TPI is usually applied to examine the relief slopes and automate surface classification [45,73]. In this study, the TPI was applied and analyzed to define the different relief indices comprising structural ridges, flat plain lands, and depressions. The TPI map illustrates the regions with a high possibility of waterlogging. Thus, to examine the relief signals over the wetness and runoff of the study basins, the TWI was processed and provided a TW map (Figure 6b). This map helps in figuring out the runoff generation. The TWI map indicates that nearly all basins show a substantial area with low TWI values. Therefore, the paper assumes that the effect of this relief factor is negligible and the topographic position effect prevails. Due to this analysis, the frictions of the studied basins, where the wetness index values exceed some thresholds, are suggested to be entirely saturated [45,74]. This index could be a guide to define the relief structure features of drainage system gaining insight into water networks indicating a unique result of runoff generation [74].
4.3. Flash Flood Susceptibility Map
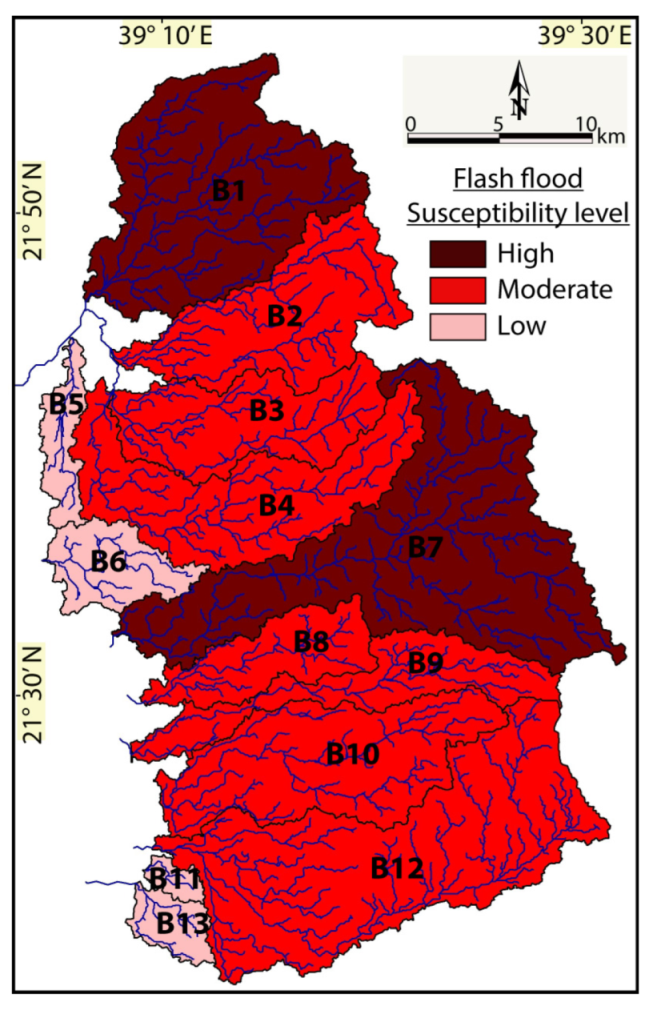
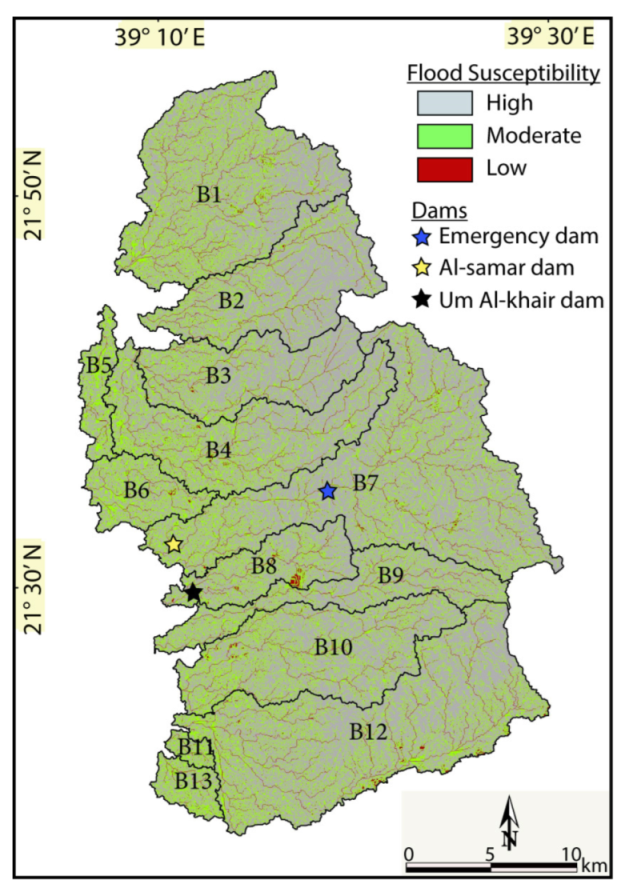
In this study, the cumulative result values come from the applied methodology showing that basins 1 and 7 provide the highest conditions for the discharge-producing potential, and they are more exposed to flood susceptibility than the rest of the basins. The basins cover an area around 506.9 km2 (208.7 km2 for basin 1 and 298.2 for basin 5), which together constitute around 32% of the entire studied area. An analysis of the morphometric analysis, including stream number (Nu), total stream length (Lu), stream order (Su), bifurcation ratio (Rb), stream frequency (Fs), form factor (F), texture ratio (Rt), drainage density (Dd), infiltration number (If), basin relief (Hr), ruggedness number (Rn), and relief ratio (Rr) with result values of 144 and 231 (Nu), 211.85 and 281.85 (Lu), 1.63 and 4.35 (Rb), 0.690 and 0.774 (Fs), 0.511 and 0.303 (F), 1.59 and 1.56 (Rt), 1.015 and 0.945 (Dd), 0.679 and 0.819 (If), 0.407 and 0.649 (Rn), and 19.85 and 21.92 (Rr) for basins 1 and 7, respectively, was performed to detect their high-level flash flood event susceptibility. Level 2 (moderate susceptibility level) covers around 931.49 km2 (59.59%) for basins 2, 3, 4, 8, 9, 10, and 12, which occupy the greater proportion of the study area as estimated by the susceptibility signals. Level 3 (lowest level) is represented by 7.95% (124.29 km2). The hydrological analysis provide that the higher level of flood susceptibility has a greater possibility to produce maximum discharge signals during the heavy rain periods providing the highest values of the runoff-producing characteristics [45]. On the other hand, the moderate level mostly extends vertically in the middle and southern parts of the Jeddah region. This zone reflects a moderate runoff contribution. Integrating between the basin level susceptibility scenario (Figure 7) and in situ TPI and TWI maps (Figure 6a,b) allowed a preliminary depiction of the flood susceptibility of each basin. The detailed quantification of the studied area under various flash flood susceptibility classes in each basin is provided in Figure 8. Generally, the entire Jeddah area is exposed to varying levels of flood risk, but basins in the high susceptibility zones have a higher possibility of being affected.
5. Conclusions and Recommendations
Flash floods are periodically occurring hazards due to monsoon rains in Saudi Arabia. The intensity and duration of the flash floods that the Arabian Kingdom has faced in the last 50 years caused a huge loss of life and critical damage to property, which would have been a huge disaster for any other country. Recognizing and understanding the flood potential of the drainage basins is highly recommended for protecting or at least minimizing the associated flash flood event damage. In this paper, we carried out a case study on the Jeddah City area along the western coast of the Red Sea in Saudi Arabia to gain sufficient information about the flash flood risks of the study region. Therefore, several effective morphometric parameters affecting flow velocity, runoff volume, and water level were examined and evaluated to recognize the flood susceptibility of thirteen basins along the eastern Red Sea Coast in Saudi Arabia. The morphometric factors were extracted from the SRTM digital elevation model using ArcGIS. An analysis of the morphometric parameters provided a cumulative index of flooding susceptibility levels, which classified the study regions into three levels of flooding vulnerability signals. The results suggest that two basins (basins 1 and 7) would provide high conditions for heavy rainfall events and could produce a large and instant discharge, confirming that basins 1 and 7 are more susceptible to flash floods than the remaining basins considered for this analysis. In addition to the general basin-scale morphometric parameter analysis, consideration of the local relief effects aided to accurately map the preliminary flood vulnerability in all basins. Moreover, validation of the proposed flood model was still partially performed because the record of significant data on flash floods was insufficient (Figure 6). The work could also suggest that the flash flood risk is not entirely a factor of morphometric parameters; therefore, the scenarios could vary according to the influence of other parameters, such as land-use factor, flood management practices in each drainage basin, and hydraulic structures along the major streams and rivers. Although this paper does not assign uncertainties to the extracted data and used techniques, the results of this paper suggest a model for recognizing and understanding flash flood event behavior and continuously updating the flash flood mitigation plan for the study region.
Due to the strategic importance of the study area for the Arabian Kingdom and in order to minimize the flash flood impact, including protecting human lives, infrastructure, strategic locations, homes, and other man-made structures, several recommendations and strategies are suggested:
- Establish advanced monitoring stations in and around the study area in order to update the datasets about the climatic changes.
- Establish and develop more effective early warning systems for flash floods
- Construct more dams and develop more reservoir lakes as effective obstacles in the face of floods.
- Establish small rivers and channels between the mouth of the studied basins and the Red Sea in order to drain the excess rainfall accumulation toward the Red Sea.
- The government should guide the media to distribute regular public awareness messages to educate the community on flood hazards and preparedness.
Funding
This research was supported by the Researchers Supporting Project number (RSP2023R296), King Saud University, Riyadh, Saudi Arabia.
Conflicts of Interest
The author declares no conflict of interest.
References
- Sohail, M.T.; Hussan, A.; Ehsan, M.; Al-Ansari, N.; Akhter, M.M.; Manzoor, Z.; Elbeltagi, A. Groundwater budgeting of Nari and Gaj formations and groundwater mapping of Karachi, Pakistan. Appl. Water Sci. 2022, 12, 1–24. [Google Scholar] [CrossRef]
- World Meteorological Organization (WMO). Flash Flood Guidance System (FFGS) with Global Coverage Brochure; World Meteorological Organization (WMO): Geneva, Switzerland, 2016. [Google Scholar]
- Manzoor, Z.; Ehsan, M.; Khan, M.B.; Manzoor, A.; Akhter, M.M.; Sohail, M.T.; Hussain, A.; Shafi, A.; Abu-Alam, T.; Abioui, M. Floods and flood management and its socio-economic impact on Pakistan: A review of the empirical literature. Front. Environ. Sci. 2022, 10, 2480. [Google Scholar] [CrossRef]
- Dawood, F.; Akhtar, M.M.; Ehsan, M. Evaluating urbanization impact on stressed aquifer of Quetta Valley, Pakistan. Desalination Water Treat. 2021, 222, 103–113. [Google Scholar] [CrossRef]
- Kahn, M.E. The Death Toll from Natural Disasters: The Role of Income, Geography, and Institutions. Rev. Econ. Stat. 2005, 87, 271–284. [Google Scholar] [CrossRef]
- Anbarci, N.; Escaleras, M.; Register, C.A. Earthquake fatalities: The interaction of nature and political economy. J. Public Econ. 2005, 89, 1907–1933. [Google Scholar] [CrossRef]
- Khalifa, A.; Bashir, B.; Alsalman, A.; Bachir, H. Morphometric-hydro Characterization of the Coastal Line between El-Qussier and Marsa-Alam, Egypt: Preliminary Flood Risk Signatures. Appl. Sci. 2022, 12, 6264. [Google Scholar] [CrossRef]
- Petrucci, O.; Aceto, L.; Bianchi, C.; Bigot, V.; Brázdil, R.; Pereira, S.; Kahraman, A.; Kılıç, Ö.; Kotroni, V.; Llasat, M.C.; et al. Flood Fatalities in Europe, 1980–2018: Variability, Features, and Lessons to Learn. Water 2019, 11, 1682. [Google Scholar] [CrossRef] [Green Version]
- Prama, M.; Omran, A.; Schröder, D.; Abouelmagd, A. Vulnerability assessment of flash floods in Wadi Dahab Basin, Egypt. Environ. Earth Sci. 2020, 79, 114. [Google Scholar] [CrossRef] [Green Version]
- Youssef, A.M.; Pradhan, B.; Hassan, A.M. Flash flood risk estimation along the St. Katherine road, southern Sinai, Egypt using GIS based morphometry and satellite imagery. Environ. Earth Sci. 2011, 62, 611–623. [Google Scholar] [CrossRef]
- Mohamed, S.A.; El-Raey, M.E. Vulnerability assessment for flash floods using GIS spatial modeling and remotely sensed data in El-Arish City, North Sinai, Egypt. Nat. Hazards 2020, 102, 707–728. [Google Scholar] [CrossRef]
- Helmi, A.M.; Zohny, O. Flash Flood Risk Assessment in Egypt. Flash Floods Egypt 2020, 253–312. [Google Scholar] [CrossRef]
- Moghanjoghi, K.N.; Fakhraei, H.; Asadi-Aghbolaghi, M. Investigating 2019 Flash Flood of Shiraz, Iran, and Estimating Return Levels with Historic RCMs. Iran. J. Sci. Technol. Trans. Civ. Eng. 2022, 1–18. [Google Scholar] [CrossRef]
- Youssef, A.M.; Sefry, S.A.; Pradhan, B.; Abu Alfadail, E. Analysis on causes of flash flood in Jeddah city (Kingdom of Saudi Arabia) of 2009 and 2011 using multi-sensor remote sensing data and GIS. Geomat. Nat. Hazards Risk 2016, 7, 1018–1042. [Google Scholar] [CrossRef]
- El-Magd, I.A.; Hermas, E.; El Bastawesy, M. GIS-modelling of the spatial variability of flash flood hazard in Abu Dabbab catchment, Red Sea Region, Egypt. Egypt. J. Remote Sens. Space Sci. 2010, 13, 81–88. [Google Scholar] [CrossRef] [Green Version]
- Dawod, G.M.; Mirza, M.N.; Al-Ghamdi, K.A. GIS-Based Spatial Mapping of Flash Flood Hazard in Makkah City, Saudi Arabia. J. Geogr. Inf. Syst. 2011, 03, 225–231. [Google Scholar] [CrossRef] [Green Version]
- Elnazer, A.A.; Salman, S.; Asmoay, A. Flash flood hazard affected Ras Gharib city, Red Sea, Egypt: A proposed flash flood channel. Nat. Hazards 2017, 89, 1389–1400. [Google Scholar] [CrossRef]
- Farhan, Y.; Anaba, O.; Salim, A. Morphometric Analysis and Flash Floods Assessment for Drainage Basins of the Ras En Naqb Area, South Jordan Using GIS. J. Geosci. Environ. Prot. 2016, 4, 9–33. [Google Scholar] [CrossRef] [Green Version]
- Youssef, A.M.; Pradhan, B.; Sefry, S.A.; Abu Abdullah, M.M. Use of geological and geomorphological parameters in potential suitability assessment for urban planning development at Wadi Al-Asla basin, Jeddah, Kingdom of Saudi Arabia. Arab. J. Geosci. 2015, 8, 5617–5630. [Google Scholar] [CrossRef]
- Youssef, A.M.; Pradhan, B.; Sefry, S.A. Flash flood susceptibility assessment in Jeddah city (Kingdom of Saudi Arabia) using bivariate and multivariate statistical models. Environ. Earth Sci. 2016, 75, 12. [Google Scholar] [CrossRef]
- Youssef, A.M.; Maerz, N.H. Overview of some geological hazards in the Saudi Arabia. Environ. Earth Sci. 2013, 70, 3115–3130. [Google Scholar] [CrossRef]
- Azzam, A.; Ali, A.B. Urban Sprawl in Wadi Goss Watershed (Jeddah City/Western Saudi Arabia) and Its Impact on Vulnerability and Flood Hazards. J. Geogr. Inf. Syst. 2019, 11, 371–388. [Google Scholar] [CrossRef] [Green Version]
- Al Saud, M. Use of Remote Sensing and GIS to Analyze Drainage System in Flood Occurrence, Jeddah-Western Saudi Coast. In Drainage Systems; Books on Demand: Norderstedt, Germany, 2012. [Google Scholar] [CrossRef] [Green Version]
- Destro, E.; Amponsah, W.; Nikolopoulos, E.I.; Marchi, L.; Marra, F.; Zoccatelli, D.; Borga, M. Coupled prediction of flash flood response and debris flow occurrence: Application on an alpine extreme flood event. J. Hydrol. 2018, 558, 225–237. [Google Scholar] [CrossRef]
- Gaume, E.; Bain, V.; Bernardara, P.; Newinger, O.; Barbuc, M.; Bateman, A.; Blaškovičová, L.; Blöschl, G.; Borga, M.; Dumitrescu, A.; et al. A compilation of data on European flash floods. J. Hydrol. 2009, 367, 70–78. [Google Scholar] [CrossRef] [Green Version]
- Merz, R.; Blöschl, G. Flood frequency hydrology: 1. Temporal, spatial, and causal expansion of information. Water Resour. Res. 2008, 44, 1–17. [Google Scholar] [CrossRef] [Green Version]
- Horton, R.E. Drainage-basin characteristics. Trans. Am. Geophys. Union 1932, 13, 350–361. [Google Scholar] [CrossRef]
- Horton, R.E. Erosional Development of Streams and Their Drainage Basins: Hydrophysical Approach to Quantitative Morphology. Geology 1945, 56, 275–370. [Google Scholar] [CrossRef] [Green Version]
- Strahler, A. Dynamic Basis of Geomorphology. Geol. Soc. Am. Bull. 1952, 63, 923–938. [Google Scholar] [CrossRef]
- Miller, V. A Quantitative Geomorphic Study of Drainage Basin Characteristics in the Clinch Mountain Area, Virginia and Tennessee; Project NR 389–402, Technical Report 3; Columbia University, Department of Geology, ONR: New York, NY, USA, 1953; pp. 389–402. [Google Scholar]
- Khalifa, A.; Çakir, Z.; Owen, L.; Kaya, Ş. Evaluation of the Relative Tectonic Activity of the Adıyaman fault within the Arabian-Anatolian Plate Boundary (Eastern Turkey). Geol. Acta 2019, 17, 1–17. [Google Scholar] [CrossRef] [Green Version]
- Mesa, L.M. Morphometric analysis of a subtropical Andean basin (Tucumán, Argentina). Environ. Geol. 2006, 50, 1235–1242. [Google Scholar] [CrossRef]
- Angillieri, M.Y.E. Morphometric analysis of Colangüil river basin and flash flood hazard, San Juan, Argentina. Environ. Geol. 2008, 55, 107–111. [Google Scholar] [CrossRef]
- Bhatt, S.; Ahmed, S. Morphometric analysis to determine floods in the Upper Krishna basin using Cartosat DEM. Geocarto Int. 2014, 29, 878–894. [Google Scholar] [CrossRef]
- Khalifa, A.; Bashir, B.; Alsalman, A.; Öğretmen, N. Morpho-tectonic Assessment of the Abu-Dabbab Area, Eastern Desert, Egypt: Insights from Remote Sensing and Geospatial Analysis. ISPRS Int. J. Geo Inf. 2021, 10, 784. [Google Scholar] [CrossRef]
- Bhat, M.S.; Alam, A.; Ahmad, S.; Farooq, H.; Ahmad, B. Flood hazard assessment of upper Jhelum basin using morphometric parameters. Environ. Earth Sci. 2019, 78, 54. [Google Scholar] [CrossRef]
- Khalifa, A.; Bashir, B.; Çakir, Z.; Kaya, Ş.; Alsalman, A.; Henaish, A. Paradigm of Geological Mapping of the Adıyaman Fault Zone of Eastern Turkey Using Landsat 8 Remotely Sensed Data Coupled with PCA, ICA, and MNFA Techniques. ISPRS Int. J. Geo Inf. 2021, 10, 368. [Google Scholar] [CrossRef]
- Satheeshkumar, S.; Venkateswaran, S.; Kannan, R. Rainfall–runoff estimation using SCS–CN and GIS approach in the Pappiredipatti watershed of the Vaniyar sub basin, South India. Model. Earth Syst. Environ. 2017, 3, 24. [Google Scholar] [CrossRef] [Green Version]
- Reddy, G.P.O.; Maji, A.K.; Gajbhiye, K.S. Drainage morphometry and its influence on landform characteristics in a basaltic terrain, Central India–a remote sensing and GIS approach. Int. J. Appl. Earth Obs. Geoinf. 2004, 6, 1–16. [Google Scholar] [CrossRef]
- Daoudi, M.; Niang, A.J. Detection of shoreline changes along the coast of Jeddah and its impact on the geomorphological system using GIS techniques and remote sensing data (1951–2018). Arab. J. Geosci. 2021, 14, 1265. [Google Scholar] [CrossRef]
- Cools, J.; Vanderkimpen, P.; El Afandi, G.; Abdelkhalek, A.; Fockedey, S.; El Sammany, M.; Abdallah, G.; El Bihery, M.; Bauwens, W.; Huygens, M. An early warning system for flash floods in hyper-arid Egypt. Nat. Hazards Earth Syst. Sci. 2012, 12, 443–457. [Google Scholar] [CrossRef]
- Marchi, L.; Borga, M.; Preciso, E.; Gaume, E. Characterisation of selected extreme flash floods in Europe and implications for flood risk management. J. Hydrol. 2010, 394, 118–133. [Google Scholar] [CrossRef]
- Daoudi, M.; Niang, A.J. Flood Risk and Vulnerability of Jeddah City, Saudi Arabia. In Recent Advances in Flood Risk Management; IntechOpen: London, UK, 2019. [Google Scholar] [CrossRef] [Green Version]
- Monnier, O.; Guilcher, A. Le Sharm Abhur, ria récifale du Hedjaz, mer Rouge: Géomorphologie et impact de l’urbanisation. Ann. Georgr. 1993, 102, 1–16. [Google Scholar] [CrossRef]
- Alam, A.; Ahmed, B.; Sammonds, P. Flash flood susceptibility assessment using the parameters of drainage basin morphometry in SE Bangladesh. Quat. Int. 2021, 575–576, 295–307. [Google Scholar] [CrossRef]
- Khalifa, A.; Çakir, Z.; Owen, L.; Kaya, Ş. Morphotectonic analysis of the East Anatolian Fault, Turkey. Turk. J. Earth Sci. 2018, 27, 110–126. [Google Scholar] [CrossRef]
- Schumm, S.A. Evolution of Drainage Systems and Slopes in Badlands at Perth Amboy, New Jersey. Bull. Geol. Soc. Am. 1956, 67, 597–646. [Google Scholar] [CrossRef]
- Smith, K.G. Standards for grading texture of erosional topography. Am. J. Sci. 1950, 248, 655–668. [Google Scholar] [CrossRef]
- Ullah, K.; Zhang, J. GIS-based flood hazard mapping using relative frequency ratio method: A case study of Panjkora River Basin, eastern Hindu Kush, Pakistan. PLoS ONE 2020, 15, e0229153. [Google Scholar] [CrossRef] [PubMed] [Green Version]
- Melton, M.A. An Analysis of the Relations among Elements of Climate, Surface Properties, and Geomorphology; Columbia University: New York, NY, USA, 1957; p. 99. [Google Scholar]
- Weiss, A. Topographic position and landforms analysis. In Proceedings of the Poster Presentation, ESRI User Conference, San Diego, CA, USA, 9–13 July 2001; Volume 64, pp. 227–245. [Google Scholar]
- Bhat, M.A.; Dar, T.; Bali, B.S. Morphotectonic analysis of Aripal Basin in the North-Western Himalayas (India): An evaluation of tectonics derived from geomorphic indices. Quat. Int. 2020, 568, 103–115. [Google Scholar] [CrossRef]
- Charizopoulos, N.; Mourtzios, P.; Psilovikos, T.; Psilovikos, A.; Karamoutsou, L. Morphometric analysis of the drainage network of Samos Island (northern Aegean Sea): Insights into tectonic control and flood hazards. Comptes Rendus Geosci. 2019, 351, 375–383. [Google Scholar] [CrossRef]
- Adnan, M.S.G.; Dewan, A.; Zannat, K.E.; Abdullah, A.Y.M. The use of watershed geomorphic data in flash flood susceptibility zoning: A case study of the Karnaphuli and Sangu river basins of Bangladesh. Nat. Hazards 2019, 99, 425–448. [Google Scholar] [CrossRef]
- Strahler, A.N. Quantitative Geomorphology of Drainage Basins and Channel Networks. In Handbook of Applied Hydrology; Chow, V.T., Ed.; McGraw Hill: New York, NY, USA, 1954. [Google Scholar]
- Patton, P.C. Drainage basin morphometry and floods. In Flood Geomorphology; Baker, V.R., Kochel, R.C., Patton, P.C., Eds.; Wiley: New York, NY, USA, 1988; pp. 51–65. [Google Scholar]
- Betson, R.P. Drainage Basin Form and Process; A Geomorphological Approach. Soil Sci. Soc. Am. J. 1974, 38, 465. [Google Scholar] [CrossRef]
- Hamid, R.A.H.A. Application of Morphometric Analysis for Geo-Hydrological Studies Using Geo-Spatial Technology—A Case Study of Vishav Drainage Basin. J. Waste Water Treat. Anal. 2013, 4, 1–12. [Google Scholar] [CrossRef] [Green Version]
- Azor, A.; Keller, E.A.; Yeats, R.S. Geomorphic Indicators of Active Fold Growth: South Mountain-Oak Ridge Anticline, Ventura Basin, Southern California. Bull. Geol. Soc. Am. 2002, 114, 745–753. [Google Scholar] [CrossRef]
- Pinter, N.; Keller, E.A. Active Tectonics: Earthquakes, Uplift and Landscape, 2nd ed.; Prentice Hall: Upper Saddle River, NJ, USA, 2002. [Google Scholar]
- Kabite, G.; Gessesse, B. Hydro-geomorphological characterization of Dhidhessa River Basin, Ethiopia. Int. Soil Water Conserv. Res. 2018, 6, 175–183. [Google Scholar] [CrossRef]
- Costa, J.E. Hydraulics and basin morphometry of the largest flash floods in the conterminous United States. J. Hydrol. 1987, 93, 313–338. [Google Scholar] [CrossRef]
- Patton, P.C.; Baker, V.R. Morphometry and floods in small drainage basins subject to diverse hydrogeomorphic controls. Water Resour. Res. 1976, 12, 941–952. [Google Scholar] [CrossRef] [Green Version]
- Pawluszek, K.; Borkowski, A. Impact of DEM-derived factors and analytical hierarchy process on landslide susceptibility mapping in the region of Rożnów Lake, Poland. Nat. Hazards 2017, 86, 919–952. [Google Scholar] [CrossRef] [Green Version]
- Jebur, M.N.; Pradhan, B.; Tehrany, M.S. Optimization of landslide conditioning factors using very high-resolution airborne laser scanning (LiDAR) data at catchment scale. Remote Sens. Environ. 2014, 152, 150–165. [Google Scholar] [CrossRef]
- Pourghasemi, H.R.; Moradi, H.R.; Aghda, S.M.F.; Gokceoglu, C.; Pradhan, B. GIS-based landslide susceptibility mapping with probabilistic likelihood ratio and spatial multi-criteria evaluation models (North of Tehran, Iran). Arab. J. Geosci. 2014, 7, 1857–1878. [Google Scholar] [CrossRef] [Green Version]
- Schmidt, F.; Persson, A. Comparison of DEM Data Capture and Topographic Wetness Indices. Precis. Agric. 2003, 4, 179–192. [Google Scholar] [CrossRef]
- Sørensen, R.; Zinko, U.; Seibert, J. On the calculation of the topographic wetness index: Evaluation of different methods based on field observations. Hydrol. Earth Syst. Sci. 2006, 10, 101–112. [Google Scholar] [CrossRef] [Green Version]
- Wu, Y.; Giri, S.; Qiu, Z. Understanding the spatial distribution of hydrologic sensitive areas in the landscape using soil topographic index approach. Int. Soil Water Conserv. Res. 2016, 4, 278–283. [Google Scholar] [CrossRef] [Green Version]
- De Risi, R.; Jalayer, F.; De Paola, F.; Lindley, S. Delineation of flooding risk hotspots based on digital elevation model, calculated and historical flooding extents: The case of Ouagadougou. Stoch. Environ. Res. Risk Assess. 2018, 32, 1545–1559. [Google Scholar] [CrossRef] [Green Version]
- Gessler, P.E.; Moore, I.D.; McKenzie, N.J.; Ryan, P.J. Soil-landscape modelling and spatial prediction of soil attributes. Int. J. Geogr. Inf. Syst. 1995, 9, 421–432. [Google Scholar] [CrossRef]
- Görüm, T. Tectonic, topographic and rock-type influences on large landslides at the northern margin of the Anatolian Plateau. Landslides 2019, 16, 333–346. [Google Scholar] [CrossRef]
- De Reu, J.; Bourgeois, J.; Bats, M.; Zwertvaegher, A.; Gelorini, V.; De Smedt, P.; Chu, W.; Antrop, M.; De Maeyer, P.; Finke, P.; et al. Application of the topographic position index to heterogeneous landscapes. Geomorphology 2013, 186, 39–49. [Google Scholar] [CrossRef]
- Woods, R.; Sivapalan, M. A connection between topographically driven runoff generation and channel network structure. Water Resour. Res. 1997, 33, 2939–2950. [Google Scholar] [CrossRef]
Figure 1.
(a). Location of Saudi Arabia in world; (b). Location map showing the country of Saudi Arabia in relation to neighboring countries; (c). Shaded relief illustrating the examined basin, drainage streams, and pour points of the study basins (B1–B13).
Figure 1.
(a). Location of Saudi Arabia in world; (b). Location map showing the country of Saudi Arabia in relation to neighboring countries; (c). Shaded relief illustrating the examined basin, drainage streams, and pour points of the study basins (B1–B13).

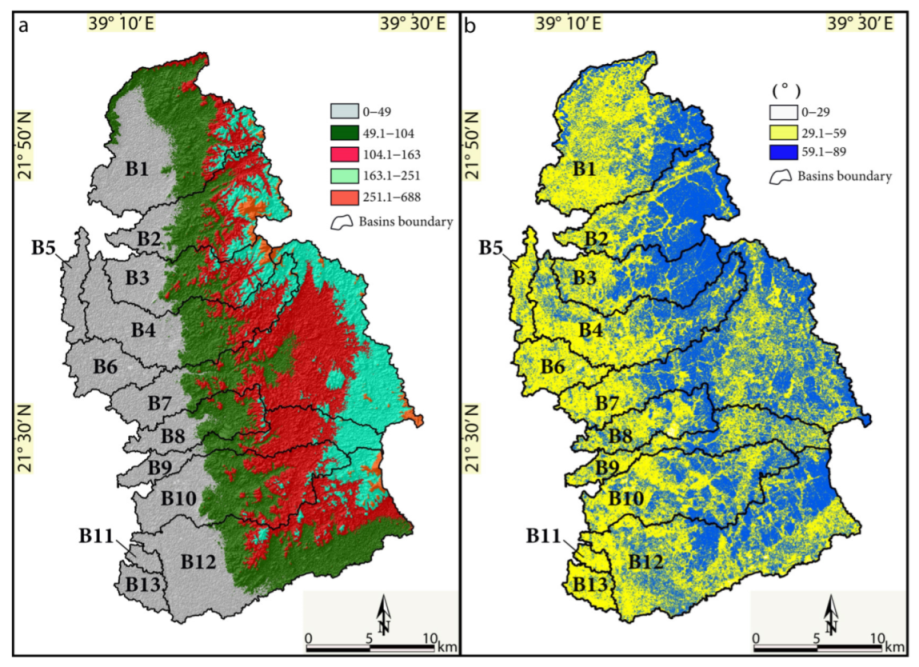
Figure 2.
(a). Digital elevation model (SRTM 30 m resolution) and (b). Slope map.

Figure 3.
Precipitation pattern model from Tropical Rainfall Measuring Mission (TRMM) of (a) November 2009, (b) January 2010, and (c) January 2011.
Figure 3.
Precipitation pattern model from Tropical Rainfall Measuring Mission (TRMM) of (a) November 2009, (b) January 2010, and (c) January 2011.

Figure 4.
Methodological flow chart proposed in the study region.

Figure 6.
(a), Topographic position index (TPI) and (b), Topographic wetness index (TWI).

Figure 7.
Map of relative flood susceptibility of the basins.

Figure 8.
Flash flood susceptibility map of all the parts in each basin.

Table 1.
Several examples of flash flood events are indicators for the seriousness of destructive flash flooding during the last 50 years.
Table 1.
Several examples of flash flood events are indicators for the seriousness of destructive flash flooding during the last 50 years.
| Date | Flash Flood | Description |
|---|---|---|
| November 1972 | Moderate | The quantity of rain recorded 83 mm in a very short time damaged old streets and formed many swamps |
| November 1979 | High | The water reached around 1 m on streets, and life ceased totally for about three days |
| November 1985 | Moderate | It happened after heavy rainfall in Jeddah and the neighboring areas. It blocked the road to Mecca and forced the local schools to close |
| November 2009 | High | It caused at least 113 deaths, and some roads were covered by around 1 m of water. In this event, at least 3000 vehicles were damaged or swept away. |
| January 2010 | High | It left about 122 fatalities, and more than 350 people were reported missing |
| January 2011 | High | During this event, about 10 people were reported to have been killed, and 1500 families were left homeless |
Table 2.
Morphometric and topographic parameters.
| Index | Mathematical Formula of Basins | Reference |
|---|---|---|
| Area, A (km2) | A expresses the total area from drainage divide to catchment outlet point. | [7] |
| Perimeter, P (km) | P expresses the total length of the basin boundary. | [47] |
| Length, L (km) | L expresses the maximum length of the basin measured parallel to the main basin river. | [47] |
| Stream number, Nu | Nu = N1 + N2 + N3 +N4 + ……. + Nn. | [29] |
| Stream length, Lu | Lu = L1 + L2 + L3 +L4 + ………...+ Ln. | [29] |
| Stream order, Su | Hierarchical rank. | |
| Bifurcation ratio, Rb | Rb = Nu/Nu + 1, where Nu is the number value of streams of any given order, and Nu+1 represents the number value for the next higher order. | [28] |
| Stream frequency, Fs | Fs = Nu/A, where Nu is the average total number of all order streams, and A is the basin area. | [45] |
| Form factor, F | F = A/L2, where A is the basin area, and L2 is the squared basin length. | [45] |
| Texture ratio, Rt | Rt = Nu/P, where Nu is the average total number of all order streams, and P is the basin perimeter. | [48] |
| Drainage density, Dd | Dd = Lu/A, where Lu is the total length of all basin segments, and A is the basin area. | [49] |
| Infiltration number, If | If = Fs/Dd, where Fs is the stream frequency, and Dd represents the drainage density. | [45] |
| Basin relief, H (m) | H = Hmax−Hmin, where Hmax and Hmin are the highest and lowest points of the proposed basin, respectively. | [47] |
| Ruggedness number, Rn | Rn = Dd × (H/1000), where Dd expresses the drainage density, and H is the basin relief. | [50] |
| Relief ratio, Rr | Rr = H/L, where Hr represents the basin relief, and L is the basin length. | [47] |
| Topographic Position Index (TPI) | TPI = M0 − , where M0 = elevation of the model point under evaluation; Mn = elevation of grid, and n = the total number of surrounding points employed in the evaluation. | [51] |
| Topographic Wetness Index (TWI) | TWI = ln (a/tanβ), where a is the specific catchment area (SCA) meaning the local upslope area draining through a certain point per unit contour length, which is equal to a certain grid cell width, and β is the local slope. | [45] |
Table 3.
Basic morphometric values of the studied basins.
| Basins | Area (A), Km2 | Perimeter (P), Km | Length (L), m | Mean Elevation (H) m |
|---|---|---|---|---|
| B1 | 208.67 | 90.23 | 20.2 | 401 |
| B2 | 126.77 | 75.79 | 22.81 | 496 |
| B3 | 102.68 | 66.36 | 22.45 | 530 |
| B4 | 144.97 | 103.73 | 36.41 | 356 |
| B5 | 43.53 | 29.9 | 14.62 | 25 |
| B6 | 51.71 | 62.7 | 12.25 | 46 |
| B7 | 298.22 | 147.78 | 31.33 | 687 |
| B8 | 62.02 | 57.01 | 17.16 | 240 |
| B9 | 82.17 | 93.04 | 32.2 | 932 |
| B10 | 148.05 | 82.29 | 25.85 | 237 |
| B11 | 8.24 | 16.15 | 4.36 | 29 |
| B12 | 264.68 | 117.57 | 35.4 | 542 |
| B13 | 20.81 | 2569 | 7.13 | 25 |
Disclaimer/Publisher’s Note: The statements, opinions and data contained in all publications are solely those of the individual author(s) and contributor(s) and not of MDPI and/or the editor(s). MDPI and/or the editor(s) disclaim responsibility for any injury to people or property resulting from any ideas, methods, instructions or products referred to in the content. |
© 2023 by the author. Licensee MDPI, Basel, Switzerland. This article is an open access article distributed under the terms and conditions of the Creative Commons Attribution (CC BY) license (https://creativecommons.org/licenses/by/4.0/).
Share and Cite
MDPI and ACS Style
Bashir, B. Morphometric Parameters and Geospatial Analysis for Flash Flood Susceptibility Assessment: A Case Study of Jeddah City along the Red Sea Coast, Saudi Arabia. Water 2023, 15, 870. https://doi.org/10.3390/w15050870
AMA Style
Bashir B. Morphometric Parameters and Geospatial Analysis for Flash Flood Susceptibility Assessment: A Case Study of Jeddah City along the Red Sea Coast, Saudi Arabia. Water. 2023; 15(5):870. https://doi.org/10.3390/w15050870
Chicago/Turabian StyleBashir, Bashar. 2023. "Morphometric Parameters and Geospatial Analysis for Flash Flood Susceptibility Assessment: A Case Study of Jeddah City along the Red Sea Coast, Saudi Arabia" Water 15, no. 5: 870. https://doi.org/10.3390/w15050870
Note that from the first issue of 2016, this journal uses article numbers instead of page numbers. See further details here.