Article

Calculation of Head Losses and Analysis of Influencing Factors of Crossing Water-Conveyance Structures of Main Canal of Middle Route of South-to-North Water Diversion Project

1
China Institute of Water Resources and Hydropower Research, Beijing 100038, China
2
China South-to-North Water Diversion Middle Route Corporation Limited, Beijing 100038, China
*
Author to whom correspondence should be addressed.
Water 2023, 15(5), 871; https://doi.org/10.3390/w15050871
Submission received: 10 February 2023 / Revised: 20 February 2023 / Accepted: 22 February 2023 / Published: 23 February 2023
(This article belongs to the Special Issue Water Distribution and Drainage Systems)

Abstract

:
The main canal of the middle route of the South-to-North Water Diversion Project has the risk of excess head loss in crossing water-conveyance structures, but the assessment of this risk faces difficulties such as the lack of sufficient monitoring points inside the structures, the current water-conveyance flow rate being lower than the design maximum flow rate, and the lack of verification of monitoring data. Monitoring data of the main canal were collected in 2022, prototype observations were carried out, the monitoring data were verified, and a method for calculating the head loss using the combined head loss coefficient was proposed. The assessment of 143 structures showed that 40 structures had excess head losses, including 31 inverted siphons, four aqueducts, four underdrains, and one culvert. The 143 structures had a total residual head of 3.05 m, accounting for 9% of the distributed head. In addition to natural aging, freshwater mussel and algal attachment, sediments, and undesirable flow regimes were all important influencing factors that caused the head loss to increase. It is recommended to take measures such as regular removal of sediments and algae and freshwater mussel attachments, optimization of inlet and outlet shapes, and application of roughness-reducing materials.

1. Introduction

Officially opened in December 2014, the main canal of the first phase of the middle route of the South-to-North Water Diversion (hereinafter referred to as the Main Canal) is the world’s largest inter-basin water-conveyance project [1], with a total length of 1432 km and a planned average multi-year water diversion capacity of 9.5 billion m3. The Main Canal draws water from the Danjiangkou Reservoir and supplies water to Henan, Hebei, Tianjin, and Beijing (Figure 1). It has become the main water source for many cities along the route, especially for Beijing and Tianjin, two municipalities directly under the Central Government, conveying 9.212 billion m3 of water in 2021–2022. At the beginning of the design of the Main Canal, considering the requirements of efficient utilization of water resources as well as the cost and rationality of the project, two flow rate criteria, namely, the design flow rate and the increased flow rate (i.e., the design maximum water-conveyance flow rate), were adopted [2]. In general, all sections of the Main Canal have a probability of conveying water above the design flow rate or even at the increased flow rate, but not for an extended period of time. For example, the probabilities of operation above the design flow rate and at the increased flow rate in the first section of the canal are about 20% and 4%, respectively. The Project of Water Diversion from the Yangtze River to the Hanjiang River, a follow-up project of the South-North Water Diversion Project, started in July 2022 and will be completed in 2031, after which it is estimated that the multi-year average water diversion capacity of the Main Canal will increase to 11.51 billion m3 and the probability of conveying water at the maximum design flow rate of the Main Canal will increase.
The Main Canal is a typical water-conveyance project with a long distance, low head, and large flow rate. The whole route has a distributed head of only 87.08 m, of which crossing water-conveyance structures account for 42 m or 48% [3]. In the process of water-conveyance with a high flow rate in recent years, phenomena such as high water levels in some sections of the Main Canal, undesirable flow regimes of some crossing water-conveyance structures, and large fluctuations of the water level have occurred many times [4,5,6], indicating that there is a local risk of an insufficient water-conveyance capacity in the Main Canal and an urgent need to assess the head loss under the design maximum water-conveyance flow rate. Relevant methods include hydraulic model tests [7,8,9,10,11,12], prototype observations [13,14], and numerical model simulations [4,5,6]. To carry out the assessment, it is necessary to arrange a sufficient number of monitoring points inside the structures, measure under the design operating conditions, and use equations to calculate the frictional head loss and local head loss [15] to calibrate parameters such as the roughness coefficient [16,17] and head loss coefficient [18,19,20]. The dimensions and roughness coefficient of the flow sections of the Main Canal have changed to some extent after its continuous operation for eight years. Therefore, it is difficult to construct an accurate hydraulic model or numerical simulation model, while a direct and effective method is to carry out the assessment based on the monitoring data of the project itself. However, some issues need to be addressed. First, the monitoring points are only located at the inlet and outlet of each crossing water-conveyance structure of the Main Canal, and therefore, the roughness and head loss coefficient of the internal structure cannot be calibrated separately, preventing the direct use of the conventional equations for head loss calculations. Second, the current water-conveyance flow rate of the Main Canal is lower than the design maximum water-conveyance flow rate (i.e., the increased flow rate), so the estimation can only be made based on the current monitoring data obtained at low flow rates. Finally, the monitoring equipment in the project is installed in the field, and the monitoring data are easily affected by environmental and human factors. Thus, the data need to be verified before use.
This study was carried out based on the monitoring data of the Main Canal from April to August of 2022. In total, 30 out of 158 crossing water-conveyance structures were selected, and observations were made simultaneously using high-precision portable instruments to correct some of the monitoring data. A head loss calculation method using the combined head loss coefficient was proposed to estimate the head losses of 143 analysis-ready structures. The total number of buildings with the measured head loss less than or equal to the distributed head loss and their number in each subgroup, as well as the spatial distribution of head losses of the structures, were statistically analyzed, the main influencing factors causing head loss to increase were examined, and countermeasures and suggestions were proposed. This research method can be used as a reference for similar large-scale long-distance open channel water-conveyance projects.

2. Materials and Methods
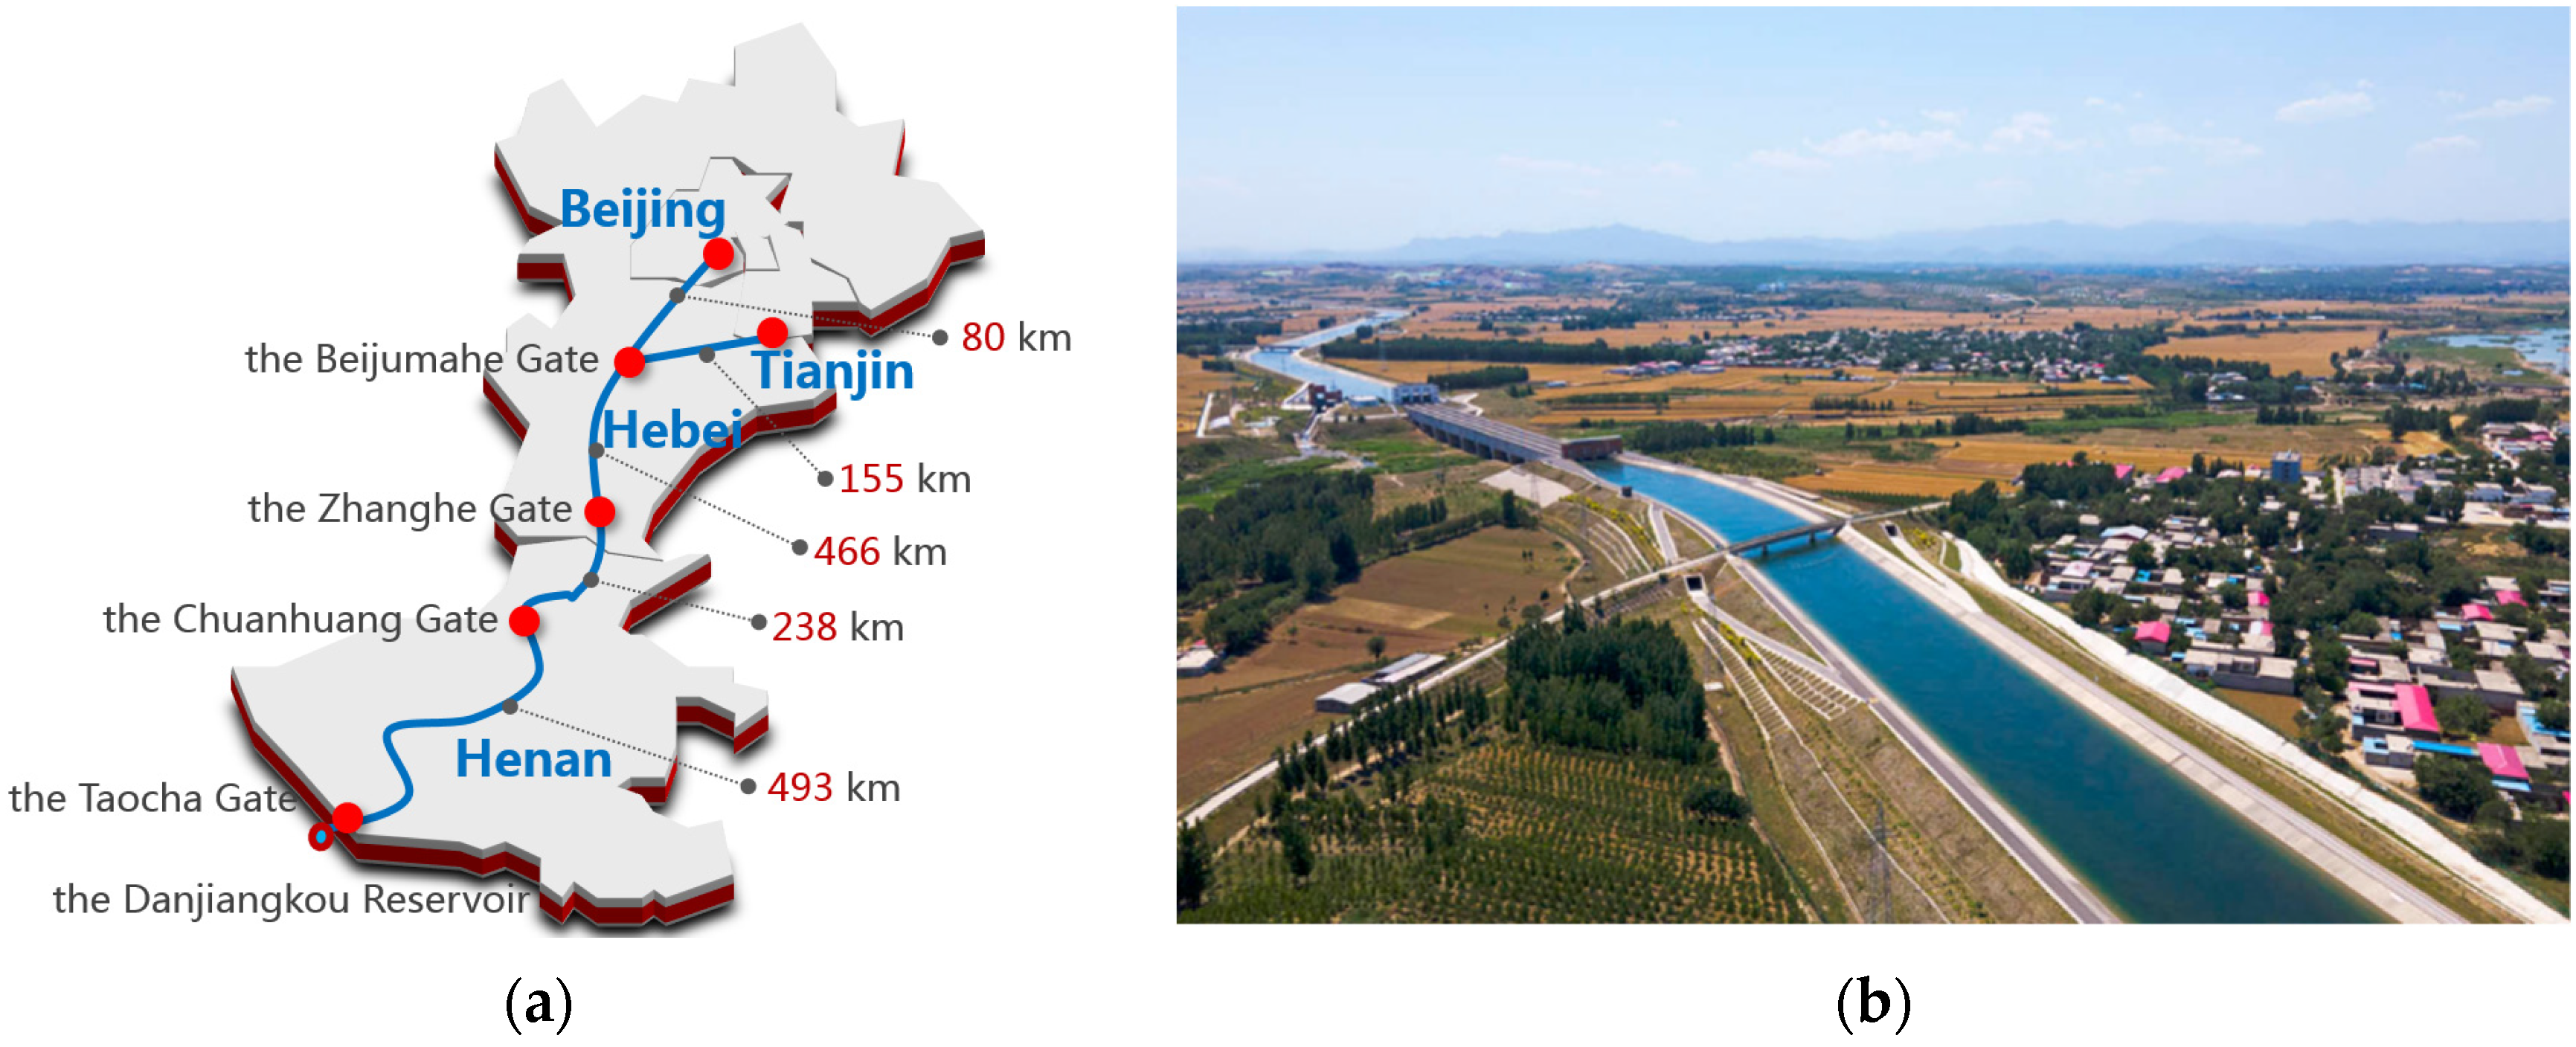
2.1. Study Area

The 158 crossing water-conveyance structures to be assessed are all located in the section between the Taocha Gate and Beijumahe Gate of the Main Canal. This section is 1197 km long and relies on the gravity flow for water-conveyance along the whole route. The Main Canal has a design flow rate of 350 m3/s and an increased flow rate of 420 m3/s at the starting point, and a design flow rate of 50 m3/s and an increased flow of 60 m3/s at the ending point. The canal has a wide and shallow trapezoidal section with a full section of concrete lining, a design roughness coefficient of 0.015 (taking into account the head losses of the transition sections, bends, and piers of bridges crossing the canal), a side slope of 1.5–3.5, and an average bottom slope of 1/25,000. The size of the canal section decreases from south to north with the flow rate, the design water depth changes from 8.0 to 3.8 m, and the bottom width changes from 29.0 to 7.0 m [3]. The freeboard of the canal was designed based on the water surface profile for the increased flow rate and varies in the range of 0.8 to 1.8 m.
The 158 crossing water-conveyance structures include 102 inverted siphons, 27 aqueducts, 17 underdrains, and 12 culverts. Each structure consists of an inlet transition section, an inlet gate chamber section, a main structure section, an outlet gate chamber section, and an outlet transition section, with a design roughness coefficient of 0.014 (Figure 2, an example). There are 61 control gates in total, with an average spacing of about 20 km, of which 59 are arranged in combination with the crossing water-conveyance structures and located at the inlets of aqueducts, culverts, and underdrains and at the outlets of inverted siphons.
Water gauges are installed at the inlets and outlets of the crossing water-conveyance structures, located upstream of the inlet transition section and downstream of the outlet transition section, and the water level is read manually through a camera. There are 59 crossing water-conveyance structures with control gates, near which pressure water level gauges (or ultrasonic water level gauges) and ultrasonic flowmeters are installed to automatically monitor the water levels and flow rates. The study area contains a total of 97 offtakes, all of which are equipped with ultrasonic flowmeters.

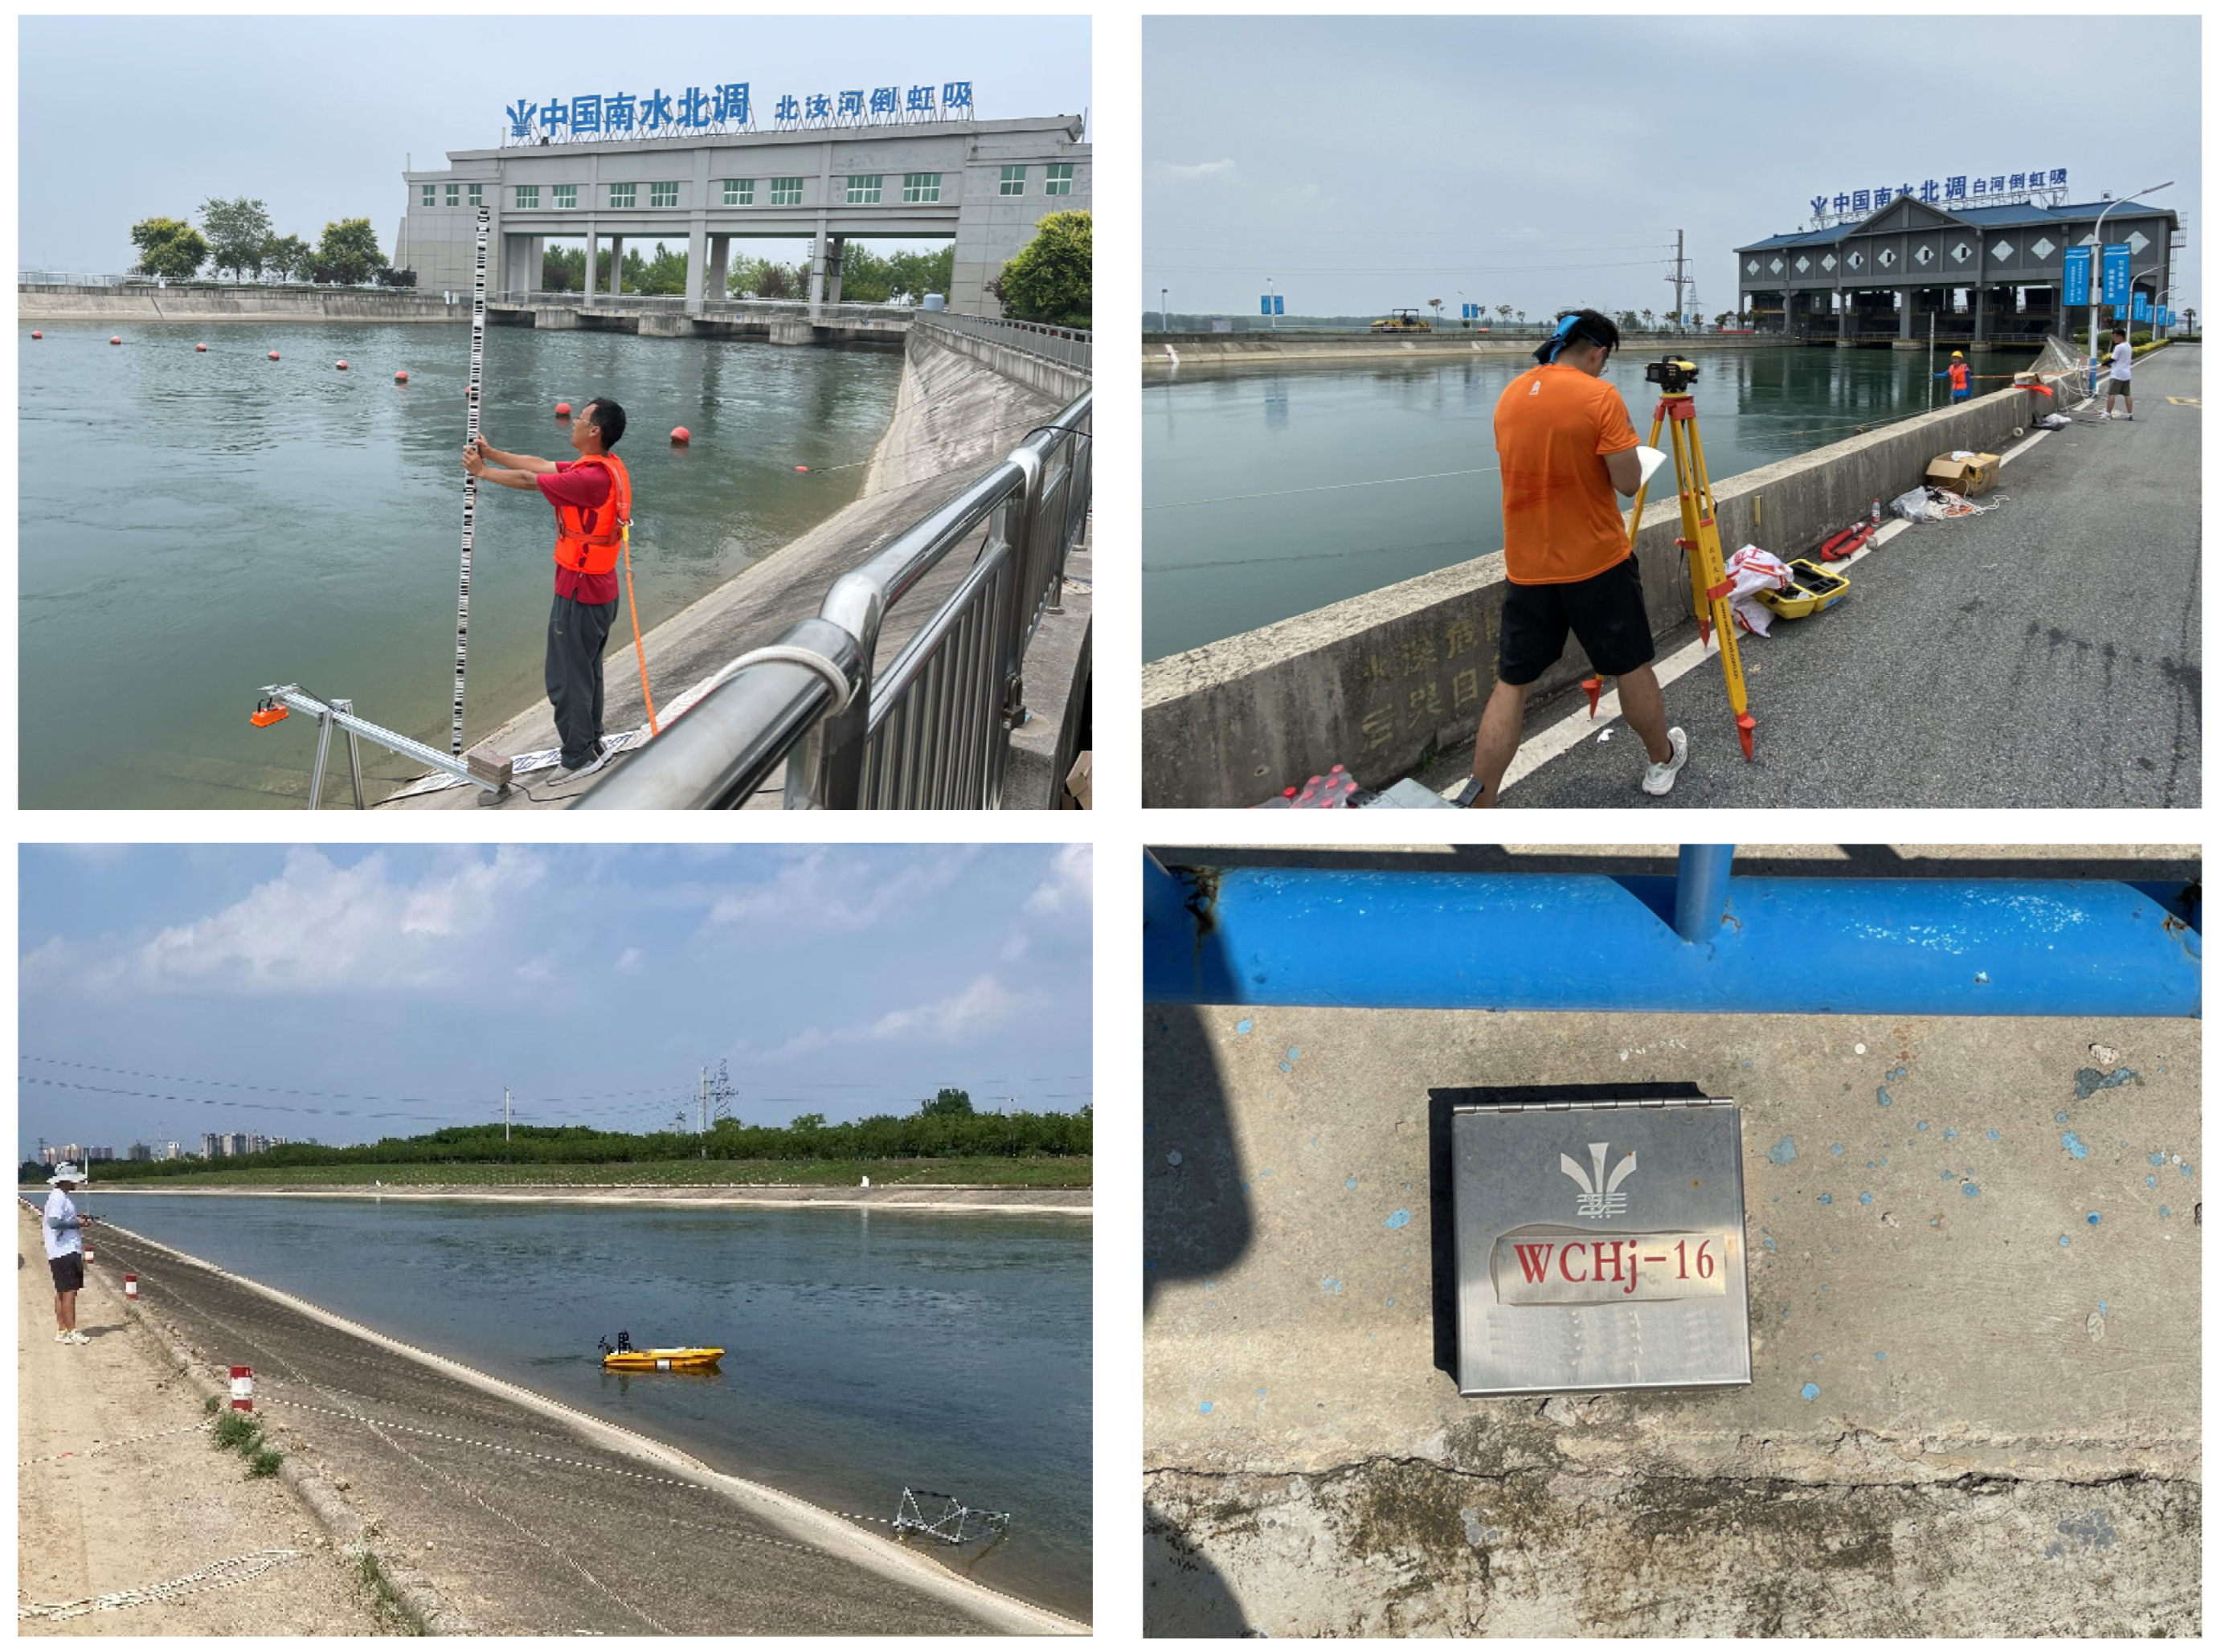
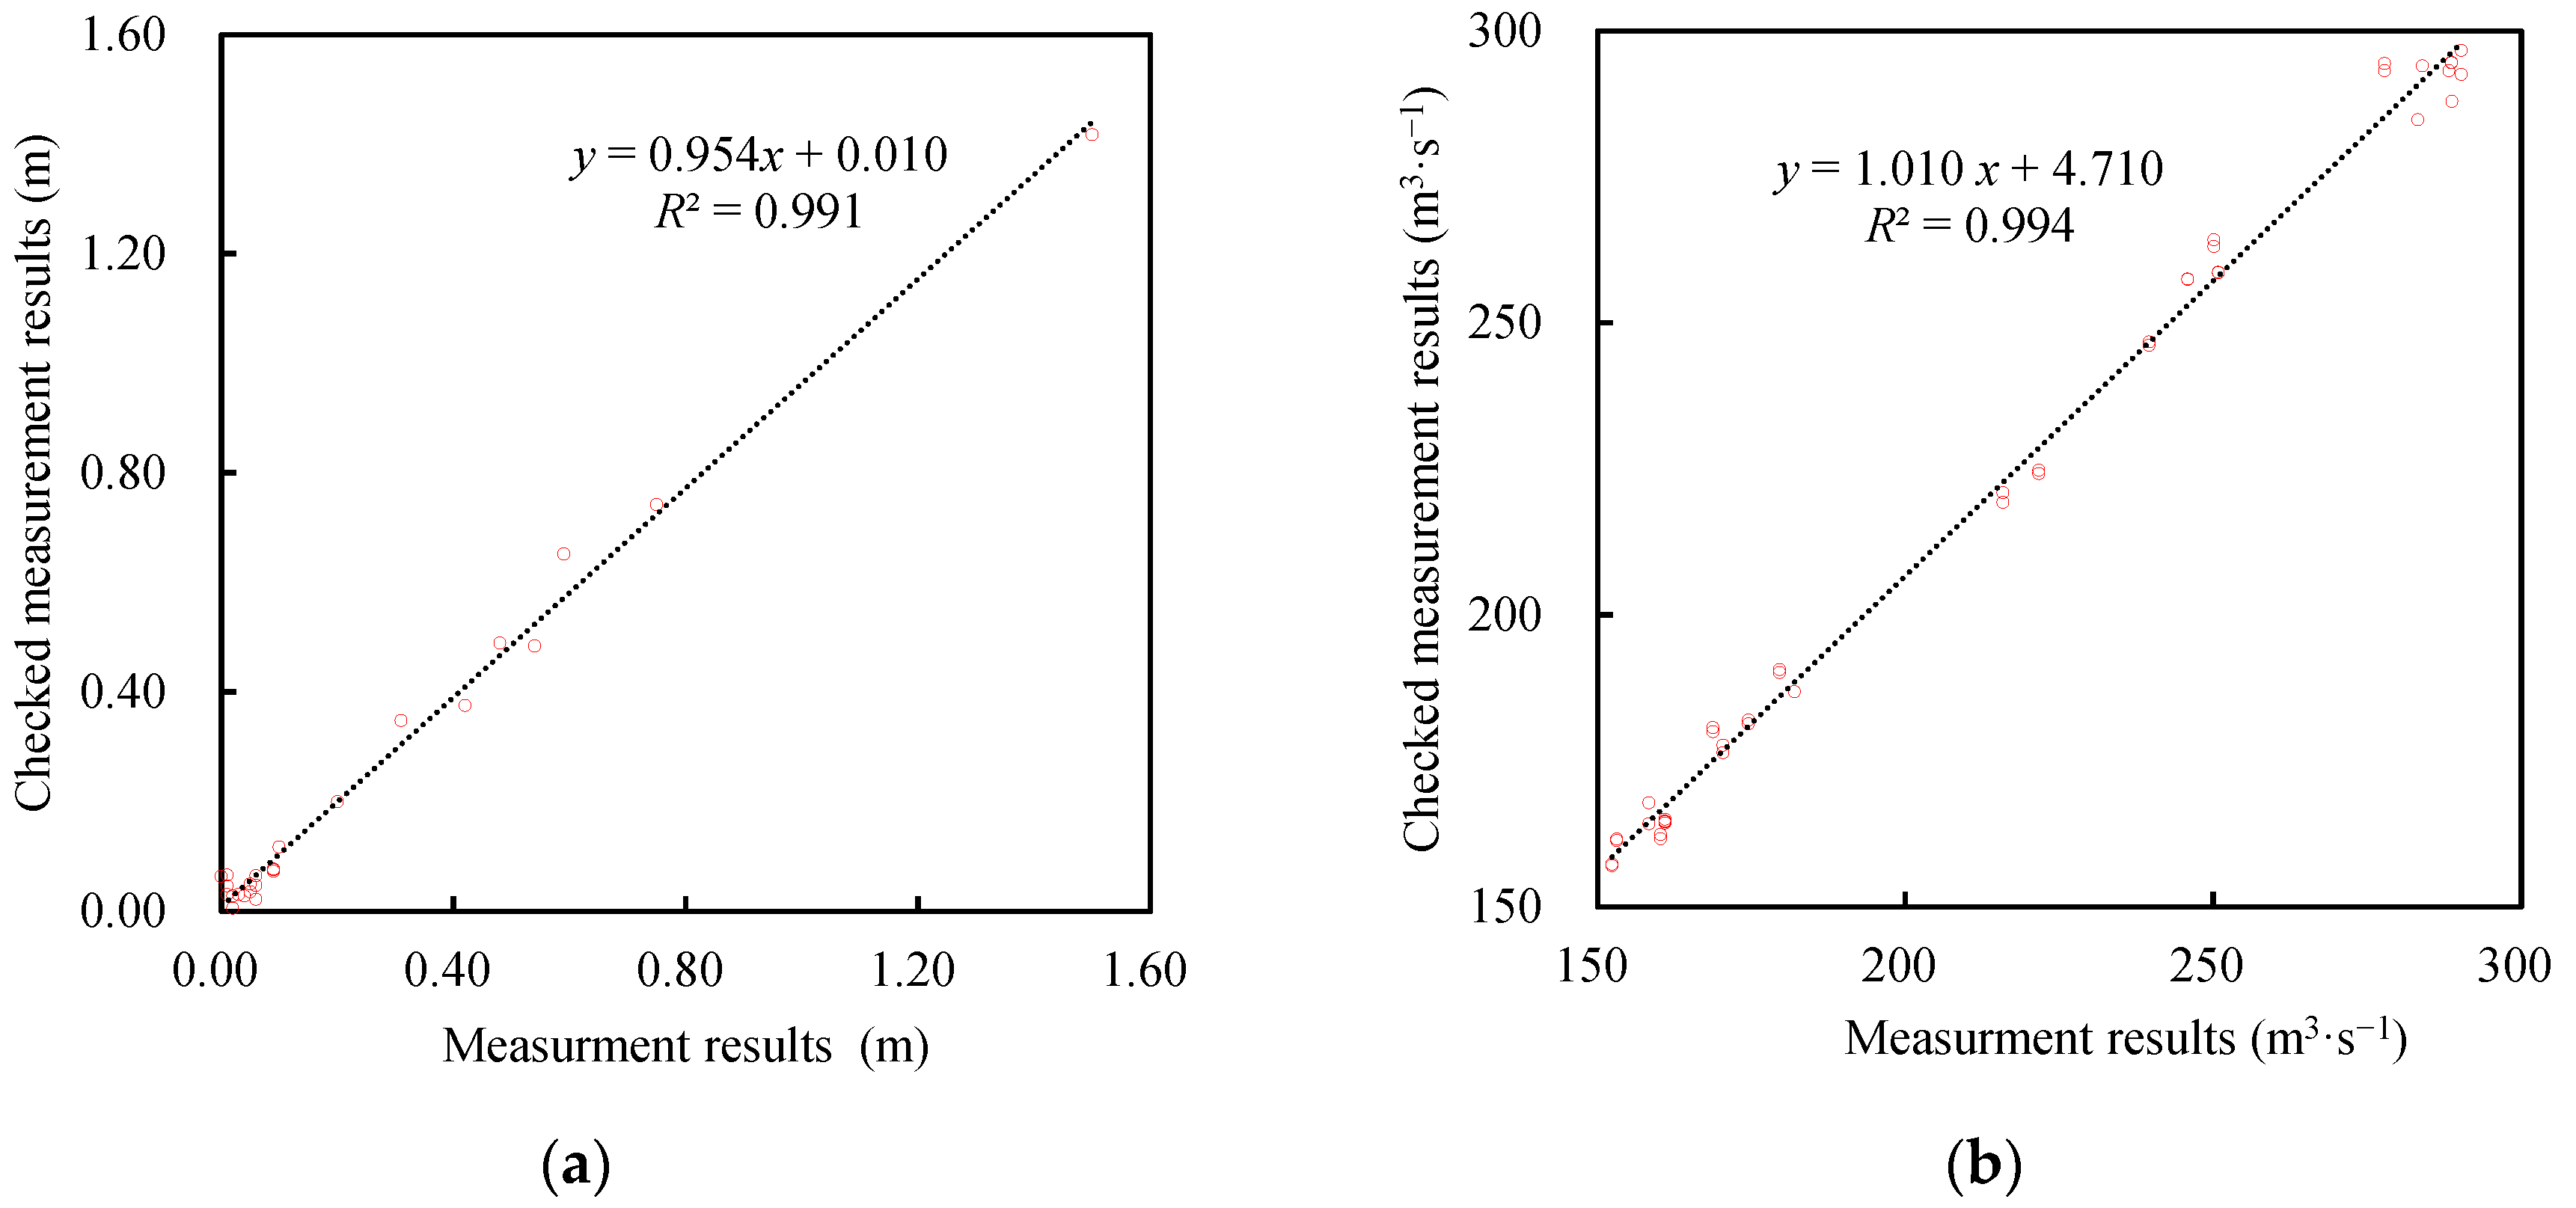
2.2. Data Collection and Checking

From April to August of 2022, water-conveyance with a high flow rate was implemented in the Main Canal, and the flow rate reached or exceeded the design flow rate during some periods. The personnel at field management stations used the water level gauges and flowmeters installed in the project to record the water level and flow rate at the inlet and outlet of each structure, as well as the control status of the gates at 10:00 a.m. and 16:00 p.m. every day, as shown in Table 1. Analysis showed that 143 of the 158 structures had the monitoring data of more than 15 days of water conveyance with free flow (i.e., the gates of the structures were fully opened) for head loss analysis.
During the above-mentioned water-conveyance with a high flow rate, the researchers of this study used equipment such as radar water level gauges and shipborne acoustic doppler current profilers (ADCPs) (Table 2) to conduct prototype observations of 30 structures (including 20 inverted siphons, seven aqueducts, two culverts, and one underdrain). In-site elevation benchmarks are utilized to locate and calibrate the instruments (Figure 3). In addition to the water levels and flow rates at the inlets and outlets of these structures, the water-conveyance flow regimes at the inlets and outlets and inside of the open flow sections were recorded.
The measurement results offered by the field management stations in the project and the checked measurement results from researchers in this study are compared in Figure 4. The analysis shows that the two sets of results were generally in good agreement. The water levels measured in the project had random errors with deviations in the range of ±0.10 m. The flow rates measured in the project had overall relatively small systematic errors with deviations of less than 7.2%. Based on the examined measurement data, the flow rate correction equation in Figure 4b was fitted to correct the measured flows in the project.

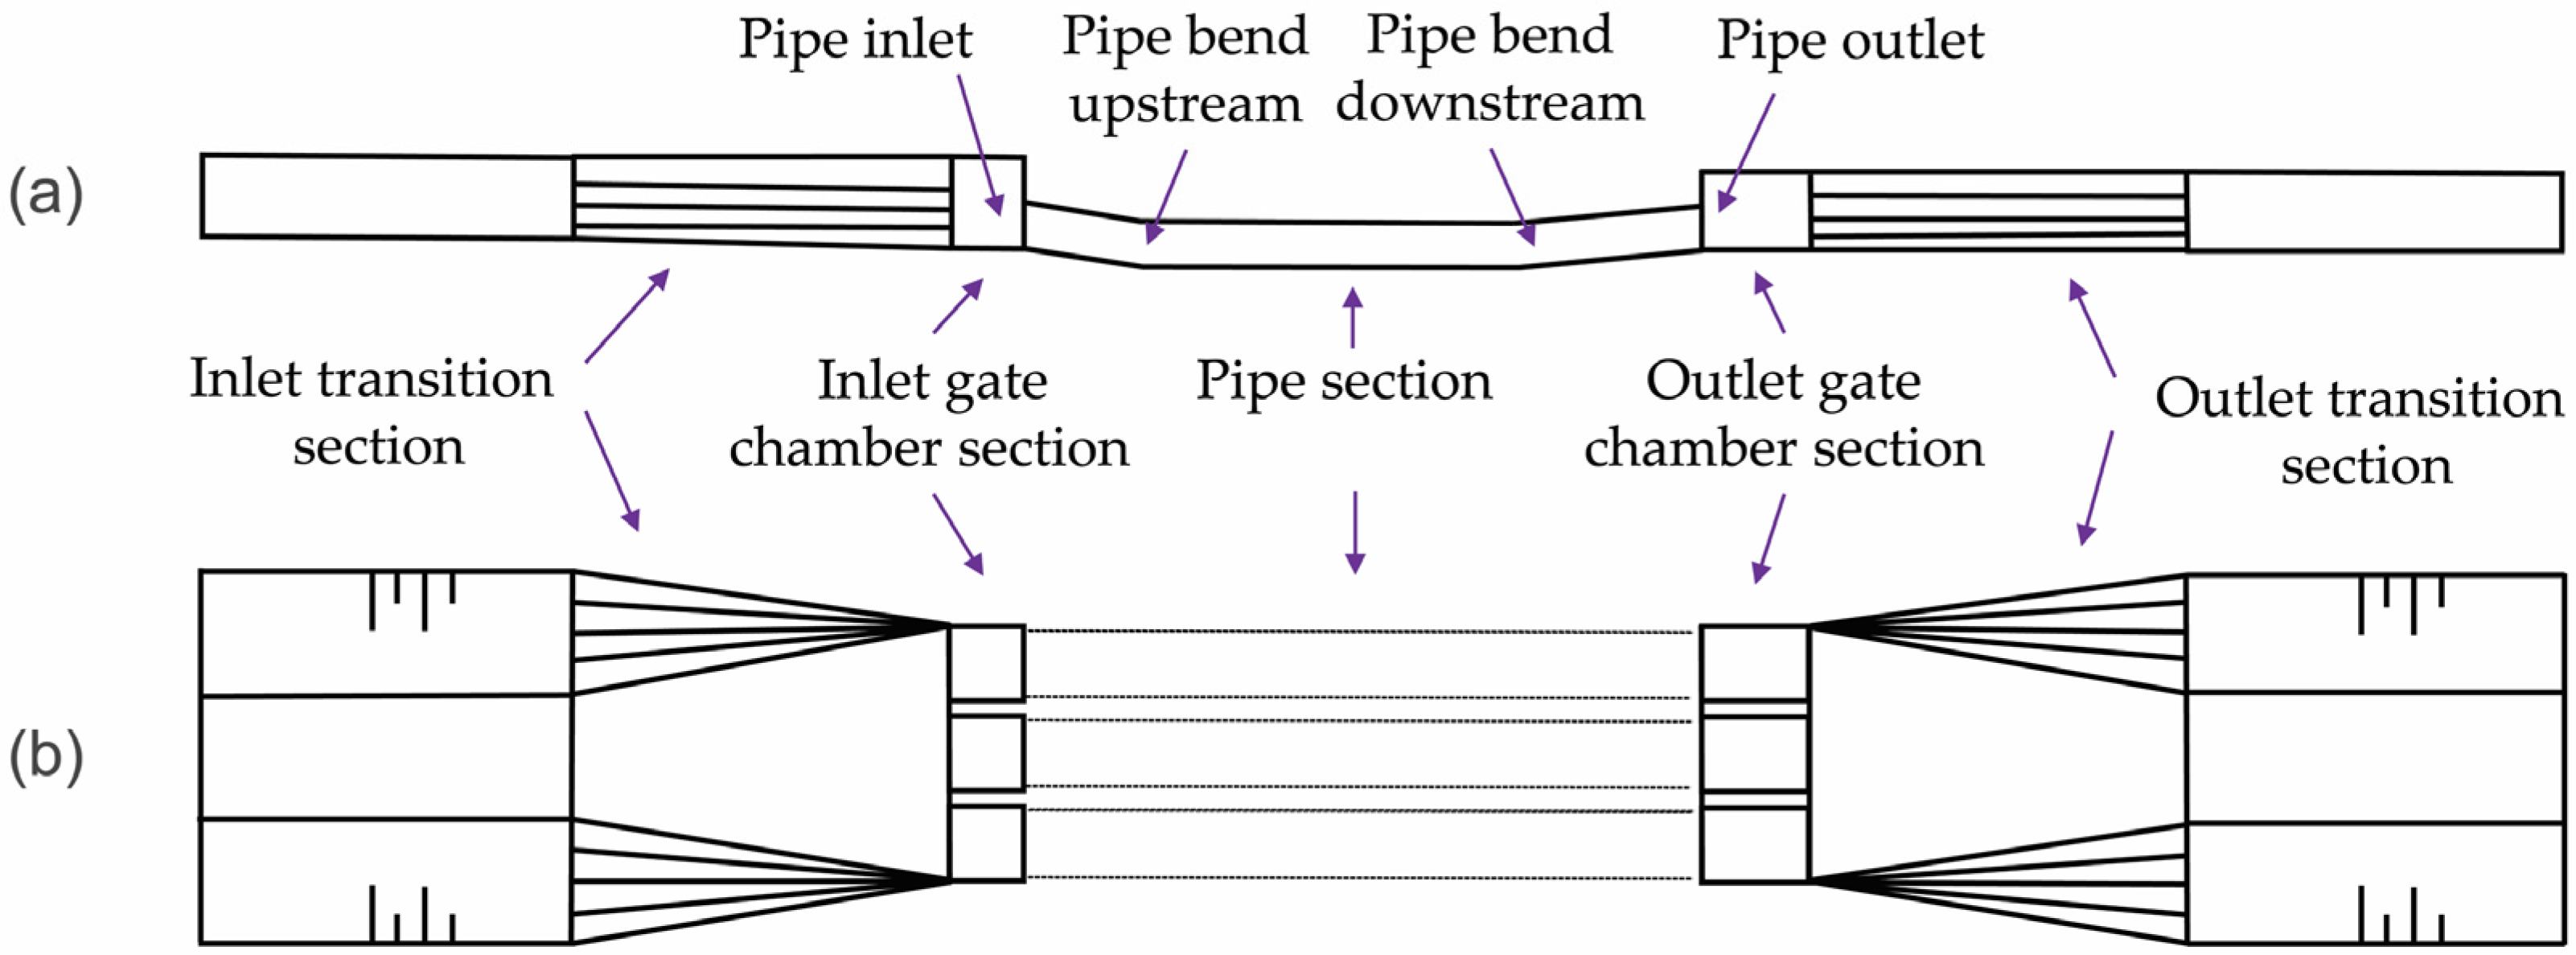
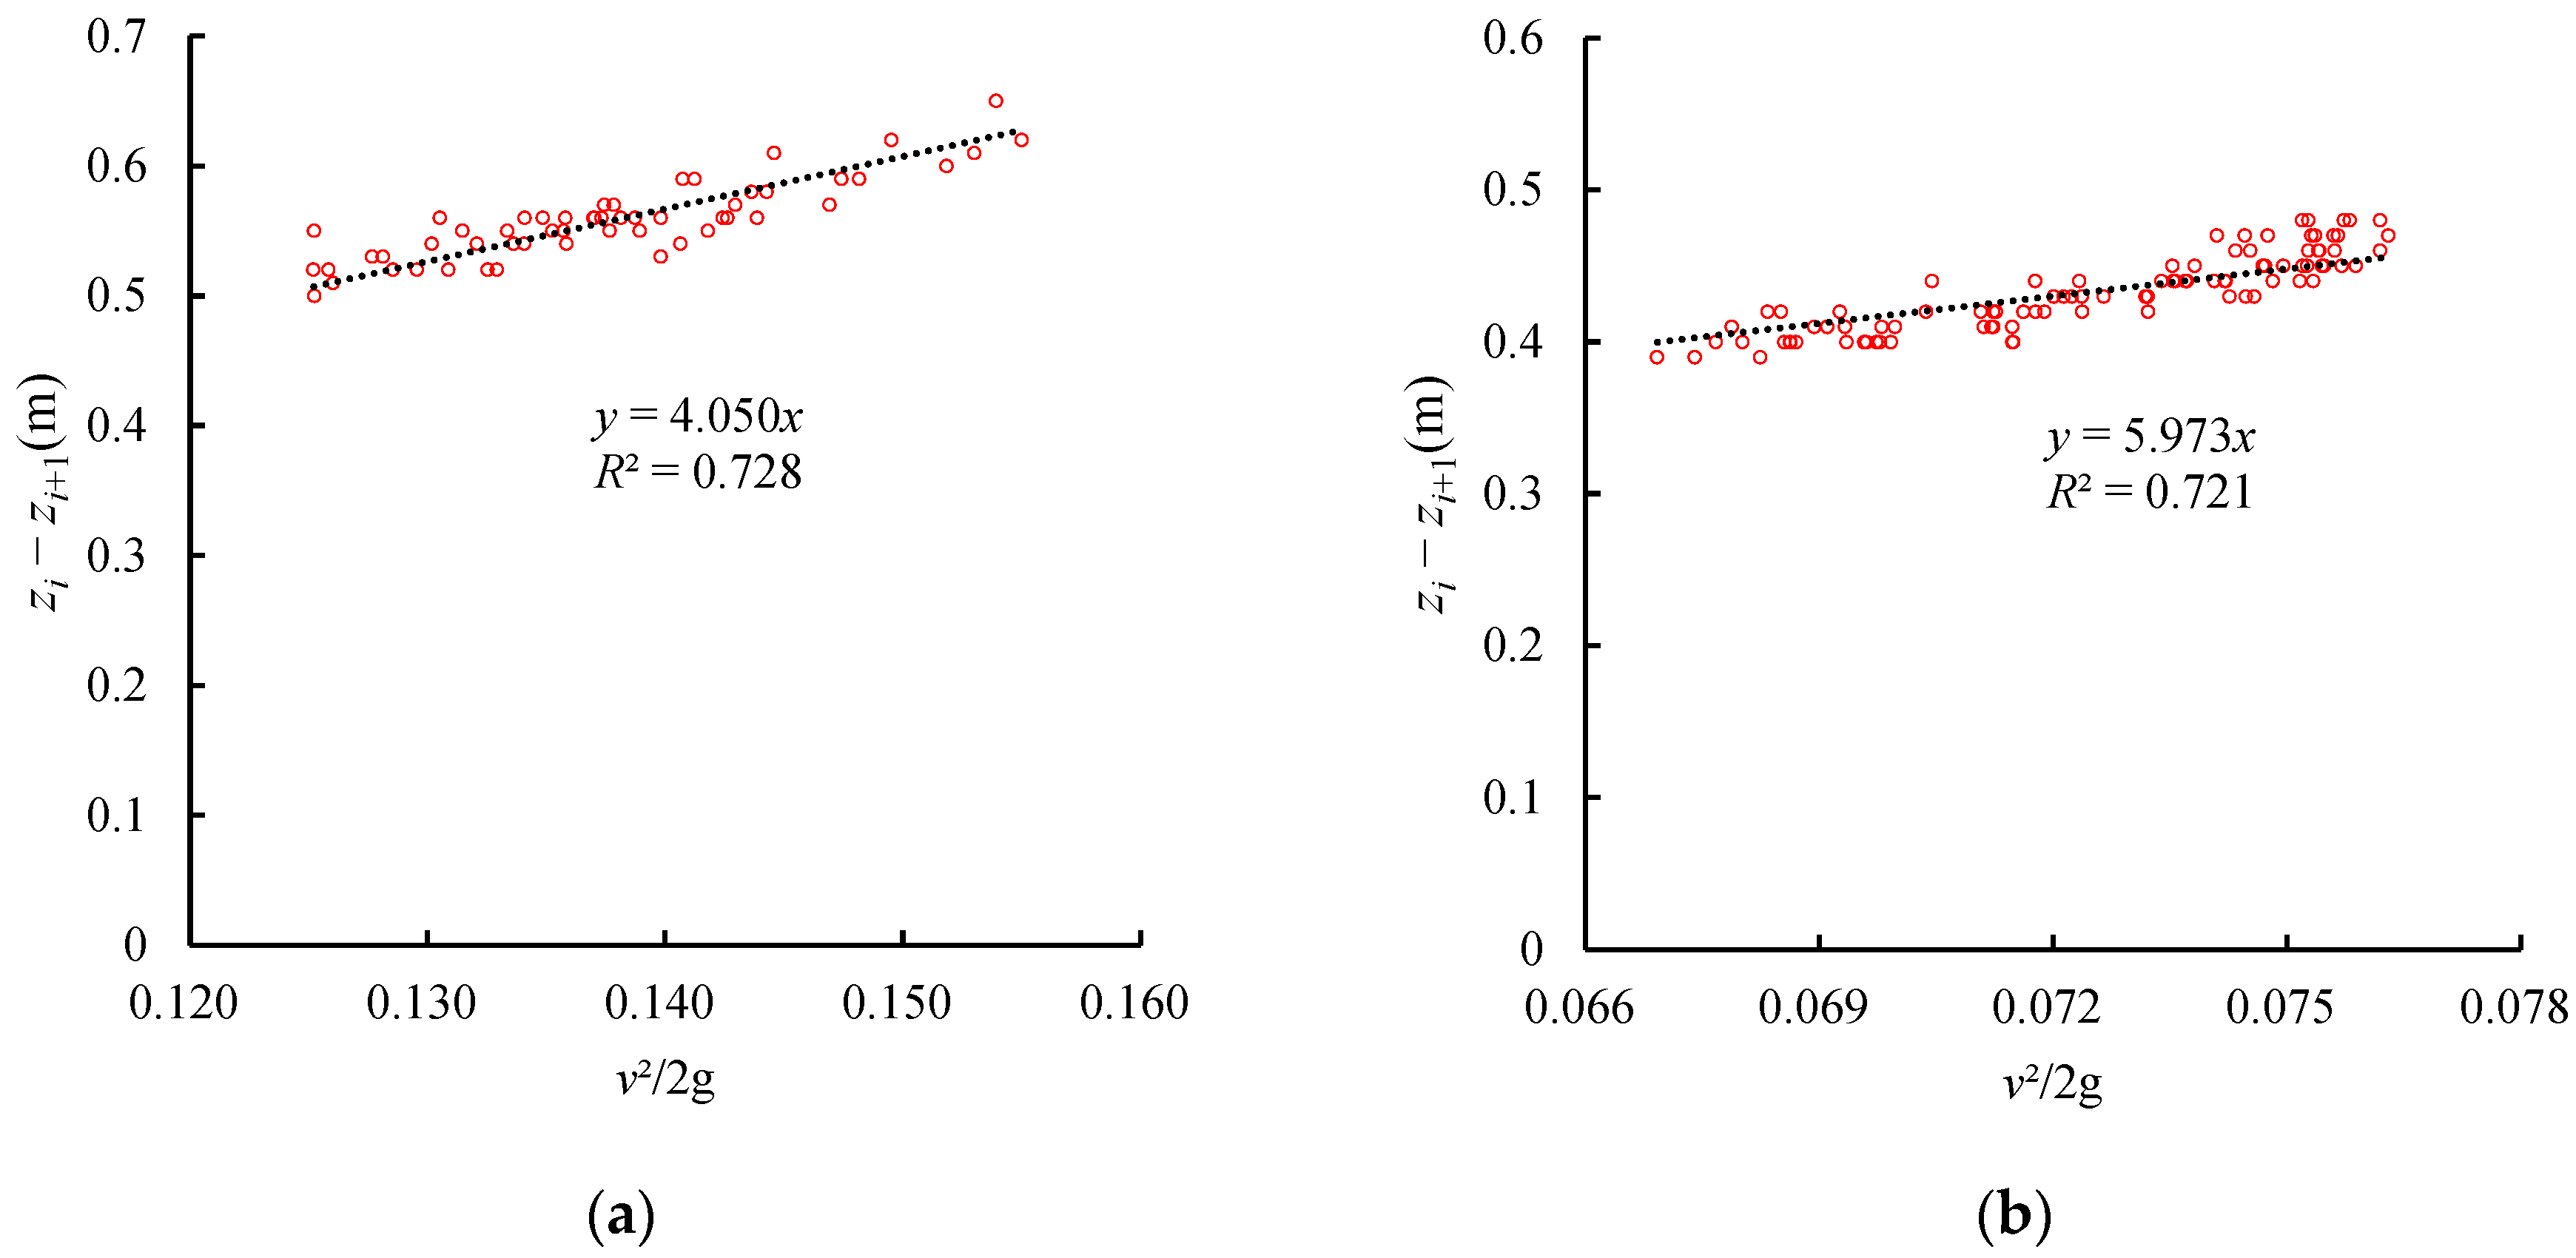
2.3. Method for Calculating Head Losses of Crossing Water-Conveyance Structures

A crossing water-conveyance structure is composed of inlet and outlet transition sections, inlet and outlet gate chamber sections, and a main section. The total head loss hw is the sum of the frictional head loss hf and the local head loss hj in each section:
hw = ∑hf + ∑hj
hf is usually calculated as follows:
h f = 2 g L i C 2 R A A i 2 v 2 2 g
where subscript ‘i’ is the index of a section, Li is the flow path length of section i, and Ai is the average cross-sectional area of section i. Variables without a subscript are for a specified section, commonly the main section of a structure. R is the average hydraulic radius, C is the Chezy coefficient, C = R1/6/n, n is the roughness coefficient, and v is the average flow velocity. The form of the equation for calculating hj varies with the type of structure [15]. The following equation is usually adopted for the gate chamber section:
h j = ζ g v g 2 2 g
where vg is the average flow velocity of the gate chamber section and ζg is the local head loss coefficient of the gate chamber section. The following equation is usually used for the body section of an inverted siphon [15]:
h j = ( ζ a + ζ b + ζ c + ζ d ) v s 2 2 g
where vs is the average flow velocity of the body and ζa, ζb, ζc, and ζd are the local head loss coefficients of the pipe inlet, pipe bend upstream, pipe bend downstream, and pipe outlet of the inverted siphon, respectively. The following equation is usually employed for the transition section:
h j = ζ t v a 2 2 g v b 2 2 g
where va and vb are the average flow velocities of the inlet and outlet of the transition section, respectively, and ζt is the local head loss coefficient of the transition section.
For the Main Canal, when only the water levels and flow rates at the inlet and outlet sections of a structure are available, the roughness coefficient n and each local head loss coefficient cannot be calibrated, so Equations (2)–(5) cannot be used directly. Given that structures usually operate in the region of quadratic resistance, both frictional and local head losses are proportional to the square of the flow velocity, so hw can be expressed as the product of a combined head loss coefficient ζ and a specified characteristic cross-sectional flow head:
h w = ζ v 2 2 g
ζ = ζ i ( A A i ) 2 + 2 g L i C 2 R A A i 2 v 2 2 g
Clearly, ζ contains several resistance-related factors (such as R in Equation (2)) that vary with the water level and ζ varies with the flow rate. However, when the Main Canal is operated in a large flow rate range, the water level is relatively stable and factors such as R do not change much, so ζ can be approximated to be fixed.
The calibration of ζ by Equation (6) requires knowledge of v2/2g and hw. To facilitate the calculation of v using the monitored water level, the specified characteristic sections of each structure are chosen in the main section. For aqueducts, underdrains, and culverts, the width of the characteristic section is the bottom width, and the height of the characteristic section is the average of the inlet and outlet water depths. For inverted siphons, the dimensions of the characteristic section are taken from the original dimensions. To obtain hw, one needs to measure the potential head and the velocity head. The equation for the energy conservation between the inlet section i and the outlet section i + 1 of a structure is written as follows:
z i + α i v i 2 2 g = z i + 1 + α i + 1 v i + 1 2 2 g + h f + h j
where z is the water level of the section, α is the kinetic energy correction factor, and v is the average flow velocity of the section. When structures convey water at a high flow rate, v is generally within 1.2–1.5 m/s and the velocity head difference between the inlet and outlet accounts for less than 1% of the total head loss, which can be ignored. Thus,
hwzizi+1
The relationship between the water level difference between the inlet and outlet and the velocity head of the characteristic section (i.e., zizi+1 and v2/2g) of each structure was plotted according to Equations (6) and (9) and the slope of the linear fitting curve was ζ. The relationships between zizi+1 and v2/2g for the inverted siphon in the Baihe River and the aqueduct in the Caohe River are plotted as examples in Figure 5a,b, respectively, and the corresponding ζ values were 4.05 and 5.97.
When the head losses of aqueducts, underdrains, and culverts were estimated under the design maximum water-conveyance flow rates (i.e., the increased flow rates) using Equation (6), a trial-and-error approach was used because the water depth of the characteristic section varied with the flow rate and thus affected the values on both sides of the equation simultaneously.

3. Results and Discussion

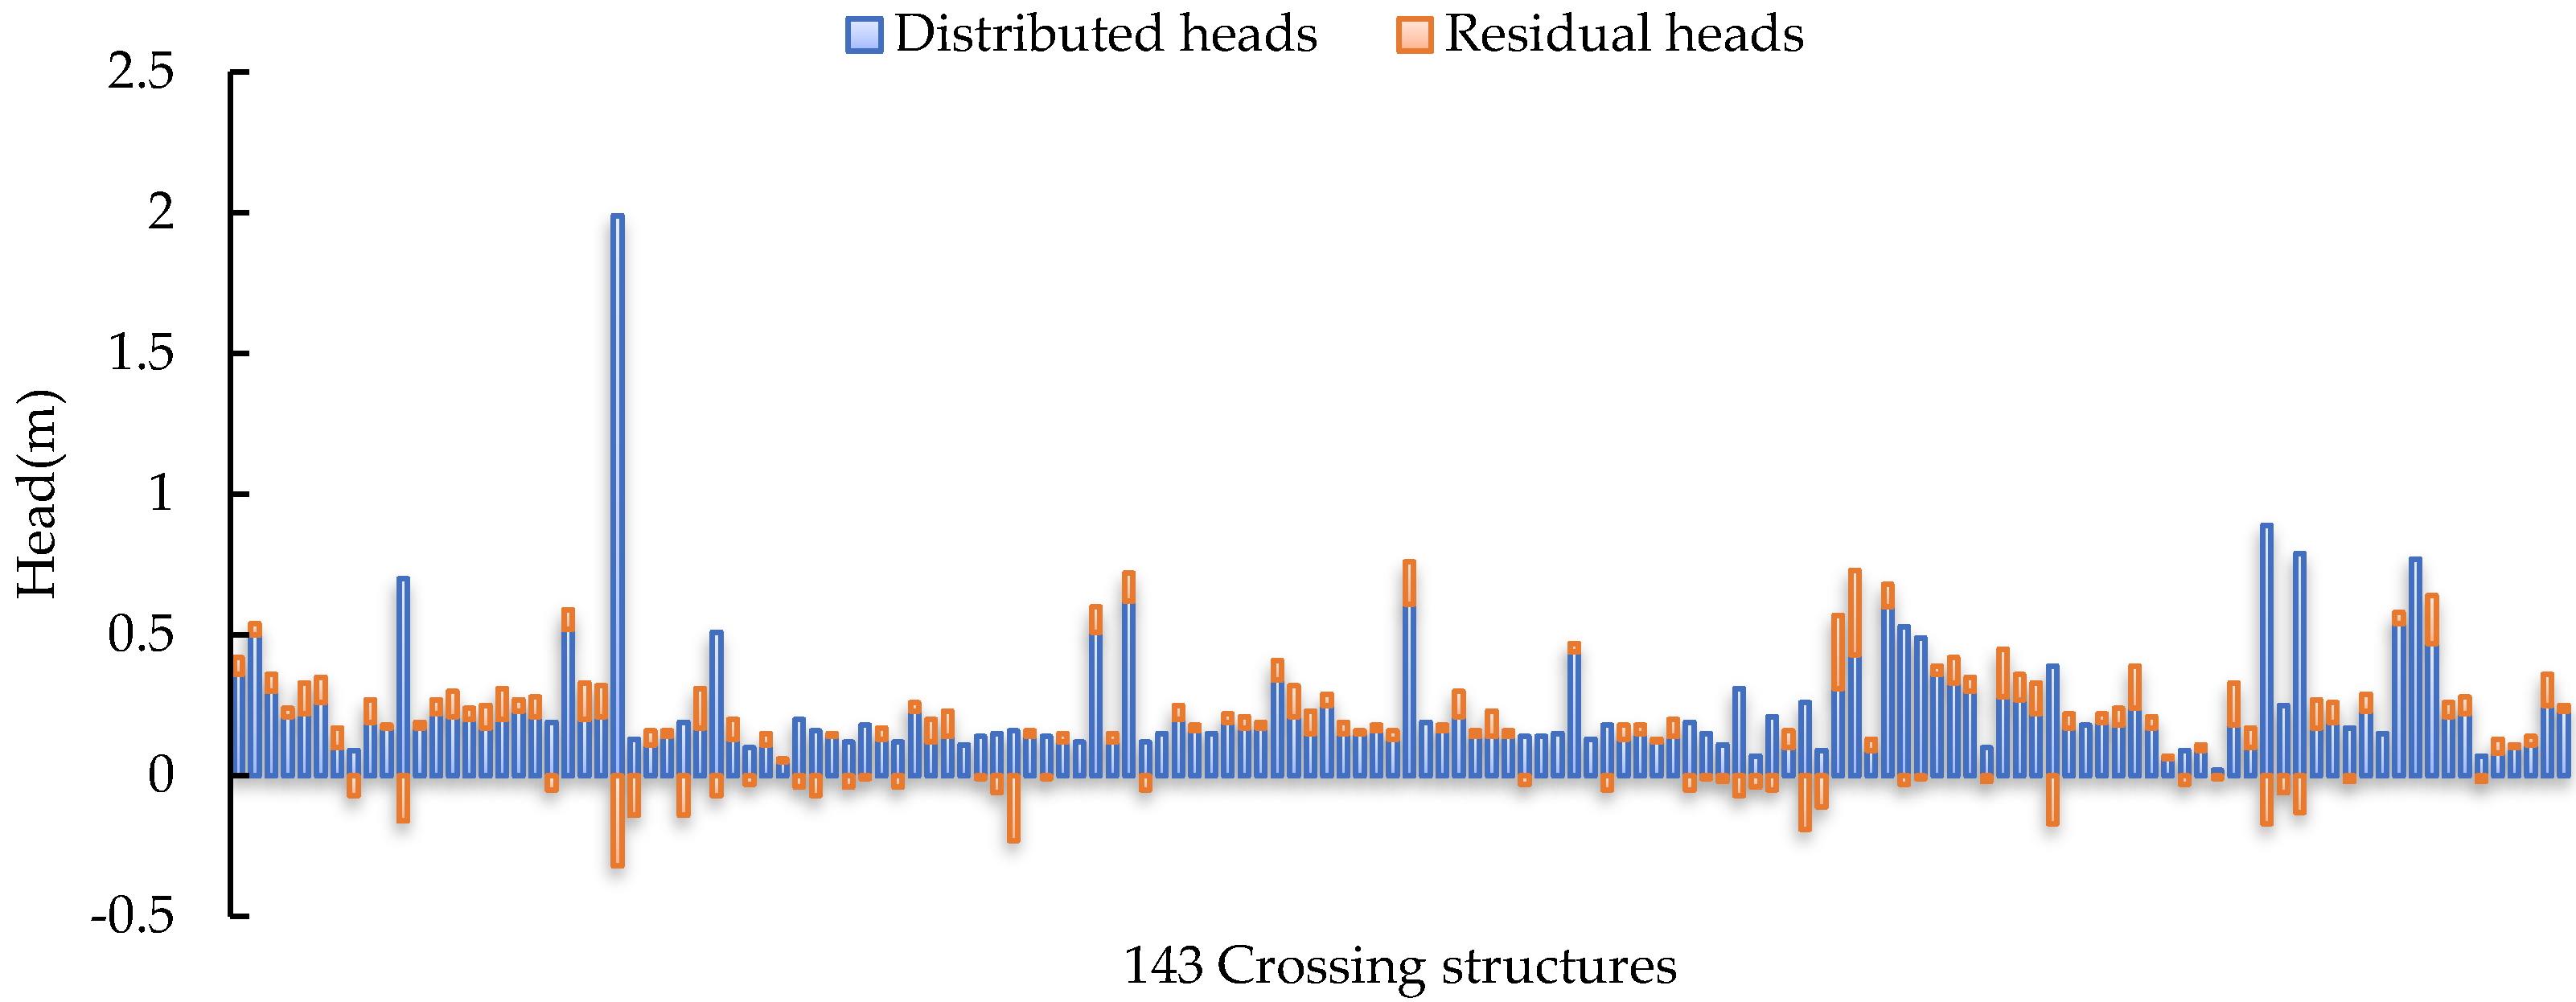
3.1. Calculation Results of Head Losses of Crossing Water-Conveyance Structures

Due to space limitations, only the calculation results of the head losses of the eight structures most upstream and the eight structures most downstream of the Main Canal among its 143 structures are listed in Table 3. Also listed in the table are the design maximum water-conveyance flow rate, distributed head (water head reserved for a structure during the planning and design stage), residual head (distributed head minus head loss), and maximum monitored flow. A positive value of the residual head indicates a surplus of the distributed head, and a negative value indicates an excess head loss.
The distributions of distributed heads and residual heads of the 143 crossing water-conveyance structures of the Main Canal are shown in Figure 6 in the order of upstream to downstream. There were 103 (72%) structures with surplus distributed heads and 40 (28%) structures with excess head losses. There were 31 inverted siphons with excess head losses, accounting for 30% of the total number of inverted siphons, with an average excess of 0.07 m and a maximum excess of 0.17 m; four aqueducts with excess head losses, accounting for 15% of the total number of aqueducts, with an average excess of 0.15 m and a maximum excess of 0.32 m; four underdrains with excess head losses, accounting for 24% of the total number of underdrains, with an average excess of 0.04 m and a maximum excess of 0.11 m; and one culvert with excess head loss, accounting for 8% of the total number of culverts, with an excess of 0.07 m.
According to the statistics of the spatial distribution, the head loss and residual head of the crossing water-conveyance structures in the Main Canal are shown in Table 4. The structures in the south section of Chuanhuang Gate, the section from Chuanhuang Gate to Zhanghe Gate, and the section north of Zhanghe Gate all had residual distributed heads, which were 0.48, 1.06, and 1.51 m, respectively, amounting to a total residual head of 3.05 m. In terms of the proportion of the residual head to the distributed head in different canal sections, the section south of the Chuanhuang Gate had a significantly low proportion (only 4%), while the other two canal sections had proportions of 13% and 12%, respectively, resulting in an average of 9% for all the canal sections.
In summary, the crossing water-conveyance structures of the Main Canal generally had surplus distributed heads, the spatial distributions of which, however, differed significantly. About 28% of the total number of individual crossing water-conveyance structures, mostly inverted siphons, had excess head losses.

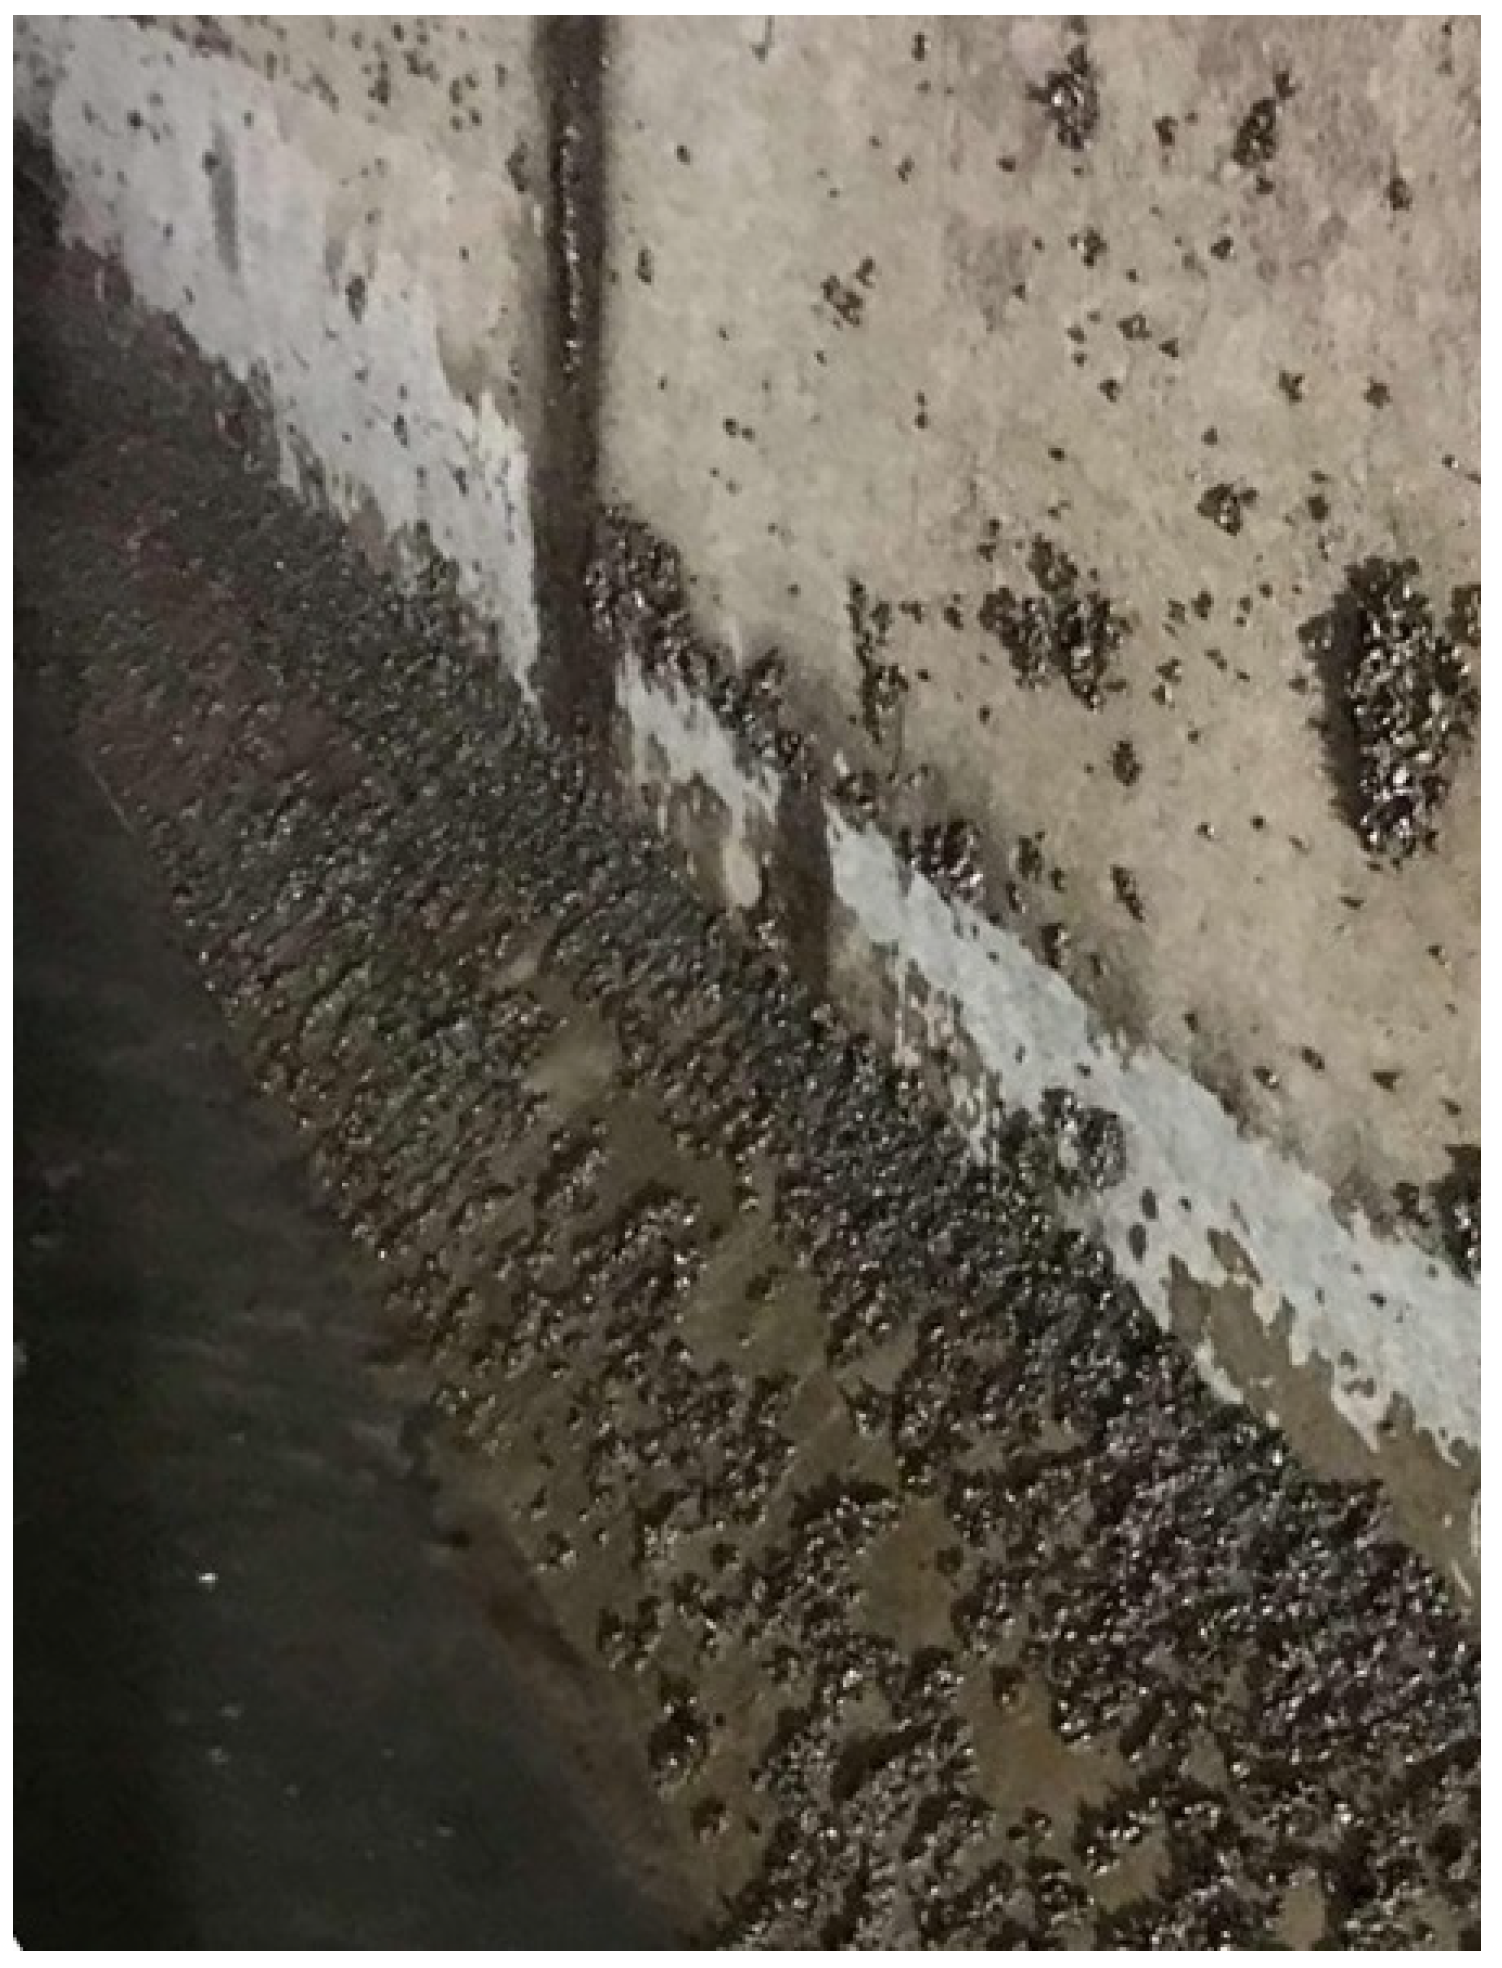
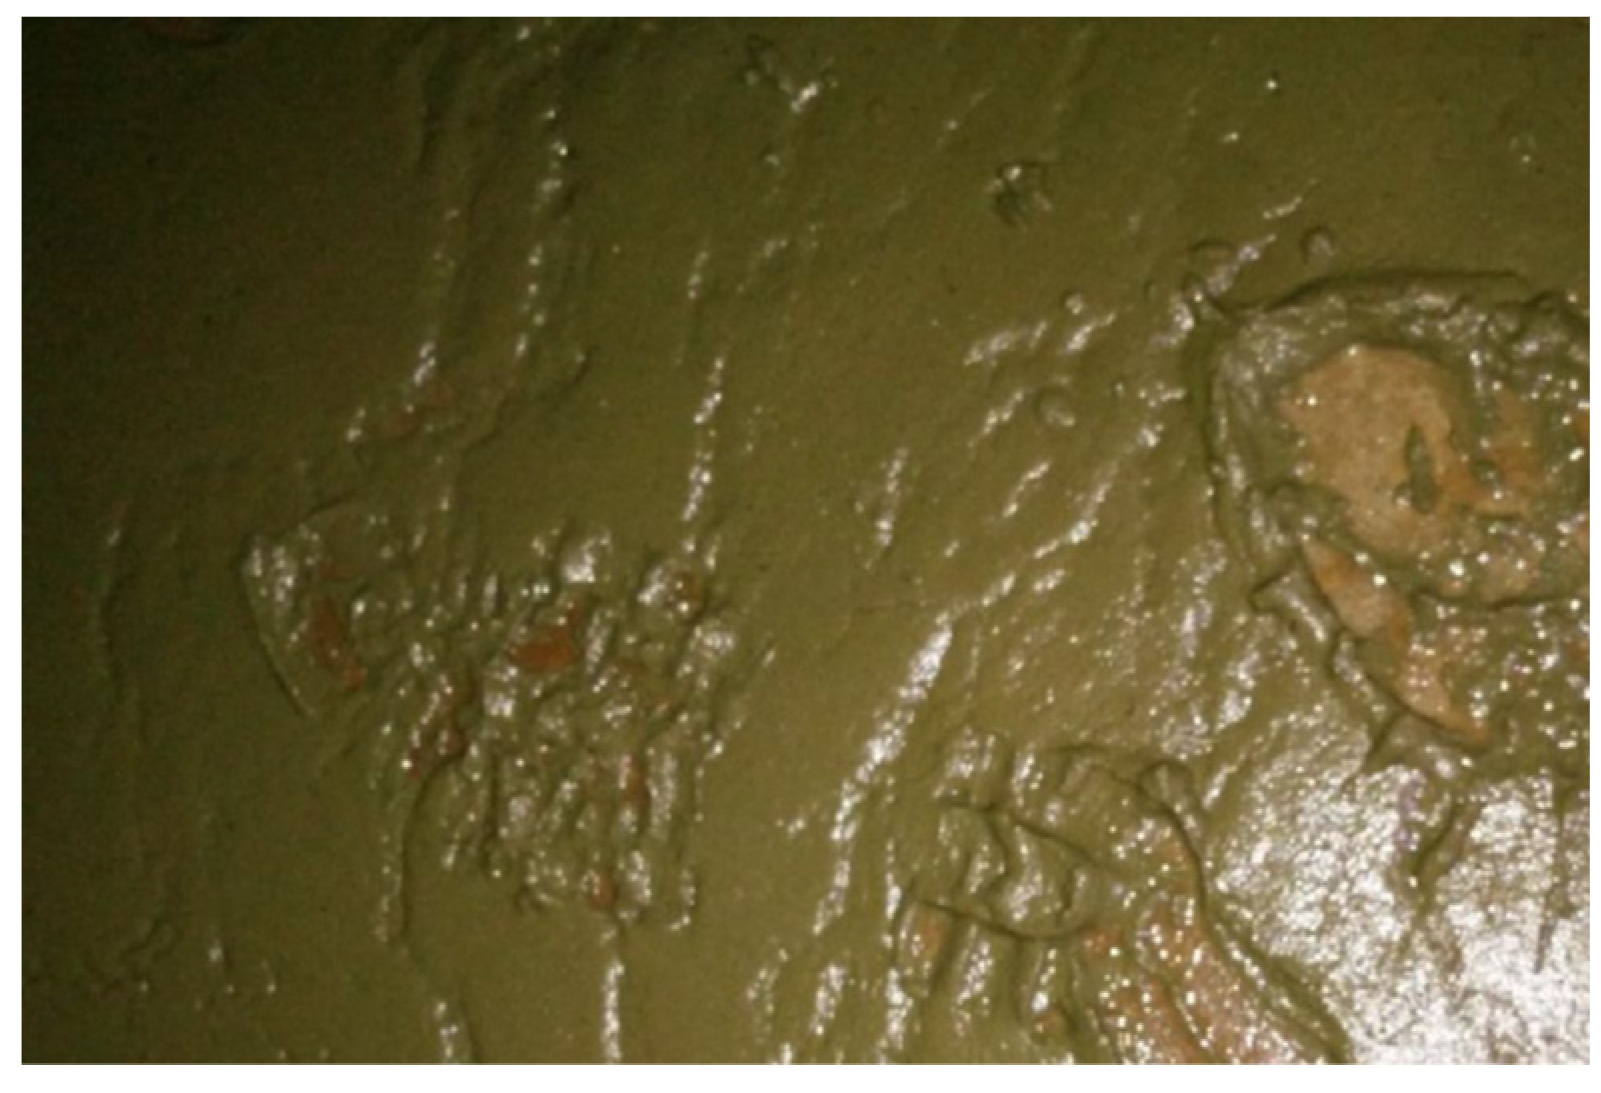
3.2. Analysis of Factors Influencing the Head Loss Increase

Prototype observations and investigations showed that, in addition to the increase in roughness caused by natural aging during the eight years of project operation [21,22], the attachment of freshwater mussels and algae to the structure surface, the existence of sediment at the bottom, and the presence of undesirable flow regimes at the inlet and outlet and inside the structure were all important influencing factors that caused an increase in the head loss of the structure.
(1) Attachment of freshwater mussels. Freshwater mussels were found attached to the underwater concrete surfaces of the crossing water-conveyance structures during the maintenance of the Main Canal in recent years (Figure 7). The underwater investigation of the distribution of freshwater mussels in the Main Canal from October to December of 2017 revealed that the attachment densities of four of the 12 sampling points along the entire route were above 5000 ind·m−2 and up to 10,190 ind·m−2 [23]. Freshwater mussels tended to be concentrated in dark water with a flow velocity range of 0.3–0.9 m·s−1 and 3 m below the water surface [24]. The entire Main Canal had a water depth of over 3 m, and a flow velocity in the range of 0.33 to 1.1 m·s−1. Most of the crossing water-conveyance structures are closed structures, which are suitable for the enrichment of freshwater mussels [25]. The influence of freshwater mussel attachment on the roughness of the Main Canal is still under investigation [26]. According to the measured results of the Dongshen Water Supply Project, the freshwater mussels increased the roughness of underdrains from 0.0123 at the beginning of the year to 0.0167 at the end of the year, an increase of 35.77% [27]. Results from laboratory pipe tests showed that the roughness of the pipe nearly doubled after the attachment of freshwater mussels (with a density of 12,000 ind·m−2) [28].
(2) Algal attachment. A large amount of algae has proliferated abnormally in the Main Canal in the springs and autumns since 2016 [29]. Algae attached to the sidewalls increase the resistance to water flow. After they age, fall off, float up, and accumulate, they can clog facilities such as the inlet screen of the structure, which leads to local damming and an increase in the head loss. Research on the effect of algae on the roughness of the Main Canal is still underway. A study of channels in an irrigation district in Japan showed that the influence of algae on the channel roughness varied with water temperature and turbidity, and the roughness coefficient increased from 0.011 to 0.019 within a month [30]. A study on the channel of a hydropower station in Australia revealed that the removal of algae attached to the channel sidewalls increased the channel’s water-conveyance capacity by 10% [31].
(3) Sediments at bottom of structure. The Main Canal draws water from the Danjiangkou Reservoir, and there is very little silt from the water source. However, during the flood season, external floodwaters overflow into the canal through the drainage structures on the left bank many times, resulting in different degrees of sedimentation near some structures [32,33]. An investigation in 2017 showed that the flood control risk of 31 of the 73 drainage structures on the left bank along the Main Canal did not meet the design requirements, and overflow could cause external water to enter the canal under flood conditions far below the design standard [34]. According to the survey of the 72-km section at the end of the Main Canal from 2019 to 2020, the main types of sediments were silts, algal residues, fallen leaves, freshwater mussels, and other miscellaneous materials, which were mainly distributed in areas with gentle flow velocities, such as canal bends, water diversion areas, and before exit gates. The sediments had an average thickness of 0.2–0.3 m, and some were as high as 1–2 m; the sediments in inverted siphons had a thickness of about 0.02 m, mainly composed of algal residue sediments (Figure 8) and small quantities of miscellaneous materials such as water bottles, plastic bags, and garbage, rather than silt [35]. The research and development of environmentally friendly underwater dredging equipment suitable for the Main Canal and regular dredging have become urgently needed to improve the water-conveyance capacity of the Main Canal [36].
(4) Undesirable flow regime of inverted siphons. When the Main Canal conveyed water with a high flow rate, some inverted siphons made regular “pop” sounds at the outlet of the pipe body when the control gate was fully opened, accompanied by the rapid gushing of the water body and the formation of surging waves hitting the radial gate panels. At the same time, a symmetrically distributed vortex zone appeared at the end of the outlet pier of the inverted siphon outlet, and periodic water level fluctuations formed in the outlet gate chamber section. It has been shown that the symmetrically distributed Karman vortex street formed by the water flow at the gate pier of the inverted siphon outlet was the main cause of the above phenomenon, which adversely affected smooth water-conveyance and structural safety and increased the head loss [37]. At present, management personnel suppress undesirable flow regimes by adjusting the underwater depth of the control gate at the cost of a certain amount of head.
(5) Undesirable flow regime of aqueducts. When the Main Canal conveyed water with a high flow rate, the water level in adjacent slots of some aqueducts showed alternating large fluctuations, with a maximum amplitude of 1.2 m, which severely affected the stability of water conveyance and the structural safety of the project [4]. Since the aqueduct only has a freeboard of about 0.5 m, the large fluctuations make it impossible to operate according to the design water-conveyance capacity. Previous studies have pointed out that the “Karman vortex street” (Figure 9a) at the gate pier of the aqueduct is the root cause of the above-mentioned undesirable flow regime [5,12]. In 2021, the shape of the inlet and outlet diversion piers was optimized for the Lihe Aqueduct. Field observations in July 2022 showed that the undesirable flow regime was improved significantly (Figure 9b). Undesirable flow regimes in other aqueducts were suppressed mainly by adjusting the gate outflow rate of adjacent slots, which unfortunately increased the corresponding head loss.

3.3. Suggestions for Countermeasures

Some countermeasures are proposed to reduce the head loss of the structures and ensure the effective use of their water-conveyance capacity based on the head loss calculation results of the structures and the analysis of related factors in combination with the experience learned from the Main Canal itself and other projects:
  • Regularly clean up the sediments in the structures, remove algae and freshwater mussels attached to the surface, and apply roughness-reducing materials if necessary.
  • Modify the shapes of the inlet and outlet structures of the crossing water-conveyance structure with undesirable flow regimes.
  • Dredge and expand the drainage structures on the left bank with a high flood risk, raise the levees at the inlet and outlet, and set up grit chambers upstream.
  • Explore the option of adding water-conveyance channels in the case that the existing crossing water-conveyance structures cannot be modified.
  • Add automatic monitoring sections and advanced monitoring equipment to improve the intelligent sensing and precise control ability of the Main Canal.
  • Increase the frequency of daily inspections during periods of water conveyance with a high flow rate and periods when rainstorms, floods, and geological disasters likely occur.
  • Check the margin of safety of the structures under long-term water conveyance with a high flow rate and take structural strengthening measures if necessary.
  • Check the aeration conditions of the water conveyance with a high flow rate in the underdrains and increase the number of aeration facilities if necessary.
  • Take engineering and management measures to reduce the roughness of the canal and mitigate the impact on its flow capacity due to damming at the outlet of the structure.

4. Conclusions

The Main Canal of the South-to-North Water Diversion Project faces the risk of a reduced water-conveyance capacity of the crossing water-conveyance structures. Therefore, it is very important to carry out a head loss assessment, determine the causes, and propose countermeasures to ensure the safety of the water supply. Based on the monitoring data of the Main Canal during the water conveyance with a high flow rate in 2022, the head losses of 143 structures under the design maximum water-conveyance flow rate were calculated after examining field observations and performing data correction. The assessment showed excess head losses in 40 structures, which included 31 inverted siphons, with a maximum excess of 0.17 m; four aqueducts, with a maximum excess of 0.32 m; four underdrains, with a maximum excess of 0.11 m; and one culvert, with an excess of 0.07 m. The structures in the Main Canal had a total residual head of 3.05 m, accounting for 9% of its distributed head. Among them, the canal section south of the Chuanhuang Gate, the canal section from the Chuanhuang Gate to the Zhanghe Gate, and the canal section north of the Zhanghe Gate had residual heads of 0.48, 1.06 and 1.51 m, respectively, accounting for 4%, 13%, and 12% of the distributed head. Freshwater mussel and algal attachments, sediments such as silts and algal residues, and undesirable flow regimes are important factors for the increased head loss. The recommended measures include the regular removal of sediments and the attached algae and freshwater mussels, application of roughness-reducing materials, shape optimization of the inlet and outlet of structures, improvement of the flood discharge capacity of drainage structures on the left bank, addition of water-conveyance channels, and strengthening of water monitoring and project inspections.
This study was carried out based on the monitoring data in 2022. There were certain errors in the estimated results because the water-conveyance flow rate had not yet reached the design level at that time. As the water flow rate of the Main Canal continues to increase, the estimated results will become more accurate in the future. The proposed method to calculate the combined head loss, under the condition of insufficient monitoring, data can be used as a reference for similar large-scale, long-distance open channel water-conveyance projects.

Author Contributions

Conceptualization, W.C. (Wenxue Chen), W.C. (Wei Cui) and X.M.; methodology, W.C. (Wei Cui) and X.M.; software, W.C. (Wei Cui); validation, W.C. (Wei Cui) and Q.X.; writing, W.C. (Wei Cui) and M.L.; project administration, W.C. (Wenxue Chen); funding acquisition, W.C. (Wei Cui). All authors have read and agreed to the published version of the manuscript.

Funding

This research was funded by the National Key R&D Program of China (2021YFC3200905), the National Natural Science Foundation of China (U20A20316).

Data Availability Statement

Some or all data models that support the findings of this study are available from the corresponding author upon reasonable request.

Acknowledgments

The anonymous reviewers and the editor will be thanked for providing insightful and detailed comments and suggestions.

Conflicts of Interest

The authors declare no conflict of interest.

References

  1. Niu, X.Q. The First Stage of the Middle-Line South-to-North Water-Transfer Project. Engineering 2022, 16, 21–28. [Google Scholar] [CrossRef]
  2. Zhang, Z.M.; Chen, L.B.; Zhang, Y.J. Research on Water Surface Profile of Artery Canal of Middle Route Project of South-to-North Water Transfer. Yangtze River 2006, 37, 1–3+76. [Google Scholar]
  3. Xiao, W.G.; Wu, Z.Y. Principle and Characteristics of the Layout of the Main Channel of the First Phase of the Middle Route of the South-to-North Water Diversion Project. Express Water Resour. Hydropower Inf. 2006, 27, 14–17. [Google Scholar]
  4. Li, L.Q.; Chen, X.N.; Jiang, L.; Xu, X.Y. Influence of Tail Pier Lengthening on Water Level Fluctuation Elimination in South-to-North Water Diversion Aqueduct. China Rural. Water Hydropower 2023, 1, 146–151. [Google Scholar] [CrossRef]
  5. Qu, Z.G.; Li, Z.P. Causal Analysis on Water Level Abnormal Fluctuation in Aqueduct and Improvement Measures: Case of Lihe Aqueduct in Middle Route of South-to-North Water Transfer Project. Yangtze River 2022, 53, 189–194. [Google Scholar] [CrossRef]
  6. Meng, X.Y. Study on the Abnormal Fluctuation Mechanism of Large Inverted Siphon Water Level Based on LES Method. Master’s Thesis, North China University of Water Resources and Electric Power, Zhengzhou, China, 2022. [Google Scholar]
  7. Yan, W.; Han, J.B.; Huang, G.B. Experimental Study on Hydraulics of a Main Channel Invert Siphon Project of South-to-North Water Diversion Project. In Proceedings of the 3rd National Congress on Hydraulics and Hydroinformatics, Nanjing, China, 18–20 October 2007. [Google Scholar]
  8. Huang, G.B.; Nie, Y.H.; Duan, W.G. Hydraulics Research on the Mid-route of South to North Water Diversion Project. J. Yangtze River Sci. Res. Inst. 2014, 31, 34–42. [Google Scholar] [CrossRef]
  9. Dai, M.; Chen, X.Q. Hydraulic Prototype Experiment of Huai River II Aqueduct in Middle Route of South-to-North Water Transfer Project. South North Water Transf. Water Sci. Technol. 2008, 6, 194–196+199. [Google Scholar] [CrossRef]
  10. Zhou, C.; Wan, L.W.; He, Y.; Lu, J.Y. Experimental Study on Flow Characteristics in Inverted Siphon for Diversion Project From South to North China. J. Yangtze River Sci. Res. Inst. 2002, 19, 8–10. [Google Scholar]
  11. Xu, M.Z.; Wang, Z.Y.; Lin, C.C.; Pan, B.Z.; Zhao, N. Experimental Study of Invasion and Biofouling of Freshwater Mussel Limnoperna Fortunei. Int. J. Geosci. 2013, 4, 1–7. [Google Scholar] [CrossRef] [Green Version]
  12. Wang, C.H.; Wang, W.; Hou, D.M.; Wang, Z.X.; Tian, F.Y. Abnormal Water Waves in Large-scale Conveyance Aqueduct:Causes and Countermeasures. J. Yangtze River Sci. Res. Inst. 2021, 38, 46–52. [Google Scholar] [CrossRef]
  13. Li, L.Q.; Chen, X.N.; Chen, W.X. A Probe into the Surface Roughness Reduction and Protection of Typical Water Conveyance Structures in the South-to-North Water Diversion Middle Route Project. China Rural. Water Hydropower 2022, 10, 143–147+153. [Google Scholar] [CrossRef]
  14. Alazba, A.A.; Mattar, M.A.; Einesr, M.N.; Amin, M.T. Field Assessment of Friction Head Loss and Friction Correction Factor Equations. J. Irrig. Drain. Eng. 2012, 138, 166–176. [Google Scholar] [CrossRef] [Green Version]
  15. Li, W.; Xu, X.P. Hydraulics, 3rd ed.; Press of Wuhan University of Hydraulic and Electric Engineering: Wuhan, China, 2002; pp. 152–165. [Google Scholar]
  16. Yao, X.; Cui, W.; Weng, J.P.; Mu, X.P. Roughness Measurement Uncertainty Analysis of Large Scale Canal Project. Irrig. Drain. 2016, 35, 152–155. [Google Scholar] [CrossRef]
  17. Dong, D.D.; Li, C.; Bi, J.L.; Zhao, H.C. Study on Actual Roughness of Pressurized Conveyance Tank Culvert in Tianjin Trunk Line of South-to-North Water Diversion Project. Des. Water Resour. Hydroelectr. Eng. 2022, 41, 14–17. [Google Scholar]
  18. Chang, S.; Mu, Z.W.; Wan, L.B. Friction Head Loss Calculation for the FRP Pipes of Inverted Siphon Project. AMM 2014, 641–642, 275–278. [Google Scholar] [CrossRef]
  19. Zhai, Y.J. Study on the Calculation Method of Local Head Loss in the Gradient Section of the Main Channel of the Middle Route of the South-to-North Water Diversion Project. Irrig. Drain. 2007, 26, 20–22. [Google Scholar] [CrossRef]
  20. Li, Y.J.; Ma, B.; Peng, X.M. Research on Hydraulic Factors of Water Conveyance Buried Culvert in Jinan Urban Section of Eastern Route of South-North Water Diversion. China Water Wastewater 2014, 30, 58–61. [Google Scholar] [CrossRef]
  21. Xie, K.K. Analysis of Hydraulic Elements in the Middle Route of South-to-North Water Transfer Project Based on Data Mining Technology. Master’s Thesis, North China University of Water Resources and Electric Power, Zhengzhou, China, 2021. [Google Scholar] [CrossRef]
  22. Chen, W.X.; Cui, W.; He, S.N.; Mu, X.P. Study on Method of Roughness Calibration for Water Conveyance System. Water Resour. Hydropower Eng. 2019, 50, 116–121. [Google Scholar] [CrossRef]
  23. Zhao, N.; Xu, M.Z.; Blanckaert, K.; Qiao, C.H.; Zhou, H.M.; Niu, X.L. Study of Factors Influencing the Invasion of Golden Mussels (Limnopernafortune) in Water Transfer Projects. Aquat. Ecosyst. Health Manag. 2020, 22, 385–395. [Google Scholar] [CrossRef]
  24. Daniela, D.; Demetrio, B.; Francisco, S. Detachment, Displacement and Reattachment Activity in a Freshwater Byssate Mussel (Limnoperna Fortunei): The Effects of Light, Temperature and Substratum Orientation. Biofouling 2015, 31, 599–611. [Google Scholar] [CrossRef]
  25. Xia, Z.Q. Quantifying Early Risks of Species Invasions: Factors Regulating South to North Bivalve Colonization of Novel Habitats. Ph.D. Thesis, University of Windsor, Windsor, ON, Canada, 2019. [Google Scholar]
  26. Ou, Z.X. Study on the Influence of Golden Mussel on the Water Conveyance Capacity of Channel. Master’s Thesis, Hebei University of Engineering, Handan, China, 2020. [Google Scholar] [CrossRef]
  27. Li, D.M. Study on the Influence of Golden Mussel on the Water Conveyance Capacity of Water Conveyance Buildings. Water Wastewater Eng. 2009, 45, 94–96. [Google Scholar] [CrossRef]
  28. Zhang, J.H.; Xu, M.Z.; Liu, W.; Zhang, T.Y. Experimental Study on the Effect of Golden Mussel Attachment on the Roughness of Water Transfer Pipeline. In Proceedings of the 12th International Symposium on Ecohydraulics, Tokyo, Japan, 19–24 August 2018. [Google Scholar]
  29. Zhu, J.; Lei, X.H.; Quan, J.; Yue, X. Algae Growth Distribution and Key Prevention and Control Positions for the Middle Route of the South-to-North Water Diversion Project. Water 2019, 11, 1851. [Google Scholar] [CrossRef] [Green Version]
  30. Fujii, H.; Ikeda, N. Algal Growth in an Irrigation Canal and Its Effect on Flow Function. Paddy Water Environ. 2019, 17, 419–427. [Google Scholar] [CrossRef]
  31. Sargison, J.; Andrewartha, J.; Perkins, K. The Effect of Gomphonema and Filamentous Algae Streamers on Hydroelectric Canal Capacity and Turbulent Boundary Layer Structure. In Proceedings of the 16th Australasian Fluid Mechanics Conference Crown Plaza, Gold Coast, Australia, 2–7 December 2007. [Google Scholar]
  32. Nie, H.C. Study on the Influence of External Flood into Channel on Channel Flow Capacity. Master’s Thesis, Hebei University of Engineering, Handan, China, 2020. [Google Scholar] [CrossRef]
  33. Jin, S.; Liu, H.; Ding, W.; Shang, H.; Wang, G. Sensitivity Analysis for the Inverted Siphon in a Long Distance Water Transfer Project: An Integrated System Modeling Perspective. Water 2018, 10, 292. [Google Scholar] [CrossRef] [Green Version]
  34. Zhang, Q.Y.; Yao, Q.L.; Ding, L.Q.; Xie, J.B. Identification of Flood Risk on Left Bank Drainage Aqueducts of South-to-North Water Diversion Middle Route Project. Water Resour. Hydropower Eng. 2021, 52, 112–121. [Google Scholar] [CrossRef]
  35. Fu, J.; Cheng, X.; Wang, Y.Q.; Zhu, X.X. Study on Silting in Channels and Buildings of Middle Route of South-to-North Water Diversion Project. Yangtze River 2021, 52, 347–350. [Google Scholar] [CrossRef]
  36. Huang, J.D.; Hu, P.; Fu, Q.K.; QU, L. An Application Example Analysis of a Mobile Environment-friendly Desilting Equipment in the Middle Route of the South-to-North Water Diversion Project. In Proceedings of the Chinese Hydraulic Society 2019 Annual Conference, Yichang, China, 22–24 October 2019. [Google Scholar] [CrossRef]
  37. Xu, X.; Chen, S.; Meng, X.; Jiang, L. Characteristics and Hazards Analysis of Vortex Shedding at the Inverted Siphon Outlet. Sustainability 2022, 14, 14744. [Google Scholar] [CrossRef]
Figure 1. Main canal of the middle route of the South-to-North Water Diversion Project: (a) general layout and (b) canal and crossing water-conveyance structures.
Water 15 00871 g001
Figure 2. Scheme of an inverted siphon: (a) profile view and (b) plan view.
Water 15 00871 g002
Figure 3. Observation instruments and benchmark of prototype observation.
Water 15 00871 g003
Figure 4. Comparison of the tested results in the project itself and the checked measurement results in this study: (a) water level difference between inlet and outlet and (b) flow rate.
Water 15 00871 g004
Figure 5. Relationship between zizi+1 and v2/2g for structures: (a) an inverted siphon of the Baihe River and (b) an aqueduct of the Caohe River.
Water 15 00871 g005
Figure 6. Distributed heads and residual heads of 143 crossing structures in the Main Canal.
Water 15 00871 g006
Figure 7. Freshwater mussels on an inverted siphon.
Water 15 00871 g007
Figure 8. Sediments in an inverted siphon.
Water 15 00871 g008
Figure 9. Flow regime at the outlet: (a) the aqueduct of the tributary of the Shuangji River and (b) the aqueduct of the Lihe River.
Water 15 00871 g009
Table 1. Example of monitored water level and flow records of the project (at 16:00 on 20 May 2022).
StructureMonitoring Point LocationStake NumberWater Gauge Reading (m)Water Level Difference between Inlet and Outlet (m)Measured Flow Rate (m3/s)Gate Control Status
Aqueduct of Yanling RiverUpstream of inlet transition section48 + 740144.810.15322.54Fully opened
Downstream of outlet transition section49 + 161144.64
Inverted siphon of Xizhao RiverUpstream of inlet transition section69 + 523143.690.10327.07Fully opened
Downstream of outlet transition section69 + 874143.58
Table 2. Observation instruments and performance parameters.
No.TypeModel or SpecificationMain Performance IndicatorsMeasurements
1Radar water level gaugeHZ-RLS-26L-50Range: 0.25–15 m; Range hole: 0.25 m; Range accuracy: ±2 mmWater level
2ADCPSonTek RiverSurveyorVelocity measurement range: ±10 m/s; Resolution: 0.001 m/s; Accuracy: ±1%Discharge
3Remotely controlled unmanned ship systemNortek USVScope of application: rivers or channels with a velocity of 0–5 m/s/
4Electronic levelLeica SPRINTER 100/100MElevation measurement accuracy: 2.0 mm; Distance measurement accuracy: standard deviation = 10 mm when distance <10 m and standard deviation = 1‰ of the measured value when distance ≥ 10 m; Distance measurement range: 2–80 mElevation
5RangefinderLeica D5Measuring range: 0.05–200 m; Measuring accuracy: ±1.0 mmDistance
Table 3. Calculation results of head losses of crossing water-conveyance structures.
No.Design Maximum Water-Conveyance Flow Rate (m3·s−1)Distributed Head (m)Head Loss (m)Residual Head (m)Monitored Maximum Flow Rate (m3·s−1)
14200.360.300.06351.28
24200.500.460.04348.84
34100.300.240.06348.86
44100.210.180.03349.41
54100.220.110.11344.36
64100.260.170.09344.24
74100.100.030.07345.09
84100.090.16−0.07345.09
9700.210.160.0564.13
10700.220.160.0664.13
11700.070.09−0.0266.08
12700.080.030.0566.08
13700.100.090.0166.08
14700.110.080.0363.01
15700.250.140.1162.99
16700.230.210.0262.99
Table 4. Head loss and residual head of crossing water-conveyance structures by canal section (unit: m).
Canal SectionTaocha Gate–Chuanhuang GateChuanhuang Gate–Zhanghe GateZhanghe Gate–Beijumahe GateTaocha Gate–Beijumahe Gate
Stake number0 + 000–483 + 471483 + 471–731 + 366731 + 366–1197 + 6690 + 000–1197 + 669
Distributed head12.148.2912.9933.42
Head loss11.667.2311.4830.37
Residual head0.481.061.513.05
Residual head as percentage of distributed head4%13%12%9%
Disclaimer/Publisher’s Note: The statements, opinions and data contained in all publications are solely those of the individual author(s) and contributor(s) and not of MDPI and/or the editor(s). MDPI and/or the editor(s) disclaim responsibility for any injury to people or property resulting from any ideas, methods, instructions or products referred to in the content.

