

Dynamic Data-Driven Ship Motion Simulation toward Visual-Aided Navigation on Water

1
Tianjin Research Institute for Water Transport Engineering, M.O.T, Tianjin 300456, China
2
School of Navigation, Wuhan University of Technology, Wuhan 430070, China
3
Navigation College, Dalian Maritime University, Dalian 116026, China
*
Author to whom correspondence should be addressed.
Water 2023, 15(5), 872; https://doi.org/10.3390/w15050872
Submission received: 30 January 2023
/
Revised: 21 February 2023
/
Accepted: 22 February 2023
/
Published: 24 February 2023
(This article belongs to the Special Issue Sustainable Development of Inland Waterways)
Abstract
:Visual aids for navigation systems are a key function of intelligent onboard navigation units for ships. These systems visualize the planning decisions of an intelligent navigation unit for computer-aided visual navigation to reduce the cognitive workload of the driving control personnel of an intelligent ship. In this study, we propose a dynamic data driven method to simulate the motion of ships on the water. We constructed a validation dataset for ship motion simulation toward visual-aided navigation considering the combined effects of wind, waves and currents. According to the validation results on this dataset, the proposed simulation method exhibited good accuracy and real-time performance. Under the given control and environmental input series, the mean errors of simulated heading and simulated trajectory were 5.7°/h and 282.6 m/h, respectively; the simulation time was 475 ms for each hour of physical duration. Overall, the proposed simulation method satisfies the need for visual navigation aids and could improve the situational awareness of the driving control personnel of the intelligent ship.
1. Introduction
As the shipping industry continues to expand, navigational safety has become an increasingly prominent problem. According to statistics on 741 merchant ship accidents in Australia and 19,500 maritime accidents in the European Union, navigational accidents are mainly attributable to negligence in lookout or improper maneuvering [1,2]. In 2016, Rolls-Royce proposed the “Ship Intelligence” vision, which considered augmented reality and data fusion technologies to promote the development of navigational aid system for ships. In the same year, Jaeyong et al. proposed the AR-based advanced navigation aid system for ships, which displays the visual navigation aid information on the common screen [3]. In April 2019, Mitsui O.S.K. Lines, Ltd., a Japanese transport company, installed a visual navigation aid system on 21 very large crude carriers (VLCCs) to support lookout and maneuvering in the course of navigation. In October 2019, Furuno Electric Co., Ltd., a Japanese electronics company, released a visual navigation aid system called “ENVISION”. In April 2020, South Korea’s Hyundai Heavy Industries mounted its advanced visual navigation aid system “HiNAS” on a bulk carrier [4]. Consequently, maintaining situation awareness of mariners is critical for safe navigation, visual-aided information could provide such function by overlaying the physical world with digital content such as graphics [5].
Okazaki et al. developed a route display system by registering the planned route in the onboard video. The pilot can also maintain environmental awareness at night [6]. Nordby et al. presented a more detailed design idea for the information generation and display method and interactive interface of visual navigation aids [7]. In their work, the displayable area in smart glasses was divided into five areas: sky, water antenna, mask, free movement and water surface, and corresponding information generation and display were performed, respectively. In the existing visual aid systems, the navigation information is mainly provided by traditional navigation equipment. System designs have focused on integrating various sources of information (e.g., planned routes and the target ship of the automatic identification system (AIS)) and videos. Procee et al. explored the higher level of visual-aided information [8,9]. In their work, a visual-aided collision avoidance system is developed, which proposed the concept of collision avoidance scheme visualization to enhance situational awareness and reduce collision risk by providing pilots with navigational information of route and speed combination. In 2021, Francesco et al. investigates the use of augmented reality technology in the field of maritime navigation, most work focus on the display of navigation equipment information such as compass, heading and position. In its data statistics, little of the literature involves visual rendering of ship motion simulation and prediction results [10]. For intelligent ships, intelligent navigation units can plan routes dynamically, and control the ship to achieve autonomous collision avoidance and navigation. To visualize the execution effect of the planning, dynamic planning information must be combined with ship motion modeling and simulation. Thus, we can provide perceptual criteria for remote control, and thus improve the functionality of the visual navigation aid systems [11]. Therefore, synthesizing ship motion via simulation effectively with visual navigation aids would significantly enhance the situational awareness of ship officer.
At the present stage, ship motion simulation mainly focuses on ship maneuvering and seakeeping, aiming to evaluate the ship performance at the design stage [12]. The motion trajectories are primarily simulated through standard performance tests, such as turning circle and zigzag tests. To visualize the trajectory of intelligent navigation planning in the visual navigation aid systems, ship motion simulation must meet three requirements, First, the ship trajectory should be simulated accurately under the given control series and environmental information. Secondly, the simulation needs to consider time- and space-varying environmental factors such as wind, waves and currents. Thirdly, the time cost of simulation and calculation should be controlled, because the simulation trajectory is processed by the visualization unit of the visual navigation aid system. Nevertheless, insufficient attention has been paid to ship motion simulation methods for the specific task of computer-aided visual navigation because the research fields of computer vision and ship hydrodynamics overlap. Moreover, there is a lack of real-world ship navigation verification datasets containing integrated environmental information on wind, waves and currents.
Bendict et al. created a fast simulation tool for crew maneuver training, which provides inspiration to solve the high time cost of ship motion simulation in visual-aided navigation [13]. In 2020, Qianfeng et al. applied a real sea area database to ship motion simulation [14], and, on this basis, proposed a sensor-driven ship motion prediction approach for constructing a digital twin framework [15], shedding light on simulation driven by dynamic data. However, the time consumption of the simulation method in their work was not discussed. Practical testing datasets with not only accuracy but real-time performance index need to be built for further validation and integration with visual-aided navigation system.
In this study, we present a dynamic data-driven method for ship motion simulation and construct a validation dataset using real ship navigation data. The validation results on this dataset show that the proposed method simulates routes rapidly and accurately for visual navigation aid systems and provides a suitable tool to reduce the cognitive load of the driving control personnel of an intelligent ship and enhance their capacity for situational awareness.
The main contributions of this paper are as follows: firstly, a ship motion simulation pipeline based on various databases is constructed, which is characterized by both accuracy and real-time operation and is especially suitable for visual-aided navigation. Secondly, this paper establishes a dataset and performance indexes to evaluate the pipeline, which provides a basis for further research on the integration of ship motion simulation and visual navigation aid systems.
2. Materials and Methods
2.1. Visual-Aided Navigation on the Water
In recently released visual-aided navigation systems such as Furono’s ENVISION, the display interface not only matches and fuses the AIS information of the target ship with the video information, but also registers the planned routes of the ship to the onboard video images, such that the driving control personnel can perceive the navigation situation stably.
In the existing visual navigation systems, the navigation information is mainly obtained from the traditional equipment of the ship bridge, such as electronic charts, radar, AIS, global positioning system (GPS) and compass. Using augmented reality, the above information is registered to the video images of the shipboard camera to realize a superimposition of virtual information and real images. On the intelligent ship, the intelligent navigation unit is capable of autonomous navigation, i.e., making avoidance decisions and planning routes according to the current situation.
At present, the planning results of intelligent navigation units are rarely integrated with visual navigation aid systems. The main problem is the lack of a ship motion simulation framework applicable to the above scenario. During intelligent navigation, route planning is executed continuously after a fixed time interval. Each phase of planning outputs a unique control series, depending on the changes of the current environment. This calls for a dynamic, data-driven ship motion simulation method designed to ensure the consistency between simulation and actual navigation by receiving dynamic control information and environmental information. Such a method would provide accurate and real-time simulation trajectory data for the visual navigation aid systems.
2.2. Dynamic, Data-Driven Simulation Method
In order to evaluate the ship performance at the design stage, the traditional ship motion simulation study focusses on common standard test schemes, such as turning circle test and zigzag test with a certain velocity and rudder angle. In these standard tests, the control series of the ship are generally fixed values; the simulation environment is generally still water, or only influenced by a single environmental factor, namely, wind and currents with fixed direction and velocity, and regular waves with fixed frequency and amplitude. However, it is very important to consider the comprehensive influence of wind, current and wave in time and space for ship motion simulation in the actual sea. Modern commercial navigation simulators can simulate the ships motion in different environments in real time, but few studies focus on the real-time performance of their simulation method. As mentioned above, visual navigation aids need to display long-distance motion simulation data in a shorter time, which means that the simulation method needs to develop from real-time operation to faster operation beyond real-time. Apart from imputing the dynamic control series, the changing hydrodynamics of the ship and environmental disturbances must be taken into account to simulate ship motions for visual navigation aid systems. For this purpose, we developed a method for dynamic, data-driven simulation based on the ship hydrodynamic database and the environmental database. Additionally, all the databases are integrated into a pipeline using online interpolation. The proposed method is described in detail in the following sections.
2.2.1. Ship Hydrodynamic Database
During actual navigation, the ship’s heading and velocity, and its relative relationship to the wind, waves and currents in the marine environment vary from moment to moment. The traditional maneuvering motion simulation usually assumes that the ship has a constant hydrodynamic coefficient. This assumption is rather reasonable, for turning circle test and zigzag test are generally carried out in still water and last a short time. When the ship sails amidst complex sea conditions, the changing hydrodynamic coefficient needs to be considered to simulate the ship’s motion response as close to the real value as possible.
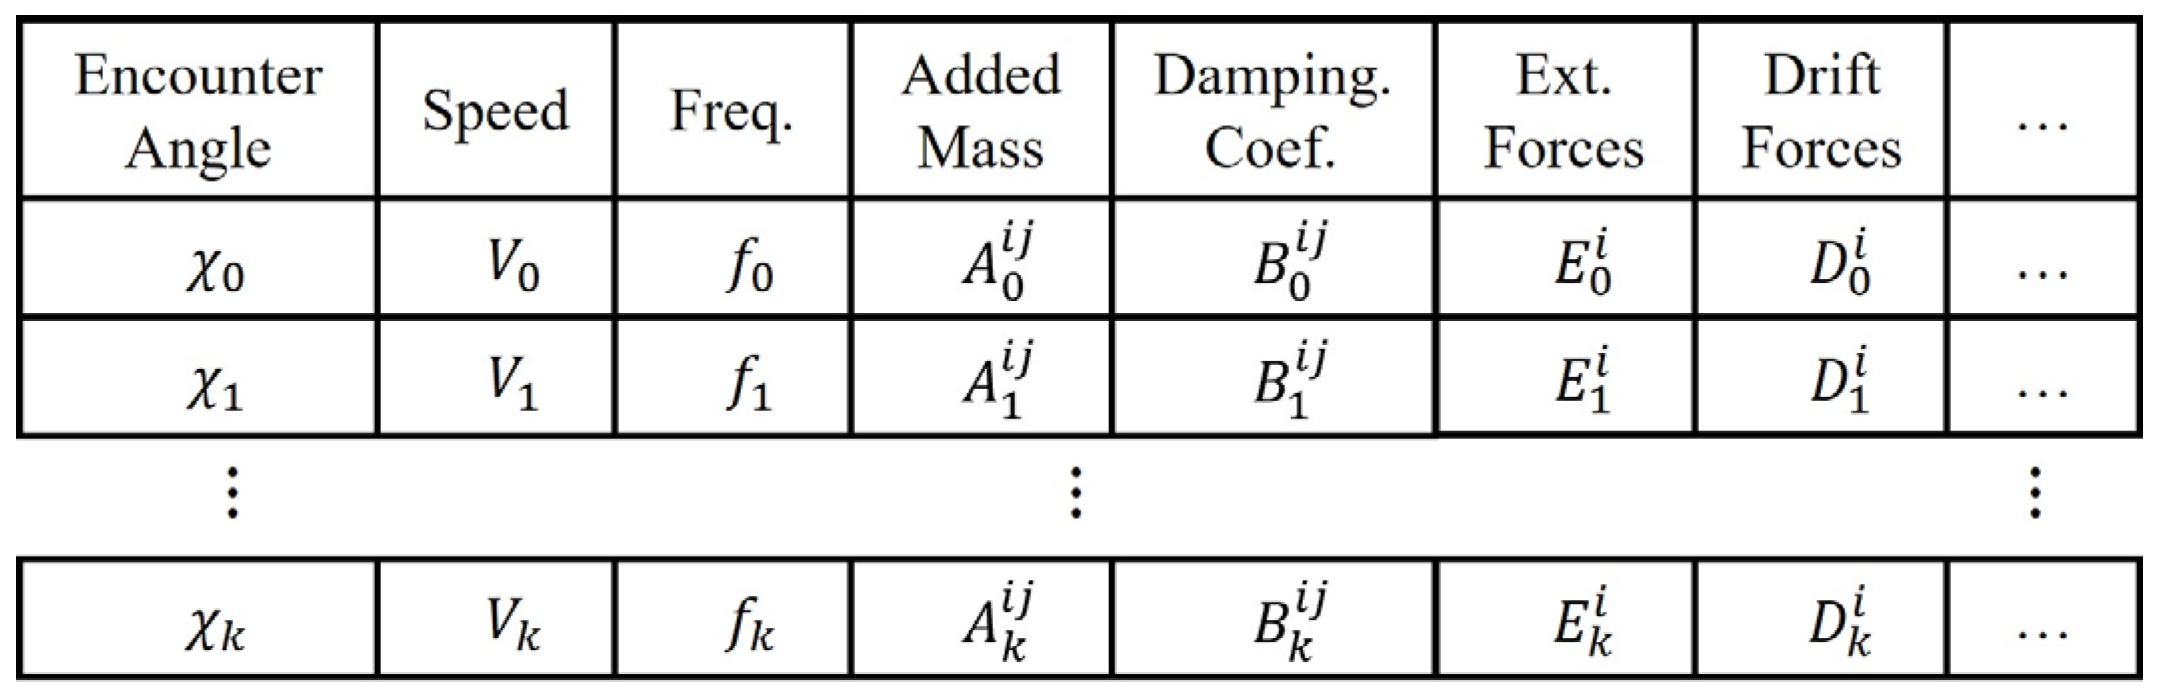
To obtain the real-time hydrodynamic coefficient in various sea condition, it is necessary to interpolate the coefficient according to the encounter angle, ship speed and wave frequency in the ship hydrodynamic database. Figure 1 illustrates the structure of the ship hydrodynamic database. The key values used for indexing are encounter angle , ship speed and wave frequency , and the data segments mainly include time-varying coefficients like the added mass matrixes , damping coefficient matrixes , wave excitation force vectors and wave drift force vectors . The superscript “i” and “j” indicate the six degrees of freedom of ship motion. In addition, the subscript “k” represents the index number in the database. In the actual simulation, the coefficients at a certain ship state were obtained quickly using trilinear interpolation on the database, in light of the irregular waves and the ship motion state.
2.2.2. Environmental Database
The marine environment is complex and constantly changing. The wind, currents and waves all vary with time and space. To approximate the real environmental disturbances in the simulation, the spatiotemporal variability of the environment must be considered to simulate ship motions in actual navigation [14]. Historical observations can be imported to the ocean forecasting model to predict the environmental field for a future period [15].
Given the high real-time requirement of visual-aided navigation, we obtained the dynamic information of environmental vectors from an offline environmental database. The structure of the environmental database is shown in Figure 2, where the data at different moments are arranged sequentially in sub-tables. In each sub-table, the keys used for indexing are latitude and longitude , and the data segments are wind, current and wave vectors, where represent the wind direction and speed; represent the current direction and speed; represent the wave direction, wave period and wave height, respectively. During the simulation, trilinear interpolation with latitude, longitude and time was performed on the environmental database, according to the time and ship position. The interpolation yields the wind direction, wind speed, current direction, current speed, wave direction, wave period and wave height of the corresponding time and space. Next, the dynamic environmental vectors were imported to calculate the environmental disturbances of the ship.
2.2.3. Dynamic, Data-Driven Simulation Pipeline
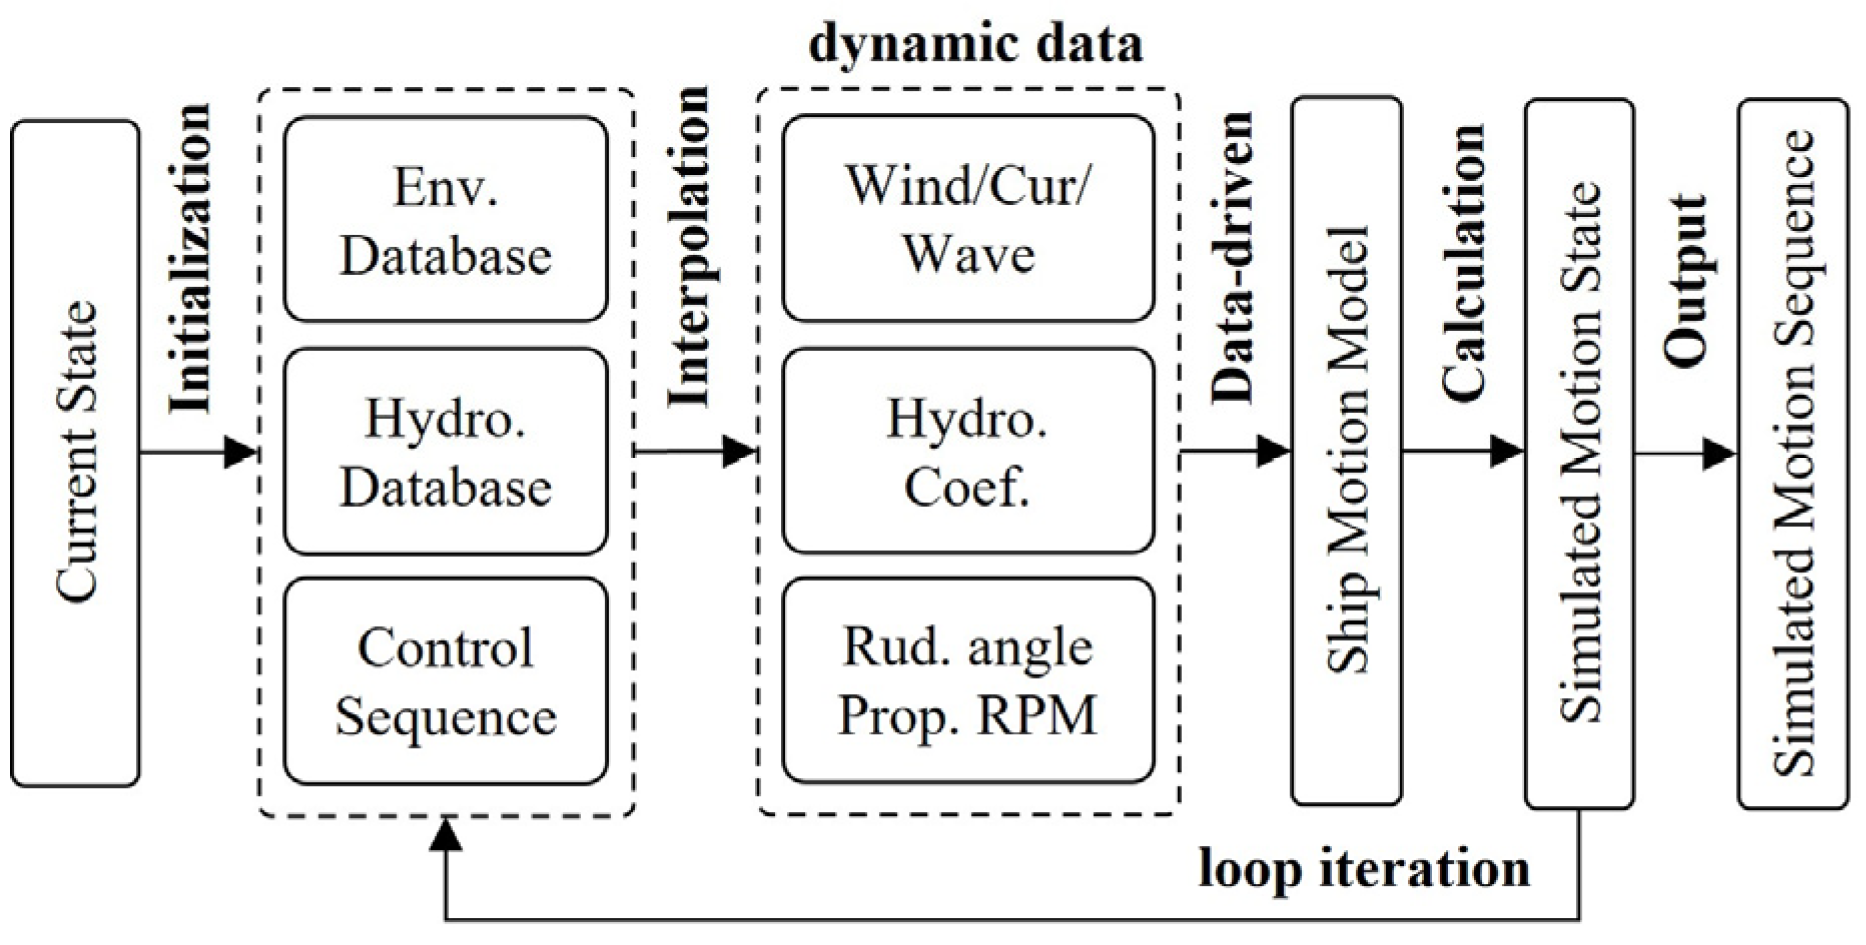
Based on the ship hydrodynamic database and the environmental database, this paper sets up a dynamic data driven simulation pipeline, as shown in Figure 3. Take the superimposition of simulated motion trajectories in visual-aided navigation as an example. During one simulation, the pipeline is initialized by the information includes the current ship motion state (attitude, velocity and position) of the ship, and the wind, current and wave vectors are derived from the environmental database through interpolation of time and ship position. Subsequently, hydrodynamic coefficients are obtained from the hydrodynamic database through interpolation of wind, current and wave vectors according to the motion state of the ship. Additionally, the current rudder angle and propeller rate is extracted from the control series planned by the intelligent navigation unit. Next, the above dynamic data are input into the ship motion model to drive the solving process, producing the motion state at the next time step. The above steps are repeated cyclically until all the data in the control series are calculated. In the end, the simulated motion series is output to the visual-aided navigation unit, where the simulated routes are merged with the video for display.
In this pipeline, the most important parts are the offline databases. On one hand, the online simulation can achieve real-time performance benefits from the interpolation of the offline databases. The interpolation employed in this pipeline is linear method, which can keep the time consumption at a low level. On the other hand, the databases are carefully designed. The databases are developed based on light-weight local database SQLite, and the primary keys of databases are converted from physical values to integer numbers, which attempts to reduce the time of database indexing as much as possible. Consequently, this simulation method can achieve superior real-time performance by using the above techniques.
In the above pipeline, different modules are decoupled from each other and interact only at the data level, and the ship motion model is a replaceable unit. To simulate ship motion trajectories quickly, this paper adopts a four degrees of freedom (4-DoF) model considering environmental disturbances, as shown in Equation (1). This model was developed by adding dynamic data to the practical model proposed by Yasukawa et al. [16]. Where m is the ship mass, is the longitudinal position of the center of gravity, represents the added mass, indicate the moment of inertia, represents the added moment of inertia. Additionally, u, , r, and p represent the surge, sway, yaw and roll speed, respectively. In Equation (2), X, Y, N and K are the combined forces/moments of the surge, sway, yaw and roll motion, respectively, while the subscripts H, R, P, a, c and w are the forces/moments of hull hydrodynamic force, rudder, propeller, wind, currents and waves acting on the ship, respectively. Among them, the coefficients used to calculate the hull hydrodynamic force are from the hydrodynamic database, the environmental vectors used to calculate the wind, current and wave disturbance forces are from the environmental database, and the rudder angle and propeller rate used to calculate rudder and propeller control forces are from the control series. For detailed calculation method of the terms in Equations (1) and (2), please refer to the literature [17].
2.3. Validation Datasets
Dataset Structure
This section devises a dataset for validating the proposed ship motion simulation method in visual navigation aids. As shown in Figure 4, the validation dataset contains three parts of data, namely, control input, environmental input and true value. Each row of the dataset is a 16-dimensional vector containing a 1-dimensional timestamp, a 1-dimensional rudder angle, a 1-dimensional propeller rate, a 2-dimensional wind vector, a 2-dimensional current vector, a 3-dimensional wave vector, a 3-dimensional Euler angle of the attitude (which can be converted from a rotation matrix or a 4-tuple) and a 3-dimensional position vector. Each dataset contains k moments of data, forming a matrix of size .
Take the data at moment 0 as an example. The rudder angle in the control input is in degrees; the propeller rate is in revolutions per minute (RPM); the wind direction is in degrees; the wind velocity is in m/s; the flow direction is in degrees; the flow velocity is in m/s; the wave direction is in degrees; the wave period is in s; the wave height is in m; the attitude in the ground truth is , which represents a 3 × 3 rotation matrix, and is stored in the dataset as Euler angles with three components (roll angle , pitch angle and yaw angle ); the position is , and stored in the dataset as latitude, longitude and altitude.
2.4. Performance Indexs
The simulation performance on the validation dataset was measured by two kinds of metrics, namely, accuracy and real-time performance.
2.4.1. Accuracy
The simulation accuracy measures the error between the simulation data and the ground truth. The index mainly contains two types of data: attitude and trajectory. Since the ship’s attitude and position change constantly, the accuracy is measured by the absolute error in a fixed time range. Taking the heading data, for example, the simulation accuracy can be expressed as:
where and are the simulated and ground truth heading at time k, respectively; the subscript “gt” and “sim” indicate the ground truth and simulation; is the absolute heading error at each moment k; N is the number of rows in the matrix of the dataset with the constant physical time steps; is the mean error over the whole dataset in units of .
For the trajectory data, the latitude, longitude and height data are firstly converted to the east–north–up (ENU) coordinates. Then, the position of the ground truth values of row 0 in the dataset is taken as the origin of the ENU coordinate system. For the rest of the positions, coordinate conversion is implemented to derive the metric coordinates under that coordinate system. Next, the trajectory error is calculated:
where and are the simulated and ground truth positions at moment k, respectively; is the absolute trajectory error (2-norm) at each moment k; is the mean trajectory error over the whole dataset in units of .
2.4.2. Real-Time Performance
Real-time performance measures the time cost of our simulation method on datasets of different physical durations. As shown in Equation (5), a dataset with physical duration t is divided into subsets with the interval of , starting from . Then, each subset is subjected to n tests on simulation time cost. The mean time cost (ms) is thus obtained and plotted into a simulation time–cost curve for different physical durations.
3. Results and Discussion
3.1. Data Source
This section aims to validate the proposed simulation method with real ship data. Two validation datasets, hereinafter referred to as cases 1 and 2, were constructed based on the actual sailing records of a bulk carrier. The main parameters of the bulk carrier are provided in Table 1. The voyage data is extracted from the VDR (voyage data recorder).
The basic information of the voyage is shown in Table 2, where the start and end positions are provided in longitude and latitude values. The wave height appears to be more than 4 m and is coupled with a strong wind. That is, the weather of the voyage is relatively bad, and the ship is affected by wind, current and wave simultaneously. The time interval of the data is 0.1 s, and 1.0 h length for each case. For each time point, the data consist of the time, control input series of the ship (collected actual rudder angle and propeller rate), the environmental input vectors (wind, wave, and current vectors), and the ground truth vectors (attitude and trajectory) as described in Figure 4. Each validation dataset has 36000 rows and 16 columns. The accuracy and real-time performance of our simulation method were evaluated on the validation dataset based on the proposed indexes in Equations (4) and (5).
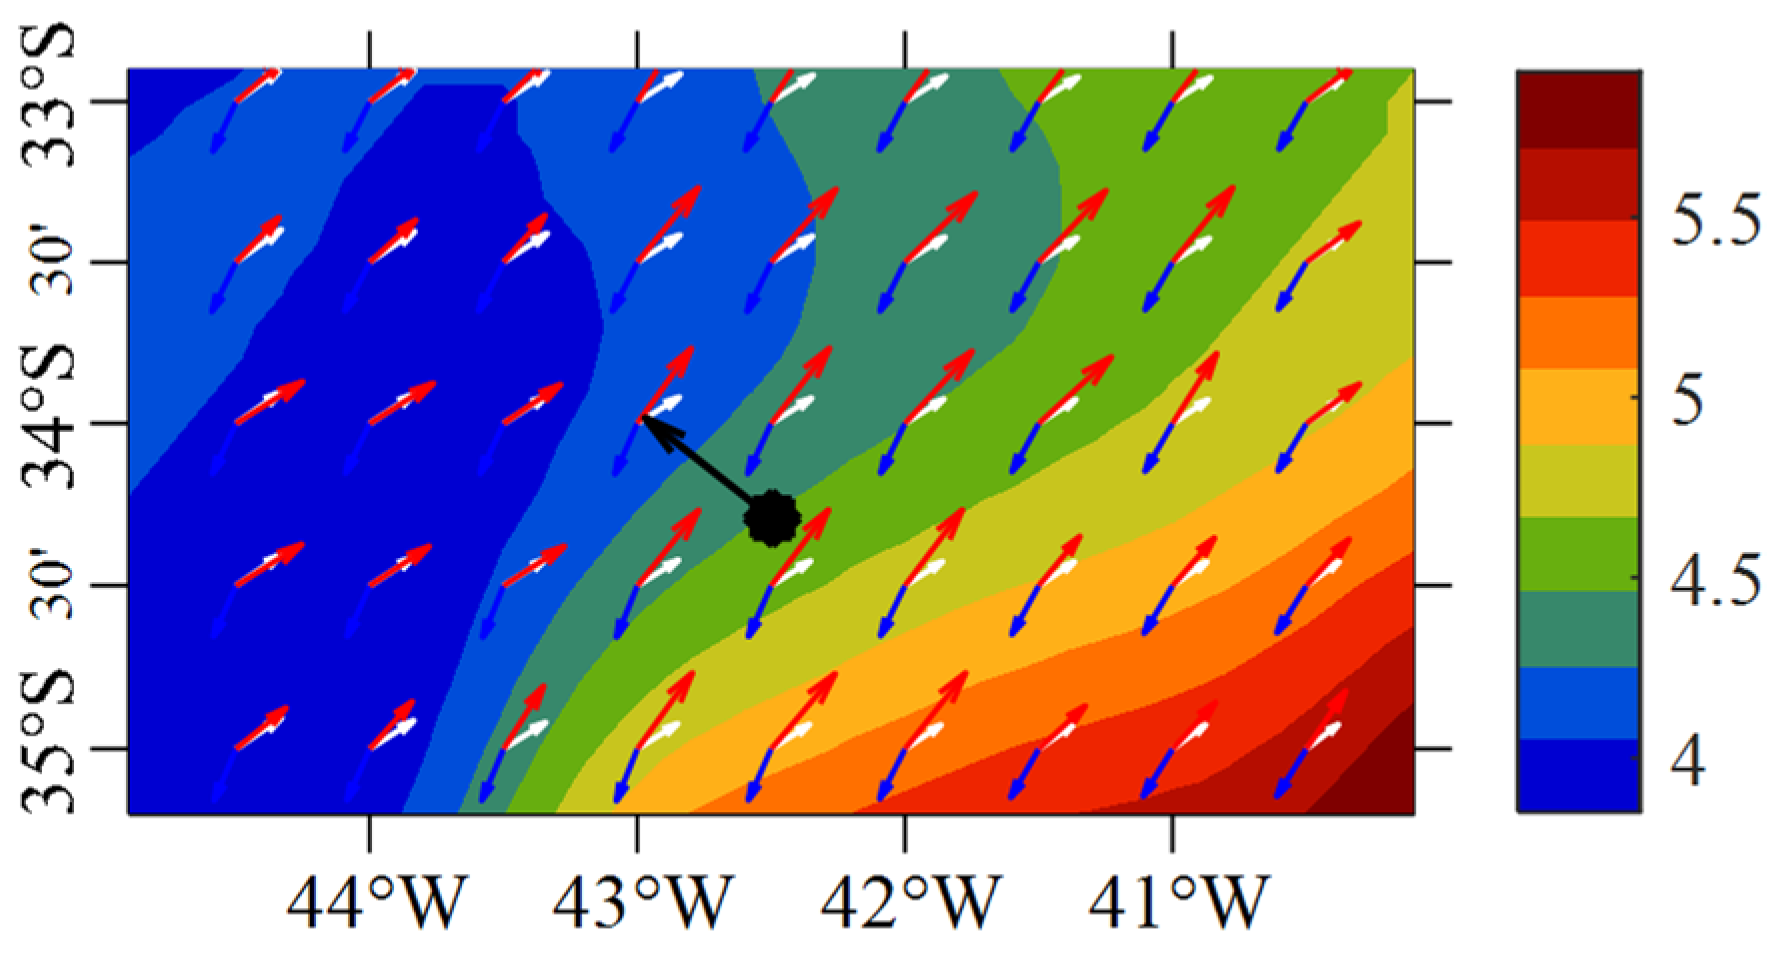
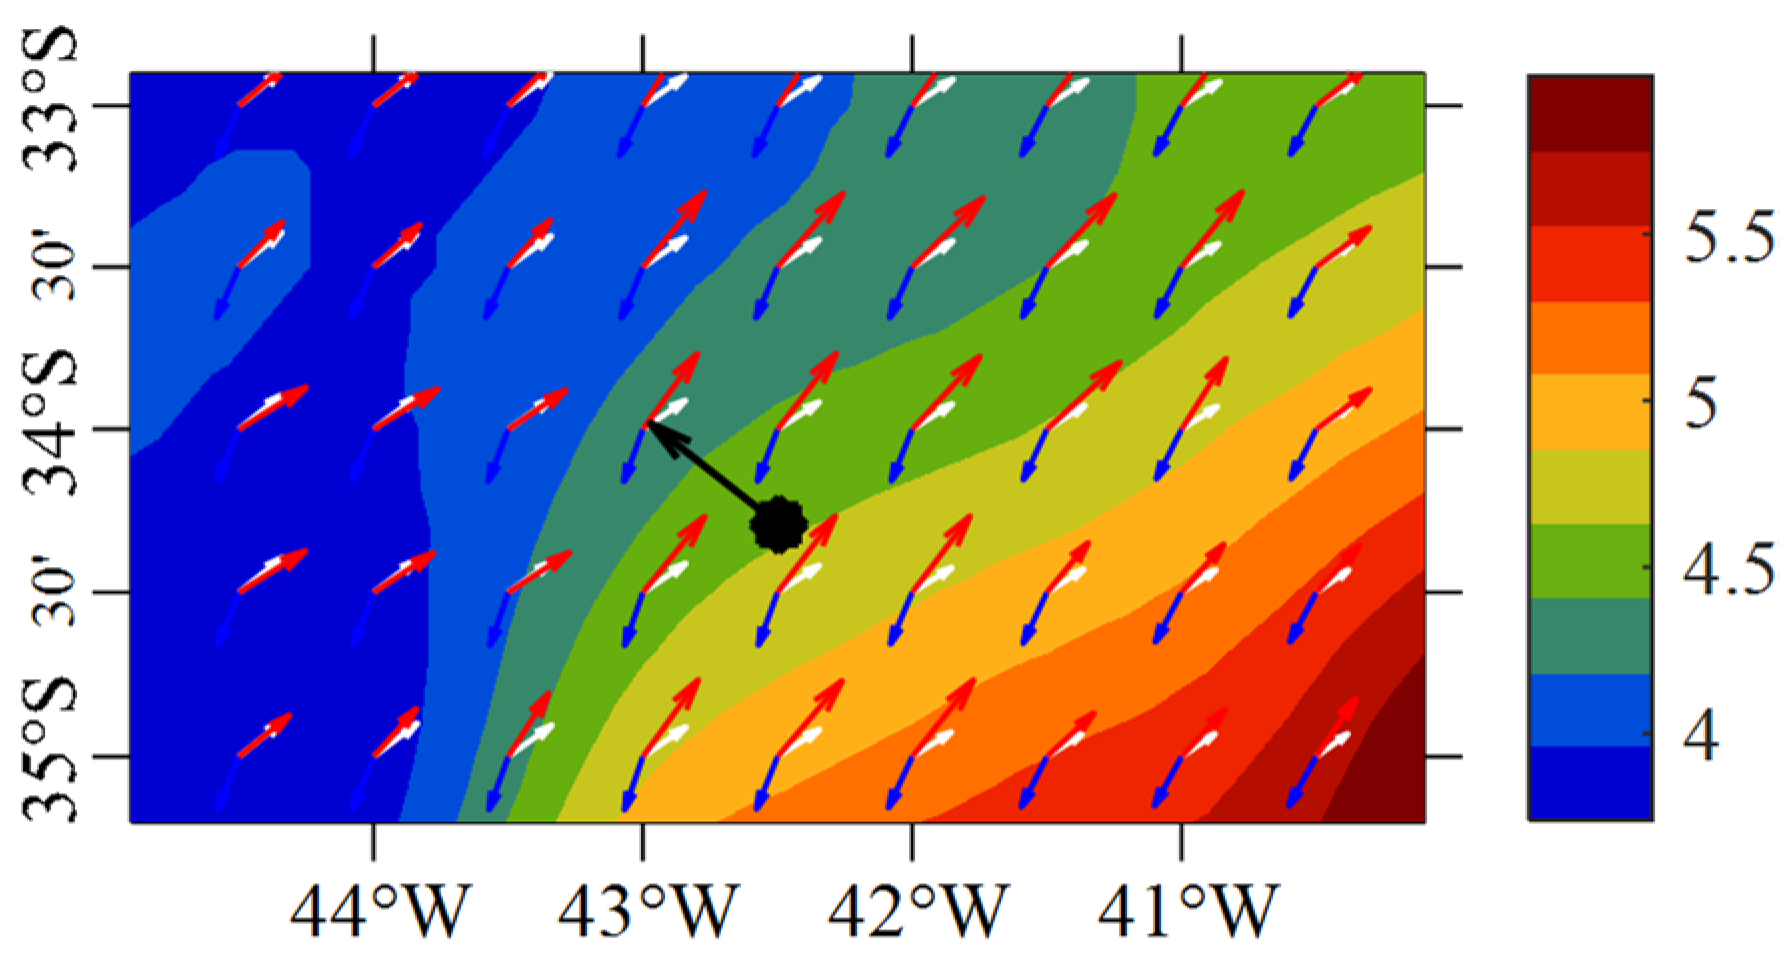
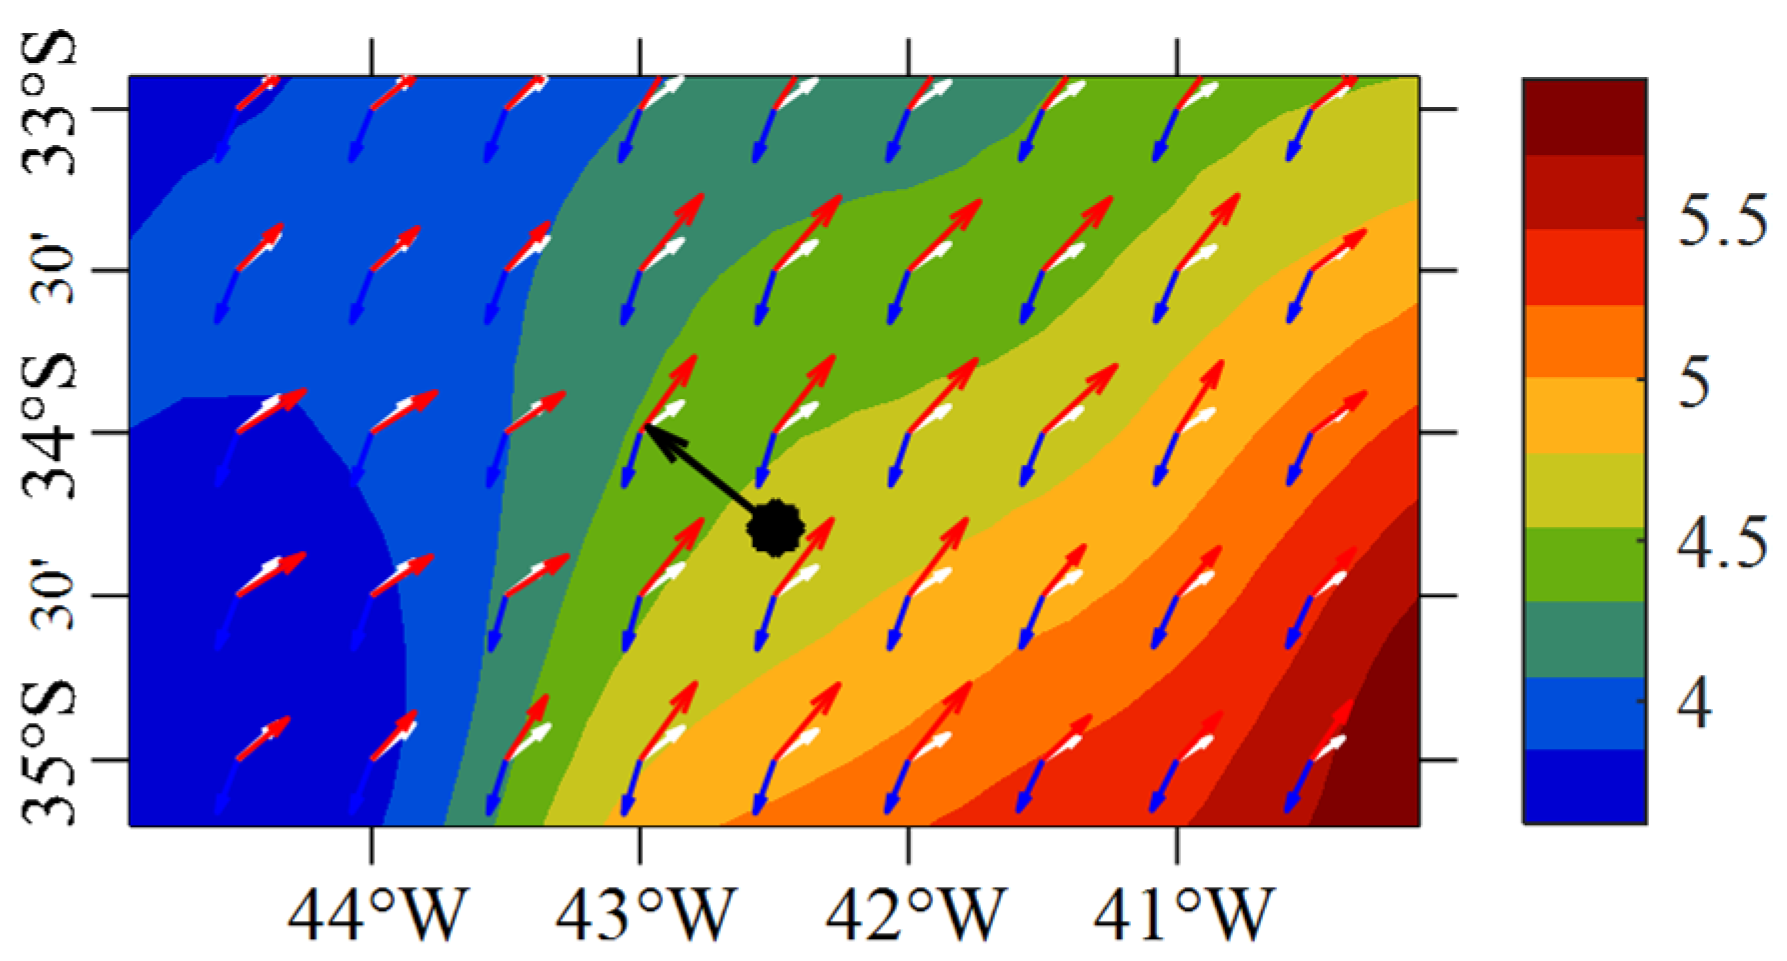
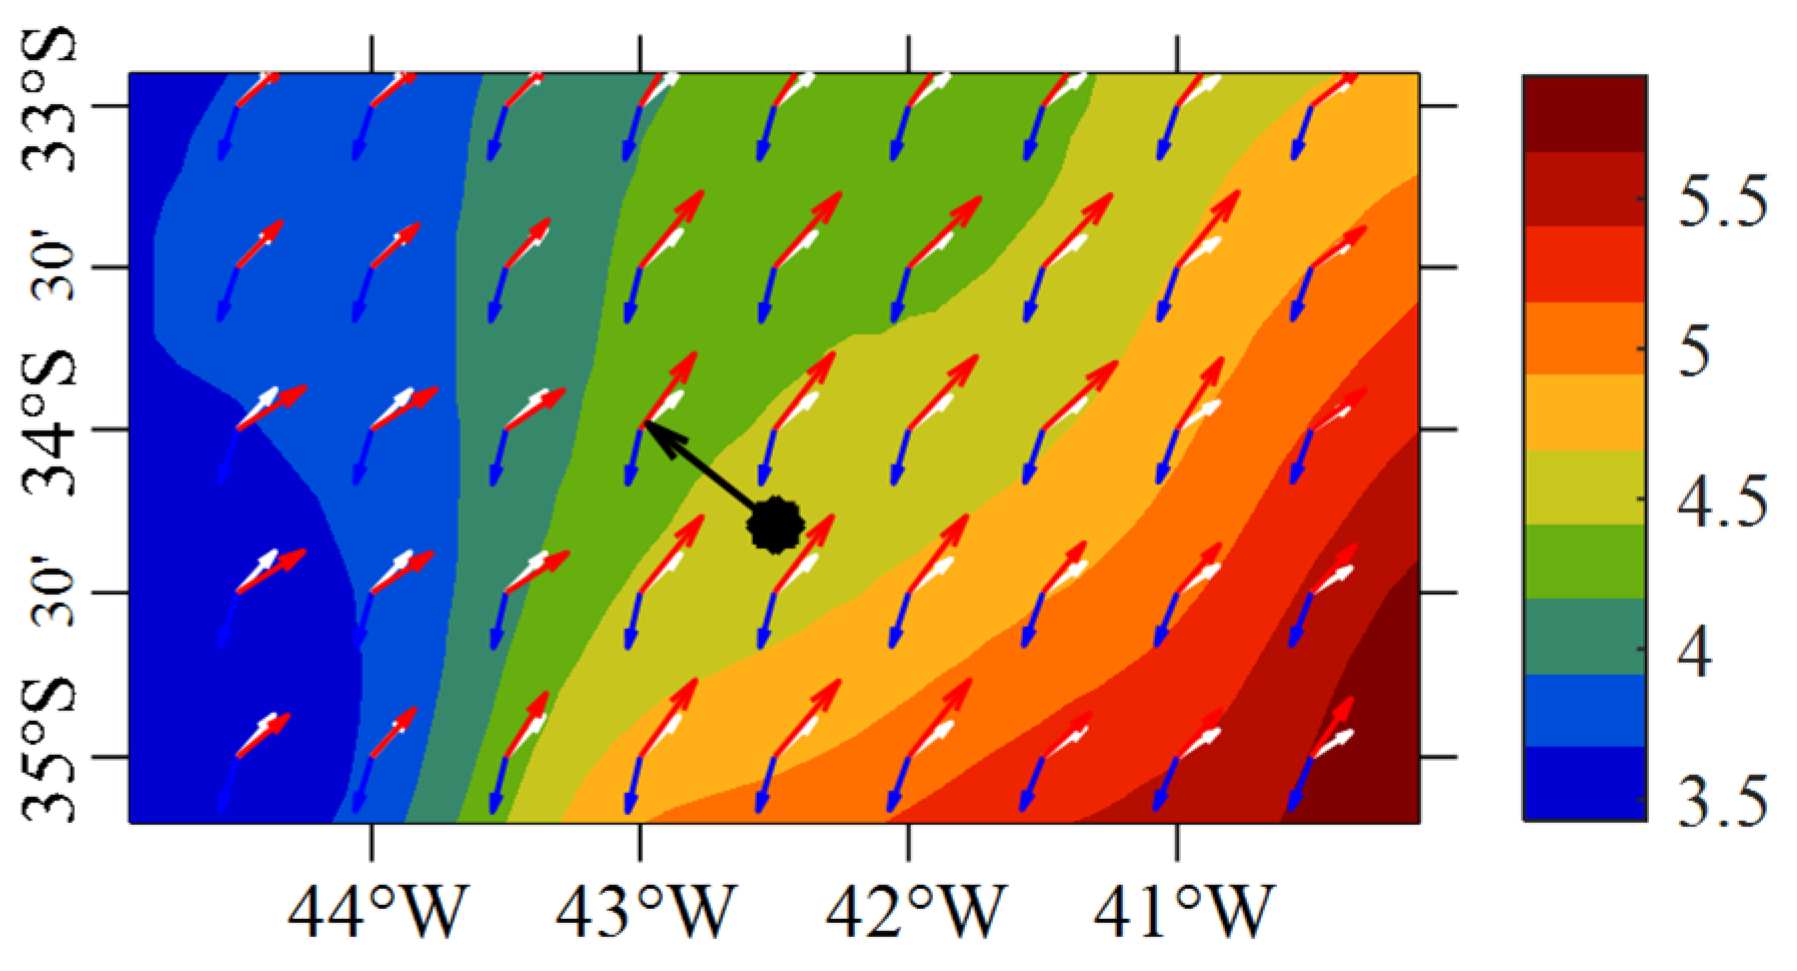
Figure 5, Figure 6, Figure 7 and Figure 8 display the environmental field data near the start and end positions of the ship in cases 1 and 2. In the environmental database, the longitude and latitude grids of wind, waves and currents are of the resolution 0.1°. The horizontal axis represents geographic longitude, and the vertical axis represents geographic latitude. Additionally, the right color bar indicates the wave height values of the contour map. To keep them clear, the figures only present part of the vector data of whole grids. The heading is marked with a black arrow and the wind, current and wave vectors are marked with red, blue and white arrows, respectively. In cases 1 and 2, the ships both head northwest. The colored contours show the distribution of the meaningful wave heights, indicating that the ships in both cases sail in rough sea conditions. Comparing the start and end moments of the figures, we clearly observed the spatiotemporal changes in the marine environment. Therefore, the time- and space-varying information of the environmental vector field must be considered to simulate the real-time ship trajectories for visual-aided navigation.
3.2. Validation Results of Accuracy
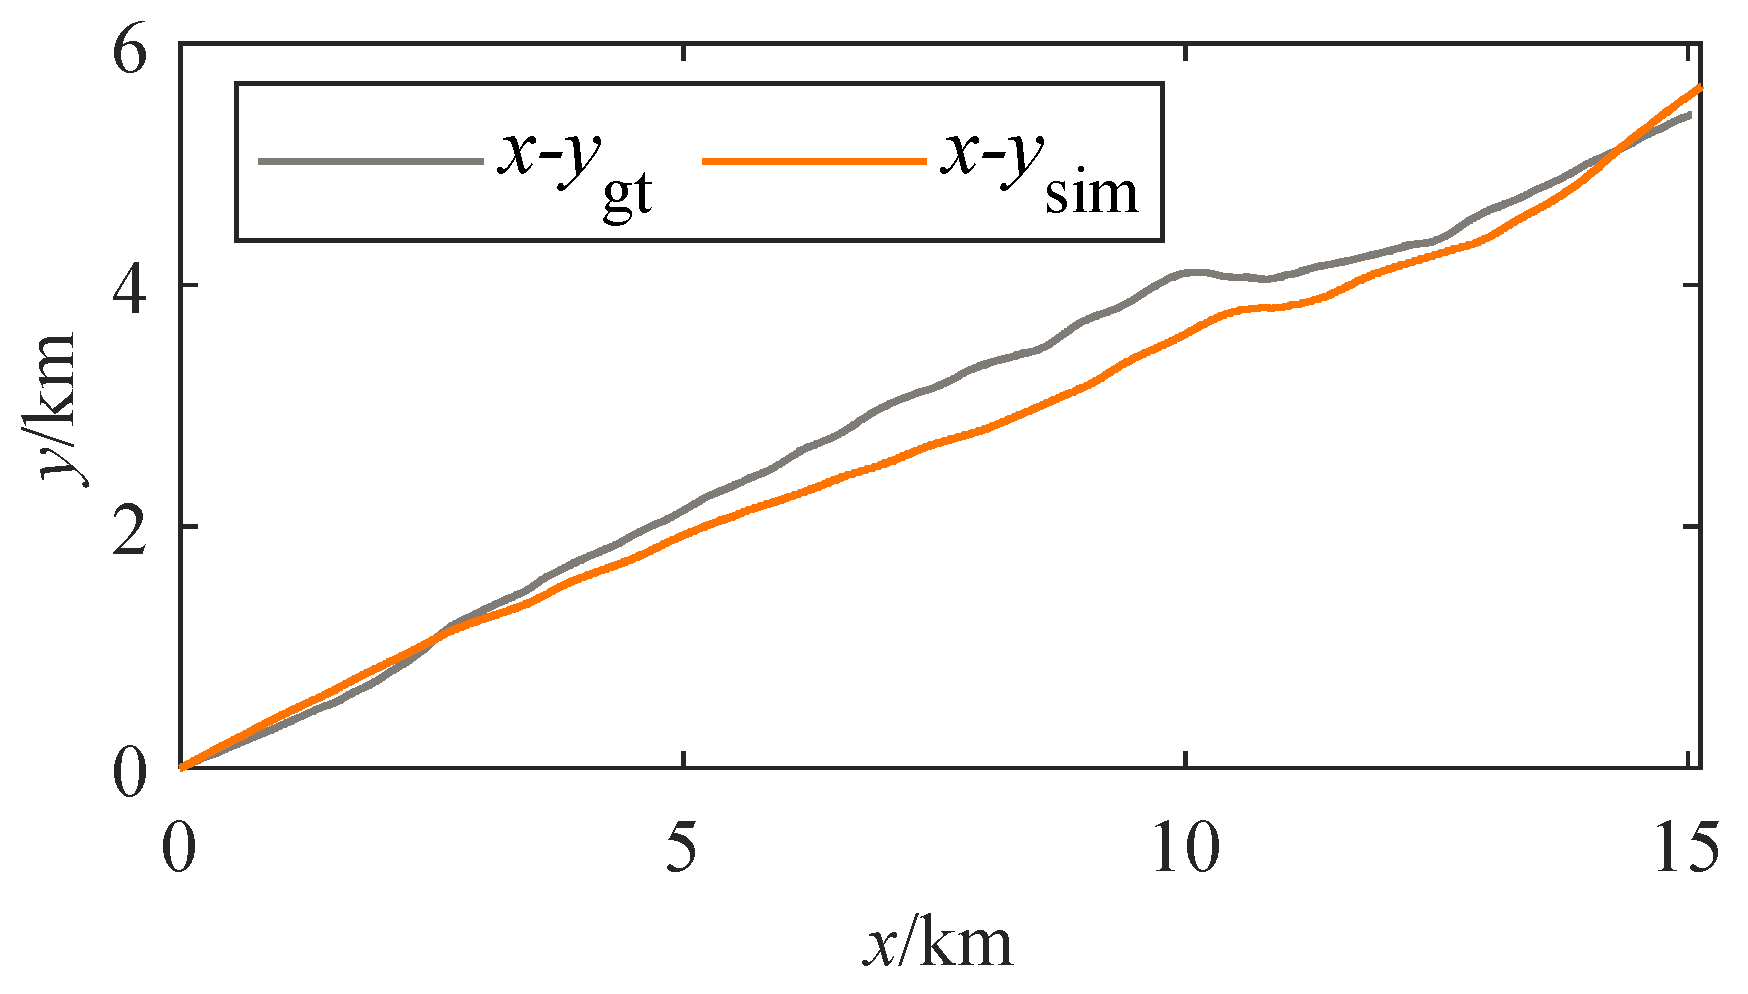
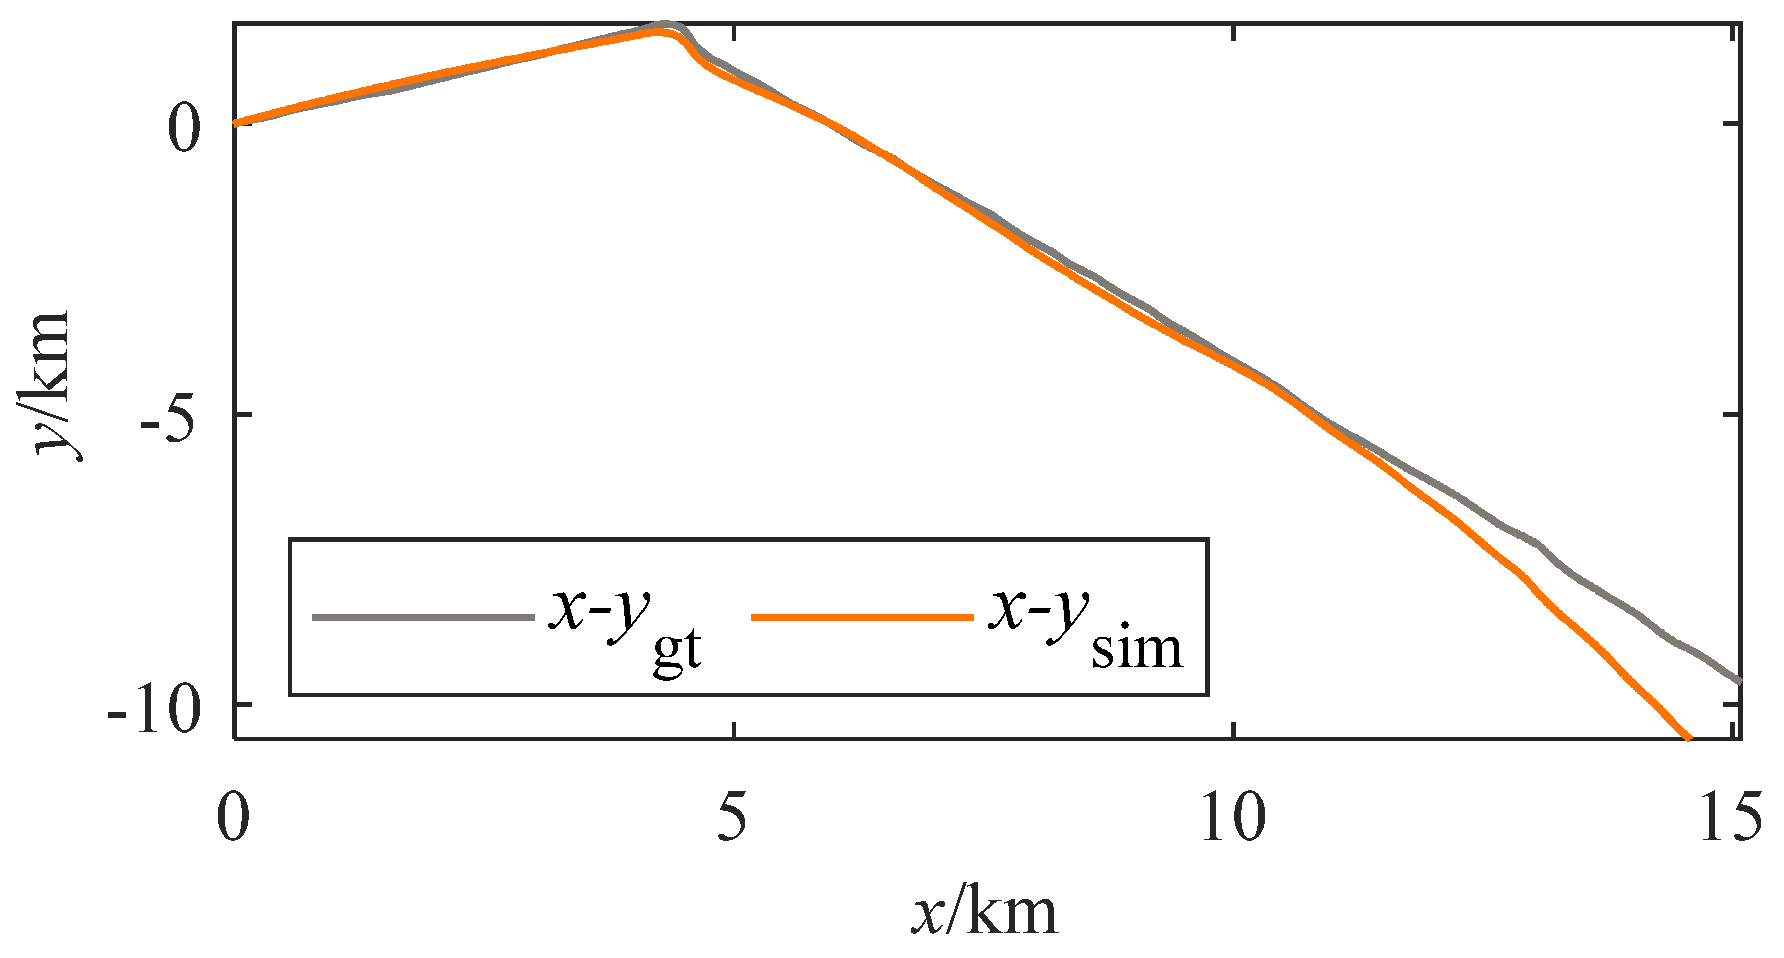
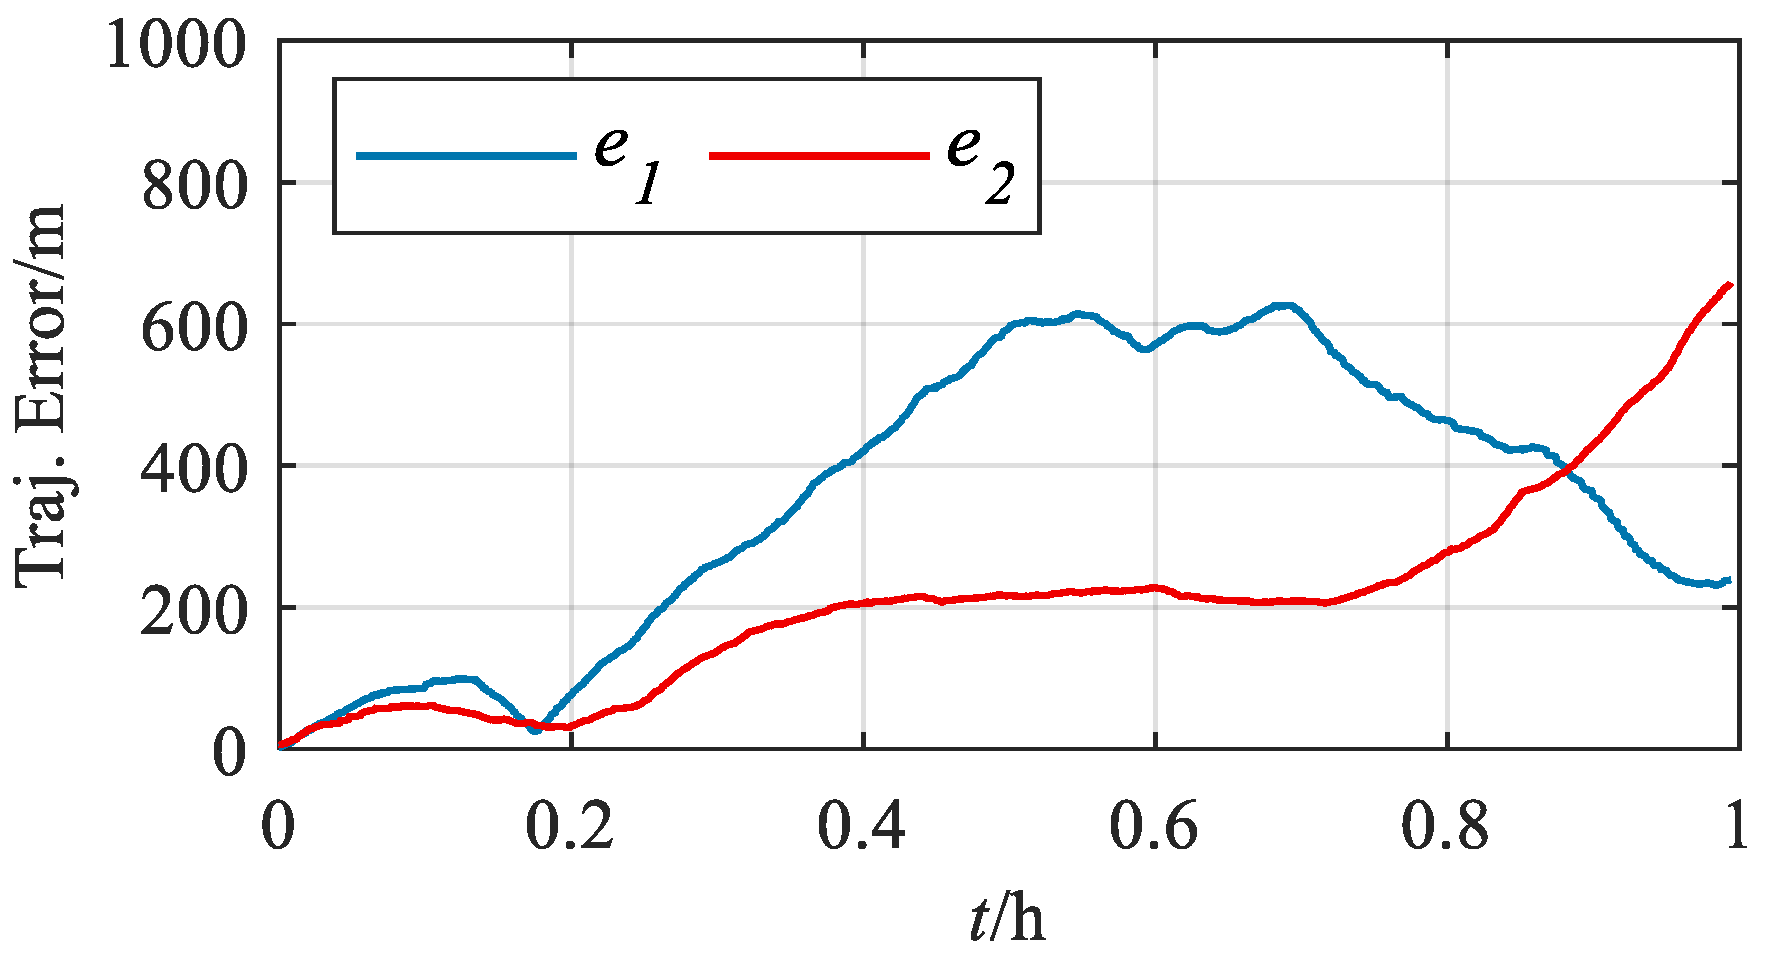
Figure 9 and Figure 10 compare the simulated and true trajectories in cases 1 and 2, respectively. The horizontal and vertical coordinates are in km. Figure 11 displays the trajectory error curves, where and represent the trajectory errors in m for cases 1 and 2, respectively. In case 1, the maximum absolute error of the simulated trajectory was 626.4 m, and the mean absolute error is 356.2 m/h. In case 2, the maximum absolute error of the simulated trajectory was 657.7 m, and the mean absolute error is 208.9 m/h. The mean trajectory error of the two cases stood at 282.6 m/h.
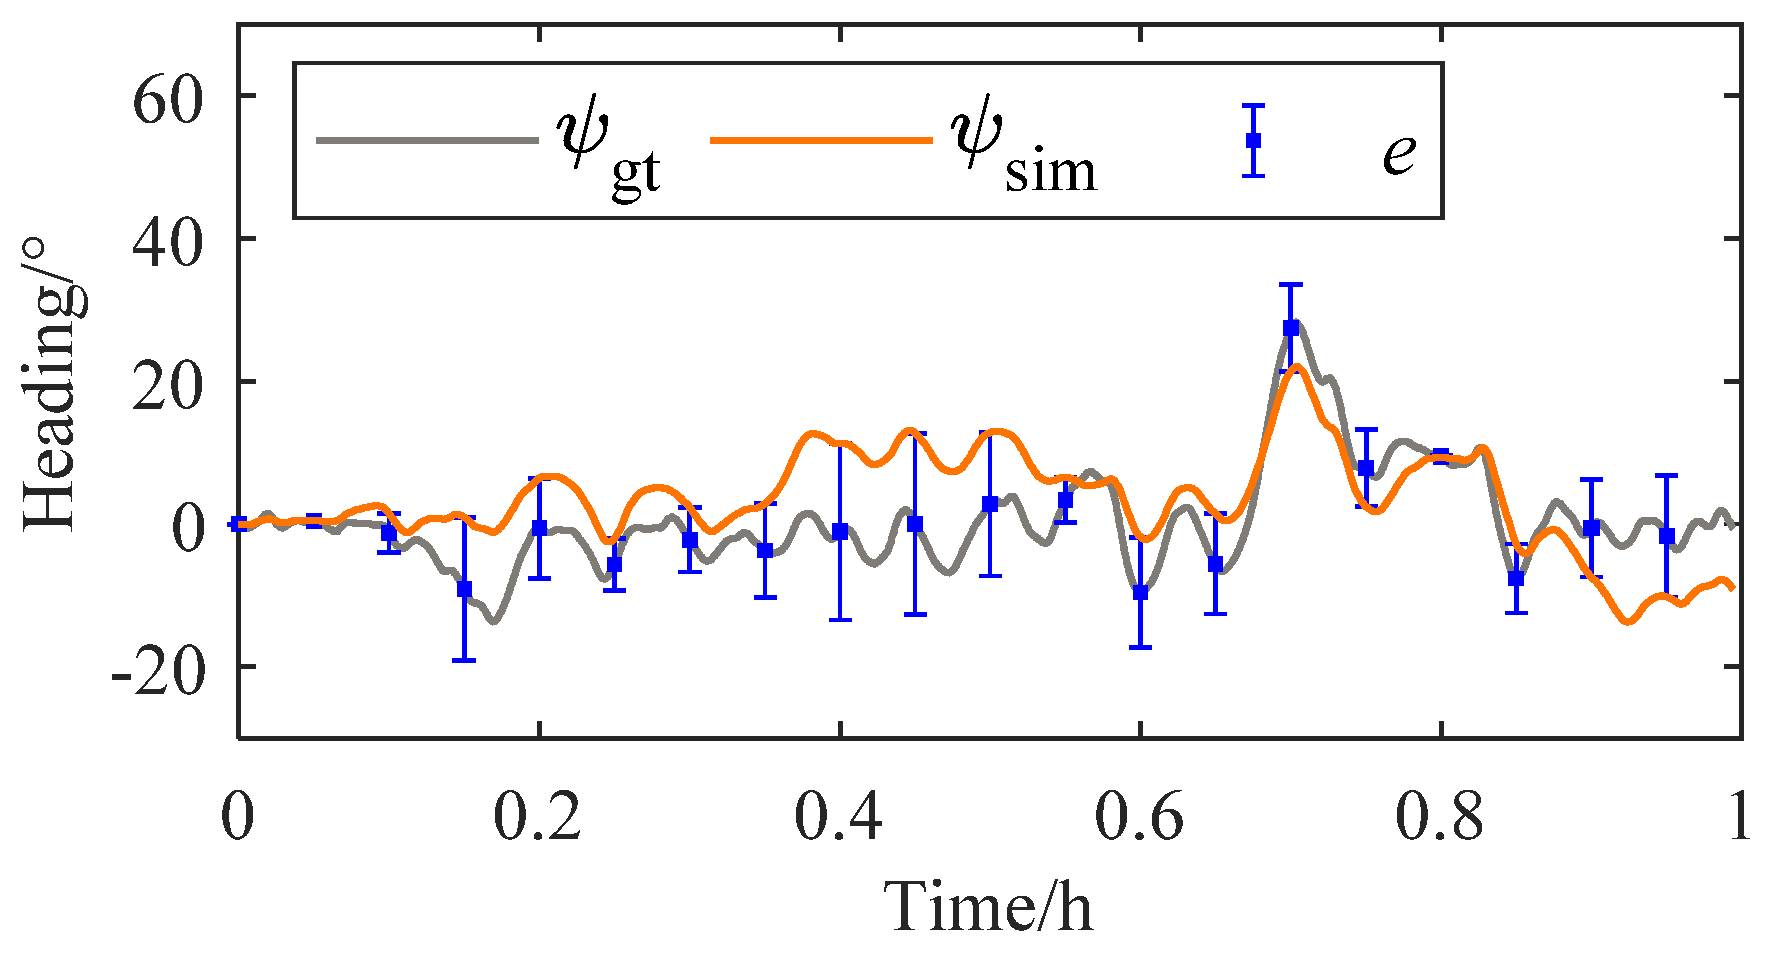
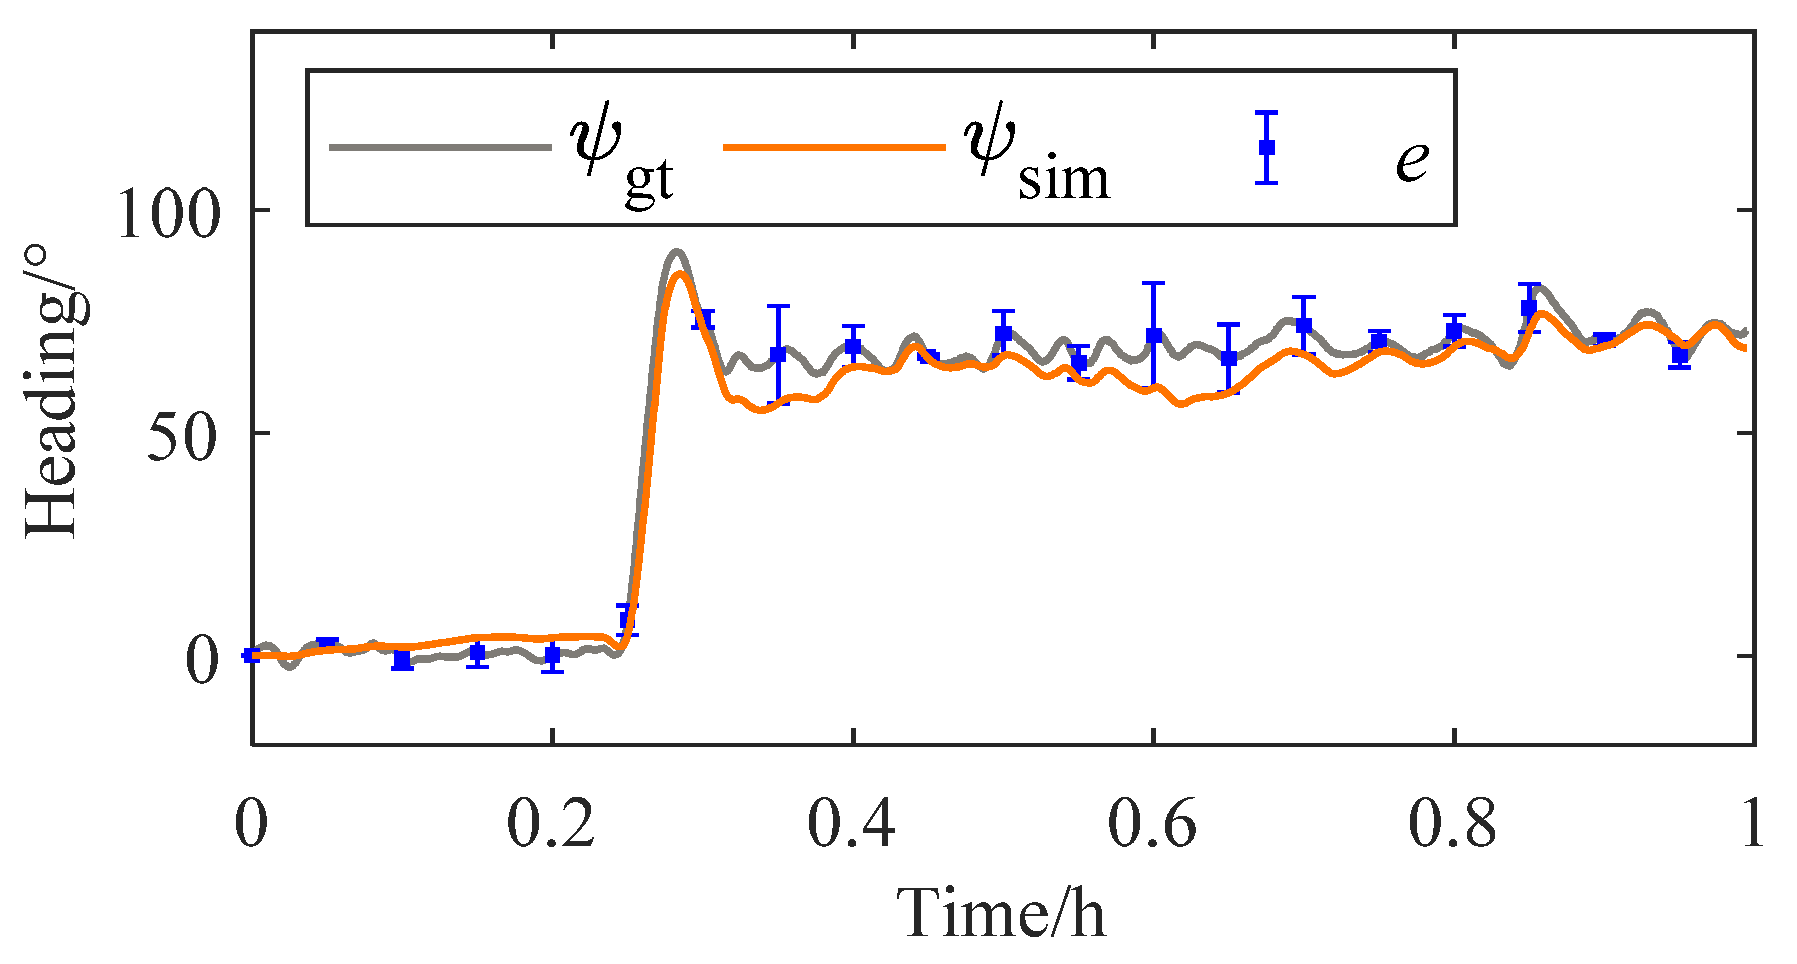
Figure 12 and Figure 13 compare the simulated and true headings in cases 1 and 2, respectively. Note that e is the absolute error between the two headings. In case 1, the maximum absolute error of the simulated heading was , and the mean absolute error was . In case 2, the maximum absolute error of the simulated heading was , and the mean absolute error was . The mean heading error of the two cases was .
As can be seen from Figure 9 and Figure 10, the ship in case 1 basically sails straight, while that in case 2 is turning. As shown in Figure 12 and Figure 13, there is a certain absolute error between simulated and true headings in either case 1 or case 2. However, the simulated and true headings change rather consistently, and the error is relatively stable. The simulated results can accurately reflect how the changing marine environmental factors and maneuvering on ship motions. Judging by the error variation, the headings and trajectories of the two cases do not show large cumulative errors under the physical time of 1 h. The headings and trajectories at the end moment are within a reasonable distance from the true values.
3.3. Validation Results of Real-Time Performance
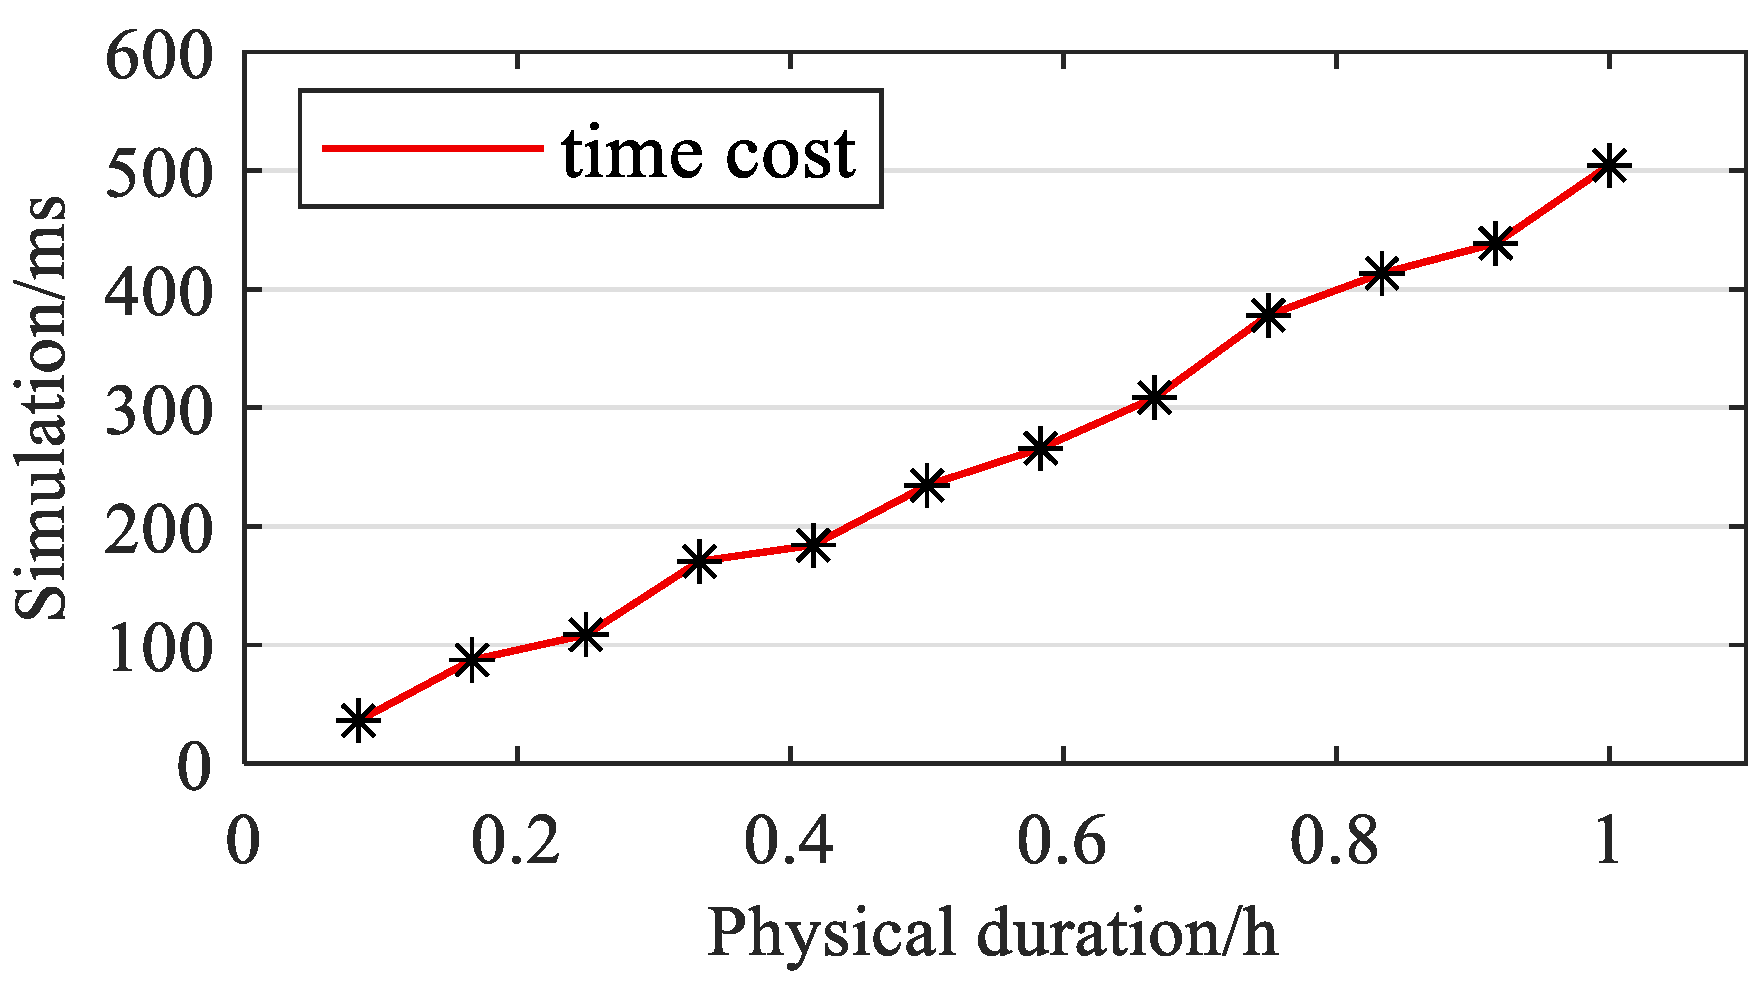
Cases 1 and 2 were simulated for different durations to count the time cost of our simulation method. Each case with the physical duration of 1 h was split into nine subcases (0.1–0.9 h) of different durations, with 0.1 h as the interval. Each subcase was simulated multiple times, and the mean time cost was counted. The real-time performance was verified using a computer equipped with Intel i5-1135G7 (2.40 GHz) with 16.0 GB of RAM. Figure 14 shows the simulation time cost with physical duration. The horizontal axis represents the duration of the actual voyage (in hours), while the vertical axis represents the duration of the simulation time cost of the voyage (in milliseconds).
As shown in Figure 14, it is obvious that the simulation time cost was linearly related to the physical duration. This is mainly because the solution of the ship’s motion state depends on the numerical solution of the differential equation, and the simulation method projects the current state based on the previous state. In other words, the simulation program has a serial structure. The simulation time cost inevitably rises, as the physical duration grows. The simulation consumed 475 ms for a 1 h physical duration and merely 24 ms for a 0.1 h physical time. The above results suggest that our method achieves good real-time performance with the current hardware. The time cost is expected to be reduced if better hardware is employed.
To sum up, the generation of visual-aided navigation information mainly comes from the traditional navigation equipment on the bridge at the current stage. For example, based on 2D graphics or text information directly obtained from ECDIS, AIS, GPS, compass and other equipment. The information above can be considered as low-level navigational information, which can be visually displayed on the screen or smart glasses, but the pilot or bridge officer still needs to further evaluate and process these information. The ship motion model can predict the ship motion state, combine with the trial operation and other modules to quickly provide the current ship motion trend, and reflect the ship motion state in real-time. It has significant application value in visual navigation and decision-making.
However, there are few studies on generating this kind of navigation information in existing visual-aided navigation systems. High-level navigation aid information can reduce the cognitive load of seafarers while enhancing situational awareness and maximizing the effectiveness of visual-aided navigation systems, which will also be an essential development direction in the generation of visual navigation aid information in the future. This work is also the basis of this research direction, providing plug-and-play ship motion simulation and prediction module for the subsequent construction of a complete visual-aided navigation system.
4. Conclusions
Visual navigation aid systems on the water could improve intelligent ship perception ability. In this study, we designed a dynamic, data-driven simulation method and constructed validation datasets with performance indicators to simulate ship motions for visual navigation aids. The proposed method was verified on the proposed dataset for accuracy and real-time performance. In the two simulation cases, the mean errors of simulated heading and simulated trajectory were 5.7°/h and 282.6 m/h, respectively. Meanwhile, the proposed simulation program consumed a relatively short time. It output the simulation series for the next 6 min at roughly 42 frames per second (FPS) and provided the simulation series of the next hour at 2.1 FPS. It was indicated that the time consumption of online simulation could keep at a low level based on the interpolation of the offline databases, which is a compromise between speed and accuracy. The validation results show that our method simulated ship motions under the given control series and environment information in with acceptable error and high real-time performance, which is applicable to visual-aided navigation applications.
However, there are still some limitations in this work. The proposed simulation pipeline relies on mechanism modeling to simulate ship motions and requires the parameters of the specific type of ship under analysis. To further improve simulation accuracy and universality, future research may replace the ship motion model in our framework with data-driven artificial intelligence models, such as a recurrent neural network (RNN) model based on the proposed dataset. Additionally, the integration of ship motion simulation and navigation aid registration will be studied in future work.
Author Contributions
Conceptualization, Z.Y. and Q.J.; methodology, Z.Y. and Q.J.; software, Q.J.; validation, X.L.; formal analysis, X.L.; investigation, Z.Y.; resources, Z.Y.; data curation, Q.J.; writing—original draft preparation, Z.Y. and Q.J.; writing—review and editing, Z.Y. All authors have read and agreed to the published version of the manuscript.
Funding
This research was funded by Guizhou Waterway Bureau, grant number 2022-221-07.
Data Availability Statement
Data are unavailable due to privacy or ethical restrictions.
Acknowledgments
Grateful acknowledgment is made to Ma Dianguang, who provided important guidance on this paper.
Conflicts of Interest
The authors declare no conflict of interest. The funders had no role in the design of the study; in the collection, analyses, or interpretation of data; in the writing of the manuscript; or in the decision to publish the results.
References
- Domestic Commercial Vessel Annual Incident Report, January–December 2019. Available online: https://www.amsa.gov.au/vessels-operators/incident-reporting/domestic-commercial-vessel-annual-incident-report-january (accessed on 21 February 2023).
- Annual Overview of Marine Casualties and Incidents (2020). Available online: https://www.emsa.europa.eu/we-do/safety/accident-investigation/item/4266-annual-overview-of-marine-casualties-and-incidents-2020 (accessed on 21 February 2023).
- Jaeyong, O.; Park, S.; Kwon, O.-S. Advanced Navigation Aids System Based on Augmented Reality. Int. J. E-Navig. Marit. Econ. 2016, 5, 21–31. [Google Scholar]
- Jeon, M.; Park, J.; Woo, J. Development of HHI’s Advanced Navigation Assistance System for Safe Voyage. IFAC-Pap. 2019, 52, 111–113. [Google Scholar] [CrossRef]
- Frydenberg, S.; Nordby, K.; Eikenes, J.O. Exploring Designs of Augmented Reality Systems for Ship Bridges in Arctic Waters. Hum. Factors 2018, 26, 27. [Google Scholar]
- Okazaki, T.; Takaseki, R.; Shoji, R.; Matsubara, K. Development of Sea Route Display System by Using Augmented Reality. In Proceedings of the 2017 IEEE International Conference on Systems, Man, and Cybernetics (SMC), Banff, AB, Canada, 5–8 October 2017; pp. 3403–3408. [Google Scholar]
- Nordby, K.; Gernez, E.; Frydenberg, S.; Eikenes, J.O. Augmenting OpenBridge: An Open User Interface Architecture for Augmented Reality Applications on Ship Bridges. In Proceedings of the 19th International Conference on Computer and IT Applications in the Maritime Industries (COMPIT’20), Pontignano, Italy, 17 August 2020. [Google Scholar]
- Procee, S.; Borst, C.; van Paassen, M.; Mulder, M.; Bertram, V. Toward Functional Augmented Reality in Marine Navigation: A Cognitive Work Analysis. In Proceedings of the COMPIT, Cardiff, UK, 15–17 May 2017; pp. 298–312. [Google Scholar]
- Procee, S.; Borst, C.; van Paassen, R.; Mulder, M.; Bertram, V. Using Augmented Reality to Improve Collision Avoidance and Resolution. In Proceedings of the 17th International Conference on Computer and IT Applications in the Maritime Industries, Pavone, Italy, 14–16 May 2018; pp. 14–16. [Google Scholar]
- Laera, F.; Fiorentino, M.; Evangelista, A.; Boccaccio, A.; Manghisi, V.M.; Gabbard, J.; Gattullo, M.; Uva, A.E.; Foglia, M.M. Augmented Reality for Maritime Navigation Data Visualisation: A Systematic Review, Issues and Perspectives. J. Navig. 2021, 74, 1073–1090. [Google Scholar] [CrossRef]
- Yuanyuan, W.; Jialun, L.; Feng, M.; Xingping, W.; Xinping, Y. Review and Prospect of Remote Control Intelligent Ships. Chin. J. Ship Res. 2021, 16, 18–31. [Google Scholar]
- Zhang, X.; Wang, X.; Meng, Y.; Yin, Y. Research Progress and Future Development Trend of Ship Motion Modeling and Simulation. J Dalian Marit Univ 2021, 47, 1–8. [Google Scholar]
- Benedict, K.; Fischer, S.; Gluch, M.; Kirchhoff, M.; Schaub, M.; Baldauf, M.; Müller, B. Innovative Fast Time Simulation Tools for Briefing/Debriefing in Advanced Ship Handling Simulator Training and Ship Operation. Trans. Marit. Sci. 2017, 6, 24–38. [Google Scholar] [CrossRef] [Green Version]
- Jing, Q.; Shen, H.; Gao, Z.; Yin, Y. Simulation on Spatial-Temporal Dynamic Change of Ocean Environment in Marine Simulators. J. Syst. Simul. 2020, 32, 1972. [Google Scholar]
- Jing, Q.; Shen, H.; Yin, Y. A Ship Digital Twin Framework Based on Virtual Reality System. J. Beijing Jiaotong Univ. 2020, 44, 117–124. [Google Scholar]
- Yasukawa, H.; Sakuno, R.; Yoshimura, Y. Practical Maneuvering Simulation Method of Ships Considering the Roll-Coupling Effect. J. Mar. Sci. Technol. 2019, 24, 1280–1296. [Google Scholar] [CrossRef]
- Jing, Q.; Sasa, K.; Chen, C.; Yin, Y.; Yasukawa, H.; Terada, D. Analysis of Ship Maneuvering Difficulties under Severe Weather Based on Onboard Measurements and Realistic Simulation of Ocean Environment. Ocean Eng. 2021, 221, 108524. [Google Scholar] [CrossRef]
Figure 1.
Structure of the ship hydrodynamic database.

Figure 2.
Structure of environmental database.

Figure 3.
Dynamic, data-driven simulation pipeline.

Figure 4.
Structure of the validation dataset.

Figure 5.
Case 1 environmental field (start moment).

Figure 6.
Case 1 environmental field (end moment).

Figure 7.
Case 2 environmental field (start moment).

Figure 8.
Case 2 environmental field (end moment).

Figure 9.
Simulated and true trajectories of case 1.

Figure 10.
Simulated and true trajectories of case 2.

Figure 11.
Absolute trajectory errors of cases 1 and 2.

Figure 12.
Simulated and true headings of case 1.

Figure 13.
Simulated and true headings of case 2.

Figure 14.
Validation results of real-time performance.


Table 1.
Main parameters of the bulk carrier.
| Parameter | Value |
|---|---|
| Ship length | 160.4 m |
| Ship breadth | 27.2 m |
| Mean draft | 8.16 m |
| Propeller diameter | 5.25 m |
| Rudder area | 26.4 m2 |
| Sailing speed | 14 knots |
Table 2.
Parameters of cases 1 and 2.
| Parameter | Case 1 | Case 2 |
|---|---|---|
| Start position | 34.4212° S, 41.5801° W | 34.5812° S, 42.0828° W |
| End position | 34.4698° S, 41.7438° W | 34.4944° S, 42.2470° W |
| Total duration | 1.0 h | 1.0 h |
| Data interval | 0.1 s | 0.1 s |
| Total data volume | ||
| Mean wind velocity | 9.31 m/s | 7.46 m/s |
| Mean flow rate | 0.03 m/s | 0.13 m/s |
| Mean wave height | 4.41 m | 4.58 m |
Disclaimer/Publisher’s Note: The statements, opinions and data contained in all publications are solely those of the individual author(s) and contributor(s) and not of MDPI and/or the editor(s). MDPI and/or the editor(s) disclaim responsibility for any injury to people or property resulting from any ideas, methods, instructions or products referred to in the content. |
© 2023 by the authors. Licensee MDPI, Basel, Switzerland. This article is an open access article distributed under the terms and conditions of the Creative Commons Attribution (CC BY) license (https://creativecommons.org/licenses/by/4.0/).
Share and Cite
MDPI and ACS Style
Yang, Z.; Jing, Q.; Li, X. Dynamic Data-Driven Ship Motion Simulation toward Visual-Aided Navigation on Water. Water 2023, 15, 872. https://doi.org/10.3390/w15050872
AMA Style
Yang Z, Jing Q, Li X. Dynamic Data-Driven Ship Motion Simulation toward Visual-Aided Navigation on Water. Water. 2023; 15(5):872. https://doi.org/10.3390/w15050872
Chicago/Turabian StyleYang, Zongmo, Qianfeng Jing, and Xiaochen Li. 2023. "Dynamic Data-Driven Ship Motion Simulation toward Visual-Aided Navigation on Water" Water 15, no. 5: 872. https://doi.org/10.3390/w15050872
Note that from the first issue of 2016, this journal uses article numbers instead of page numbers. See further details here.