
Combined Column Test for Characterization of Leaching and Transport of Trace Elements in Contaminated Soils

1
Lindum AS, 3036 Drammen, Norway
2
Faculty of Environmental Sciences and Natural Resource Management, Norwegian University of Life Sciences (NMBU), 1430 Ås, Norway
3
Norwegian Institute of Bioeconomy Research (NIBIO), 1430 Ås, Norway
4
Norwegian Geotechnical Institute (NGI), 0484 Oslo, Norway
*
Author to whom correspondence should be addressed.
Water 2023, 15(5), 874; https://doi.org/10.3390/w15050874
Submission received: 31 January 2023
/
Revised: 17 February 2023
/
Accepted: 22 February 2023
/
Published: 24 February 2023
(This article belongs to the Special Issue Quantifying Groundwater Flow and Solute Transport Processes through Modelling and Experiments)
Abstract
:Environmental assessments are required prior to remediation and redevelopment of contaminated sites. To date, regulatory guidelines are commonly based on total concentrations. Occasionally, simple leaching procedures are included in environmental assessment. Despite being essential for quantification of contaminant transport, analysis of hydraulic conductivity is rarely considered. Cost-effective methods that reflect both contaminant leaching and hydrogeological properties of contaminated soils are needed to ensure proper soil management. The aim of this study was to simultaneously evaluate contaminant leaching and hydraulic conductivity in soil using a combined column test (CCT) and compare this to the leaching results from batch tests (BT) and transport estimates derived from the empirical Hazen equation. Two soils of different origin were characterized using the CCT. By including physical and chemical factors affecting the release and retention of contaminants, the CCT provides an integrated assessment of leaching and transport of trace elements from soils. Additionally, the effect of soil compaction was investigated as a physical treatment to reduce leaching and transport in contaminated soils. Soil compaction did not demonstrate reduced leaching, but a less extensive contaminant transport was observed due to reduced hydraulic conductivity in the soil.
1. Introduction
Contaminated soils and sites can serve as pools and long-term sources of trace elements to the environment. In the European Union (EU) alone, 2.8 million sites are potentially contaminated due to polluting activities in the past [1]. Today, historically contaminated sites are under redevelopment [2] as the demand for land is rapidly increasing in urban areas. Environmental risk assessments aim to determine the likelihood of negative impacts for humans and the environment caused by the presence of contaminants [3], and must be performed prior to considering redevelopment of potentially contaminated sites. The underlying goal is to provide risk-based decisions and suitable clean-up strategies for contaminated soils and sites based on regulatory guidelines and protocols. However, both site investigations and remediation are expensive and time consuming. Therefore, cost-effective methods to evaluate the behavior and fate of contaminants to human health and the environments are crucial to ensure proper management of our common soil resources.
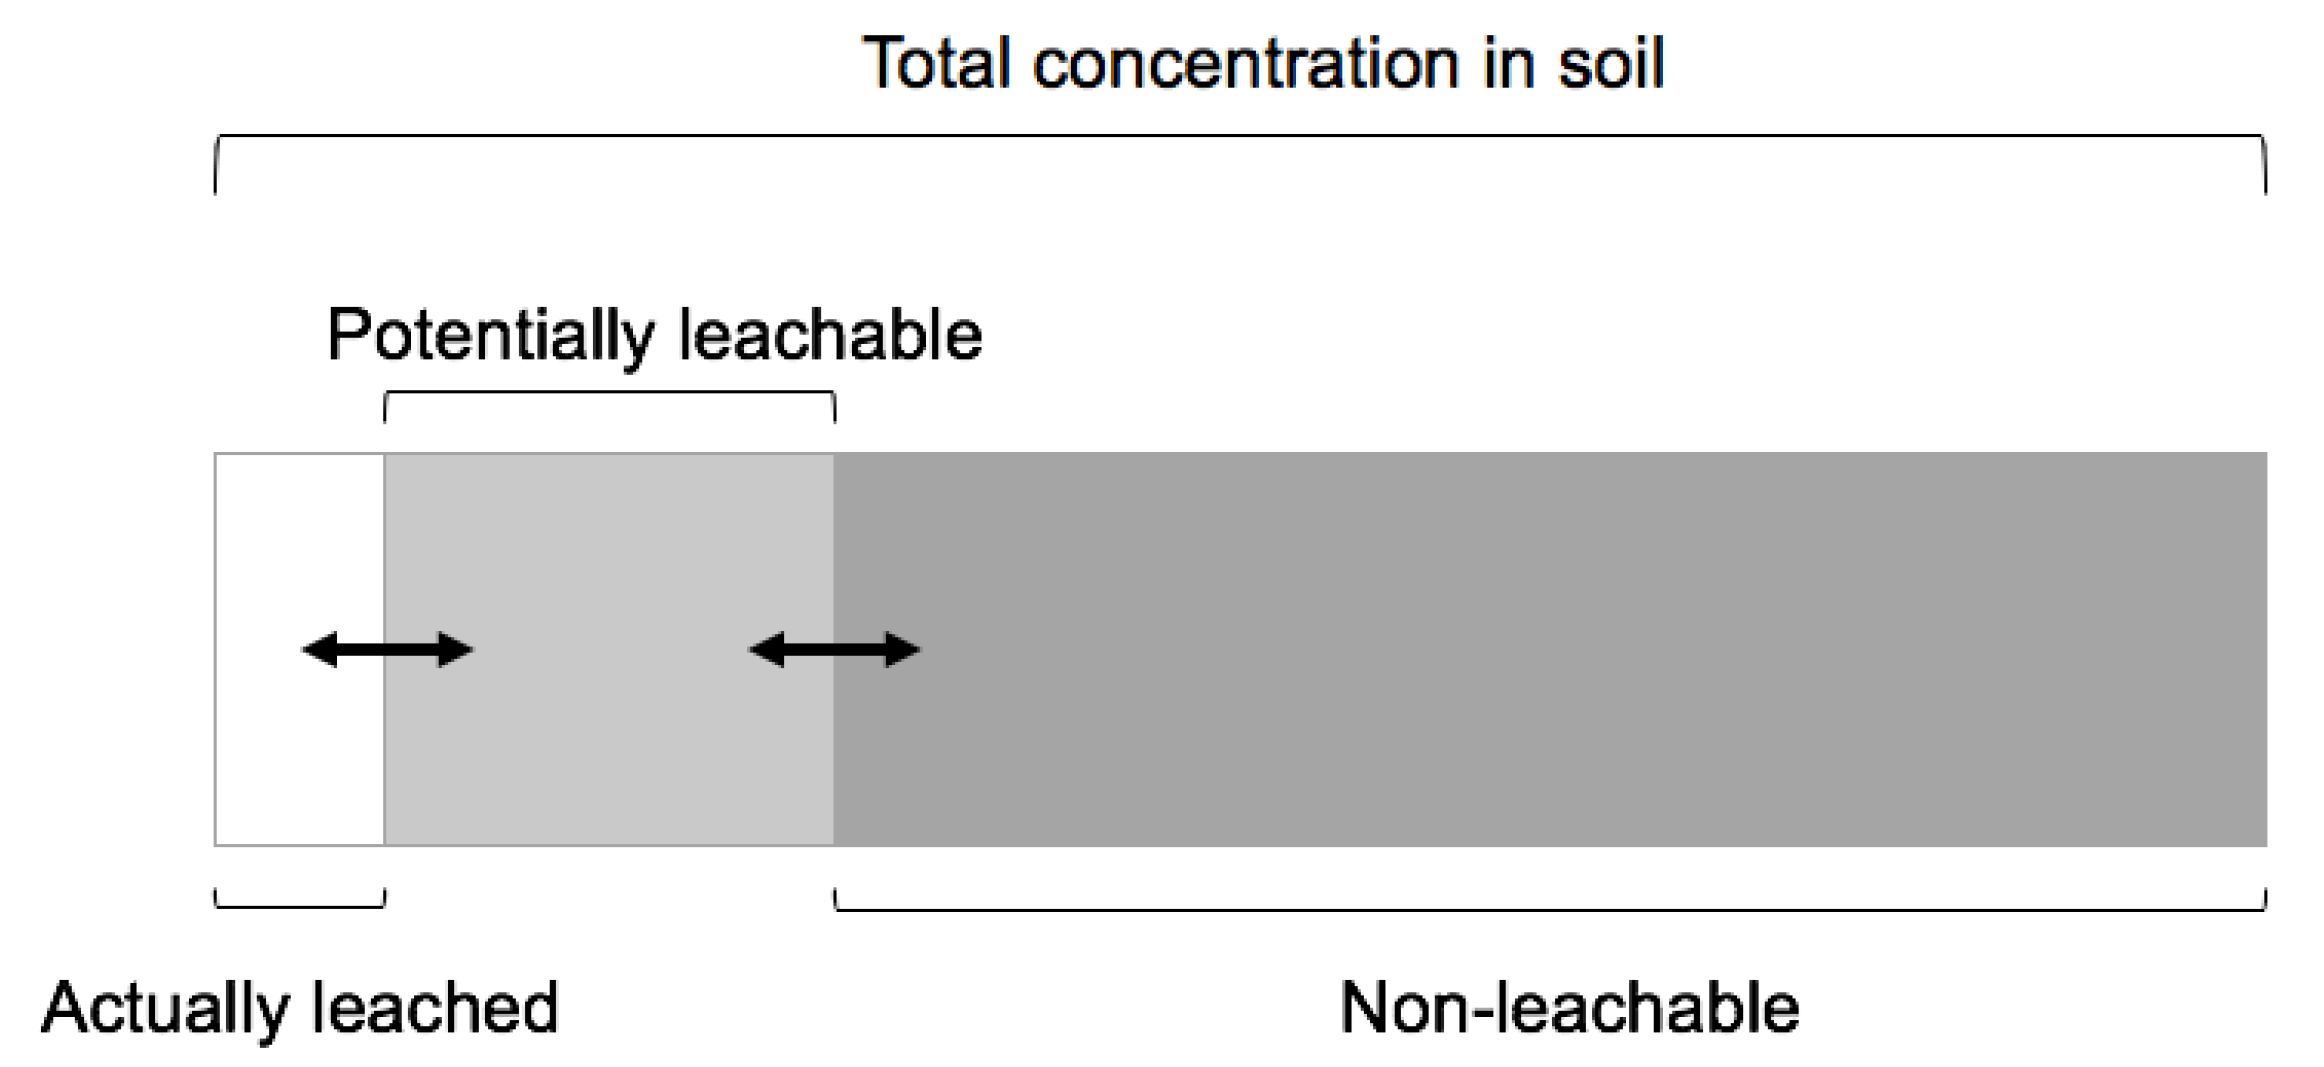
In several countries, including Norway, assessments of contaminated sites have traditionally been based on total concentration analysis (mg/kg dry weight (dw)) which have been evaluated against corresponding soil quality criteria [4,5]. As a significant fraction of the contaminant is embedded in the soil matrix (Figure 1), total concentration analysis quantifies both the dissolved and the irreversibly bound fractions of the contaminant [6]. Hence, legislative guideline values based on total concentration do not consider contaminant availability. As a result, the environmental risks tend to be overestimated. In many cases, this leads to unnecessary and costly remediation measures. Therefore, new approaches that mimic field conditions are needed for more realistic assessments.
The availability of a contaminant depends primarily on its chemical speciation and affinity to soil particles [8]. Therefore, leaching tests are more adequate for environmental assessments. This approach relies on the assumption that, at equilibrium, the distribution of a contaminant between soil and water is constant [9,10]. Rapid screening of the leaching potential can be performed by one-stage batch tests, while more sophisticated column tests aim to mimic field conditions and allow for leaching patterns to be established over a relevant time frame (Table 1). On the downside, more sophisticated tests are generally more labor intensive and time consuming. Despite availability of several standardized leaching tests, regulatory guidelines and protocols still require total concentration analysis. Conversely, the EU Landfill Directive requires soil that is to be landfilled to meet certain leaching limits (both one-stage batch test and column test) before it can be accepted into inert, ordinary, or hazardous landfills [11].
Leaching alone cannot determine the behavior and fate of contaminants in the environment. Transport pathways, including mechanisms such as colloid facilitated transport and dispersion, affect concentration levels in groundwater and other recipients. However, regulatory guidelines and protocols for management of contaminated soils do not consider water transport (highly influenced by hydraulic conductivity and gradient) when assessing the mobility of contaminants in soil. Laboratory and field measurements of hydraulic conductivity (e.g., Schwartz and Zhang [13]; Table 2) are often considered too expensive and labor intensive to include in an environmental assessment. If considered, the preferred option is to do simple estimates from empirical equations (pedotransfer functions) (e.g., Schwartz and Zhang [13]). However, these functions are often restricted to a limited number of soil parameters, making them inadequate for many contaminated soils.
Although some simultaneous measurements of leaching and hydraulic conductivity are described in the literature [15,16], combined tests are rare in environmental assessment programs.
The primary aim of this study was to evaluate if a combined column test (CCT) with simultaneous measurement of hydraulic conductivity and contaminant leaching can improve the methods used for characterization of contaminated soils that are applied today. Our study also investigated leaching from contaminated soils as a function of change in hydrogeological properties due to compaction. A laboratory CCT was conducted on two contaminated soils. The results were compared with one-stage batch test (BT) data and empirical estimates of hydraulic conductivity using Hazen’s equation. In addition, leaching and spreading from one of the soils were investigated at high and low compaction in the CCT to explore the effect of soil compaction as a low-cost physical treatment to reduce leaching and transport of contaminants.
2. Materials and Methods
2.1. Soil Analysis
Two soils were investigated in this study. One soil was sampled from a bullet trap at an abandoned shooting range facility at Steinsjøen, Innlandet County, Norway. The shooting range was in operation from 1984 until 2000. The other soil was sampled from an urban filling in the Oslo region, Norway. The soils were sieved (<2 mm), homogenized and divided into representative subsamples. Loss on ignition (LOI) was determined by combustion at 550 ± 25 °C for three hours. Total inorganic content (TIC) and total organic content (TOC) were measured by coulometry (ISO 10694, EN 13137, EN 15936) by the accredited laboratory ALS. Limits of quantification (LOQ) are available in Table S1. Particle size distribution analyses were performed using the pipette method [17] (the data and sieving curves are available in Table S2 and Figure S1, respectively). The uniformity coefficient (Cu) (Table 3) was calculated as the ratio between d60 and d10, which corresponds to the point where 60% and 10% of the particles, respectively, are finer by weight.
The target contaminants, lead (Pb), copper (Cu), and antimony (Sb) for the shooting range soil, and Pb, Cu, and zinc (Zn) for the urban soil, were identified and quantified using an inductively coupled plasma mass spectrometry (ICP-MS, Agilent 8900 QQQ) after digestion with nitric acid (HNO3) for Pb, Cu, and Zn (metals), and a mix of HNO3 and hydrofluoric acid (HF) (ratio 5:1) for Sb (metalloid). Analyses of certified reference materials [18,19] were carried out for quality control purposes. The recoveries were 88%, 94%, 75%, and 91% for Cu, Zn, Pb, and Sb, respectively. LOQs are available in Table S3. All soil analyses were performed in triplicate. Soil chemical and physical properties are summarized in Table 3.
2.2. The Combined Column
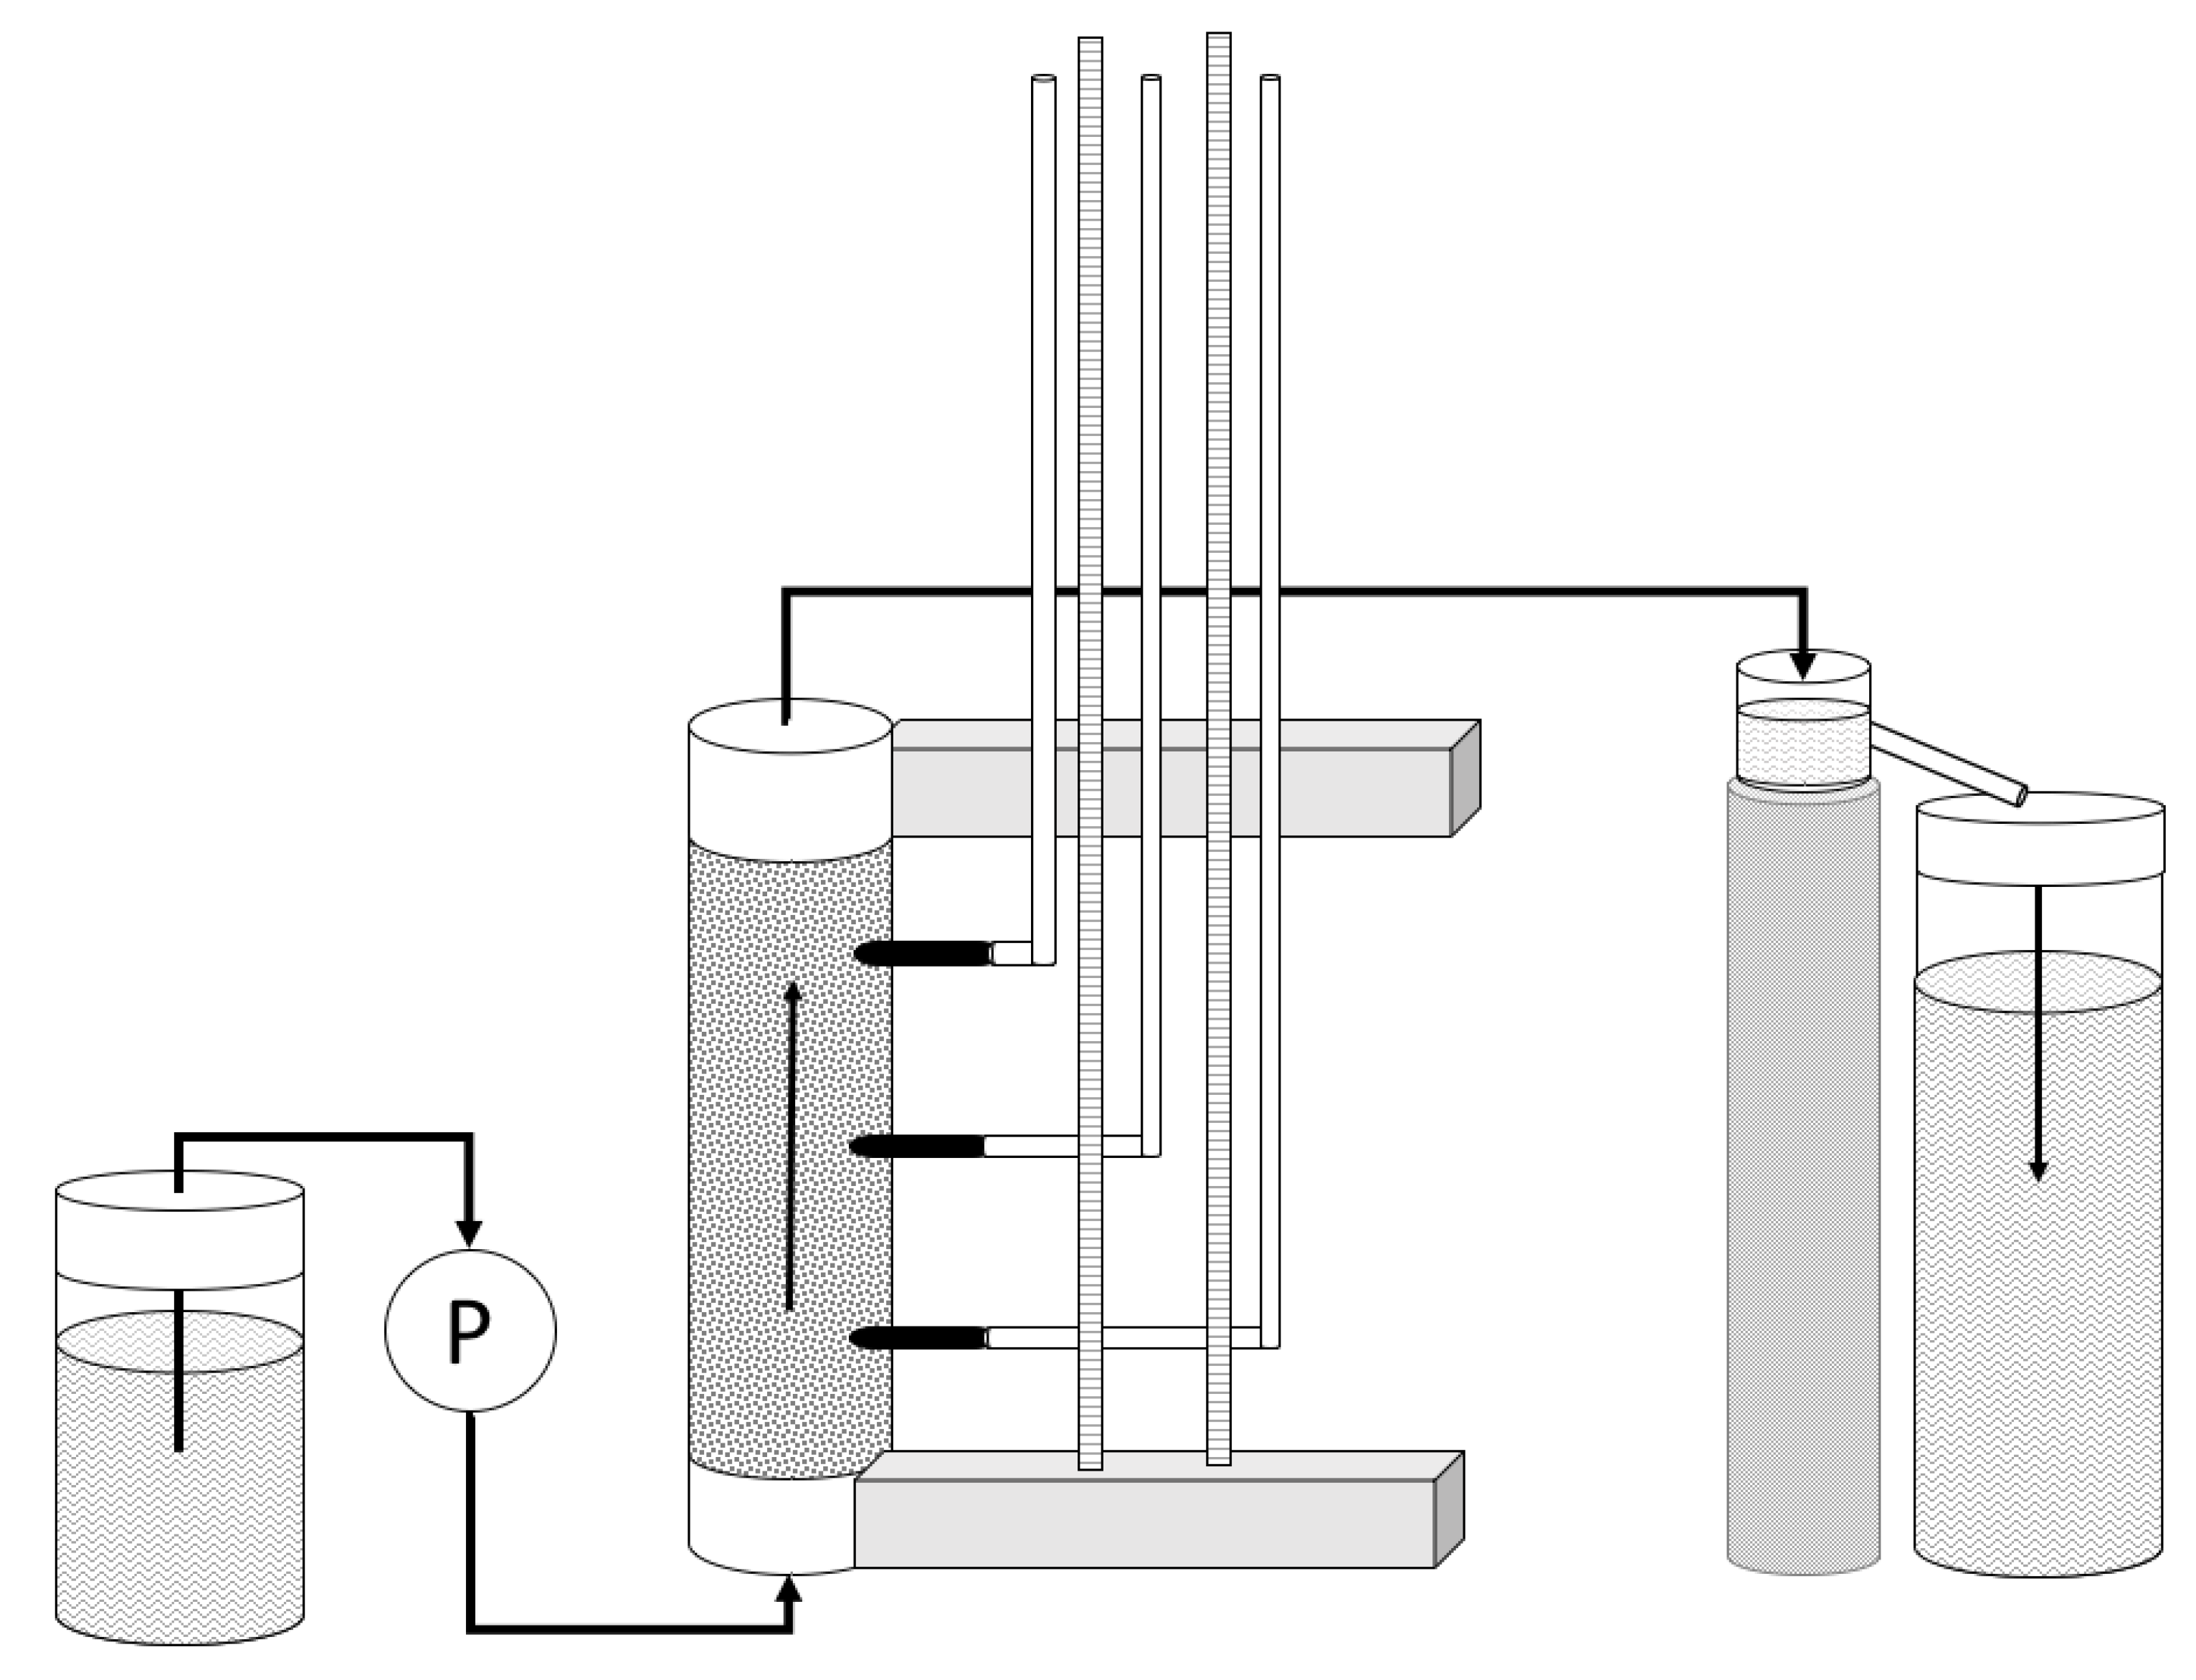
The combined columns were modified from the up-flow percolation column test according to European standards [9] using polymethylmethacrylate (PMMA, plexiglas) columns (length = 450 mm, inner diameter (ID) = 50 mm). Three 6 mm ID PMMA standpipes were installed with 7.5 cm intervals to monitor head values in the column (Figure 2). Plastic filters prevented migration of soil particles from the column into the standpipes. The top and bottom sections (Teflon) were equipped with grid filters (plastic) for securing water flow and 0.45 µm membrane filters (47 mm diameter, Supor-450, Pall Corporation) for particle retention. Both the top and bottom sections were sealed with O-rings. Deionized water (Direct-Q, Millipore) was pumped into the columns by a peristaltic pump connected to the bottom section. The eluent container was capped with parafilm to prevent evaporation and contamination. Tubes were connected between the top section and a constant outlet where the eluate was retained before entering the eluate container.
The experimental program is summarized in Table 4. Leaching tests were performed on dry soil after soil homogenization and sieving (<4 mm). Two compaction modes were considered for the shooting range soil. The soil columns were packed in a specific number of consecutive layers (Table 4) to a height of ~30 cm. A steel weight (125 g) was dropped from a height of 23.5 cm along a rod. Hereon, the term “low density” refers to the soil columns where the steel weight was dropped one single time at each layer, while the term “high density” refers to the soil columns where the steel weight was dropped three times at each layer, this to investigate an effect of compaction. After the final layer was packed, the top section was fitted closely to the soil sample to avoid free water space. Column volume and weights are listed in Table S4. All tests were performed in triplicate.
The columns were saturated with deionized (DI) water 3 days prior to test start to equilibrate the system. A clamp prevented water from escaping the column. After the equilibrium period, the peristatic pumps were started, and DI water was pumped into the columns. Optimal flow range was 10.6–13.9 mL/h, according to CENT/TS 14405 [9]. Eluates were collected at liquid to solid ratios (L/S) 0.1, 2, and 6. L/S 10 was also collected for the high-density shooting range soil. L/S ratios 2, 6, and 10 were collected as accumulated volumes. The experiment was conducted at room temperature (~20 °C). Pore volumes corresponding to each L/S ratio for the respective soils are available in Table S4.
2.3. One-Stage Batch Test
One-stage batch tests were performed in accordance with EN 12457-2 [10] using soil <4 mm in triplicate. Soil and DI water were mixed to L/S 10 and placed in an end-over-end shaker at 10 rpm for 24 ± 0.5 h at room temperature. The samples were left overnight to settle, then filtered through a 0.45 µm PES filter.
2.4. Eluate Analysis
pH and EC were measured in the eluates immediately after sampling using a pH meter (WTW Inolab pH level 2) and an EC meter (WTW LF 538, electrode: TetraCon 325). Eluates for metal analysis were conserved with ultrapure HNO3 in 15 mL polypropylene tubes in a 9:1 ratio prior to analysis by ICP-MS (8900 Agilent QQQ). The DOC concentration was measured using Shimadzu TOC-V CPN Total organic carbon analyzer. IC 5000 Ion Chromatograph, Lachat (Zellweger analytics) was used to determine the concentrations of sulfate (SO42−), nitrate (NO3−–N), and chloride (Cl−). Blanks were collected regularly and analyzed together with the eluates. Analysis of a standard reference material was carried out for quality control. LOQs are listed in Table S5, and raw data are available in Tables S6 and S7.
2.5. Data Treatment
Blank corrections of the eluate concentrations were performed, and negative values caused by the blank correction were set to zero. Data were tested for normality by drawing density plots in the statistical software, R (v. 3.3.3, 2016). Linear regression was performed based on Spearman’s rank order correlation by using Microsoft Excel with the Analysis ToolPak extension (v. 16.16.3, 2018). Samples were compared using t-tests (normality assumed) in Microsoft Excel. Results with p < 0.05 were considered statistically significant.
Geochemical modeling was conducted using Visual MINTEQ version 3.0 [20] to predict trace element speciation. For complexation with DOC, the NICA-Donnan model was specified.
Leaching of trace elements from the soil relative to the total soil dry weight (mg/kgdw) was calculated as
where C corresponds to the concentration in the eluate (mg/L), L/S is the liquid-to-solid ratio (L/kg), and MC is the soil moisture content (% dry mass) [9].
2.6. Hydraulic Conductivity
Hydraulic conductivity (K) in the combined columns was calculated using Darcy’s law:
where Q is the volume of collected eluate at time, t (mL), L is the distance between the standpipes, A is the column cross-sectional area (cm2), Δh is the difference in head value between the upper and lower standpipes, and Δt is the time elapsed (hours). Raw data are provided in Table S8.
The Hazen hydraulic conductivity in m/s was calculated as:
where CH is an empirical constant set to 0.01157 and d10 was derived from the particle size distribution, 0.70 + 0.03 T is a temperature correction factor where the temperature, T, was set to 20 °C [21].
3. Results and Discussion
3.1. Hydraulic Conductivity: Column Measurements vs. Pedotransfer Functions
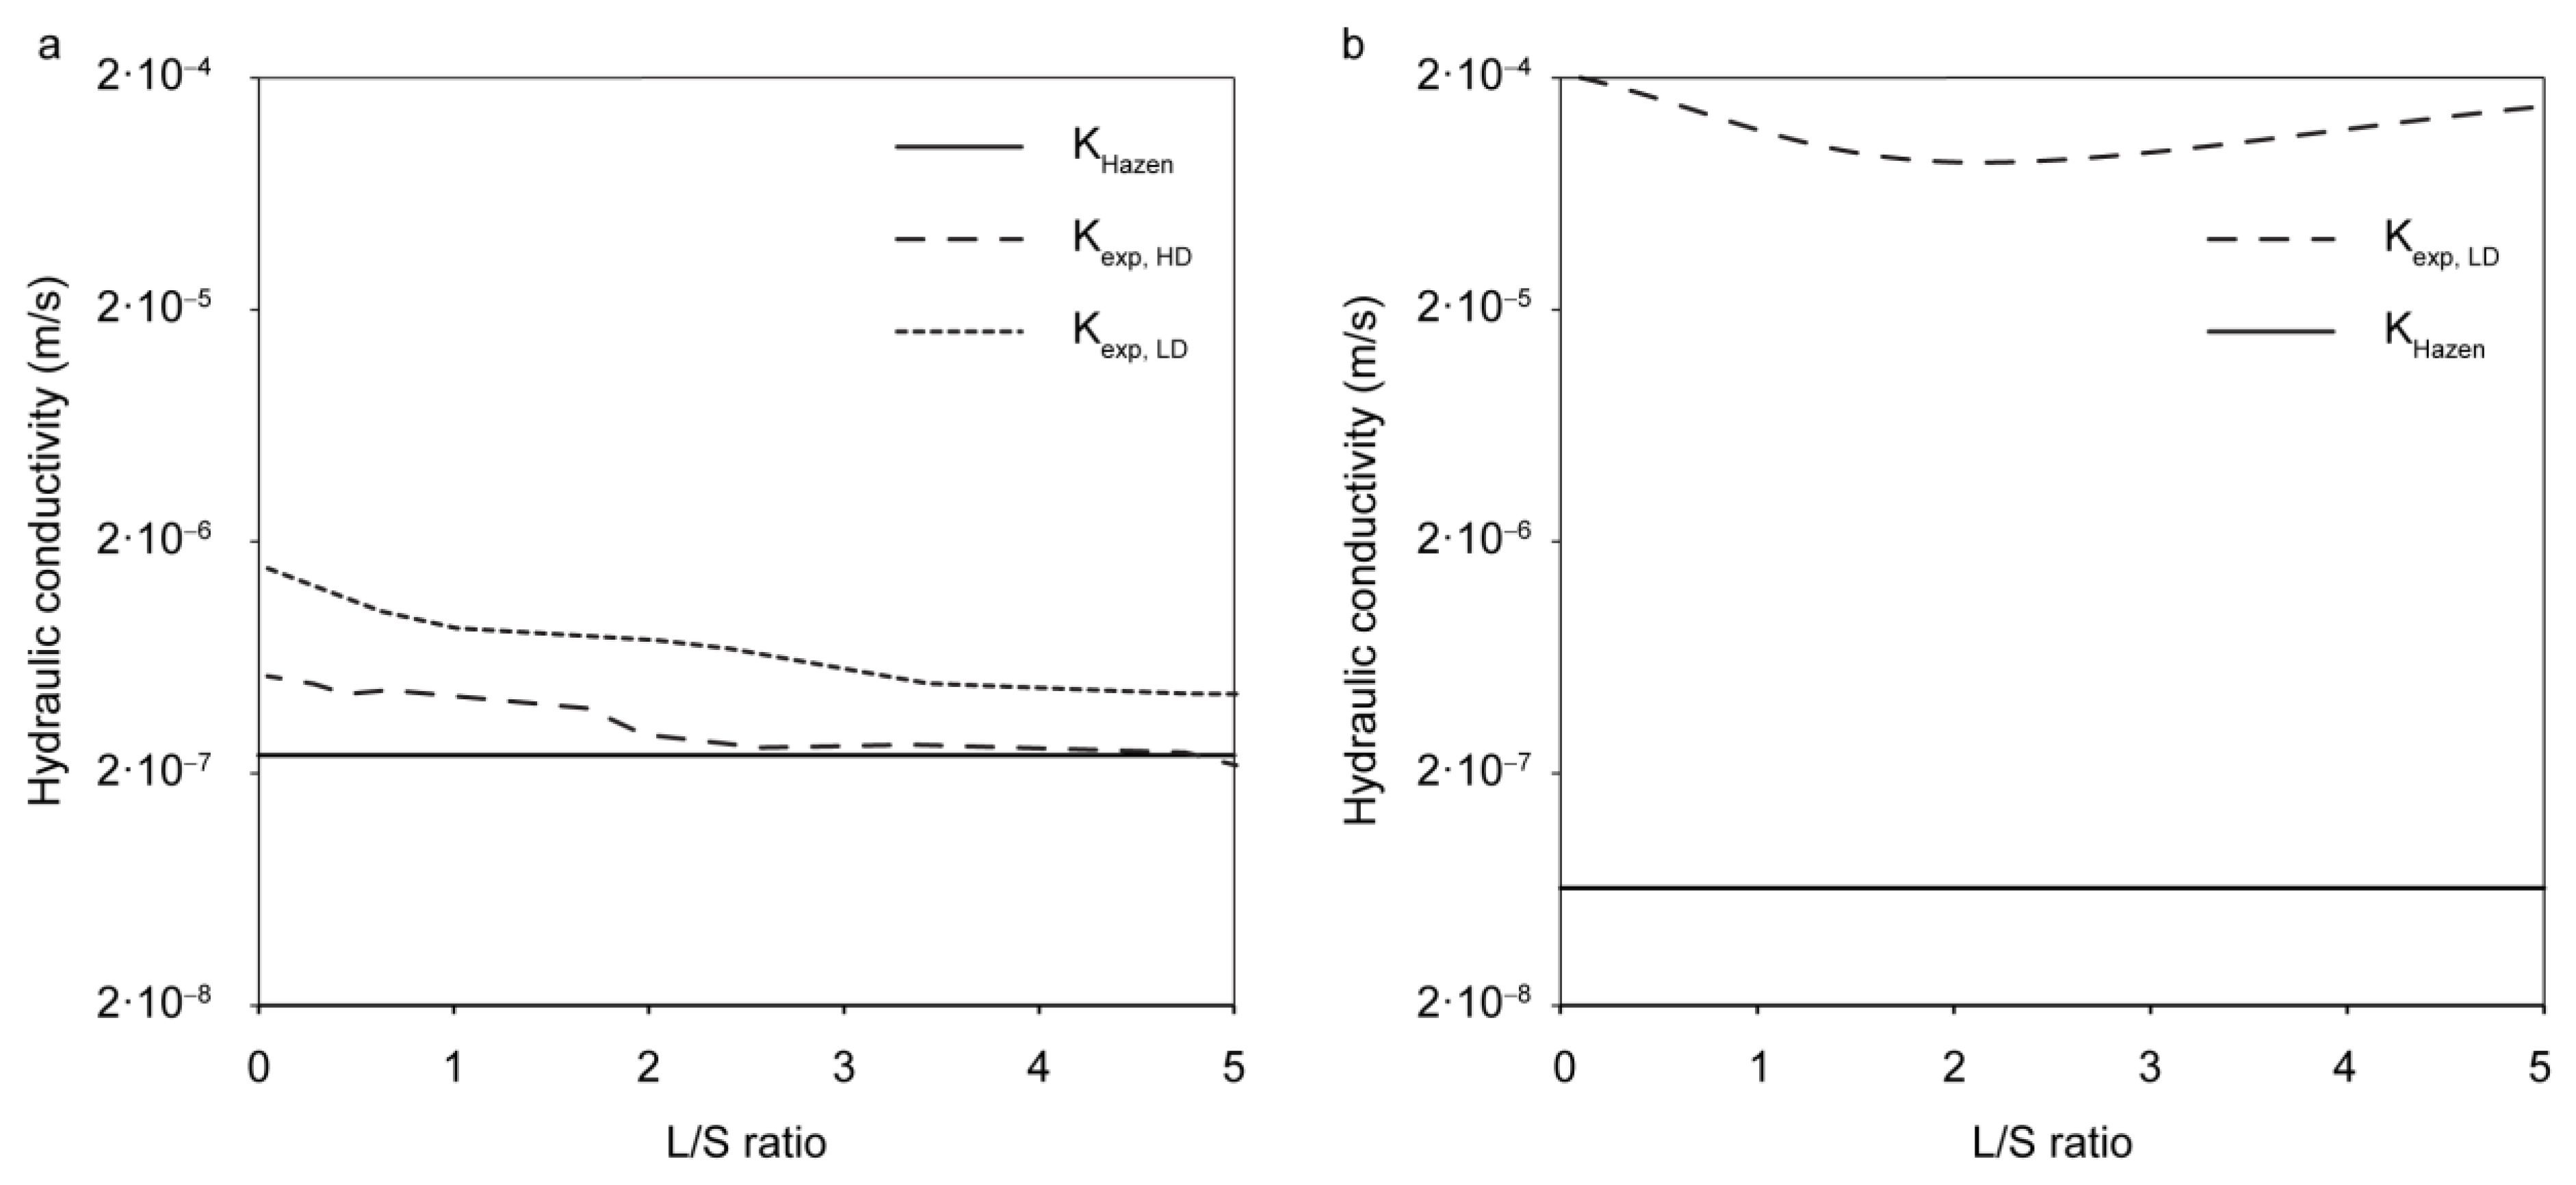
Figure 3 shows the measured hydraulic conductivity (Kexp) and predicted hydraulic conductivity (KHazen) (Hazen’s equation) as a function of L/S for the shooting range soil (a) and urban soil (b). Kexp for the low-density (LD) shooting range soil ranged from 1.5 × 10⁻⁶ to 4.4 × 10⁻⁷ m/s, slightly higher than Kexp for the high-density (HD) shooting range soil of 5.3 × 10⁻⁷ to 1.9 × 10⁻⁷ m/s. Kexp for the LD and HD shooting range soils show an overall decreasing trend. Some particle migration in the columns was detected by the accumulation of fine particles in the outlet during the initial phase of column operation. This is consistent with previous column studies that have shown that a decrease in hydraulic conductivity can arise from pore clogging following rearrangement, mobilization, and entrapment of finer particles [15]. Furthermore, a gradual compaction of the material could also arise from the water pressure in the columns. Pore blockage could also have contributed to the decline in Kexp due to the observation of air bubbles in the column that were expected to originate from the joint between the peristaltic pump and the tubes. In contrast, Kexp for the urban soil remained relatively stable over the experimental period and in the range 2.0 × 10⁻⁴ to 1.5 × 10⁻⁴ m/s.
KHazen (Equation (3)) for the shooting range soil and urban soil were 2.4 × 10⁻⁷ m/s and 6.1 × 10⁻⁸ m/s, respectively. None of the soils met the assumptions for the Hazen equation with respect to d10 and Cu (Table 3). The Hazen’s equation is derived for sorted, sandy and uniform materials that satisfies Cu < 5 and d10 between 0.1–3.0 mm [22] and ignores material compaction, as it is only valid when the soil is lightly packed, i.e., low-density [23]. Unexpectedly, the high-density shooting range soil had the best agreement between KHazen and Kexp.
3.2. Contaminant Mobility in Soil
3.2.1. Long-Term Leaching in the Combined Column Test
Shooting Range Soil
The total concentrations of Pb, Cu, and Sb (Table 3) were in accordance with previously reported concentrations for the same shooting range soil [24,25], and reflected the chemical composition of the most common ammunition [26].
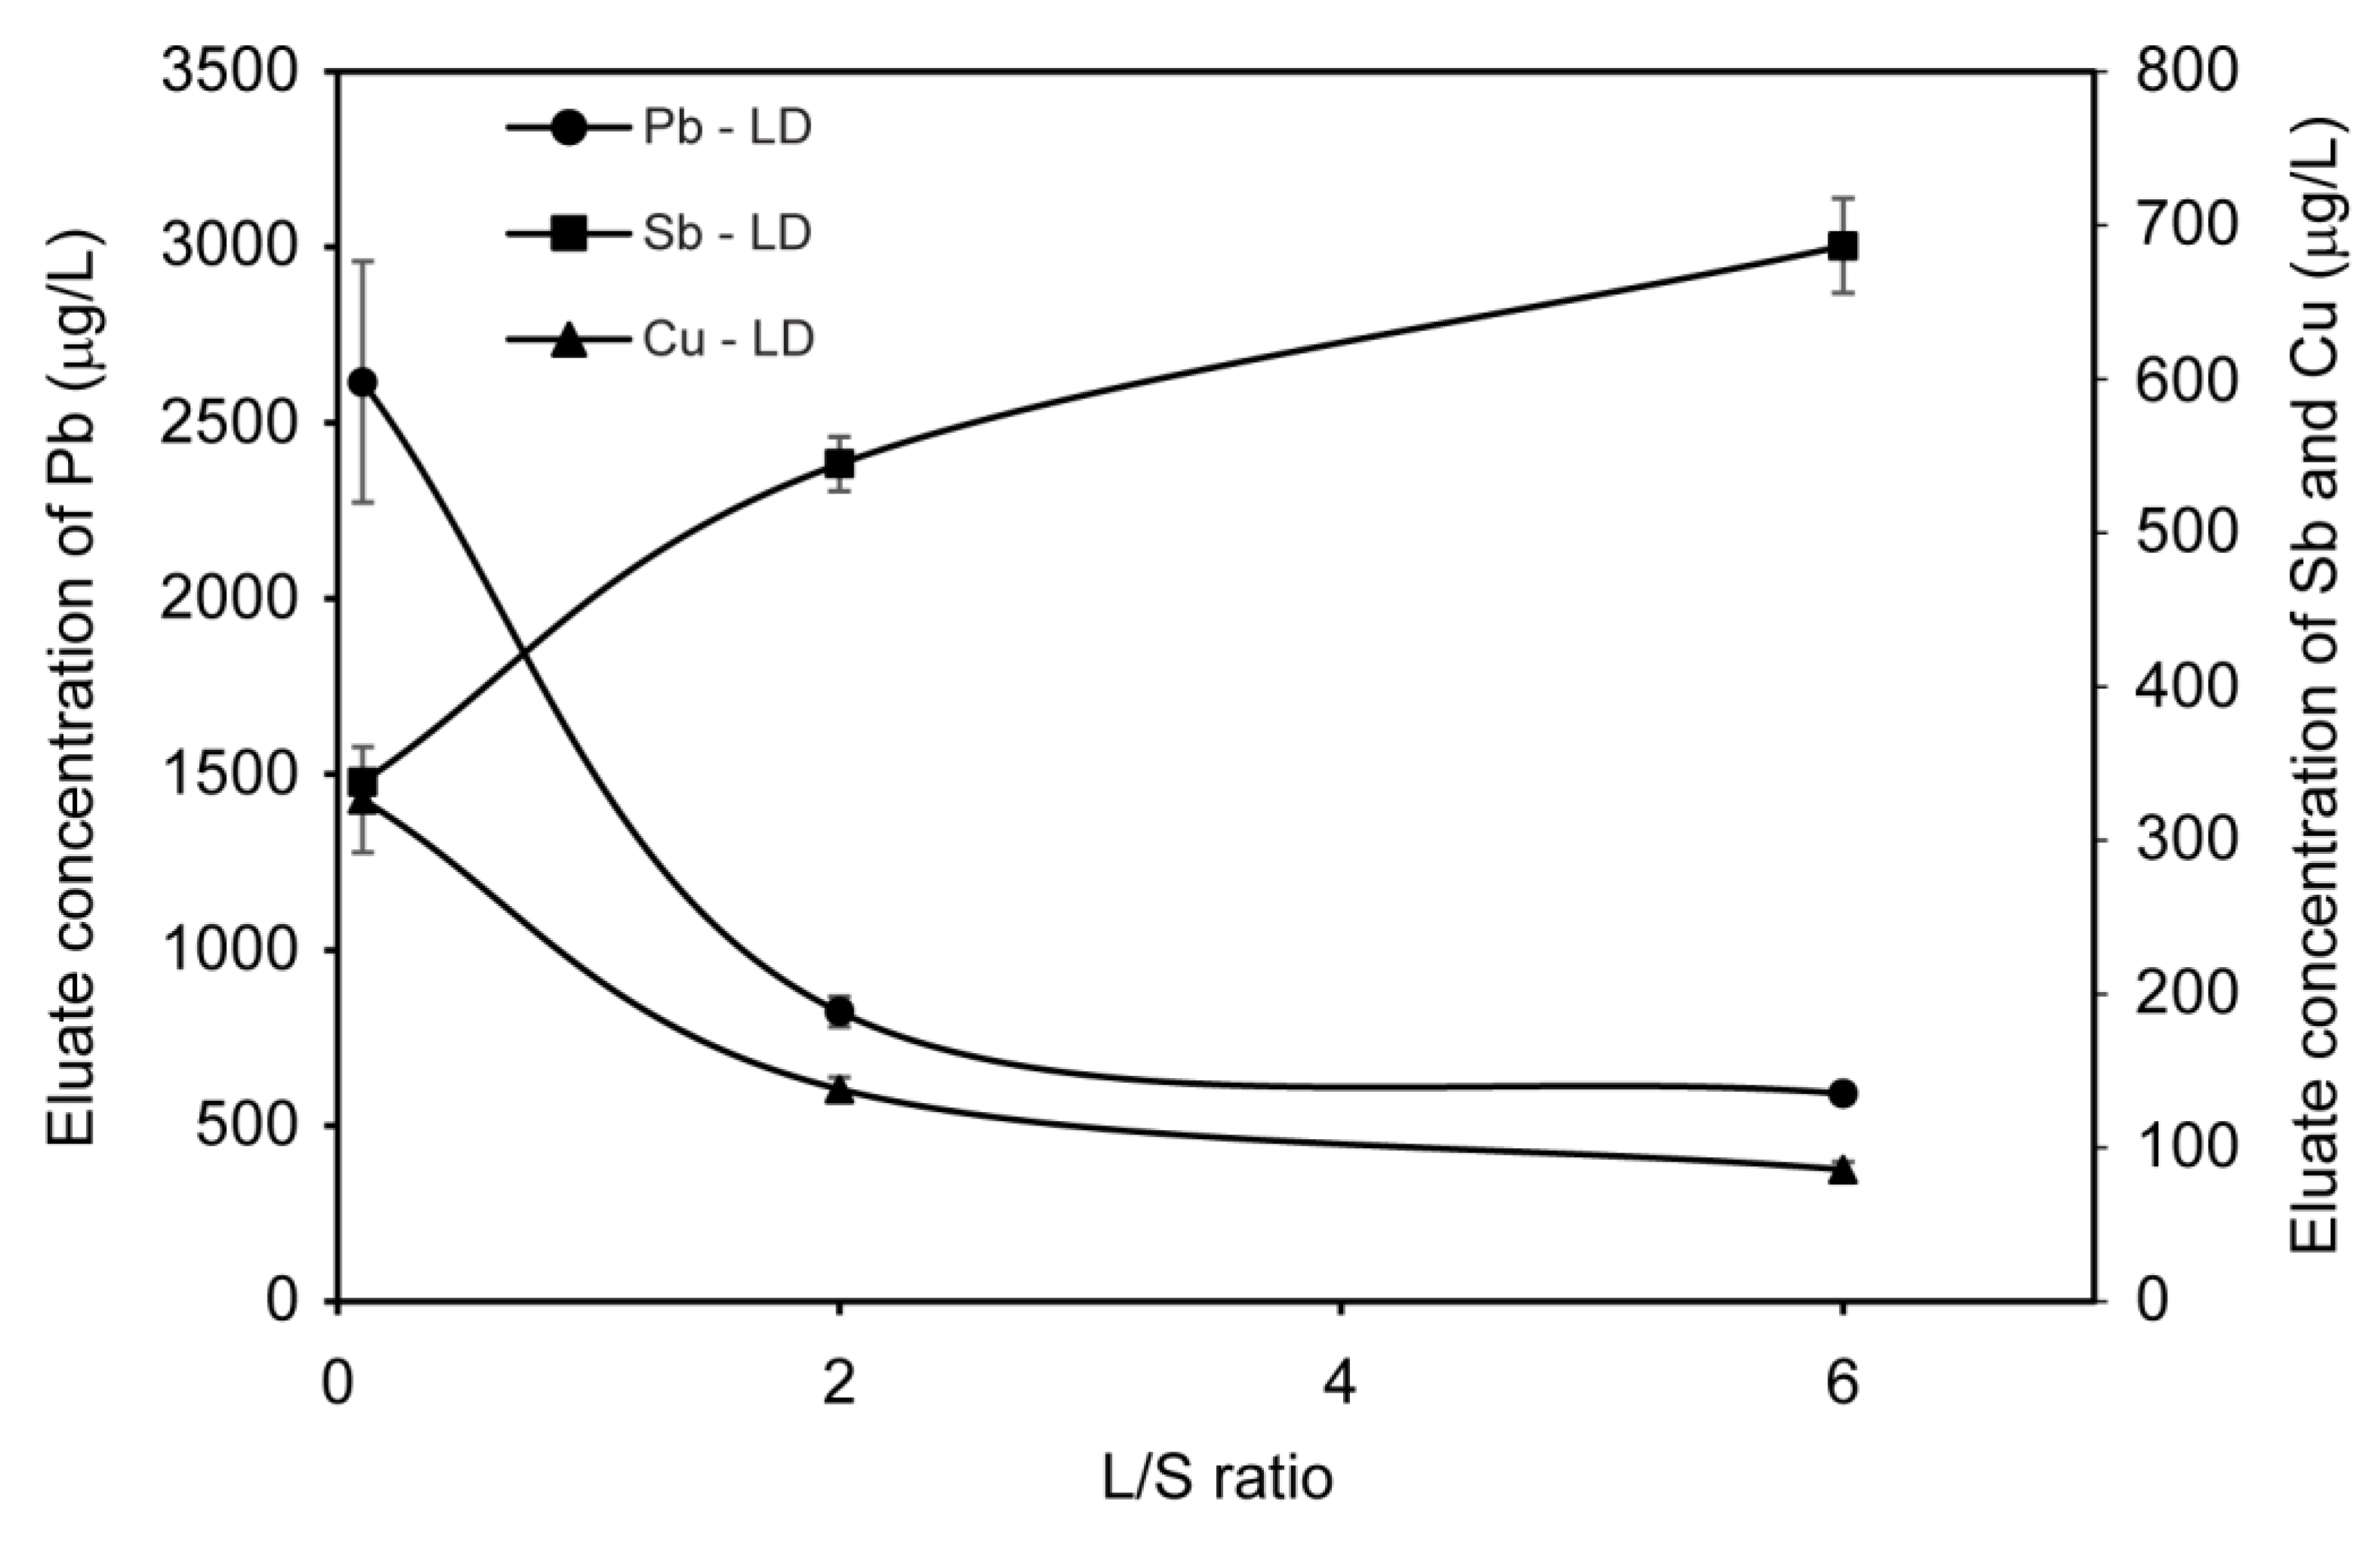
Leaching curves for Pb and Cu showed a similar trend for the low-density soil columns (Figure 4). The highest concentrations were detected in the first flush (2616 ± 343 μg Pb/L and 326 ± 34 μg Cu/L, respectively), followed by a rapid drop where concentrations stabilized at higher L/S ratios. The pH values (pH 6.6 ± 0.0 to 6.2 ± 0.0) were stable throughout the experiment and were not expected to significantly affect leaching. The cumulative release of Pb and Cu at L/S ratio 6 accounted for 0.2% and 0.5% of the total concentrations, respectively (Table S9).
There were strong correlations between DOC and the two metals Pb and Cu (R2 = 0.76, p < 0.05 for Pb, R2 = 0.88, p < 0.05 for Cu), suggesting a dominance of DOC-facilitated transport. A similar mechanism was proposed by geochemical modeling which indicated that >90% of Pb and Cu were complexed to DOC. These observations are in accordance with several other studies that have demonstrated that total metal concentrations in soil and mobility of metals are highly dependent on DOC concentration [27,28,29]. Greater release of Cu compared to Pb can be attributed to several factors related to the nature of present complexes. Particular and colloidal high molecular mass species are the dominant Pb-organic carbon (OC) complexes found in shooting range runoff streams, while Cu primarily complexes to colloids and low molecular mass species [30]. Saar and Weber [31] found that Pb-DOC complexes precipitate at a lower metal-DOC ratio compared to Cu-DOC complexes. Additionally, Pb has a greater affinity to particulate organic carbon compared to Cu [32], which in total leads to higher retention of Pb than Cu.
Antimony had the lowest eluate concentrations at L/S 0.1 (338 ± 8 μg/L) before a steady increase with increasing L/S (687 ± 31 μg/L at L/S 6) (Figure 4). The cumulative release of Sb at L/S 6 accounted for 1.7% of the total concentration (Table S9). A leaching test performed by Okkenhaug et al. [24] on the same shooting range soil as in the present study found that after an initial Sb concentration of ~380 μg/L, stabilization at ~290 μg/L took place throughout the rest of the experiment. The contradictory results may be attributed to slightly lower pH values (~5.2–6.0) compared to the present study. The presence of more positively charged surfaces associated with lower pH values results in reduced mobilization of anions such as Sb [33,34].
Geochemical modeling indicated that Sb(V) in the form Sb(OH)6− was the dominant Sb species in the eluates (>99%). This is in accordance with previous studies on shooting range soils [25,35]. Scheinost et al. [36] performed an extended X-ray adsorption fine structure (EXAFS) study on samples from Swiss shooting range soils, and found that Sb(V) and Sb(0) were the only Sb species present. The researchers suggested that Sb(V) was sorbed to iron oxides, while Sb(0) was present in the unweathered bullets [36]. Thus, in contrast to Pb and Cu, Sb is not expected to associate with DOC. Overall, the release of Sb in the shooting range soil is expected to be a result of Sb weathering of, and desorption from, residual bullet fragments (<4 mm). In addition, the soil anion sorption capacity is expected to be low under the current pH.
Urban Soil
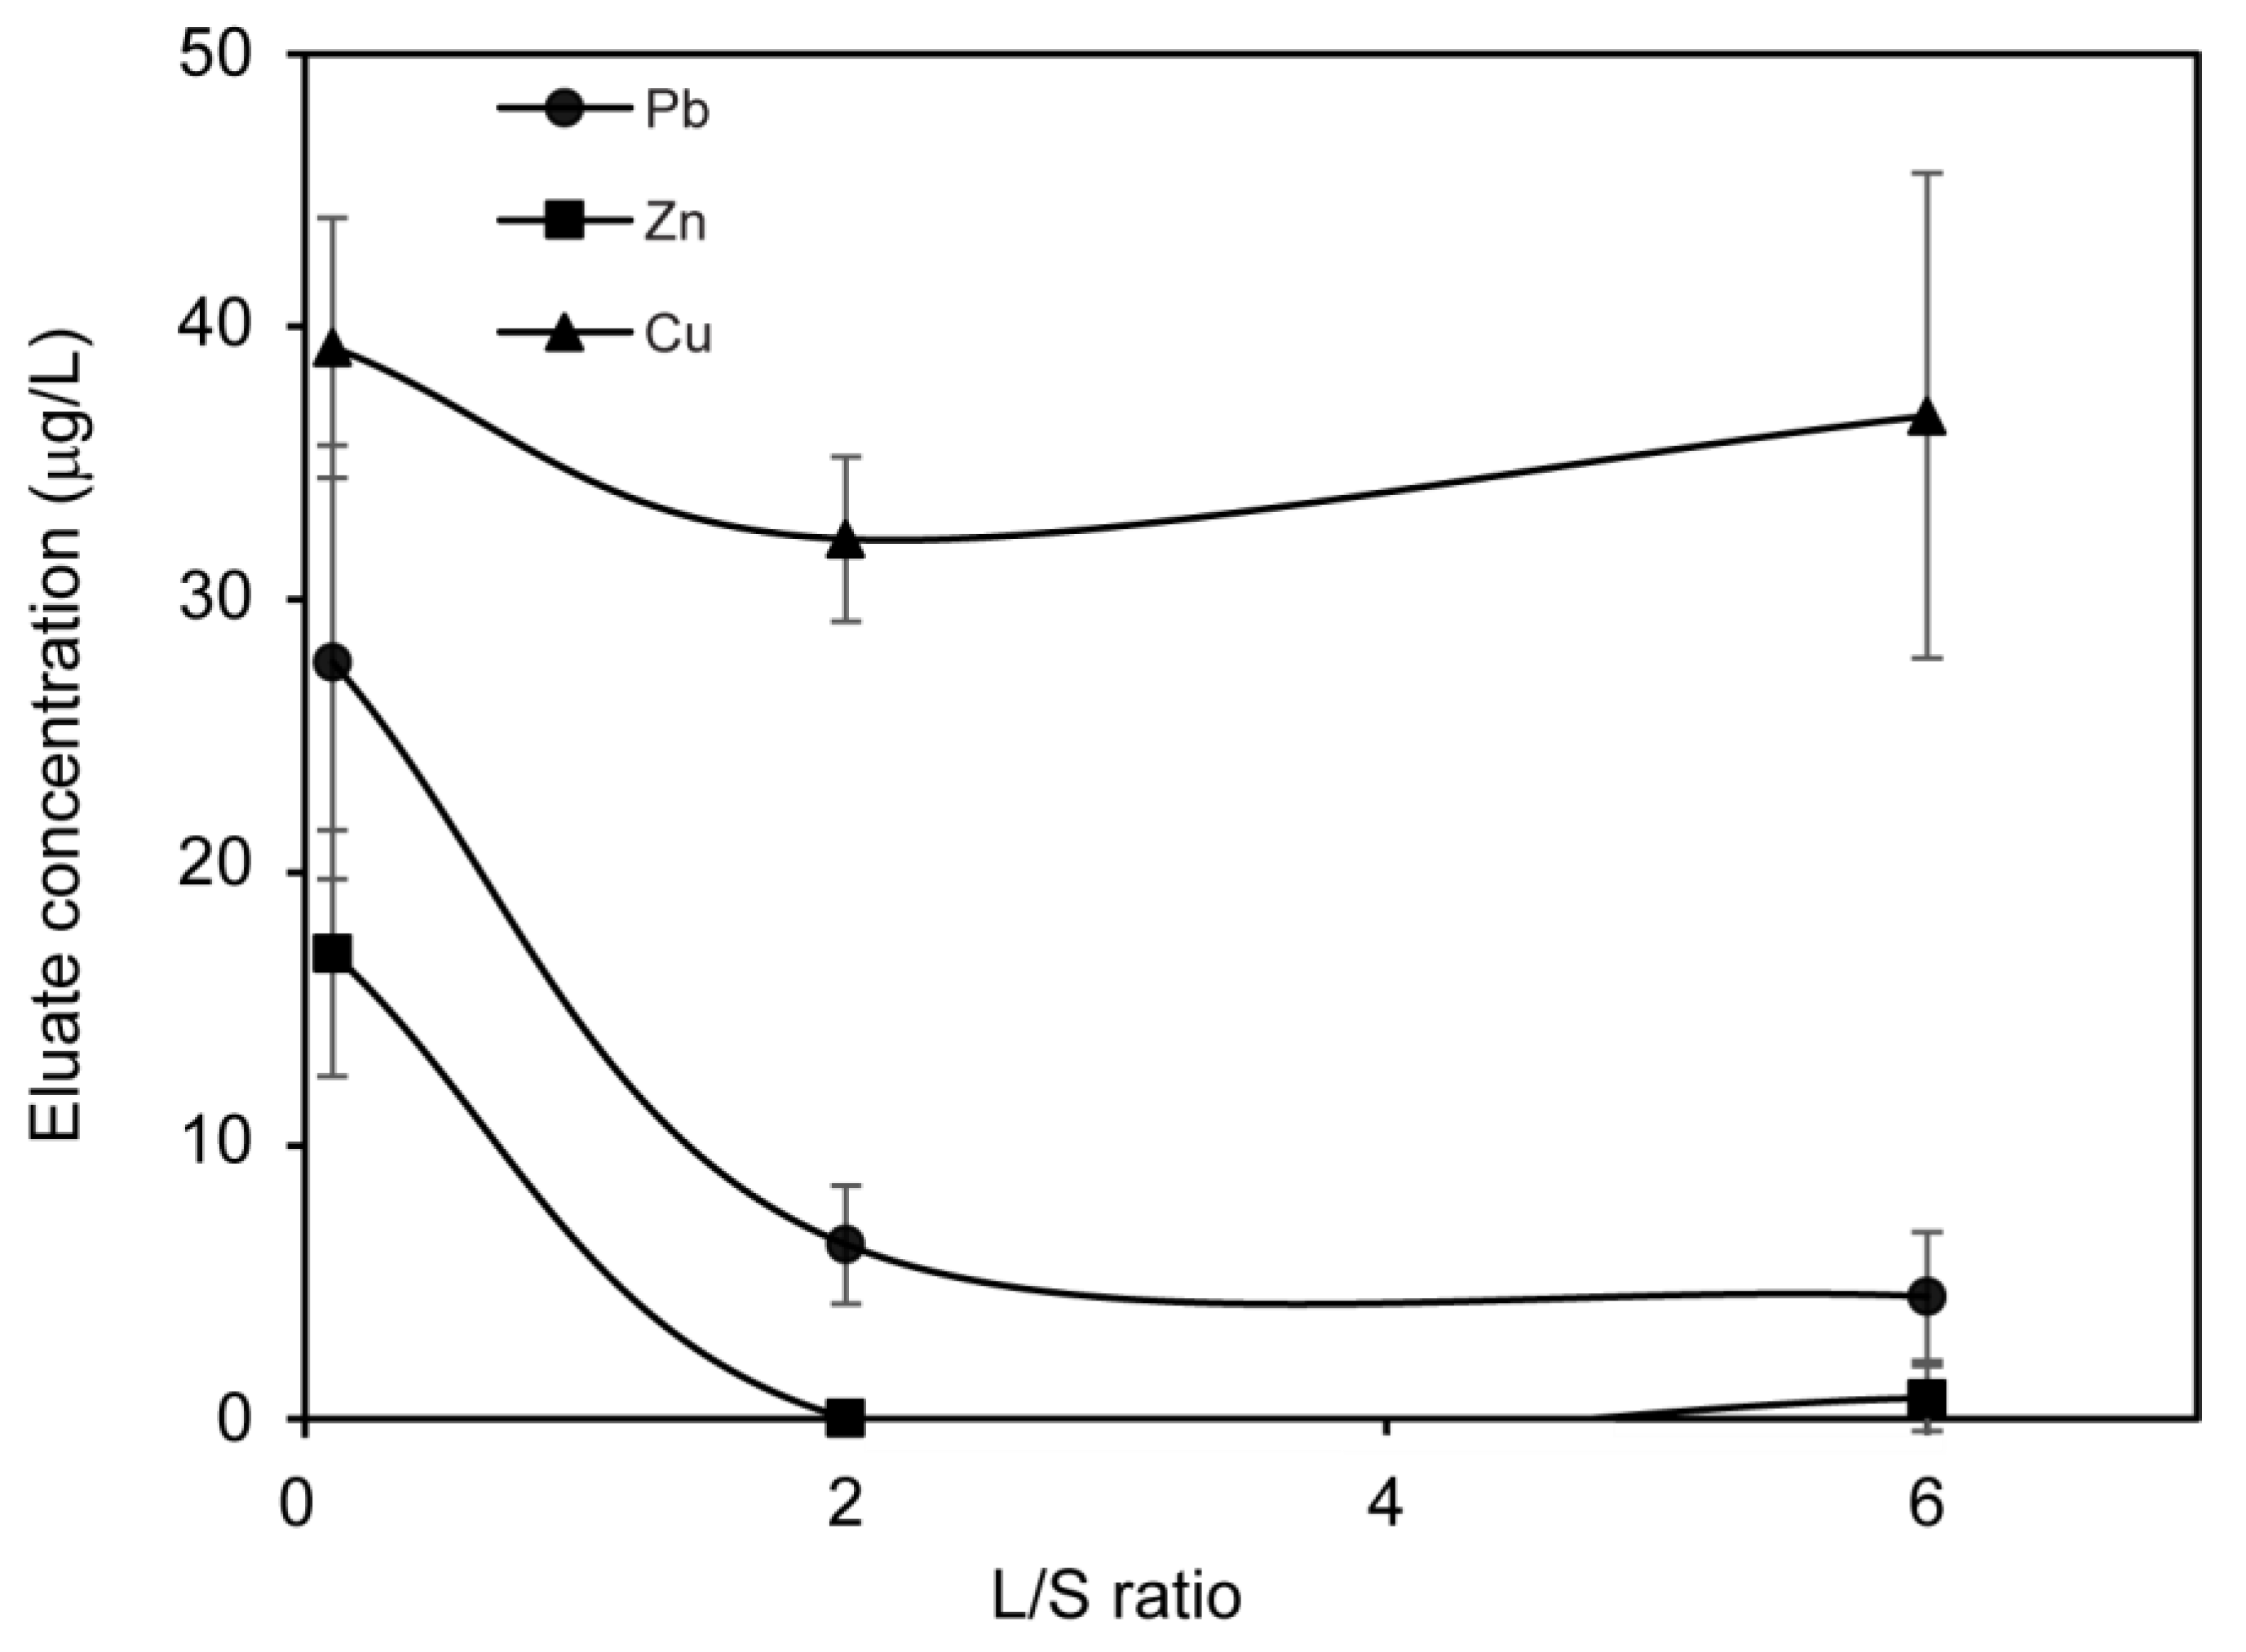
Total concentrations of lead (Pb) in the urban soil corresponds with previously reported average concentrations from contaminated sites in Oslo, Norway (660 mg/kg (this study) versus 780 mg/kg Pb, Table 3) [37]. The concentrations of copper (Cu) and zinc (Zn) were similar to average urban soils in Oslo (59 and 193 mg/kg (this study), versus 60 mg/kg and 210 mg/kg Cu and Zn, respectively, Table 3) [37]. Only 0.005%, 0.5% and 0.002% of the total concentrations of Pb, Cu, and Zn, respectively, were leached at L/S 6 (Table S9). High and stable pH values (8.4–8.5) favored sorption and retention of the metals in the urban soil.
Pb was primarily mobilized during the first flush (28 ± 8 μg/L) and was then reduced by ~80% at L/S 6 (4.5 ± 2.4 μg/L; Figure 5). Zn dropped from 17 ± 5 μg/L to 0 from L/S 0.1 to 2, and increased to 0.8 ± 1.2 μg/L at L/S 6. These patterns can indicate surface wash-off during the initial operation period (e.g., Delay et al. [38]), followed by solubility-controlled leaching (e.g., Kosson et al. [39]). The leaching of Cu remained elevated and stable throughout the experiment (39 ± 5, 32 ± 3, and 37 ± 9 μg/L at L/S 0.1, 2, and 6, respectively). This suggests that the leaching of Cu is mainly governed by solubility and minimally influenced by initial surface wash-off processes.
There was a significant correlation between Pb and DOC (R2 = 0.69, p < 0.05) and a weak correlation between Cu and DOC (R2 = 0.11, p > 0.05). In contrast, geochemical modeling indicated that >95% of Pb and >99% of Cu were complexed to DOC. Similar to the shooting range soil, leaching behavior of Pb and Cu can be attributed to differences in affinity and mobility of Pb- and Cu-complexes (e.g., Saar and Weber [31]). The geochemical model does not indicate that DOC is limited with respect to Cu availability. Thus, other factors that control leaching of Cu may explain the lack of significant correlation between Cu and DOC, but these factors were not addressed in the present study.
The correlation between DOC and Zn was weak (R2 = 0.37, p > 0.05) and largely in agreement with the geochemically modeled results. This indicates that Zn was mainly leached as ions with limited association to organic matter.
3.2.2. Combined Column Test vs. One-Stage Batch Test
Leaching of Pb and Sb from the CCTs were significantly (p < 0.05) higher than the eluate concentrations from the BTs (Table 5). Differences in metal leaching between the CCTs and BTs cannot be explained by differences in pH (6.7 vs. 6.2 for CCT and BT, respectively), as Pb and Cu retention is positively correlated with pH. The BT eluates contained significantly higher concentrations of DOC compared to the CCT eluates. These findings were consistent with observations by Van der Sloot et al. [12], who hypothesized that the high-energy agitation obtained in batch tests irreversibly mobilizes DOC and colloids. However, since mobility of metals has shown to be mainly DOC-facilitated, the significantly greater concentration of DOC does not correspond with the lower concentrations of metals in the BT eluates.
In this study, leaching of Pb, Cu, and Sb was suggested to be governed by weathering of residual bullet fragments, followed by interaction with soil constituents (e.g., DOC-metal complexation and surface adsorption on soil). The difference in method duration between CCT and BT must be considered. The CCT was conducted over several months, whereas the BTs were shaken for 24 h. Therefore, weathering of residual bullet fragments is likely to be higher for the CCT compared to BTs, leading to more extensive leaching of our target contaminants.
Even though several studies have investigated the differences between batch and column leaching tests, there is no clear consensus regarding harmonization between the two methods. Lopez Meza et al. [40] compared the release of Pb, Zn, and major cations from five different waste fractions in batch and column tests and found no significant differences between the methods. Other studies have reported greater discrepancies between batch and column test results [41,42]. However, the agreement between batch and column tests has, to the best of our knowledge, not been investigated for soils with an active source of soil contaminants, such as residual bullet fragments in shooting range soil.
3.3. Effect of Soil Compaction on Leaching
The combined column tests were packed with shooting range soil at two compaction modes (high-density (HD) and low-density (LD) soil, n = 3) to (i) investigate leaching as a function of hydrogeological properties, and (ii) investigate compaction as a low-cost physical treatment of contaminated soil. The total porosity in the HD and LD columns were 0.4 and 0.5, respectively (Table 4), and porewater velocities for the HD and LD columns were 16.5 and 27.1 cm/d, respectively (Table 4).
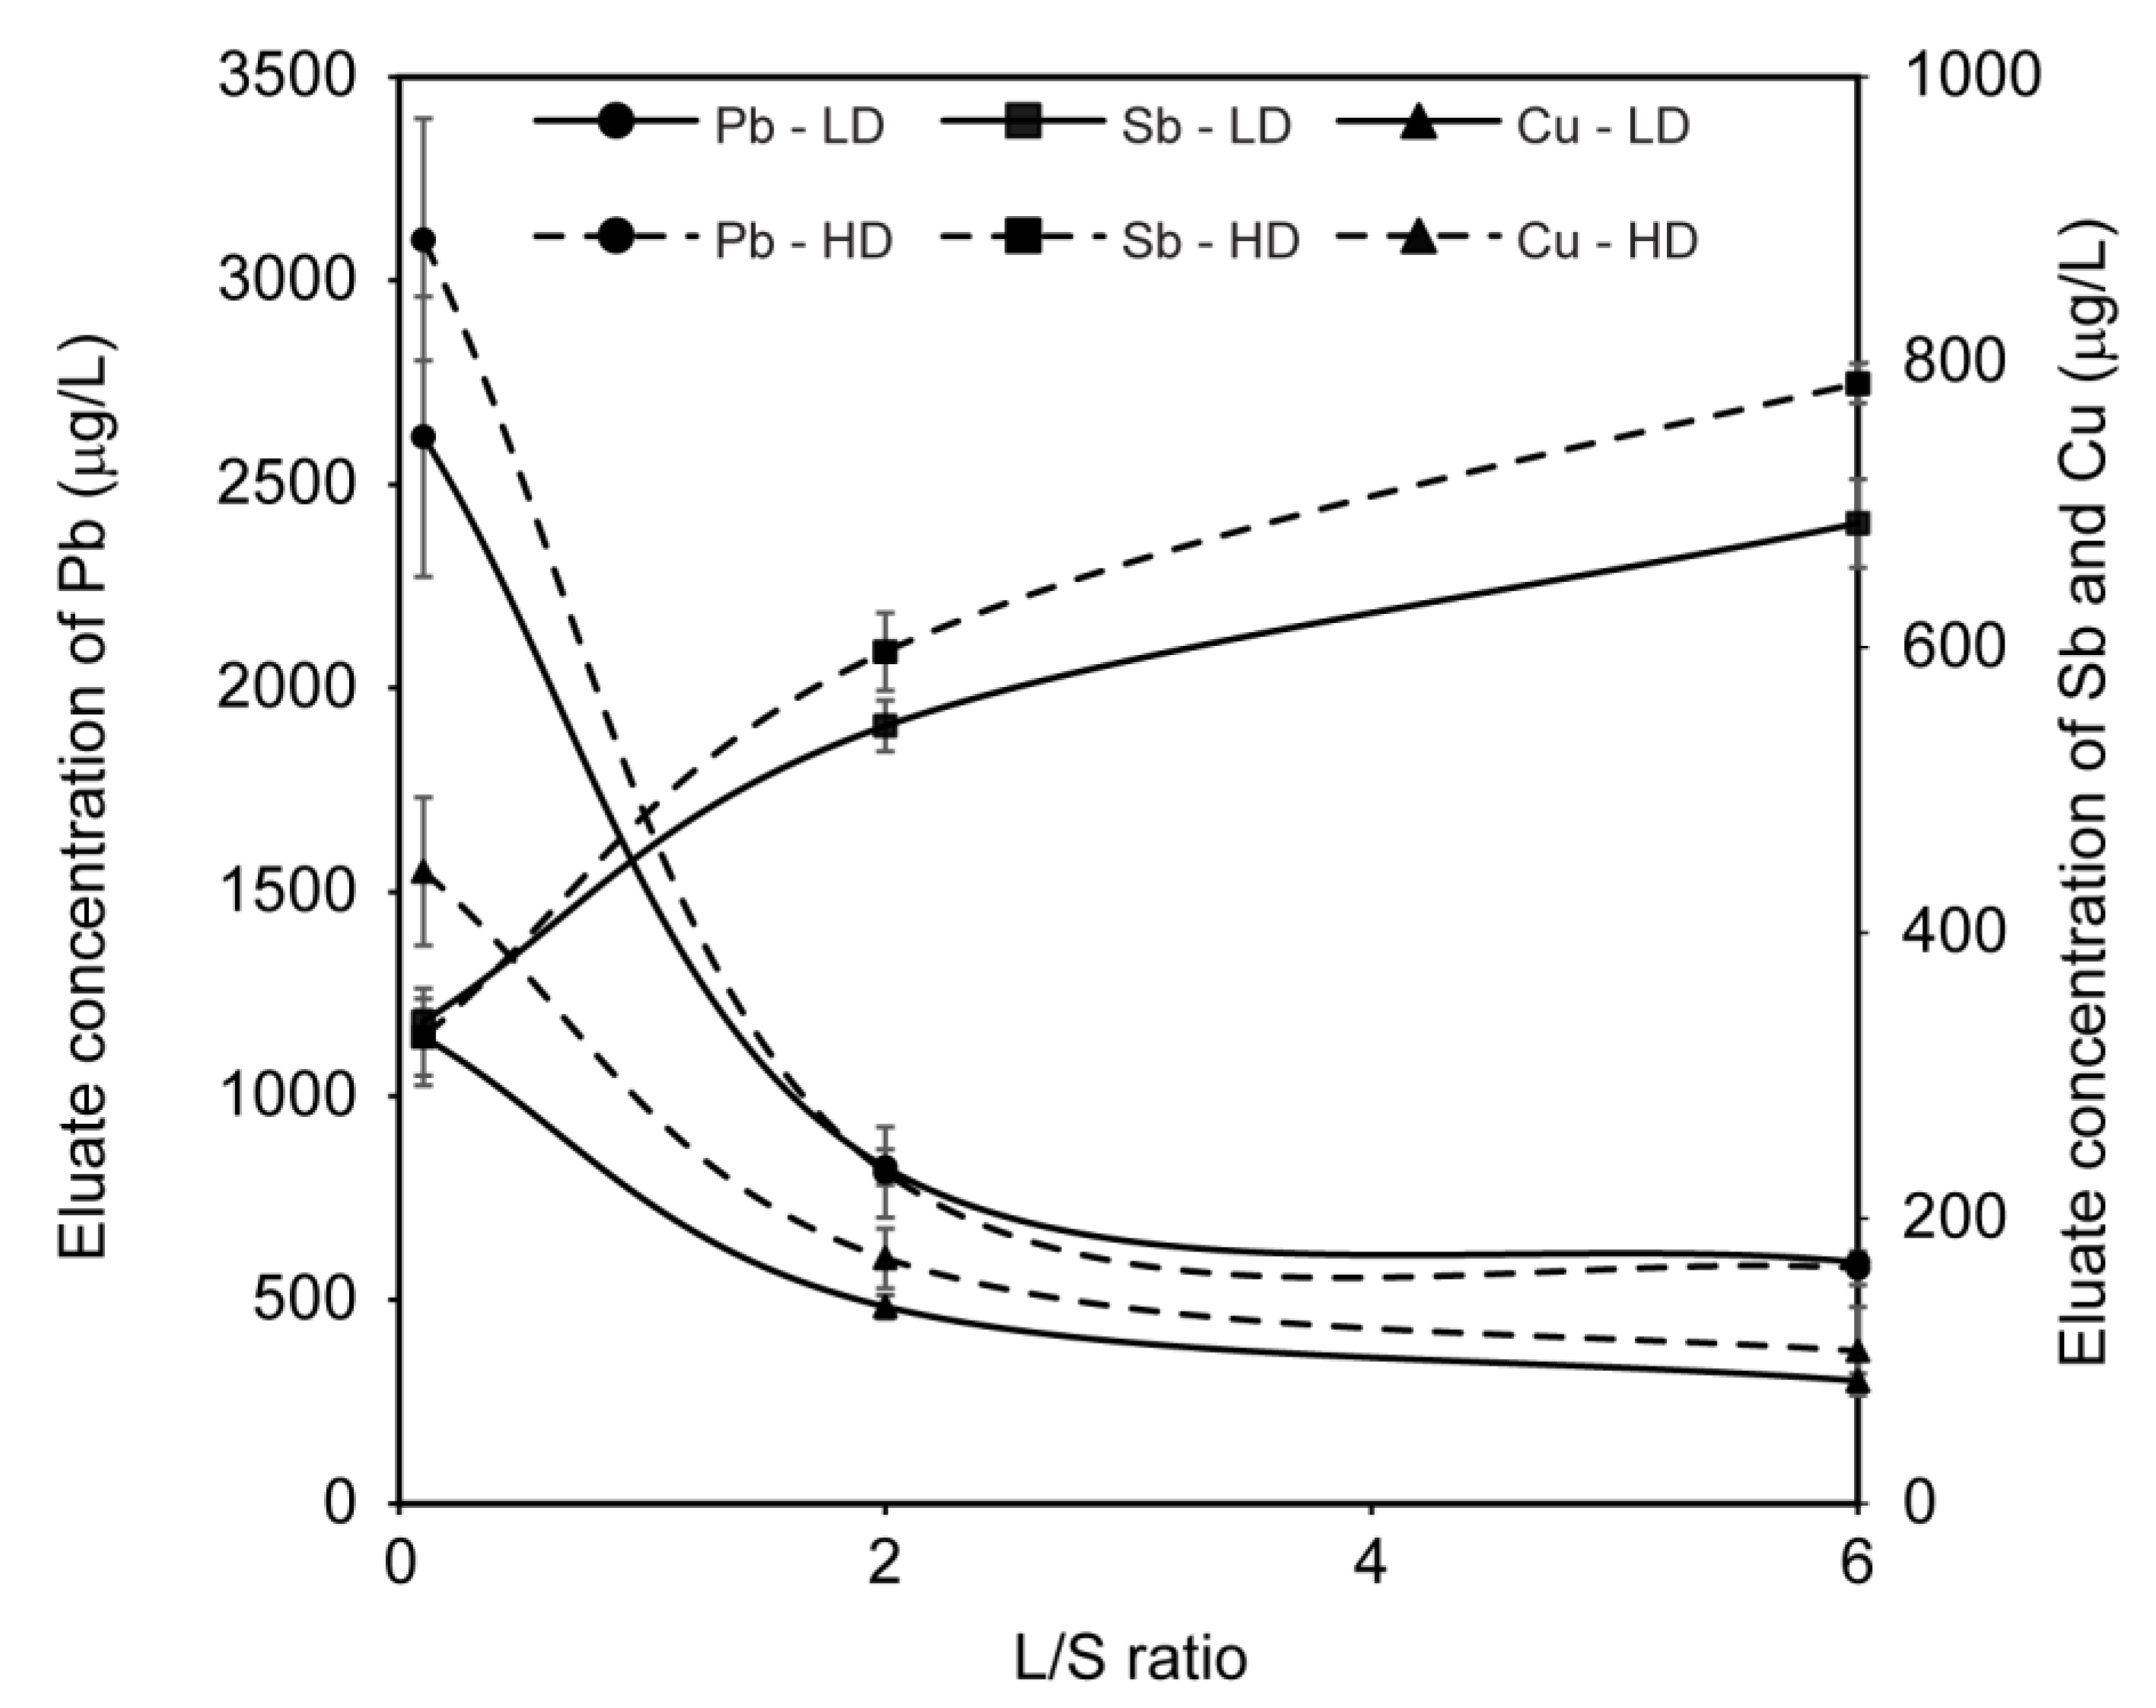
Concentrations of Pb, Cu, and Sb in the eluates from the HD and LD soils are given in Figure 6. Sb showed the greatest difference in leachate concentration, where the HD columns had significantly higher concentration of Sb than for the LD columns at L/S ratios 2 and 6 (p < 0.05). The initial concentration of Cu in the HD column was significantly higher than for the LD column (p < 0.05). The difference in Pb leaching was insignificant.
Leaching was hypothesized to be higher for the LD columns due to faster flushing of water through the soil system, facilitating higher leaching rates. However, our results showed the opposite, where leaching of Sb and Cu was significantly higher for the HD columns than for the LD columns.
pH in the LD columns (6.6 ± 0.1) was significantly higher compared to the HD columns (5.9 ± 0.1) at L/S 0.1. This is consistent with reduced leaching of Pb and Cu at higher pH, but does not account for the observed trends in Sb leaching. There were negligible differences in DOC-levels (Table S6). It can be hypothesized that as the water flows more slowly through the HD columns, the buffering capacity of the soil has more time to equilibrate with the flowing water, which yields pH values closer to the soil pH (5.2 ± 0.0, Table 3). The higher contaminant release from the HD columns can be attributed to longer operation time (Table 4), and thus, increased time for weathering of the bullet fragments. While the leaching of metals mainly was controlled by DOC, the low anion sorption capacity expected for this soil may have resulted in the higher leaching of Sb over time. Overall, our results indicate that compaction negatively affected the leaching of contaminants from the shooting range soil.
3.4. Effect of Soil Compaction on Transport
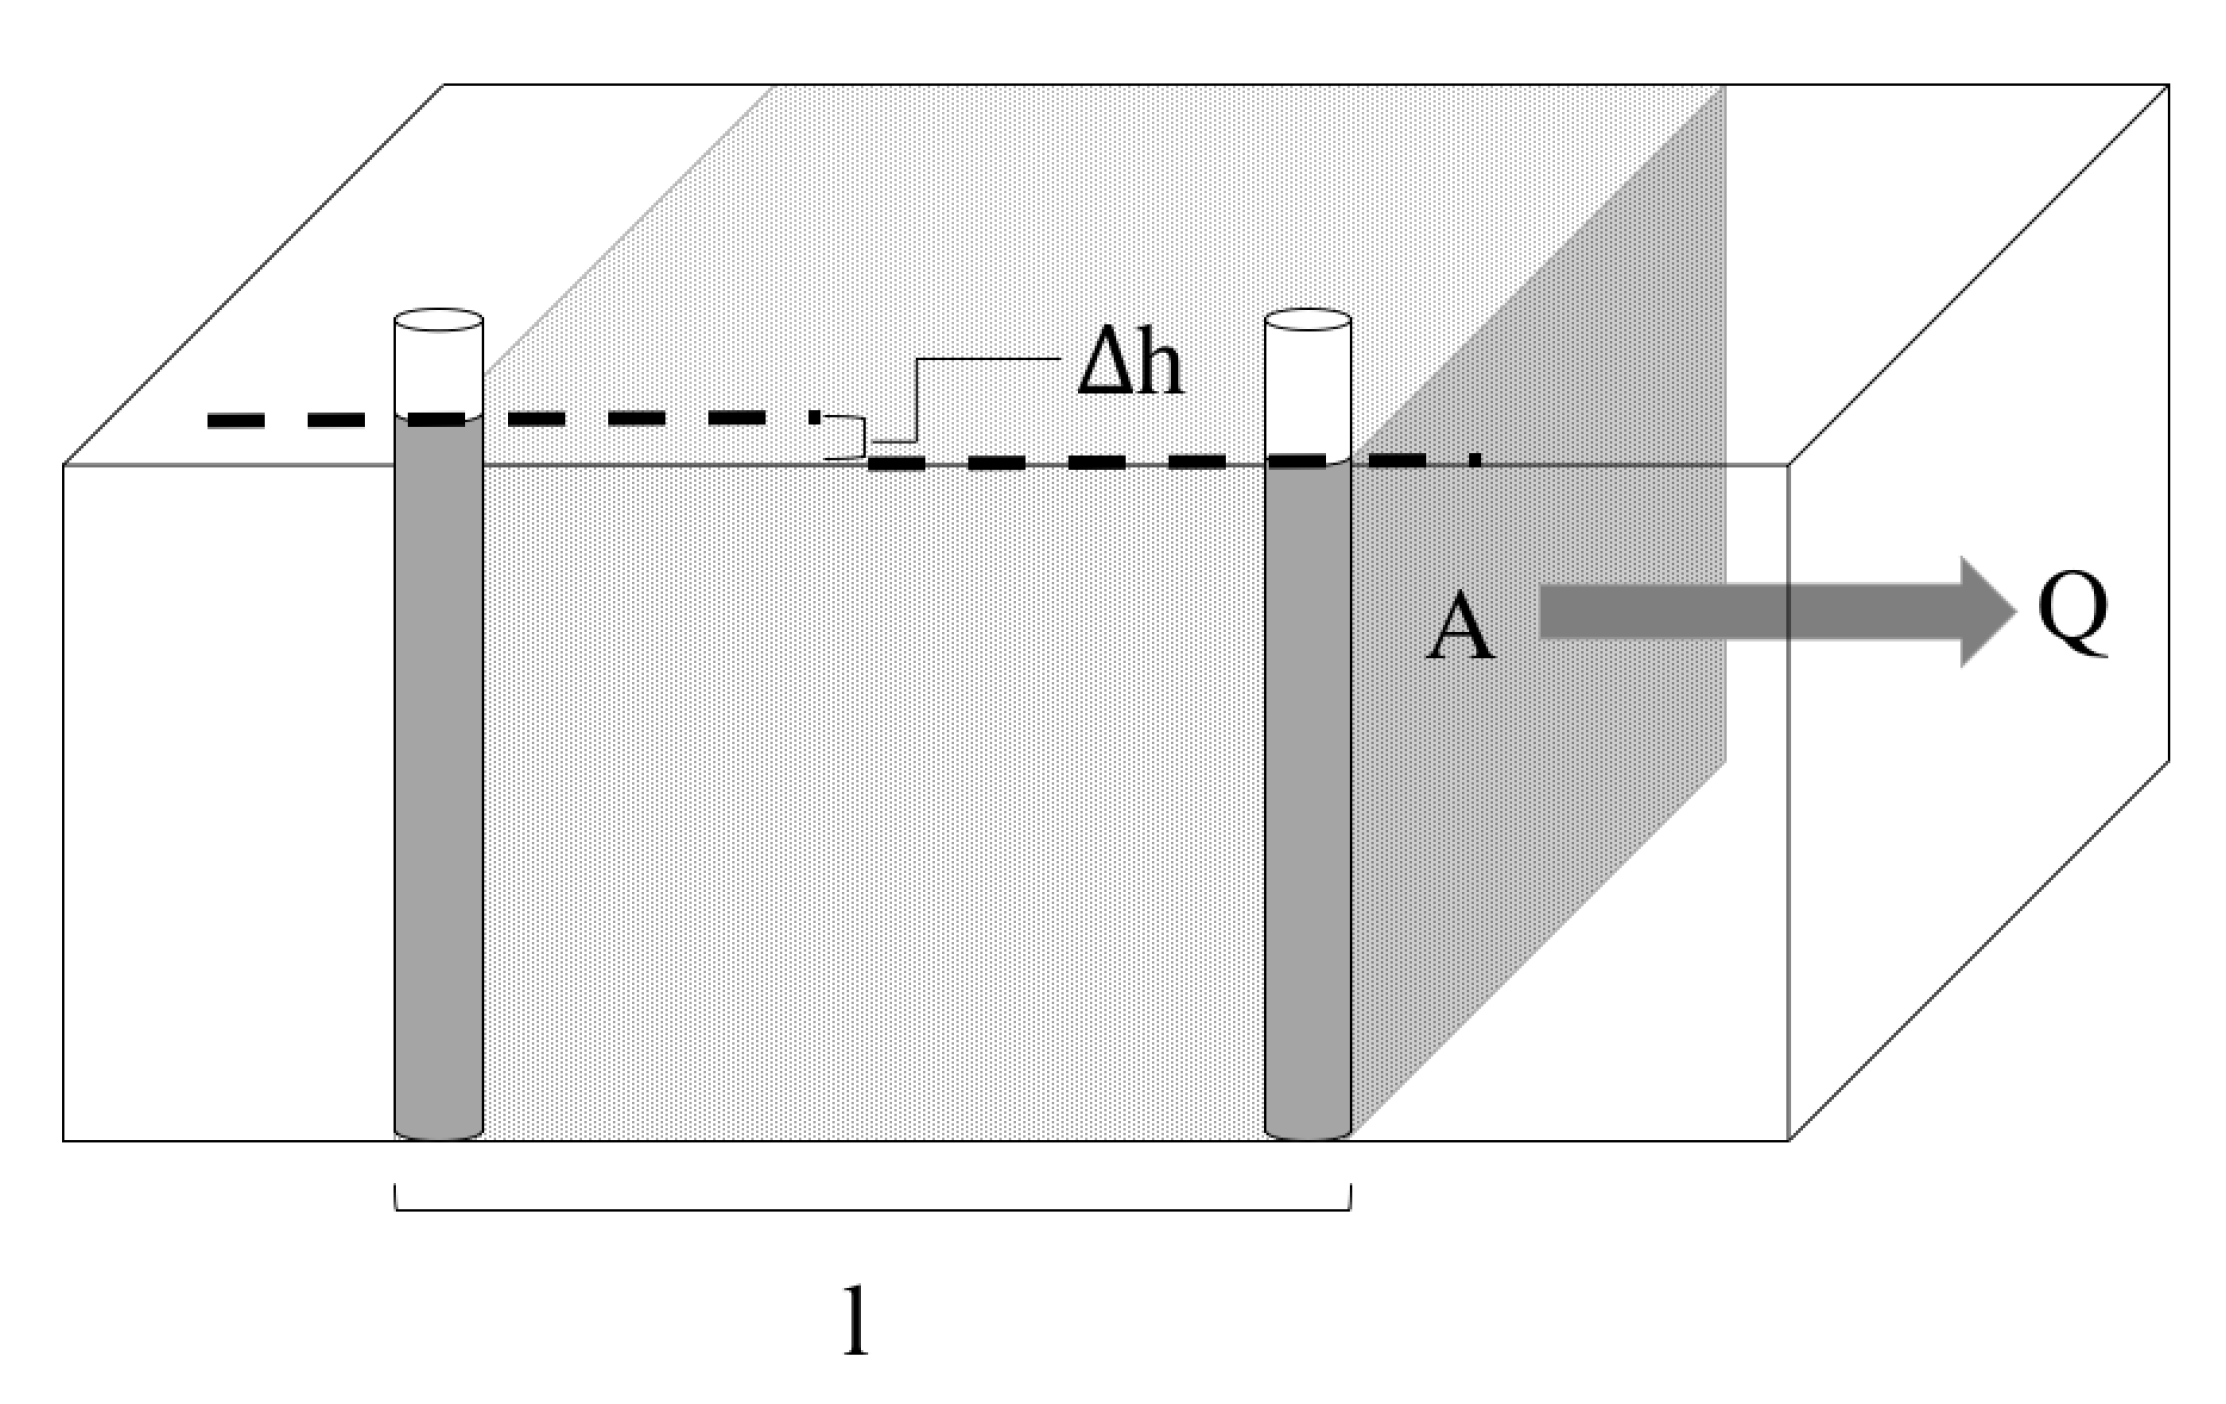
Theoretical transport from a soil body with a cross-sectional area of 100 m2 in the saturated zone was defined to investigate the practical implications of large-scale soil compaction (Figure 7). A hydraulic gradient of 10−3 was defined, and the annual discharge (Q) was calculated from the experimentally determined Kexp values. The experimentally determined hydraulic conductivities (Kexp) were, on average 2.8 × 10⁻⁷ m/s and 7.2 × 10⁻⁷ m/s for the HD and LD columns, respectively. Homogeneous soil characteristics were assumed. In the theoretical scenario (Figure 7), the annual discharge (Q) was almost three times greater for the LD soil compared to the HD soil, 2.3 versus 0.9 m3/year, respectively, following from the higher Kexp of the LD soil. Despite the small leaching differences (except from Sb) observed for the two compaction modes in the CCT (Section 3.3), the annual release from the HD and LD soils in our theoretical case was estimated to 510 mg/y and 1344 mg/y for Pb, 94 mg/y and 195 mg/y for Cu, and 693 mg/y and 1560 mg/y for Sb, respectively, clearly demonstrating an effect of compaction.
The present study shows that compaction has a significant effect on contaminant release from soil. Our results demonstrate the importance of considering hydrogeological properties when assessing contaminated soils and sites. Our results also suggest that soil compaction can be a low-cost remediation option to reduce water transport and thereby spreading of contaminants. However, to validate these findings, further studies are recommended before upscaling.
3.5. In Future Development of the Combined Column
The following is a summary of some practical limitations of using CCTs and areas of improvement in the further development of this method. Reproducibility is of high importance when developing new methods, and variation in measured hydraulic conductivity between replicates is a main limitation of the CCT. The lightly packed material varied the most (Table S8). For example, a rapid increase in Kexp, followed by an instant drop in pressure for one of the low-density shooting range soil columns, indicated preferential flow. Preferential flow can lead to an overestimation of hydraulic conductivity as the water flows through the path of least resistance (e.g., Chapuis [14], Chapuis et al. [43]). This tendency was only significant for the low-density soils, and correspond to previously reported findings stating that poorly sorted and loosely compacted material is more prone to erosion and preferential flow (e.g., Chapuis [14], Chapuis, et al. [43]). A lower flow rate could potentially reduce the preferential flow problem. However, the flow rate should correspond to standardized column leaching tests for better comparison between experiments.
Modifications of the CCT setup to avoid entrapment of air bubbles can also be beneficial to increase reproducibility. Possible solutions include the use of de-aired water, vacuum pumps or air-traps [14]. However, the potential influence of de-airing on porosity and hydraulic conductivity must then be considered [44].
High permeability of the low-density urban soil resulted in minor pressure differences in the CCT and the variations in head were almost undetectable. In contrast, the substantial differences in head levels observed for the columns with high-density shooting range soil resulted in overflow and leakage. These observations suggest that the CCT is limited to soils with a hydraulic conductivity between 10−7 to 10−4 m/s. Fortunately, many soils have a hydraulic conductivity within this interval.
Finally, only minor variations were observed for leaching from the CCT replicates, indicating stable and reliable results due to chemical equilibrium, and therefore constant contaminant distribution between soil and water.
3.6. Pratical Implications
Our study adds to a general debate on whether environmental assessments of contaminated soils and sites should be based on equilibrium-based considerations or on total concentrations alone. Indeed, the established test procedure in investigations of contaminated soils and sites have a major impact on the management of our common soil resources, and it is generally acknowledged that total concentrations is inadequate for environmental assessments [5,6]. Therefore, methods used in assessment of contaminated soils and sites should be closely aligned to field conditions to correctly provide reliable clean-up needs in order to satisfy environmental and human health criteria. The combined column test (CCT) represents a method that facilitates more accurate characterization of contaminated soils and sites where both contaminant leaching and hydrogeological properties are considered. The theoretical annual releases of Sb and Pb from the high-density shooting range soil calculated from the BT results coupled with Hazen’s equation were compared with theoretical annual releases derived the CCT results. The release of Sb and Pb from the BT coupled with Hazen’s equation accounted for only 50% of the estimated release of these metals from the CCT (Table S10). Leaching results also showed that only negligible fractions of the total contaminant concentrations were available. This demonstrates that commonly used quick and cost-efficient methods to assess the potential leaching and transport from soil can yield misleading results and potentially under- or overestimate the risk. The choice of method in assessment of contaminated sites and soils clearly influences the results.
Our findings demonstrate the need for more careful evaluation of which methods that should be applied for environmental risk assessments of contaminated soils and sites. While total concentration analysis is the commonly applied approach in environmental assessments, strongly justified by regulatory guidelines and corresponding soil quality criteria, we suggest that leaching tests, where equilibrium determines contaminant availability, are likely to better represent field conditions. When hydrogeological properties are combined with leaching data, as in the CCT, a more reasonable release estimate of the contaminants can be derived in a short-and long-term scenario and a better understanding of environmental risk is obtained. Further studies should elucidate the performance of the CCT on several soils with different physiochemical properties and contaminant levels. Finally, it should be noted that in environmental assessments of contaminated soils and sites, local conditions, such as geology and hydrology, should be considered regardless of test regime.
4. Conclusions
Our results show that the combined column test can be used to quantify leaching and hydrogeological properties in contaminated soils. The combined column test provides a more representative starting point for an environmental assessment compared to routine measurements of total concentrations and pedotransfer functions that estimate hydraulic conductivity.
Compaction as a physical treatment method did not reduce leaching from the contaminated shooting range soil as expected. Leaching from the high-density soil increased for some of the contaminants, which we attribute to bullet weathering and longer contact time. Reduced hydraulic conductivity observed in the high-density scenario, suggests that soil compaction reduced the water flow through the contaminated soil and thereby reduced contaminant release. Our findings highlight the importance of considering hydrogeological properties when investigating contaminated soils and sites. In retrospect, the effect of compaction on contaminant release was difficult to assess because the weathering of residual bullet fragments represented a continuous source of metal contamination. Future work using a soil without an active contaminant source is needed to examine the effect of compaction on leaching from contaminated soil. More research is needed to evaluate leaching and transport of soil contaminants as a function of hydrogeological properties.
Supplementary Materials
The following supporting information can be downloaded at: https://www.mdpi.com/article/10.3390/w15050874/s1, Tables S1–S10, Figure S1.
Author Contributions
Conceptualization, K.A.S., H.K.F. and G.O.; methodology, K.A.S., H.K.F., P.C. and G.O.; formal analysis, K.A.S. and G.O.; investigation, K.A.S.; resources, P.C. and G.O.; data curation, K.A.S. and G.O.; writing—original draft preparation, K.A.S.; writing—review and editing, K.A.S., H.K.F., P.C. and G.O.; visualization, K.A.S.; supervision, H.K.F., P.C. and G.O.; funding acquisition, H.K.F. and G.O. All authors have read and agreed to the published version of the manuscript.
Funding
This research was funded by the EarthresQue Centre for Research Driven Innovation, Rescue of Earth Materials in the Circular Economy, partly funded by the Research Council of Norway, grant number 310042/F40.
Institutional Review Board Statement
Not applicable.
Informed Consent Statement
Not applicable.
Data Availability Statement
The data presented in this study are available in the Supplementary material.
Acknowledgments
The authors thank Valentina Zivanovic, Oddny Gimmingsrud and Irene E. Dahl for all the valuable help with the laboratory work at NMBU. The authors wish to express their gratitude to Katinka Krahn for help in improving the manuscript.
Conflicts of Interest
The authors declare no conflict of interest. The funders had no role in the design of the study; in the collection, analyses, or interpretation of data; in the writing of the manuscript; or in the decision to publish the results.
References
- Pérez, A.P.; Eugenio, N.R. Status of Local Soil Contamination in Europe; European Comission: Luxemburg, 2018. [Google Scholar]
- World Health Organization. Urban Redevelopment of Contaminated Sites: A Review of Scientific Evidence and Practical Knowledge on Environmental and Health Issues; Regional Office for Europe: Copenhagen, Denmark, 2021. [Google Scholar]
- Peijnenburg, W.J.G.M. Implementation of bioavailability in prospective and retrospective risk assessment of chemicals in soils and sediments. In Bioavailability of Organic Chemicals in Soil and Sediment; Ortega-Calvo, J.J., Parsons, J.R., Eds.; Springer International Publishing: Cham, Switzerland, 2020; pp. 391–422. [Google Scholar]
- Miljødirektoratet (The Norwegian Environmental Agency). Helsebaserte Tilstandsklasser for Forurenset Grunn; Miljødirektoratet: Oslo, Norway, 2009. [Google Scholar]
- Meuser, H.; Van der Graaff, R.H.M. Characteristics of natural and urban soils. In Dealing with Contaminated Sites; Swartjes, F.A., Ed.; Springer: Dordrecht, The Netherlands, 2011. [Google Scholar]
- Grathwohl, P.; Halm, D.; Bonilla, A.; Broholm, M.; Burganos, V.; Christophersen, M.; Comans, R.; Gaganis, P.; Gorostiza, I.; Höhener, P.; et al. Guideline for Groundwater Risk Assessment at Contaminated Sites (GRACOS); Eberhard Karl University of Tübingen: Tübingen, Germany, 2003. [Google Scholar]
- Almås, Å.R.; Singh, B.R. Trace metal contamination. In Encyclopedia of Soil Sciences; Lan, R., Ed.; CRC Press: Boca Raton, FL, USA, 2017; pp. 2364–2368. [Google Scholar]
- Kim, R.-Y.; Yoon, J.-K.; Kim, T.-S.; Yang, J.E.; Owens, G.; Kim, K.-R. Bioavailability of heavy metals in soils: Definitions and practical implementation—A critical review. Environ. Geochem. Health 2015, 37, 1041–1061. [Google Scholar] [CrossRef] [PubMed]
- CENT/TS 14405; Characterization of Waste. Leaching Behavior Test. Up-flow Peroclation Test (Under Specific Conditions). European Committee for Standardization: Brussels, Belgium, 2006.
- EN 12457-2; Characterization of Waste. Leaching. Compliance Test for Leaching of Granular Waste Materials and Sludges. Part 2: One Stage Batch Test at a Liquid to Solid Ratio of 10 L/kg for Materials with Particle Size Below 4 mm (Without or With Size Reduction). European Committee for Standardization: Brussels, Belgium, 2003.
- L 11/27; Council Decision of 19 December 2002 Establishing Criteria and Procedures for the Acceptance of Waste at Landfills Pursuant to Article 16 of and Annex II of Directive 1999/31/EC. Council of the European Union: Brussels, Belgium, 2003.
- Van der Sloot, H.A.; Van Zomeren, A.; Dijkstra, J.J.; Hoede, D.; Jacobs, J.; Schariff, H. Predication of long term leachate quality and chemical speciation for a predominantly inroganic waste landfill. In Proceedings of the Ninth International Waste Mangamenet and Landfill Symposium, Sardina, Italy, 6–10 October 2003. [Google Scholar]
- Schwartz, F.W.; Zhang, H. Fundamentals of Ground Water, 1st ed.; John Wiley & Sons: New York, NY, USA, 2003. [Google Scholar]
- Chapuis, R.P. Predicting the saturated hydraulic conductivity of soils: A review. Bull. Eng. Geol. Environ. 2012, 71, 401–434. [Google Scholar] [CrossRef]
- Dikinya, O.; Hinz, C.; Aylmore, G. Decrease in hydraulic conductivity and particle release associated with self-filtration in saturated soil columns. Geoderma 2008, 146, 192–200. [Google Scholar] [CrossRef]
- Li, S.; Zhang, Y.; Yan, W.; Shangguan, Z. Effect of biochar application method on nitrogen leaching and hydraulic conductivity in a silty clay soil. Soil Tillage Res. 2018, 183, 100–108. [Google Scholar] [CrossRef]
- Krogstad, T.; Jørgensen, P.; Sogn, T.; Børresen, T.; Kolnes, A.G. Manual for Kornfordelingsanalyse Etter Pipettemetoden [Instructions for particle size distribution analysis by the pipette method]; Institutt for Jordfag, Norwegian College of Agriculture: Ås, Norway, 1991. [Google Scholar]
- (R) 2702; Certificate of Analysis, Standard Reference Material, Inorganics in Marine Sediment. National Institute of Standards & Technology: Gaithesburg, MD, USA, 2016.
- (R) 2709a; Certificate of Analysis, Standard Reference Material, San Joaquin Soil. National Institute of Standard & Technology: Gaithesburg, MD, USA, 2009.
- Gustafsson, J.P. Visual MINTEQ ver. 3.0; KTH: Stockholm, Sweden, 2012. [Google Scholar]
- Carrier, W.D. Goodbye, Hazen; Hello, Kozeny-Carman. J. Geotech. Geoenvironmental Eng. 2003, 129, 1054–1056. [Google Scholar] [CrossRef] [Green Version]
- Chapuis, R.P. Predicting the saturated hydraulic conductivity of natural soils. Geotech. News 2008, 26, 47–50. [Google Scholar]
- Chapuis, R.P. Predicting the saturated hydraulic conductivity of sand and gravel using effective diameter and void ratio. Can. Geotech. J. 2004, 41, 787–795. [Google Scholar] [CrossRef]
- Okkenhaug, G.; Amstätter, K.; Lassen Bue, H.; Cornelissen, G.; Breedveld, G.; Henriksen, T.; Mulder, J. Antimony (Sb) Contaminated Shooting Range Soil: Sb Mobility and Immobilization by Soil Amendments. Environ. Sci. Technol. 2013, 47, 6431–6439. [Google Scholar] [CrossRef]
- Okkenhaug, G.; Grasshorn Gebhardt, K.; Amstaetter, K.; Lassen Bue, H.; Herzel, H.; Mariussen, E.; Rossebø Almås, Å.; Cornelissen, G.; Breedveld, G.D.; Rasmussen, G.; et al. Antimony (Sb) and lead (Pb) in contaminated shooting range soils: Sb and Pb mobility and immobilization by iron based sorbents, a field study. J. Hazard. Mater. 2016, 307, 336–343. [Google Scholar] [CrossRef]
- Voie, Ø.A.; Strømseng, A.E. Risikovurdering Av Tungmetallforurensning På en Utendørs Skytebane; The Norwegian Defence Research Establishment: Kjeller, Norway, 2000. [Google Scholar]
- Bradl, H.B. Adsorption of heavy metal ions on soils and soils constituents. J. Colloid Interface Sci. 2004, 277, 1–18. [Google Scholar] [CrossRef]
- Jordan, R.N.; Yonge, D.R.; Hathhorn, W.E. Enhanced mobility of Pb in the presence of dissolved natural organic matter. J. Contam. Hydrol. 1997, 29, 59–80. [Google Scholar] [CrossRef] [Green Version]
- Tipping, E.; Rieuwerts, J.; Pan, G.; Ashmore, M.R.; Lofts, S.; Hill, M.T.R.; Farago, M.E.; Thornton, I. The solid–solution partitioning of heavy metals (Cu, Zn, Cd, Pb) in upland soils of England and Wales. Environ. Pollut. 2003, 125, 213–225. [Google Scholar] [CrossRef] [PubMed]
- Heier, L.S.; Meland, S.; Ljønes, M.; Salbu, B.; Strømseng, A.E. Short-term temporal variations in speciation of Pb, Cu, Zn and Sb in a shooting range runoff stream. Sci. Total Environ. 2010, 408, 2409–2417. [Google Scholar] [CrossRef] [PubMed]
- Saar, R.A.; Weber, J.H. Lead(II) complexation by fulvic acid: How it differs from fulvic acid complexation of copper(II) and cadmium(II). Geochim. Et Cosmochim. Acta 1980, 44, 1381–1384. [Google Scholar] [CrossRef]
- Covelo, E.F.; Vega, F.A.; Andrade, M.L. Competitive sorption and desorption of heavy metals by individual soil components. J. Hazard. Mater. 2007, 140, 308–315. [Google Scholar] [CrossRef]
- Okkenhaug, G.; Mulder, J. Antimony. In Encyclopedia of Soil Science, 3rd ed.; Lal, R., Ed.; CRC Press: Boca Raton, FL, USA, 2011. [Google Scholar]
- Wilson, S.C.; Lockwood, P.V.; Ashley, P.M.; Tighe, M. The chemistry and behaviour of antimony in the soil environment with comparisons to arsenic: A critical review. Environ. Pollut. 2010, 158, 1169–1181. [Google Scholar] [CrossRef]
- Johnson, C.A.; Moench, H.; Wersin, P.; Kugler, P.; Wenger, C. Solubility of Antimony and Other Elements in Samples Taken from Shooting Ranges. J. Environ. Qual. 2005, 34, 248–254. [Google Scholar] [CrossRef] [Green Version]
- Scheinost, A.C.; Rossberg, A.; Vantelon, D.; Xifra, I.; Kretzschmar, R.; Leuz, A.-K.; Funke, H.; Johnson, C.A. Quantitative antimony speciation in shooting-range soils by EXAFS spectroscopy. Geochim. Et Cosmochim. Acta 2006, 70, 3299–3312. [Google Scholar] [CrossRef]
- Ottesen, R.T.; Alexander, J.; Joranger, T.; Rytter, E.; Andersson, M. Forslag Til Tilstandsklasser for Jord; NGU: Trondheim, Norway, 2007. [Google Scholar]
- Delay, M.; Lager, T.; Schulz, H.D.; Frimmel, F.H. Comparison of leaching tests to determine and quantify the release of inorganic contaminants in demolition waste. Waste Manag. 2007, 27, 248–255. [Google Scholar] [CrossRef]
- Kosson, D.S.; van der Sloot, H.A.; Eighmy, T.T. An approach for estimation of contaminant release during utilization and disposal of municipal waste combustion residues. J. Hazard. Mater. 1996, 47, 43–75. [Google Scholar] [CrossRef]
- Lopez Meza, S.; Garrabrants, A.C.; van der Sloot, H.; Kosson, D.S. Comparison of the release of constituents from granular materials under batch and column testing. Waste Manag. 2008, 28, 1853–1867. [Google Scholar] [CrossRef] [PubMed]
- Grathwohl, P.; Susset, B. Comparison of percolation to batch and sequential leaching tests: Theory and data. Waste Manag. 2009, 29, 2681–2688. [Google Scholar] [CrossRef] [PubMed]
- Kalbe, U.; Berger, W.; Eckardt, J.; Simon, F.-G. Evaluation of leaching and extraction procedures for soil and waste. Waste Manag. 2008, 28, 1027–1038. [Google Scholar] [CrossRef]
- Chapuis, R.; Weber, S.; Duhaime, F. Permeability test results with packed spheres and non-plastic soils. Geotech. Test. J. 2015, 38, 950–964. [Google Scholar] [CrossRef]
- Pedersen, T.S. Væsketransport i Umettet Sone. Stratigrafisk beskrivelse av toppsedimentene på forskningsfeltet Moreppen, og bestemmelse av tilhørende hydrauliske parametere [Liquid transport in the unsaturated zone. Stratigraphic description of the top sediments on the Moreppen research area, and investigations of relevant hydraulic parameters]. Master’s Thesis, University of Oslo, Oslo, Norway, 1994. [Google Scholar]
Figure 1.
Schematic presentation of contaminant distribution in soil. Modified from Almås and Singh [7].
Figure 1.
Schematic presentation of contaminant distribution in soil. Modified from Almås and Singh [7].

Figure 2.
Experimental set-up for the combined column test (CCT). The eluent is pumped through the soil column using a peristaltic pump (marked with a “P”). Flow direction is indicated by the arrows. Eluate was collected after passing the constant outlet. Three standpipes were installed next to measuring sticks (mm scale) for reading of head values.

Figure 3.
Calculated hydraulic conductivity (KHazen) and the average experimental hydraulic conductivity (Kexp) in m/s in: (a) shooting range soil in high-density (HD) columns and low-density (LD) columns and (b) the urban soil (LD). Outliers have been excluded.
Figure 3.
Calculated hydraulic conductivity (KHazen) and the average experimental hydraulic conductivity (Kexp) in m/s in: (a) shooting range soil in high-density (HD) columns and low-density (LD) columns and (b) the urban soil (LD). Outliers have been excluded.

Figure 4.
Eluate concentrations (μg/L) of Pb, Cu, and Sb as a function of L/S ratio for the low-density (LD) shooting range soil. Error bars represent standard deviations (n = 3).
Figure 4.
Eluate concentrations (μg/L) of Pb, Cu, and Sb as a function of L/S ratio for the low-density (LD) shooting range soil. Error bars represent standard deviations (n = 3).

Figure 5.
Eluate concentrations (μg/L) of Pb, Cu, and Zn as a function of L/S ratio for the urban soil. Error bars represent standard deviations (n = 3).
Figure 5.
Eluate concentrations (μg/L) of Pb, Cu, and Zn as a function of L/S ratio for the urban soil. Error bars represent standard deviations (n = 3).

Figure 6.
Eluate concentrations (µg/L) of Pb, Cu, and Sb as a function of L/S ratio for the high-density (HD) and low-density (LD) shooting range soil. The error bars represent standard deviations (n = 3).
Figure 6.
Eluate concentrations (µg/L) of Pb, Cu, and Sb as a function of L/S ratio for the high-density (HD) and low-density (LD) shooting range soil. The error bars represent standard deviations (n = 3).

Figure 7.
Cross-section of a contaminated soil body in the saturated zone. The discharge (Q) was calculated based on the cross-sectional area (A) (100 m2) and the hydraulic gradient (i) = (h1−h2)/l (10−3).
Figure 7.
Cross-section of a contaminated soil body in the saturated zone. The discharge (Q) was calculated based on the cross-sectional area (A) (100 m2) and the hydraulic gradient (i) = (h1−h2)/l (10−3).


Table 1.
Methods for determining soil contamination.
| Method | Description | Advantages 1 | Disadvantages 1 |
|---|---|---|---|
| Total soil concentration | Decomposition of soil matrix with acid before detection of contaminants (mg/kg dw) in the soil sample. | Cost-efficient. | Includes also the non-available contaminant fractions and leads to an overestimation of environmental risk. |
| One-stage batch test (e.g., [10]) | Evaluates leaching (mg/kg dw) under specific conditions at one single liquid-to-solid (L/S) ratio. | Cost-efficient (duration ~24 h), easy to operate, rapid data analysis and interpretation. | Agitation contributes to a high-energy environment, and can lead to irreversible mobilization of dissolved organic matter (DOC) and colloids (e.g., [12]). Ignores mass transport. |
| Column test (e.g., [9]) | Evaluates leaching (mg/kg dw) at various L/S ratios. | Field resembling conditions, provides information about leaching as a function of time. | Resource and time-consuming. Error sources, such as preferential flow, can affect reproducibility. |
1 In terms of environmental purposes.
Table 2.
Methods for determining contaminant transport in soil.
| Method | Description | Advantages 1 | Disadvantages 1 |
|---|---|---|---|
| Pedotransfer-functions, e.g., Hazen and Kozeny-Carman (e.g., [13]) | Based on single soil parameters, such as particle size distribution. | Cost-efficient. | Based on destructive sampling which does not measure real pore structure and connectivity. |
| Column experiments, constant or falling head methods (e.g., [13]) | Disturbed or undisturbed soil cores (pore structure intact) are sampled from the field, and discharge measured under constant or falling head. | Suitable for a wide range of soils. | Prone to uncertainties due to field heterogeneities (undisturbed) or packing procedures (disturbed), as well as operation [14]. |
| Field measurements | A wide range of methods exists, including piezometer and borehole installations. | Provides the most accurate values of the hydraulic conductivity at a site. Can account for heterogeneity if several setups are installed. | Resource and time-consuming. Consideration of the local area (e.g., flow patterns) must be made. |
1 In terms of environmental purposes.
Table 3.
Soil chemical and physical characteristics.
| Parameter | Unit | Shooting Range Soil | Urban Soil | |
|---|---|---|---|---|
| Soil type | - | Silty sand | Silty sand | |
| d10 | mm | 0.004 | 0.002 | |
| d60 | mm | 0.2 | 0.3 | |
| Uniformity coefficient (Cu) | - | 50 | 150 | |
| Loss on ignition (LOI) | % | 2.5 ± 0.1 | 7.7 ± 0.5 | |
| Total inorganic content (TIC) | % | 0.02 ± 0.00 | 0.08 ± 0.02 | |
| Total organic content (TOC) | % | 1.1 ± 0.0 | 5.3 ± 0.1 | |
| pHin water (Liquid to solid ratio (L/S) 0.4) | - | 5.2 ± 0.0 | 7.4 ± 0.0 | |
| Electrical conductivity (EC) | μS/cm | 50 ± 3 | 206 ± 18 | |
| Total concentration | Pb | mg/kg dw | 1933 ± 58 | 660 ± 36 |
| Cu | mg/kg dw | 127 ± 6 | 59 ± 4 | |
| Zn | mg/kg dw | - | 193 ± 6 | |
| Sb | mg/kg dw | 210 | - |
Table 4.
Experimental program.
| Parameter | Unit | Shooting Range Soil | Urban Soil | |
|---|---|---|---|---|
| Compaction level | High density | Low density | Low density | |
| Experimental period | - | ~9 weeks | ~3 weeks | ~1–2 weeks |
| Replicates | - | 3 | 3 | 3 |
| Sampling (Liquid to solid ratio (L/S)) | L/kg | 0.1, 2, 6, and 10 | 0.1, 2, and 6 | 0.1, 2, and 6 |
| Height of soil in column after packing | cm | ~30 | ~30 | ~30 |
| Number of layers | - | 10 | 6 | 6 |
| Average flow rate | mL/h | 5.8 | 10.4 | 9.4 |
| Bulk density 1 | g/cm3 | 1.5 | 1.4 | 1.0 |
| Pore number (e) 2 | - | 0.7 | 0.9 | 1.8 |
| Porosity (n) 3 | - | 0.4 | 0.5 | 0.6 |
| Porewater velocity 4 | cm/d | 16.5 | 27.1 | 18.0 |
Table 5.
pH, Pb, Cu, Sb, and DOC at L/S 10 from the batch test and the combined column test on the shooting range soil.
Table 5.
pH, Pb, Cu, Sb, and DOC at L/S 10 from the batch test and the combined column test on the shooting range soil.
| Batch Test | Combined Column Test | |
|---|---|---|
| pH | 6.2 ± 0.1 | 6.7 ± 0.2 |
| Pb (mg/kgdw) | 3.5 ± 0.4 | 6.2 ± 0.4 |
| Cu (mg/kgdw) | 0.9 ± 0.1 | 1.0 ± 0.1 |
| Sb (mg/kgdw) | 4.8 ± 0.2 | 8.4 ± 0.3 |
| DOC (mg/kgdw) | 81 ± 8 | 55 ± 1 |
Disclaimer/Publisher’s Note: The statements, opinions and data contained in all publications are solely those of the individual author(s) and contributor(s) and not of MDPI and/or the editor(s). MDPI and/or the editor(s) disclaim responsibility for any injury to people or property resulting from any ideas, methods, instructions or products referred to in the content. |
© 2023 by the authors. Licensee MDPI, Basel, Switzerland. This article is an open access article distributed under the terms and conditions of the Creative Commons Attribution (CC BY) license (https://creativecommons.org/licenses/by/4.0/).
Share and Cite
MDPI and ACS Style
Skjennum, K.A.; French, H.K.; Carotenuto, P.; Okkenhaug, G. Combined Column Test for Characterization of Leaching and Transport of Trace Elements in Contaminated Soils. Water 2023, 15, 874. https://doi.org/10.3390/w15050874
AMA Style
Skjennum KA, French HK, Carotenuto P, Okkenhaug G. Combined Column Test for Characterization of Leaching and Transport of Trace Elements in Contaminated Soils. Water. 2023; 15(5):874. https://doi.org/10.3390/w15050874
Chicago/Turabian StyleSkjennum, Karen Ane, Helen K. French, Pasquale Carotenuto, and Gudny Okkenhaug. 2023. "Combined Column Test for Characterization of Leaching and Transport of Trace Elements in Contaminated Soils" Water 15, no. 5: 874. https://doi.org/10.3390/w15050874
Note that from the first issue of 2016, this journal uses article numbers instead of page numbers. See further details here.