Article

Flood or Non-Flooded: A Comparative Study of State-of-the-Art Models for Flood Image Classification Using the FloodNet Dataset with Uncertainty Offset Analysis

by
Jehoiada Jackson
1,*,
Sophyani Banaamwini Yussif
2,
Rutherford Agbeshi Patamia
1,
Kwabena Sarpong
1 and
Zhiguang Qin
1
1
School of Information and Software Engineering, University of Electronic Science and Technology of China, Chengdu 610054, China
2
School of Computer Science and Engineering, University of Electronic Science and Technology of China, Chengdu 610054, China
*
Author to whom correspondence should be addressed.
Water 2023, 15(5), 875; https://doi.org/10.3390/w15050875
Submission received: 29 January 2023 / Revised: 17 February 2023 / Accepted: 21 February 2023 / Published: 24 February 2023

Abstract

:
Natural disasters, such as floods, can cause significant damage to both the environment and human life. Rapid and accurate identification of affected areas is crucial for effective disaster response and recovery efforts. In this paper, we aimed to evaluate the performance of state-of-the-art (SOTA) computer vision models for flood image classification, by utilizing a semi-supervised learning approach on a dataset named FloodNet. To achieve this, we trained son 11 state-of-the-art (SOTA) models and modified them to suit the classification task at hand. Furthermore, we also introduced a technique of varying the uncertainty offset λ in the models to analyze its impact on the performance. The models were evaluated using standard classification metrics such as Loss, Accuracy, F1 Score, Precision, Recall, and ROC-AUC. The results of this study provide a quantitative comparison of the performance of different CNN architectures for flood image classification, as well as the impact of different uncertainty offset λ . These findings can aid in the development of more accurate and efficient disaster response and recovery systems, which could help in minimizing the impact of natural disasters.

1. Introduction

Traditional methods of collecting information about the extent of damage caused by natural disasters, such as ground surveys, can be time-consuming, costly, and may not always provide accurate or comprehensive data. In recent years, the use of satellite imagery and convolutional neural networks (CNNs) has become an increasingly popular approach for monitoring and responding to natural disasters. These techniques allow for the efficient and accurate identification of affected areas, which can aid in disaster response and recovery efforts. In addition to the importance of visual scene understanding in disaster response and recovery, it’s also important to understand the scope and frequency of natural disasters. The Natural Disasters DataBook 2019, a report published by the Centre for Research on the Epidemiology of Disasters (CRED) provides a comprehensive overview of natural disasters that occurred worldwide in 2019. The report states that a total of 9974 natural disasters were recorded in 2019, affecting over 208 million people and causing over 29 billion economic losses [1]. The report also highlights that floods were the most frequent type of natural disaster, accounting for 42 % of all-natural disasters recorded in 2019, followed by storms ( 26 ) % and heatwaves ( 10 ) % . Additionally, the report states that Asia was the most affected region, with 50 % of all-natural disasters recorded in 2019 occurring in Asia, followed by Africa ( 20 ) % and the Americas ( 19 ) % respectively. These statistics highlight the necessity for effective and precise disaster response and recovery efforts, particularly in regions that are most affected. The ability to quickly and accurately interpret images and videos captured in the aftermath of a disaster, using techniques like deep learning and CNNs can provide valuable information for decision-making in disaster management and recovery efforts. Traditionally, providing assistance to disaster areas has relied on ground surveys, where teams of experts physically visit the affected areas to assess the damage and identify areas in need of assistance. This method can be time-consuming and costly, and may not always provide accurate or comprehensive information [2,3,4]. Furthermore, in situations where access to the affected area is infeasible, such as an active war zone or remote area, traditional methods can be highly limited. On the other hand, the use of CNN image classification allows for a more efficient and accurate way of providing assistance to disaster areas. By analyzing images and videos captured in the aftermath of a disaster, CNNs can quickly and accurately identify damaged buildings, roads, and other infrastructure, as well as affected areas. This information can be used to prioritize resources and aid in recovery efforts [5,6]. In terms of datasets, traditional methods rely on ground survey data, which is collected by experts physically visiting affected areas. This data may include photographs, notes, and measurements taken on-site. On the other hand, CNN-based methods rely on image and video datasets, such as the xView dataset, which contains over 1 million high-resolution satellite images of natural and man-made disasters, with annotations for over 600 object classes, or the Functional Map of the World (FMoW) dataset, which consists of more than 200,000 high-resolution overhead images, labeled with information such as roads, buildings, and vehicles. The use of CNNs with these datasets allows for more efficient and accurate analysis and interpretation of the data [7,8,9,10,11]. Furthermore, with the advancements in deep learning architectures and the availability of large datasets, the performance of CNNs for image classification has been continuously improved, providing more accurate and robust results. Overall, the use of CNNs in image classification can be a powerful tool in providing assistance to disaster areas and aid in recovery efforts.
Aerial datasets for understanding scenes are useful for assessing damage after natural disasters. Existing datasets primarily use a two-step approach, beginning with semantic image segmentation and ending with pixel-by-pixel classification. One difficulty in creating an aerial dataset is the cost of labeling the data, particularly for semantic segmentation. This frequently results in labels for only a small percentage of the data, necessitating more advanced deep learning methods. Another issue is the high-class imbalance. FloodNet [12] dataset provides high-resolution images taken from low altitudes collected from remote areas using unmanned aerial vehicles, making it a good option for post-disaster damage assessment. New practices have emerged to leverage advances in satellite imaging and AI for rapid and automated post-disaster assessment of damaged infrastructure. These solutions are expected to cohere with human experts to form human-machine schemes, paving the way for faster and more accurate post-disaster damage assessment operations. Deep learning methods like CNN [13] tend to outperform existing satellite imagery data processing methods and have been shown to be effective in retrieving damaged areas from satellite and aerial images [14].
This study aims to conduct a comparative analysis on the use of mono-temporal remote sensing data for detecting damaged areas in images acquired immediately following a disaster. Additionally, this study aims to evaluate the effectiveness of deep learning methods for multi-temporal image processing in computer vision research and to perform a connection recovery assessment. Through the use of the FloodNet dataset and a semi-supervised training procedure, this study aims to provide binary classification results. In summary, our contributions to this paper are as follows:
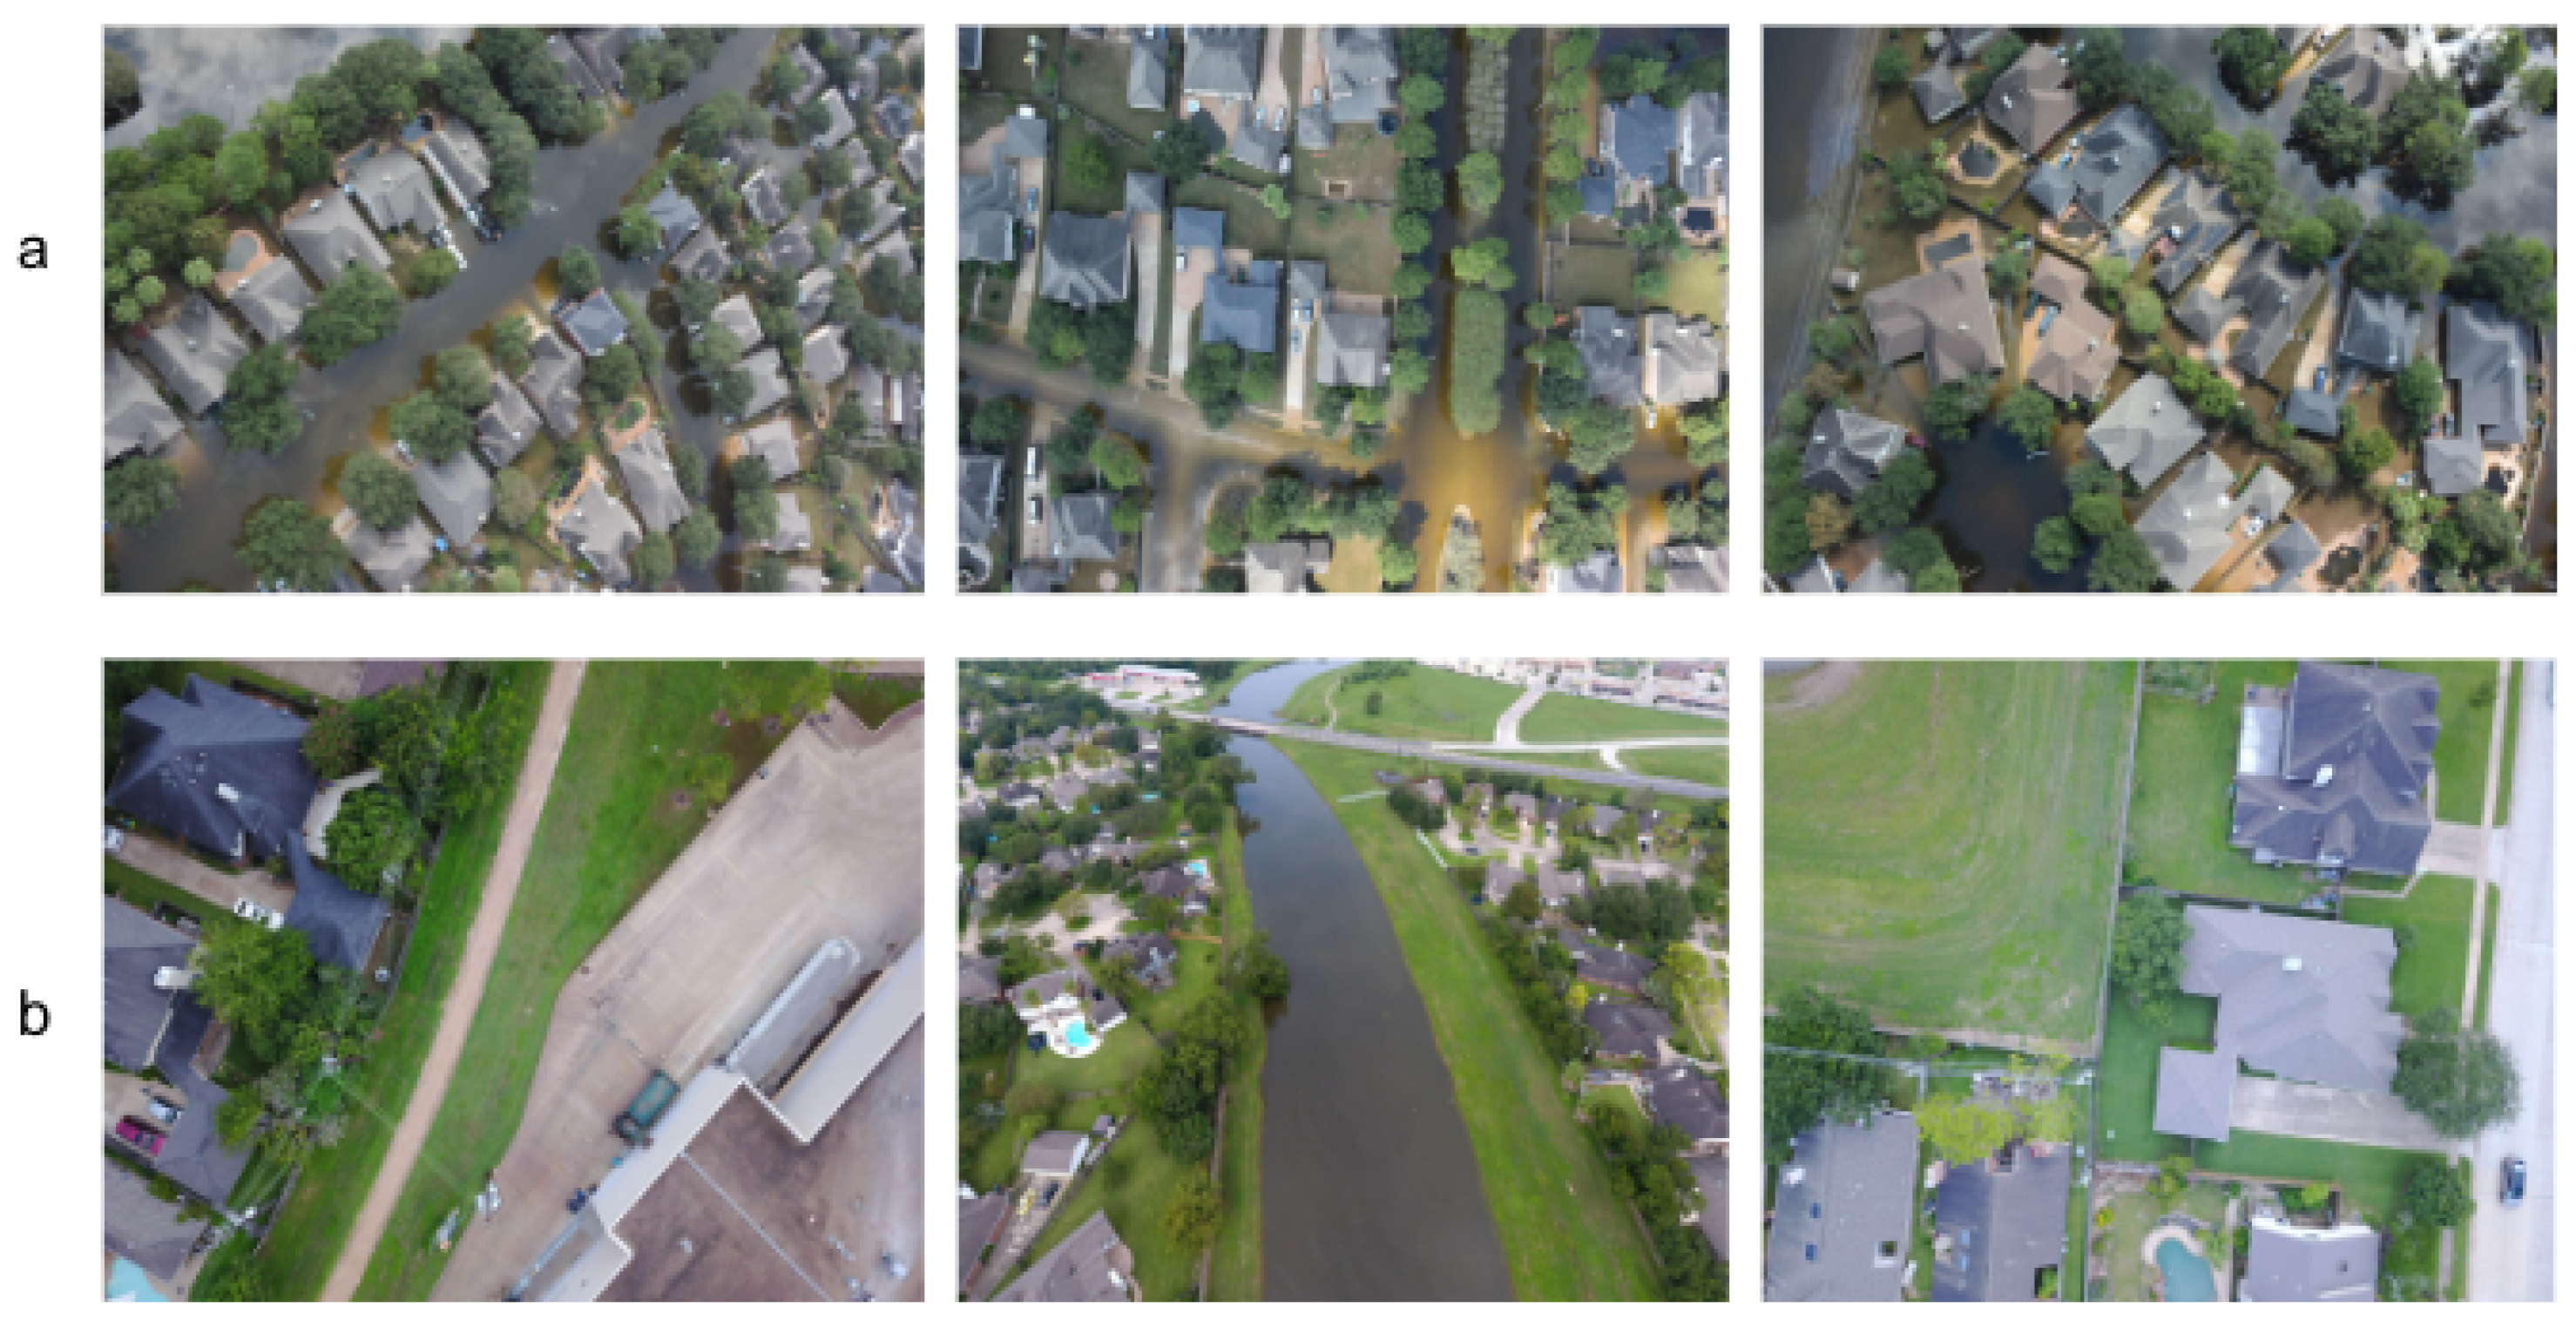
  • We utilized a manual annotation process to categorize all images as either “flooded” or “non-flooded”.
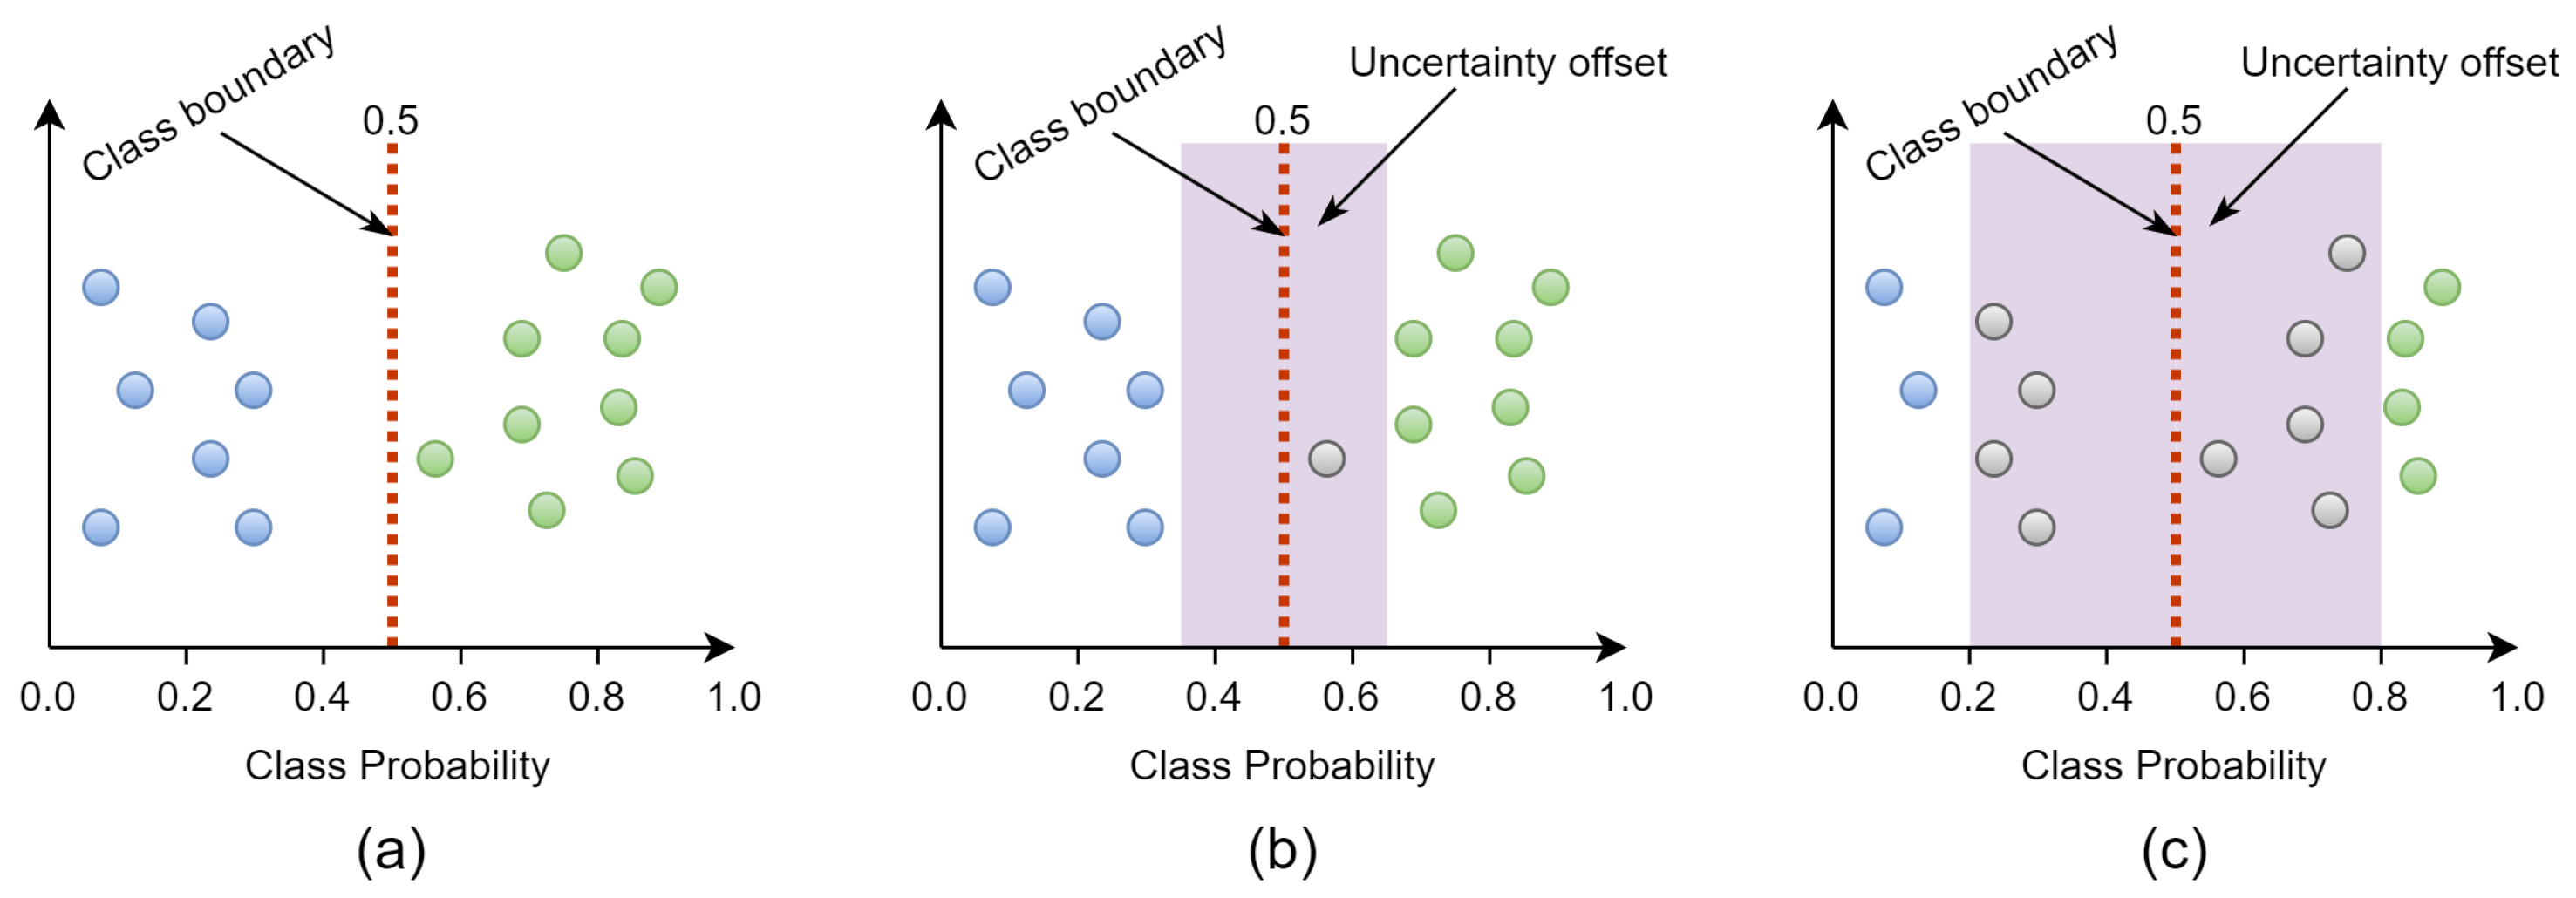
  • We utilized a semi-supervised learning methodology that involved the implementation of uncertainty offsets to dynamically annotate the input images. This approach allowed us to analyze and compare the performance of different state-of-the-art models.
  • We conducted a thorough evaluation of the performance of state-of-the-art networks through a series of experiments, utilizing a variety of metrics to assess their capabilities.
The remaining sections of this paper are organized as follows: In Section 2, we provide a comprehensive review of existing research on the classification and segmentation of post-natural disaster damages using aerial and satellite images. In Section 3, we present an overview of the base models used in this study. Section 4.1 details the FloodNet dataset, our approach to annotation, and the design of our experiments. The results of our experiments and quantitative analysis of performance are presented in Section 4. Finally, we conclude the study in Section 5.

2. Related Works

Recent research has focused on utilizing convolutional neural networks (CNNs) for image classification in natural disaster response and recovery. The state-of-the-art in image classification has been continuously advancing, with CNNs achieving high accuracy in recognizing objects, scenes, and activities in images. One area of research has been the use of CNNs to classify disaster images for efficient and accurate damage assessment. This information can then be used to prioritize resources and aid in recovery efforts. Additionally, CNNs have been employed to classify images of infrastructure, such as roads and bridges, for identifying areas in need of immediate repair and maintenance. Satellite image classification and segmentation of post-natural disaster damages can be summarized into three categories of current damage-detecting techniques. The first category employs supervised machine learning approaches such as pixel-based salient change and object-based detection [12,15]. The second category comprises unsupervised approaches [16], mainly focused on outlier identification in scene changes. The third category, a recent trend in damage assessment, employs semi-supervised techniques to utilize less human-labeled data while maintaining greater accuracy [17]. Deep learning frameworks such as CNNs have also been presented in other publications to forecast the damage degree of each image. However, current models are limited to generating bounding box prediction tasks and the exact locations of damaged components [13].
Algiriyage et al. [18] proposed an Automatic Multi-class Image Tagging for Disaster Management Using CNN, which achieved a high accuracy of 0.9 in tagging images of natural disasters with relevant keywords, such as flood or damage. Chen et al. [19] proposed a Deep Learning-based Multi-class Image Classification for Automatic Damage Assessment after Natural Disasters which achieved an F1-score of 0.97 in classifying images of natural disasters into different categories, such as damaged or undamaged. [20] proposed a Deep Learning-based Damage Assessment of Buildings after Natural Disasters Using Multi-Modal Data which achieved high accuracy in identifying damaged buildings. The study proposed a CNN-based approach for identifying damaged buildings in both aerial images and thermal images captured after natural disasters. The approach achieved a high level of accuracy, with an F1-score of 0.93 [3] There are many other research studies that have been conducted on disaster image classification using CNNs, including works that propose approaches for automatic detection of landslides [21], and segmentation of damaged buildings [22]. There is also a significant amount of research on specific tasks such as the identification of flood-affected areas and the segmentation of damaged buildings and roads. For example, a 2020 study proposed a deep-learning-based approach for automatically detecting flooded areas in satellite imagery using CNNs. The approach achieved a high level of accuracy, with an F1-score of 0.95 [23]. Additionally, another study in 2021 proposed a CNN-based approach for segmenting damaged buildings and roads in overhead imagery captured after natural disasters, achieving an F1-score of 0.92 [24] These studies demonstrate the potential of CNNs for specific tasks related to disaster response and recovery, such as identifying areas affected by floods, as well as segmenting damaged buildings and roads. This information can be used to prioritize resources and aid in recovery efforts, highlighting the importance of image classification in disaster management. With the advancements in deep learning architectures, such as ResNet, DenseNet, and EfficientNet, and the availability of large datasets, the performance of CNNs for image classification has been continuously improved. This further highlights the potential of CNNs in providing valuable information for decision-making in disaster management and recovery efforts. In conclusion, the use of CNNs in image classification has led to a significant amount of research on its application in the context of natural disaster response and recovery. The ability of CNNs to automatically learn features from the data and achieve high accuracy in recognizing objects, scenes, and activities in images is invaluable in identifying damage, prioritizing resources, and aiding in recovery efforts.

2.1. Supervised Classification

Supervised classification is a widely used method for quantitatively analyzing data from remote sensing images. It involves training a classifier on labeled data and then using it to classify new data. In this method, the spectral characteristics of the remote sensing image are divided into areas associated with the ground cover classes of interest. These ground cover classes can include various types of land use such as forests, urban areas, and water bodies. The classifier is trained using labeled training data, where each pixel in the image is assigned to a specific class based on its spectral characteristics. Once the classifier is trained, it can then be applied to new images to classify the pixels into different classes. This approach allows for the quantitative analysis of data from remote sensing images, providing valuable information for various applications such as land use and land cover mapping, urban planning, and natural resource management. Popular cutting-edge semantic segmentation algorithms are divided into encoder-decoder based frameworks [25], and pooling-based architectures [26]. Encoder-decoder techniques in the first part leverage low-level information to construct a local contextual map that establishes crisp object boundaries.
Current state-of-the-art semantic segmentation algorithms can be broadly classified into two categories: encoder-decoder-based frameworks and pooling-based architectures. Popular cutting-edge semantic segmentation algorithms are divided into encoder-decoder-based frameworks [25], and pooling-based architectures [26]. Encoder-decoder techniques in the first part leverage low-level information to construct a local contextual map that establishes crisp object boundaries. Pooling-based approaches, such as DeepLabv3+ [26], UNet [27], and PSPNet [28], employ pyramid pooling procedures to produce feature maps rich in pertinent global information. Other superior approaches in recent years include self-attention-based techniques [29], which have demonstrated exceptional performance in segmentation by gathering superior global context dependencies. The authors of [30] developed a revolutionary flooded building segmentation approach based on merging three spectrums, dubbed the Multi3Net, using satellite images in a convolutional neural network. However, while their technique produces very accurate segmentation maps on medium-resolution datasets, it may not generalize well on substantially more detailed high-resolution datasets. Gupta et al. in [31] presented a RescueNet capable of segmenting buildings and analyzing the damage levels to individual structures. [32] demonstrated an integrated, highly linked neural network for segmenting out object boundaries when applied to UAV images for recognizing flooded regions. On the other hand, classification was one of the first schemes in the deep learning domain. Xu et al. [33] developed a Convolutional Neural Network (CNN) model that automatically recognizes damaged structures in satellite imagery by training and testing the models on various catastrophic situations, which might determine how well the models will generalize to future disasters. Chen [34] explores data-driven ways for estimating tornado damage utilizing Deep Neural Networks (DNN) and evaluating their performance in object detection and image classification. All studies performed well on relatively high assessment measures. The authors of [35] presented and tested a set of convolutional neural networks for identifying ground assets in the aftermath of a disaster. [36] presented a post-hurricane layered convolutional neural network. The model demonstrated a positive accuracy-confidence correlation, which is useful for model evaluation when ground-truth data is easily available.

2.2. Unsupervised and Semi-Supervised Approach

Unsupervised classification is a method that is used to group pixels in remote sensing images based on their spectral characteristics without prior knowledge about the classes. This approach utilizes algorithms to automatically discover patterns and structures in the data without the need for predefined classes, making it useful in a variety of applications such as land cover mapping, urban planning, and natural resource management. However, it is important to note that compared to supervised classification, the results of unsupervised classification may require further human analysis and interpretation to be useful. Change detection is a well-studied issue in various fields, and a variety of techniques have been developed to tackle it [34]. These include both supervised [35] and unsupervised [36] methods, depending on the predicted variation in the change and the cost of label acquisition. However, with the increasing availability of unlabeled data, there has been an increasing interest in developing semi-supervised learning approaches to improve the learning and labeling processes by including human input [37,38]. This methodology has also been tested on a broader scale, with crowds used for label generation [39]. Unsupervised learning techniques have also been utilized in satellite imagery, with the goal of locating outliers associated with scene changes [40,41,42]. While these techniques are good at catching general changes, they may not effectively identify specific features. One approach to addressing this issue is to employ local visual descriptors to improve data robustness [42]. However, scaling up this approach may be difficult in situations where label acquisition is costly.
Recent advancements in deep learning techniques have led to a significant increase in their utilization for remote sensing image analysis. These techniques have been shown to be particularly effective in handling large-scale datasets and in applications such as land cover mapping, object detection, and change detection. Commonly employed deep learning architectures for remote sensing image analysis include fully convolutional networks (FCN), U-Net, SegNet, among others [43,44]. Fully convolutional networks (FCNs) are a subclass of convolutional neural networks (CNNs) that have been specifically designed to work with dense image predictions. The U-Net and SegNet architectures are also commonly employed for semantic segmentation and have been observed to be effective in handling small, irregularly-shaped objects in images. When it comes to remote sensing image analysis, there are various techniques and approaches that can be utilized, each with its own advantages and limitations. The selection of the appropriate technique will depend on the specific application, the type and availability of data, and the goals of the analysis. For instance, if the objective is to classify an image into different land cover classes, a traditional machine learning approach such as Random Forest may be sufficient, whereas if the objective is to detect and segment small, irregularly-shaped objects, a deep learning approach such as U-Net would be more suitable.
In summary, the utilization of deep learning techniques for remote sensing image analysis has been demonstrated to be highly effective for a wide range of applications. These techniques have been shown to be particularly beneficial in handling large-scale datasets and in applications such as land cover mapping, object detection, and change detection. However, the selection of the appropriate technique will depend on the specific application, the type and availability of data, and the goals of the analysis.

3. Base Models

In this section, we present an overview of the state-of-the-art methods that were utilized as the foundation for the classification of the Floodnet dataset. These methods were carefully selected and evaluated based on their performance and ability to accurately classify the data within the dataset. The use of these state-of-the-art techniques ensures that the results obtained from the classification of the Floodnet dataset are of the highest caliber and accuracy.

3.1. ResNet-18

The depth of a neural network plays a crucial role in its performance, however, as the depth increases, there can be a concern of degradation caused by the vanishing gradient problem [45]. This issue is distinct from overfitting and results from the loss of small details in feature maps at high-level layers. To address this challenge, He et al. proposed the ResNet-18, a deep residual network architecture with 18 layers that enhances the efficiency of training convolutional neural networks. This approach won first prize in ILSVR2015. The ResNet-18 is able to learn rich feature representations for a wide range of images, and the use of skip connection blocks optimizes the entire network, resulting in improved model accuracy. Instead of traditional monotonically progressive convolutions, the skip connections implement an equivalent mapping by adding parameters or increasing computational complexity.
The structural block in ResNet is described as follows:
u = F ( x , W i ) + x ,
where F ( x , W i ) is the residual network to be learned. x and u are distinct layers’ input and output characteristics. ResNet’s structural block includes 3 × 3 Conv layers, BN+Conv layers, and a ReLU activation function. The first layer outputs determine x, which goes through the middle layers (BN+Conv layers) for learning residual features F ( x ) as in Figure 1.

3.2. MobileNet

MobileNet is a novel layer module that is based on the inverted residual with a linear bottleneck architecture [46]. This module takes a low-dimensional, compressed representation as input and then enlarges it to a high dimension using a lightweight depthwise convolution. The filtered features are then projected back to a low-dimensional form through a linear convolution. Sandler et al. designed this network to address a current challenge in the field of neural networks: the high computational resources required by state-of-the-art networks that exceed the capabilities of many mobile and embedded applications. By combining the inverted residual with a linear bottleneck, MobileNet is optimized for mobile designs and significantly reduces the memory footprint during inference by partly materializing massive intermediate tensors. This allows the network to eliminate the need for primary memory access in many embedded hardware designs, including modest quantities of highly responsive software-controlled memory space.

3.3. Visual Geometry Group-16 (VGG-16)

VGG-16 is a convolutional neural network (ConvNet) that boasts a high architecture depth, resulting in a classification and object detection accuracy of 92.7 % . The model is composed of 16 layers with a total of 138 trainable parameters. The architecture of VGG-16 includes 13 convolutional layers, 5 max pooling layers, and 3 dense layers, totaling 21 layers. The model accepts input images with a resolution of 224 × 244 and 3 RGB channels, utilizing a (3 × 3) kernel-sized filter with a stride of 1. The architecture is characterized by the consistent use of 2 × 2 filter max pooling layers and convolution layers. The Conv-1 layer has 64 filters, Conv-2 has 128 filters, Conv-3 has 256 filters, and Conv-4 and Conv-5 have 512 filters.

3.4. EfficientNet

EfficientNet, proposed by Tan et al. [47] in their study, aims to revolutionize the process of scaling up convolutional neural networks (ConvNets). The authors present a simple yet effective compound scaling strategy that consistently scales the network width, depth, and resolution using a fixed set of scaling coefficients. As the input image size increases, the network needs more layers to expand the receptive field and more channels to capture more intricate patterns on the larger image. To mitigate the rapid saturation of accuracy, the authors propose utilizing all three scaling dimensions (width, depth, and resolution) rather than just one or two. The study provides a new perspective on the method of scaling up ConvNets, by incorporating three dimensions of scaling and using consistent scaling coefficients, the EfficientNet architecture can achieve better performance with fewer parameters.

3.5. Vision Transformer (ViT)

Transformers have become the preferred model for natural language processing (NLP) tasks, but convolutional architectures continue to dominate in computer vision tasks. In order to maintain the structure of convolutional networks, attention mechanisms are combined with these architectures. Dosovitskiy et al. in their study [48] attempted to apply a traditional transformer directly to images, drawing inspiration from the success of transformer scaling in NLP. Unlike CNNs, transformers lack certain empirical biases such as translation invariance and locally constrained receptive fields. Translation invariance refers to the ability of a model to recognize entities in an image even if their appearance or location changes. Translation, on the other hand, refers to the movement of an image pixel by a predetermined quantity in a certain direction, which is a characteristic of CNNs. Due to its permutation invariance, a traditional transformer cannot handle grid-structured data, which requires sequences. This led to the development of Vision Transformers (ViT), which can perform the functions of CNNs. To do this, an image is divided into patches, and the linear embeddings of these patches are fed into a traditional transformer encoder. The model is then pre-trained with image labels in a supervised fashion, and fine-tuned on a downstream dataset for image classification. This approach allows for the integration of the strengths of both transformer and CNN architectures, resulting in a model that can effectively handle image data while utilizing the attention mechanism of transformers.

3.6. ConvNeXt

In an effort to bridge the gap between traditional convolutional networks and more recent transformer-based architectures, Liu et al. [49] proposed the ConvNeXt architecture. This model was designed to be built entirely from common convolutional network components and was tested on a variety of computer vision tasks. The results of this study demonstrated that the ConvNeXt architecture performed better than transformer-based models in terms of accuracy, scalability, and robustness across all major benchmarks. Additionally, the ConvNeXt architecture retained the efficiency of traditional convolutional networks while maintaining the fully-convolutional nature of both training and testing, making it highly practical and easy to implement.

3.7. Regular Networks (RegNet)

The proposed RegNet architecture, introduced by Radosavovic et al. in their study [50], aims to improve the performance of visual recognition networks by exploring the design space of network architectures. The authors focused on identifying general design principles that can be applied to a wide range of models, rather than developing a single, highly-tuned model for a specific task. To achieve this, they employed a sampling method to generate a distribution of models within the design space, and then used statistical techniques to analyze the design space. This approach is not intended to find the single best model within the design space, as is common in architectural search methods. Through a series of design phases, the study developed RegNet, a condensed design space composed solely of regular network architectures, which has been shown to be effective in various visual recognition tasks.

4. Experiment

This section outlines the technical details of the experimental setup, including the libraries and configurations utilized during the execution of the experimentation. The aim is to provide a clear and thorough understanding of the experimental setup for replication and further research.

4.1. FloodNet Dataset

The FloodNet dataset, as presented in [12], is composed of 2343 images of dimensions 3000 × 4000 × 3, with a distribution of 1445 images in the training set, 450 images in the validation set, and 448 images in the test set. Among the 1445 training images, 398 are labeled with the class labels of Flooded and Non-Flooded, while the remaining 1047 images are unlabeled. The task at hand is to develop a classification model that can accurately distinguish between the two classes, as depicted in Figure 2. Our approach for tackling this task involves utilizing state-of-the-art convolutional neural networks (CNNs) architectures and training them on the labeled dataset, followed by fine-tuning on the entire dataset to exploit the additional information present in the unlabeled images. Furthermore, data augmentation techniques are utilized to increase the diversity of the training dataset and prevent overfitting.

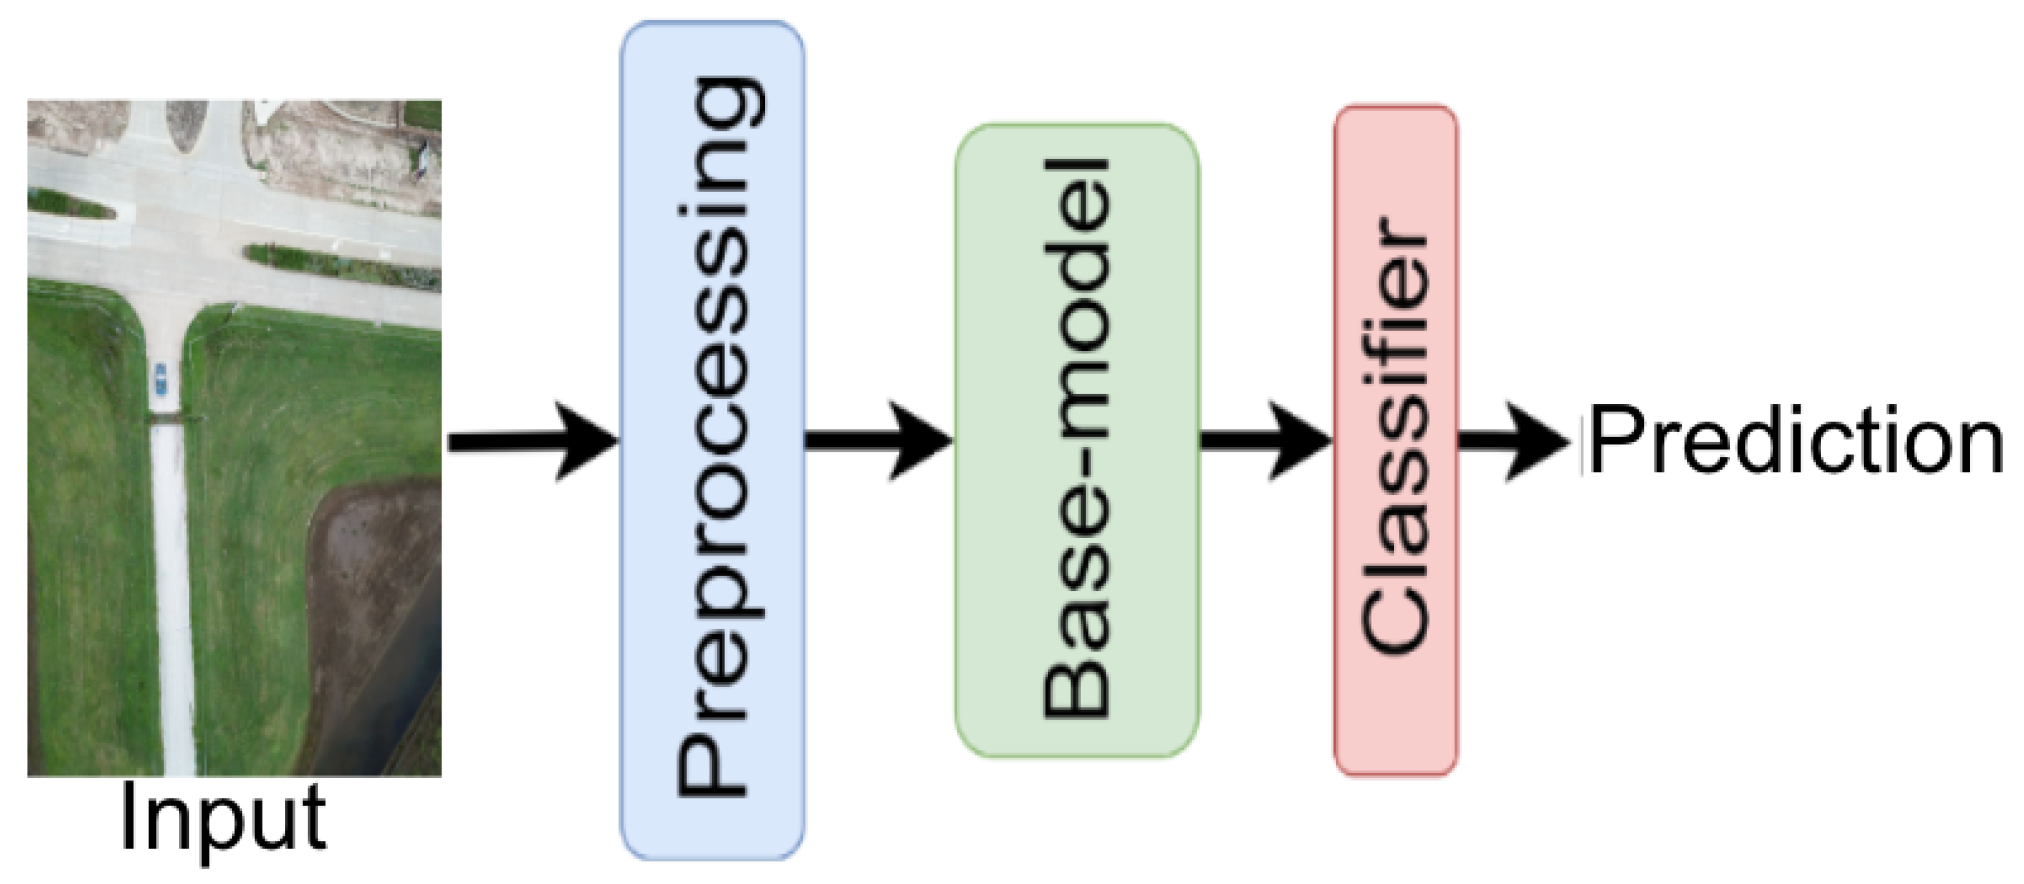
4.2. Dataset Preprocessing

The FloodNet dataset [12] comprises of 2343 images, with dimensions of 3000 × 4000 × 3, which are divided into three splits: training (1445 images), validation (450 images), and test (448 images). Out of the 1445 training images, 398 images were labeled, with 51 of them being flooded and 347 being non-flooded. The large class imbalance in the labeled dataset presents a challenge for the model to achieve a good F1 score. To address this issue, we implemented a weighted sampling strategy during data loading to ensure equal class representation during batch generation. No additional data augmentation techniques were applied. To make the images compatible with state-of-the-art computer vision models, each image was downsized to 224 × 224 × 3 dimensions.

4.3. Semi-Supervised Training

In this section, we delve into the intricacies of the semi-supervised training approach outlined in Algorithm 1 and depicted in Figure 3. The model was trained over a total of E epochs, with only the labeled samples being utilized during the initial E i a epochs. Once this phase was complete, pseudo labels were added to the training set in order to further fine-tune the model. To implement this, we employed a modified form of the Binary Cross-Entropy (BCE) loss function, as depicted in Algorithm 1. This loss function takes into account the predicted class for labeled samples ( l ^ ) as well as the predicted class for unlabeled samples in the current epoch ( U e p o c h ), and is optimized using the Adam optimizer with a learning rate of 0.0001. An interesting aspect of this approach is the incorporation of an uncertainty offset, represented by the parameter λ . As illustrated in Figure 4, this allows for a soft margin around the class boundary, effectively eliminating samples whose class probabilities are close to the boundary (indicating uncertainty) during the prediction process. Only samples whose probabilities fall outside of this margin (as represented by the blue and green circles in Figure 3) are included in the next training round. In summary, the semi-supervised training algorithm outlined in Algorithm 1 and depicted in Figure 3 is a novel approach that utilizes three different models: the Base-model, the Classifier, and the Discriminator. The Base-model serves as a pretrained model that extracts features from the input images, while the Classifier and Discriminator are used to predict class labels and estimate the likelihood of the images being real or generated, respectively. By incorporating the uncertainty offset, we are able to effectively assign unlabeled samples to their corresponding classes and fine-tune the model in an iterative process, resulting in improved performance of the overall system.
Algorithm 1: Semi-supervised training procedure
Water 15 00875 i001

4.4. Implementation Details

This work was implemented with PyTorch library and executed with NVIDIA GeForce RTX 2080 Ti NVIDIA. The models were trained with the Adam optimizer with a learning rate of 0.0001. The models were trained with a batch size of 16 and for 50 epochs. The pre-trained weights of the state-of-the-art models were used for fine-tuning the final model. a i and a f are set as 0 and 1, respectively. E i a and E f a are set as 20 and 40, respectively.

4.5. Results

In our experimentation, we explored the impact of different uncertainty offset values, represented by λ , on the performance of our model. We found that setting λ to 0.2 resulted in the best performance, as seen in Table 1. This particular value of λ allowed the model to effectively balance the trade-off between exploiting the labeled data and exploring the unlabeled data. To further understand the effect of this parameter, we conducted a series of experiments with different values of λ . We found that when λ is set to a low value, the model heavily relies on the labeled data, resulting in a suboptimal performance due to the class imbalance present in the dataset. On the other hand, when λ is set to a high value, the model heavily relies on unlabeled data, which can lead to poor generalization and overfitting. In this experiment, the ResNet-18 architecture was used as the base model. This allowed us to effectively evaluate the impact of different λ values on the performance of the model. The results obtained from this experimentation provided insights into how the uncertainty offset parameter can be used to improve the performance of semi-supervised learning models.
The F1 score is a measure of a model’s performance that combines precision and recall. A high F1 score indicates that the model has a good balance between precision and recall. A high precision indicates that the model has a low false positive rate, while a high recall indicates that the model has a low false negative rate. The ROC-AUC (Receiver Operating Characteristic - Area Under the Curve) metric is used to evaluate the performance of a binary classifier. A ROC-AUC score of 1 indicates that the model is perfect, while a score of 0.5 indicates that the model is no better than a random classifier. From the results in Table 2, it is clear that the ResNet-18 model performed the best, with an accuracy of 98.6 % , F1 score of 94.9 % , precision of 91.6 % , recall of 100 % , and ROC-AUC of 99.25. MobileNet V2, RegNet-8, RegNet-16, and VGG-16 also obtained high precision and recall rates, but overall ResNet-18 performed better. The ConvNeXt-base model performed well in terms of precision but had lower accuracy, F1 score, recall, and ROC-AUC than ResNet-18. ResNet-18 obtained the best results compared to the other models due to its architecture. ResNet-18 is a variation of the ResNet architecture that is characterized by its deep layers and residual connections. These properties allow the model to effectively learn and extract features from the input data, leading to better performance on the classification task. Additionally, the use of weighted sampling in the data loading process helped to balance the class imbalance, further contributing to the model’s high performance. Furthermore, the use of different uncertainty offset values showed that setting λ = 0.2 was more beneficial, therefore it was used to train the ResNet-18 model. All of these factors combined led to the ResNet-18 model achieving the highest scores in all evaluation metrics, including loss, accuracy, F1 score, precision, recall, and ROC-AUC.

5. Conclusions

In conclusion, we proposed a method for classifying images in the FloodNet dataset into “flooded” and “non-flooded” classes by using a manual annotation approach and a weighted sampling strategy to handle class imbalance. We also experimented with different uncertainty offset values and various state-of-the-art computer vision models, such as ResNet-18, VGG-16, MobileNet V2, RegNet-8, RegNet-16, and ConvNeXt-base. Our results showed that ResNet-18 performed the best overall, achieving the highest accuracy, F1 score, precision, and ROC-AUC. The VGG-16 also obtained great results in precision and recall. The MobileNet V2, RegNet-8, and RegNet-16 obtained a Recall of 100, and ConvNeXt-base obtained a precision of 100. From these results, it can be concluded that the ResNet-18 model is highly suitable for the FloodNet dataset, and can be used as a reliable model for classifying images of flood-affected areas. In future work, we will apply domain adaptation methods to more datasets across different locations to further validate our findings.

Author Contributions

Conceptualization, J.J.; Coding, J.J. and S.B.Y.; formal analysis, S.B.Y.; writing—original draft preparation, S.B.Y. and K.S.; writing—review and editing, R.A.P. and J.J; visualization, J.J.; supervision, Z.Q. All authors have read and agreed to the published version of the manuscript.

Funding

This work was supported in part by the National Natural Science Foundation of China Major Instrument Project Number: 62027827; Name: Development of Heart-Sound Cardio-Ultrasonic Multimodal Auxiliary Di- agnostic Equipment for Fetal Hear.

Institutional Review Board Statement

Not applicable.

Informed Consent Statement

Not applicable.

Data Availability Statement

Not applicable.

Conflicts of Interest

The authors declare no conflict of interest.

References

  1. Center, A. Natural Disaster Data Book (An Analytical Overview); Asian Disaster Reduction Center: Kobe, Japan, 2011. [Google Scholar]
  2. Amankwah, S.; Wang, G.; Gnyawali, K.; Hagan, D.; Sarfo, I.; Zhen, D.; Nooni, I.; Ullah, W.; Duan, Z. Landslide detection from bitemporal satellite imagery using attention-based deep neural networks. Landslides 2022, 19, 2459–2471. [Google Scholar] [CrossRef]
  3. Jang, Y.; Kang, H.; Kim, H.; Lee, I. Deep Learning-based Damage Assessment of Buildings after Natural Disasters Using Multi-Modal Data. Remote Sens. 2020, 12, 616. [Google Scholar]
  4. Kamilaris, A.; Ioannides, M. Landslide detection in satellite imagery using convolutional neural networks. ISPRS J. Photogramm. Remote Sens. 2018, 142, 1–15. [Google Scholar]
  5. Shen, Y.; Liu, X.; Chen, Y. Automatic detection of landslides from remote sensing images using deep convolutional neural networks. Int. J. Appl. Earth Obs. Geoinf. 2018, 66, 1–11. [Google Scholar]
  6. Li, Y.; Chen, Y. A convolutional neural network-based approach for segmenting damaged buildings and roads in overhead imagery captured after natural disasters. Remote Sens. 2019, 11, 60. [Google Scholar]
  7. Chen, J.; Liu, Y.; Guo, Y. Automatic building damage detection from post-disaster optical imagery using deep convolutional neural networks. Remote Sens. 2019, 11, 136. [Google Scholar]
  8. Ghasemian, N.; Wang, J.; Najafi, M. Building detection using a dense attention network from LiDAR and image data. Geomatica 2021, 75, 209–236. [Google Scholar] [CrossRef]
  9. Li, Y.; Chen, Y. A deep-learning-based approach for automatically detecting flooded areas in satellite imagery using convolutional neural networks. Remote Sens. 2018, 10, 568. [Google Scholar]
  10. Hedayatnia, B.; Yazdani, M.; Nguyen, M.; Block, J.; Altintas, I. Determining feature extractors for unsupervised learning on satellite images. In Proceedings of the 2016 IEEE International Conference On Big Data (Big Data), Washington, DC, USA, 5–8 December 2016; pp. 2655–2663. [Google Scholar]
  11. Vaduva, C.; Costachioiu, T.; Patrascu, C.; Gavat, I.; Lazarescu, V.; Datcu, M. A latent analysis of earth surface dynamic evolution using change map time series. IEEE Trans. Geosci. Remote Sens. 2012, 51, 2105–2118. [Google Scholar] [CrossRef]
  12. Rahnemoonfar, M.; Chowdhury, T.; Sarkar, A.; Varshney, D.; Yari, M.; Murphy, R. Floodnet: A high resolution aerial imagery dataset for post-flood scene understanding. IEEE Access 2021, 9, 89644–89654. [Google Scholar] [CrossRef]
  13. Kadhim, M.; Abed, M. Convolutional neural network for satellite image classification. In Proceedings of the Asian Conference On Intelligent Information And Database Systems, Yogyakarta, Indonesia, 8–11 April 2019; pp. 165–178. [Google Scholar]
  14. Ghaffarian, S.; Kerle, N. Post-disaster recovery assessment using multi-temporal satellite images with a deep learning approach. In Proceedings of the 39th Annual EARSeL Conference & 43rd General Assembly, Salzburg, Austria, 1–4 July 2019. [Google Scholar]
  15. Zhu, X.; Liang, J.; Hauptmann, A. Msnet: A multilevel instance segmentation network for natural disaster damage assessment in aerial videos. In Proceedings of the IEEE/CVF Virtual Winter Conference on Applications of Computer Vision, Virtual, 5–9 January 2021; pp. 2023–2032. [Google Scholar]
  16. Gueguen, L.; Soille, P.; Pesaresi, M. Change detection based on information measure. IEEE Trans. Geosci. Remote Sens. 2011, 49, 4503–4515. [Google Scholar] [CrossRef]
  17. Gueguen, L.; Hamid, R. Large-scale damage detection using satellite imagery. In Proceedings of the IEEE Conference on Computer Vision and Pattern Recognition (CVPR), Boston, MA, USA, 7–12 June 2015; pp. 1321–1328. [Google Scholar]
  18. Algiriyage, N.; Prasanna, R.; Stock, K.; Doyle, E.E.H.; Johnston, D. Multi-source: Multimodal Data and Deep Learning for Disaster Response: A Systematic Review. Comput. Sci. 2022, 3, 181–189. [Google Scholar] [CrossRef] [PubMed]
  19. Abdi, G.; Esfandiari, M.; Jabari, S. A deep transfer learning-based damage assessment on post-event very high-resolution orthophotos. Geomatica 2022, 75, 237–250. [Google Scholar] [CrossRef]
  20. Nex, F.; Duarte, D.; Tonolo, F.G.; Kerle, N. Structural Building Damage Detection with Deep Learning: Assessment of a State-of-the-Art CNN in Operational Conditions. Remote Sens. 2019, 11, 2765. [Google Scholar] [CrossRef] [Green Version]
  21. Tang, X.; Tu, Z.; Wang, Y.; Liu, M.; Li, D.; Fan, X. Automatic Detection of Coseismic Landslides Using a New Transformer Method. Remote Sens. 2022, 14, 2884. [Google Scholar] [CrossRef]
  22. Wu, Q.; Feng, D.; Cao, C.; Zeng, X.; Feng, Z.; Wu, J.; Huang, Z. Improved Mask R-CNN for Aircraft Detection in Remote Sensing Images. Sensors 2021, 21, 2618. [Google Scholar] [CrossRef] [PubMed]
  23. Nemni, E.; Bullock, J.; Belabbes, S.; Bromley, L. Fully Convolutional Neural Network for Rapid Flood Segmentation in Synthetic Aperture Radar Imagery. Remote Sens. 2020, 12, 2532. [Google Scholar] [CrossRef]
  24. Ayala, C.; Sesma, R.; Aranda, C.; Galar, M. A Deep Learning Approach to an Enhanced Building Footprint and Road Detection in High-Resolution Satellite Imagery. Remote Sens. 2021, 13, 3135. [Google Scholar] [CrossRef]
  25. Paszke, A.; Chaurasia, A.; Kim, S.; Culurciello, E. Enet: A deep neural network architecture for real-time semantic segmentation. arXiv 2016, arXiv:1606.02147. [Google Scholar]
  26. Chen, L.; Zhu, Y.; Papreou, G.; Schroff, F.; Adam, H. Encoder-decoder with atrous separable convolution for semantic image segmentation. In Proceedings of the European Conference on Computer Vision (ECCV), Munich, Germany, 8–14 September 2018; pp. 801–818. [Google Scholar]
  27. Ronneberger, O.; Fischer, P.; Brox, T. U-net: Convolutional networks for biomedical image segmentation. In Proceedings of the International Conference on Medical Image Computing and Computer-Assisted Intervention, Munich, Germany, 5–9 October 2015; pp. 234–241. [Google Scholar]
  28. Zhao, H.; Shi, J.; Qi, X.; Wang, X.; Jia, J. Pyramid scene parsing network. In Proceedings of the IEEE Conference On Computer Vision And Pattern Recognition, Honolulu, HI, USA, 21–26 July 2017; pp. 2881–2890. [Google Scholar]
  29. Chowdhury, T.; Rahnemoonfar, M. Self Attention Based Semantic Segmentation on a Natural Disaster Dataset. In Proceedings of the 2021 IEEE International Conference On Image Processing (ICIP), Anchorage, AK, USA, 19–22 September 2021; pp. 2798–2802. [Google Scholar]
  30. Rudner, T.; Rußwurm, M.; Fil, J.; Pelich, R.; Bischke, B.; Kopačková, V.; Biliński, P. Multi3Net: Segmenting flooded buildings via fusion of multiresolution, multisensor, and multitemporal satellite imagery. In Proceedings of the AAAI Conference on Artificial Intelligence, Honolulu, HI, USA, 27 January–1 February 2019; Volume 33, pp. 702–709. [Google Scholar]
  31. Gupta, R.; Shah, M. Rescuenet: Joint building segmentation and damage assessment from satellite imagery. In Proceedings of the 2020 25th International Conference On Pattern Recognition (ICPR), Milan, Italy, 10–15 January 2021; pp. 4405–4411. [Google Scholar]
  32. Rahnemoonfar, M.; Murphy, R.; Miquel, M.; Dobbs, D.; Adams, A. Flooded area detection from UAV images based on densely connected recurrent neural networks. In Proceedings of the IGARSS 2018-2018 IEEE International Geoscience And Remote Sensing Symposium, Valencia, Spain, 22–27 July 2018; pp. 1788–1791. [Google Scholar]
  33. Xu, J.; Lu, W.; Li, Z.; Khaitan, P.; Zaytseva, V. Building damage detection in satellite imagery using convolutional neural networks. arXiv 2019, arXiv:1910.06444. [Google Scholar]
  34. Chen, Z.; Wagner, M.; Das, J.; Doe, R.; Cerveny, R. Data-driven approaches for tornado damage estimation with unpiloted aerial systems. Remote Sens. 2021, 13, 1669. [Google Scholar] [CrossRef]
  35. Pi, Y.; Nath, N.; Behzadan, A. Convolutional neural networks for object detection in aerial imagery for disaster response and recovery. Adv. Eng. Inform. 2020, 43, 101009. [Google Scholar] [CrossRef]
  36. Cheng, C.; Behzadan, A.; Noshadravan, A. Deep learning for post-hurricane aerial damage assessment of buildings. Comput.-Aided Civ. Infrastruct. Eng. 2021, 36, 695–710. [Google Scholar] [CrossRef]
  37. Markou, M.; Singh, S. Novelty detection: A review—Part 1: Statistical approaches. Signal Process. 2003, 83, 2481–2497. [Google Scholar] [CrossRef]
  38. Liu, Z.; Mercier, G.; Dezert, J.; Pan, Q. Change detection in heterogeneous remote sensing images based on multidimensional evidential reasoning. IEEE Geosci. Remote Sens. Lett. 2013, 11, 168–172. [Google Scholar] [CrossRef]
  39. Li, F.; Runger, G.; Tuv, E. Supervised learning for change-point detection. Int. J. Prod. Res. 2006, 44, 2853–2868. [Google Scholar] [CrossRef]
  40. Li, Y.; Hu, W.; Li, H.; Dong, H.; Zhang, B.; Tian, Q. Aligning discriminative and representative features: An unsupervised domain adaptation method for building damage assessment. IEEE Trans. Image Process. 2020, 29, 6110–6122. [Google Scholar] [CrossRef]
  41. Daniel, T.; Kurutach, T.; Tamar, A. Deep variational semi-supervised novelty detection. arXiv 2019, arXiv:1911.04971. [Google Scholar]
  42. Vijayanarasimhan, S.; Grauman, K. Large-scale live active learning: Training object detectors with crawled data and crowds. Int. J. Comput. Vis. 2014, 108, 97–114. [Google Scholar] [CrossRef] [Green Version]
  43. Chen, L.C.; Peng, Y.; Tu, Z.W. Deep learning for remote sensing data: A comprehensive review and list of resources. IEEE Geosci. Remote Sens. Mag. 2016, 4, 6–36. [Google Scholar]
  44. Volpi, M.; Alparone, L. Deep learning for remote sensing data classification: A review. IEEE J. Sel. Top. Appl. Earth Obs. Remote Sens. 2019, 12, 1266–1282. [Google Scholar]
  45. Sandler, M.; Howard, A.G.; Zhu, M.; Zhmoginov, A.; Chen, L. MobileNetV2: Inverted Residuals and Linear Bottlenecks. In Proceedings of the IEEE/CVF Conference on Computer Vision and Pattern Recognition, Salt Lake City, UT, USA, 18–22 June 2018; pp. 4510–4520. [Google Scholar]
  46. He, K.; Zhang, X.; Ren, S.; Sun, J. Deep residual learning for image. In Proceedings of the IEEE Conference on Computer Vision and Pattern Recognition, Las Vegas, NV, USA, 27–30 June 2016; pp. 770–778. [Google Scholar]
  47. Tan, M.; Le, Q.V. EfficientNet: Rethinking Model Scaling for Convolutional Neural Networks. arXiv 2019, arXiv:1905.11946. [Google Scholar]
  48. Dosovitskiy, A.; Beyer, L.; Kolesnikov, A.; Weissenborn, D.; Zhai, X.; Unterthiner, T.; Dehghani, M.; Minderer, M.; Heigold, G.; Gelly, S.; et al. An Image is Worth 16 × 16 Words: Transformers for Image Recognition at Scale. arXiv 2021, arXiv:2010.11929. [Google Scholar]
  49. Liu, Z.; Mao, H.; Wu, C.; Feichtenhofer, C.; Darrell, T.; Xie, S. A ConvNet for the 2020s. In Proceedings of the IEEE/CVF Conference on Computer Vision and Pattern Recognition (CVPR), New Orleans, LA, USA, 18–24 June 2022; pp. 11966–11976. [Google Scholar]
  50. Radosavovic, I.; Kosaraju, R.; Girshick, R.B.; He, K.; Dollár, P. Designing Network Design Spaces. In Proceedings of the IEEE/CVF Conference on Computer Vision and Pattern Recognition (CVPR), Seattle, WA, USA, 14–19 June 2020; pp. 10425–10433. [Google Scholar]
Figure 1. Residual network.
Water 15 00875 g001
Figure 2. Sample images from FloodNet dataset: (a) Flooded Images (b) Non-flooded.
Water 15 00875 g002
Figure 3. The general workflow for the classification task.
Water 15 00875 g003
Figure 4. Representations of different uncertainty offsets for assigning unlabeled samples to class 0 or 1 based on the class probability generated by the trained model: (a) Uncertainty offset is 0, (b) Uncertainty offset is 0.1, and (c) Uncertainty offset is 0.3. The Blue circles represent samples belonging to Class 0, Green circles denote samples labelled as Class 1, and Grey circles are the ignored training samples.
Water 15 00875 g004
Table 1. Experimental results for different uncertainty offsets of the ResNet-18 model on the dataset.
Uncertainty OffsetLossAccuracyF1 ScorePrecisionRecallROC-AUC
00.06998.68494.82891.66710098.875
0.10.07498.24693.10310010098.875
0.20.05698.68494.91591.66710099.25
0.30.06698.24693.10391.83710098.875
0.40.07598.68494.91592.10510099.25
Table 2. Results of the different state-of-the-art models on the dataset for different metrics.
Base-ModelLossAccuracyF1 ScorePrecisionRecallROC-AUC
ResNet-180.05698.68494.91591.66710099.254
VGG-160.09697.36890.21410010098.251
ShuffleNet V20.18694.73777.35882.34291.07190.411
MobileNet V20.18595.17580.64586.66710092.554
EfficientNet-B00.10895.83384.55395.12294.64394.571
EfficientNet-B30.09996.9387.93189.1396.42995.821
RegNet-80.09996.71187.17985.18510096.625
RegNet-160.11597.36890.32388.88910098.523
Vision Transformer-160.10396.93188.33388.67994.64395.946
Vision Transformer-320.13795.17582.25886.11110093.411
ConvNeXt-smal0.20093.64277.86377.77810092.536
ConvNeXt-base0.20492.76373.28210098.21494.107
Disclaimer/Publisher’s Note: The statements, opinions and data contained in all publications are solely those of the individual author(s) and contributor(s) and not of MDPI and/or the editor(s). MDPI and/or the editor(s) disclaim responsibility for any injury to people or property resulting from any ideas, methods, instructions or products referred to in the content.

