
The Interaction of Aeolian Sand and Slope on Runoff and Soil Loss on a Loess Slope via Simulated Rainfall under Laboratory Conditions
 ,
,
Abstract
:1. Introduction
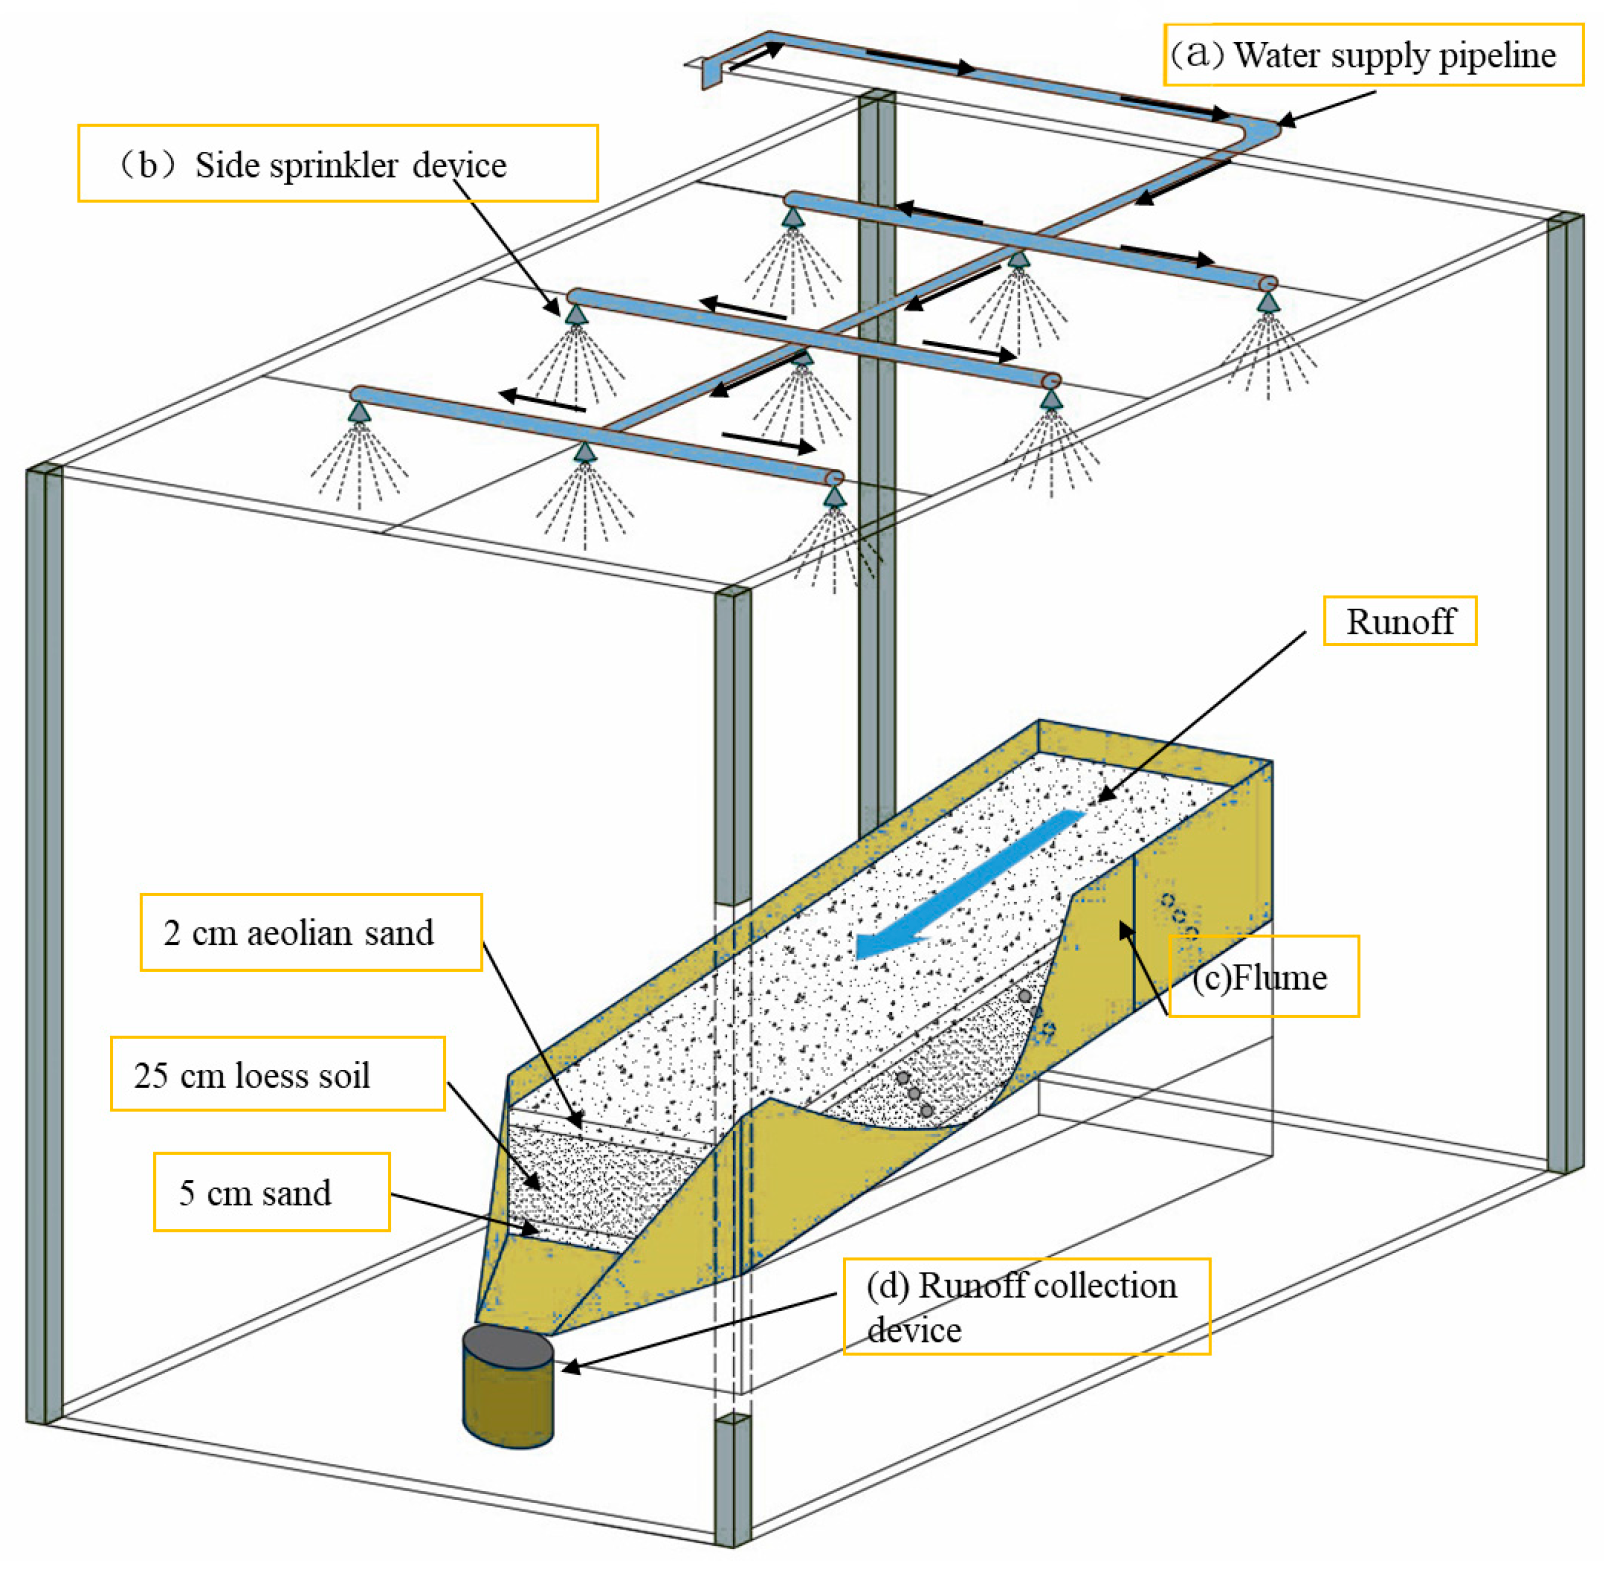
2. Materials and Methods
2.1. Materials
2.2. Data Processing
3. Results and Discussion
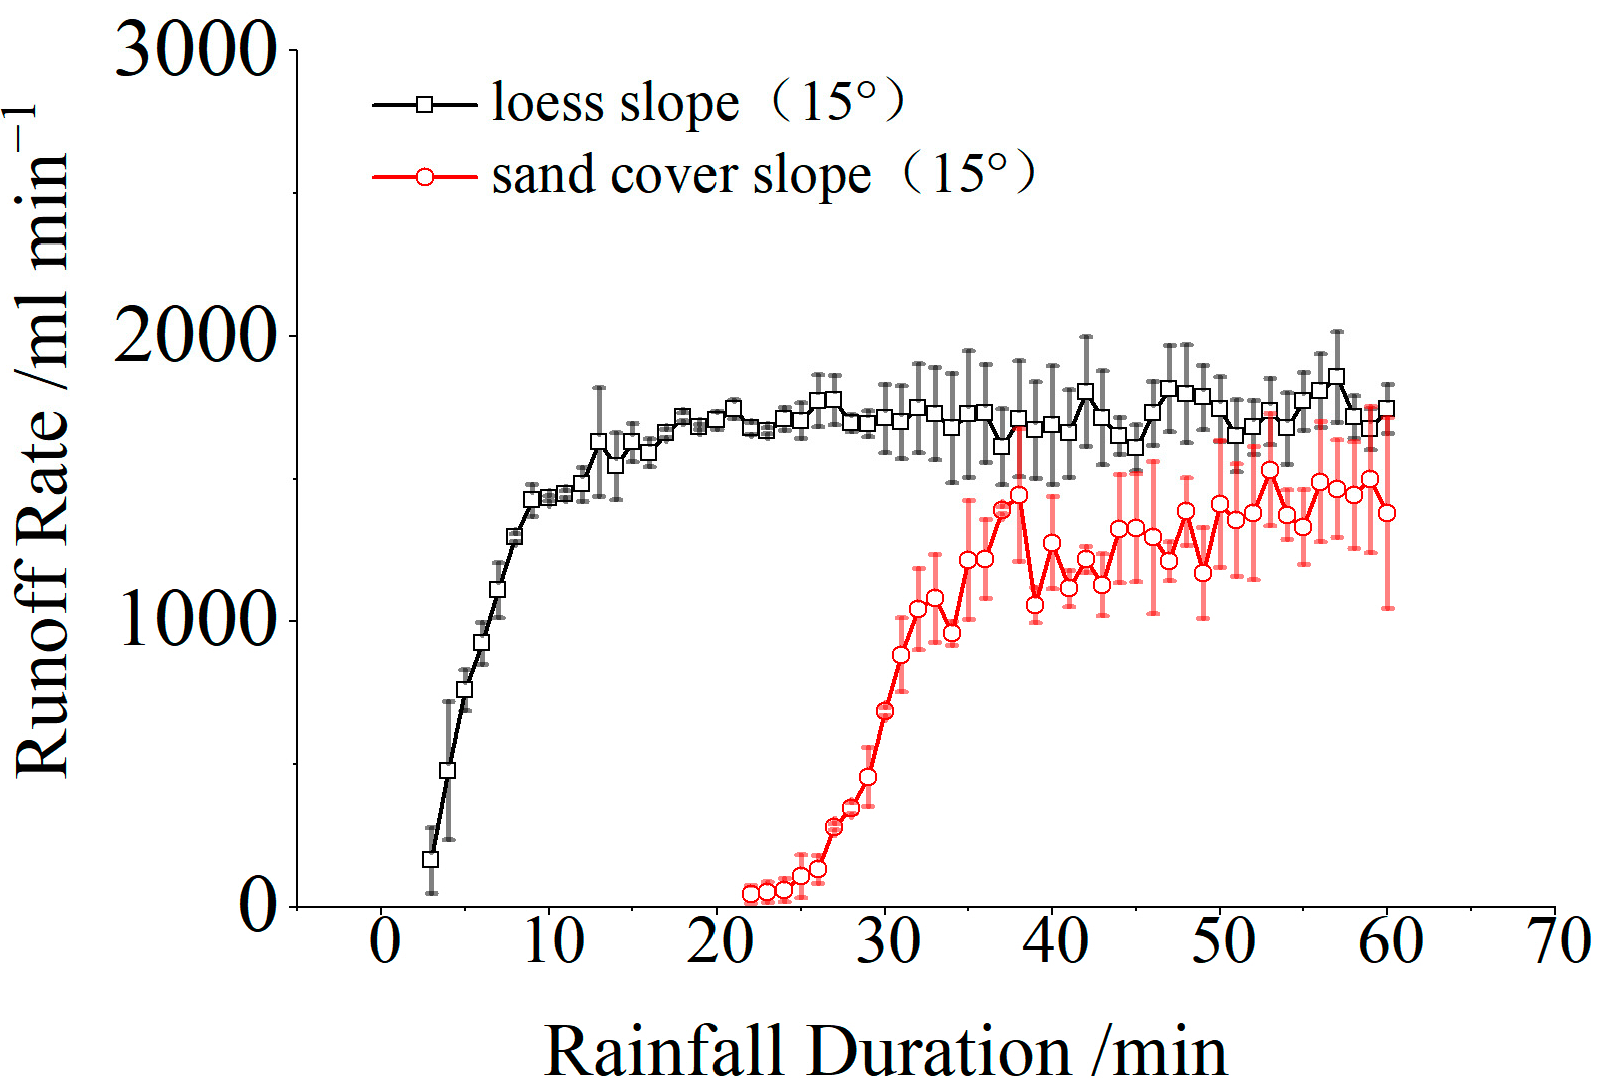
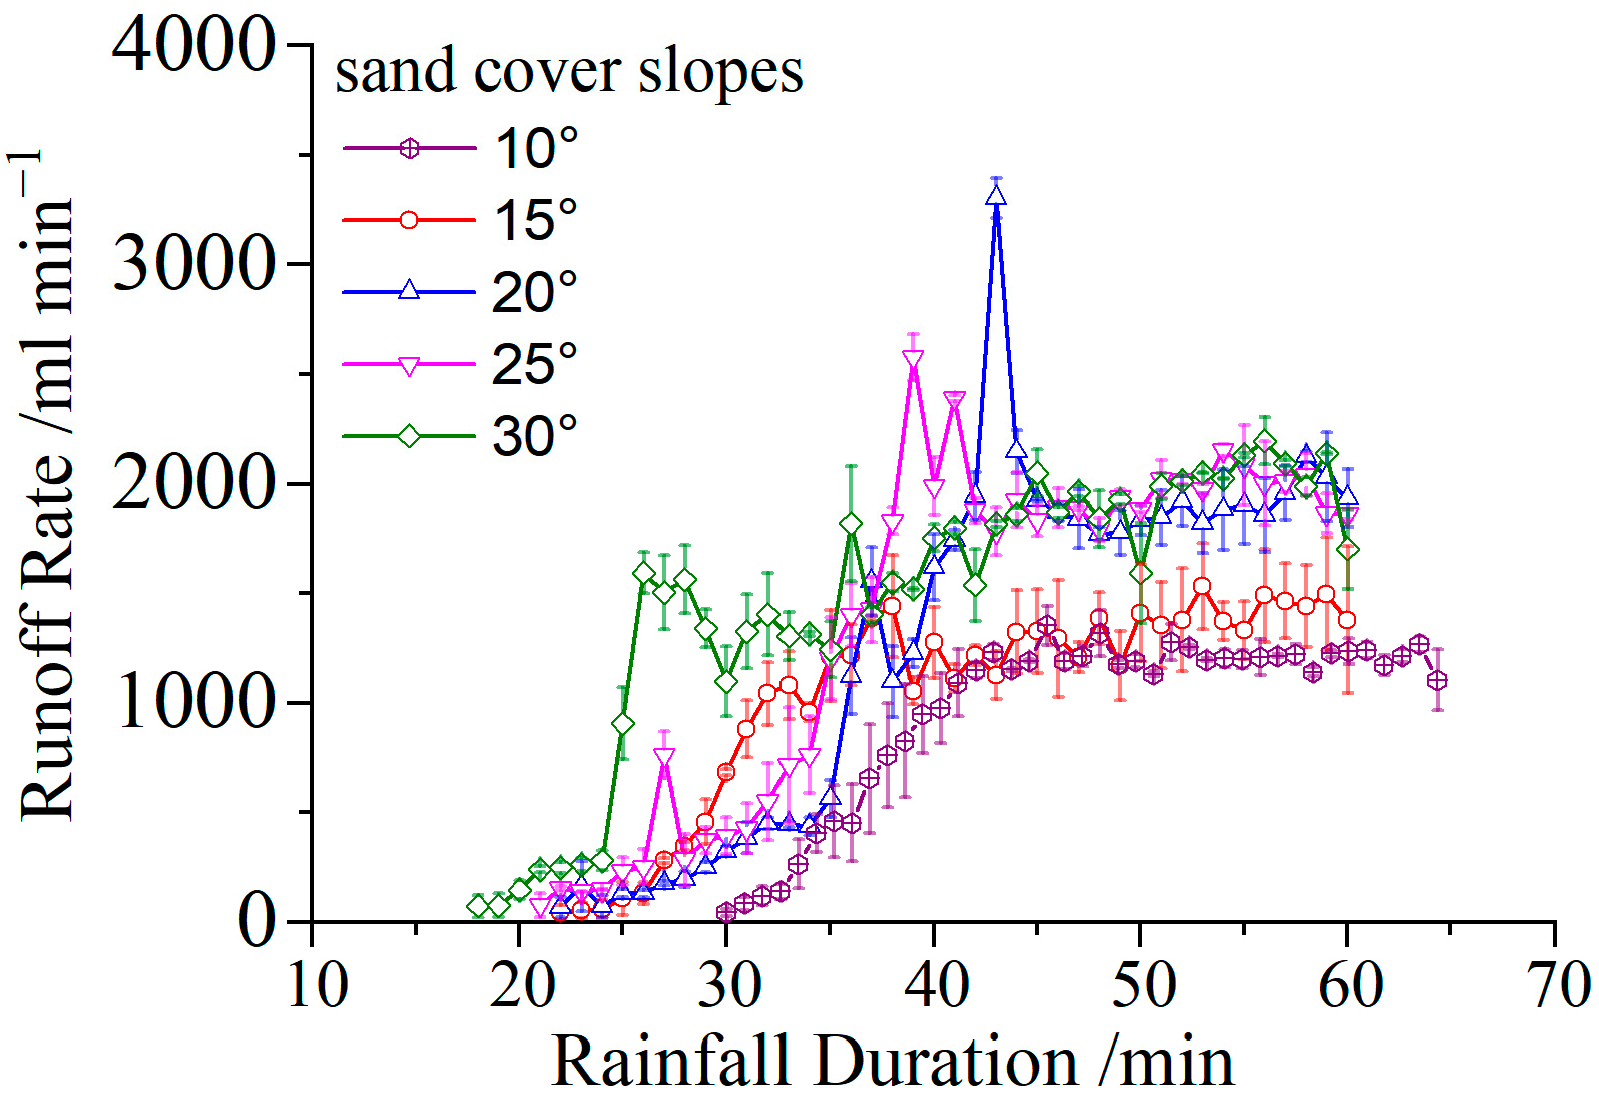
3.1. Runoff
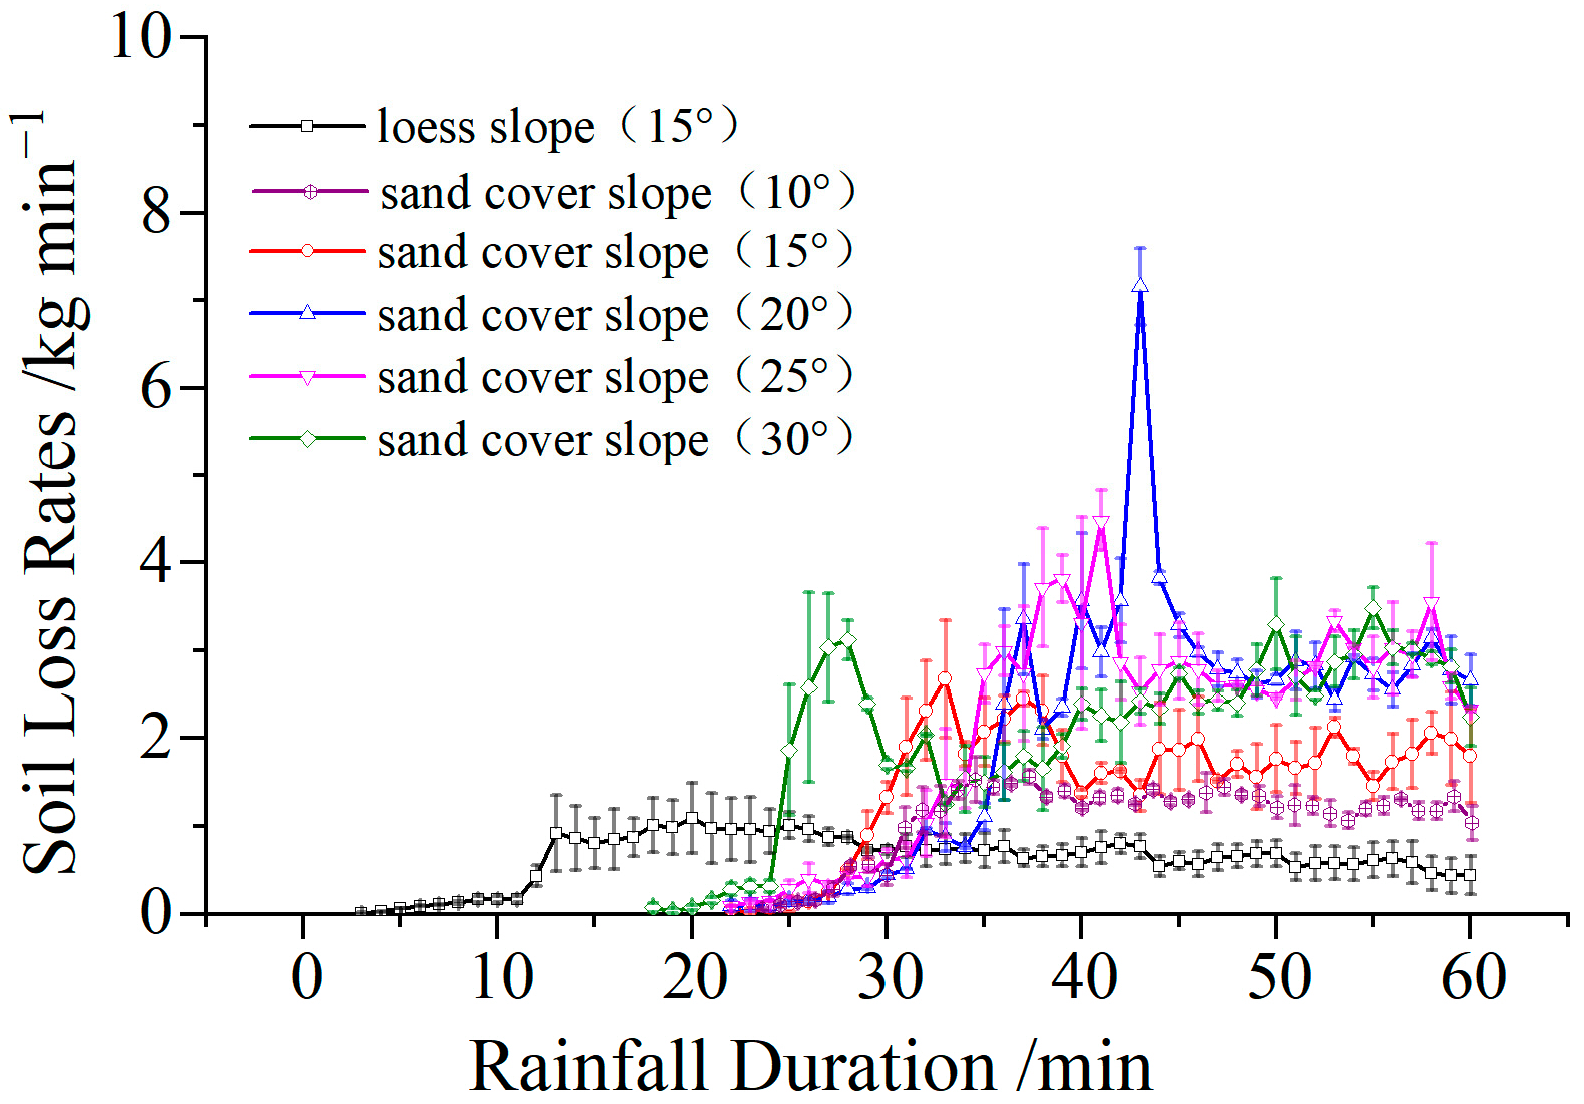
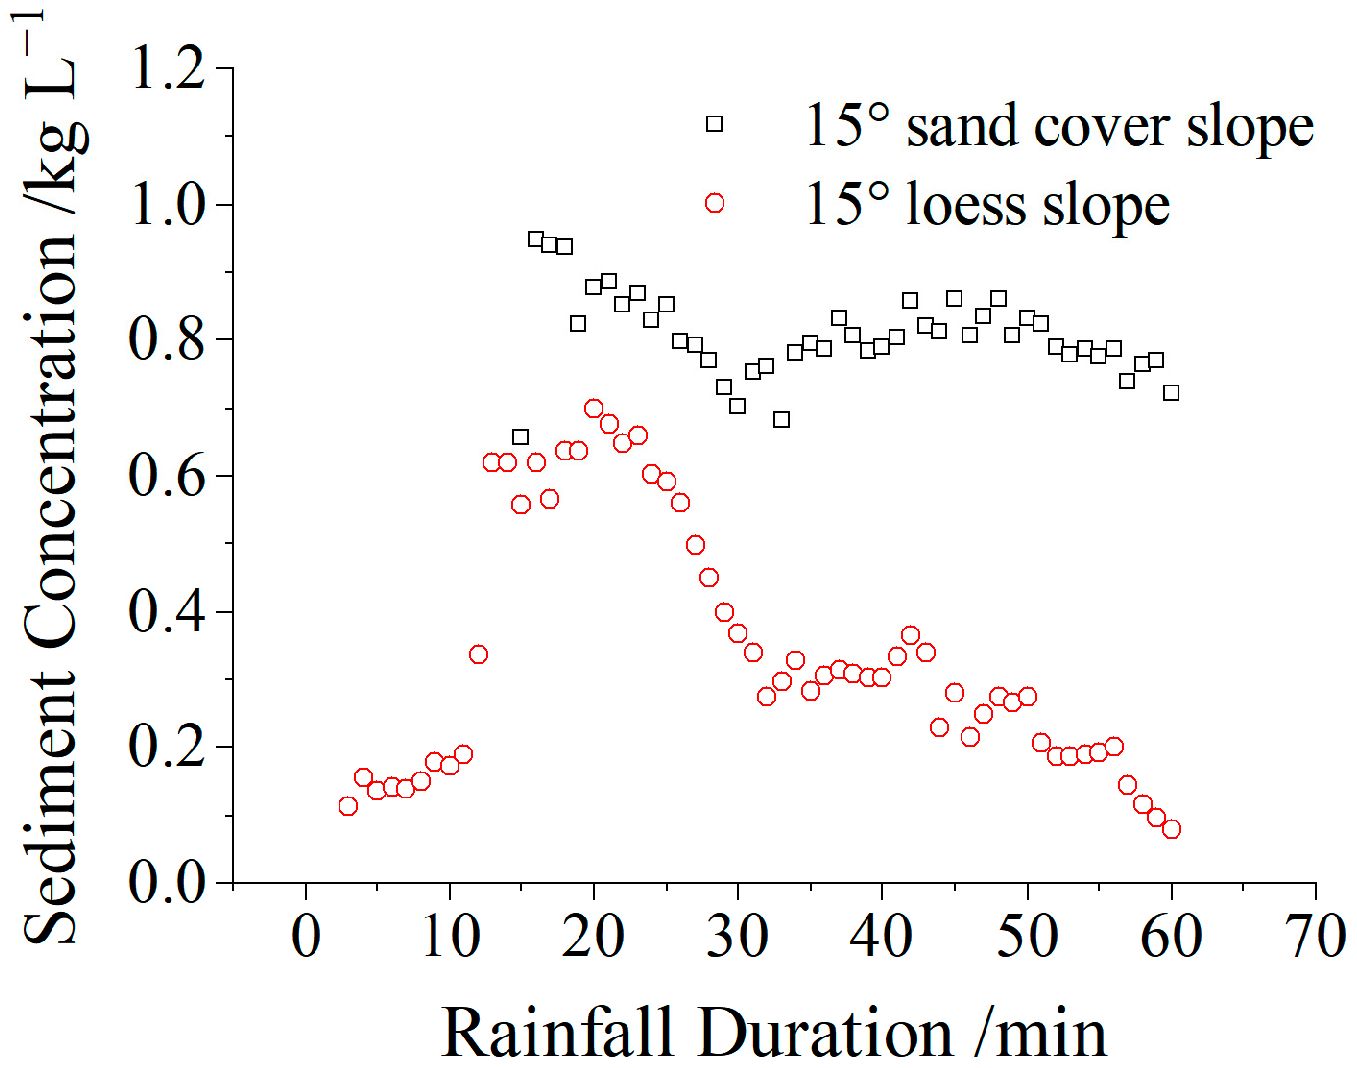
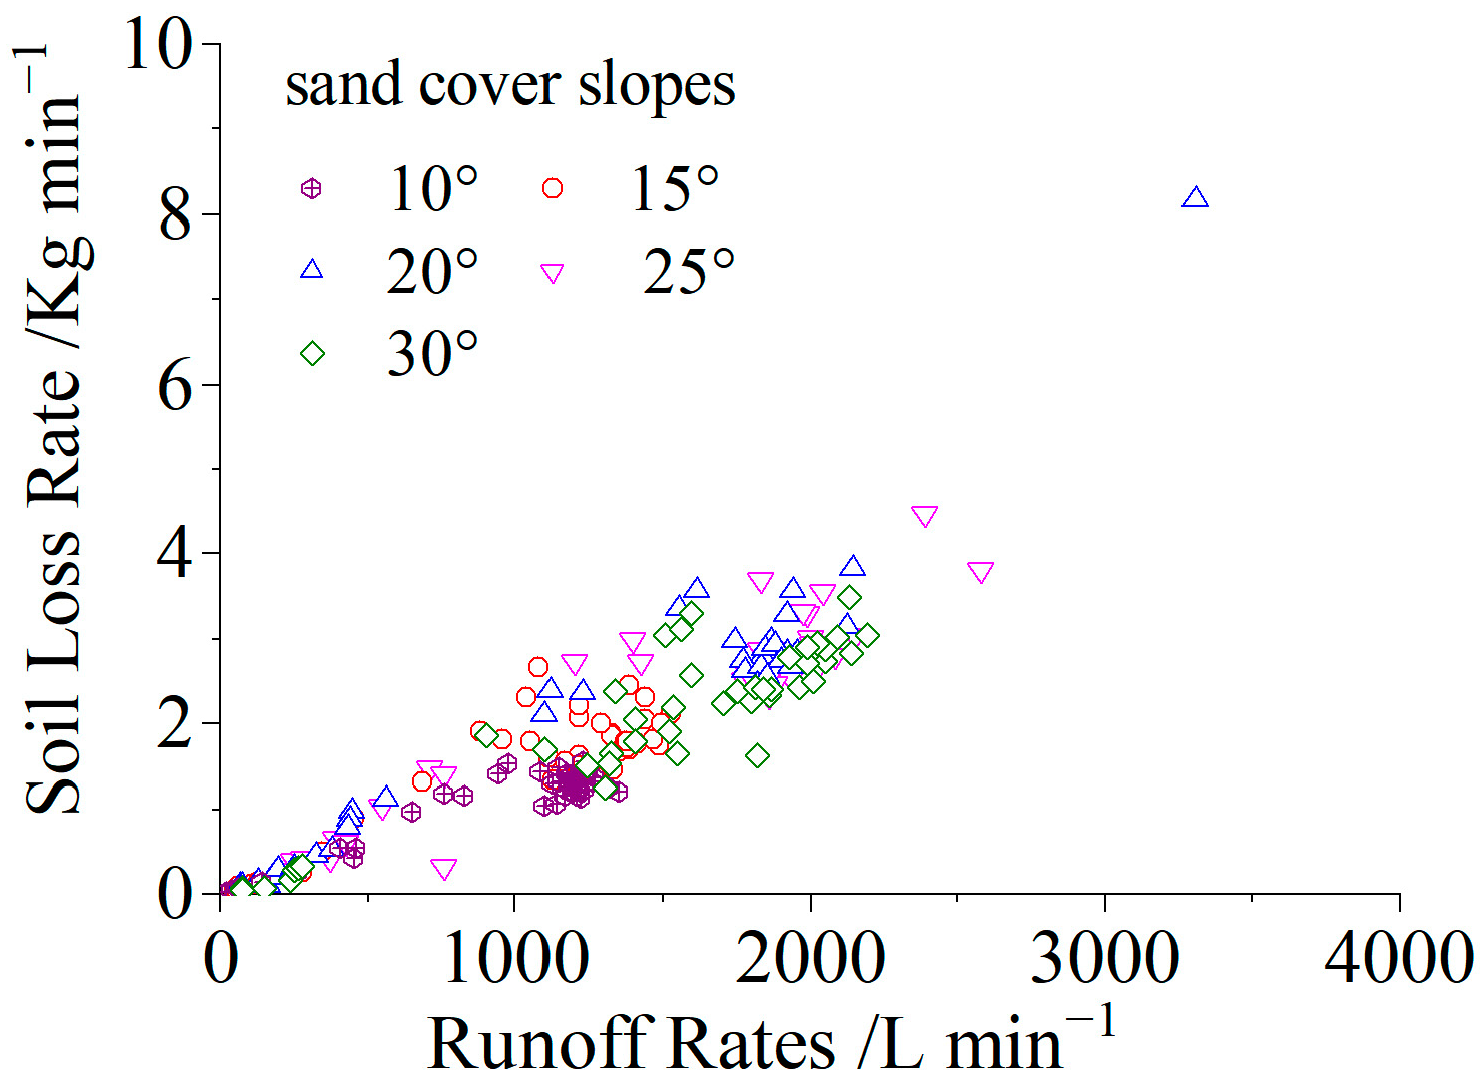
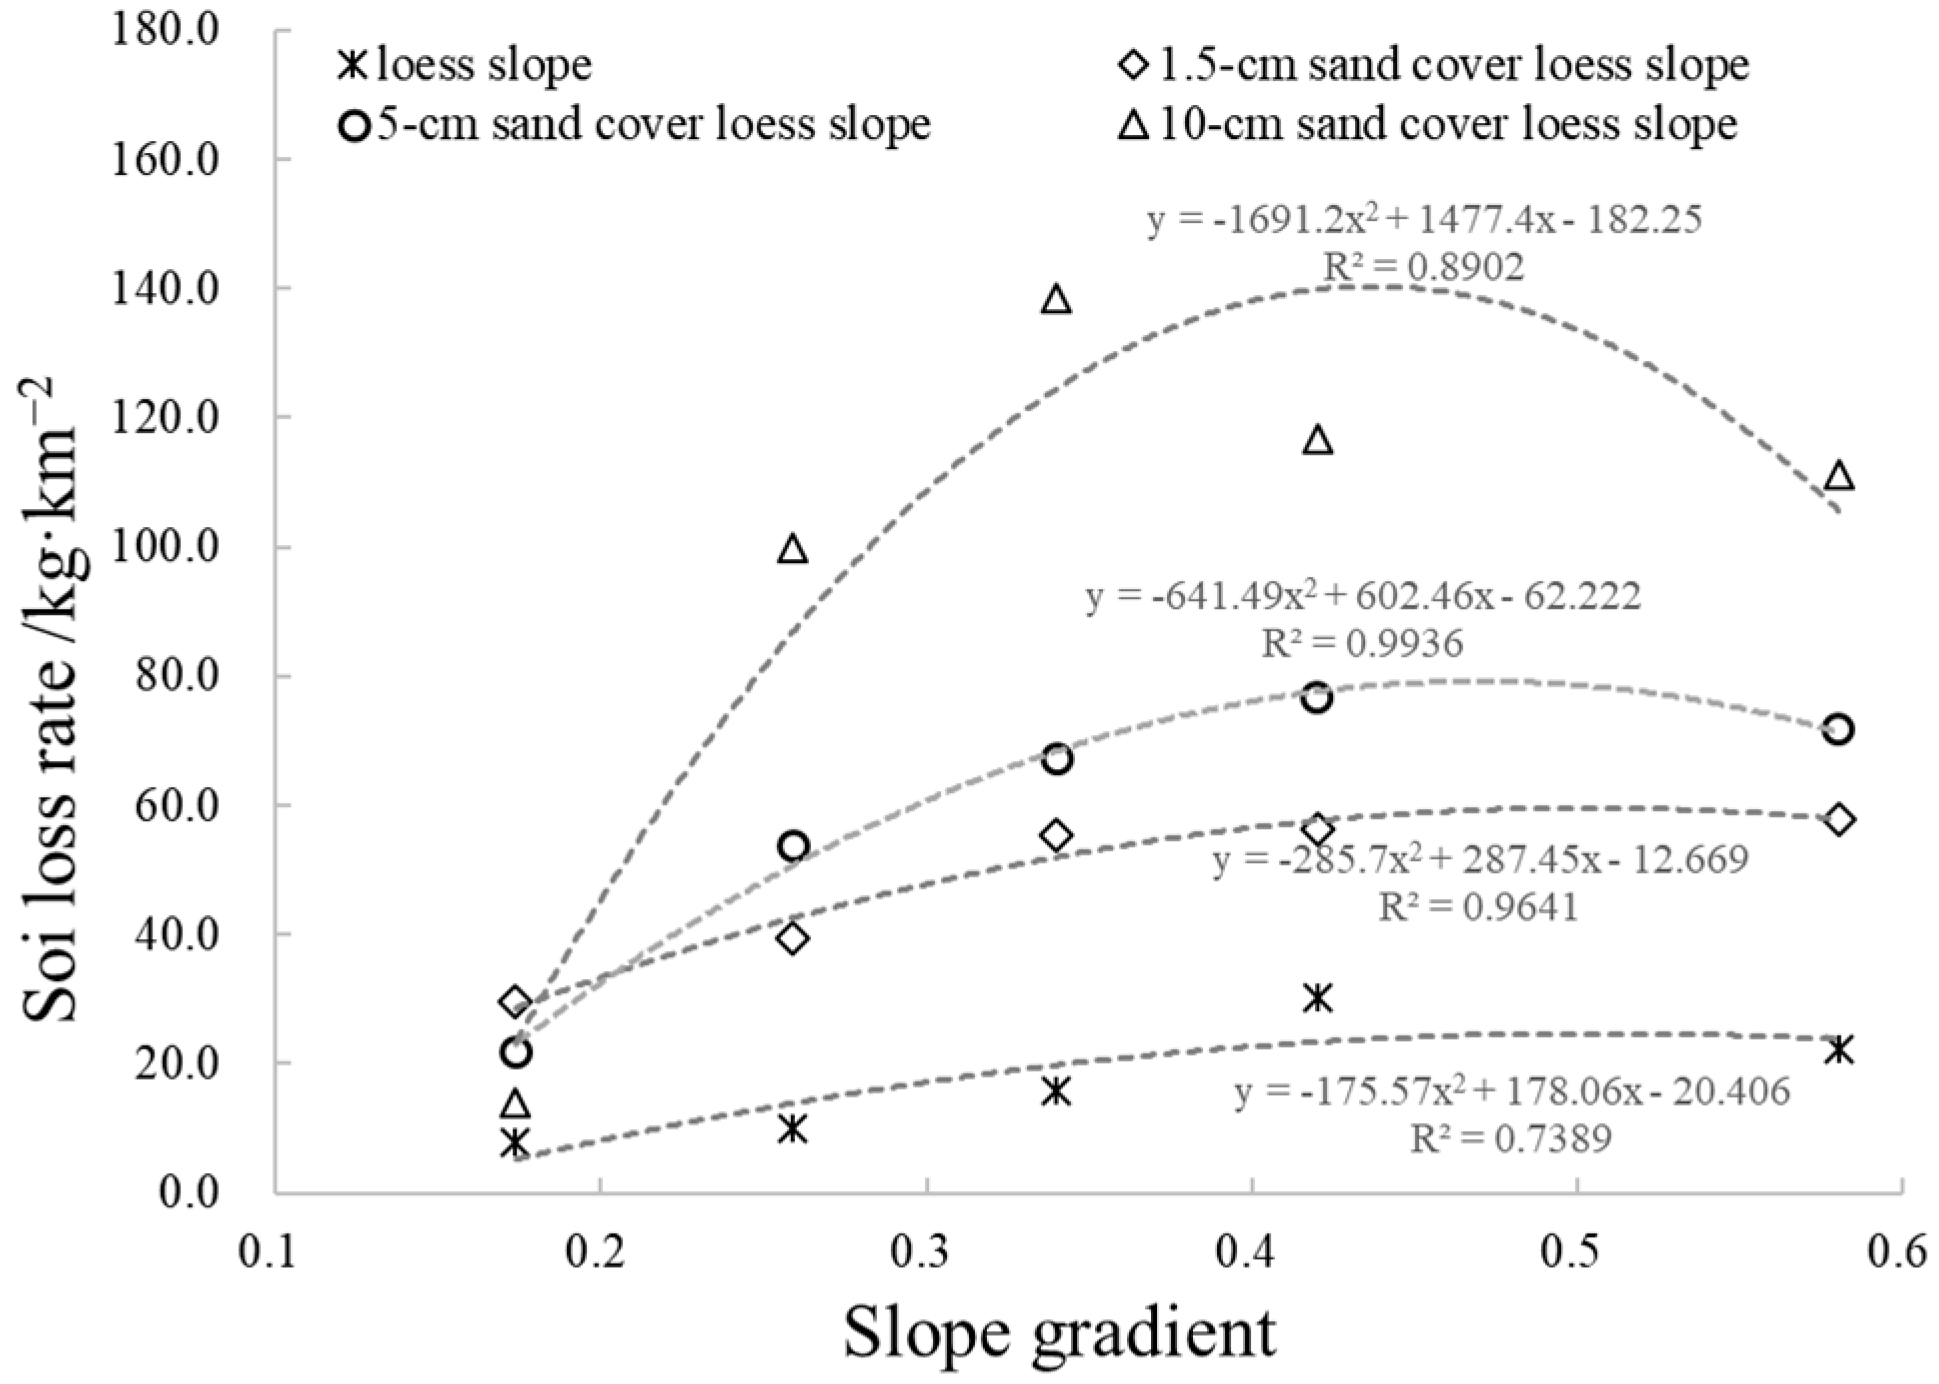
3.2. Soil Loss
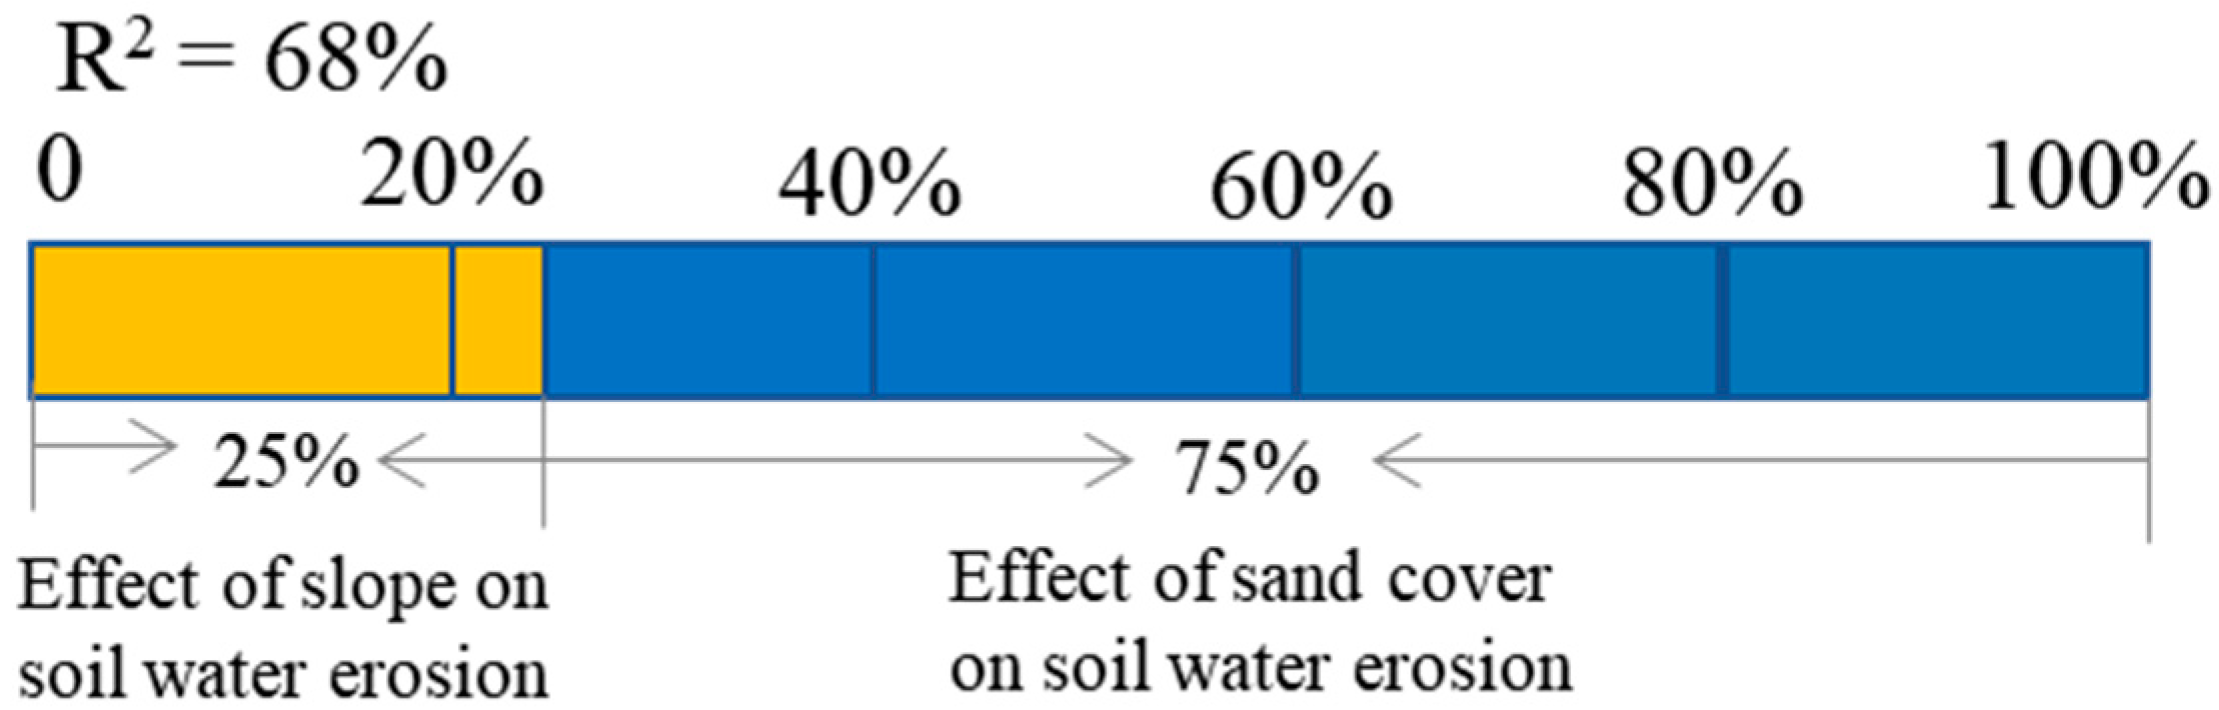
3.3. Analysis of the Interaction between Slope and Sand Cover on Soil Loss
4. Conclusions
Author Contributions
Funding
Data Availability Statement
Conflicts of Interest
References
- Tang, K.L.; Hou, Q.C.; Wang, B.; Zhang, P.C. Environmental Background and Regulation Direction of Wind and Water Erosion Crisscross Zone and Shenmu Experimental Area in Loess Plateau. J. Northwest Inst. Soil Water Conserv. Minist. Water Resour. CAS 1993, 18, 2–15. [Google Scholar]
- Xu, J.H.; Lv, G.X.; Gan, Z.M. Regional definition of coarse sediment area in the middle reaches of the Yellow River. China Water Conserv. 2000, 12, 37–38. [Google Scholar]
- Zhang, J.Q.; Yang, M.Y.; Deng, X.X.; Liu, Z.; Zhang, F.B.; Zhou, W.Y. Beryllium-7 measurements of wind erosion on sloping fields in the wind-water erosion crisscross region on the Chinese Loess Plateau. Sci. Total Environ. 2018, 615, 240–252. [Google Scholar] [CrossRef]
- Ren, Z.P.; Zhang, X.; Zhang, X.C.; Li, Z.B.; Li, P.; Zhou, Z.Z. Sand cover enhances rill formation under laboratory rainfall simulation. Catena 2021, 205, 105472. [Google Scholar] [CrossRef]
- Zhang, F.B.; Bai, Y.J.; Xie, L.Y.; Yang, M.Y.; Li, Z.B.; Wu, X.R. Runoff and soil loss characteristics on loess slopes covered with aeolian sand layers of different thicknesses under simulated rainfall. J. Hydrol. 2017, 549, 244–251. [Google Scholar] [CrossRef]
- Xu, G.C.; Tang, S.S.; Lu, K.X.; Li, P.; Li, Z.B.; Gao, H.D.; Zhao, B.H. Runoff and sediment yield under simulated rainfall on sand-covered slopes in a region subject to wind–water erosion. Environ. Earth Sci. 2015, 74, 2523–2530. [Google Scholar] [CrossRef]
- Zhang, F.B.; Yang, M.Y.; Li, B.B.; Li, Z.B.; Shi, W.Y. Effects of slope gradient on hydro-erosional processes on an aeolian sand-covered loess slope under simulated rainfall. J. Hydrol. 2017, 553, 447–456. [Google Scholar] [CrossRef]
- Morbidelli, R.; Saltalippi, C.; Flammini, A.; Govindaraju, R.S. Role of slope on infiltration: A review. J. Hydrol. 2018, 557, 878–886. [Google Scholar] [CrossRef]
- Janeau, J.L.; Bricquet, J.P.; Planchon, O.; Valentin, C. Soil crusting and infiltration on steep slopes in northern Thailand. Eur. J. Soil Sci. 2003, 54, 543–553. [Google Scholar] [CrossRef] [Green Version]
- Patin, J.; Mouche, E.; Ribolzi, O.; Chaplot, V.; Sengtahevanghoung, O.; Latsachak, K.O.; Soulileuth, B.; Valentin, C. Analysis of runoff production at the plot scale during a long-term survey of a small agricultural catchment in lao pdr. J. Hydrol. 2012, 426–427, 79–92. [Google Scholar] [CrossRef]
- Liu, B.Y.; Nearing, M.A.; Risse, L.M. Slope Gradient Effects on Soil Loss for Steep Slopes. Trans. ASAE 1994, 37, 1835–1840. [Google Scholar] [CrossRef]
- Nord, G.; Esteves, M. The effect of soil type, meteorological forcing and slope gradient on the simulation of internal erosion processes at the local scale. Hydrol. Process. 2010, 24, 1766–1780. [Google Scholar] [CrossRef]
- Xu, G.C.; Cheng, Y.T.; Zhao, C.Z.; Mao, J.S.; Li, Z.B.; Jia, L.; Zhang, Y.X.; Wang, B. Effects of driving factors at multi-spatial scales on seasonal runoff and sediment changes. Catena 2023, 222, 106867. [Google Scholar] [CrossRef]
- Hu, S.X.; Jin, C.X. Theoretical and experimental study on the critical slope of soil erosion on hillslope. Acta Geogr. Sin. 1999, 54, 347–356. [Google Scholar]
- Wang, Z.W.; Chen, Z.C.; Zhao, A. Effects of rainfall intensity and slope gradient on soil erosion and sediment yield on typical slope in Yimeng mountainous area. J. Soil Water Conserv. 2012, 26, 17–20. [Google Scholar]
- Li, H.L.; Han, X.; Zhang, Z.D.; Li, J.N.; Jiang, H.C.; Luo, X.L. Research on runoff and erosion sediment under simulated rainfall condition of black soil in Northeast China. J. Soil Water Conserv. 2013, 27, 49–57. [Google Scholar]
- Koenker, R.; Bassett, G. Regression Quantiles. Econometrica 1978, 46, 33–50. [Google Scholar] [CrossRef]
- Assouline, S. Rainfall-induced soil surface sealing. Vadose Zone J. 2004, 3, 570–591. [Google Scholar] [CrossRef]
- Zhang, X.C.; Miller, W.P. Polyacrylamide effect on infiltration and erosion in furrows. Soil Sci. Soc. Am. J. 1996, 60, 866–872. [Google Scholar] [CrossRef]
- Ma, B.; Ma, F.; Li, Z.B.; Wu, F.Q. Effects of soil crust and crop on runoff and erosion in Loess Plateau. Acta Agric. Scand. Sect. B Soil Plant Sci. 2014, 64, 645–656. [Google Scholar] [CrossRef]
- Huang, Y.H.; Wang, W.; Lei, T.W.; Li, F.H.; Li, J. Saturation effect on the distribution of rill detachment rate. Eur. J. Soil Sci. 2021, 72, 2076–2087. [Google Scholar] [CrossRef]
- Huang, C. Sediment regimes under different slope and surface hydrologic conditions. Soil Sci. Soc. Am. J. 1998, 62, 423–430. [Google Scholar] [CrossRef]
- Huang, C.; Laften, J.M. Seepage and soil erosion for a clay loam soil. Soil Sci. Soc. Am. J. 1996, 60, 408–416. [Google Scholar] [CrossRef]
- Ran, Q.H.; Su, D.Y.; Li, P.; He, Z.G. Experimental study of the impact of rainfall characteristics on runoff generation and soil erosion. J. Hydrol. 2012, 424–425, 99–111. [Google Scholar] [CrossRef]
- Zhang, X.J. Determining and Modeling Dominant Processes of Interrill Soil Erosion. Water Resour. Res. 2019, 55, 4–20. [Google Scholar] [CrossRef] [Green Version]
- Assouline, S.; Ben-Hur, M. Effects of rainfall intensity and slope gradient on the dynamics of interrill erosion during soil surface sealing. Catena 2006, 66, 211–220. [Google Scholar] [CrossRef]
- Xu, J. The wind-water two-phase erosion and sediment-producing processes in the middle Yellow River basin, China. Sci. China Ser. D Earth Sci. 2000, 43, 176–186. [Google Scholar] [CrossRef]
- Xu, J.; Yang, J.; Yan, Y. Erosion and sediment yield as influenced by coupled eolian and fluvial processes: The Yellow River, China. Geomorphology 2006, 73, 1–15. [Google Scholar] [CrossRef]


| Treatment | Slope Angles (°) | Treatment Mode | Rainfall (mm min−1) |
|---|---|---|---|
| Loess slope (control) | 15 | Two layers: top layer was 25 cm loess slope; the bottom layer was 5 cm aeolian sand | 1.5 |
| Sand cover treatment 1 | 10 | Three layers: top layer was a 2 cm layer of aeolian sand; the middle layer was 25 cm loess slope; the bottom layer was also 5 cm sand. | 1.5 |
| Sand cover treatment 2 | 15 | 1.5 | |
| Sand cover treatment 3 | 20 | 1.5 | |
| Sand cover treatment 4 | 25 | 1.5 | |
| Sand cover treatment 5 | 30 | 1.5 |
| Treatment | Slope/° | The Runoff Initiation Times/s | Total Runoff Volume/L | Total Sediment Yield/kg | First Collapse Time/min |
|---|---|---|---|---|---|
| Loess slope | 15 | 172 | 92.4 | 39.2 | No collapse |
| Sand-covered loess slope | 10 | 1393 | 39.7 | 44.3 | No collapse |
| 15 | 1399 | 40.5 | 59.4 | No collapse | |
| 20 | 1339 | 49.8 | 83.1 | 43 | |
| 25 | 1231 | 54.9 | 84.5 | 40 | |
| 30 | 1091 | 62.5 | 87.1 | 36 |
Disclaimer/Publisher’s Note: The statements, opinions and data contained in all publications are solely those of the individual author(s) and contributor(s) and not of MDPI and/or the editor(s). MDPI and/or the editor(s) disclaim responsibility for any injury to people or property resulting from any ideas, methods, instructions or products referred to in the content. |
© 2023 by the authors. Licensee MDPI, Basel, Switzerland. This article is an open access article distributed under the terms and conditions of the Creative Commons Attribution (CC BY) license (https://creativecommons.org/licenses/by/4.0/).
Share and Cite
Ren, Z.; Pan, J.; Li, Z.; Xiao, P.; Shen, Z.; Jia, L.; Li, X. The Interaction of Aeolian Sand and Slope on Runoff and Soil Loss on a Loess Slope via Simulated Rainfall under Laboratory Conditions. Water 2023, 15, 888. https://doi.org/10.3390/w15050888
Ren Z, Pan J, Li Z, Xiao P, Shen Z, Jia L, Li X. The Interaction of Aeolian Sand and Slope on Runoff and Soil Loss on a Loess Slope via Simulated Rainfall under Laboratory Conditions. Water. 2023; 15(5):888. https://doi.org/10.3390/w15050888
Chicago/Turabian StyleRen, Zongping, Jinjin Pan, Zhanbin Li, Peiqing Xiao, Zhenzhou Shen, Lu Jia, and Xiaozheng Li. 2023. "The Interaction of Aeolian Sand and Slope on Runoff and Soil Loss on a Loess Slope via Simulated Rainfall under Laboratory Conditions" Water 15, no. 5: 888. https://doi.org/10.3390/w15050888