
The Influence of the Internal Properties of River Ice on Ground Penetrating Radar Propagation


1
School of Water Conservancy and Civil Engineering, Northeast Agricultural University, Harbin 150030, China
2
Heilongjiang Provincial Key Laboratory of Water Resources and Water Conservancy Engineering in Cold Region, Harbin 150030, China
*
Author to whom correspondence should be addressed.
Water 2023, 15(5), 889; https://doi.org/10.3390/w15050889
Submission received: 11 December 2022
/
Revised: 9 February 2023
/
Accepted: 23 February 2023
/
Published: 25 February 2023
(This article belongs to the Special Issue Sea, River, Lake Ice Properties and Their Applications in Practices)
Abstract
:Ground penetrating radar (GPR) has proven to be a very effective method for examining ice thickness. However, two preconditions must be met for this approach to be useful; the round-trip travel time of electromagnetic (EM) waves and radar transmission speed in the ice must be known. These issues are problematic because many factors affect radar transmission speed in ice, including impurities, physical properties such as porosity and density, and temperature. Results show that if these factors are not taken into account and a signal velocity of 0.17 m/ns in pure ice is used to estimate thickness, overestimates will result. We carried out a series of GPR surveys using dual channel host 200 MHz shielded antennas at the Toudaoguai Hydrological Station on the Yellow River, China, and collected samples to analyze ice impurities and physical properties. The results show that the ice crystal types include frazil, granular, and column at the Toudaoguai Hydrologic Station section. Our analysis of ice gas bubble and sediment content showed that the gas bubble volume content is between 11.95 and 13.0% in the frazil ice and between 7.9% and 8.6% in granular and columnar ice. At the same time, the ice sediment content ranged between 0.11‰ and 0.57‰, and the average was 0.24‰ in granular and columnar ice, which was about one-tenth that of the suspended sediment concentration in water. Additionally, a combination of GPR data as well as ice impurities, porosity, density, and temperature enabled us to provide insights on the variability of radar transmission speed and the equivalent dielectric permittivity in river ice. Our extensive observations reveal that radar transmission speed falls between 0.141 m/ns and 0.164 m/ns and that the equivalent dielectric permittivity of river ice increases in concert with ice temperature.
1. Introduction
Freshwater ice cover is a fundamental characteristic of northern temperate aquatic systems and is associated with the least productive months of the year [1]. Seasonal freshwater ice will still be present when the accumulated number of freezing days is sufficiently large, while perennial ice cover can be found at high altitudes and at high polar latitudes. Brooks et al. [2] studied the areal extent and volume of Northern Hemisphere freshwater ice in rivers and lakes and showed that the total covered area at peak thickness, north of the January 0 °C isotherm (excluding the Greenland ice sheet), is 1.7 × 10⁶ km2. Additionally, the total volume of Northern Hemisphere freshwater ice is 1.6 × 10³ km3. The extent and duration of freshwater ice cover has a tremendous impact on human life, including influencing large-scale climate change [3]. At the same time, flood forecasting and mitigation are influenced when ice cover breaks up on a river [4,5]. Freshwater ice is closely related to our life; accurate measurement of freshwater ice thickness is important if we are to determine the production activities of ice cover. The traditional method to estimate ice thickness is the use of a drill-hole, but this approach is relatively inefficient when generating large amounts of data.
Ground penetrating radar (GPR) is a noninvasive geophysical technique that can be used to detect electrical discontinuities in the shallow subsurface. This noninvasive geophysical technique was first used in the early 20th century by German scientists to investigate the nature of buried features [6,7]. Concomitant with technology development, GPR systems became commercially available and digital data acquisition was first feasible in the 1980s [8]. This approach is now widely applied across a range of fields, including underground archaeology, soil science, and engineering. GPR also plays an important role in the detection of ice and snow; in glaciology, for example, several research studies [9,10,11,12,13,14,15,16] have employed this approach to measure the thickness of glaciers. A range of investigations have also used GPR to measure snow thickness [17,18,19], and this approach has also been applied to snowpack analysis to determine physical properties, measure liquid water content [20,21,22], estimate density [23,24,25], and determine snow water equivalent [26,27]. Applications of GPR to river [28,29,30], sea [31], and reservoir ice [32] have primarily focused on thickness measurements and the detection of floating or grounded ice conditions [33,34]. Because the dielectric permittivities of ice (ε = 3–4), freshwater (ε = 81), and sediment (ε = 5–40) contrast greatly with one another, GPR can be used to detect the ice–water and water–sediment interface via changes in electromagnetic (EM) signals when high-frequency waves penetrate through these boundaries. The GPR can also be used to estimate winter ebullition bubble volume in lake ice, which can make an accurate assessment of gas emissions from lakes [35]. The dielectric permittivity of ice is not a fixed value; it varies depending on physical properties, including density, gas content, and textural structure. Thus, if we want to accurately measure the ice thickness by GPR, there is a strong need to carry out a detailed study of the influence of the internal properties of river ice on ground penetrating radar propagation.
The dielectric permittivity of river ice is relatively complex under natural conditions, as it is influenced by its physical properties and inner structure. Thus, river ice thickness can be measured accurately via GPR under the premise of determining the dielectric permittivity. We use GPR in this study to investigate the effects of impurities, physical properties (porosity and density), and temperature on the dielectric permittivity of river ice.
2. Research Area and Methods
2.1. Overview of the Research Area
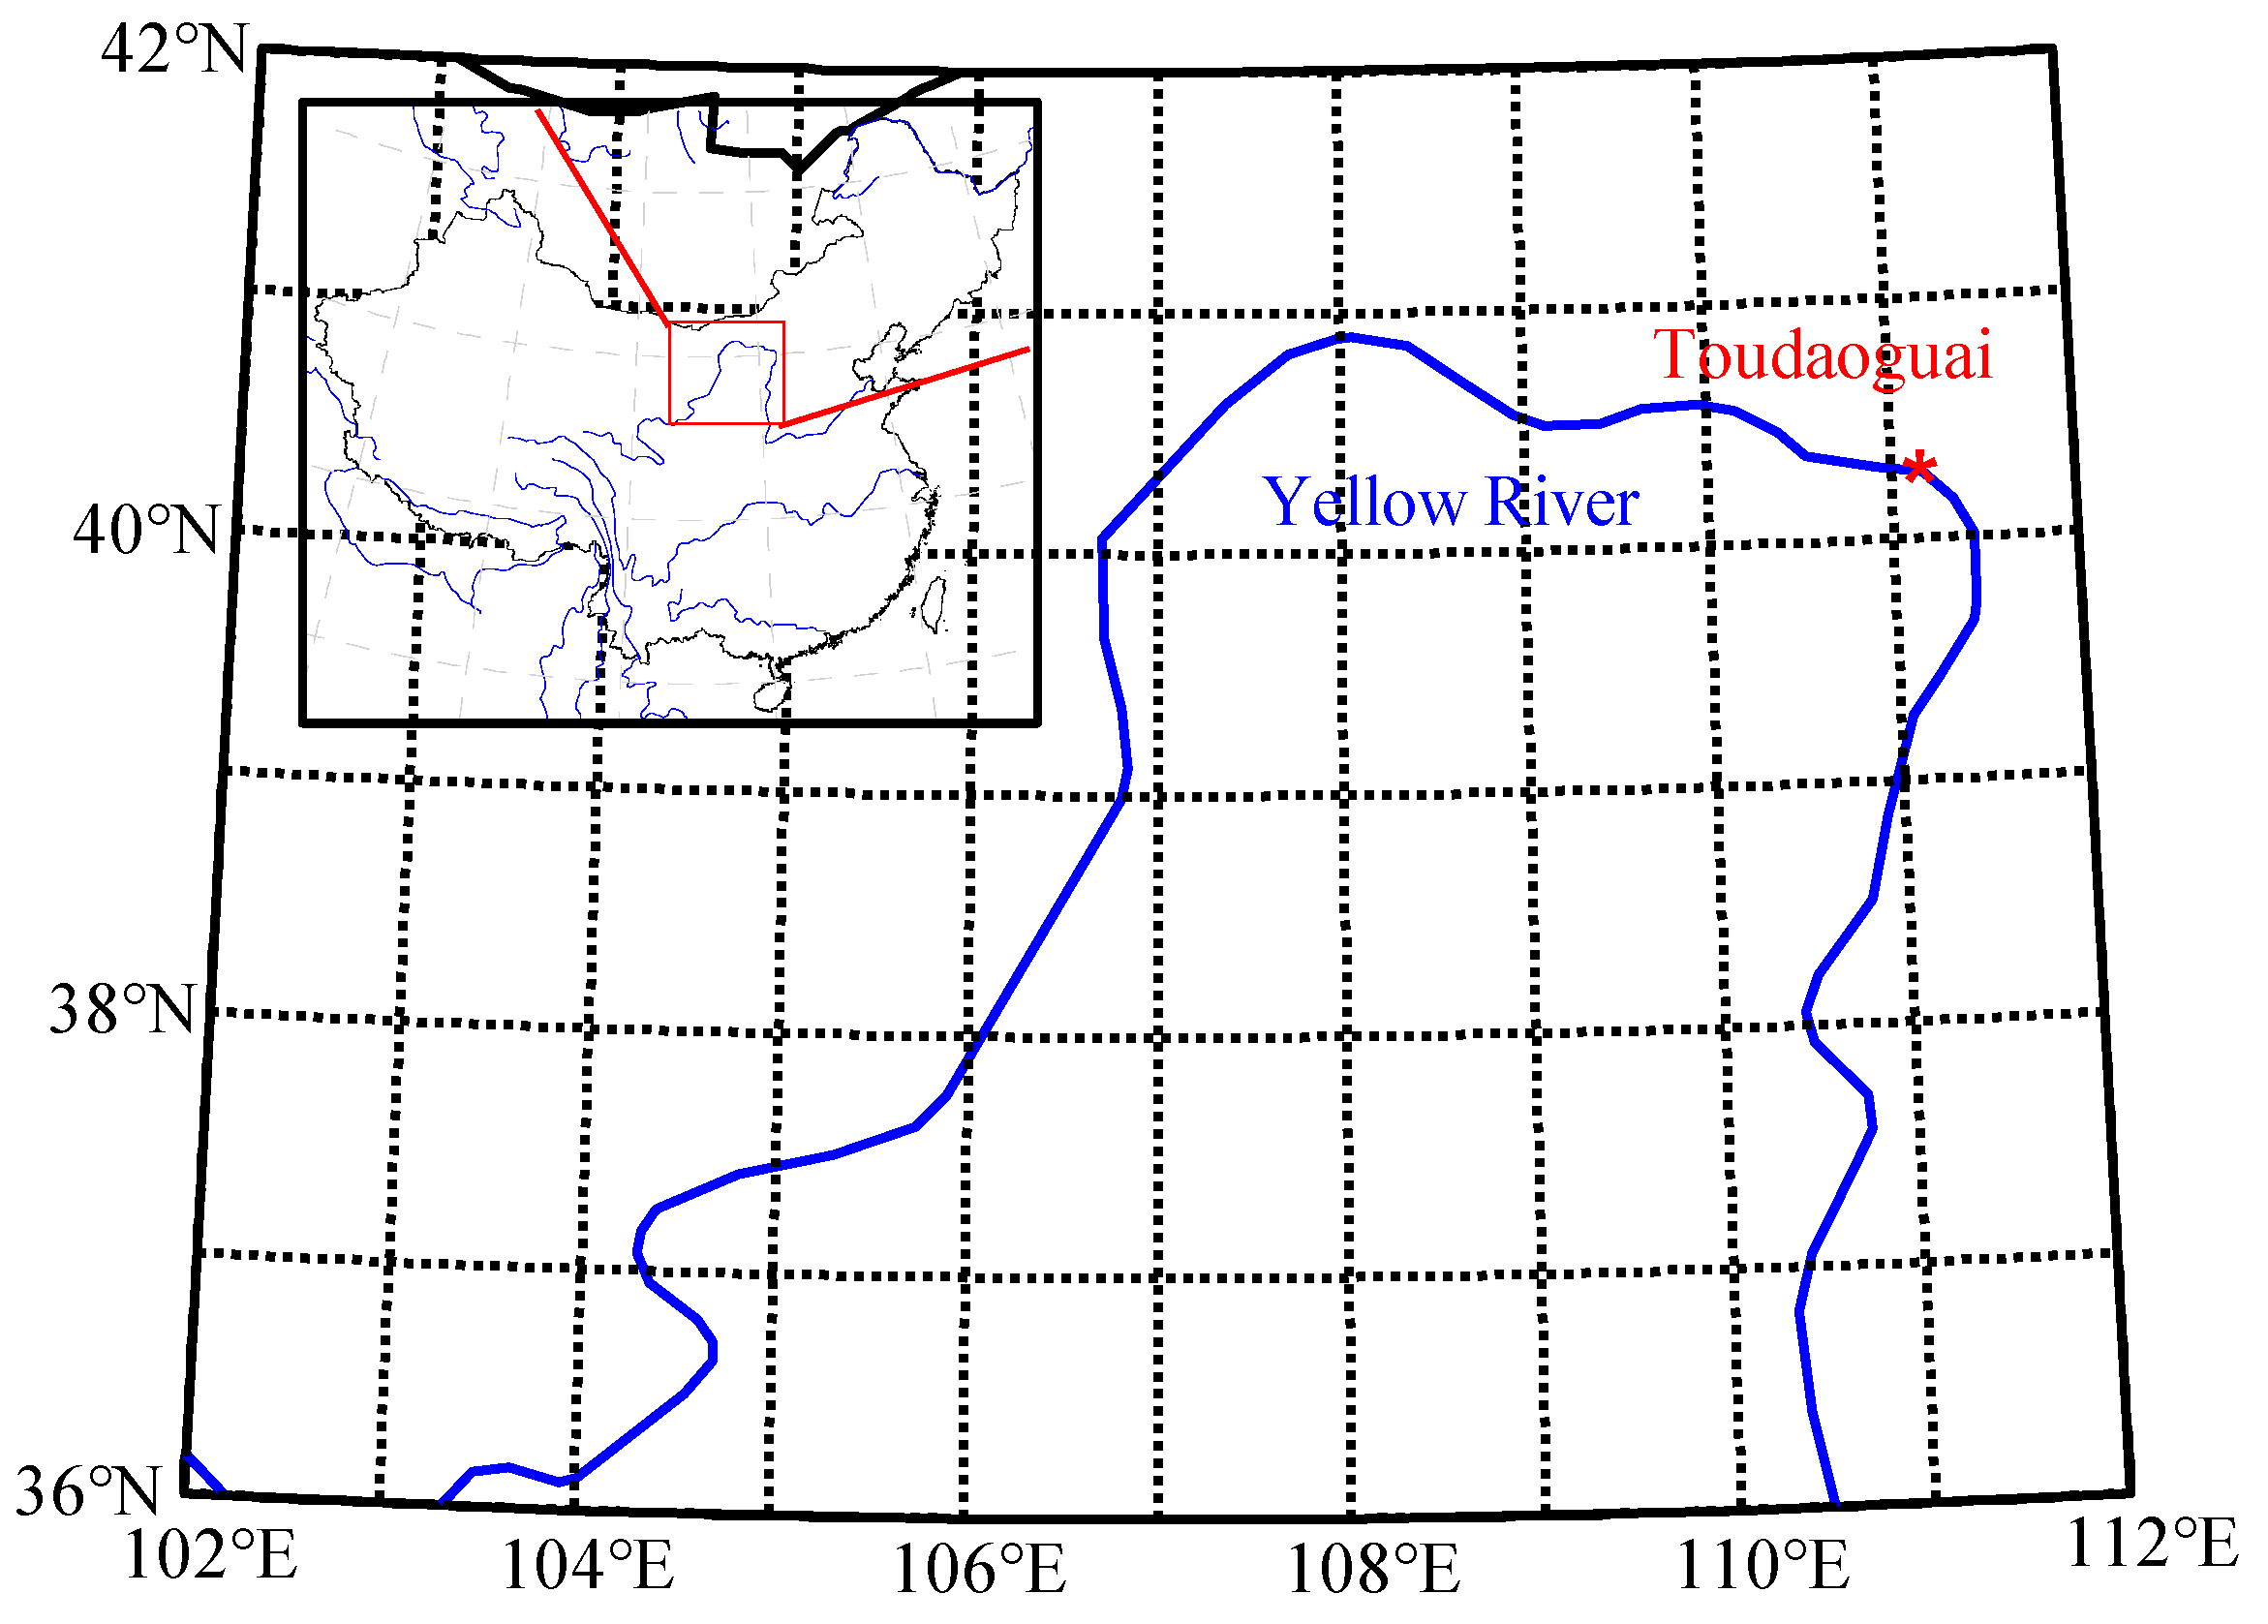
The Yellow River is the third-longest river in Asia and the sixth-longest in the world. Originating on the high Qinghai-Tibetan Plateau in Qinghai Province in western China, the Yellow River flows north, turns south, and then bends east for a total of 5464 km before draining into the Bohai Sea near the city of Dongying in Shandong Province, encompassing a basin area of ca. 752,000 km2. The upper part of this drainage basin is located on the Qinghai-Tibetan Plateau, the middle part is located on the Loess Plateau, and the lower part is on the North China Plain [36]. The Toudaoguai cross-section lies in the terminal mainstream channel of the upper Yellow River, as shown in Figure 1; specifically, this section is located in the zone where the river transitions from a meandering to a straight channel, the latter of which has a length of about 16 km [37]. The winters are bitterly cold and long in this region, with air temperatures below zero from November to March [38]. As air temperature changes, ice formation, development, movement, accumulation, thaw, and disappearance all exert important impacts on river engineering and management. Within the Toudaoguai cross-section, freeze-up of the Yellow River often occurs in mid-December, while ice break-up takes place towards the end of March the following year [39]. During the break-up period, ice floods lead to frequent jams and dams within the region.
2.2. Research Method
We performed radar measurements using a RIS-K2 system (IDS Ltd., Pisa, Italy) and a survey with dual channel host 200 MHz shielded antennas. We operated GPR systems in continuous reflection mode and used an odometer wheel to measure and mark distances; all GPR profile data were collated with a laptop computer and processed using the software GresWin2.
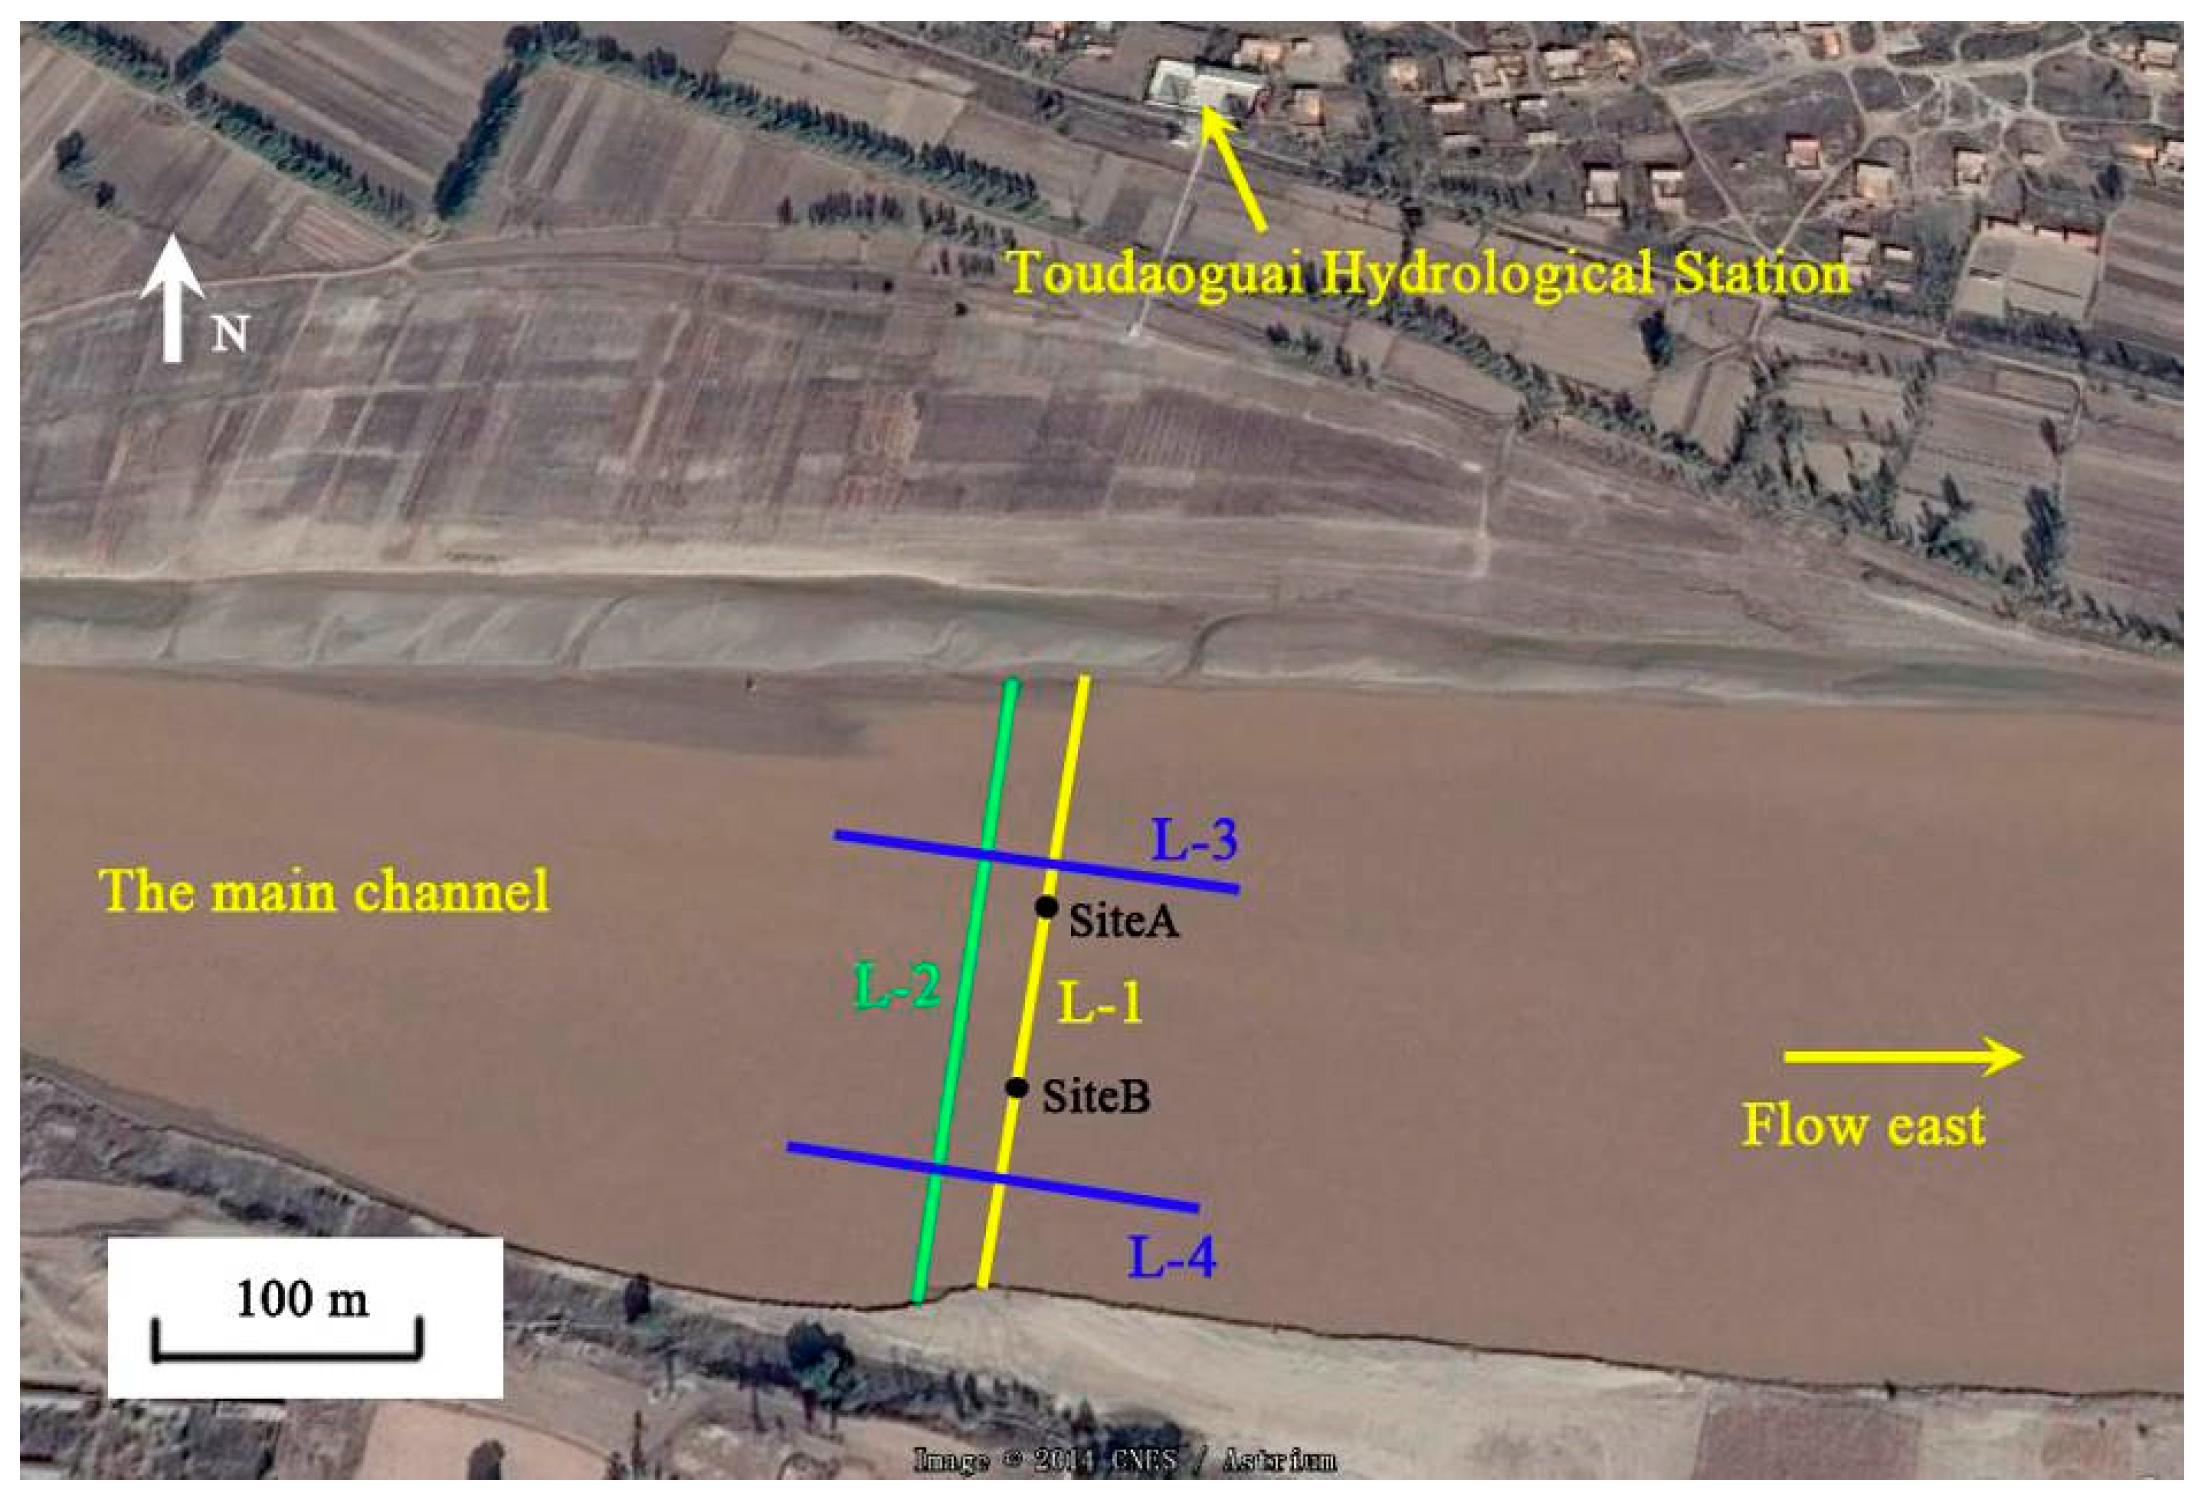
GPR surveys were conducted along the Toudaoguai Hydrological Station river section on 19 January and 15, 20, 24, 25, and 27 February 2014, and four measurements were made every day in order to eliminate the discreteness of test results. The main river channel at this section spans about 340 m, while the shoal is about 140 m wide. We detected four survey lines (Figure 2) during the field investigation; two of these (L-1, L-2) were perpendicular to the course of river, while another two (L-3, L-4) ran parallel to the river course.
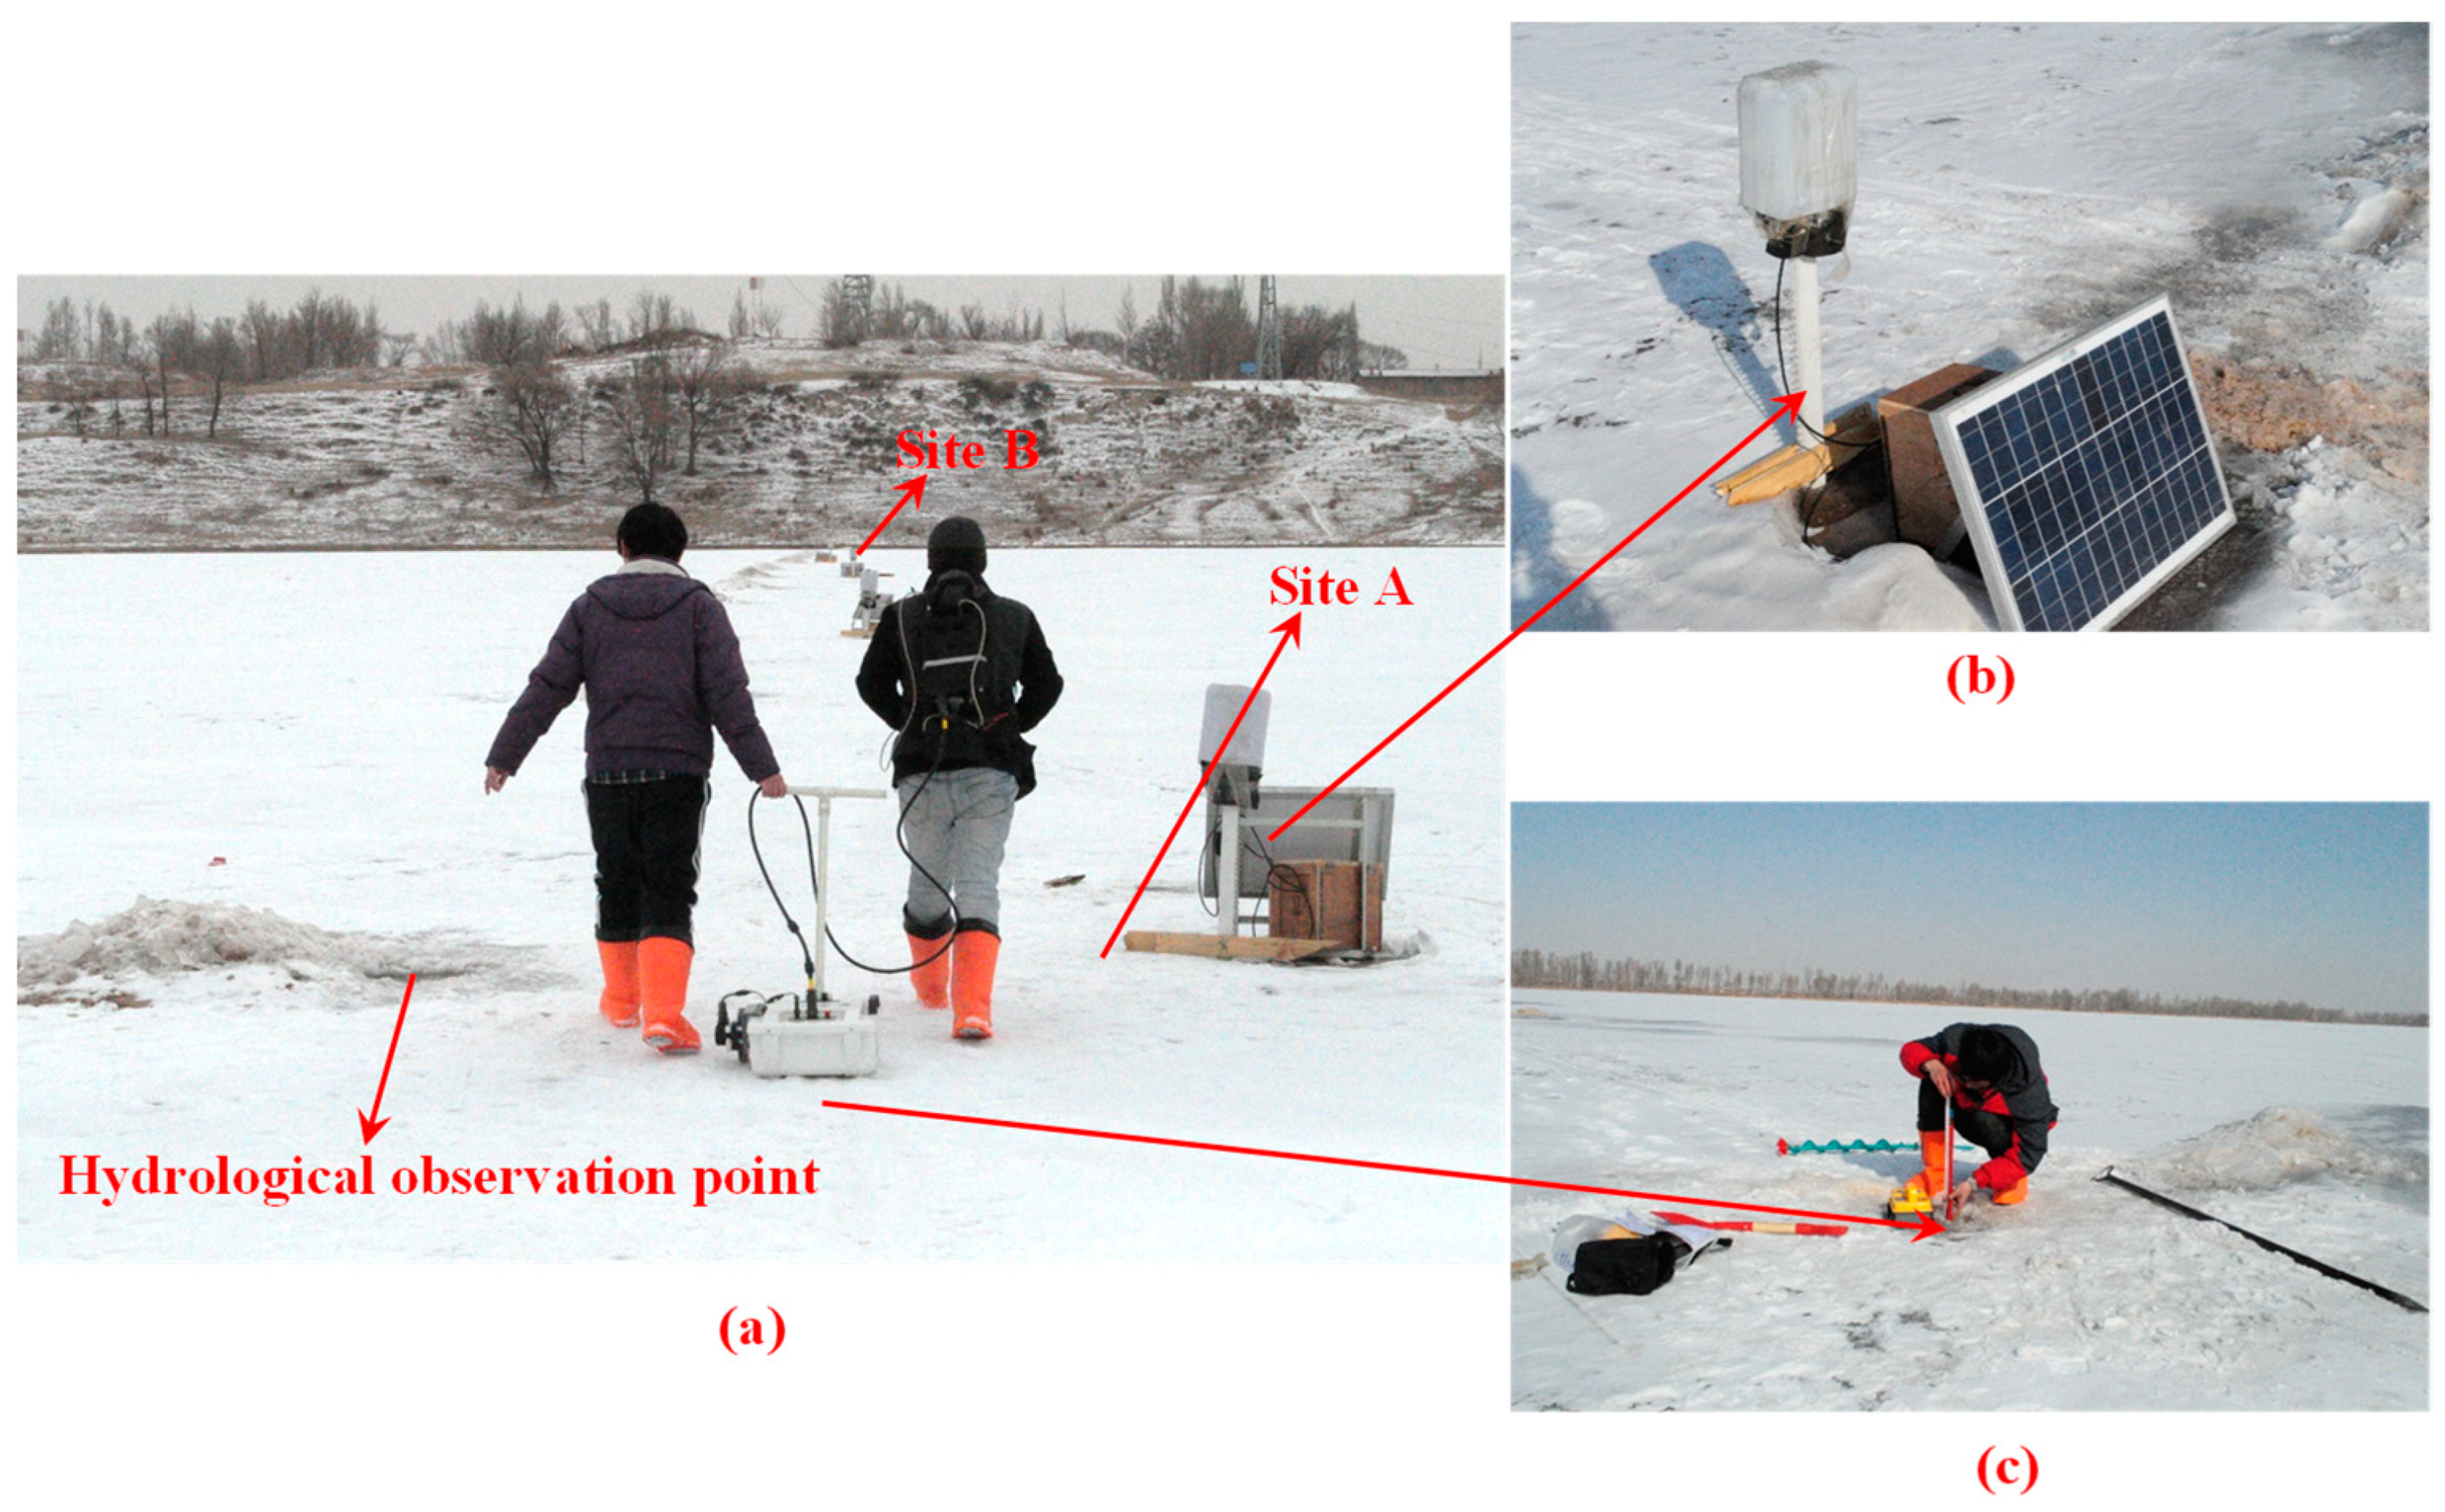
As shown in Figure 3, four 2.0 m long temperature sensor chains were used to determine the ice and water temperature along L-1 line from 8 January 2014. The temperature probe spacing was 0.01 m, and the measuring accuracy was 0.1 °C. Because the ice thickness at the hydrological observation point was less than undisturbed ice cover, we controlled the L-1 line to be more than 1 m away from hydrological observation points in actual operation in order to ensure the accuracy of inversion radar ice thickness measurement. We verified GPR reflections by drilling ice thickness (Figure 3c), and the precision of manual measurement of ice thickness was 0.001 m. In order to study the influence of the internal structure of the river ice on the EM velocity, ice specimens were sampled by a Kovacs drill (Roseburg, OR, USA) with a corer of 0.09 m diameter at Site A and Site B on 15 February 2014.
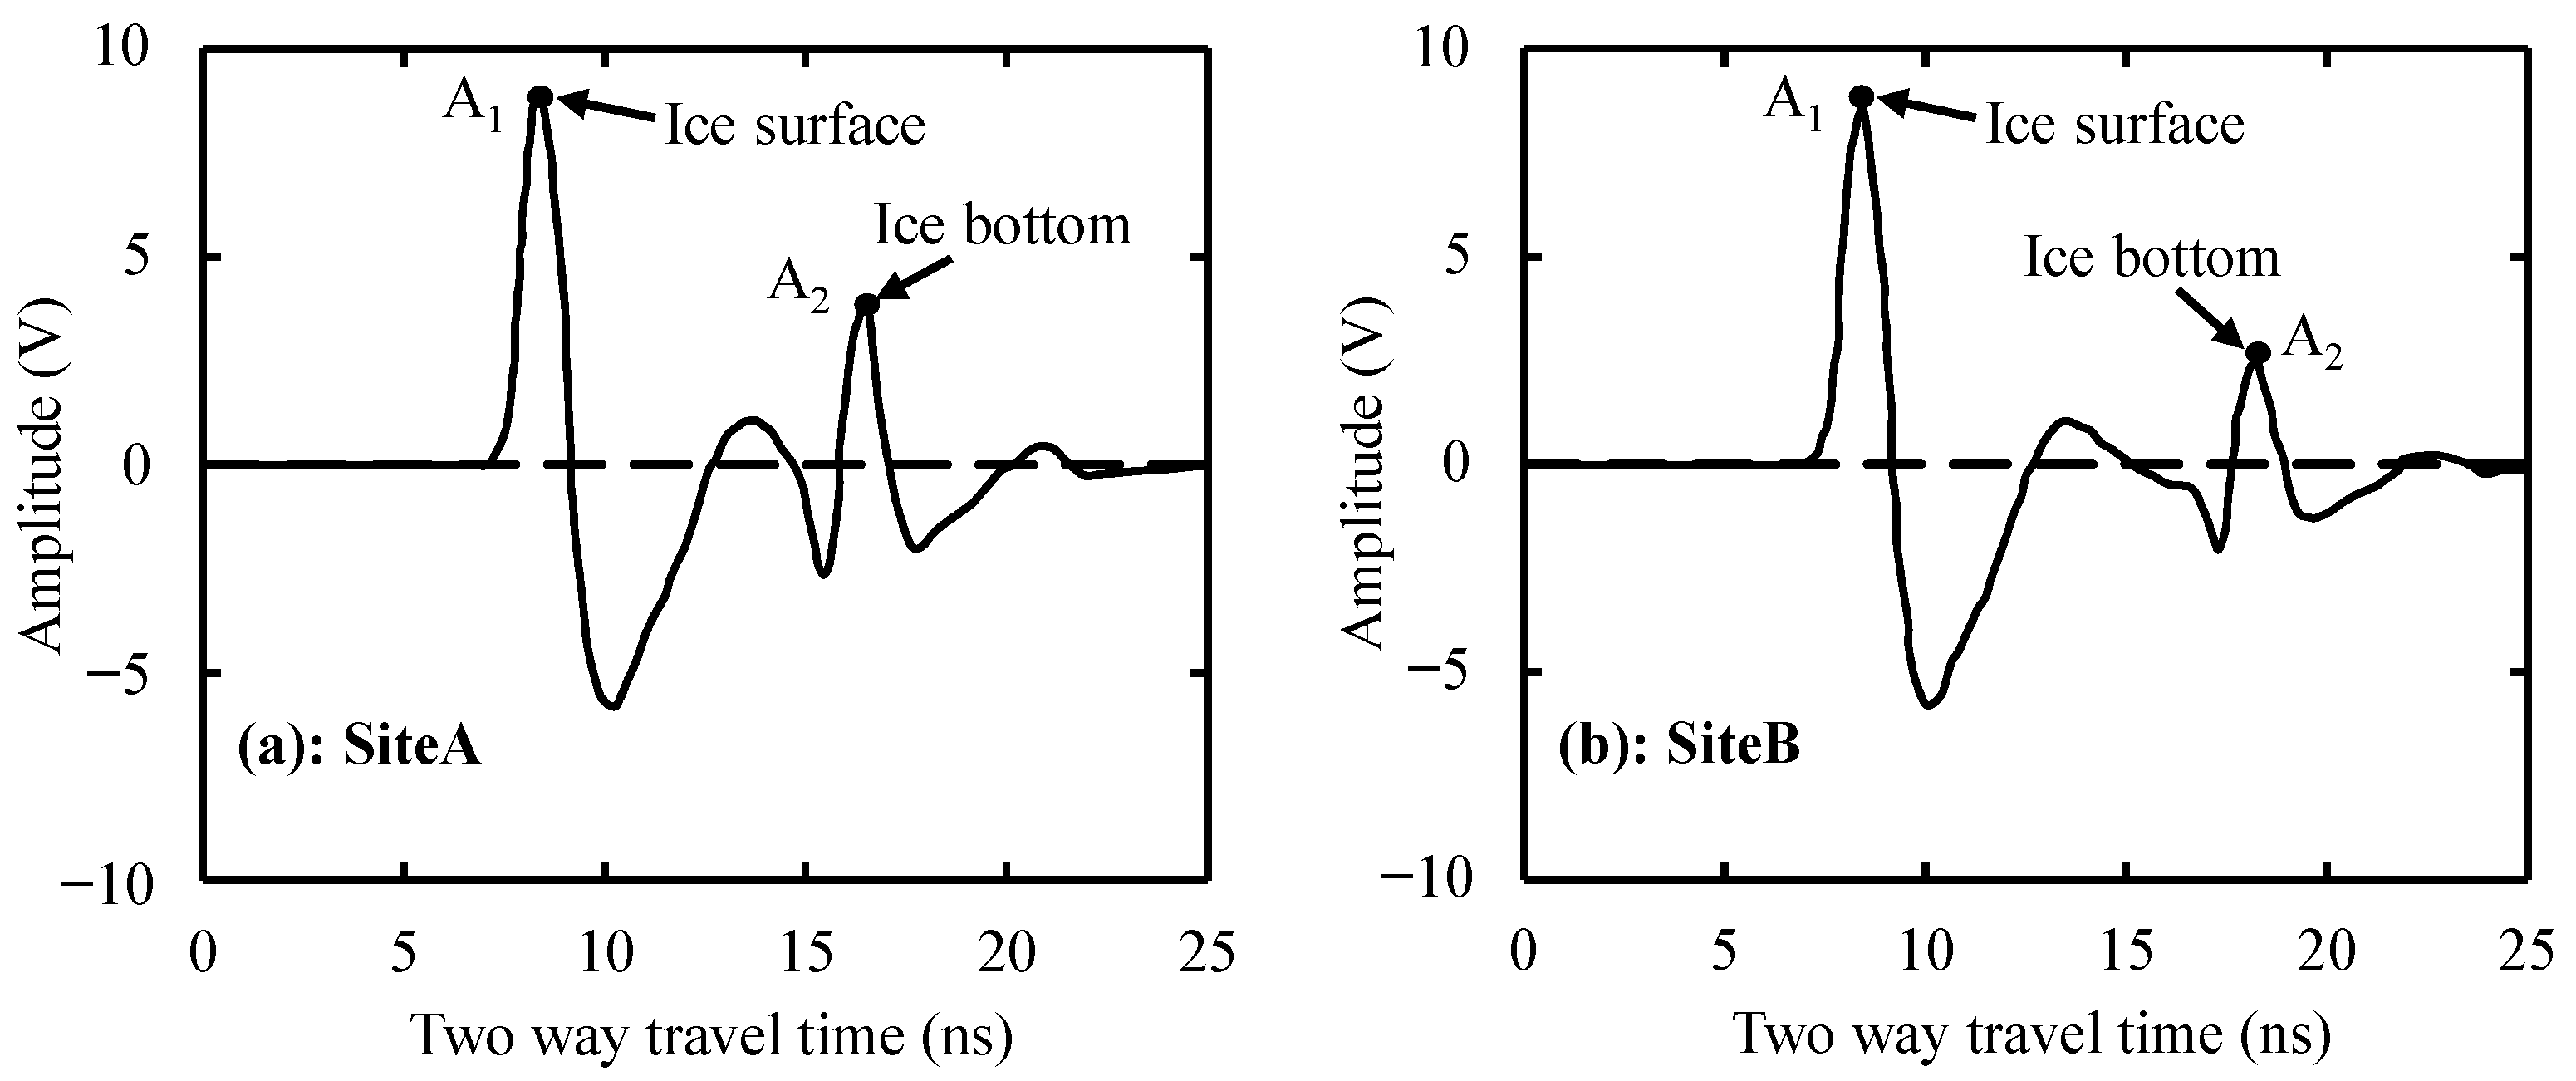
The standard time-voltage wiggle traces of GPR signals are shown in Figure 4; comparing the time domains of these two signals shows the same waveform in ice cover. The first and largest echo (A1) is due to the air–ice interface, while the second largest echo (A2) that appears later is due to reflections of the ice–water interface. The time interval between A1 and A2 represents the two-way travel time through the ice cover.
Based on EM wave propagation theory, EM velocity in a single medium can be expressed as follows:
where c is the EM velocity in a vacuum, 0.3 m/ns, while ε denotes the dielectric permittivity of the medium, 1 for air and 3.17 for pure ice.
Nevertheless, analyses of the physical properties of ice revealed the existence of vertical stratification. Ice cover can therefore be assumed to comprise a multilayer dielectric system, with homogeneous properties in each layer. Thus, the electrical conductivity of ice can be neglected.
The RIS-K2 system coupled with dual-channel hosted 200 MHz shielded antennas is a monostatic radar system. Thus, round-trip travel times of EM waves from transmission to reception within ice cover can be obtained as follows:
and
Solving Equations (2) and (3), the equivalent dielectric permittivity () of ice cover is as follows:
In these expressions, T refers to two way travel time (ns), c is the EM velocity in a vacuum, i is the interface number, ti is the ns from interface (i − 1) to interface (i), εi is the dielectric permittivity of ice from interface (i − 1) to interface (i), H is the total depth (m), hi is the depth (m) of ice from interface (i − 1) to interface (i), and is the equivalent dielectric permittivity of ice cover.
Kovacs et al. [40] developed an empirical relationship connecting ice density with the dielectric permittivity if river ice is assumed to be a composite material comprised of ice and air, as follows:
where ρ is measured ice density and εice is the ice dielectric permittivity.
Shokr [41] modified the two-phase dielectric mixing model for ice, suggesting that when the volume fraction of inclusions is less than 0.1, the dielectric permittivity of granular ice () can be calculated as follows:
Similarly, the dielectric permittivity of columnar ice can be calculated as follows:
In these expressions, and refer to the dielectric permittivities of columnar ice in the x direction (perpendicular to the ice column) and z direction (along the ice column), while is the dielectric permittivity of gas bubbles, is the d dielectric permittivity of pure ice, and is the volume content of gas bubbles. Thus, gas bubble volume content relative to porosity can be calculated as follows [42]:
In this expression, is the density of pure ice (916.8 kg/m3), while ρ is the measured density of ice cover. The results of these calculations show that gas bubble volume content is less than 0.1; thus, Equations (6)–(8) can be used to calculate the dielectric permittivity of river ice.
3. Results
3.1. Ice Formation and Ice Physical Properties
The formation of river ice is a complex process that depends on a combination of hydrodynamic and atmospheric conditions. In the Toudaoguai Hydrological Station section, observed hydrological data show that ice cover forms from the left side of the river to the right; as air temperature decreases, a thin cover of ice forms in gently flowing areas near to the left bank of the river. As the left part of the river iced over, frazil particles and slush in turbulent water floated to the surface to create frazil pans on the right side of the river, before congealing into ice cover in mid-December 2013.
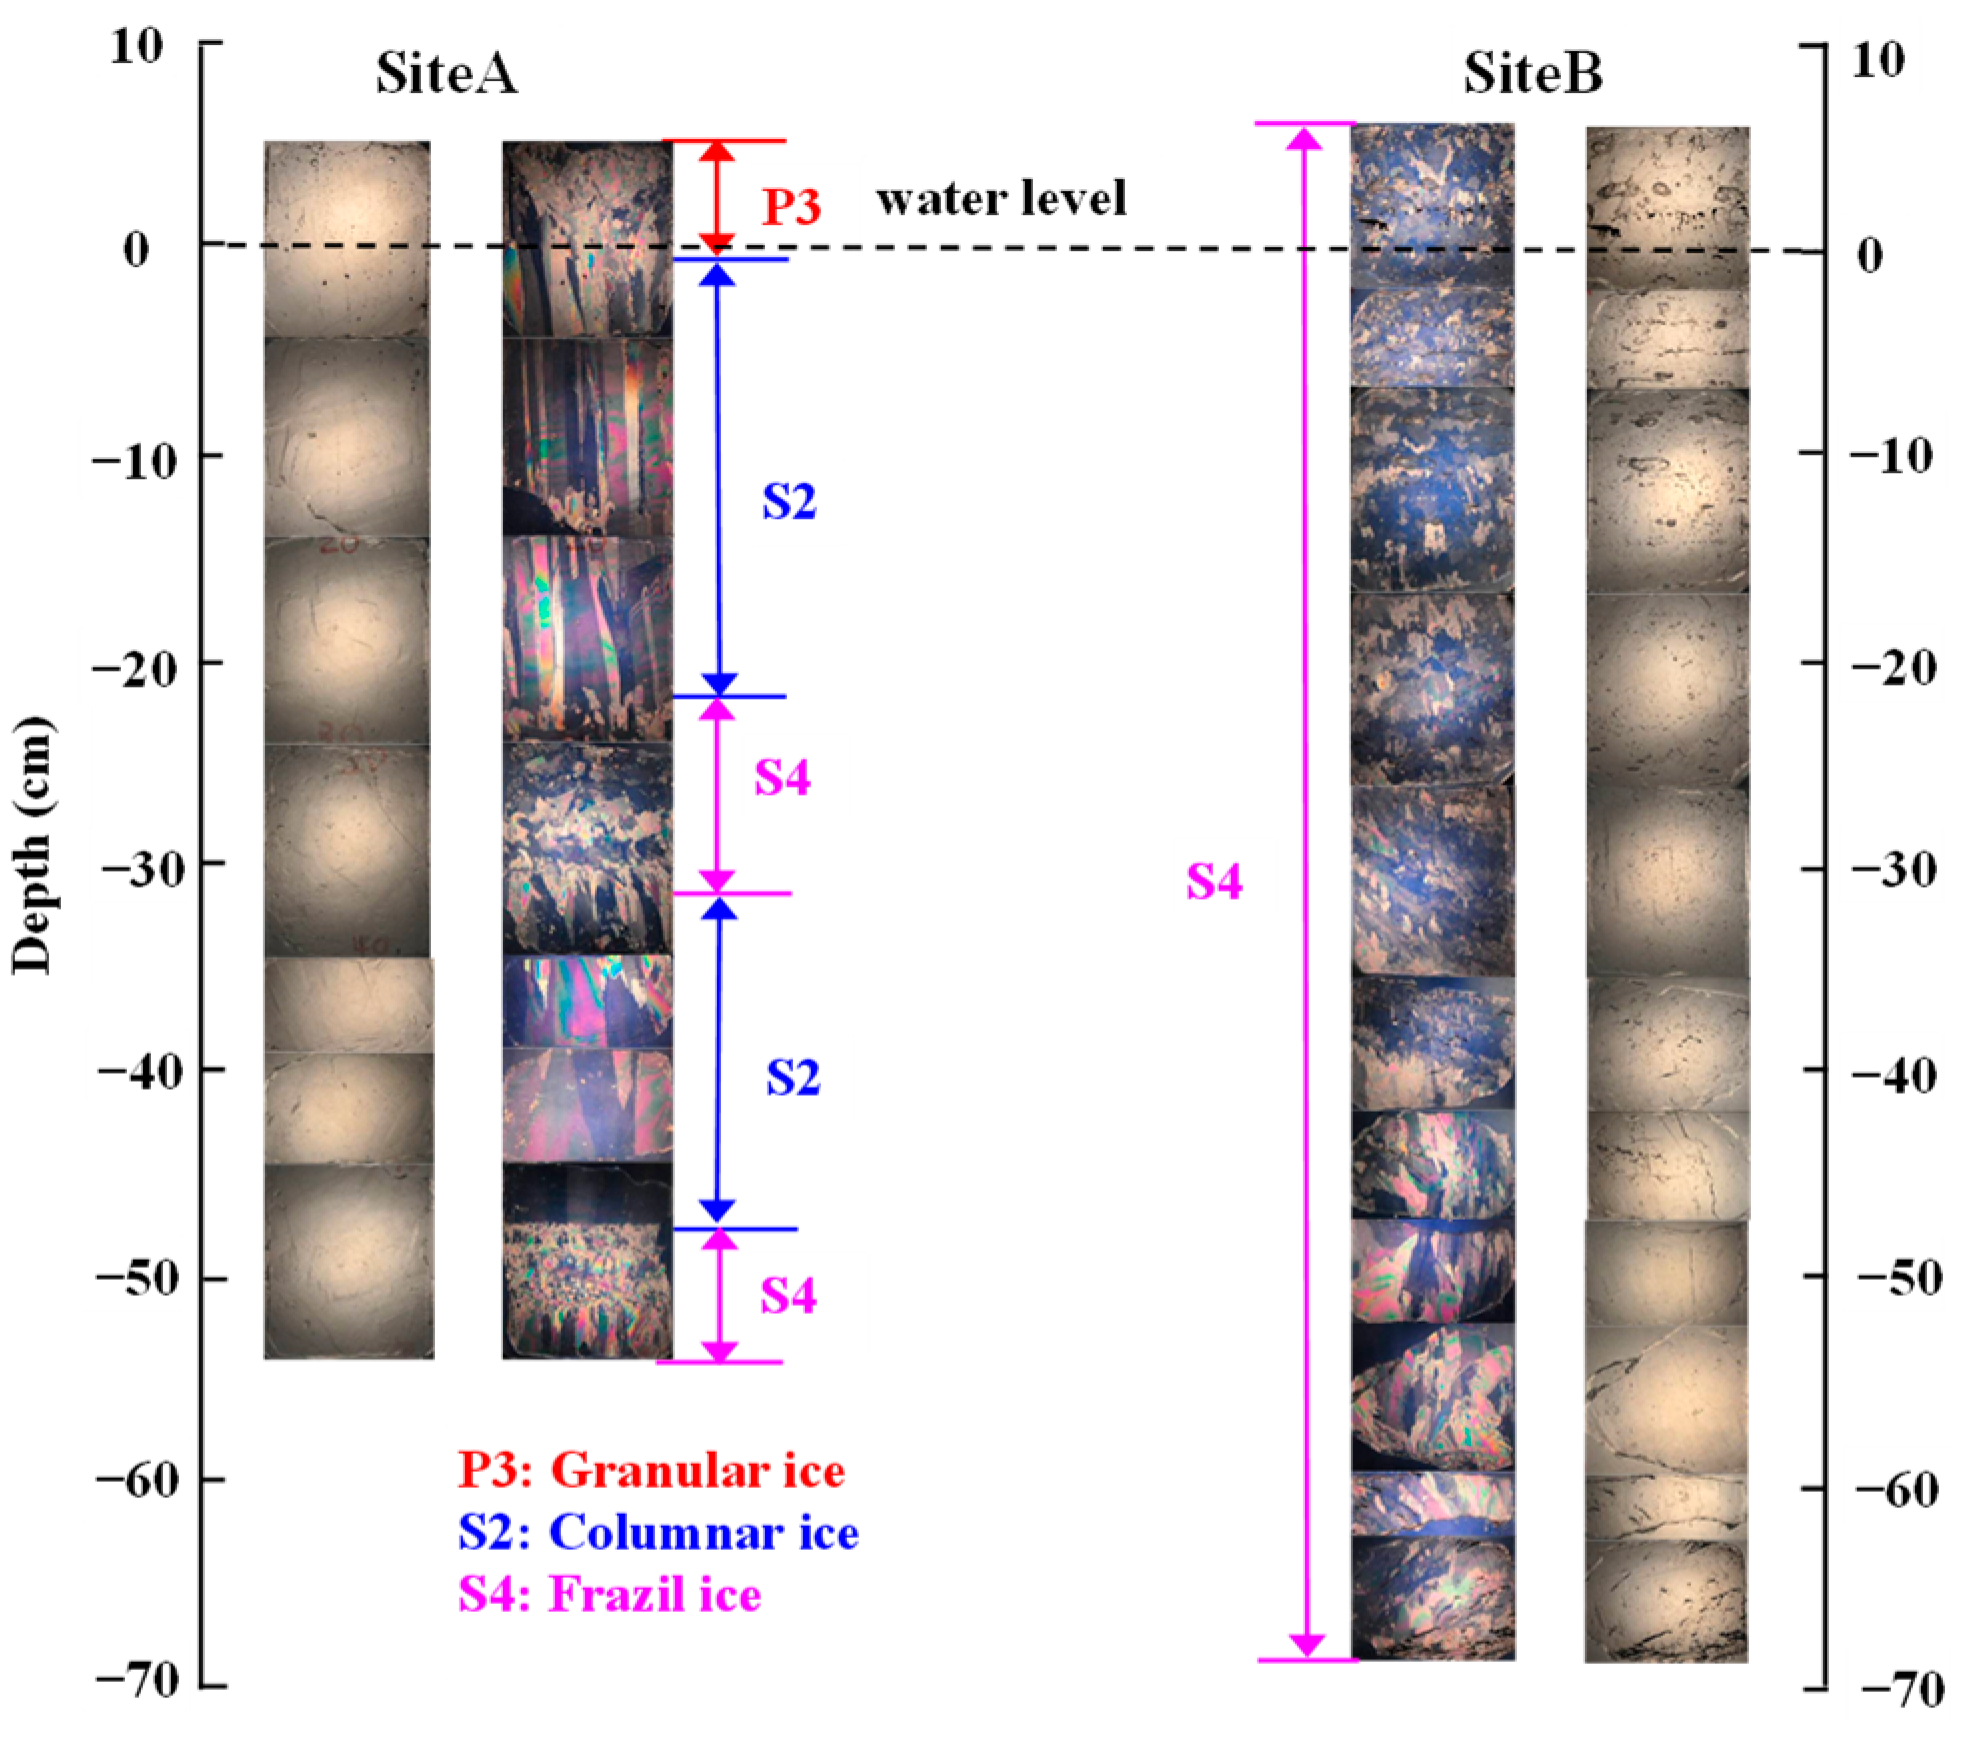
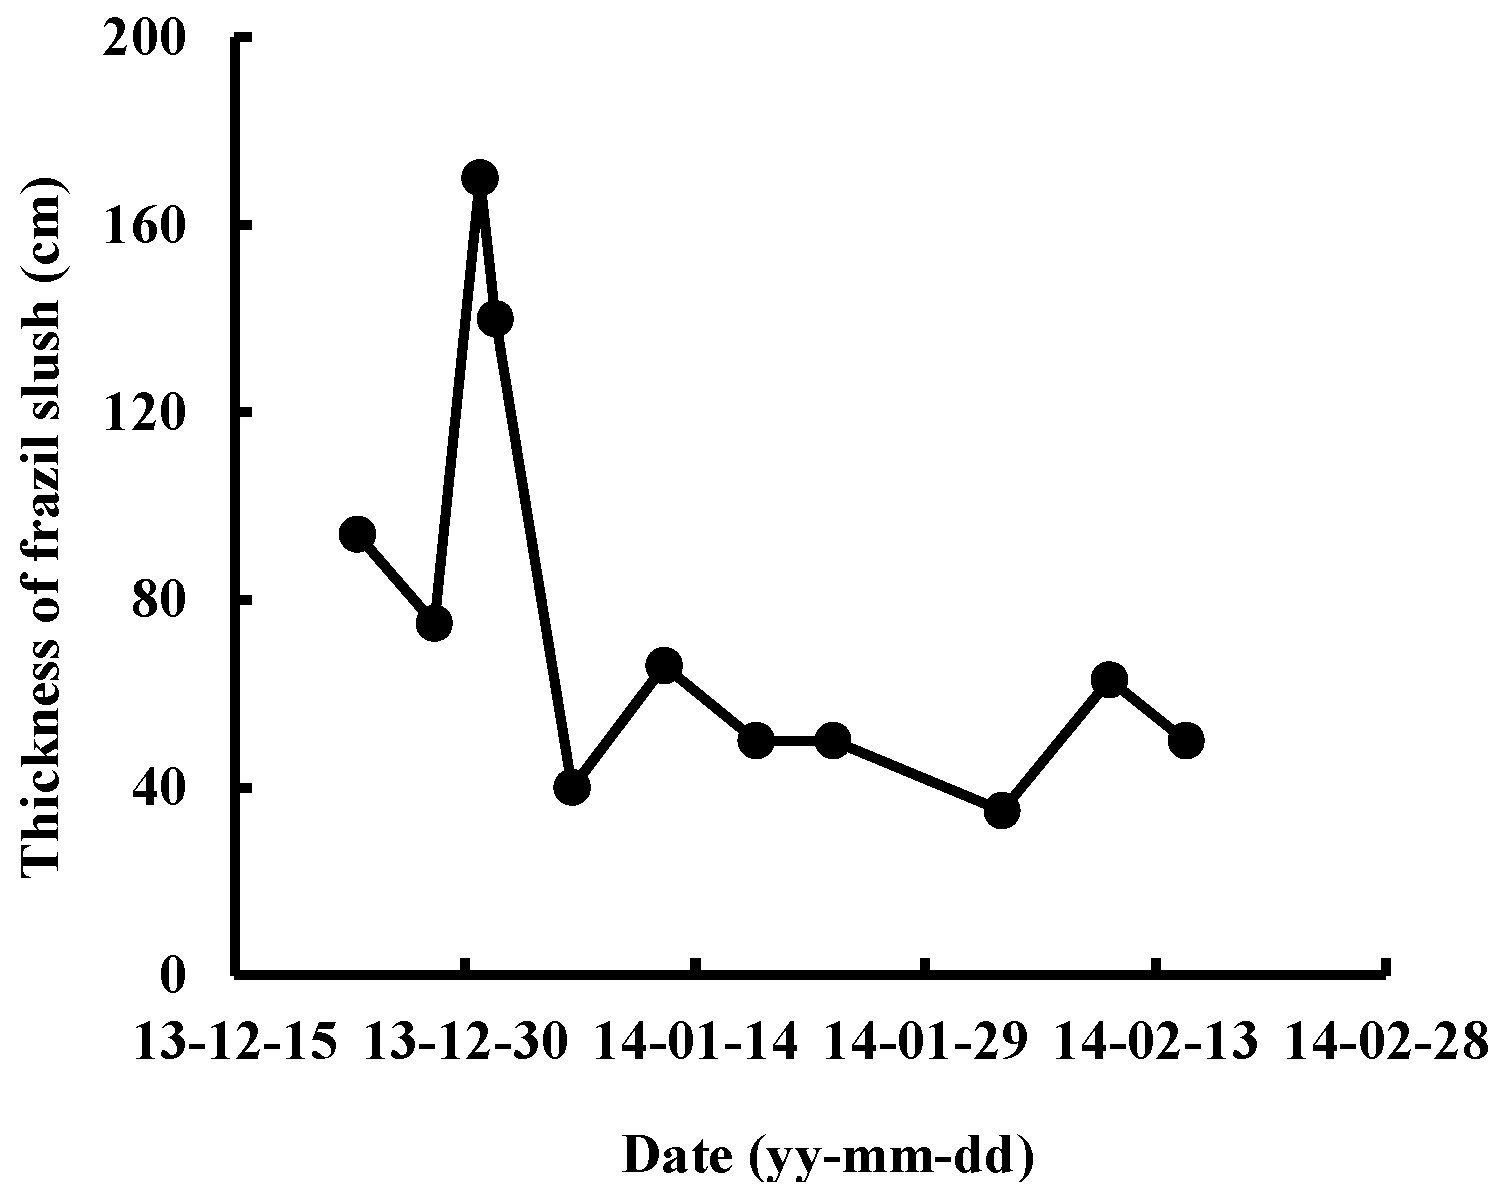
We collected a series of 0.09 m diameter ice cores for textural and structural analyses on 15 February 2014; at this time, the ice thickness was 0.600 m at Site A and 0.780 m at Site B. Vertical thin sections viewed under polarized and normal light revealed the crystalline structure and defects (i.e., gas bubbles and sand particles) in river ice. We collected three types of ice—frazil, granular, and columnar—from the Toudaoguai Hydrological Station section (Figure 5). The ice forming at the beginning of winter at Site A comprised granular ice in a layer about 0.05 m thick. Columnar and frazil ice were alternately distributed beneath this layer, while at Site B, the ice comprised frazil ice, attributed to slush accumulation (Figure 6). According to the variation of the thickness of frazil slush and field observation, it was found that the frazil slush suspended in water and transported under the ice cover throughout the winter; during the initial freeze-up stage, frazil slush in the flow accumulated along the underside of the ice cover due to jams, forming a maximum slush thickness of 1.70 m by 31 December 2013. Following the initiation of ice cover, energy exchange over the top of this layer and frazil slush led to the formation of frazil ice.
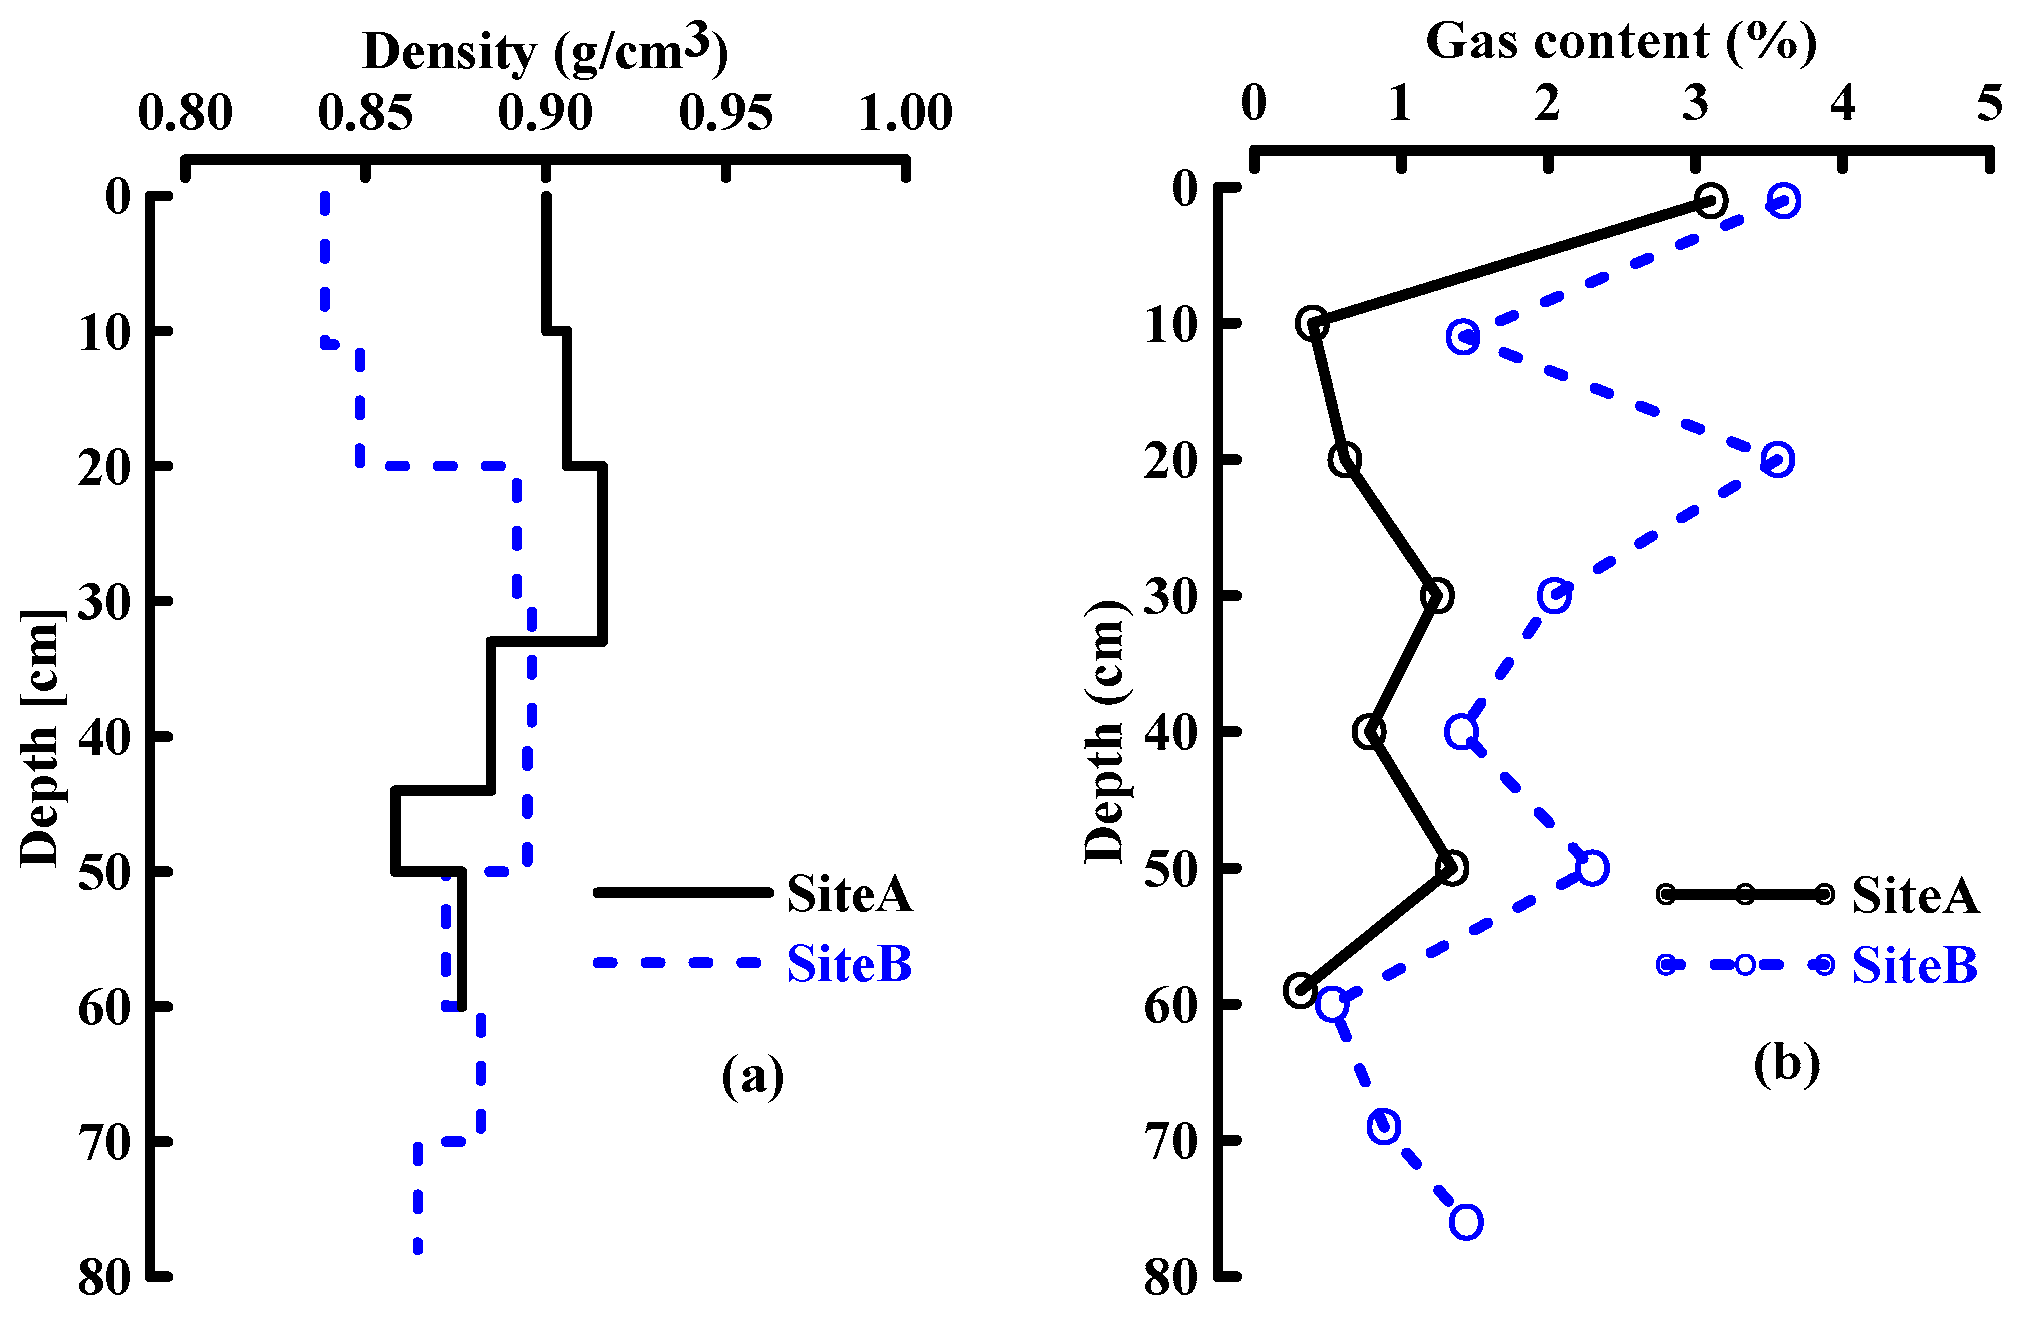
We measured ice density using the mass-volume method. A gas/ice horizontal thin section image was photographed under normal light, and the ice gas content was calculated using MATLAB software. Vertical density profiles and ice core gas contents are shown in Figure 7; it is noteworthy that frazil ice from Site B has a higher gas content than the pure thermal growth ice that contains intermittent frazil ice from Site A. Results show that the gas content of the frazil ice layer at core Site A is about 1.3% larger than adjacent columnar ice layers. Ice density is also negatively correlated with gas content; the density at Site B was less than 900 kg/m3 but increased with depth as gas content decreased.
3.2. Interpretation of GPR Image
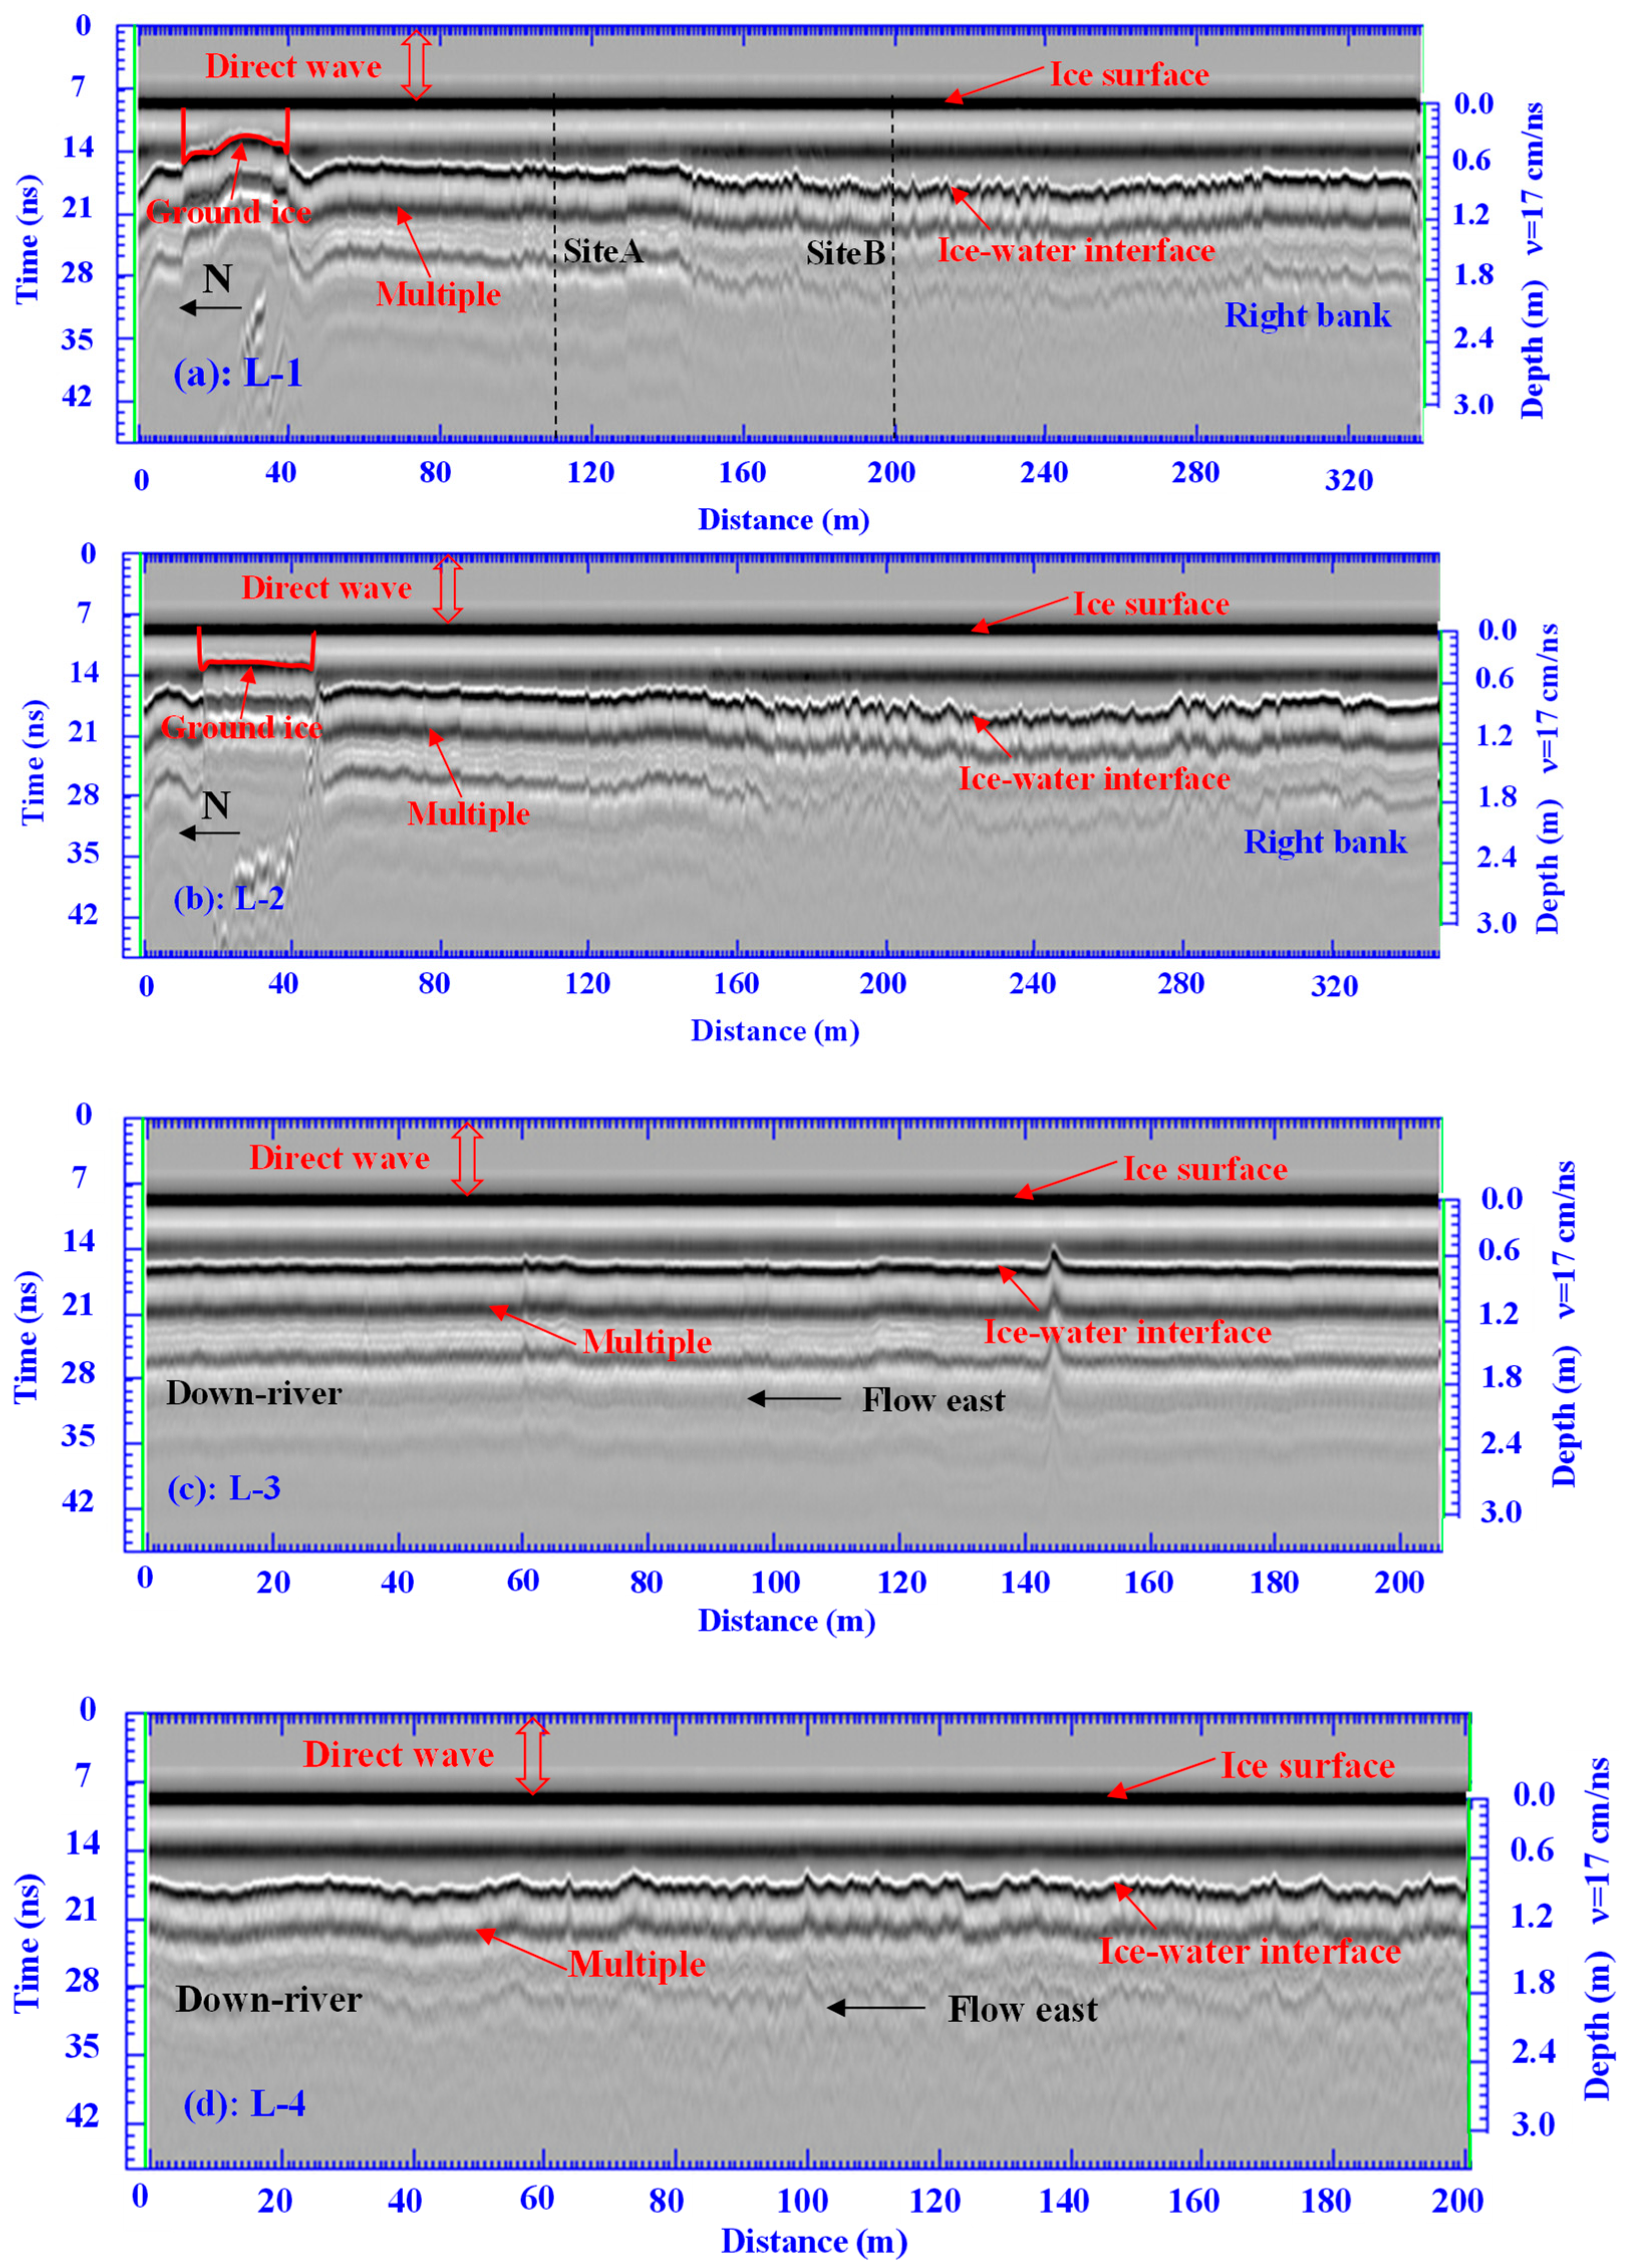
Radar investigations comprise measurements of wave propagation time; thus, once EM wave propagation speed is known, it is possible to accurately derive ice cover reflector depth. The EM propagation speed is then determined by the electrical properties of a material; in pure ice, for example, EM speed ranges between 0.1667 m/ns and 0.1700 m/ns [19]. In this study, depth on the right vertical axis of Figure 8 was estimated using a signal velocity of 0.17 m/ns for freshwater ice.
As shown in Figure 8, radar images provide clear cross-sections of ice cover. As expected, we observed significant reflections from the air–ice and ice–water interfaces; the distribution of ice thickness was uneven in the L-1 and L-2 surveys because cover was thinner on the left side (Figure 8a,b) and a 25 m wide section of grounded ice was present near to the left bank of the shallow water area. In this area, radar signal also revealed a strong and continuous reflection from the ice–sediment interface. Ice thickness was also not homogeneous on the right section because this region comprised frazil ice attributed to slush accumulation. In addition, survey L-4, parallel to the river course, showed that frazil ice thickness was not homogeneous (Figure 8d), while the radar result from survey line L-3 showed a more uniform distribution of ice thickness (Figure 8c).
3.3. Dielectric Permittivities of River Ice
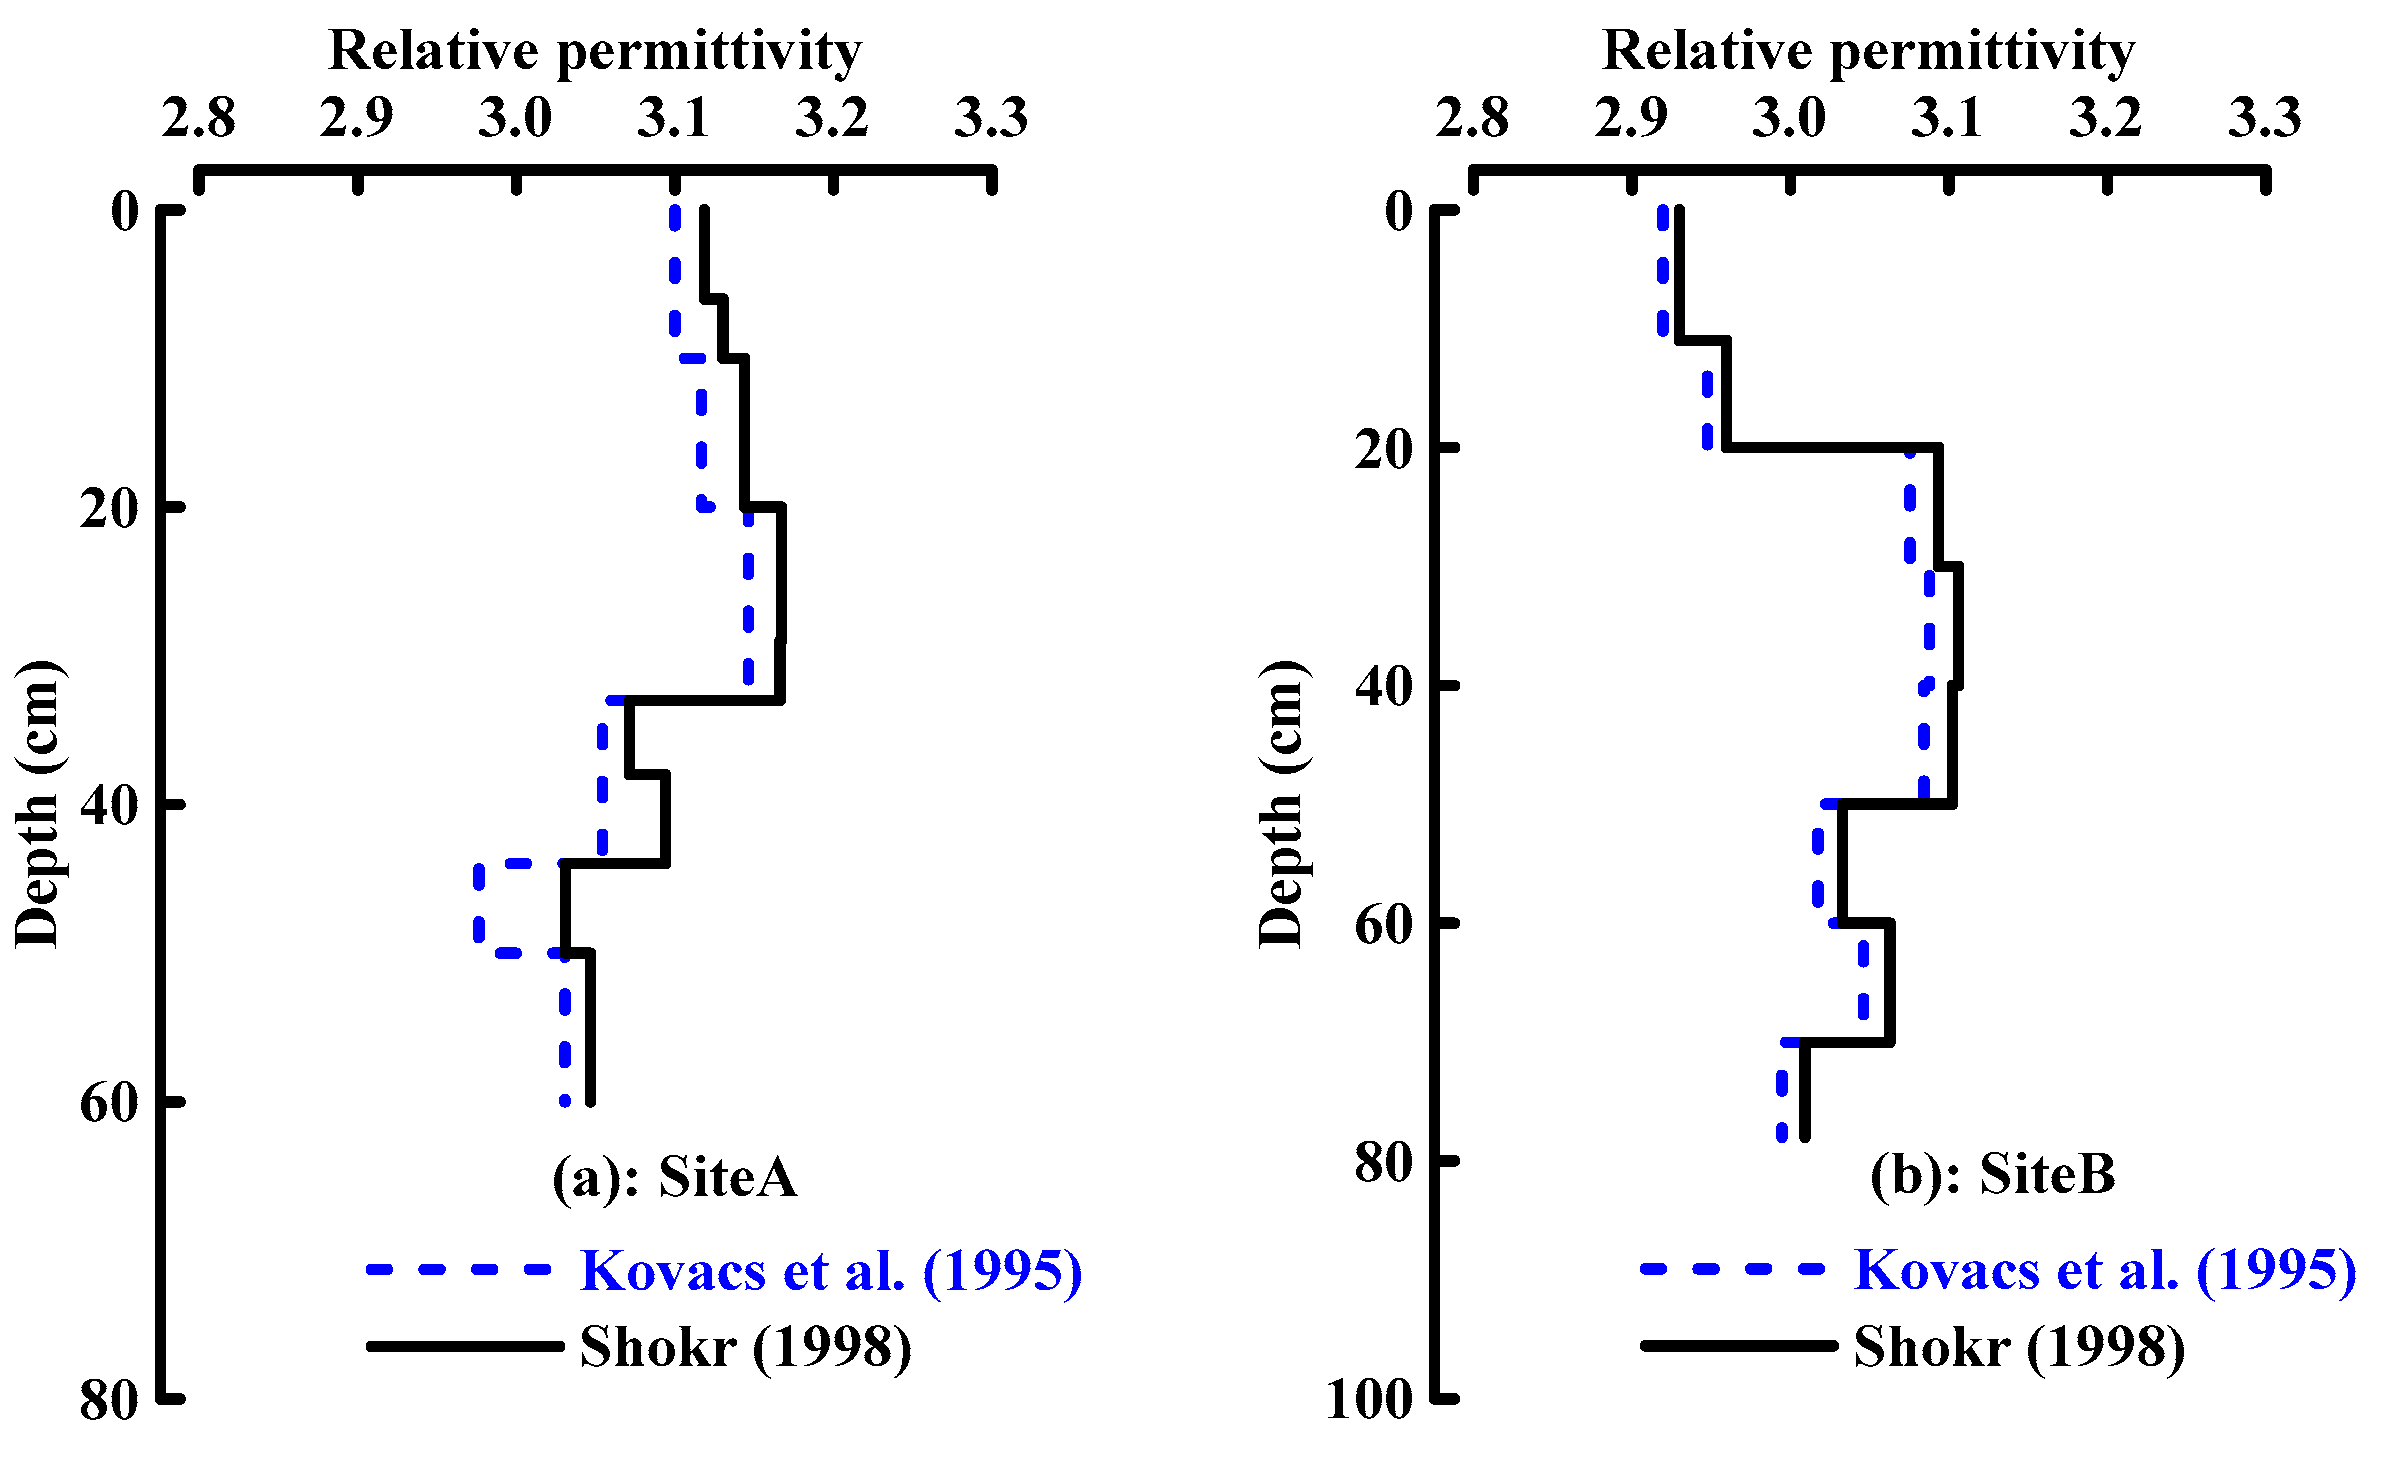
Because gas bubbles are randomly distributed spheres in frazil ice, similar to the granular case, the formula for the latter can be used to calculate the dielectric permittivity for the former. Thus, applying Equations (5)–(9) as well as the physical properties of ice at Site A and Site B on 15 February 2014, we calculated the dielectric permittivities for river ice. Significant differences were not found between the results of the two calculations (Figure 9) for frazil ice at Site B, while the difference was larger for the columnar ice at Site A.
The equivalent dielectric permittivities of river ice calculated using the radar method were derived using Equation (4) based on the round-trip travel times and drilled ice thicknesses. As shown in Table 1, the equivalent dielectric permittivities of river ice calculated using the radar method were higher than results derived from empirical formulae based on ice density [40]. At the same time, the gas bubble volume content was between 11.95% and 13.0% at Site A and between 7.9% and 8.6% at Site B. Measurements of in situ ice taken on 15 February 2014 show that the average temperature was −2.45 °C at Site A and −3.24 °C at Site B. It is therefore likely that the river ice was composed of crystals, gas bubbles, and impurities and did not contain liquid water at this time. In particular, the equivalent dielectric permittivity of this river ice was so high that it was likely caused by impurities; Evans [43] discussed how the presence of impurities in snow increased values of the dielectric permittivity, and the same is likely true for ice. Previous results show that the annual average suspended sediment concentration in Yellow River water at the Toudaoguai Hydrological Station was about 2.5‰ (2.5 kg/m3) between 1987 and 2010 [44]. The suspended sediment in river water mainly comprises silts and sands, which participate in ice freezing and thawing processes. We therefore analyzed the ice sediment content (Figure 10); the results show that sediment concentration ranged between 0.11‰ and 0.57‰ and that the average at Site A was 0.24‰. Although the sediment concentration of ice was about one-tenth that of the suspended sediment concentration in water, particles in the former (i.e., silts and sands) had significantly higher dielectric permittivities [45,46]. It is therefore likely that sediment content influences the equivalent dielectric permittivities of river ice when the radar method is used for calculations. Unfortunately, however, our existing experimental data are insufficient to build a model that encompasses ice sediment concentration and enables the estimation of the river ice dielectric permittivity.
4. Discussion
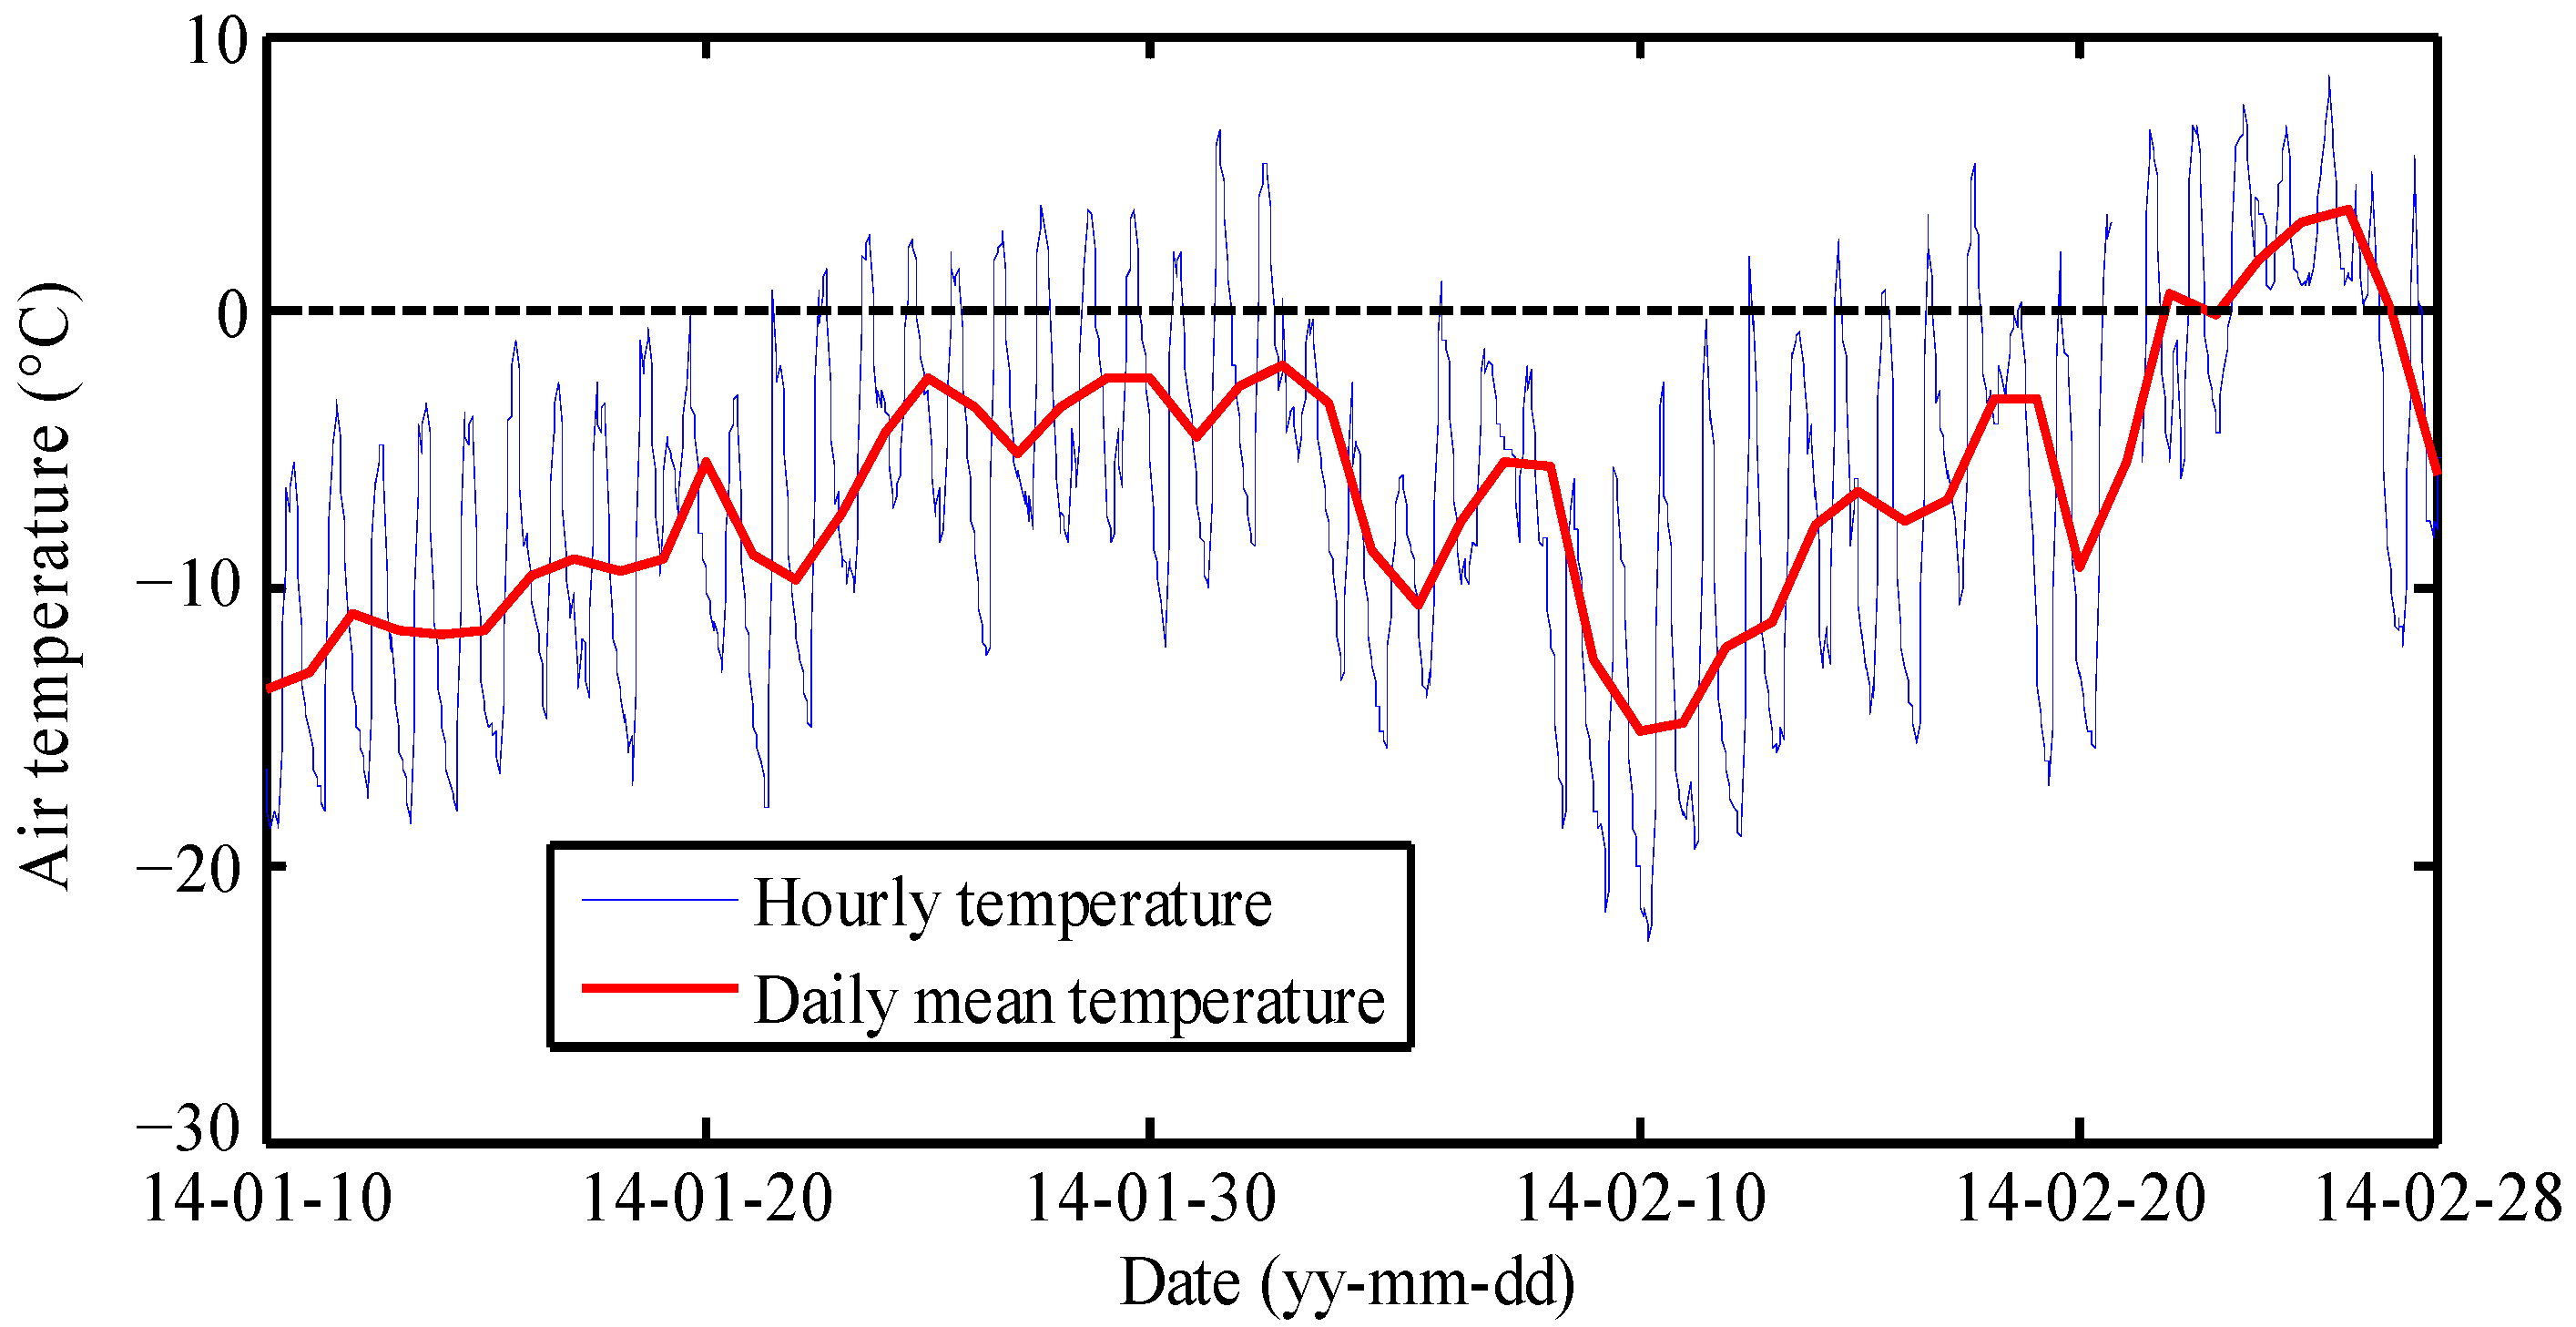
In addition to impurities, it is well-known that temperature can also impact the dielectric permittivity of ice. This is because the internal structure changes as ice temperature increases and approaches the melting point. Thus, in order to analyze the relationship between the ice dielectric permittivity and temperature, we first evaluated the latter for both air and ice. Results show (Figure 11) that air temperature rose gradually between 10 January 2014 and 1 February 2014, especially the daytime temperature after 21 January 2014, which became positive. This increase in air temperature also resulted in a rise in ice temperature and melting; as a result, ice surface melting was initiated at both Site A and Site B. Bottom melting at the ice–water interface also led to the thinning of ice at Site A during this period. Another period of increasing temperatures was seen between 9 February 2014 and 25 February 2014; ice temperature rose close to 0 °C near to the end of this period of increase (Figure 12).
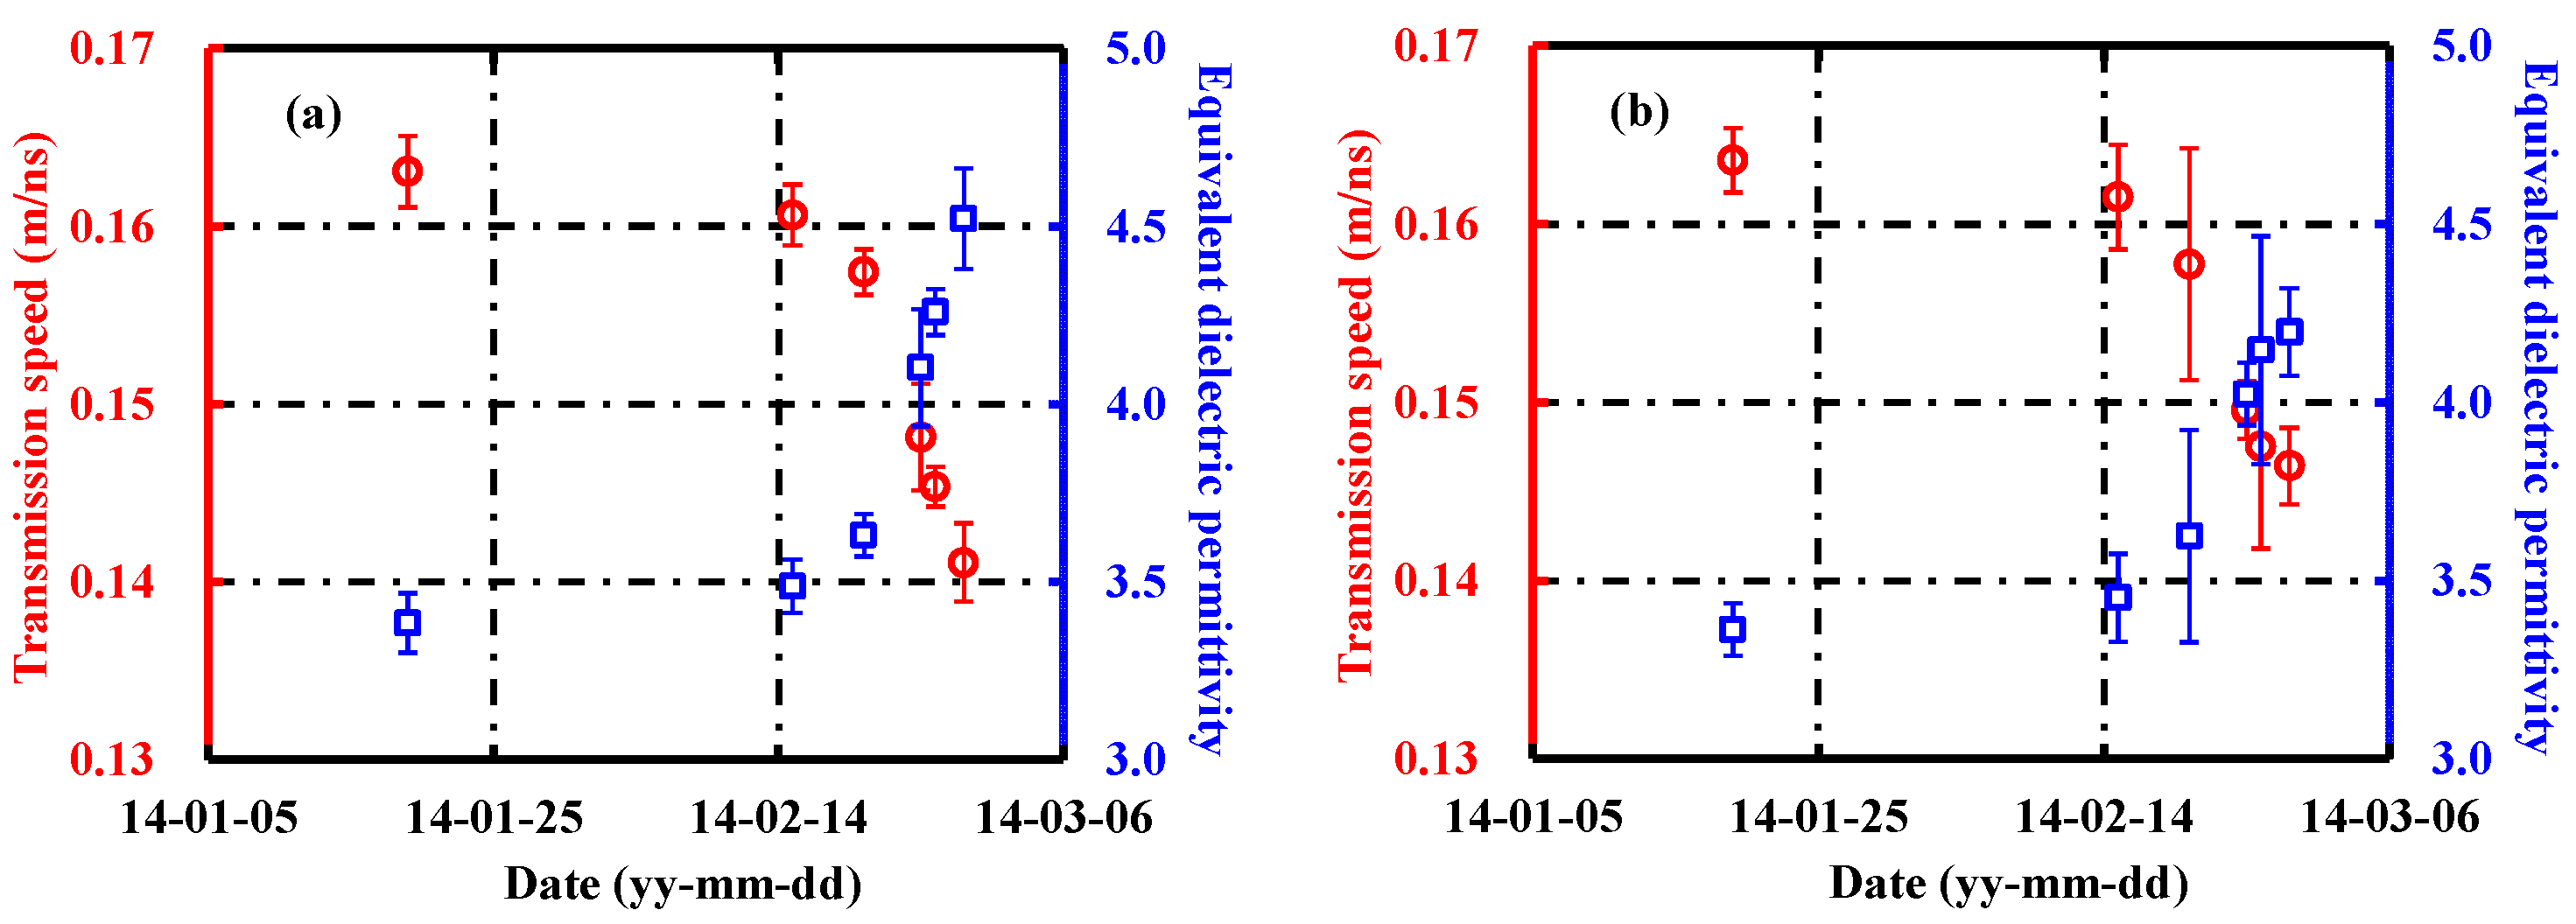
We computed radar transmission speeds in river ice using travel times and ice thicknesses measured at a number of locations. Results show (Figure 13) that these speeds in river ice were between 0.141 m/ns and 0.164 m/ns, lower than those observed in ‘pure’ ice. This result is consistent with previously published data; for example, Moorman and Michel [46] noted that ice melting on Bulb and Kame lakes had transmission speeds of 0.133 m/ns and 0.140 m/ns, respectively. These workers were also able to clarify that the slower velocity measured in river ice compared to ‘pure’ ice is the result of unfrozen water content. Indeed, even outside the melting period, radar transmission speeds measured in natural ice are normally lower than the 0.17 m/ns that characterizes ‘pure’ ice. Hausmann and Behm [47] measured transmission speeds of cave ice between 10.157 m/ns and 0.169 m/ns, while Stoyanovich et al. [48] reported ice EM propagation velocity to be 0.154 m/ns. These data also suggest that radar transmission speeds in natural ice are highly variable; consequently, the dielectric permittivity of natural ice is not always equal to 3.17. Our results also suggest that the dielectric permittivity of ice increases in concert with ice temperature; data show that average ice temperature was −2.85 °C at Site A and −3.32 °C at Site B on 19 January 2014, during the coldest period of the whole freezing cycle. At the same time, the radar transmission speed of a pulse through river ice was 0.163 m/ns, while the equivalent dielectric permittivity was around 3.4 at Site A and Site B based on drill-hole thickness data. Data show that as spring approached, ice temperature gradually increased and was generally above −2.00 °C on 24 February 2014. Finally, after two days of rapid increases, ice temperature was close to 0 °C on 27 February 2014. Equivalent dielectric permittivities also increased rapidly over this period (Figure 13), especially when the ice temperature was close to 0 °C. This is because the dielectric permittivity of water is obviously higher than ice, while the inevitable presence of unfrozen water within ice causes an increase in the dielectric permittivity as the temperature approaches 0 °C. Previous studies that have used GPR to assess winter roads have shown that radar transmission speeds are strongly dependent on ice thickness; thus, the inherent nature of depth analysis means that the presence of unfrozen water in ice will be the main factor influencing calculations [49]. You et al. [50] also reported the average velocities decreased slightly with a rise in the unfrozen water content in the ice.
During our whole observation period, the minimum equivalent dielectric permittivity of the Yellow River ice was 3.4 ± 0.1 when the average ice temperature was between −2.85 °C and −3.32 °C on 19 January 2014, which was higher than laboratory measurements of the artificial ice reported in previous studies. Bohleber et al. [51,52] reported that the mean value of the relative permittivity of the artificial ice grown from ultra-pure water is 3.18 ± 0.01 at −20 °C. We believe that the difference of the dielectric permittivity between the river ice and pure ice is due to the different physical properties of ice. Regardless of ice impurities or the effect of ice temperature, radar transmission speeds in river ice can ultimately be attributed to the influence of the internal structure on the dielectric permittivity. The influence of ice temperature on radar transmission speed is affected by varying the percentage of liquid water in the ice; indeed, establishing a relationship between the liquid water percentage and the ice dielectric permittivity is the most scientific method to evaluate radar transmission speeds in river ice. However, it is difficult to measure the percentage of liquid water directly, which limits our ability to establish a relationship between the dielectric permittivity and the liquid water percentage. Thus, our approach to address the relationship between ice temperature and the dielectric permittivity of river ice provides a method for assessing high-temperature ice, which can be used to evaluate radar transmission speeds. Accurate measurement of ice thickness can nevertheless be achieved via the use of GPR at the end of the winter.
5. Concluding Remarks
We conducted a series of GPR measurements in 2014 on river ice thicknesses at the Toudaoguai Hydrological Station section of the upper Yellow River, China. This field investigation utilized four survey lines, of which two were perpendicular to the river course, while another two ran parallel. Our results show that ice cover formed by the accumulation of frazil ice was not homogeneous in the right part of river, while ice cover that formed via thermodynamic processes was more uniformly distributed on the left side of the river.
In order to use GPR to measure ice thickness, it is necessary to know the round-trip travel time of EM waves as well as radar transmission speed. Because it is possible to obtain accurate round-trip travel times in ice as part of the measurement process, radar transmission speed, determined by the dielectric permittivity, is the main factor that influences accuracy. Thus, in order to ensure measurement precision, in situ calibration is necessary to determine radar transmission speed or the equivalent dielectric permittivity of ice. We therefore investigated the effects of variable physical properties on the dielectric permittivity of river ice; the results reveal that equivalent dielectric permittivities of river ice calculated using the radar method are greater than those based on empirical formulae for ice density [40] and volume fraction [41], directly attributable to the concentration of sediment in ice. The effect of ice temperature on the dielectric permittivity of ice is affected by changes in the percentage of liquid water in ice; our results show that the equivalent dielectric permittivity of ice increases in concert with ice temperature.
Thus, while GPR can be used to rapidly measure the total thickness of ice, it cannot be used to determine changes in spatial thickness caused by uneven ice surface fluctuations. We therefore recommend that future studies employ real-time kinematic techniques to measure ice surface elevation changes and combine them with total ice thicknesses obtained using GPR measurements to evaluate fluctuations in the surfaces and bases of ice.
Author Contributions
Conceptualization, H.H. and E.W.; methodology, H.H., E.W., X.L. and H.J.; formal analysis, H.H. and W.L.; investigation, H.H.; data curation, H.H., Y.L., W.L. and X.L.; writing—original draft preparation, H.H. and Y.L.; writing—review and editing, H.J.; funding acquisition, E.W. All authors have read and agreed to the published version of the manuscript.
Funding
This research was supported by Natural Science Foundation of Heilongjiang Province of China (No. LH2020E004), the National Natural Science Foundation of China (41876213), and the Project to Support the Development of Young Talent by Northeast Agricultural University.
Data Availability Statement
The data are available upon request.
Conflicts of Interest
The authors declare no conflict of interest.
References
- Frenette, J.J.; Thibeault, P.; Lapierre, J.F.; Hamilton, P.B. Presence of algae in freshwater ice cover of fluvial LAC Saint-Pierre (St. Lawrence River, Canada). J. Phycol. 2008, 44, 284–291. [Google Scholar] [CrossRef] [PubMed]
- Brooks, R.N.; Prowse, T.D.; O’Connell, I.J. Quantifying Northern Hemisphere freshwater ice. Geophys. Res. Lett. 2013, 40, 1128–1131. [Google Scholar] [CrossRef]
- Prowse, T.; Alfredsen, K.; Beltaos, S.; Bonsal, B.; Duguay, C.; Korhola, A.; McNamara, J.; Vincent, W.F.; Vuglinsky, V.; Weyhenmeyer, G.A. Arctic freshwater ice and its climatic role. AMBIO 2011, 40, 46–52. [Google Scholar] [CrossRef] [Green Version]
- Ferrick, M.G.; Mulherin, N.D. Framework for control of dynamic ice breakup by river regulation: Regulated Rivers. Res. Manag. 1989, 3, 79–92. [Google Scholar] [CrossRef] [Green Version]
- Mahabir, C.; Hicks, F.; Fayek, A.R. Neuro-fuzzy river ice breakup forecasting system. Cold Reg. Sci. Technol. 2006, 46, 100–112. [Google Scholar] [CrossRef]
- Reynolds, J.M. An Introduction to Applied and Environmental Geophysics; Wiley: New York, NY, USA, 1997; p. 796. [Google Scholar]
- Neal, A. Ground-penetrating radar and its use in sedimentology: Principles, problems and progress. Earth-Sci. Rev. 2004, 66, 261–330. [Google Scholar] [CrossRef]
- Annan, A.P.; Davis, J.L. Design and development of a digital ground penetrating radar system. In Ground Penetrating Radar; Canada Communication Group: Ottawa, ON, Canada, 1992; pp. 15–23. [Google Scholar]
- Binder, D.; Brückl, E.; Roch, K.H.; Behm, M.; Schöner, W.; Hynek, B. Determination of total ice volume and ice-thickness distribution of two glaciers in the Hohe Tauern region, Eastern Alps, from GPR data. Ann. Glaciol. 2009, 50, 71–79. [Google Scholar] [CrossRef] [Green Version]
- Cui, X.B.; Sun, B.; Tian, G.; Tang, X.Y.; Zhang, X.P.; Jiang, Y.Y.; Guo, J.X.; Li, X. Ice radar investigation at Dome A, East Antarctica: Ice thickness and subglacial topography. Chin. Sci. Bull. 2010, 55, 425–431. [Google Scholar] [CrossRef]
- Saintenoy, A.; Friedt, J.M.; Booth, A.D.; Tolle, F.; Bernard, E.; Laffly, D.; Marlin, C.; Griselin, M. Deriving ice thickness, glacier volume and bedrock morphology of Austre Lovénbreen (Svalbard) using GPR. Near Surf. Geophys. 2013, 11, 253–261. [Google Scholar] [CrossRef]
- Bohleber, P.; Sold, L.; Hardy, D.R.; Schwikowski, M.; Klenk, P.; Fischer, A.; Sirguey, P.; Cullen, N.J.; Potocki, M.; Hoffmann, H.; et al. Ground-penetrating radar reveals ice thickness and undisturbed englacial layers at Kilimanjaro’s Northern Ice Field. Cryosphere 2017, 11, 469–482. [Google Scholar] [CrossRef] [Green Version]
- Langhammer, L.; Rabenstein, L.; Bauder, A.; Maurer, H. Ground-penetrating radar antenna orientation effects on temperate mountain glaciers. Geophysics 2017, 82, H15–H24. [Google Scholar] [CrossRef]
- Mccarthy, M.; Pritchard, H.; Willis, I.; King, E. Ground-penetrating radar measurements of debris thickness on Lirung Glacier, Nepal. J. Glaciol. 2017, 63, 543–555. [Google Scholar] [CrossRef] [Green Version]
- Li, Y.; Li, Z.; Wang, N. Ice thickness sounded by ground penetrating radar on the Meikuang Glacier in the Eastern Kunlun Mountains. J. Glaciol. Geocryol. 2018, 40, 38–46. (in Chinese). [Google Scholar] [CrossRef]
- Mishra, A.; Negi, B.D.S.; Banerjee, A.; Nainwal, H.C.; Shankar, R. Estimation of ice thickness of the Satopanth Glacier, Central Himalaya using ground penetrating radar. Curr. Sci. India 2018, 114, 785–791. [Google Scholar] [CrossRef]
- Kanagaratnam, P.; Markus, T.; Lytle, V.; Heavey, B.; Jansen, P.; Prescott, G.; Gogineni, S.P. Ultrawideband radar measurements of thickness of snow over sea ice. IEEE Trans. Geosci. Remote Sens. 2007, 45, 2715–2724. [Google Scholar] [CrossRef]
- Galley, R.J.; Trachtenberg, M.; Langlois, A.; Barber, D.G.; Shafai, L. Observations of geophysical and dielectric properties and ground penetrating radar signatures for discrimination of snow, sea ice and freshwater ice thickness. Cold Reg. Sci. Technol. 2009, 57, 29–38. [Google Scholar] [CrossRef]
- Liu, H.; Takahashi, K.; Sato, M. Measurement of dielectric permittivity and thickness of snow and ice on a brackish lagoon using GPR. IEEE J-STARS 2014, 7, 820–827. [Google Scholar] [CrossRef]
- Lundberg, A.; Thunehed, H. Snow wetness influence on impulse radar snow surveys: Theoretical and laboratory study. Nord. Hydrol. 2000, 31, 89–106. [Google Scholar] [CrossRef]
- Bradford, J.H.; Harper, J.T.; Brown, J. Complex dielectric permittivity measurements from ground-penetrating radar data to estimate snow liquid water content in the pendular regime. Water Resour. Res. 2009, 45, W08403. [Google Scholar] [CrossRef] [Green Version]
- Sundström, N.; Gustafsson, D.; Kruglyak, A. Lundberg, A. Field evaluation of a new method for estimation of liquid water content and snow water equivalent of wet snowpacks with GPR. Hydrol. Res. 2013, 44, 600–613. [Google Scholar] [CrossRef]
- Previati, M.; Godio, A.; Ferraris, S. Validation of spatial variability of snowpack thickness and density obtained with GPR and TDR methods. J. Appl. Geophys. 2011, 75, 284–293. [Google Scholar] [CrossRef]
- Forte, E.; Dossi, M.; Colucci, R.R.; Pipan, M. A new fast methodology to estimate the density of frozen materials by means of common offset GPR data. J. Appl. Geophys. 2013, 99, 135–145. [Google Scholar] [CrossRef]
- Godio, A.; Frigo, B.; Chiaia, B.; Maggioni, P.; Freppaz, M.; Ceaglio, E.; Dellavedova, P. Integration of upward GPR and water content reflectometry to monitor snow properties. Near Surf. Geophys. 2018, 16, 1–10. [Google Scholar] [CrossRef]
- Holbrook, W.S.; Miller, S.N.; Provart, M.A. Estimating snow water equivalent over long mountain transects using snowmobile-mounted ground-penetrating radar. Geophysics 2016, 81, WA183–WA193. [Google Scholar] [CrossRef]
- Webb, R.W. Using ground penetrating radar to assess the variability of snow water equivalent and melt in a mixed canopy forest, Northern Colorado. Front. Earth Sci. 2017, 11, 482–495. [Google Scholar] [CrossRef]
- Li, Z.; Li, C.; Yang, Y.; Zhang, B.; Deng, Y.; Li, G. Physical scheme and parametrization by using air temperature and ice thickness to improve accuracy of GPR propagation velocity in Yellow River ice. J. Hydraul. Eng. 2022, 53, 902–913. [Google Scholar] [CrossRef]
- Best, H.; Mcnamara, J.P.; Liberty, L. Association of ice and river channel morphology determined using ground-penetrating radar in the Kuparuk River, Alaska. Arct. Antarct. Alp. Res. 2005, 37, 157–162. [Google Scholar] [CrossRef] [Green Version]
- Fu, H.; Liu, Z.; Guo, X.; Cui, H. Double-frequency ground penetrating radar for measurement of ice thickness and water depth in rivers and canals: Development, verification and application. Cold Reg. Sci. Technol. 2018, 154, 85–94. [Google Scholar] [CrossRef]
- Li, T.; Zhao, J.; Jiao, Y.; Hou, J.; Mu, L. Regional characteristics of sea ice thickness in Canadian shelf and Arctic Archipelago measured by Ground Penetrating Radar. Acta Oceanol. Sin. 2015, 34, 110–116. [Google Scholar] [CrossRef]
- Li, Z.J.; Jia, Q.; Zhang, B.S.; Leppäranta, M.; Huang, W.F. Influences of gas bubble and ice density on ice thickness measurement by GPR. Appl. Geophys. 2010, 7, 105–113. [Google Scholar] [CrossRef]
- Stevens, C.W.; Moorman, B.J.; Solomon, S.M.; Hugenholtz, C.H. Mapping subsurface conditions within the near-shore zone of an Arctic delta using ground penetrating radar. Cold Reg. Sci. Technol. 2009, 56, 30–38. [Google Scholar] [CrossRef]
- Jones, B.M.; Gusmeroli, A.; Arp, C.D.; Strozzi, T.; Grosse, G.; Gaglioti, B.V.; Whitman, M.S. Classification of freshwater ice conditions on the Alaskan Arctic Coastal Plain using ground penetrating radar and TerraSAR-X satellite data. Int. J. Remote Sens. 2013, 34, 8267–8279. [Google Scholar] [CrossRef]
- Fantello, N.; Parsekian, A.D.; Anthony, K.M.W. Estimating winter ebullition bubble volume in lake ice using ground-penetrating radar. Geophysics 2017, 83, H13–H25. [Google Scholar] [CrossRef]
- Xu, J.; Cheng, D. Relation between the erosion and sedimentation zones in the Yellow River, China. Geomorphology 2002, 48, 365–382. [Google Scholar] [CrossRef]
- Ran, L.; Wang, S.; Fan, X. Channel change at Toudaoguai Station and its responses to the operation of upstream reservoirs in the upper Yellow River. J. Geogr. Sci. 2010, 20, 231–247. [Google Scholar] [CrossRef]
- Wang, T.; Yang, K.; Guo, Y. Application of artificial neural networks to forecasting ice conditions of the Yellow River in the Inner Mongolia Reach. J. Hydrol. Eng. 2008, 13, 811–816. [Google Scholar] [CrossRef]
- Ji, H.L.; Zhang, A.D.; Gao, R.Z.; Zhang, B.S.; Xu, J. Application of the break-up date prediction model in the Inner Mongolia Reach of the Yellow River. Adv. Sci. Technol. Water Resour. 2012, 32, 42–45. (in Chinese). [Google Scholar] [CrossRef]
- Kovacs, A.; Gow, A.J.; Morey, R.M. The in-situ dielectric constant of polar firn revisited. Cold Reg. Sci. Technol. 1995, 23, 245–256. [Google Scholar] [CrossRef]
- Shokr, M.E. Field observations and model calculations of dielectric properties of Arctic sea ice in the microwave C-band. IEEE Trans. Geosci. Remote Sens. 1998, 36, 463–478. [Google Scholar] [CrossRef]
- Gherboudj, I.; Bernier, M.; Hicks, F.; Leconte, R. Physical characterization of air inclusions in river ice. Cold Reg. Sci. Technol. 2007, 49, 179–194. [Google Scholar] [CrossRef]
- Evans, S. Dielectric properties of ice and snow-A review. J. Glaciol. 1965, 5, 773–792. [Google Scholar] [CrossRef] [Green Version]
- Ran, D.; Yao, W.; Shen, Z.; Ni, Y.; Dong, F. Analysis on the contribution rate of driving factors for the annual water and sediment variations at the Toudaoguai hydrological station in the Yellow River. Adv. Water Sci. 2015, 26, 769–778. (in Chinese). [Google Scholar] [CrossRef]
- Davis, J.L.; Annan, A.P. Ground-penetrating radar for high-resolution mapping of soil and rock stratigraphy. Geophys. Prospect. 1989, 37, 531–551. [Google Scholar] [CrossRef]
- Moorman, B.J.; Michel, F.A. Bathymetric mapping and sub-bottom profiling through lake ice with ground-penetrating radar. J. Paleolimnol. 1997, 18, 61–73. [Google Scholar] [CrossRef]
- Hausmann, H.; Behm, M. Imaging the structure of cave ice by ground-penetrating radar. Cryosphere 2011, 5, 329–340. [Google Scholar] [CrossRef] [Green Version]
- Stoyanovich, G.M.; Pupatenko, V.V.; Sukhobok, Y.A. Detection of ground ice using ground penetrating radar method. Sci. Cold Arid Reg. 2015, 7, 541–546. [Google Scholar] [CrossRef]
- Annan, A.P.; Diamanti, N.; Redman, J.D.; Jackson, S.R. Ground-penetrating radar for assessing winter roads. Geophysics 2016, 81, WA101–WA109. [Google Scholar] [CrossRef]
- You, Y.; Yang, M.; Yu, Q.; Pan, X.; Guo, L.; Wang, X.; Wu, Q. Factors influencing the reliability of grounded and floating ice distinguishing based on ground penetrating radar reflection amplitude. Cold Reg. Sci. Technol. 2018, 154, 1–8. [Google Scholar] [CrossRef]
- Bohleber, P.; Wagner, N.; Eisen, O. Permittivity of ice at radio frequencies: Part I. Coaxial transmission line cell. Cold Reg. Sci. Technol. 2012, 82, 56–67. [Google Scholar] [CrossRef]
- Bohleber, P.; Wagner, N.; Eisen, O. Permittivity of ice at radio frequencies: Part II. Artificial and natural polycrystalline ice. Cold Reg. Sci. Technol. 2012, 83, 13–19. [Google Scholar] [CrossRef]
Figure 1.
Location of our study area within the Toudaoguai cross-section of the Yellow River.

Figure 2.
Aerial view of the Toudaoguai Hydrological Station section. Four survey lines (L-1, L-2, L-3, L-4) were used in the main channel during the field investigation. Site A and Site B are the locations of ice core sampling points respectively. Landscape image source: Google Earth, 25 October 2013.

Figure 3.
Pictures of the test site. (a) GPR survey. (b) Temperature measuring device. (c) Measurement of ice thickness using drilling method.
Figure 3.
Pictures of the test site. (a) GPR survey. (b) Temperature measuring device. (c) Measurement of ice thickness using drilling method.

Figure 4.
The standard time-voltage wiggle traces of the GPR signal at Site A (a) and Site B (b) that measured on 15 February 2014.
Figure 4.
The standard time-voltage wiggle traces of the GPR signal at Site A (a) and Site B (b) that measured on 15 February 2014.

Figure 5.
Vertical thin sections of ice cores under natural and polarized light collected on 15 February 2014 at Site A and Site B. The origin on the y-axis corresponds with the water level.
Figure 5.
Vertical thin sections of ice cores under natural and polarized light collected on 15 February 2014 at Site A and Site B. The origin on the y-axis corresponds with the water level.

Figure 6.
Thickness of frazil slush under the ice cover at Site B.

Figure 7.
Vertical profiles of density (a) and gas content (b) for ice cores collected on 15 February 2014.
Figure 7.
Vertical profiles of density (a) and gas content (b) for ice cores collected on 15 February 2014.

Figure 8.
The 200 MHz GPR image profiles measured on 15 February 2014, with direct air and surface-coupled waves retained. The left side is north in images (a,b), while the left side is east in (c,d); the location of ice core drilling points in (a) is marked with a dotted line. Depth on the right vertical axis was estimated by converting two-way travel time to distance for observed reflection using a signal velocity of 0.17 m/ns in freshwater ice.

Figure 9.
Dielectric permittivities of river ice at Site A (a) and Site B (b) calculated using the equations presented by Kovacs et al. [40] and Shokr [41].

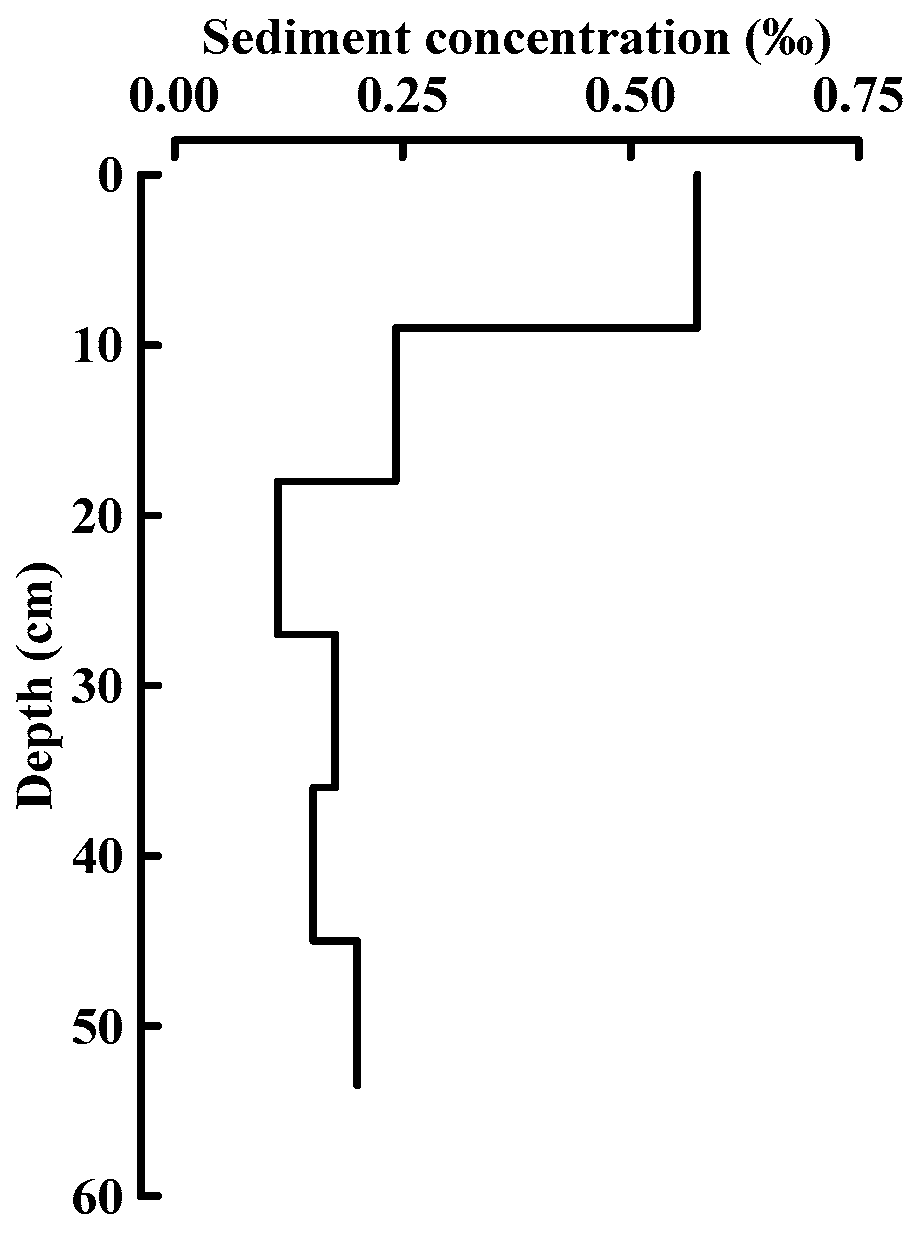
Figure 10.
Vertical profiles of ice sediment concentration from Site A.

Figure 11.
Results of atmospheric temperature monitoring.

Figure 12.
Internal ice and water temperature evolution at Site A (a) and Site B (b).

Figure 13.
Radar transmission speed and equivalent dielectric permittivity calculated by measured ice thickness and round-trip travel times: (a) Site A; (b) Site B.
Figure 13.
Radar transmission speed and equivalent dielectric permittivity calculated by measured ice thickness and round-trip travel times: (a) Site A; (b) Site B.


Table 1.
The dielectric permittivity of river ice at Site A and Site B on 15 February 2014, as calculated using three different methods.
Table 1.
The dielectric permittivity of river ice at Site A and Site B on 15 February 2014, as calculated using three different methods.
| Regime | Site A | Site B | ||
|---|---|---|---|---|
| εdz1 | εavg2 | εdz1 | εavg2 | |
| Kovacs et al. [40] | 3.1 | 3.1 (±0.06) | 3.0 | 3.0 (±0.06) |
| Shokr [41] | 3.1 | 3.1 (±0.05) | 3.0 | 3.0 (±0.06) |
| Radar method | — | 3.5 (±0.06) | — | 3.3 (±0.03) |
Note(s): 1 εdz is the equivalent dielectric permittivity; 2 εavg is the mean dielectric permittivity, with standard deviation in parentheses.
Disclaimer/Publisher’s Note: The statements, opinions and data contained in all publications are solely those of the individual author(s) and contributor(s) and not of MDPI and/or the editor(s). MDPI and/or the editor(s) disclaim responsibility for any injury to people or property resulting from any ideas, methods, instructions or products referred to in the content. |
© 2023 by the authors. Licensee MDPI, Basel, Switzerland. This article is an open access article distributed under the terms and conditions of the Creative Commons Attribution (CC BY) license (https://creativecommons.org/licenses/by/4.0/).
Share and Cite
MDPI and ACS Style
Han, H.; Li, Y.; Li, W.; Liu, X.; Wang, E.; Jiang, H. The Influence of the Internal Properties of River Ice on Ground Penetrating Radar Propagation. Water 2023, 15, 889. https://doi.org/10.3390/w15050889
AMA Style
Han H, Li Y, Li W, Liu X, Wang E, Jiang H. The Influence of the Internal Properties of River Ice on Ground Penetrating Radar Propagation. Water. 2023; 15(5):889. https://doi.org/10.3390/w15050889
Chicago/Turabian StyleHan, Hongwei, Yu Li, Wanyun Li, Xingchao Liu, Enliang Wang, and Haiqiang Jiang. 2023. "The Influence of the Internal Properties of River Ice on Ground Penetrating Radar Propagation" Water 15, no. 5: 889. https://doi.org/10.3390/w15050889
Note that from the first issue of 2016, this journal uses article numbers instead of page numbers. See further details here.