
Determination of Exploitable Coefficient of Coral Island Freshwater Lens Considering the Integrated Effects of Lens Growth and Contraction


College of Hydrology and Water Resources, State Key Laboratory of Hydrology-Water Resources and Hydraulic Engineering, Hohai University, Nanjing 210098, China
*
Authors to whom correspondence should be addressed.
Water 2023, 15(5), 890; https://doi.org/10.3390/w15050890
Submission received: 14 January 2023
/
Revised: 21 February 2023
/
Accepted: 22 February 2023
/
Published: 25 February 2023
(This article belongs to the Special Issue China Water Forum 2022)
Abstract
:Groundwater on small coral islands (so-called freshwater lens) is an important water resource for residents and local ecosystems. However, an overexploitation of it may induce a contamination by saltwater. In this paper, we strive to determine the exploitable coefficient of the freshwater lens considering the integrated effects of lens growth and contraction and examine the impacts of well layout schemes on the evolution of the freshwater lens. For this purpose, a numerical model is setup to simulate the saltwater upconing and recovery process under pumping conditions during different evolution stages. Our results show that long-term and higher intensity pumping activities are suggested to be conducted at the latter stage of the lens evolution. Meanwhile, the seasonal contraction of the freshwater lens caused by the seasonal variation in rainfall is characterized by a quicker response of center thickness than maximum thickness of the lens, which further impacts the pumping intensity. The results also indicate that the exploitable coefficient (ρ) of the freshwater lens in small coral island is generally smaller than that in inland areas, ranging from 0.09 to 0.37 under different well layout schemes. Additionally, it is also affected by the uncertainty of hydrogeological parameters. Finally, a safe exploitable coefficient is proposed under the most unfavorable parameter combination for the studied island. The study has important implications for the protection and sustainable exploitation of subsurface freshwater resources on island.
1. Introduction
Coral islands are distributed in the tropical and subtropical oceans of the Pacific and Indian oceans where corals are easy to grow [1]. Because of their extreme geographical isolation, unique geological structure, and vulnerable water resources, they attracted the attention of researchers in various fields [2,3]. The freshwater lens is a limited renewable underground freshwater resource on the coral island, which exists in the form of a floating “lens” [4,5,6]. Unlike most marine islands, coral islands have a double-layer aquifer system, which is composed of Holocene aquifer and Pleistocene aquifer [7]. The Holocene aquifer is unconformably covered by the Pleistocene limestone [5], and the freshwater lens is stored in the Holocene aquifer. Due to the high permeability of the soil and weathering layer of the small coral island, it is difficult to form surface runoff, and the freshwater lens became the only natural water supply source on the island [5]. Therefore, whether it is the early development of uninhabited natural islands or the daily life of inhabited islands, the reasonable development and utilization of the freshwater lens can play an important role in alleviating the water supply difficulties [1,2,3], with great economic, military, and social benefits. The amount of available groundwater is usually obtained by the exploitable coefficient method, while the exploitable coefficient of small coral islands is closely related to many factors, such as the hydrogeological conditions, the development of the freshwater lens, etc. Therefore, it is necessary to discuss the determination method of the exploitable coefficient in combination with the formation and evolution of the freshwater lens, the seasonal variation in precipitation, and the specific pumping well layout, so as to provide help for the sustainable development and utilization of the freshwater lens in the small coral island.
In order to scientifically and rationally develop and utilize the fresh groundwater resources of coral islands, scholars conducted in-depth research on the formation and internal fluid dynamics of freshwater lenses [8,9,10,11,12,13]. Zhou et al. [14] and Yao [15] simulated the formation and evolution of the freshwater lens on natural and artificial islands through numerical models; Li et al. [16] simulated the dynamic process of the freshwater lens under the conditions of recharge and pumping through physical experiments. Dose et al. [17] explored the influence of hydrogeological parameters on the flow movement of the freshwater lens through a physical sand tank experiment and numerical simulation; Post et al. [18] studied the long-term impact of abstraction on the freshwater lens through field observation and numerical simulation. These studies show that freshwater lenses are highly sensitive to climate factors and human activities [19,20], which must be considered in the sustainable development and utilization of freshwater lenses [21,22].
Although the fresh groundwater in the small coral island is very limited due to the limitations of natural conditions and technology, it is necessary to exploit freshwater lenses to meet the water demand at the early stage of island development. Unlike inland aquifers, the quality and quantity of freshwater available to small island communities depend on the mixing of seawater and freshwater, seawater intrusion, and human activities [5]. In many studies, the definition of drinking water in the freshwater lens is 2.5% relative to the salinity of seawater, or the chloride concentration is about 500 mg/L [11,13,23,24]. Underwood et al. [11] believed that the exploitable freshwater lens appeared at the place where the recharge was greater than or equal to 2000 mm/y and the island width is larger than 250 m. Traditionally, the sustainable exploitation of atolls ranges from 25% to 50% based on the percentage of recharge [5,25]. Ibrahim et al. [26] used 30% of the rainfall as an approximate estimate of sustainable exploitation. Pauw et al. [27] and Post et al. [18] suggested that the numerical simulation for evaluating sustainable exploitation should be conducted at a decadal scale, even for small islands.
The above-mentioned research provides a rich knowledge background for the research on sustainable exploitation of freshwater lenses in small islands. However, more factors should be considered in the estimation of ideal sustainable exploitation, such as the acceptable salinity limit, the growth stage of freshwater lenses, the seasonal contraction of freshwater lenses, the well layout plan, and the heterogeneity of media.
This paper discusses a method to determine the exploitable coefficient of freshwater lenses in small coral islands, and considers the comprehensive effect of lens growth and contraction and the impact of well layout on the evolution of the freshwater lens. By simulating the growth stage of the freshwater lens and the seasonal contraction of the freshwater lens caused by the uneven distribution of rainfall in a year, the optimum pumping stage of the freshwater lens in the coral island was studied. In addition, considering the uncertainty of hydrogeological parameters, the safe exploitable coefficient under the given well layout scheme is calculated, which is supposed to provide a reference for the exploitable coefficient range of freshwater lenses in small coral islands.
2. Study Area
The coral island is located on the Xisha Islands in the South China Sea. It is 1.98 km long from east to west and covers an area of 2.1 km2. Due to the tropical monsoon and humid marine climate, the annual average temperature is 26.5 °C, and the average annual rainfall is 1505 mm, most of which falls from June to November. The average elevation of the island is about 4.4 m, and the depression in the middle is 2–3 m lower than the surrounding sandbank, which is developed by the lagoon. The sand mat with flat terrain is the main part of the island, which is slightly higher than the depression. The sandbank formed by clastic sand from coral shells surrounds the islands. The narrow beach slopes towards the sea. Reefs much larger than islands are hidden under the sea. The island is covered with tropical plants, such as pittosporum fortunei. The coverage of the vegetation on the islands and reefs shows that the freshwater is sufficient for the growth of plants.
The coral island is formed by the accumulation or cementation diagenesis of coral reef fragments, shells, gravel, algae, and other biological debris on the coral reef. Geological profiles based on 10 boreholes show that the subsurface can be divided into a Holocene and an underlying Pleistocene unit. Coral islands and reefs have no surface runoff due to loosened surface structures and strong permeability. Rainfall is the only natural recharge to the groundwater system. The depth of groundwater in the coral island is about 0.3–2.9 m. The indigenous people on the island are fishermen. Before the completion of the desalination plant and the sewage treatment plant, the water supply mainly depends on the groundwater with a withdrawal of about 400 m3/d.
3. Materials and Methods
3.1. Conceptual Model
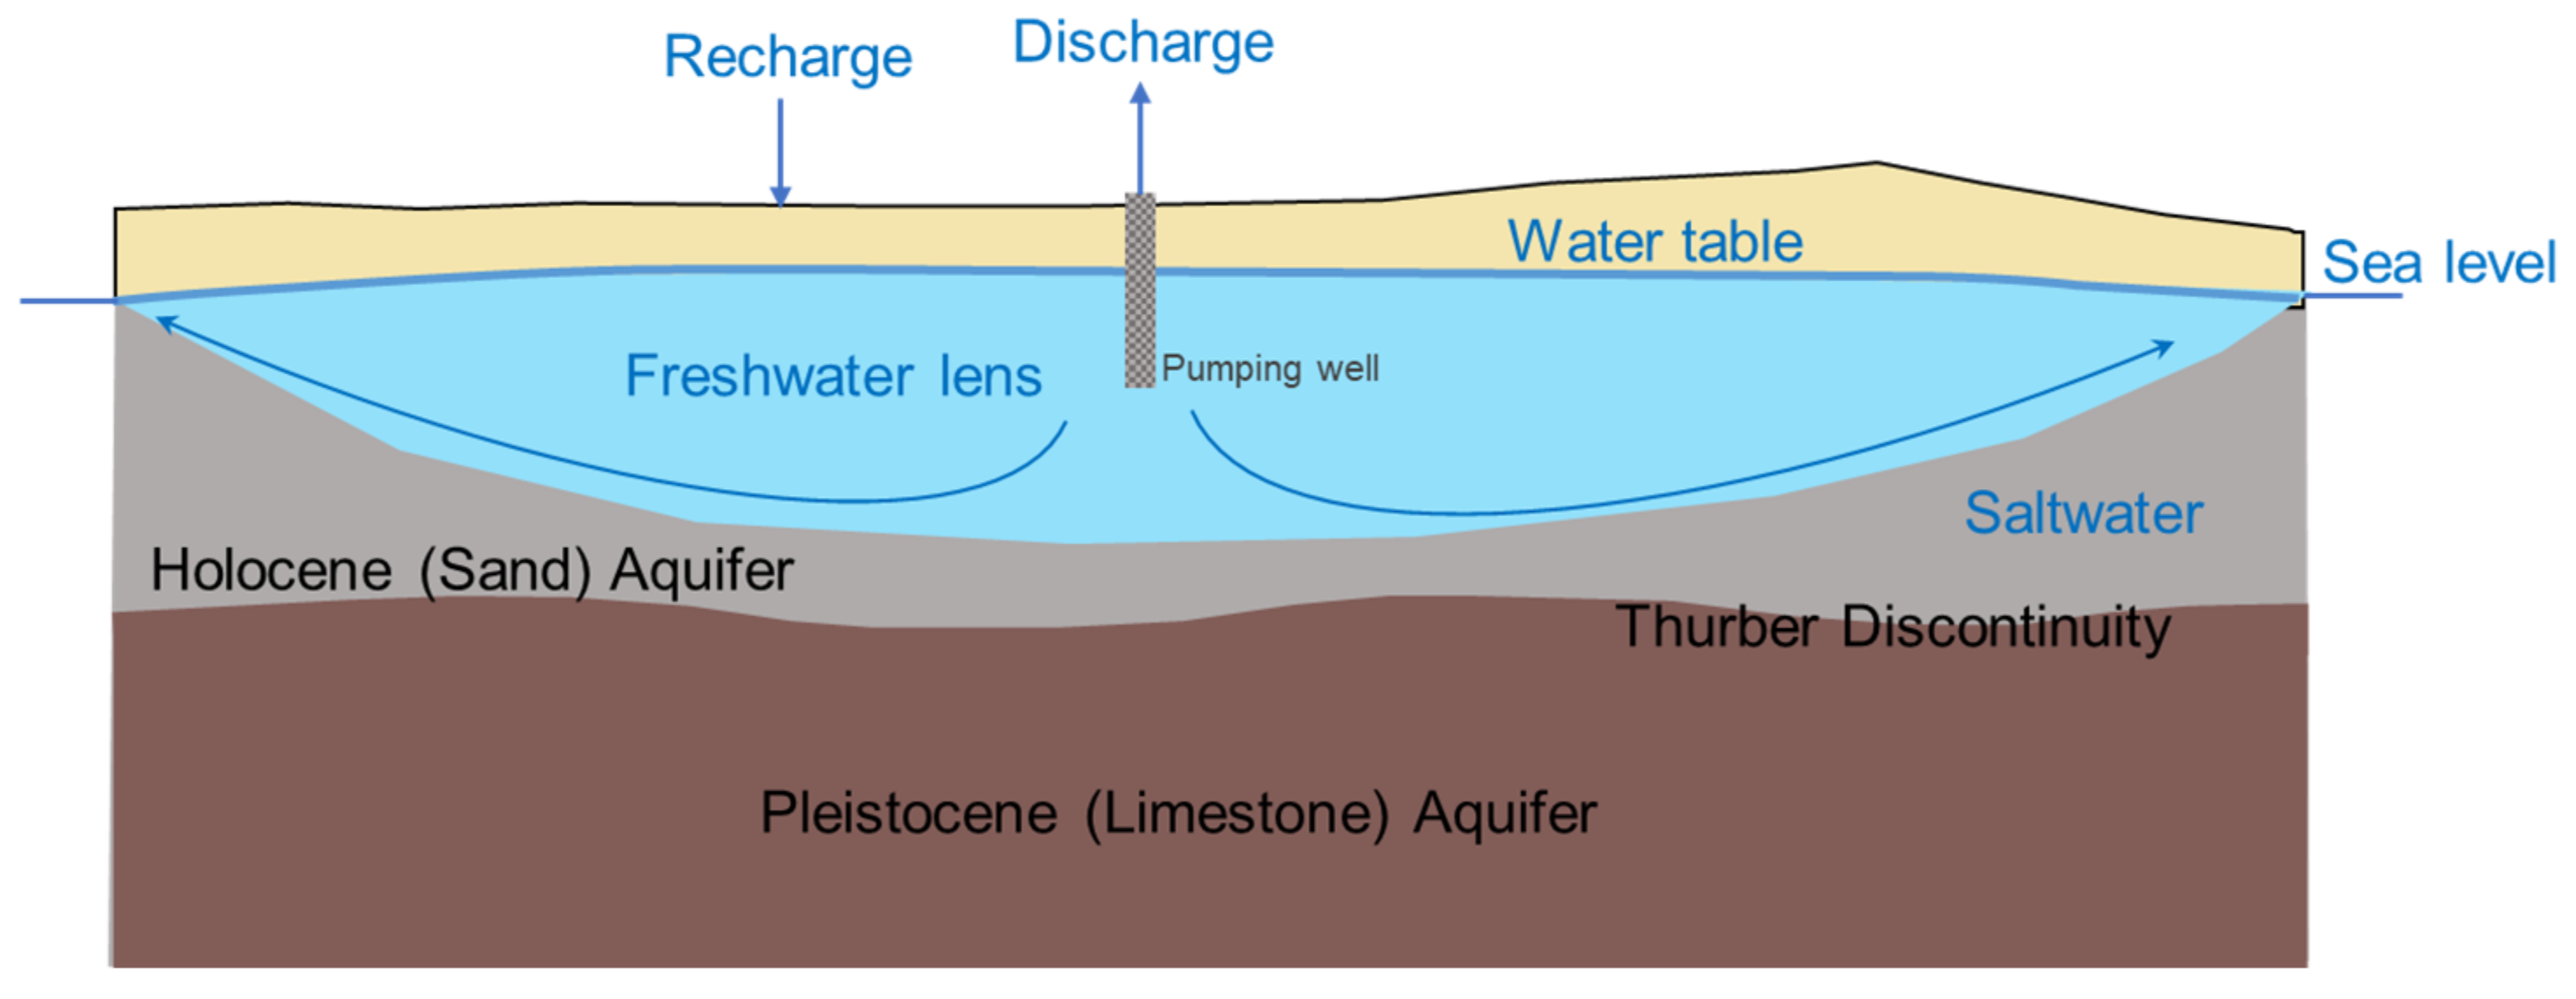
The main natural recharge source of groundwater is atmospheric precipitation infiltration. The underground can be divided into Holocene and underlying Pleistocene units. The contact between Holocene and underlying Pleistocene sediments, called ‘Thurber discontinuity” or “Holocene Pleistocene unconformity” (HPU) [24], occurs at a depth of 15–20 m below sea level. Pleistocene coral reef limestone is characterized by developed pores and dissolution pores, strong permeability, and easy seawater circulation [14]. Holocene granular sediments are mainly composed of coral clastic medium sand and coral clastic gravelly sand. The hydraulic properties of the Holocene and Pleistocene units of the coral island are obviously different. The hydraulic conductivity (K) of Holocene limestone is obviously higher than that of Holocene sediments. The conceptual sketch of the coral island is shown in Figure 1. The map includes a simplified geological setting and shows the dual nature of the water system formed by Holocene sediments overlying Pleistocene karst limestone.
3.2. Parameter Setting of Numerical Model
A two-dimensional numerical density-dependent groundwater flow and solute transport model is developed to represent the profile of a coral island using SEAWAT [28,29]. This interpretation model is used to simulate the dynamics of a coral island freshwater lens under similar hydrogeological conditions; as a result, calibration is not required [30]. The variable density groundwater flow equation is as follows:
where K is the hydraulic conductivity (m/d), H is the piezometric head (m), c is solute concentration (kg·m−3), Ss is the water storage rate (m−1), t is time (d), n is the medium’s porosity; η is the density coupling coefficient (kg·m−3), ρ is the mixed fluid density (kg·m−3), ρ0 is the freshwater density (kg·m−3), and qs is the volume of source and sink items entering unit volume aquifer in unit time (d−1).
The solute transport equation is as follows:
where xi is the infiltration direction (m), Dii is the hydrodynamic dispersion coefficient tensor (m2·d−1), ui is the flow velocity (m·d−1), and c* is the mass concentration of the source or sink fluid (kg·m3).
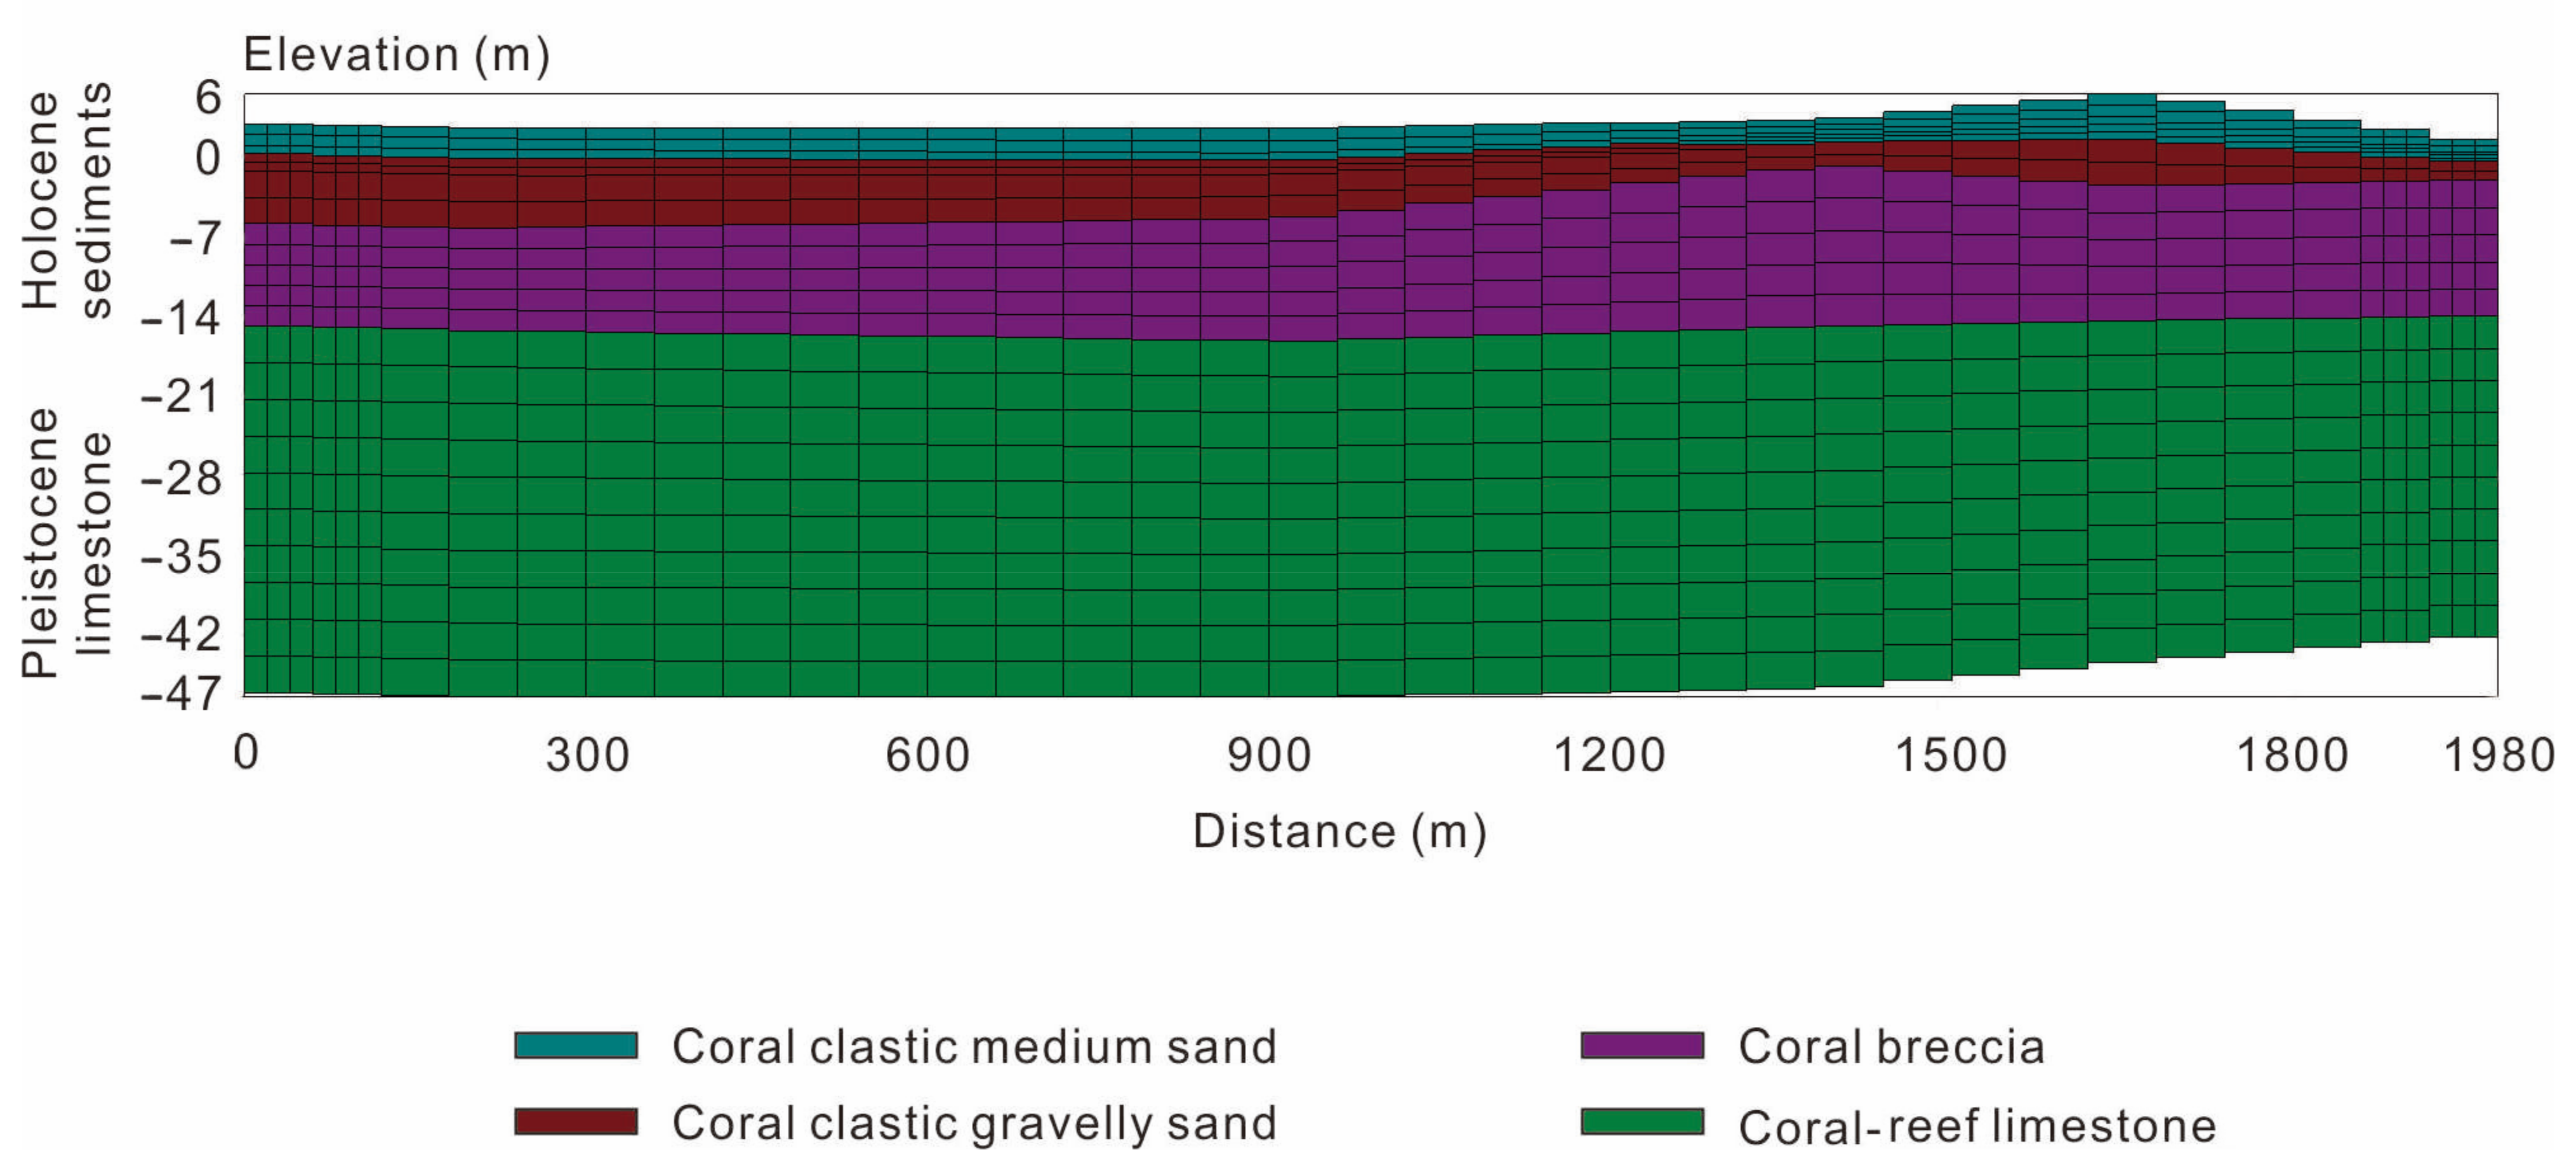
The model was running for 100 years, during which the freshwater lens developed. The model reached a stable state within 50 years (i.e., the shape of the lens remained relatively stable). The model includes 22 layers with a depth of 50 m to improve the vertical resolution in the model simulation, and is discretized into 41 columns in the horizontal direction and refined at the boundary. A constant head boundary is defined along both sides of the area to simulate sea level. The density is specified as 1025 kg/m3, representing typical sea water composition. The constant concentration boundary is assigned to the same grid cell as the constant head boundary, and the chloride concentration is 19,000 mg/L. Assuming that the loose sediment of the coral island is initially saturated with seawater, the initial chloride concentration in the whole model area is specified as 19,000 mg/L. The ground of the model is based on boreholes. The model grid is shown in Figure 2.
The hydraulic conductivity of main aquifers is determined according to petrology and previous studies [14,31,32]. The upper model layer represents coral sand, and the hydraulic conductivity (K) ranges from 60 m/d to 150 m/d. The lower model layer represents coral reef limestone. Because there are many pores and fractures of different sizes, it has good permeability, and the hydraulic conductivity (K) is 1000 m/d [33]. The effective porosity (ne) is 0.25–0.45, and the specific yield (Sy) is 0.1–0.2.
Precipitation is the only recharge of freshwater to the hydrogeological system, so it is the main mechanism to simulate the development of the freshwater lens in the model [34]. The coefficient of the precipitation recharge (α) is used to calculate the monthly replenishment. Production wells will not be activated until the model reaches a stable state. After the model reaches the steady state, the production wells are started for 20 years to simulate the saltwater coning. Table 1 summarizes the hydrogeological parameters assigned to the SEAWAT model.
4. Results and Discussion
4.1. Growth and Contraction of Freshwater Lens under Natural Conditions
4.1.1. Growth Characteristics and Stage Division of Freshwater Lens
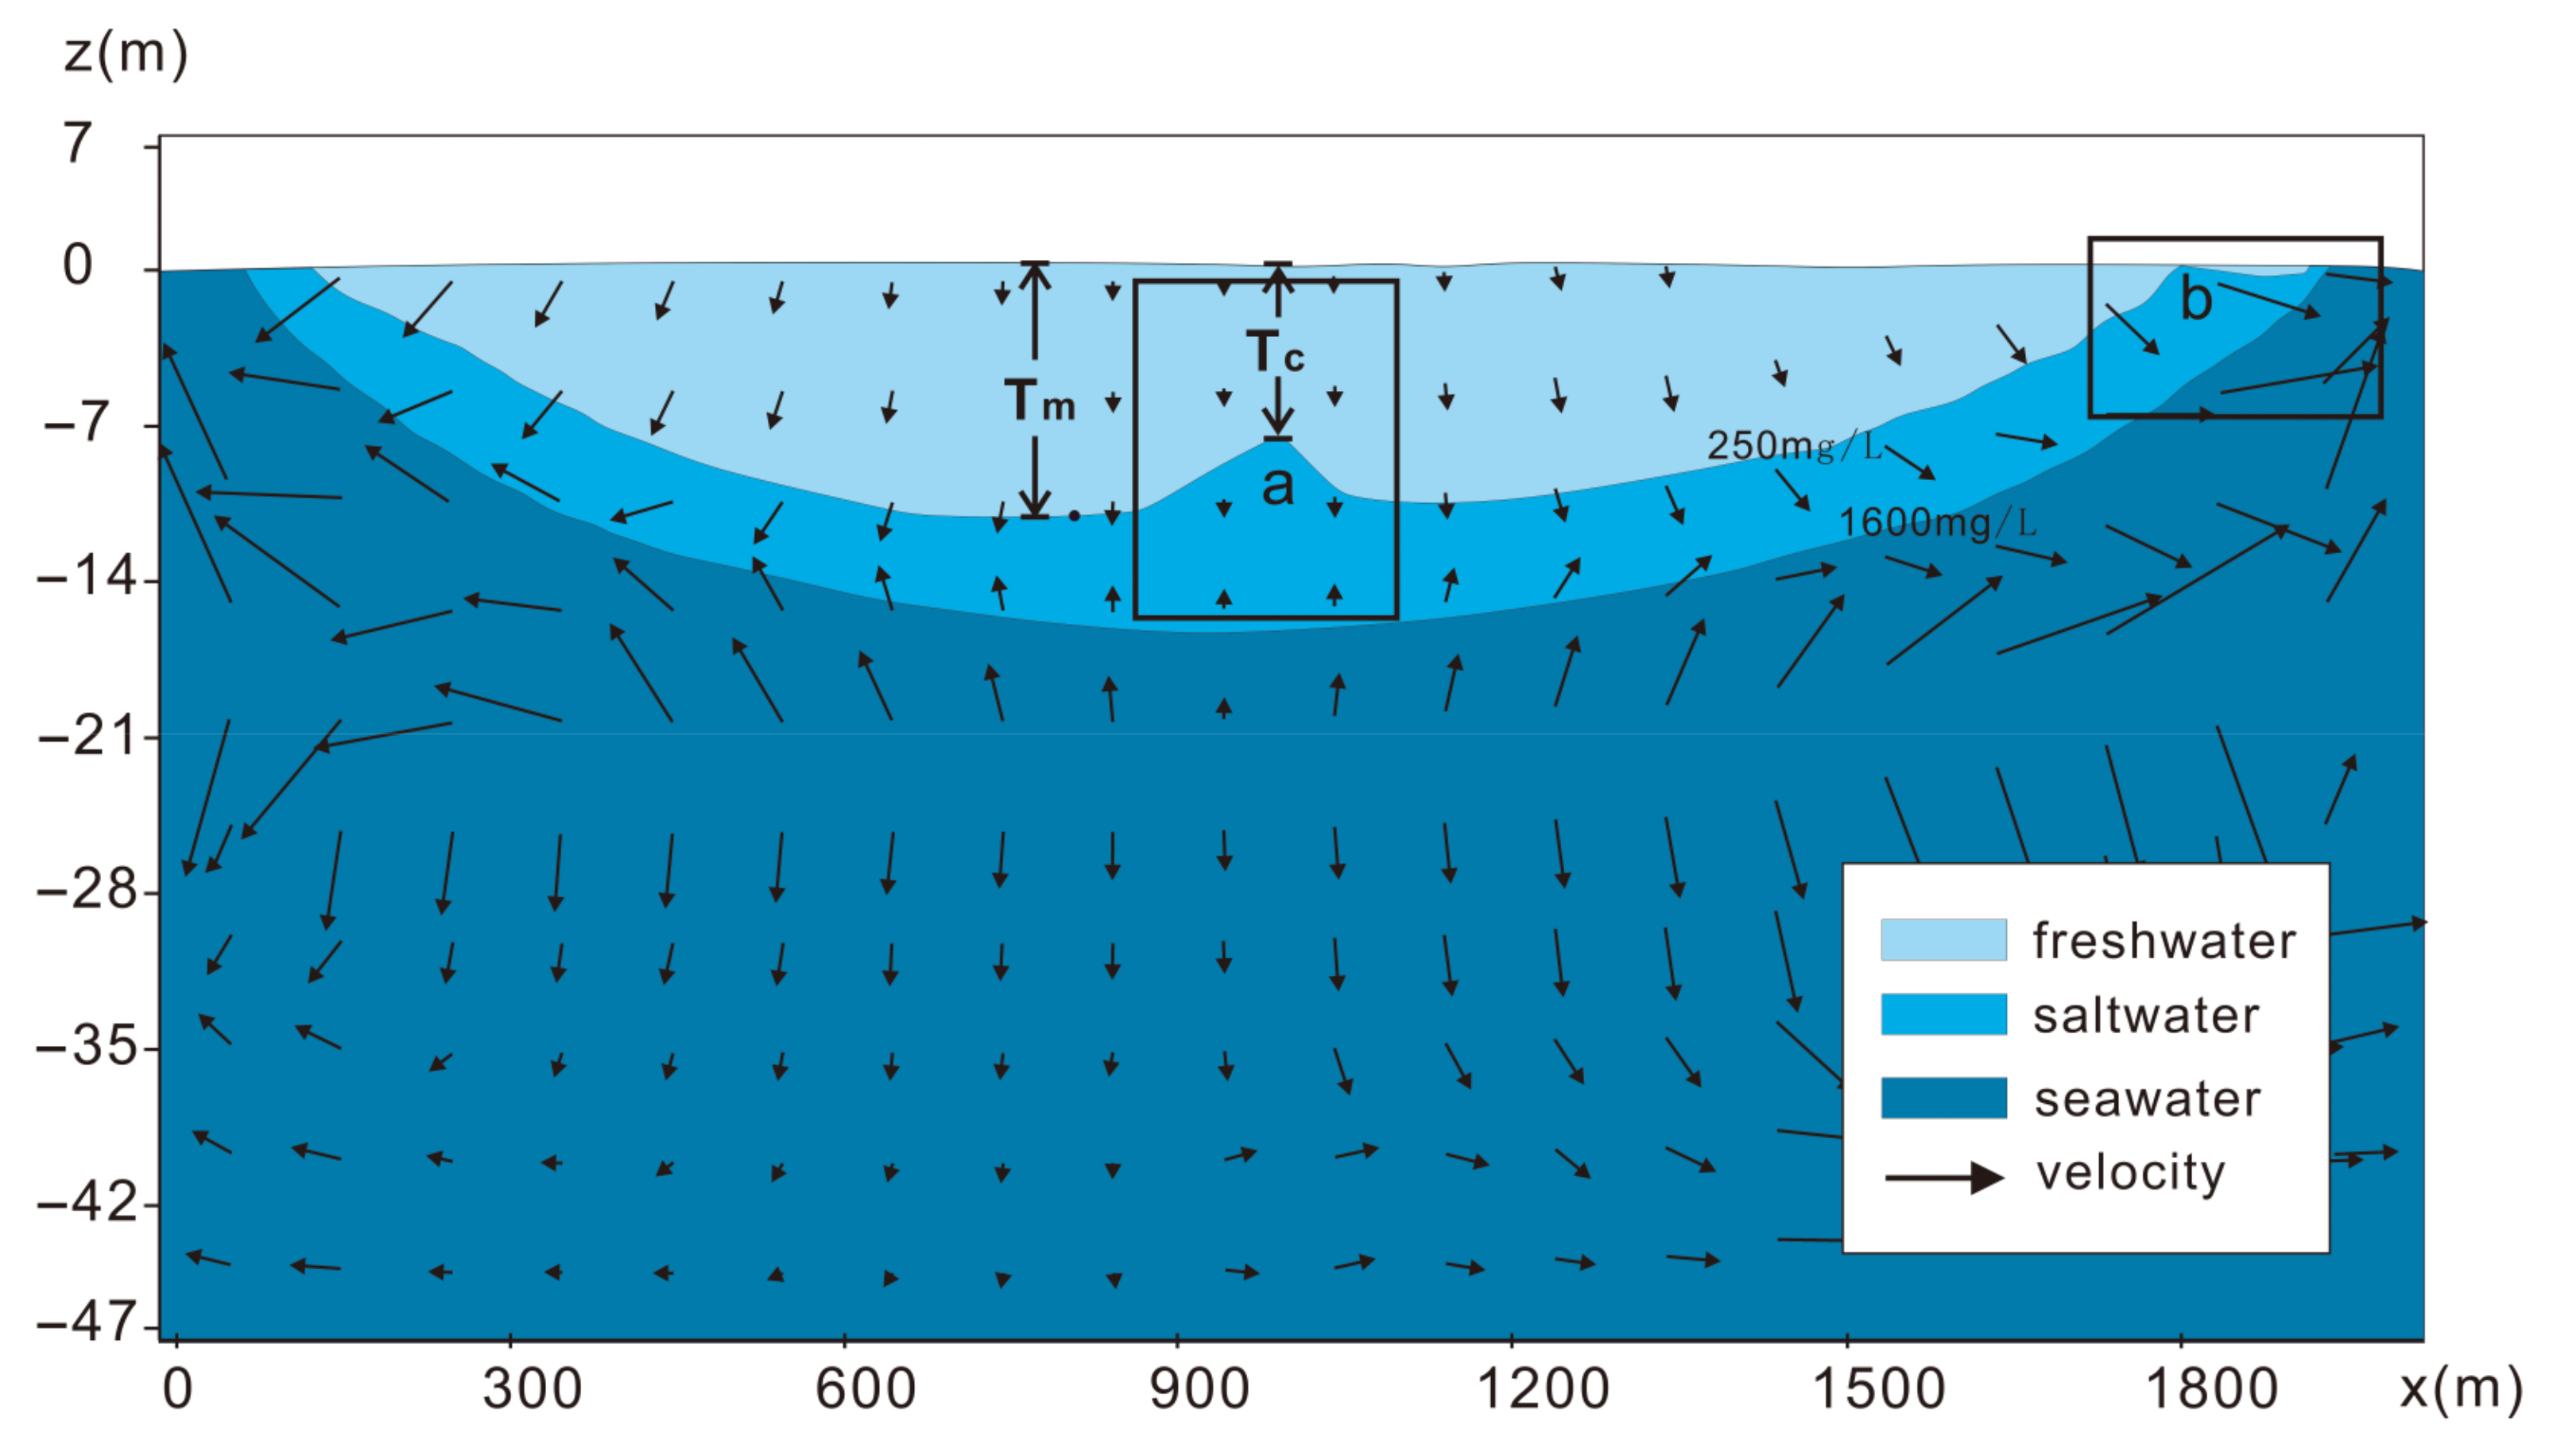
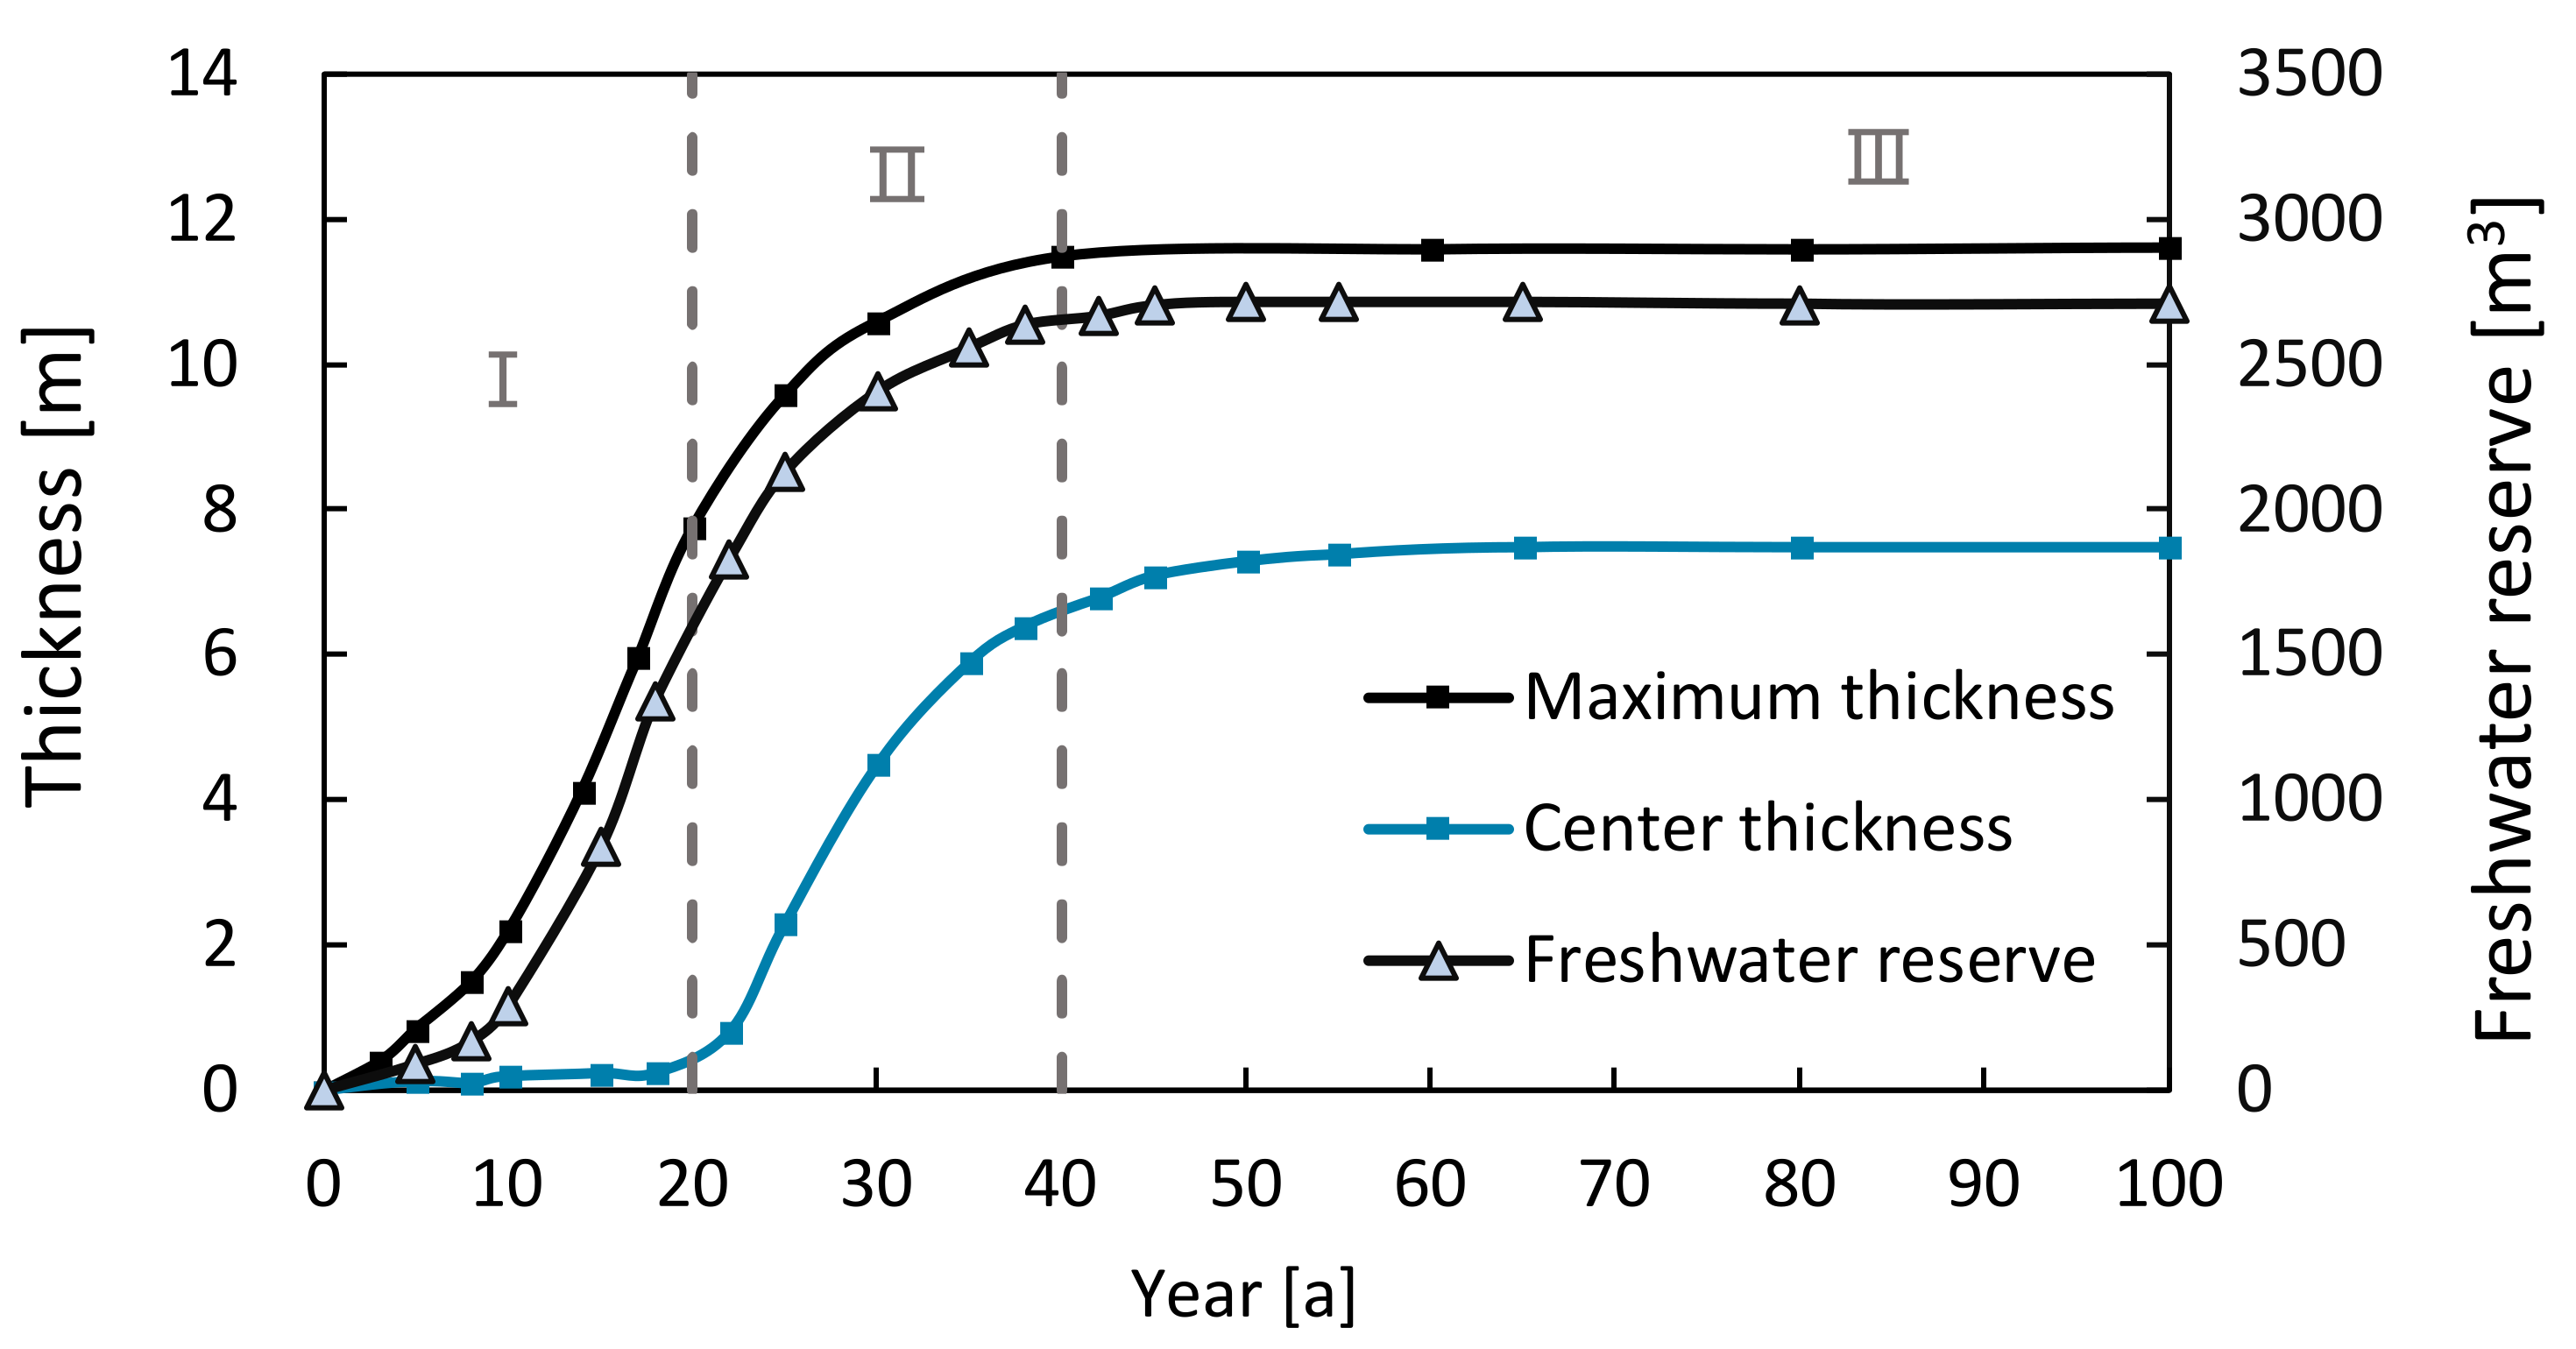
According to the drinking water standard formulated by the World Health Organization (WHO), the chloride (Cl−) ion concentration should not exceed 250 mg/L [35]. In this study, a 250 mg/L concentration contour was selected as the division between freshwater and saltwater. The growth of the freshwater lens is a long and slow dynamic process. The simulation results show that it takes 45 years for the freshwater lens to grow to its maximum thickness and for the reserve to be basically stable, and the central thickness will also reach its maximum in the 60th year. The water head distribution shows the basic characteristics of “high in the middle, low around”. The maximum freshwater head (Hm) is 0.32 m, forming a hydraulic gradient from the center to the edge, which can ensure that freshwater is continuously discharged into the sea from the thickest part of the lens. The shape of the stabilized freshwater lens and the groundwater flow rate are shown in Figure 3. After being recharged, the water within the freshwater lens flows from top to the bottom and discharges water around the island. Meanwhile, the seawater moves upward, “lifting” the freshwater lens so that it floats on the land and the entire groundwater system is in a dynamic equilibrium. The center of the freshwater lens produces a low velocity area, forming a stagnation zone (Figure 3). The flow velocity increases from the center to the boundary of the lens. Due to the difference in seawater density and freshwater density, which produces larger buoyancy in the center of the lens, the center thickness (Tc) is smaller than the maximum thickness (Tm) (Figure 3). However, the difference will become smaller if the lower interface salinity standard increases.
The growth of the freshwater lens can be divided into three stages according to the temporal variation in the thickness and freshwater storage of the freshwater lens (Figure 4):
- Stage I: 0–20 years, two extremely thin freshwater areas are formed underground on both sides near the middle of the island. The freshwater lens develops rapidly in the form of a “doughnut”, but the central thickness increases slowly. During this stage, the main role of precipitation recharge is to dilute and flush the salinity of the original groundwater under the island. The groundwater velocity near the middle of the island is the largest;
- Stage II: 20–40 years, this stage is the main stage for the stable growth of the freshwater lens. The freshwater on both sides near the middle of the island are combined into one. The maximum thickness of the freshwater lens increases synchronously with the central thickness, and the central thickness increases significantly faster than Stage I. during this stage, a large great deal of freshwater seeps into the freshwater lens through the surface as the precipitation continues to recharge the groundwater, the thickness of the upper freshwater of the lens becomes larger, and the interface between freshwater and saltwater becomes deeper. Meanwhile, the salinity gradient becomes larger, the corresponding vertical mixing weakens, and the horizontal range of the freshwater lens gradually expands;
- Stage III: After 40 years, the thickness of the freshwater lens increases slowly. After 45 years, the maximum thickness of the freshwater lens is stabilized. Later, the central thickness increases slowly, and reaches the maximum in 60 years. During this stage, the supply and discharge reach a dynamic balance, the thickness and scope of the freshwater lens will not increase, and the freshwater lens will enter a relatively stable status.
4.1.2. Seasonal Variation in Freshwater Lens
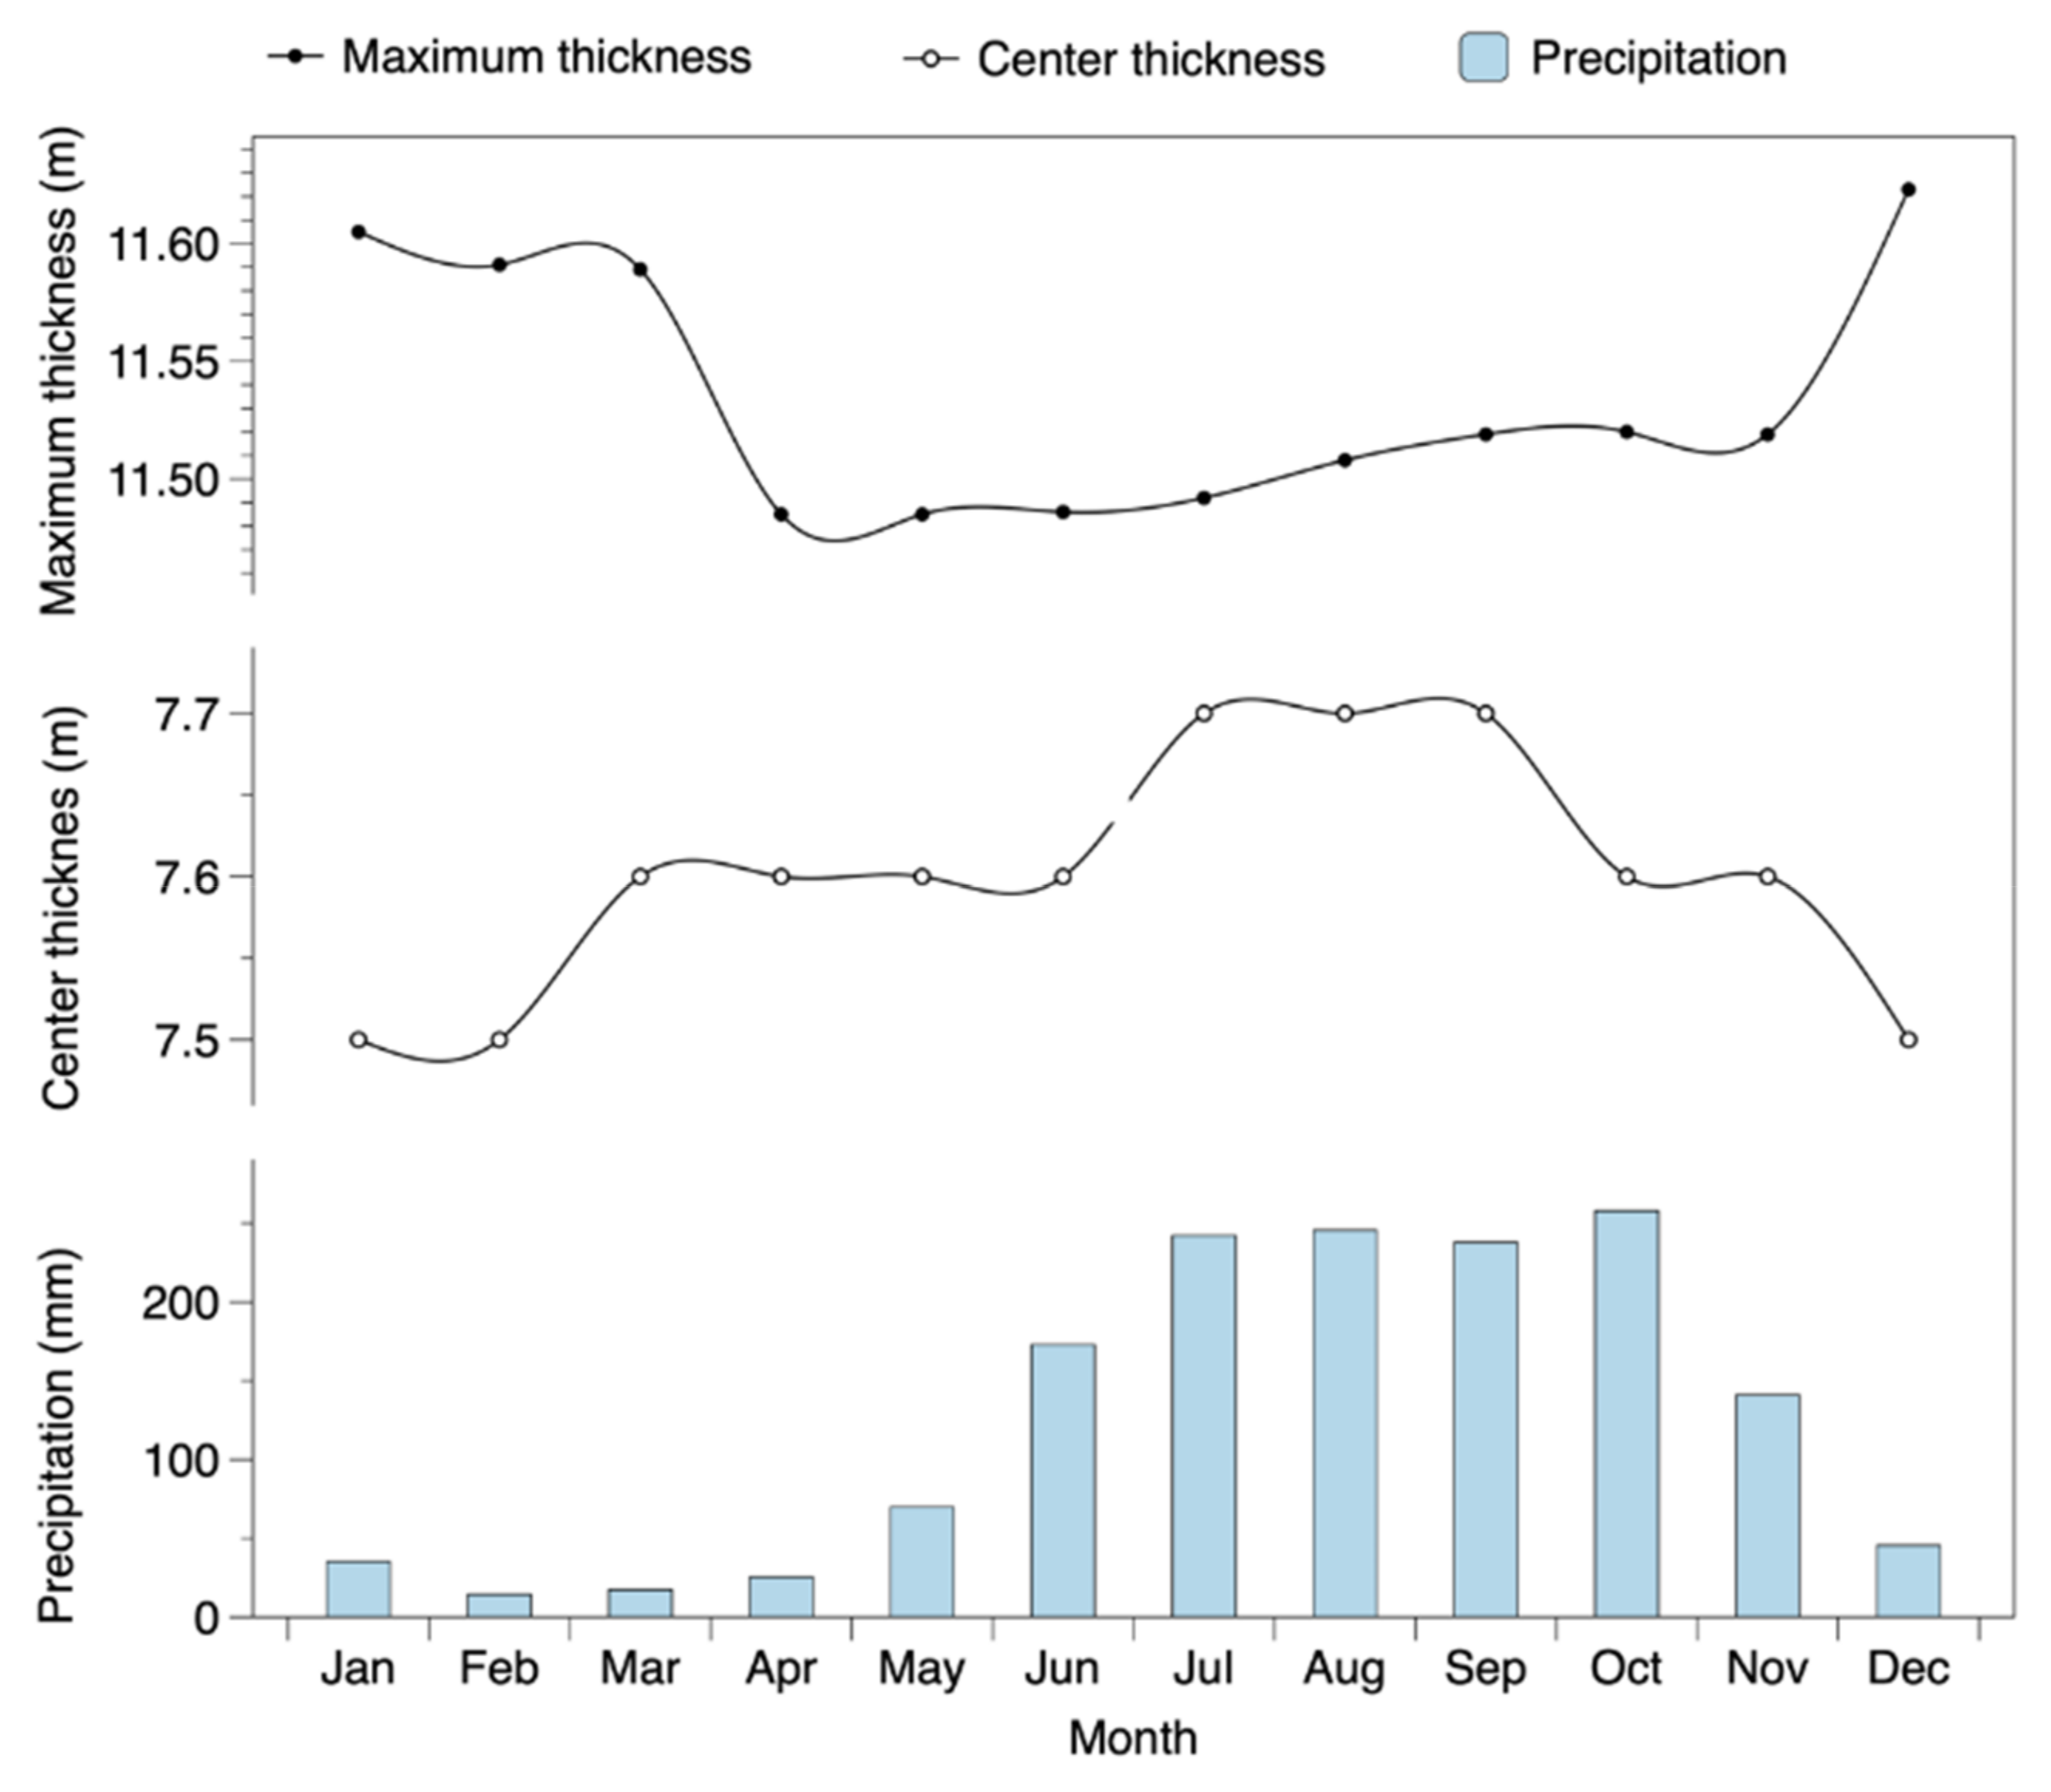
Precipitation impacts the difference of density and concentration between saltwater and freshwater, and further regulates the dynamic changes of freshwater lens. Hm increases continuously from June when the rainy season starts and usually reaches the maximum value in autumn when the rainy season ends. Although the annual variation in Hm is small, it is a key control factor for the freshwater lens to reach the maximum depth and plays an important role in maintaining the thickness of the freshwater lens.
The shape change of the freshwater lens is mainly reflected in its geometric thickness (Figure 5). The simulation results show that the change in Tm obviously lags behind Tc (about half a year), and Tm presents a smaller annual variation than Tc. Larger Tm indicates more recoverable groundwater, and due to the slower response of Tm to precipitation, the annual maximum Tm usually appears in the winter when the island is most vulnerable to water shortage in the year, which guarantees the more desired pumping amount during the dry season.
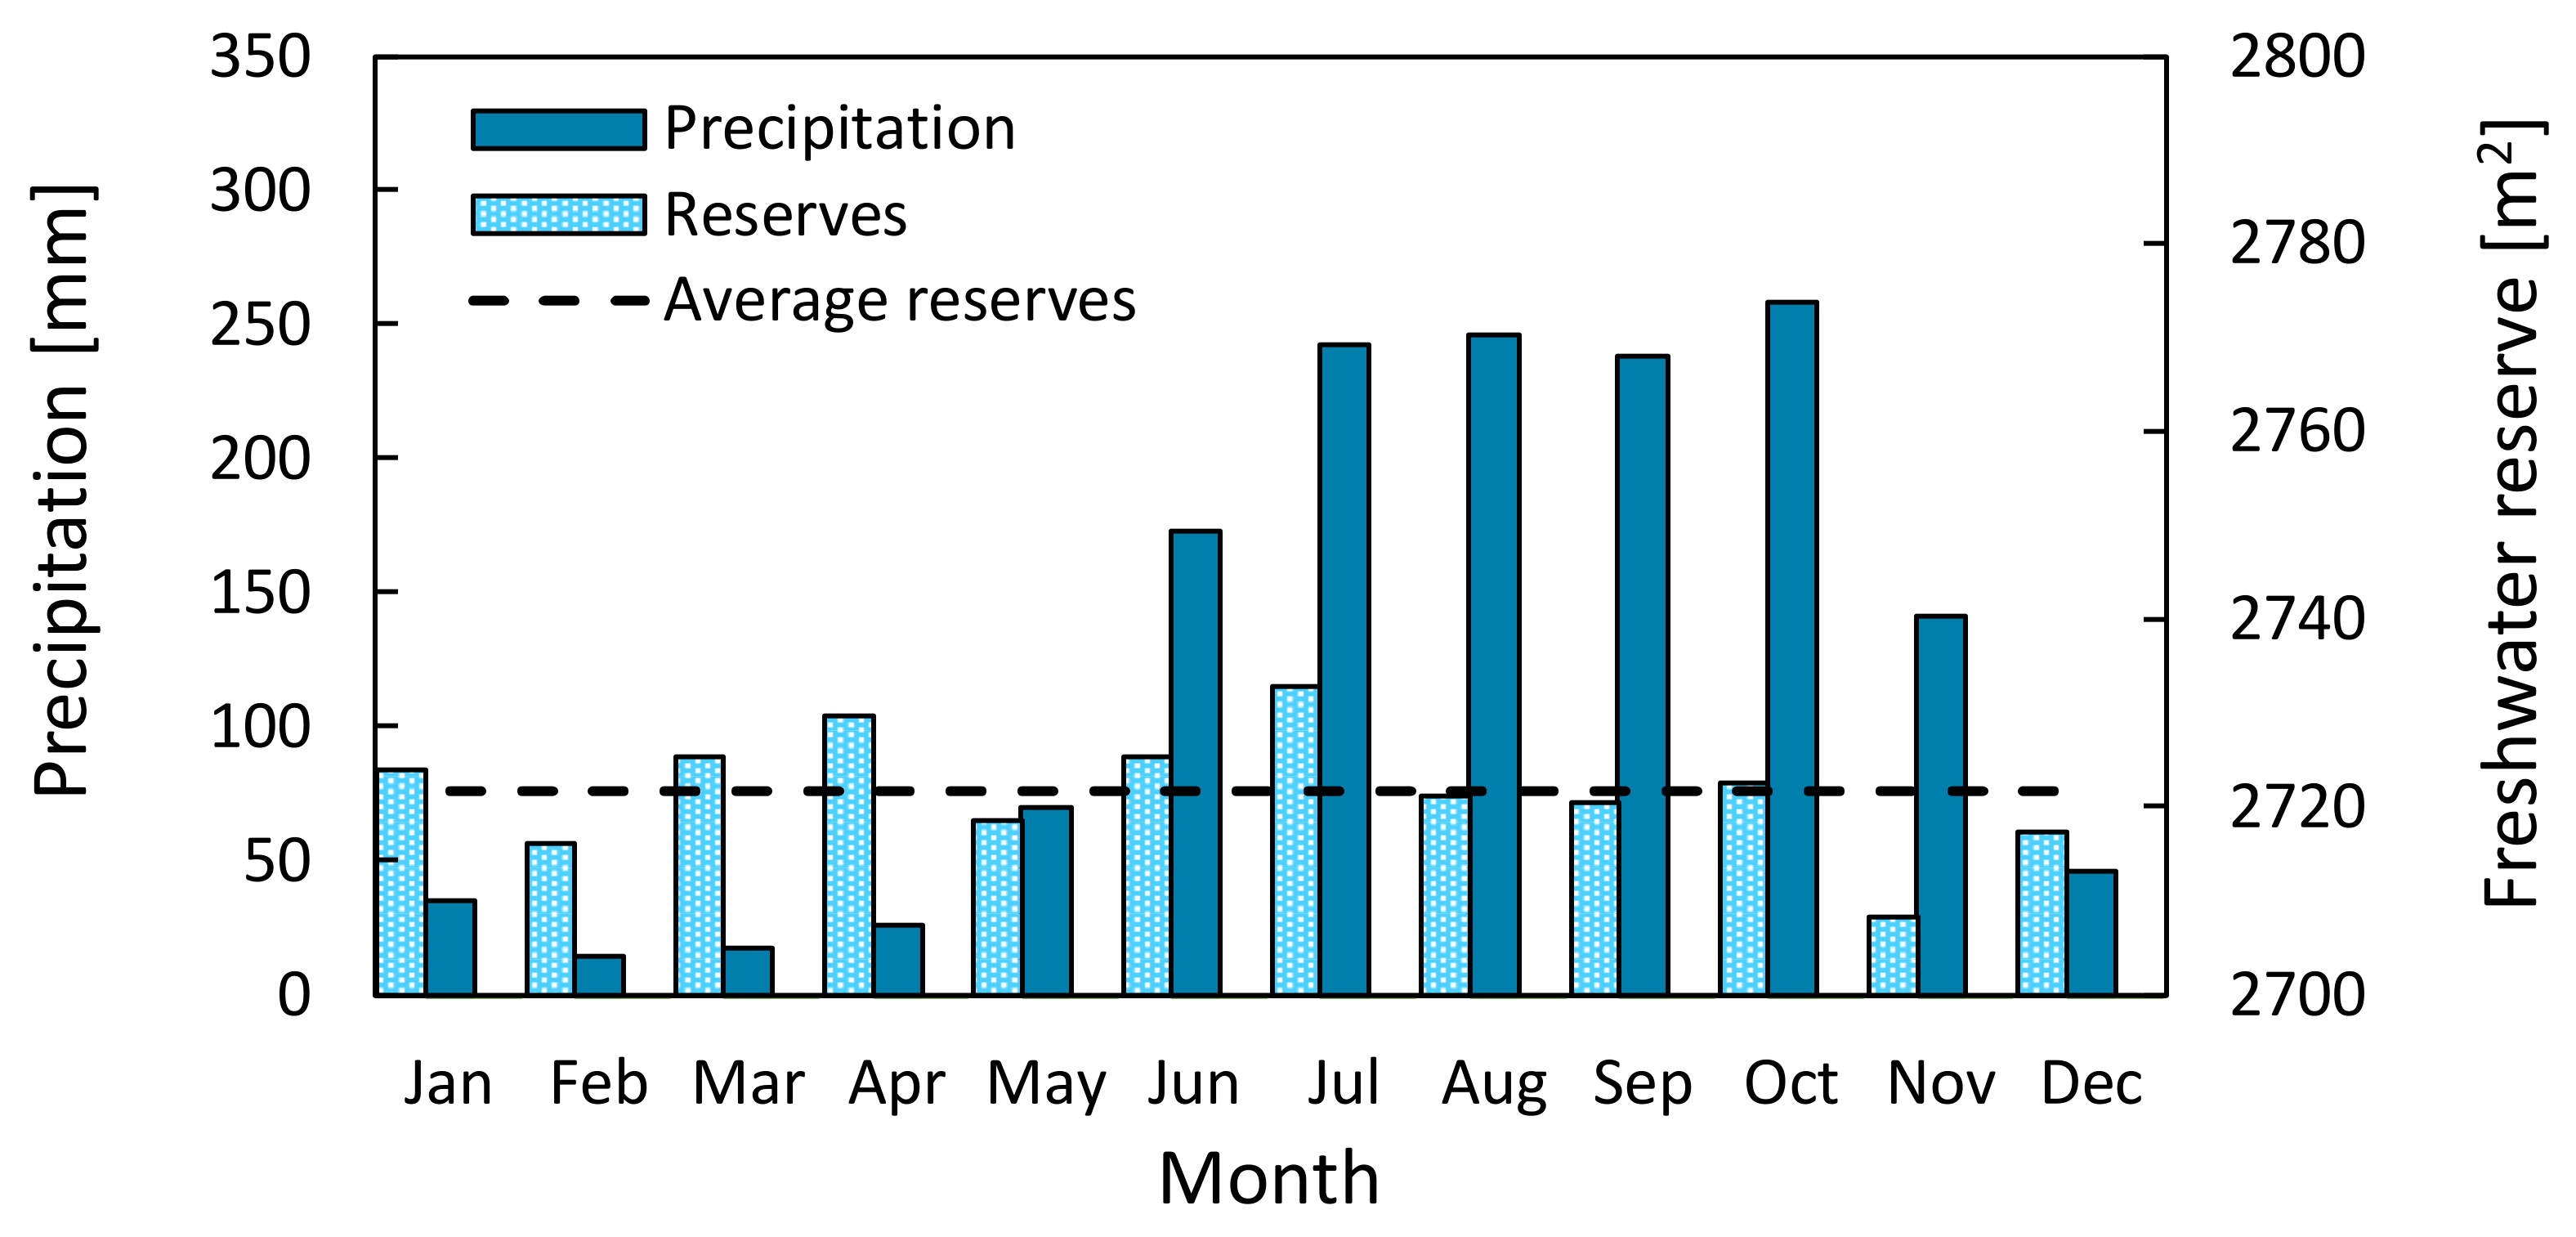
The freshwater storage (Wa) of the profile is determined by the specific yield (μ) and the shape of the freshwater lens. It reaches the maximum value in July and minimum value in November. The annual variation Wa is only 24.6 m3, accounting for 0.9% of the average Wa, and the mean precipitation has little effects on Wa (Figure 6).
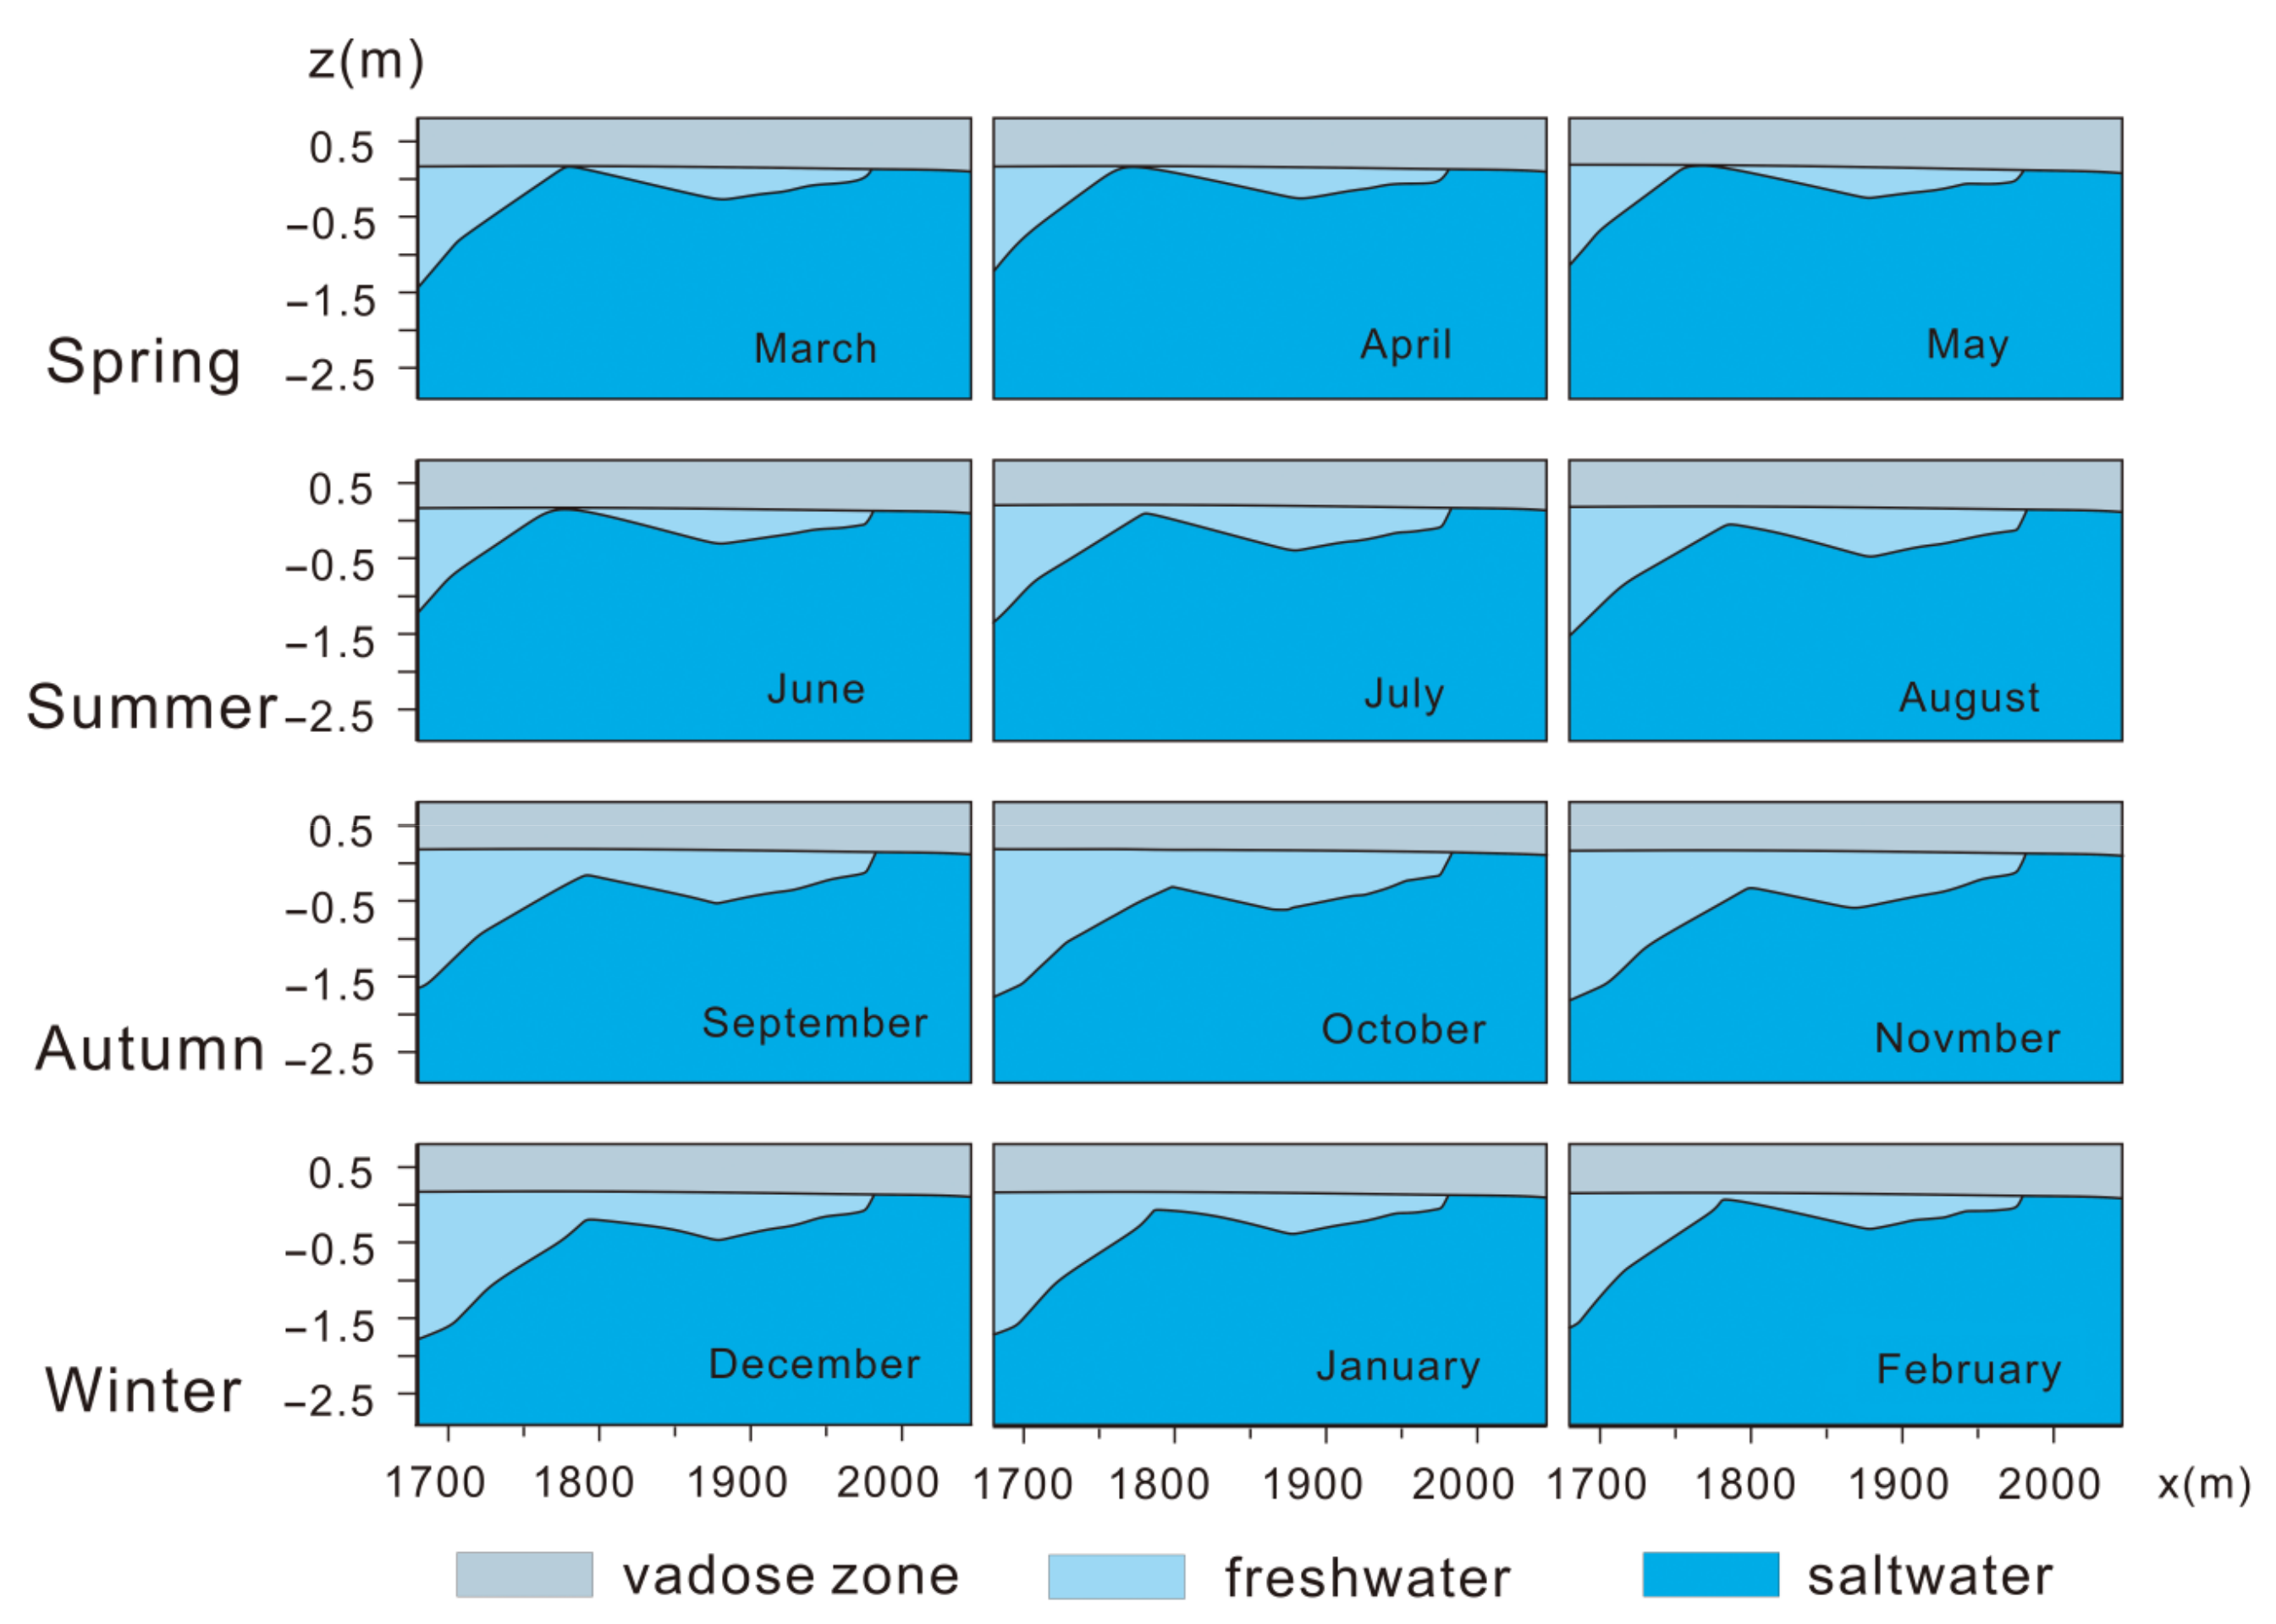
The seasonal change of the spatial distribution of the freshwater lens is mainly reflected in the edge area. Figure 7 is a local enlarged view of region b in Figure 3. In winter and spring, the edge of the freshwater lens becomes thinner and even discontinuous, leading to a narrower freshwater lens. In summer, the thickness of the freshwater lens begins to recover gradually and reaches the maximum in autumn. The seasonal cycle may be related to the obvious sand dike topography in the east. Therefore, the edge of the freshwater lens is very vulnerable and could be impacted by droughts, seawater flooding events, and human activities, which results in a reduction in the freshwater lens.
The uneven seasonal distribution of precipitation can also cause the natural contraction of the freshwater lens in terms of its thickness, storage, and distribution. In general, the maximum freshwater head is most sensitive to the seasonal change of precipitation, but because the value is very small, this change is not easy to notice; the second is the central thickness and the maximum thickness of the freshwater lens, but their changes are not synchronous. In contrast, the seasonal change of precipitation has a greater impact on the central thickness; and the seasonal variation in reserves is the least obvious. The thinning of the lens edge in spring leads to the reduction in the lens range. These changes mean that the natural contraction of the freshwater lens should be considered when determining the exploitable amount of groundwater.
4.2. Degradation and Recovery of Freshwater Lens under Pumping Conditions
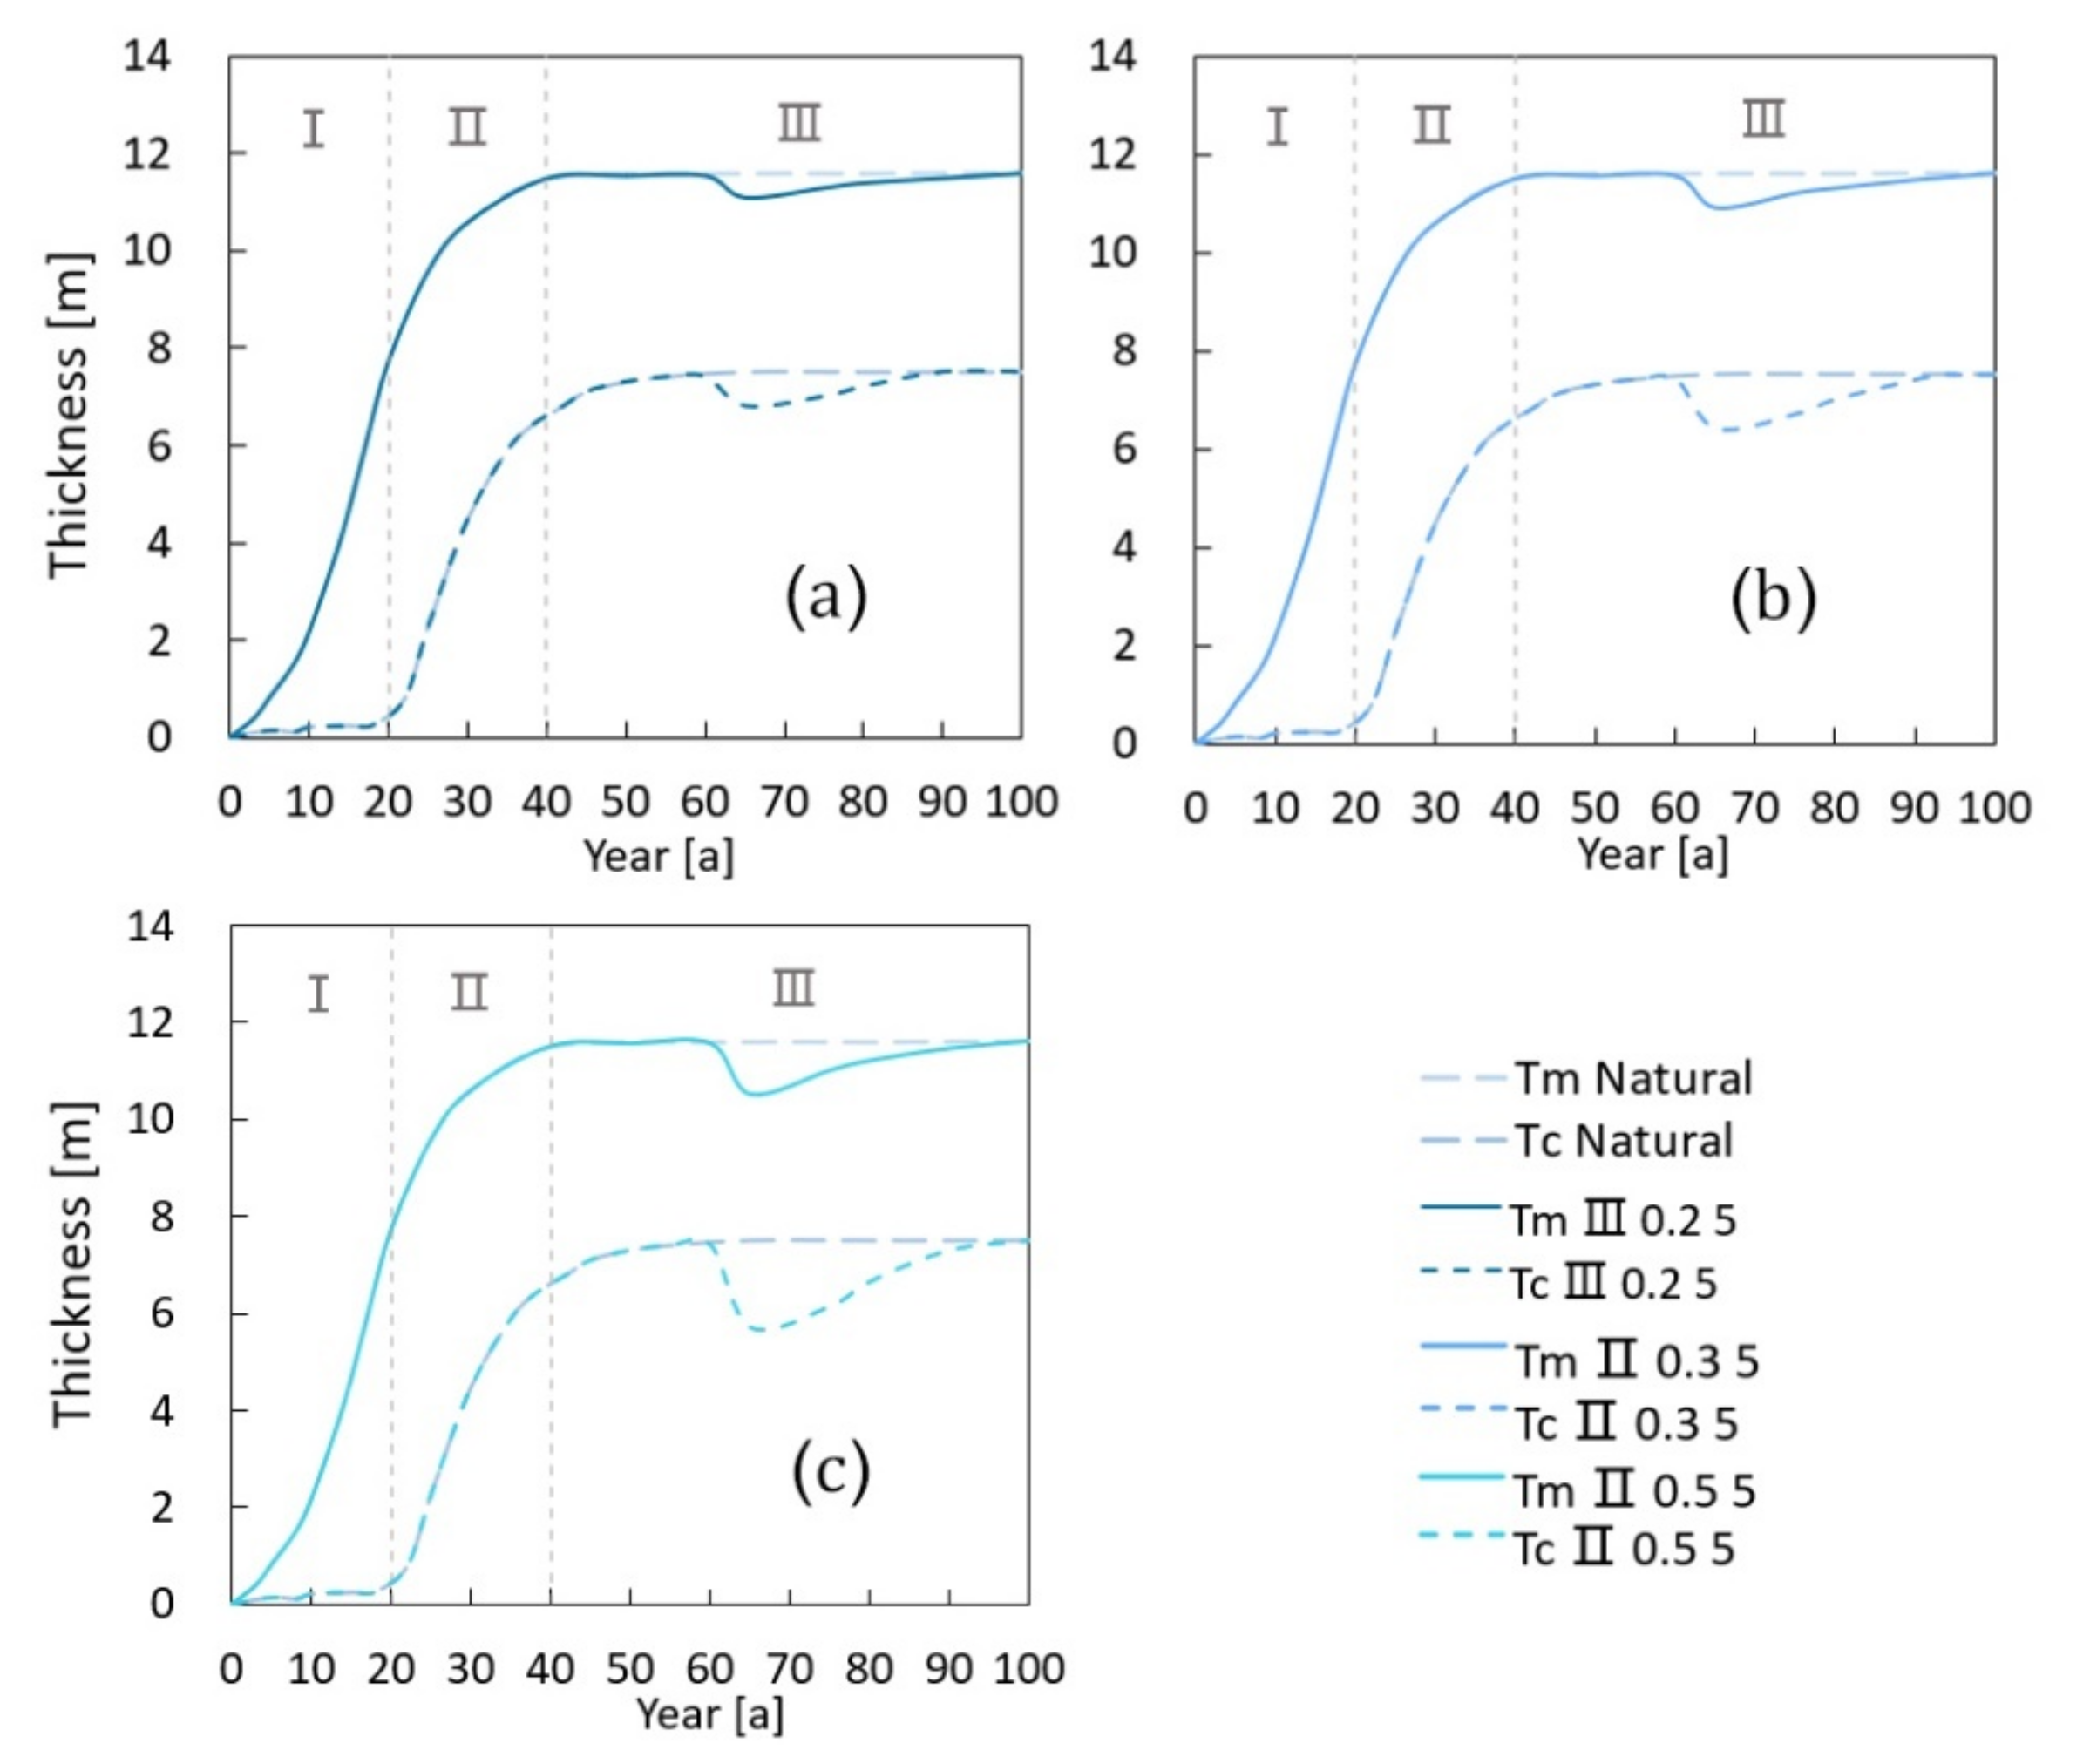
In the three different growth stages, the adaptability of the freshwater lens to pumping is different. To explore the response of the freshwater lens to the pumping process in the three stages, the pumping will be carried out for 5 years at Stage I, Stage II, and Stage III, with the pumping volume of 0.2, 0.3, and 0.5 m3/d. Because the freshwater lens in Stage I is very thin and has a limited distribution range, the pumping well will be quickly broken down by saltwater, so this stage is not suitable for exploitation.
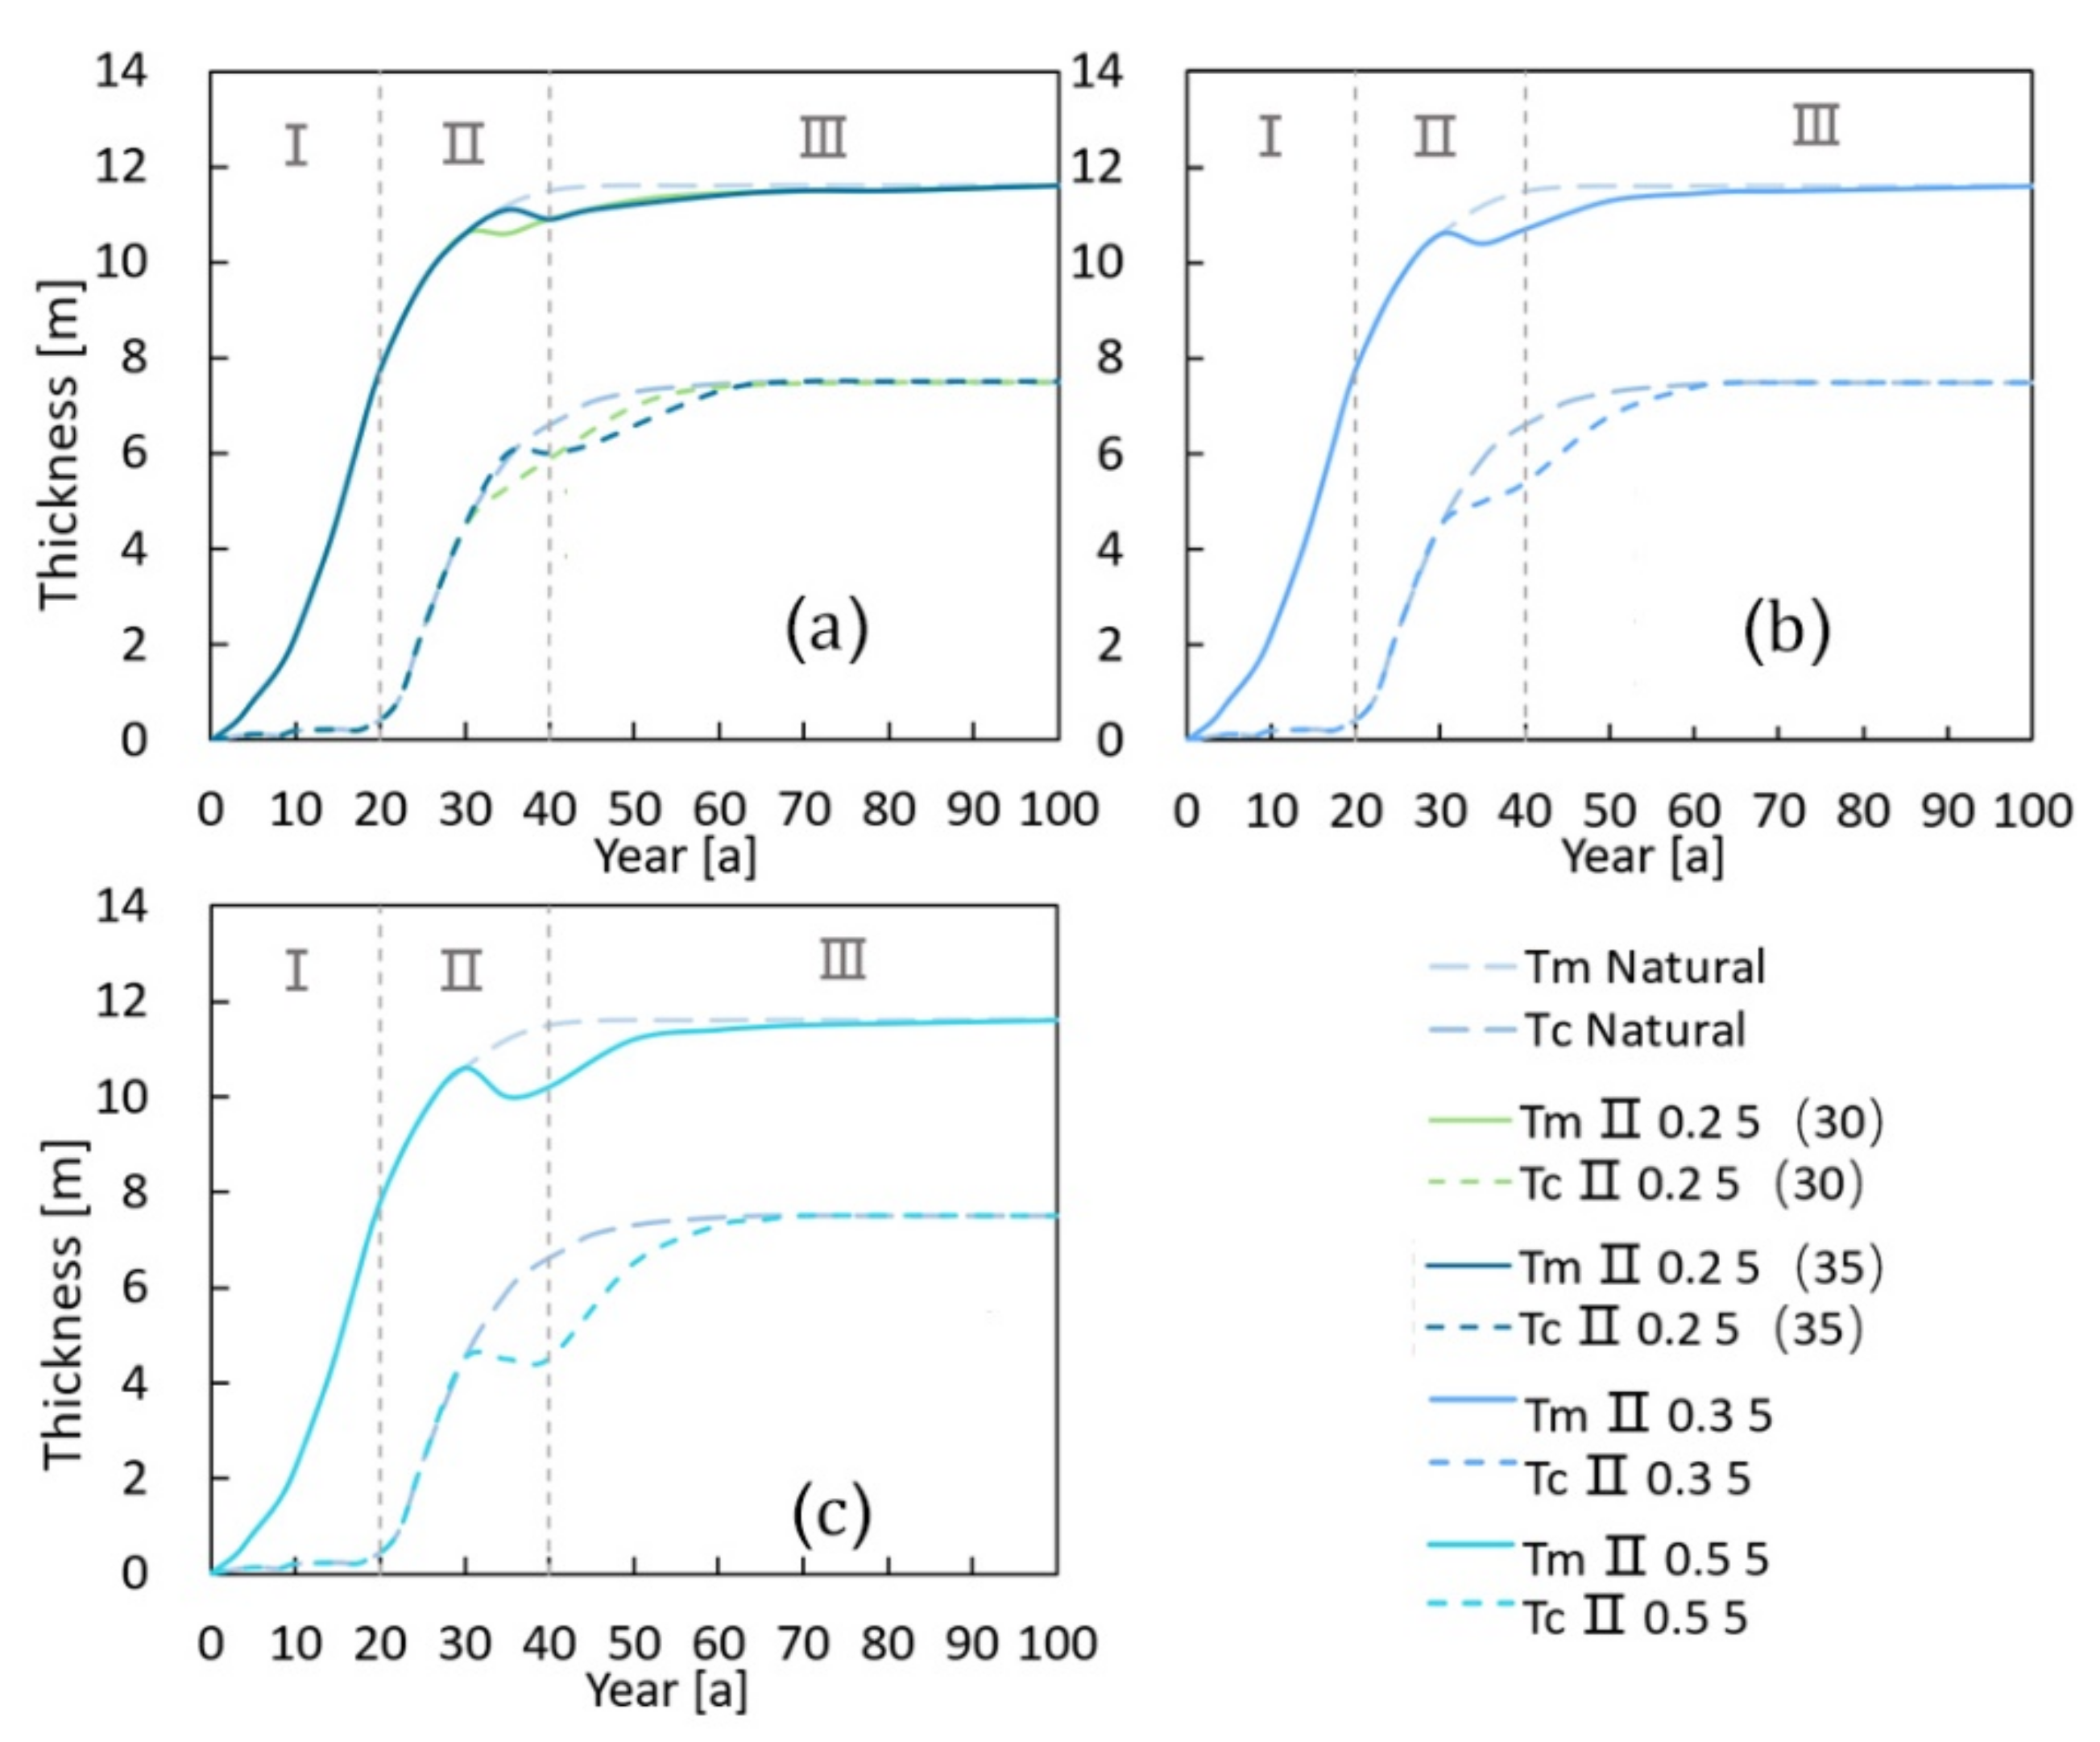
The change process of the thickness of the freshwater lens in the pumping process of Stage II is shown in Figure 8. Compared with Stage I, the freshwater lens in Stage II has developed to a larger volume, and the effect of short-term exploitation at a low pumping rate on the freshwater lens thickness can be offset by the natural increase of lens. However, in the early stage of Stage II, during which Tc is very small, there is a high risk of the production well being broken down by saltwater. The recovery time is much shorter (10 years shorter) if the pumping starts in early Stage II rather than late State II (Table 2).
In Stage III (Figure 9), the freshwater lens is developed and maintains a relatively stable shape, with large Tm and Tc. Compared with the pumping at the end of Stage II, the reduction in the thickness of the freshwater lens in Stage III is larger under the same pumping rates (Table 2). However, because the thickness base of the freshwater lens in this stage is larger, even if the thickness is reduced, it is still thicker than that in Stage II, which makes the freshwater lens in Stage III able to withstand greater pumping intensity. The duration is very long, which means there is a possibility of long-term pumping. In general, the freshwater lens is more adaptable to pumping in Stage III.
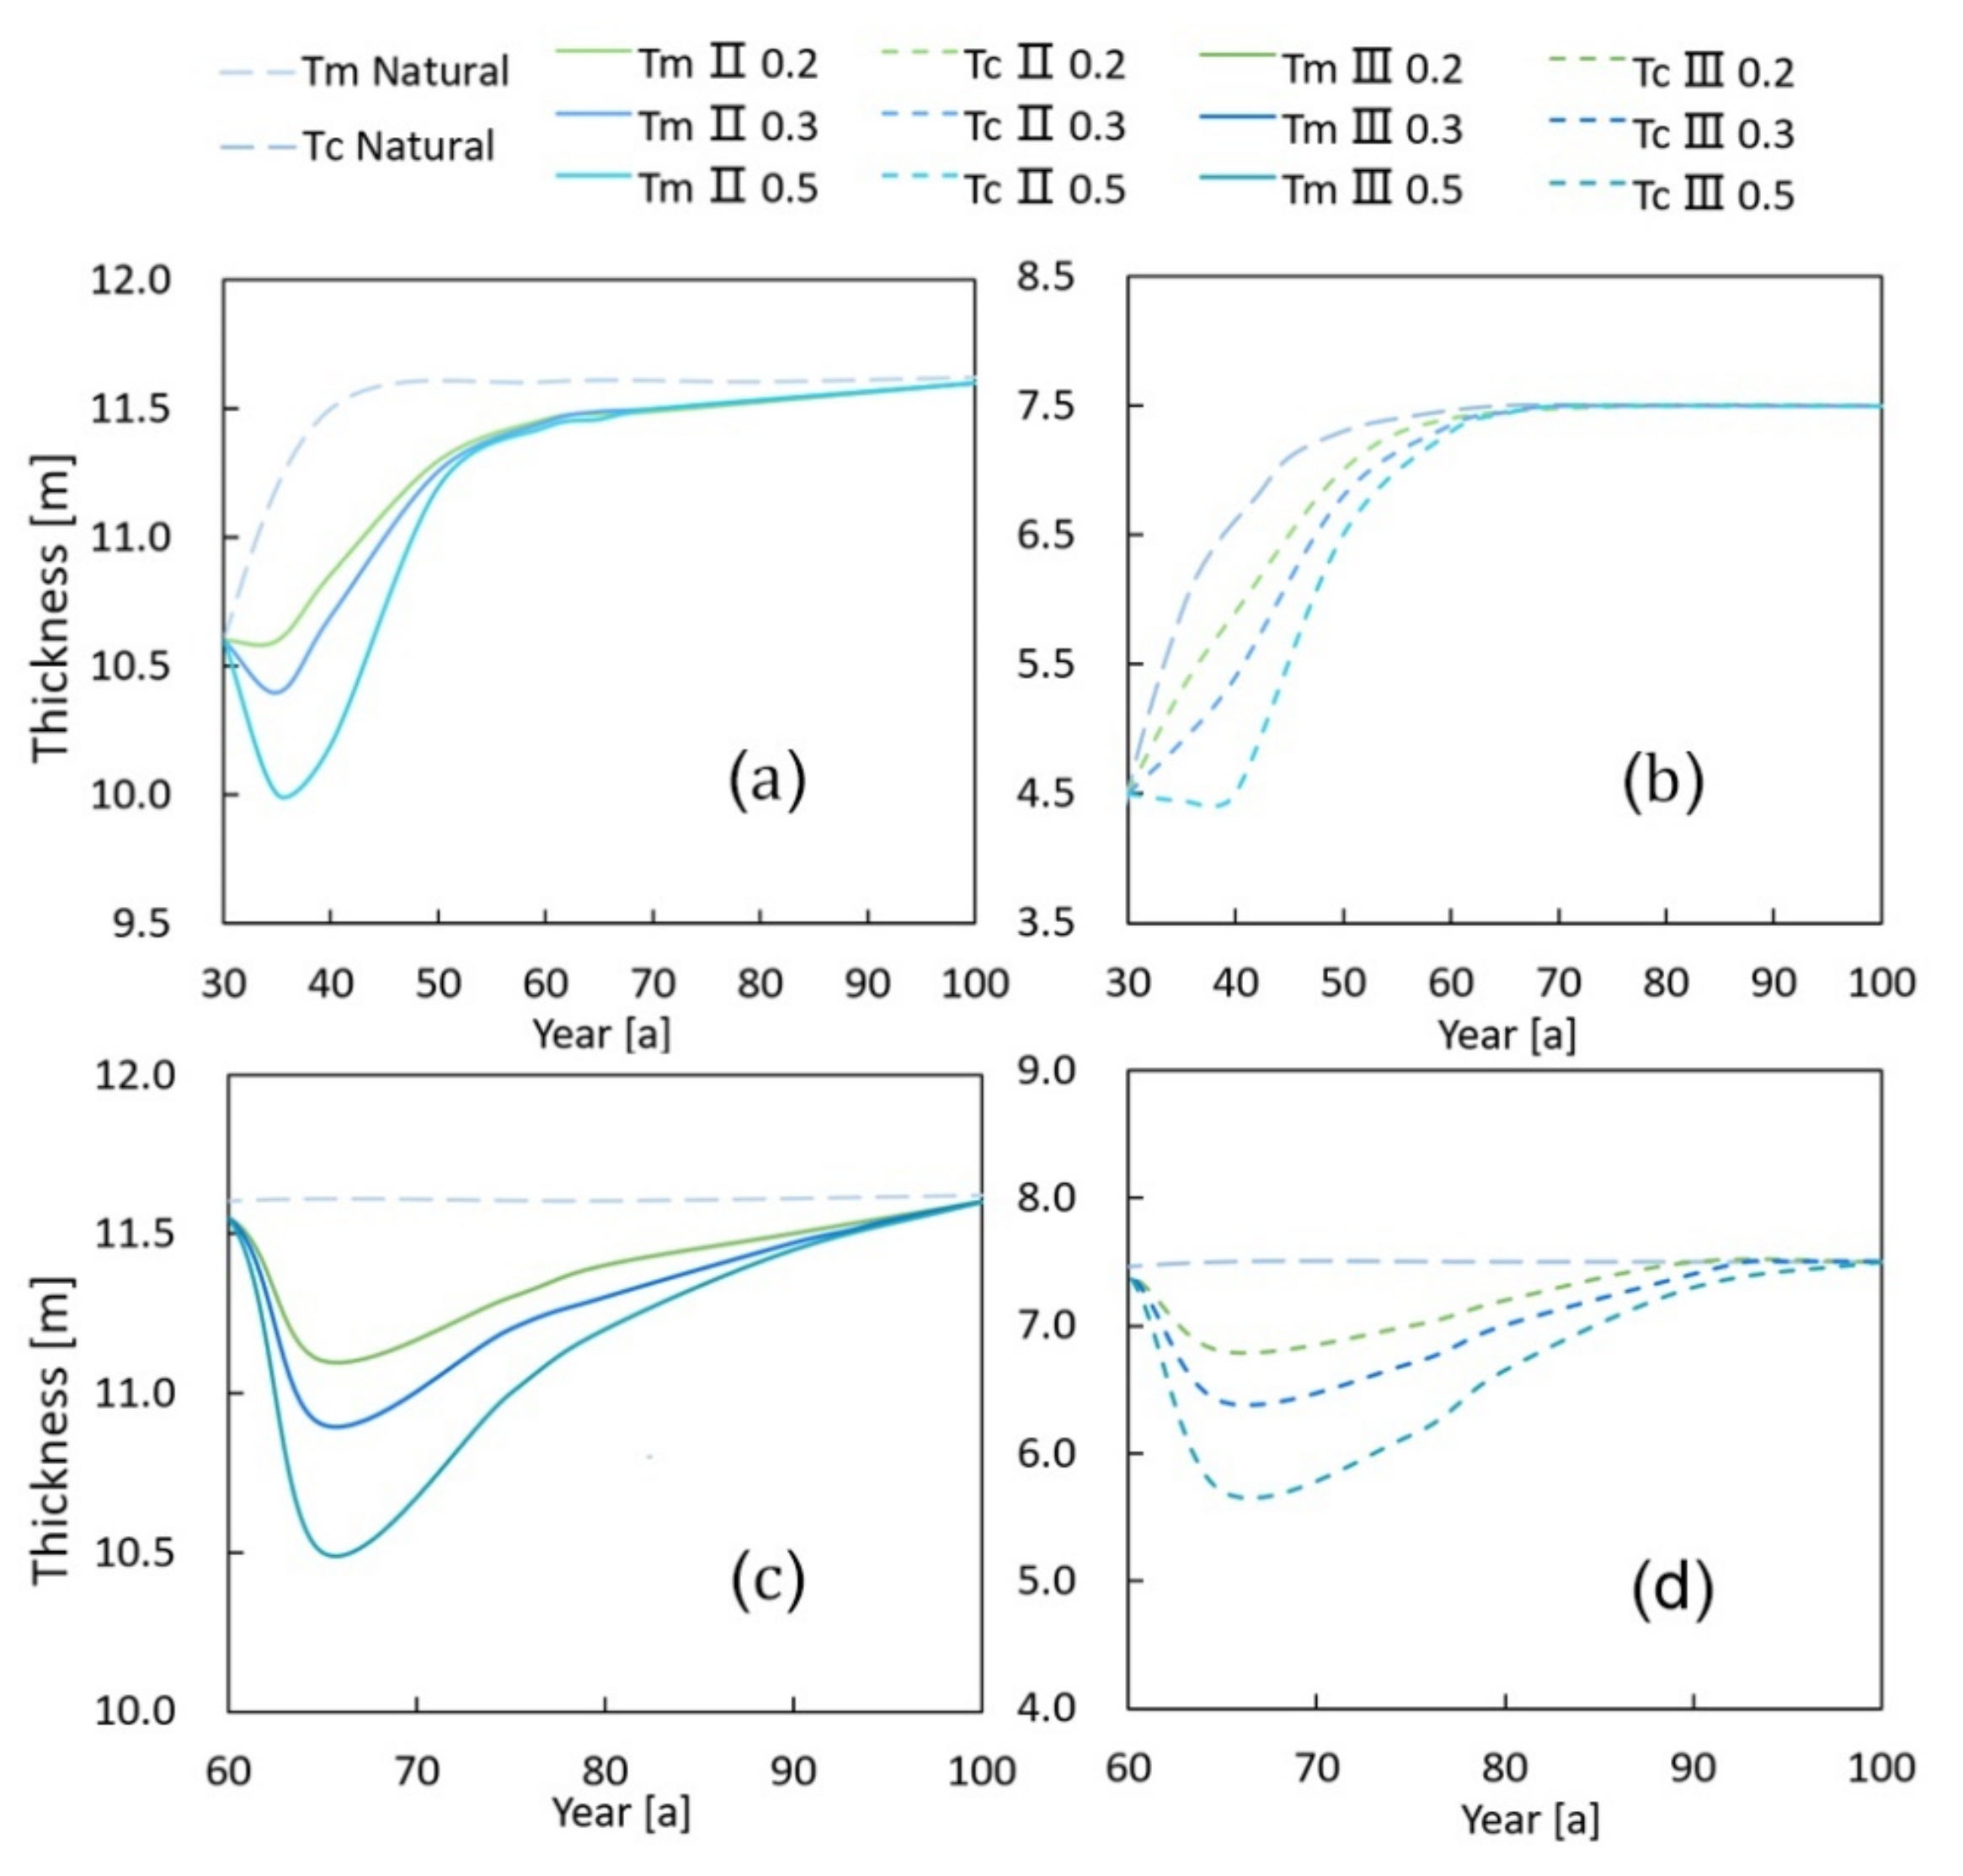
If other conditions do not change, the time required for the freshwater lens to recover to its natural state after pumping suspension is mainly affected by the pumping intensity and the growth stage of the freshwater lens when pumping starts (Figure 10). In the early stage of Stage II, the pumping volume is 0.2 m3/d for five years, and the recovery time to the natural state after pumping is 30 years. In the later stage of Stage II, the pumping will be carried out for five years with the same pumping amount, and the impact on the thickness can last for 25 years. Compared with the pumping in the earlier stage of Stage II, the recovery time will be shortened by five years. In Stage III, the pumping volume is 0.2, 0.3, and 0.5 m3/d, respectively, and the recovery time after pumping suspension increases with the increase in pumping intensity, which is 25, 30, and 35 years, respectively.
To sum up, pumping is not recommended in the early stage of Stage II; in the middle and late stage of Stage II, relatively short and low intensity pumping can be accepted; and in Stage III, long-term pumping with relatively higher intensity is possible, but it should be noted that the pumping intensity should not be too large, and the basic requirement that the wells should not be broken down by saltwater during the pumping period should be met.
4.3. Calculation of the Safe Exploitable Coefficient
The sustainable exploitation amount should not exceed the exploitable amount of groundwater. The exploitable coefficient (ρ) refers to the ratio of the exploitable amount of groundwater (Q) in an area to the total recharge amount of groundwater (W) in the same area:
where ρ is the exploitable coefficient; Q is the exploitable amount of groundwater in the area, W is the total recharge of groundwater in the same area. Furthermore, ρ should not be greater than 1. The closer the ρ value is to 1, the better the exploitation condition of aquifer is, and the smaller the ρ value is, the worse the exploitation condition is.
ρ = Q/W
The assessment of sustainable exploitation must be based on decades of time scale [18]. This paper adopts the concept of total critical pumping rate (QT) (the maximum pumping rate of all pumping wells without salinization under pumping conditions) for an inverse calculation of maximum exploitation through numerical simulation [22]. Nine well layout schemes along a straight line are designed in this study, which include the combination of different well numbers, well spacing, and the length of screen. Under the premise of continuous pumping for 20 years without salinization, the maximum total pumping rates obtained by each scheme have a large difference, reflected by the large variation in exploitation coefficients ranging from 0.09 to 0.37 (Table 3). This means that on a small island, the specific layout plan of pumping wells has a huge impact on the exploitable amount of groundwater.
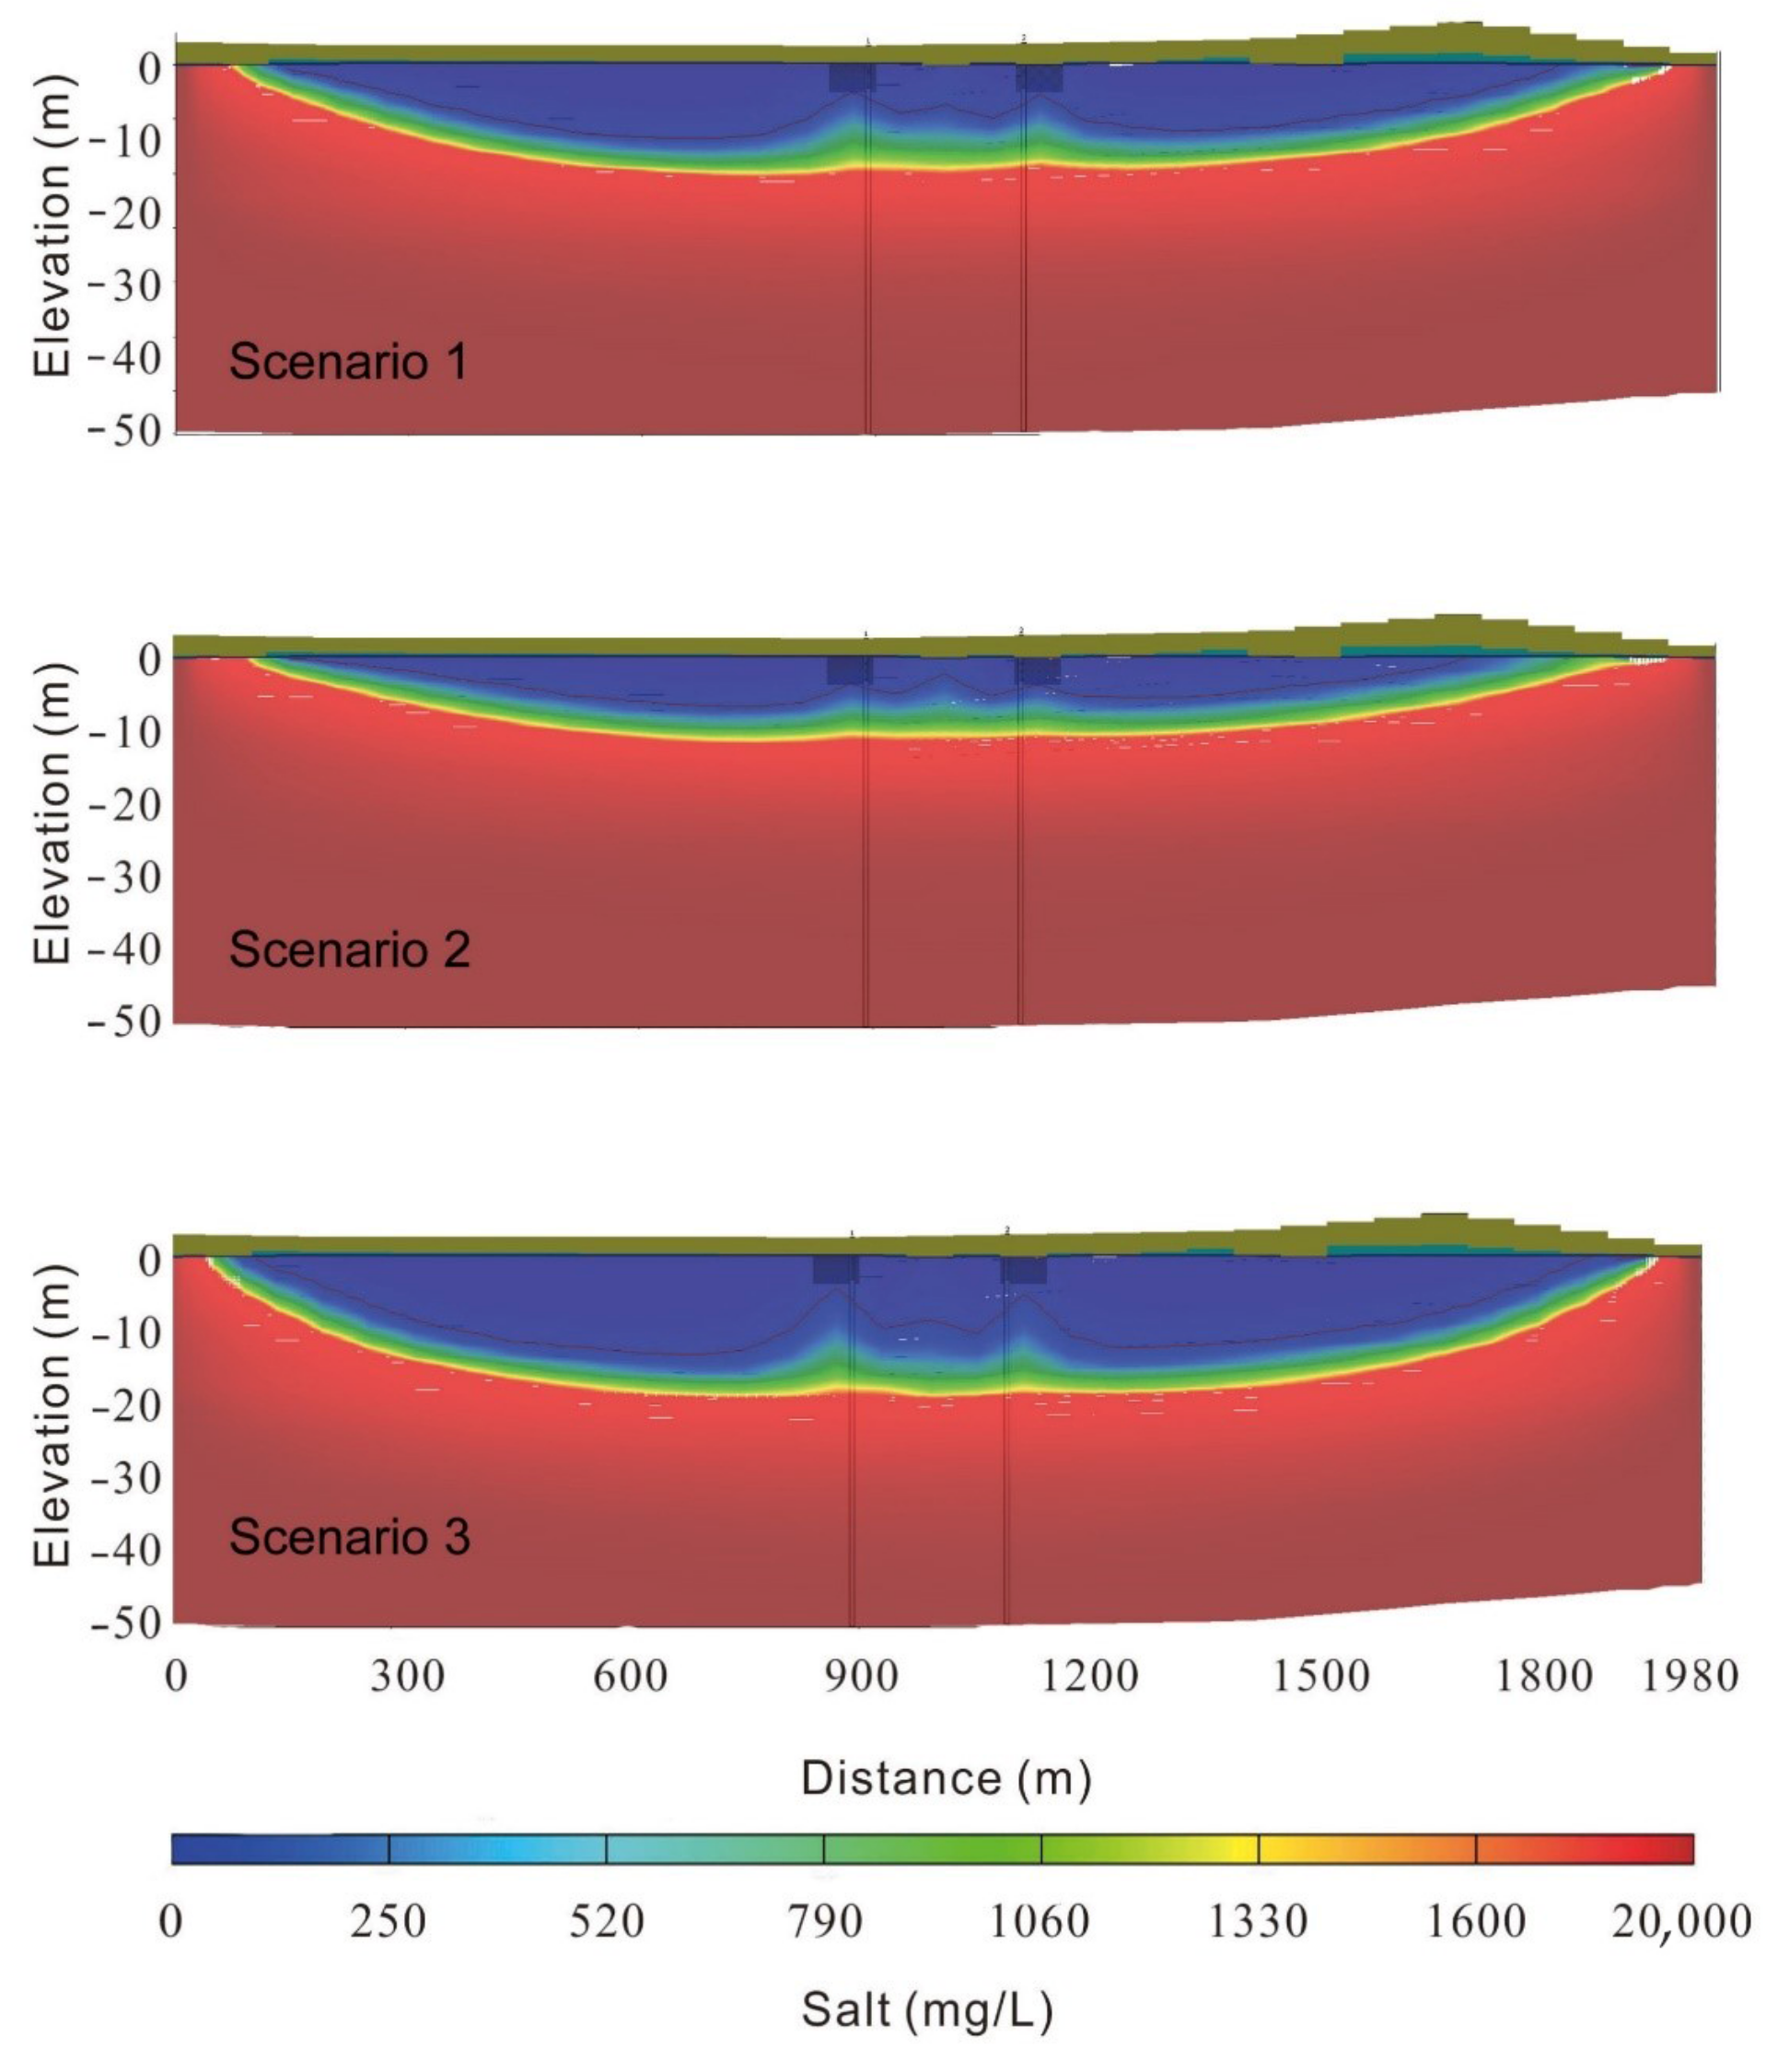
Due to the uncertainty of hydrogeological parameters, even under the determined well layout scheme, QT is also uncertain. In this study, the impact of hydrogeological parameter uncertainty on QT is investigated by conducting simulations under three combinations of net recharge (R), hydraulic conductivity (K), and porosity (n) (Table 4) in a linear well layout plan (two wells with a length of 3 m and a spacing of 200 m). The exploitable amount of groundwater obtained under this scheme is not the largest, but the seasonal contraction of Tc and Tm of the freshwater lens is comprehensively considered to ensure that the reduction in Tc and Tm will maximize the benefit of QT increase when the thickness of the freshwater lens is not less than 2 m. Therefore, the QT and ρ are safe. The pumping period is 20 years in the growth Stage III of the freshwater lens.
The simulation results of the three scenarios are shown in Figure 11. Table 4 indicates that if the extraction volume is used for continuous pumping, as long as the hydrogeological conditions do not change significantly, the pumping well will not be damaged by saltwater. Our result reflects that the difference of hydrogeological conditions has a significant impact on the exploitable amount of groundwater, and the uncertainty of hydrogeological parameters must be considered when determining the safe exploitable quantity.
The recovery time, exploitable volume, and exploitable coefficient of freshwater lens under three scenarios are recorded in Table 4, and ρ ranges from 0.1 to 0.18 under different combinations of hydrogeological parameters. Therefore, under the determined well layout plan, the safe exploitable coefficient is only 0.1, which is very small, but it can protect the freshwater lens as much as possible from damage. The smaller exploitable coefficient corresponds to larger recovery time, which shows that the combination of parameters conducive to pumping is not conducive to the recovery of freshwater lenses.
5. Conclusions
In this paper, the characteristics of each stage in the formation process of a coral island freshwater lens is studied, and the most suitable exploitation stage of freshwater lens is analyzed considering the seasonal contraction of freshwater lens caused by rainfall, different well layout schemes, and hydrogeological parameter combinations. Furthermore, the exploitable coefficient and the partial safe exploitable coefficient under a certain well layout scheme are calculated.
Water resources assessment, development, and management in small islands should be conducted considering the specific characteristics of the study island. Our research provides a reference to determine the recoverable coefficient of other similar small islands around the world. Previous studies on the sustainable exploitation of islands were conducted based on the experience of managers [25]. In this paper, QT was used to deduce the exploitable amount and exploitable coefficient of the freshwater lens on the basis of considering the exploitation stage, seasonal variation in rainfall, and parameter uncertainty, which provides numerical solutions for the study of the sustainable exploitation of the freshwater lens. The recoverable coefficient calculated in this paper varies with different well layout schemes, generally ranging from 0.09 to 0.37, which is consistent with the results from previous studies [5,25,26]. However, under a determined pumping well layout scheme, the calculated exploitable coefficient is determined to be 0.1, which is small but safe, by considering the lens contraction caused by rainfall and the most unfavorable combination of hydrogeological parameters.
The exploitability coefficient of small coral islands is significantly lower than that of inland areas (0.6–0.95). The reason is that the freshwater on the island is constantly mixed with saltwater and partly discharges into the sea, while the other part maintains a certain head difference to resist seawater intrusion. In this situation, a large part of the recharge cannot be exploited. In addition, the pumping conditions on the island are worse than those in inland areas, resulting in a generally small exploitable coefficient on the island.
The freshwater lens is a valuable freshwater resource in island areas and exhibits seasonal responses to precipitation under natural conditions. In terms of water supply for the small coral island, managers should pay attention to the sustainability of the pumping process and the protection of pumping wells, which requires a deeper understanding of the island’s hydrogeological conditions. It is necessary to select appropriate pumping methods according to the characteristics of the island itself, determine the exploitable coefficient scientifically, pertinently, and timely to adjust the pumping plan and pumping plan according to the development of the island, and finally achieve “one island, one policy”.
Author Contributions
Data curation, Z.L.; funding acquisition, R.Z.; methodology, R.W.; project administration, L.S.; supervision, L.S.; validation, Z.L.; writing—original draft, R.W.; writing—review and editing, R.Z. All authors have read and agreed to the published version of the manuscript.
Funding
This research was made possible by the Key Technologies and Application Demonstration of Groundwater Over-Extraction Control and Protection in Huang-Huai-Hai Region (No. 2021YFC3200502) to the second author and the Belt and Road Special Foundation of the State Key Laboratory of Hydrology-Water Resources and Hydraulic Engineering (2021490911) to the third author.
Institutional Review Board Statement
Not applicable.
Informed Consent Statement
Not applicable.
Data Availability Statement
Data is contained within the article.
Acknowledgments
All authors are very grateful to the editor and the anonymous reviewers for their valuable comments: which have greatly improved the paper.
Conflicts of Interest
The authors declare no conflict of interest.
References
- Chui, T.F.M.; Terry, J.P. Influence of sea-level rise on freshwater lenses of different atoll island sizes and lens resilience to storm-induced salinization. J. Hydrol. 2013, 502, 18–26. [Google Scholar] [CrossRef]
- Gohar, A.A.; Cashman, A.; Ward, F.A. Managing food and water security in Small Island States: New evidence from economic modelling of climate stressed groundwater resources. J. Hydrol. 2019, 569, 239–251. [Google Scholar] [CrossRef]
- UNESCO. Small Island Developing States—UNESCO’s Action Plan; Ikhlef, K., Nakashima, D., Eds.; United Nations Educational, Scientific and Cultural Organization: Paris, France, 2016; 32p. [Google Scholar]
- Gingerich, S.B.; Voss, C.I.; Johnson, A.G. Seawater-flooding events and impact on freshwater lenses of low-lying islands: Controlling factors, basic management and mitigation. J. Hydrol. 2017, 551, 676–688. [Google Scholar] [CrossRef]
- White, I.; Falkland, T. Management of freshwater lenses on small Pacific islands. Hydrogeol. J. 2010, 18, 227–246. [Google Scholar] [CrossRef]
- Shuhei, Y.; Satoshi, I.; Tsutomu, K.; Kazuhisa, K.; Takeo, T.; Katsushi, S. Using hydrogeochemical indicators to interpret groundwater flow and geochemical evolution of a freshwater lens on Majuro Atoll, Republic of the Marshall Islands. Hydrogeol. J. 2020, 28, 1053–1075. [Google Scholar]
- Fetter, C. Position of the saline water interface beneath oceanic islands. Water Resour. Res. 1972, 8, 1307–1315. [Google Scholar] [CrossRef]
- Bokuniewicz, H.; Pavlik, B. Groundwater seepage along a barrier island. Biogeochemistry 1990, 10, 257–276. [Google Scholar] [CrossRef]
- Bryan, E.; Meredith, K.T.; Baker, A.; Post, V.E.; Andersen, M.S. Island groundwater resources, impacts of abstraction and a drying climate: Rottnest Island, Western Australia. J. Hydrol. 2016, 542, 704–718. [Google Scholar] [CrossRef]
- Schneider, J.C.; Kruse, S.E. A comparison of controls on freshwater lens morphology of small carbonate and siliciclastic islands: Examples from barrier islands in Florida, USA. J. Hydrol. 2003, 284, 253–269. [Google Scholar] [CrossRef]
- Underwood, M.R.; Peterson, F.L.; Voss, C.I. Groundwater lens dynamics of atoll islands. Water Resour. Res. 1992, 28, 2889–2902. [Google Scholar] [CrossRef]
- Vacher, H.L.; Wallis, T. Comparative hydrogeology of fresh-water lenses of Bermuda and Great Exuma Island, Bahamas. Groundwater 1992, 30, 15–20. [Google Scholar] [CrossRef]
- Wallace, C.D.; Bailey, R.T. Geohydrologic factors governing atoll island groundwater resources. J. Hydrol. Eng. 2017, 22, 05017004. [Google Scholar] [CrossRef]
- Congzhi, Z.; Li, H.; Qin, Y.; Zhendong, F. Three-dimensional numerical simulation of freshwater lens in coral islands. J. Hydraul. Eng. 2010, 41, 560–566. [Google Scholar]
- Yao, Y.; Andrews, C.; Zheng, Y.; He, X.; Babovic, V.; Zheng, C. Development of fresh groundwater lens in coastal reclaimed islands. J. Hydrol. 2019, 573, 365–375. [Google Scholar] [CrossRef]
- Li, Y.; Shu, L.; Zhen, L.; Li, H.; Wang, R.; Opoku, P. Laboratory Physical Experiments on the Saltwater Upconing and Recovery of Island Freshwater Lenses: Case Study of a Coral Island, China. Water 2021, 13, 1137. [Google Scholar] [CrossRef]
- Dose, E.J.; Stoeckl, L.; Houben, G.J.; Vacher, H.L.; Vassolo, S.; Dietrich, J.; Himmelsbach, T. Experiments and modeling of freshwater lenses in layered aquifers: Steady state interface geometry. J. Hydrol. 2014, 509, 621–630. [Google Scholar] [CrossRef]
- Post, V.E.; Bosserelle, A.L.; Galvis, S.C.; Sinclair, P.J.; Werner, A.D. On the resilience of small-island freshwater lenses: Evidence of the long-term impacts of groundwater abstraction on Bonriki Island, Kiribati. J. Hydrol. 2018, 564, 133–148. [Google Scholar] [CrossRef]
- Fu, W.; Moore, J.K.; Primeau, F.W.; Lindsay, K.; Randerson, J.T. A growing freshwater lens in the Arctic Ocean with sustained climate warming disrupts marine ecosystem function. J. Geophys. Res. Biogeosci. 2020, 125, e2020JG005693. [Google Scholar] [CrossRef]
- Sulzbacher, H.; Wiederhold, H.; Siemon, B.; Grinat, M.; Igel, J.; Burschil, T.; Günther, T.; Hinsby, K. Numerical modelling of climate change impacts on freshwater lenses on the North Sea Island of Borkum using hydrological and geophysical methods. Hydrol. Earth Syst. Sci. 2012, 16, 3621–3643. [Google Scholar] [CrossRef] [Green Version]
- Ling, Z.; Shu, L.; Sun, Y.; Wang, R.; Li, Y. Impact of island urbanization on freshwater lenses: A case study on a small coral island. Water 2021, 13, 3272. [Google Scholar] [CrossRef]
- Wang, R.; Shu, L.; Li, Y.; Opoku, P.A. Pumping Well Layout Scheme Design and Sensitivity Analysis of Total Critical Pumping Rates in Coral Island Based on Numerical Model. Water 2021, 13, 3215. [Google Scholar] [CrossRef]
- Lloyd, J.; Miles, J.; Chessman, G.; Bugg, S. A ground water resources study of a pacific ocean atoll-tarawa, gilbert islands 1. Jawra. J. Am. Water Resour. Assoc. 1980, 16, 646–653. [Google Scholar] [CrossRef]
- Bailey, R.T.; Jenson, J.W.; Olsen, A.E. Estimating the ground water resources of atoll islands. Water 2010, 2, 1–27. [Google Scholar] [CrossRef]
- Peterson, F.L. Hydrogeology of the Marshall Islands. Dev. Sedimentol. 2004, 54, 611–636. [Google Scholar] [CrossRef]
- Ibrahim, S.A.; Bari, M.R.; Miles, L. Water Management in Maldives with Special Emphasis on Desalination. In Proceedings of the Pacific Regional Consultation on Water in Small Island Countries, July 29th–August 3rd 2002; Carpenter, C., Stubbs, J., Overmars, M., Eds.; Asian Development Bank and South Pacific Applied Geoscience Commission: Sigatoka, Fiji; Available online: http://citeseerx.ist.psu.edu/viewdoc/download?doi=10.1.1.113.913&rep=rep1&type=pdf (accessed on 17 November 2016).
- Pauw, P.S.; van der Zee, S.E.; Leijnse, A.; Oude Essink, G.H. Saltwater upconing due to cyclic pumping by horizontal wells in freshwater lenses. Groundwater 2016, 54, 521–531. [Google Scholar] [CrossRef]
- Langevin, C.D.; Shoemaker, W.B.; Guo, W. MODFLOW-2000. The US Geological Survey Modular Ground-Water Model–Documentation of the SEAWAT-2000 Version with the Variable-Density Flow Process (VDF) and the Integrated MT3DMS Transport Process (IMT); Center for Integrated Data Analytics Wisconsin Science Center Wisconsin: Madison, WI, USA, 2000; pp. 1258–2331. [Google Scholar]
- Harbaugh, A.W.; Banta, E.R.; Hill, M.C.; McDonald, M.G. Modflow-2000, the U. S. Geological Survey Modular Ground-Water Model-user Guide to Modularization Concepts and the Ground-Water Flow Process; United States Department of the Interior: Washington, DC, USA, 2000. [Google Scholar]
- Anderson, M.P.; Woessner, W.W.; Hunt, R.J. Applied Groundwater Modeling: Simulation of Flow and Advective Transport, 2nd ed.; Academic Press: Cambridge, MA, USA, 2015. [Google Scholar]
- Zhou, C.; Qiao, H.; Du, R. Simulation and exploitation of the freshwater lens in Coral Island. J. Logist. Eng. Univ. 2016, 32, 1–10. [Google Scholar]
- Sheng, C.; Xu, H.; Zhang, Y.; Zhang, W.; Rem, Z. Hydrological properties of calcareous sands and its influence on formation of underground freshwater lens on islands. J. Jilin Univ. 2020, 50, 1127–1138. (In Chinese) [Google Scholar]
- Oberdorfer, J.A.; Hogan, P.J.; Buddemeier, R.W. Atoll Island Hydrogeology: Flow and Freshwater Occurrence in a Tidally Dominated System. J. Hydrol. 1990, 120, 327–340. [Google Scholar] [CrossRef]
- Holding, S.; Allen, D. From days to decades: Numerical modelling of freshwater lens response to climate change stressors on small low-lying islands. Hydrol. Earth Syst. Sci. 2015, 19, 933–949. [Google Scholar] [CrossRef] [Green Version]
- World Health Organization. Guidelines for Drinking-Water Quality, 3rd ed.; World Health Organization: Geneva, Switzerland, 2004; Volume 1. [Google Scholar]
Figure 1.
Conceptual model of small coral island.

Figure 2.
The grid of the developed model.

Figure 3.
Morphology and velocity distribution of the freshwater lens (a: stagnation zone).

Figure 4.
Division of growth stages of freshwater lens.

Figure 5.
Seasonal variation in freshwater lens thickness.

Figure 6.
Seasonal change of freshwater lens reserves.

Figure 7.
Seasonal change in the edge of the freshwater lens.

Figure 8.
Thickness changes of the freshwater lens in Stage II under pumping conditions (a) Q = 0.2 m3/d, pumping starts in the middle of Stage II (30), and pumping starts in the late stage of Stage II (35), (b) Q = 0.3 m3/d, and (c) Q = 0.5 m3/d.
Figure 8.
Thickness changes of the freshwater lens in Stage II under pumping conditions (a) Q = 0.2 m3/d, pumping starts in the middle of Stage II (30), and pumping starts in the late stage of Stage II (35), (b) Q = 0.3 m3/d, and (c) Q = 0.5 m3/d.

Figure 9.
Thickness changes of the freshwater lens in Stage III under pumping conditions (a) Q = 0.2 m3/d, (b) Q = 0.3 m3/d, and (c) Q = 0.5 m3/d.
Figure 9.
Thickness changes of the freshwater lens in Stage III under pumping conditions (a) Q = 0.2 m3/d, (b) Q = 0.3 m3/d, and (c) Q = 0.5 m3/d.

Figure 10.
Recovery process of freshwater lens thickness after stopping pumping ((a): changes in Tm in Stage II; (b): changes in Tc in Stage II; (c): changes in Tm in Stage III; and (d): changes in Tc in Stage III).
Figure 10.
Recovery process of freshwater lens thickness after stopping pumping ((a): changes in Tm in Stage II; (b): changes in Tc in Stage II; (c): changes in Tm in Stage III; and (d): changes in Tc in Stage III).

Figure 11.
Pumping simulation results.


Table 1.
Parameter values used in the model for the coral island groundwater system.
| Settings | Parameter | Units | Value |
|---|---|---|---|
| Basic setup | Island width | m | 1980 |
| Thickness | m | 50 | |
| Grid | \ | 41 × 22 | |
| Simulated time step | d | 36,525 | |
| Flow model | Recharge | mm/y | Monthly average recharge |
| Effective porosity | \ | 0.25–0.45 | |
| Holocene K | m/d | 60–150 | |
| Pleistocene K | m/d | 1000 | |
| Specific yield | \ | 0.1–0.2 | |
| Transport model | Longitudinal dispersivity | m | 5 |
| Density-dependent model | Reference fluid density | kg/m3 | 1000 |
| Seawater density | kg/m3 | 1025 |
Table 2.
Changes and recovery time of freshwater lens thickness at different stages and pumping volumes.
Table 2.
Changes and recovery time of freshwater lens thickness at different stages and pumping volumes.
| Stages | Pumping Duration (y) | Pumping Rates (m3/d) | Minimum Value (m) | Thickness Variation (m) | Recovery Time (y) | |||
|---|---|---|---|---|---|---|---|---|
| Tm | Tc | Tm | Tc | Tm | Tc | |||
| II | 5(30) | 0.2 | 10.6 | 5.3 | 0 | 0.8 | 35 | 35 |
| 5(35) | 0.2 | 10.9 | 6 | −0.2 | 0 | 25 | 25 | |
| 5 | 0.3 | 10.4 | 5 | −0.2 | 0.4 | 30 | 30 | |
| 5 | 0.5 | 10 | 4.5 | −0.6 | 0 | 35 | 35 | |
| III | 5 | 0.2 | 11.1 | 6.8 | −0.45 | −0.6 | 35 | 25 |
| 5 | 0.3 | 11 | 6.4 | −0.55 | −1 | 35 | 30 | |
| 5 | 0.5 | 10.5 | 5.7 | −1.05 | −1.7 | 35 | 35 | |
Table 3.
Well layout plan and results of QT, Tc, Tm, and ρ.
| Test Number | Well Layout Plan | Results | |||||
|---|---|---|---|---|---|---|---|
| Screen Length (m) | Number of Wells | Distance between Wells (m) | QT (m3/d) | Tc (m) | Tm (m) | ρ | |
| 1 | 4 | 4 | 100 | 0.407 | 4.3 | 9.2 | 0.17 |
| 2 | 2 | 4 | 200 | 0.73 | 1.1 | 7.4 | 0.30 |
| 3 | 2 | 6 | 150 | 0.907 | 0.5 | 6.1 | 0.37 |
| 4 | 3 | 4 | 150 | 0.555 | 2.3 | 8.2 | 0.23 |
| 5 | 2 | 2 | 100 | 0.33 | 2.2 | 9.8 | 0.13 |
| 6 | 4 | 6 | 200 | 0.735 | 1.7 | 7 | 0.30 |
| 7 | 3 | 6 | 100 | 0.562 | 2.8 | 7.5 | 0.23 |
| 8 | 4 | 2 | 150 | 0.215 | 3.3 | 10 | 0.09 |
| 9 | 3 | 2 | 200 | 0.33 | 4.6 | 9.8 | 0.13 |
| Max ρ | 2 | 6 | 150 | 0.907 | 0.5 | 6.1 | 0.37 |
| Min ρ | 4 | 2 | 150 | 0.215 | 3.3 | 10 | 0.09 |
Table 4.
Parameter combinations and calculation results.
| Parameter Combinations | Results | ||||||
|---|---|---|---|---|---|---|---|
| ΔR* | ΔK* | Δn* | Tm (m) | QT (m3/d) | Tr | ρ | |
| Scenario 1: | 0 | 0 | 0 | 9.3 | 0.330 | 35 | 0.13 |
| Scenario 2: | −30% | 30% | −30% | 6.3 | 0.174 | 31 | 0.1 |
| Scenario 3: | 30% | −30% | 30% | 12.6 | 0.573 | 37.1 | 0.18 |
Notes: ΔR* is the percentage of net recharge change, ΔK* is the percentage of hydraulic conductivity change, and Δn* is the percentage of porosity change.
Disclaimer/Publisher’s Note: The statements, opinions and data contained in all publications are solely those of the individual author(s) and contributor(s) and not of MDPI and/or the editor(s). MDPI and/or the editor(s) disclaim responsibility for any injury to people or property resulting from any ideas, methods, instructions or products referred to in the content. |
© 2023 by the authors. Licensee MDPI, Basel, Switzerland. This article is an open access article distributed under the terms and conditions of the Creative Commons Attribution (CC BY) license (https://creativecommons.org/licenses/by/4.0/).
Share and Cite
MDPI and ACS Style
Wang, R.; Shu, L.; Zhang, R.; Ling, Z. Determination of Exploitable Coefficient of Coral Island Freshwater Lens Considering the Integrated Effects of Lens Growth and Contraction. Water 2023, 15, 890. https://doi.org/10.3390/w15050890
AMA Style
Wang R, Shu L, Zhang R, Ling Z. Determination of Exploitable Coefficient of Coral Island Freshwater Lens Considering the Integrated Effects of Lens Growth and Contraction. Water. 2023; 15(5):890. https://doi.org/10.3390/w15050890
Chicago/Turabian StyleWang, Ran, Longcang Shu, Rongrong Zhang, and Zihan Ling. 2023. "Determination of Exploitable Coefficient of Coral Island Freshwater Lens Considering the Integrated Effects of Lens Growth and Contraction" Water 15, no. 5: 890. https://doi.org/10.3390/w15050890
Note that from the first issue of 2016, this journal uses article numbers instead of page numbers. See further details here.