
Microplastics Removal from a Plastic Recycling Industrial Wastewater Using Sand Filtration

Norwegian Institute for Water Research, Økernveien 94, 0579 Oslo, Norway
*
Author to whom correspondence should be addressed.
Water 2023, 15(5), 896; https://doi.org/10.3390/w15050896
Submission received: 13 January 2023
/
Revised: 20 February 2023
/
Accepted: 20 February 2023
/
Published: 26 February 2023
(This article belongs to the Special Issue Water Treatment and Emerging Contaminants)
Abstract
:The removal of microplastic from wastewater collected from a plastic recycling facility was investigated, using a laboratory scale sand-filter. Wastewater samples were collected before and after the onsite sand-filter, for characterization for different polymer types, sizes, and shapes. A considerable difference in the characteristics and concentrations of microplastics was observed before and after onsite sand-filtration, demonstrating differences in the source of microplastics and/or potential contamination of the sand-filter operated at the facility. The distribution of different polymers showed polyethylene and polypropylene to be the main microplastics present in the wastewater samples. In the next stage, the samples were passed through a laboratory scale sand-filter column, to investigate the removal of microplastics. The laboratory scale sand-filter showed high efficiency (up to 100%) in removing microplastics of all polymer types, shapes, and sizes, demonstrating the effectiveness of this well-developed, and widely adopted, method for the removal of microplastics from wastewater. As the green shift and circular economy will result in more plastics being recycled, this study demonstrates the need for quantification of microplastic in effluents from plastic recycling facilities. This is important for devising appropriate microplastic removal strategies, and meeting potential discharge regulations that may come into effect in the future.
1. Introduction
Microplastics (MPs) have been recognized as emerging contaminants, that pose risks to human health and aquatic ecosystems. MPs are typically characterized as plastic particles from 1 nm to < 5 mm in size [1]. These include particles originating from the degradation and weathering of large plastic items (secondary microplastics), and those that are directly discharged as primary MPs [2]. Primary MPs include virgin resin pellets, microbeads in personal care products such as facial scrub cleansers, industrial scrubbers that are used in abrasive cleaning agents, and plastic powders used in molding [3]. Secondary MPs are formed from the fragmentation of large plastics during their use (i.e., plastic used in agriculture, mismanaged litter, tyres, paints, or textiles), or after the plastics are released and are exposed to the environment [3]. The environmental risk associated with MPs is largely dependent on their size (lower size MPs can easily penetrate membranes in biota [4]), aging, transport, and retention in urban water systems [5]. Although the risk associated with the toxicological impacts of MPs remains to be fully understood, several investigations have reported their negative effects on aquatic organisms [6,7]. Furthermore, MPs have the potential to adsorb persistent organic pollutants [8,9] and heavy metals [10] from the surrounding water environment. For example, hydrophobic organic pollutants were reported to adsorb onto MPs, that can lead to increased risk upon their transfer to organs and tissues, particularly at higher concentrations [11]. Since a variety of plastic additives, such as flame retardants and plasticizers, are added to the plastics during their manufacturing, the impact on ecosystems and human health could be significant if these enter the food web through digestion by biota [12,13]. In a study [14] focused on the impact of MPs on human cerebral and epithelial cells, it was found that the MPs, in combination with 40–250 nm nanoplastics, induced oxidative stress to these cells. Although the level of MPs used in most studies is generally higher than found naturally in water, the increased use of plastics, and varying concentrations in the environment, emphasize the importance of understanding the negative impacts associated with MPs. It is also important from the perspective of developing appropriate wastewater treatment strategies.
Irrespective of the type of water matrix, MPs exhibit large variations in concentration of particles, type of polymer, and size [5]. Analyses of various types of MPs are therefore important from qualitative and quantitative perspectives, to both understand their behavior and risks, and to devise appropriate technologies for their removal. Significant developments in analytical methodologies for MPs have been made recently. Analytical methods for MPs include destructive techniques based on gas chromatography coupled to mass spectrometry (GC–MS) [15], including pyrolysis-GC–MS [16,17] and thermal extraction desorption-gas chromatography-mass spectrometry (TED-GC–MS) [18,19]. The polymeric composition of MPs can be determined by micro-Fourier transform infrared (μ-FTIR) spectroscopy or Raman microspectroscopy (μ-Raman) [20,21,22]. Both these techniques are highly sensitive to interference caused by organic matter, because of spectral similarities for MPs and natural organics. Raman microspectroscopy was recently reported to have lower detection limits of as low as 10 µm [23]. It can detect MPs as small as 1 µm, and hence is the preferred technique if lower detection limits are desired. A recent study proposed using fluid imaging flow cytometry, which is an automated particle imaging analysis technique capable of generating permanent digital record of samples [24]. It is less time and labor intensive than other techniques, such as μ-Raman and μ-FTIR, since it can rapidly collect multiple measurements of microplastics. It was also demonstrated that fluid imaging flow cytometry has the potential to analyze a wide range of particle sizes (0.9–1000 μm), and it does not require chemical digestion. This demonstrates the rapid developments taking place in the field of microplastics analysis.
A widespread occurrence of MPs in various water matrices such as urban runoff [25], household tap water [26], and water and wastewater treatment plants, has attracted great interest lately. Municipal wastewater is one of the most studied wastewater matrices for the occurrence and removal of MPs, with several studies reporting the removal of MPs during conventional wastewater treatment systems, with and without tertiary treatment processes [3,27,28,29]. Even though the wastewater treatment plants (WWTPs) have not been designed for the removal of MPs, a significant fraction of MPs could be removed during different stages of the treatment. Several treatment approaches, including membrane bioreactor [3,30], membrane disc filter [3,28], and sand-filter [3], have been investigated for the removal of MPs from wastewater. Only a few studies have looked at the removal of MPs in wastewater from the plastic industry, despite it being a potential major source of MPs to the environment [31]. The reduction in MPs from municipal WWTPs has been reported to range between 79.3–99.9% using conventional processes, including primary and secondary treatment but without a tertiary treatment step [27,29,32]. A review study compared findings from 21 studies, and found that the average removal of MPs was 88% and 95%, after secondary and tertiary treatments, respectively. In addition to the treatment process, the removal efficiency of MPs is dependent on the physicochemical properties of the polymer, such as density, particle size, charge, and hydrophobicity [33]. Nonetheless, WWTPs could be a significant source of MPs, despite a high removal of MPs, due to the large volume of effluent associated with WWTPs [34,35], that may necessitate the use of additional or targeted removal of MPs prior to effluent discharge.
This study was carried out using wastewater collected from a facility that recycles plastic waste from the fishing and aquaculture industry. The discarded plastic items that are recycled include used feed sacks, hoses, cages, and other waste from the fishing industry. The industry produces high quality plastic granulates from discarded plastic items. Sand filtration is one of the well-developed and cost-effective treatments that is often used in WWTPs as a tertiary treatment for the removal of various constituents. A laboratory scale sand-filter was employed for investigating the removal of MPs in this study. In addition to evaluating the removal of MPs, the sizes, shapes, and types of polymers were characterized, and their removal investigated, using a sand-filtration column.
2. Materials and Methods
Wastewater samples were collected from a plastic recycling facility using 2 L glass bottles. Wastewater samples were collected before and after the facility’s sand-filter, and transported to the laboratory under cold conditions. The samples were analyzed for microplastics using µ-FTIR. In addition to determining the concentration, the MPs were characterized for their morphological characteristics such as size, shape, colour, and type of polymer. Specifically, the MPs were classified into fibers, fragments, beads, colour, and polymer type. Both visual identification and µ-FTIR analysis were used to characterize the MPs. The removal of MPs was investigated using a sand-filter column, to examine the efficiency of sand filtration for the removal of different MPs constituting various shapes and polymer types found in the wastewater from the plastic recycling facility.
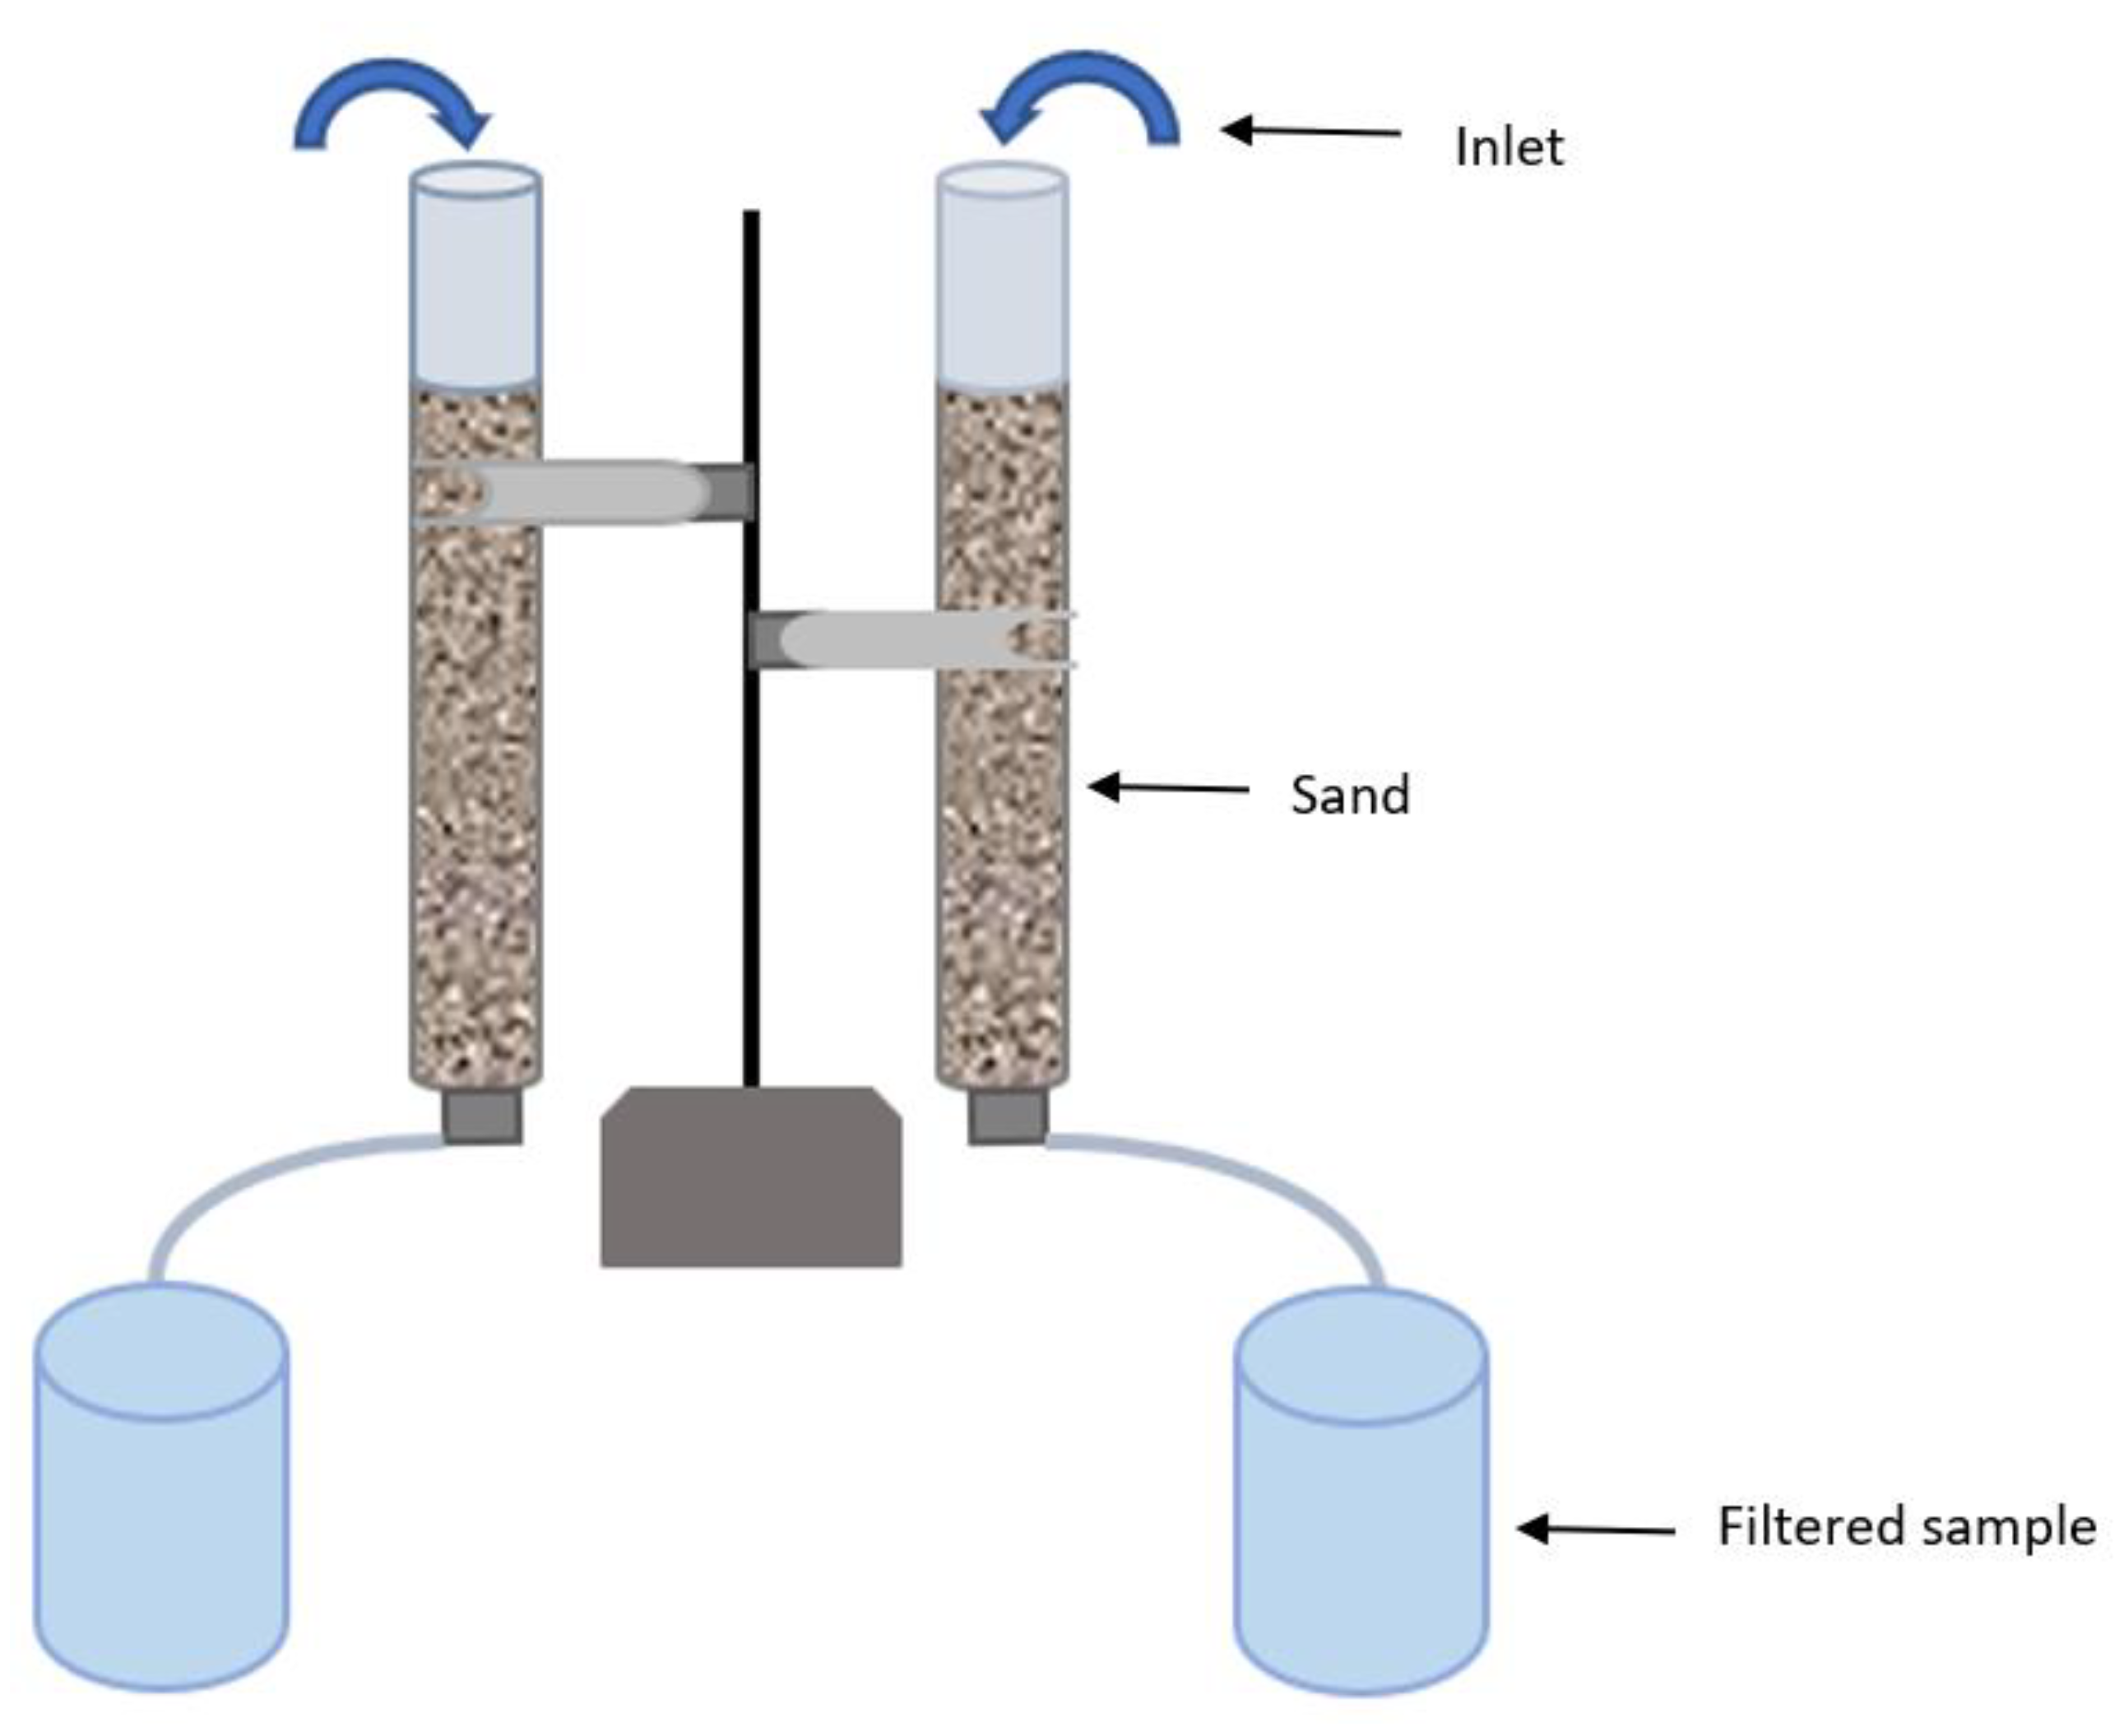
Two sand-filter columns (Figure 1) were operated, using sand that was washed with microplastic-free RO (Merck Millipore membrane filter, pore size 0.22 µm) water, and subsequently burnt at 550 °C. The average particle size of the sand was 0.7–1.4 mm. The sand-filter columns were covered with aluminum foil to avoid airborne contamination. The wastewater samples were filtered through the sand-filter column for filtration of microplastics. The flow rate of water through the columns was 7.24 cm3/min. The filter depth was 16 cm, and the internal diameter of the columns was 2.4 cm. A control sample was collected by passing the microplastic-free RO water through the sand column prior to experiments using the wastewater. A total of nine particles (mainly fibers) were found in the control water sample. The results were corrected considering the concentration of microplastics in the control water.
2.1. Sample Processing and Treatment for Identification of Microplastics
The samples from the plastic recycling facility, and the samples that were filtered through the sand-filter, were first volume-reduced by using sieves of different pore sizes, and then treated with 10 % KOH to remove organic material. After volume reduction and removal of organic material, the samples were filtered onto a GF/A glass fiber filter (pore size 1.6 μm, Ø 47 mm).
Five method blanks were included to see if there was contamination from the laboratory and personnel. The blanks were treated the same way as the samples. Prefiltered RO-water was used for the method blanks, and particles were observed in three out of the five blanks (one blue viscose fiber, and a blue and black cellulose fiber). A chemical blank was also included, to observe contamination from the 10% KOH. One black cellulose fiber was observed in this blank. The blanks were processed and filtered the same day the samples were processed in the laboratory. The blank results were used to correct the results of the samples. Every black cellulose fiber, blue cellulose fiber, and blue viscose fiber were subtracted from the results of the samples, as it was not possible to verify if these particles were from the samples or from the laboratory.
2.2. Visual Identification
A Nikon SMZ745T stereomicroscope (×20 magnification), with analysis software (Infinity Analyze v.6.5.6), was used to photograph and measure individual particles. The selection of particles was made following standard protocols developed at the Norwegian Institute for Water Research (NIVA), which are mirrored in the peer-reviewed literature [36]. Visual analysis was performed, in which potential plastics were isolated, photographed, described in terms of morphology and colour, and measured along the longest length (μm). Due to limitations of the microscope, and the size of the smallest sieve that was used for volume reduction, the lower detection limit of the particles was 30 µm.
2.3. Chemical Characterization with u-FTIR
Visual identification of microplastics should always be supported by chemical analysis [21], and μ-FTIR confirmation was performed on all extracted particles. This exceeds the recommendation for reporting under the European Union’s Marine Strategy Framework Directive (MSFD), where it is recommended that a proportion (5–10%) of all samples should be routinely checked, to confirm the accuracy of visual examination [37].
A PerkinElmer Spotlight 400 μ-FTIR spectrometer was used for chemical characterization. To improve the quality of the spectra generated, particles were prepared for analysis using a diamond compression cell (DCC) accessory. Particles were carefully transferred from glass microfiber filter papers to the DCC, with use of extra fine microforceps. The DCC compresses the particles to a thin, homogenous thickness. Subsequently, the DCC was loaded onto the μ-FTIR microscope stage for analysis. Measurements were obtained in transmission mode, and at 4 cm−1 spectral resolution, for the range 4000 to 600 cm−1. Spectra were produced from a composite of two co-scans. Background measurements were taken before each batch of particles was analyzed.
Library matching was performed in the Spectrum 10 software (v. 10.6.2). Each spectrum was compared to several different libraries available at NIVA: PerkinElmer ATR Polymers library, ST Japan Polymers ATR library, and BASEMAN library [38], and several in-house libraries, including reference polymers, different textile materials, and potential sources of laboratory contamination. All spectra were manually inspected to ensure that the library matches were acceptable. If the polymer type of a particle could not be confirmed (low intensity peaks, small particle size), but the spectra showed characteristic peaks of synthetic plastic, it was included as ‘unknown synthetic polymer’.
3. Results and Discussion
3.1. Characterization of Wastewater
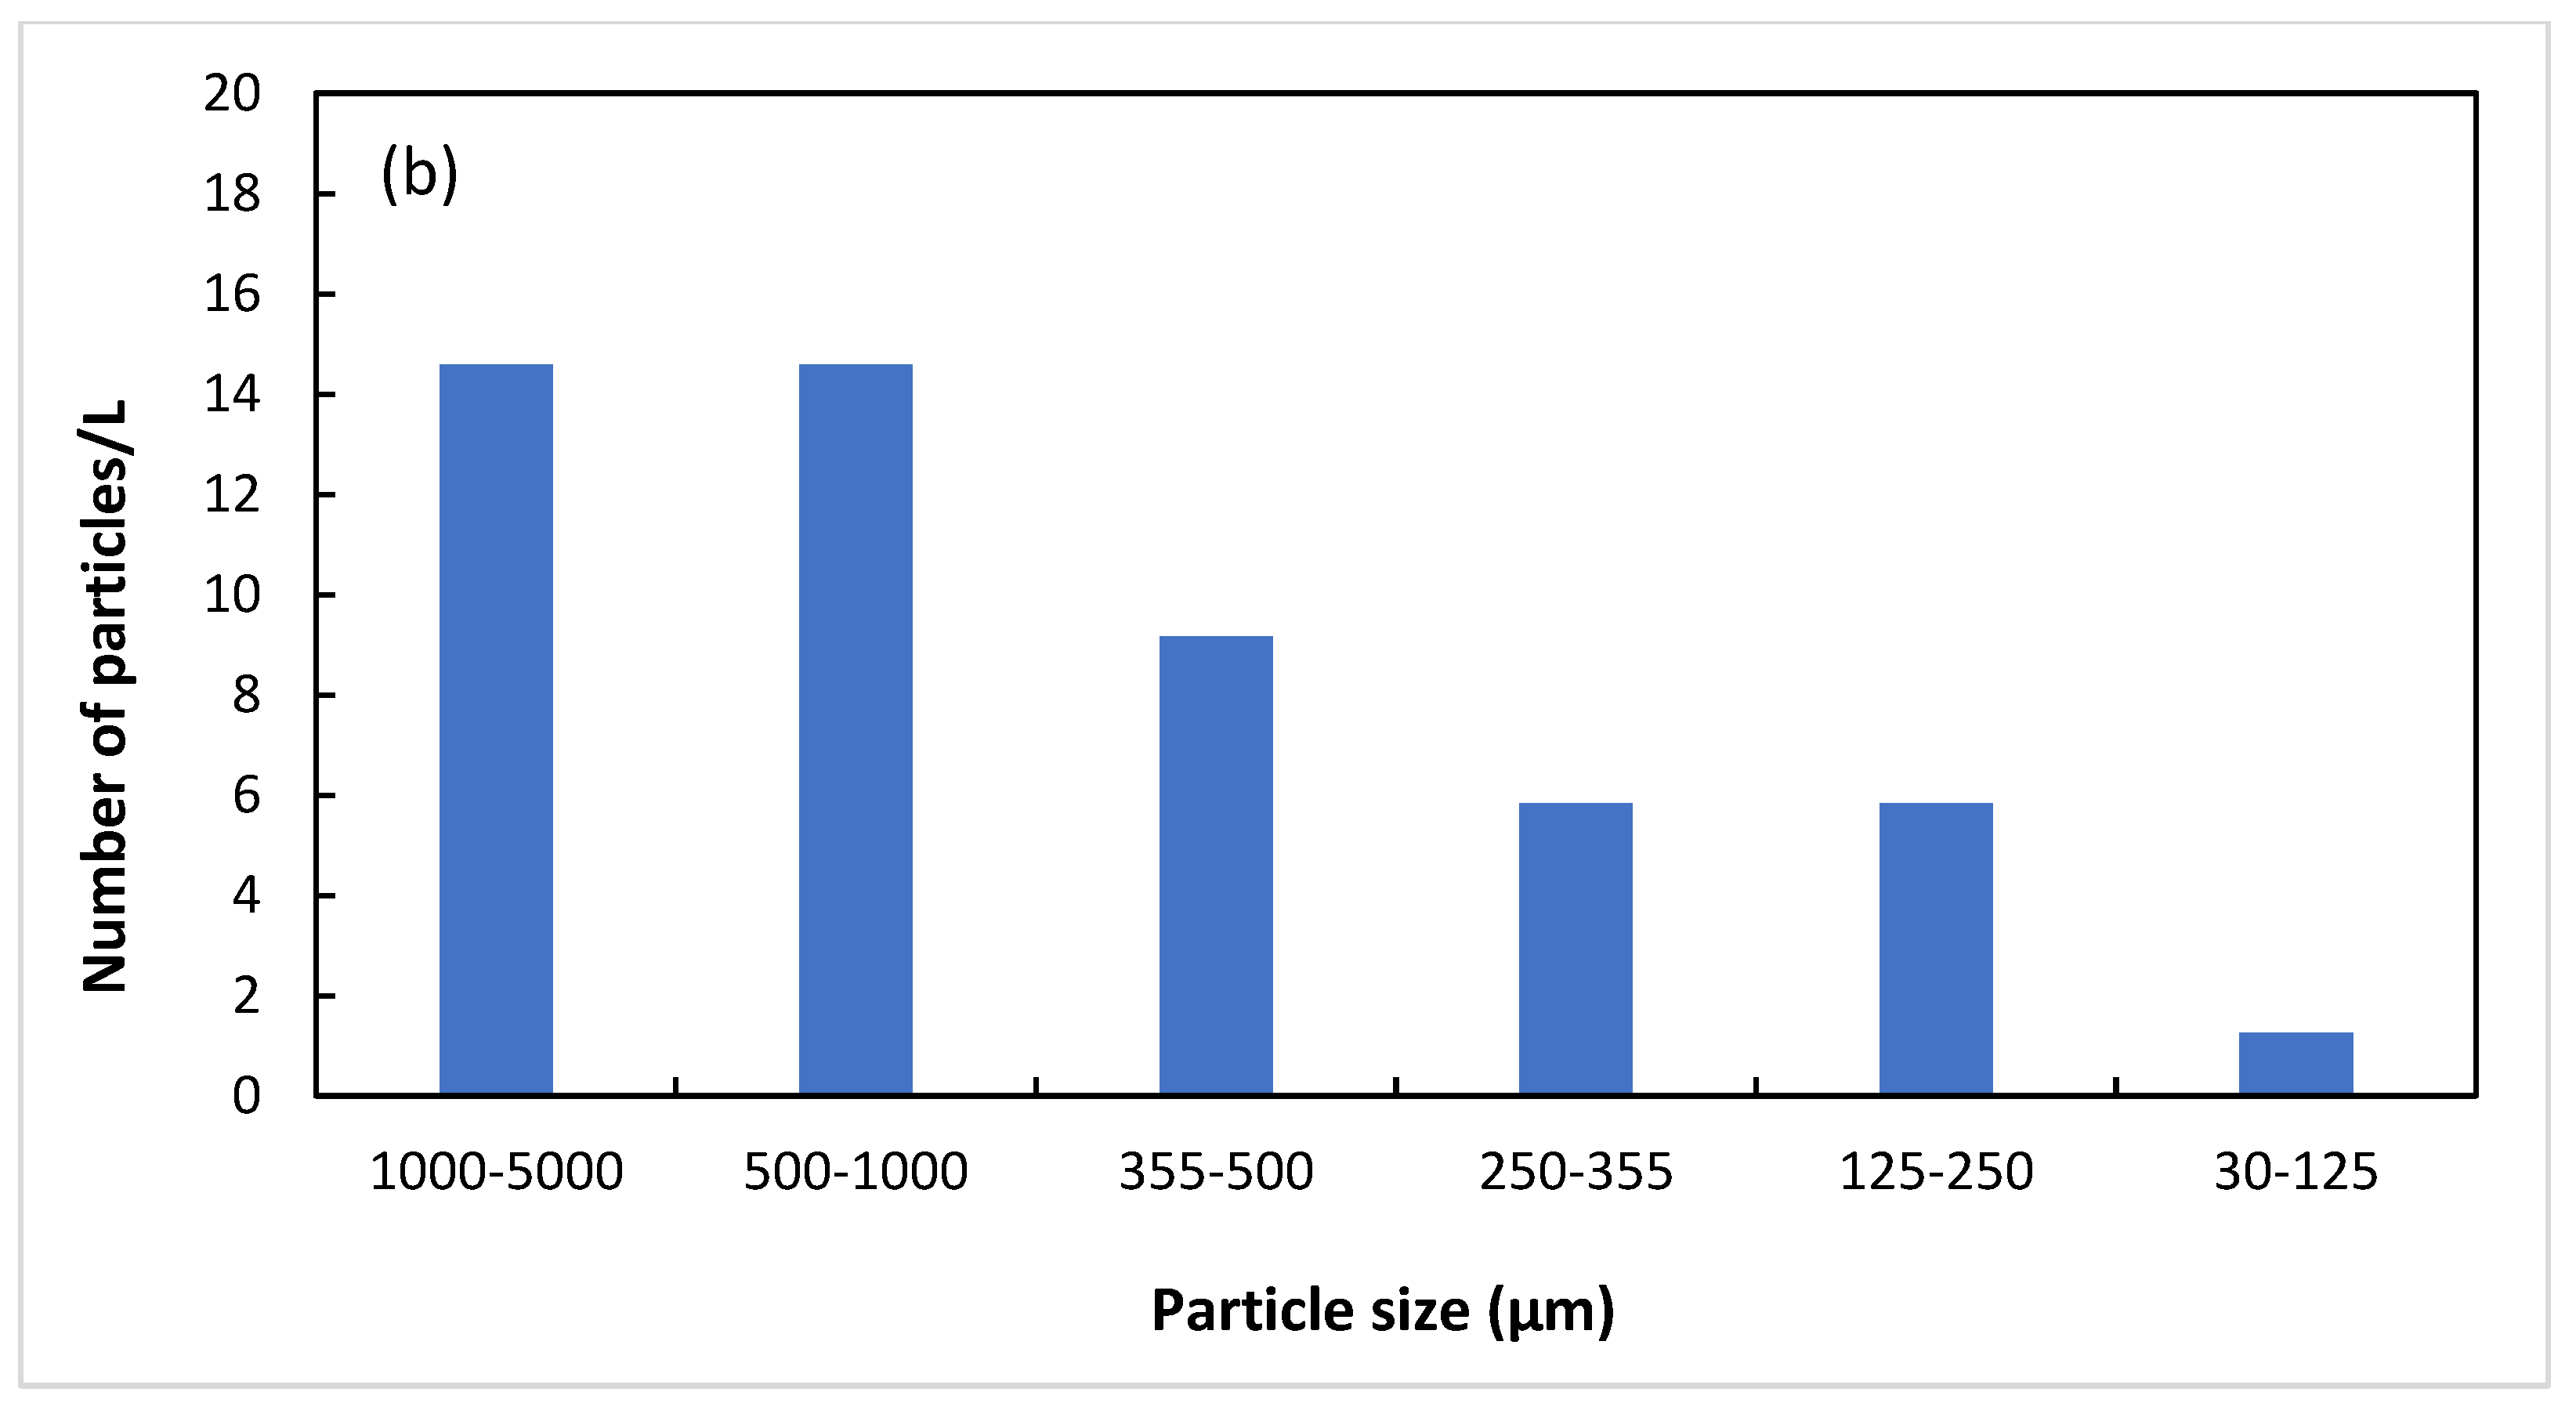
The wastewater quality, in terms of microplastic particle size, type of polymers, and shapes was characterized before and after treatment of wastewater samples. Laboratory control samples were also analyzed for microplastics and their characteristics. Here the terms “untreated” and “treated” were used for samples collected from the plastic recycling site. The “untreated sample” was the sample collected prior to any treatment, whereas the “treated sample” was collected after onsite sand filtration. The term “sandfilter(ed)” is used for the samples after the filtration step carried out at NIVA. The untreated and treated samples showed variation in terms of the number and size of the particles. For example, the untreated sample had a lower number of particles in the higher size fraction range (Figure 2a), whereas the treated sample had a higher number of particles in the higher size fraction range (Figure 2b). The total number of particles in the treated sample was lower (21 particles/L) compared with the untreated sample (27 particles/L). Hence, the filter operated at the recycling facility showed some reduction in MPs, although the reduction in microplastics was low. Notably, the size of particles and the type of polymers were different after treatment, demonstrating variations in the characteristics of MPs upon filtration. It is possible that the onsite sand-filter was contaminated with plastics and other contaminants, such as oil from surrounding areas of the facility, since surface water runoff also flows to the sand-filter. It was not investigated further due to confidentiality concerns. Briefly, the onsite sand-filter was likely to be contaminated, since it received multiple influent streams, as discussed in Section 3.2. Nonetheless, the purpose of this investigation was to investigate the removal of MPs using a laboratory-scale sand-filter, and therefore both untreated and untreated samples were subjected to filtration, using two sand-filter columns.
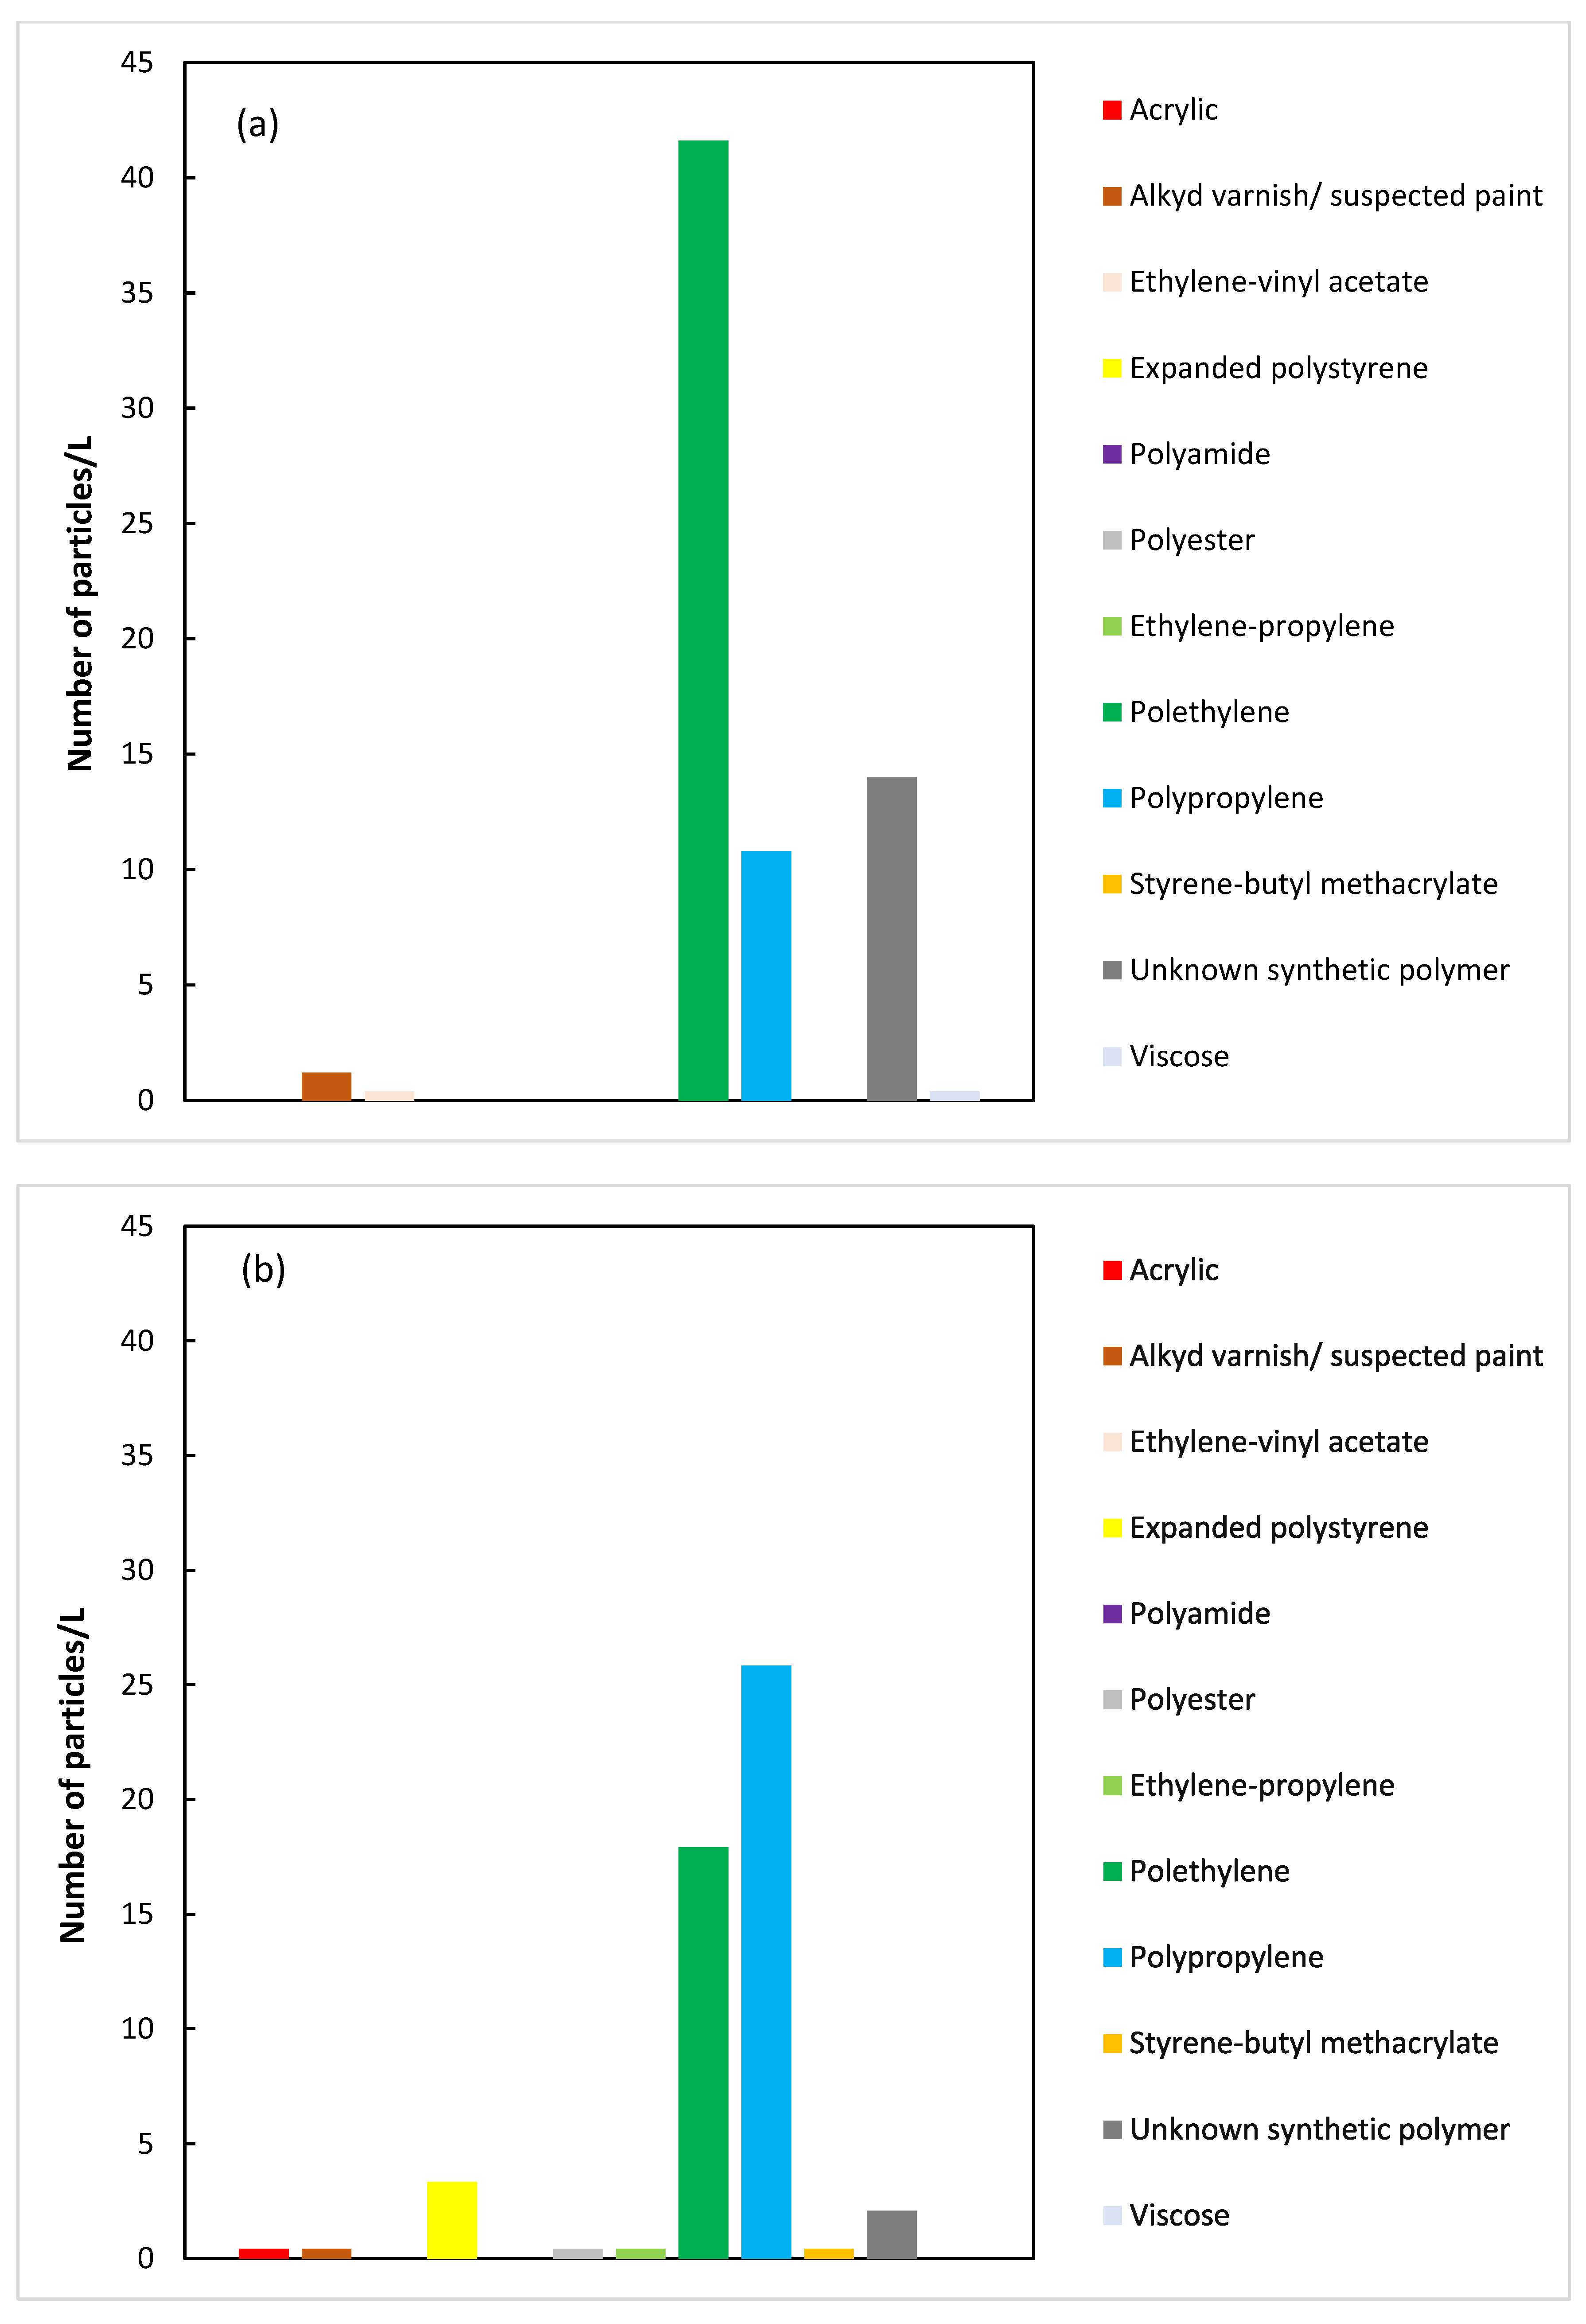
The types of polymers were also identified for both samples, i.e., treated and untreated. As indicated from the results (Figure 3a,b), the type of plastic material in relation to the number of particles was different for both the untreated and treated samples. A significantly higher number of polyethylene (PE) particles were found in the untreated sample compared with the treated one, whereas the number of polypropylene (PP) particles was much higher in the treated sample (Figure 3b). This observation is consistent with other results of this study, where the number of certain MP fractions (such as fragments) was higher in the onsite treated wastewater sample than the untreated sample, as discussed in Section 3.2. However, the concentration of unknown synthetic particles was higher in the untreated sample compared with the treated sample. As seen in Figure 3a,b, the majority of the microplastic particles were PE and PP. Although the composition and size of microplastics present in wastewater is dependent on the origin and type of plastics, and other environmental factors, the results of this study are in good agreement with the findings of Wolff et al. [23]. The authors reported that the majority of the microplastic particles in effluent of two different WWTPs were PE and PP. However, the polymer sizes they found were different to the findings of this study, since they reported that most of the polymers consisted of particles < 100 µm. Another study looked at the concentration of MPs in water from three plastic manufacturing facilities that recycle different types of plastic waste, including electronic plastic waste (EPW), polyethylene terephthalate bottle waste (PBW), and household plastic waste (HPW) [39]. As anticipated, the effluent samples showed variations depending on the type of plastic waste being recycled. For example, the effluent samples from EPW predominantly consisted of polystyrene (PS) (70–89%), whereas the majority of the polymers in PBE effluent were PET (64–67%), followed by PE (16–13%). The samples collected from HPW mainly consisted of PP (65–66%) and PP/PE (17–21%). Although these variations are predominantly related to the type of plastics being recycled, Koelmans [40] noted that it is difficult to draw conclusions by comparing different studies, because of differences in the analytical methodologies applied.
3.2. Sand Filtration
The laboratory-scale sand-filter was highly efficient in the removal of all size fractions, from both types of wastewater samples (Table 1). The number of particles shown in Table 1 is the total number of particles in ~2.5 L of water samples, implying that the number of particles in 1 L was ˂ 1 in most cases. The sand-filter removed up to 100% of the MPs, with a few exceptions. The reduction in the treated sample (onsite filtered) was 86–100%, except for particle sizes ranging from 125–250 µm, in which case the removal was low (~49%). It is worth noting that the total number of particles in this range was low, with an average of ~6 particles/L. Considering the complete removal of the similar size fraction in the untreated sample, containing a greater number of particles (~17 particles/L), the lower removal observed for the treated sample (onsite filtered) could be considered an outlier, due to potential error in counting and/or identification of the particles due to heterogeneity of the samples. Additionally, the number of particles after treatment was not very high considering the number of particles in the blanks. Counting could lead to differences between the samples. Additionally, the plastic particles are not evenly distributed in environmental samples such as water and wastewater.
A recent investigation demonstrated that the removal of MPs differed for different types of polymers [41]. The authors investigated five polymer types, including low density polyethylene (PELD), high density polyethylene (PEHD), PP, polyamide 6 (PA6), and polyethylene terephthalate (PET) in different effluent streams. They noted that the removal of PA6 and PED was higher compared with PELD, PEHD, and PP, which was attributed to stochastic distribution instead of selectivity by the sand-filter. Hence, it was not considered an indication of the performance of the sand-filter. On average, the removal of MPs by sand filtration was 82%, which is lower than reported in this investigation. The removal efficiencies vary among different studies. For example, Talvitie et al. [3] reported 97% removal of MPs, whereas Wolff et al., [23] achieved even higher removal i.e., 99.2–99.9%. Others, however, have reported much lower (79.01%) removal by sand filtration [42]. An even lower overall reduction in MPs was reported in another study [28]. It should, however, be noted that the MPs were identified by visual inspection, using a stereomicroscope [28]. These differences could be attributed to the performance of the sand-filter, which depends on the type and particle size of the sand, the flow rate, the characteristics of the influent, as well as the initial MP concentration and types of polymers. Additionally, the wastewater samples used by Bayo et al. [42] were rich in fibers, which could be difficult to remove completely by sand filtration, since fibers can pass longitudinally through the sand-filter. In fact, the authors reported a much lower reduction in fibers (53.83%) compared with other fractions such as MP particles (95.53%). Moreover, the difference in the protocols for analysis of MPs could also explain the differences, making a direct comparison between studies difficult, demonstrating the need for a standard ISO-method.
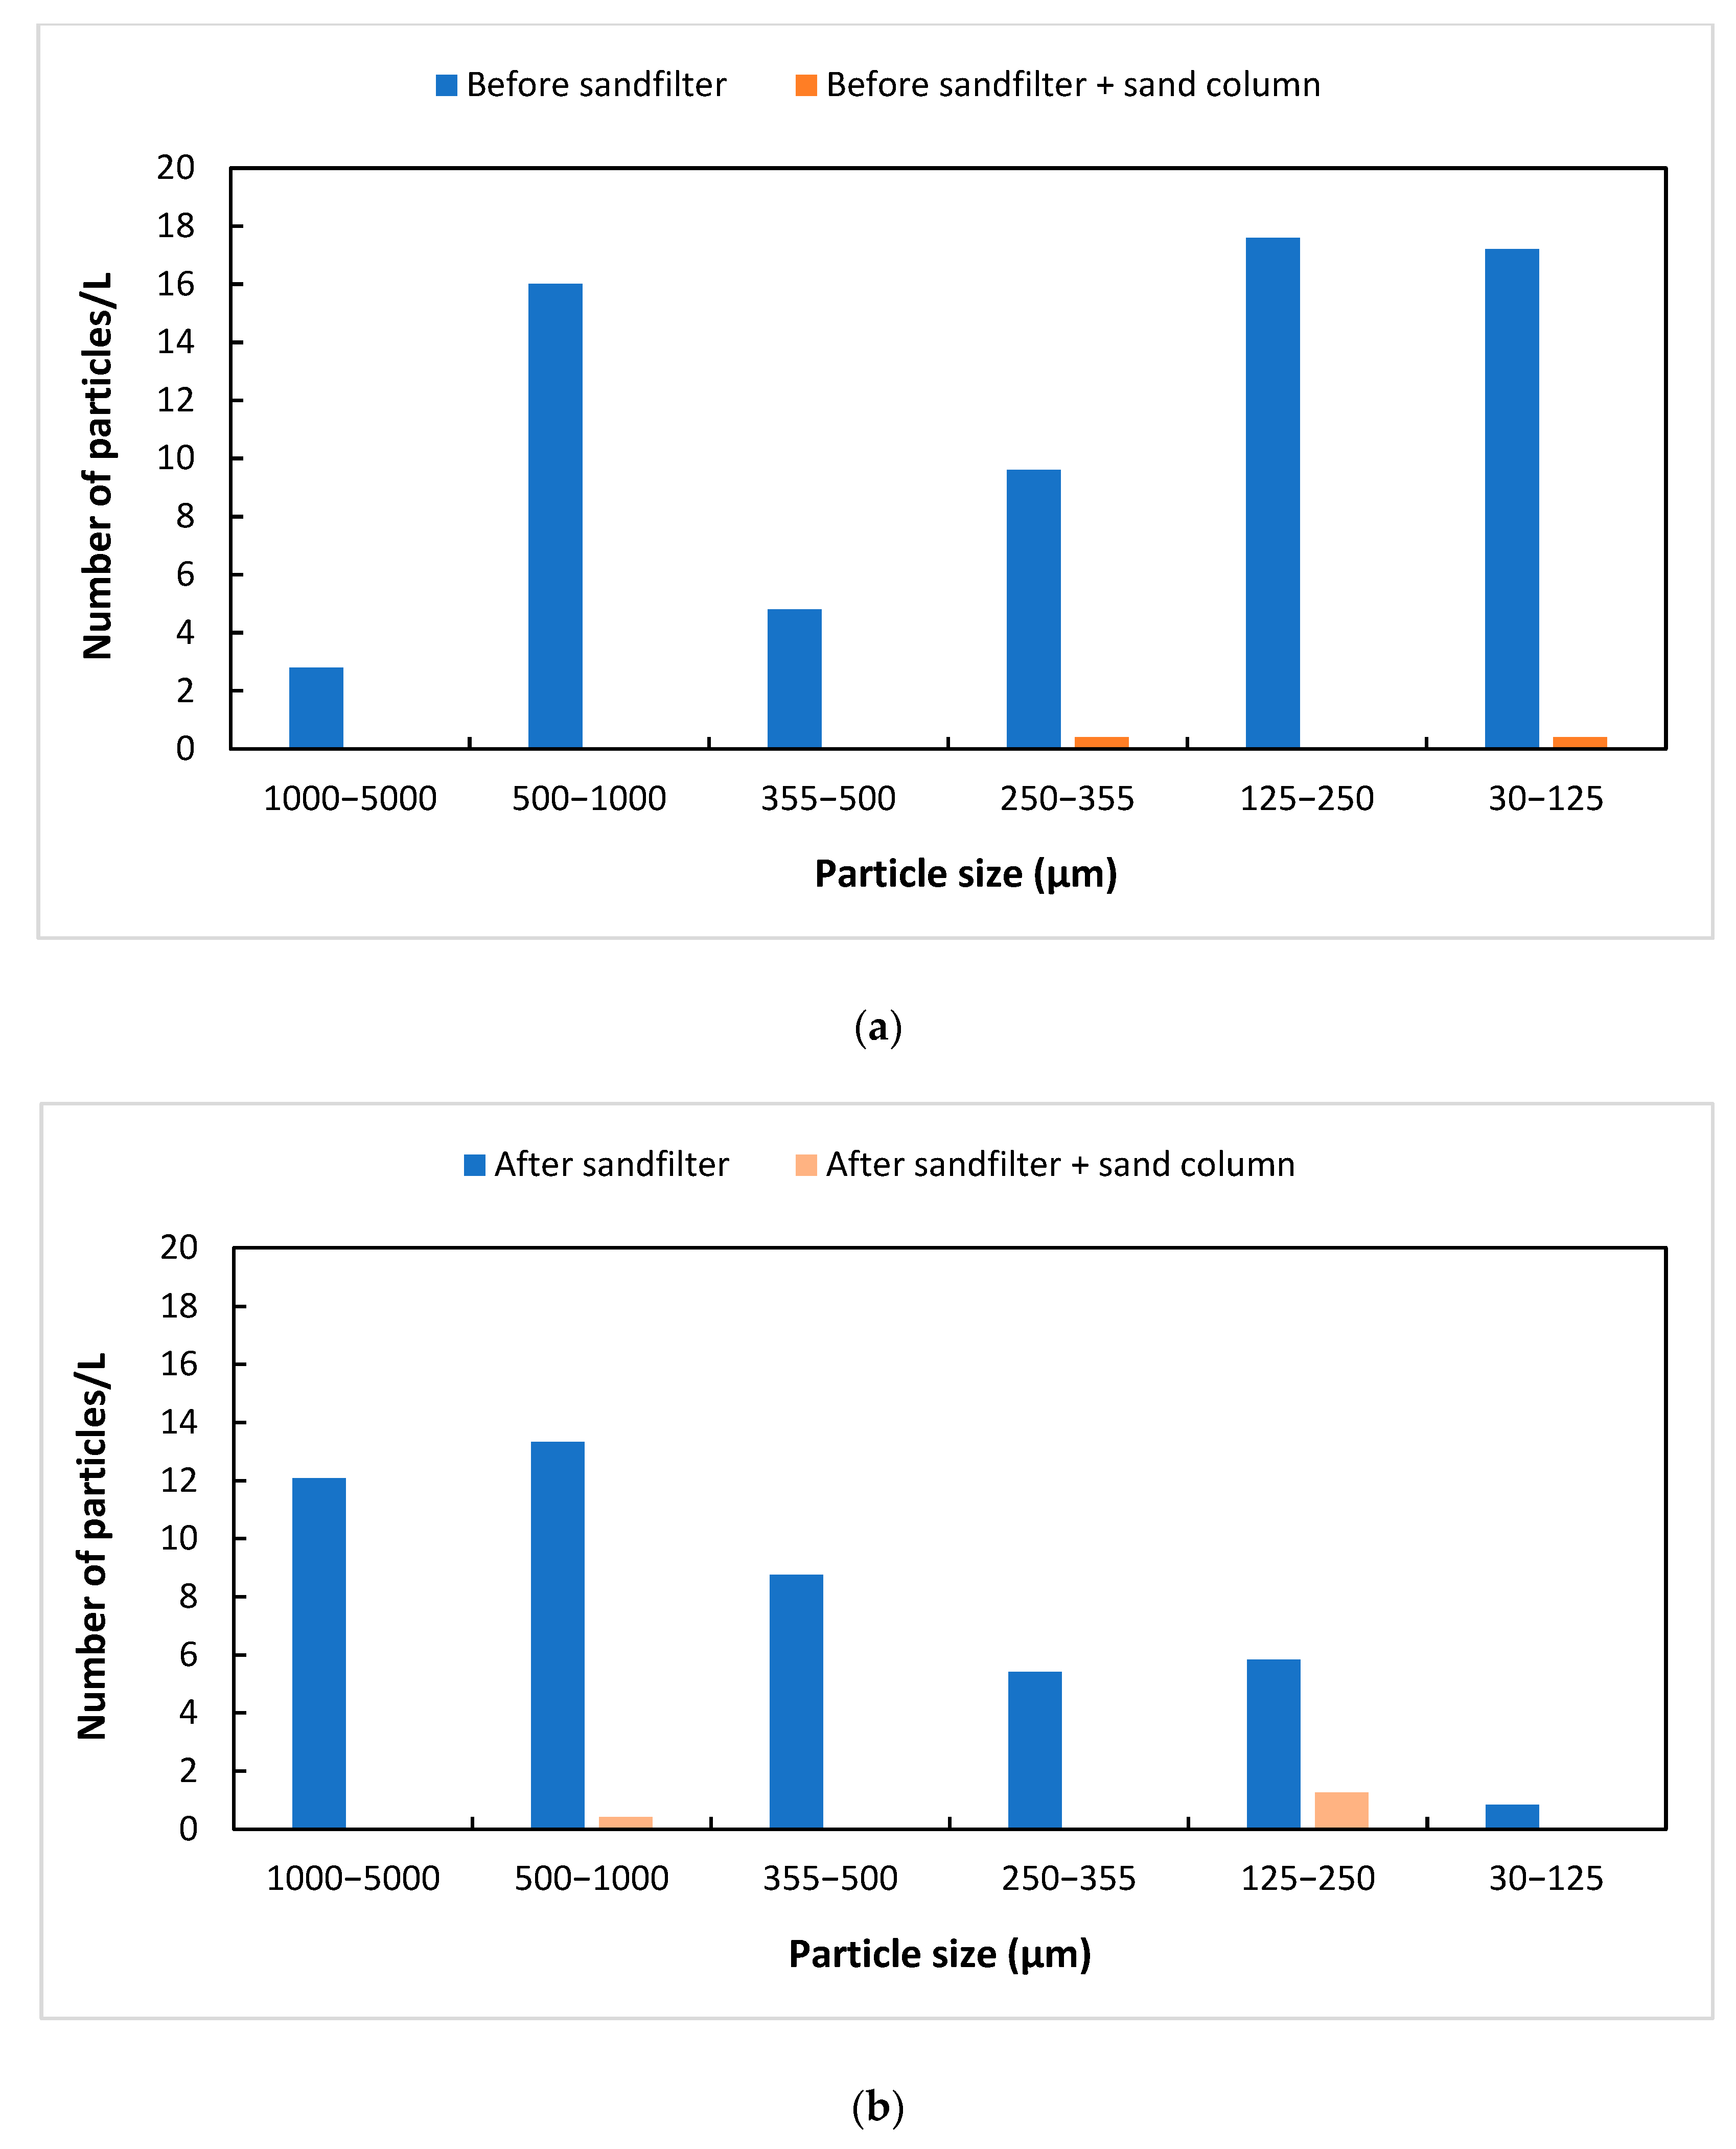
Microplastics in wastewater samples were further classified into fibers (Table 2), fragments (Table 3), and beads (results not shown since only one particle was found in the 125–250 µm range). Although not many fibers were present in the studied wastewater, the removal of fibers could be low, as mentioned above. Almost complete removal of fragments greater than 500 µm was achieved, which corroborates the finding of a very recent study carried out by Wolff et al. [23], where the authors reported similar findings for MP particles. An almost complete removal of fragments, up to the detection limit of 30 µm, was reported in this study, whereas Wolff et al. [23] noted that sand-filtered effluent primarily consisted of particles in the range of 10–50 µm, followed by those ˂ 100–50 µm and ˂ 500–100 µm. Since, the detection limit in this study was 30 µm instead of 10 µm, it is difficult to directly compare these findings. It is, however, evident that the sand-filter was effective in almost complete removal of fragments up to 30 µm (Table 3). Similar to the trend found for the total number of particles, a difference in the types of microplastic particles was noted between untreated and treated samples (Figure 4). For example, the untreated sample (Figure 4a) had a lower concentration of fragments in the largest size range, compared with the treated sample (Figure 4b). Similarly, most of the fragments present in the treated wastewater consisted of particles in the higher size range. This trend was expected, since most of the microplastic particles found were fragments. The number of fragments in the onsite sand-filtered (treated) sample was higher than the untreated sample (Table 3), which is attributed to several factors. In addition to receiving wastewater from the plastic recycling facility, the onsite sand-filter received input from surface run-off. The surface run-off is expected to be contaminated with microplastics, due to outdoor plastic storage, oil from the oil separator, soil, and other debris from industrial premises. It is also worth mentioning that the color of the effluent, after onsite sand filtration, was much darker compared with wastewater before sand filtration. There was a significant improvement in color after the laboratory-scale sand filtration. This observation further strengthens the notion that both the storage and handling of plastics, as well as other contaminants, were very likely washed out in the sand-filter. Since this onsite sand-filter was designed and operated by the facility, the observation was communicated for potential corrective actions, including establishing an indoor storage area. Nonetheless, the purpose of this study was to investigate the performance of the newly developed and operated onsite sand-filter from the perspective of the potential need for improvements, considering the findings of this study.
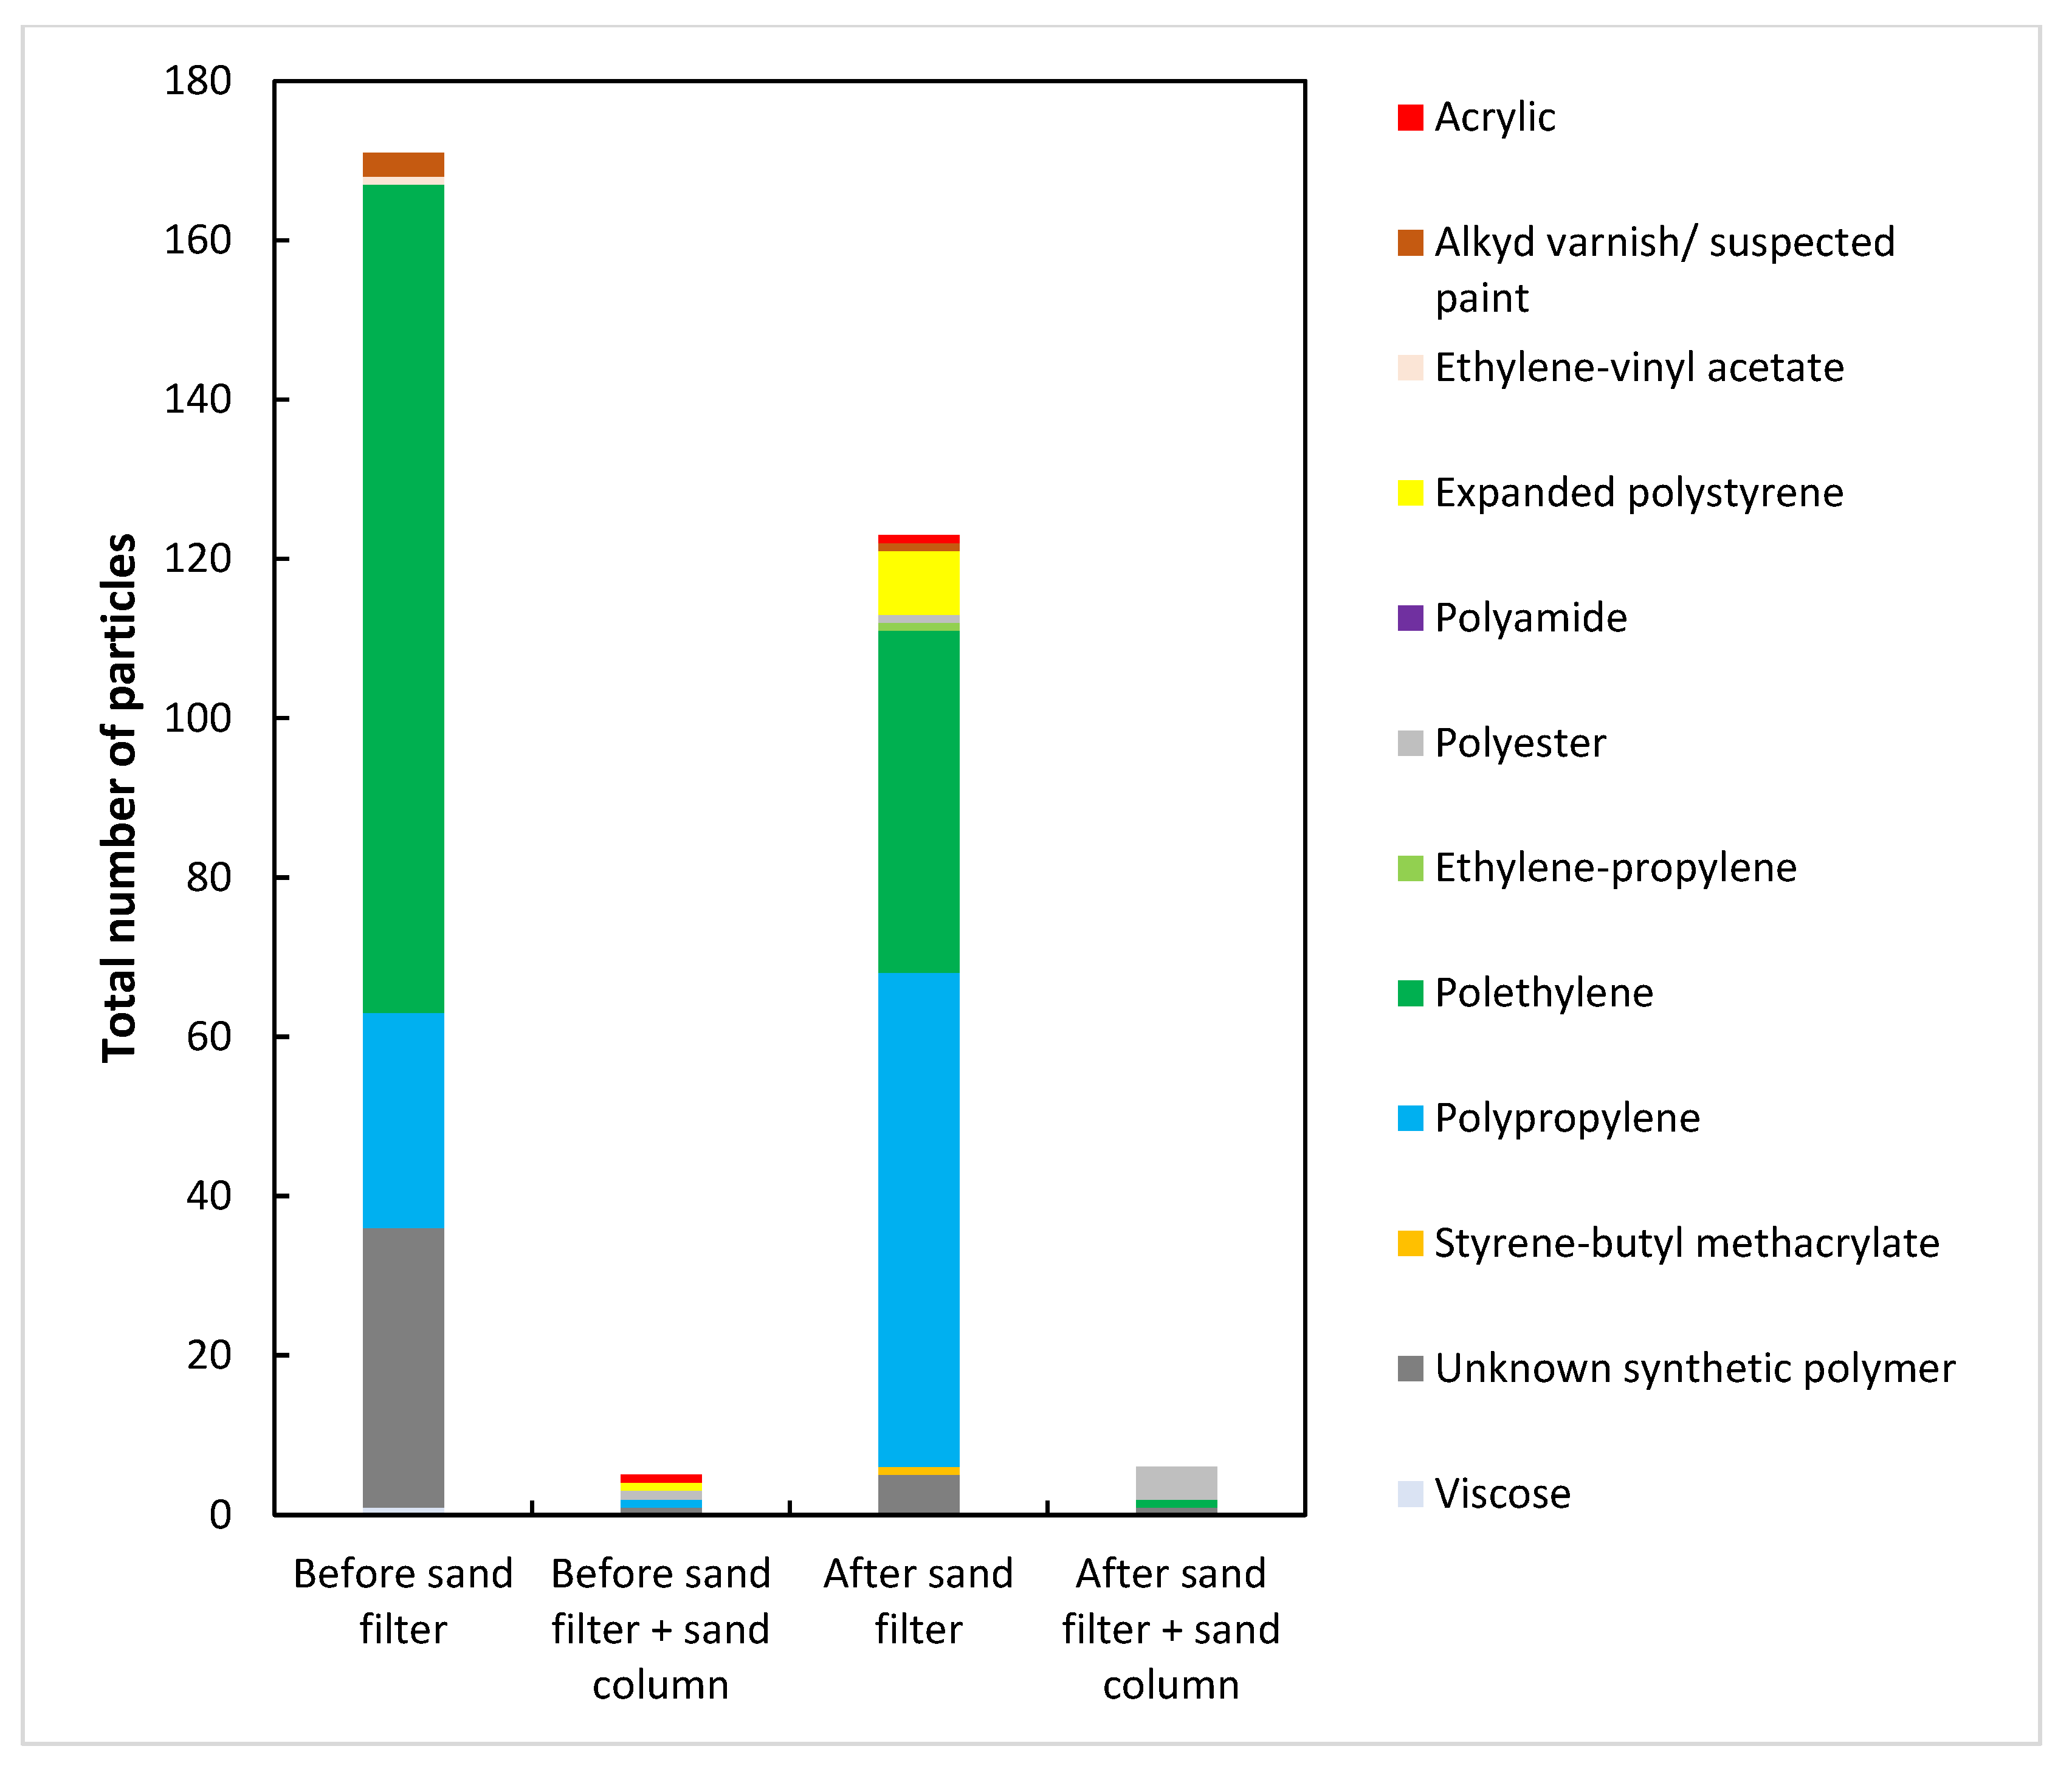
The distribution of different polymers in both samples, before and after the sand-filter, is shown in Figure 5. As seen in Figure 5, PE and PP were the main microplastics present in the wastewater samples. A decrease in all MP fractions was observed after filtration using the laboratory-scale sand-filter.
3.3. Backwashing of Sand-Filter Column
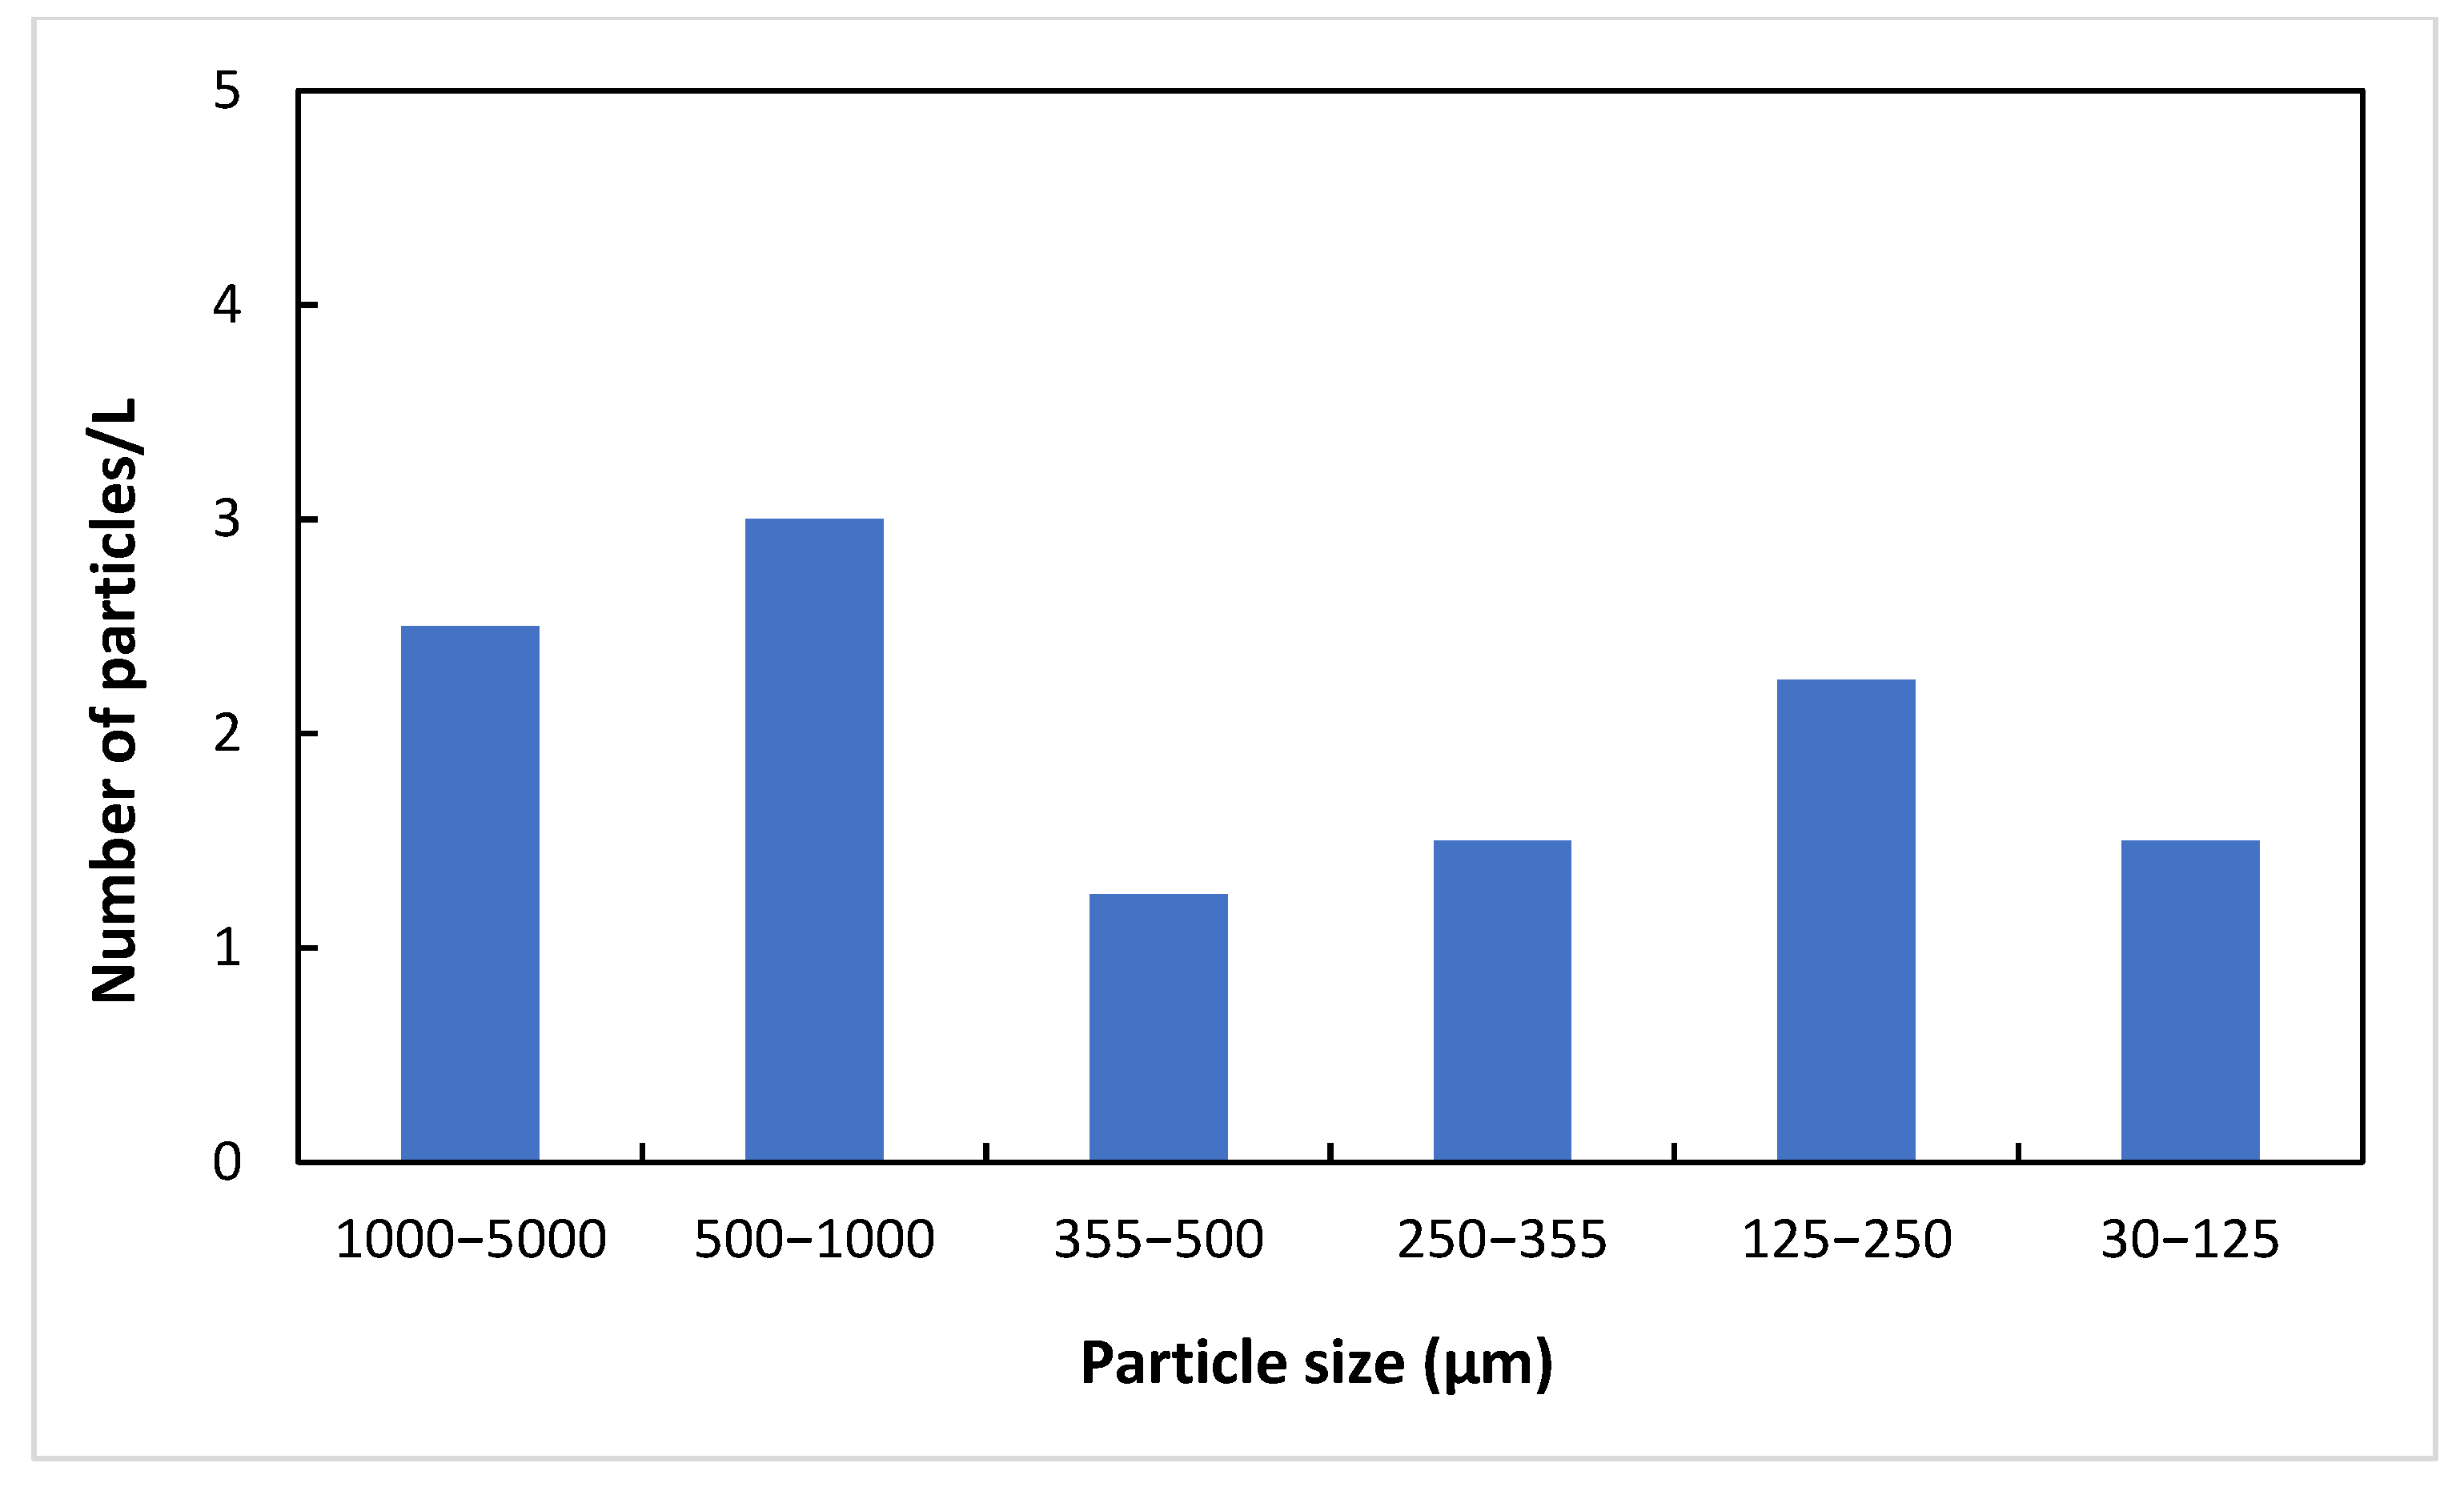
Backwash water was collected and analyzed during laboratory-scale sand filtration of the onsite treated samples. The composition of the microplastics is given in Figure 6, which is similar to the feed water, with larger size fractions as the main MP particles. The majority of the particles in the backwash water were fragments, which is consistent with the wastewater composition. However, the backwash water was collected only once, as the objective was not to investigate the composition of the backwash water in detail, due to the inadequate volume of the influent wastewater sample. The composition of the backwash water, and the frequency of backwashing, depends on the quality of the water matrix, both in terms of MPs and other constituents such as organics and suspended solids, as well as the desired removal of microplastics. In addition, the backwash water must be treated prior to discharge, considering it would contain a very high concentration of microplastics. Several questions related to the frequency of backwash, considering the quality of influent water, desired microplastics removal, and the treatment of the backwash water remain unaddressed during sand filtration for microplastics removal. Considering sand filtration as one of the well-developed processes used in water and wastewater treatment, experiences from the removal of other contaminants could be useful when implementing a sand-filter for the removal of microplastics and backwash water treatment.
4. Significance of Microplastics Removal and Future Needs
The extensive use of plastics, in combination with poor management strategies, has led to their widespread presence in the environment, with urban water as one of the most important sources and sinks of different types of microplastic particles. The removal of microplastics from water and wastewater is therefore becoming an increasingly important area of focus, to avoid their negative impacts. This study has demonstrated the use of sand filtration as one of the most effective methods for the removal of microplastics present in wastewater collected from a plastic recycling facility. Considering sand-filters are economical to operate, and are in many cases already part of the treatment process, mainly as a tertiary step, the technology offers a practical viable solution for the removal of microplastics. It is therefore important to investigate the process efficiency, especially for water and wastewater matrices containing high concentrations of microplastics. The desired removal of microplastics might necessitate making operational and design changes in already installed sand-filters, that are traditionally designed for the removal of micropollutants and microorganisms. There is currently a lack of knowledge on several aspects, including the long-term efficiency of sand-filters for the removal of microplastics, frequency of backwash, and sand replacement. Addressing these knowledge gaps is critical for large-scale applications. Many municipal and industrial facilities have been upgrading the treatment processes with an additional tertiary step, and there will be a greater need for that in the future, for the removal of conventional and emerging contaminants. Industrial uptake of a tertiary treatment step is largely dependent on the process and cost efficiency, and the potential of sand filtration for the removal of microplastics could be greater than many other more expensive and technologically complex processes, such as those based on membrane filtration.
5. Conclusions
A significant difference in the type and size of microplastic particles was found between samples before and after sand filtration of wastewater collected from a plastic recycling facility. Fragments were the most predominant type of microplastic particles in both samples, whereas most of the polymers were polyethylene and polypropylene. Treatment employed by the plastic recycling facility appears to remove some of the particles, but the size of particles found after onsite sand filtration was different from the untreated sample. A laboratory-scale sand-filter was highly efficient in removing all types and sizes of microplastic particles, from both wastewater samples, i.e., untreated and the facility’s sand-filtered samples. Very few particles were found in the wastewater filtered using the laboratory-scale sand-filter, and a significant improvement in color was also observed. This study demonstrates the effectiveness of a correctly designed sand-filter for the removal of a wide range of microplastic particles from wastewater. However, there is a need to look at the removal of other contaminants, especially micropollutants, since their removal is one of the primary objectives of tertiary treatment. The final filtration step (sand-filter or other filtration processes) should therefore be optimized for both the removal of microplastics, and other contaminants of concern, including micropollutants. This study emphasizes the need to quantify microplastics in industrial wastewater, and identify their sources, for designing appropriate technologies for their removal.
Author Contributions
M.U. designed the sand filtration set up, planned and conducted the filtration experiments and wrote the manuscript. C.S.-L. conducted the analysis of microplastics, data analysis, and proofread the manuscript. S.B.R. assisted in collaboration with sample collection, project management, and proofreading the manuscript. All authors have read and agreed to the published version of the manuscript.
Funding
This work was part of the PacKnoPlast project (#299326). We would like to thank the funding from The Research Council of Norway, Bama, and the project partners.
Institutional Review Board Statement
Not applicable.
Informed Consent Statement
Not applicable.
Data Availability Statement
The data presented in this study are available upon request from the corresponding author or the first author.
Acknowledgments
We thank the plastic recycling industry for the provision of wastewater samples. We also thank Nina Buenaventura and Bert van Bavel at the Norwegian Institute for Water Research for their useful discussions related to the analysis of microplastics.
Conflicts of Interest
The authors declare no conflict of interest.
References
- GESAMP. Sources, Fate and Effects of Microplastics in the Marine Environment: A Global Assessment; IMO/FAO/UNESCOIOC/ UNIDO/WMO/IAEA/UN/UNEP/UNDP Joint Group of Experts on the Scientific Aspects of Marine Environmental Protection: London, UK, 2015. [Google Scholar]
- Chang, M. Reducing microplastics from facial exfoliating cleansers in wastewater through treatment versus consumer product decisions. Mar. Pollut. Bull. 2015, 101, 330–333. [Google Scholar] [CrossRef] [PubMed]
- Talvitie, J.; Mikola, A.; Koistinen, A.; Setälä, O. Solutions to microplastic pollution—Removal of microplastics from wastewater effluent with advanced wastewater treatment technologies. Water Res. 2017, 123, 401–407. [Google Scholar] [CrossRef] [PubMed] [Green Version]
- Lusher, A.L.; Welden, N.A.; Sobral, P.; Cole, M. Sampling, isolating and identifying microplastics ingested by fish and invertebrates. Anal. Methods 2017, 9, 1346–1360. [Google Scholar] [CrossRef] [Green Version]
- Ni, B.-J.; Thomas, K.V.; Kim, E.-J. Microplastics and nanoplastics in urban waters. Water Res. 2023, 229, 119473. [Google Scholar] [CrossRef] [PubMed]
- de Sá, L.C.; Oliveira, M.; Ribeiro, F.; Rocha, T.L.; Futter, M.N. Studies of the effects of microplastics on aquatic organisms: What do we know and where should we focus our efforts in the future? Sci. Total Environ. 2018, 645, 1029–1039. [Google Scholar] [CrossRef]
- Triebskorn, R.; Braunbeck, T.; Grummt, T.; Hanslik, L.; Huppertsberg, S.; Jekel, M.; Knepper, T.P.; Krais, S.; Müller, Y.K.; Pittroff, M.; et al. Relevance of nano- and microplastics for freshwater ecosystems: A critical review. TrAC Trends Anal. Chem. 2019, 110, 375–392. [Google Scholar] [CrossRef]
- Rios, L.M.; Jones, P.R.; Moore, C.; Narayan, U.V. Quantitation of persistent organic pollutants adsorbed on plastic debris from the Northern Pacific Gyre’s “eastern garbage patch”. J. Environ. Monit. 2010, 12, 2226–2236. [Google Scholar] [CrossRef]
- Chua, E.M.; Shimeta, J.; Nugegoda, D.; Morrison, P.D.; Clarke, B.O. Assimilation of Polybrominated Diphenyl Ethers from Microplastics by the Marine Amphipod, Allorchestes Compressa. Environ. Sci. Technol. 2014, 48, 8127–8134. [Google Scholar] [CrossRef]
- Rochman, C.M.; Hentschel, B.T.; Teh, S.J. Long-Term Sorption of Metals Is Similar among Plastic Types: Implications for Plastic Debris in Aquatic Environments. PloS One 2014, 9, e85433. [Google Scholar] [CrossRef] [Green Version]
- Wang, F.; Wong, C.S.; Chen, D.; Lu, X.; Wang, F.; Zeng, E.Y. Interaction of toxic chemicals with microplastics: A critical review. Water Res. 2018, 139, 208–219. [Google Scholar] [CrossRef]
- Browne, M.A.; Niven, S.J.; Galloway, T.S.; Rowland, S.J.; Thompson, R.C. Microplastic Moves Pollutants and Additives to Worms, Reducing Functions Linked to Health and Biodiversity. Curr. Biol. 2013, 23, 2388–2392. [Google Scholar] [CrossRef] [Green Version]
- Rochman, C.M.; Tahir, A.; Williams, S.L.; Baxa, D.V.; Lam, R.; Miller, J.T.; Teh, F.-C.; Werorilangi, S.; Teh, S.J. Anthropogenic debris in seafood: Plastic debris and fibers from textiles in fish and bivalves sold for human consumption. Sci. Rep. 2015, 5, 14340. [Google Scholar] [CrossRef] [Green Version]
- Schirinzi, G.F.; Pérez-Pomeda, I.; Sanchís, J.; Rossini, C.; Farré, M.; Barceló, D. Cytotoxic effects of commonly used nanomaterials and microplastics on cerebral and epithelial human cells. Environ. Res. 2017, 159, 579–587. [Google Scholar] [CrossRef]
- Park, D.; Kim, D.; Lim, H.J.; Park, C.; Chua, B.; Lee, J.W.; Yoon, Y.; Son, A. Chia seed-assisted separation and detection of polyvinyl chloride microplastics in water via gas chromatography mass spectrometry. Chemosphere 2021, 273, 129599. [Google Scholar] [CrossRef]
- Gomiero, A.; Øysæd, K.B.; Agustsson, T.; van Hoytema, N.; van Thiel, T.; Grati, F. First record of characterization, concentration and distribution of microplastics in coastal sediments of an urban fjord in south west Norway using a thermal degradation method. Chemosphere 2019, 227, 705–714. [Google Scholar] [CrossRef]
- Kirstein, I.V.; Hensel, F.; Gomiero, A.; Iordachescu, L.; Vianello, A.; Wittgren, H.B.; Vollertsen, J. Drinking plastics?–Quantification and qualification of microplastics in drinking water distribution systems by µFTIR and Py-GCMS. Water Res. 2021, 188, 116519. [Google Scholar] [CrossRef]
- Funck, M.; Al-Azzawi, M.S.M.; Yildirim, A.; Knoop, O.; Schmidt, T.C.; Drewes, J.E.; Tuerk, J. Release of microplastic particles to the aquatic environment via wastewater treatment plants: The impact of sand filters as tertiary treatment. Chem. Eng. J. 2021, 426, 130933. [Google Scholar] [CrossRef]
- Al-Azzawi, M.S.M.; Funck, M.; Kunaschk, M.; der Esch, E.V.; Jacob, O.; Freier, K.P.; Schmidt, T.C.; Elsner, M.; Ivleva, N.P.; Tuerk, J.; et al. Microplastic sampling from wastewater treatment plant effluents: Best-practices and synergies between thermoanalytical and spectroscopic analysis. Water Res. 2022, 219, 118549. [Google Scholar] [CrossRef]
- Pedrotti, M.L.; Petit, S.; Eyheraguibel, B.; Kerros, M.E.; Elineau, A.; Ghiglione, J.F.; Loret, J.F.; Rostan, A.; Gorsky, G. Pollution by anthropogenic microfibers in North-West Mediterranean Sea and efficiency of microfiber removal by a wastewater treatment plant. Sci. Total Environ. 2021, 758, 144195. [Google Scholar] [CrossRef]
- Pirc, U.; Vidmar, M.; Mozer, A.; Kržan, A. Emissions of microplastic fibers from microfiber fleece during domestic washing. Environ. Sci. Pollut. Res. 2016, 23, 22206–22211. [Google Scholar] [CrossRef] [Green Version]
- Wolff, S.; Kerpen, J.; Prediger, J.; Barkmann, L.; Müller, L. Determination of the microplastics emission in the effluent of a municipal waste water treatment plant using Raman microspectroscopy. Water Res. X 2019, 2, 100014. [Google Scholar] [CrossRef] [PubMed]
- Wolff, S.; Weber, F.; Kerpen, J.; Winklhofer, M.; Engelhart, M.; Barkmann, L. Elimination of Microplastics by Downstream Sand Filters in Wastewater Treatment. Water 2021, 13, 33. [Google Scholar] [CrossRef]
- Hyeon, Y.; Kim, S.; Ok, E.; Park, C. A fluid imaging flow cytometry for rapid characterization and realistic evaluation of microplastic fiber transport in ceramic membranes for laundry wastewater treatment. Chem. Eng. J. 2023, 454, 140028. [Google Scholar] [CrossRef]
- Wang, C.; O’Connor, D.; Wang, L.; Wu, W.-M.; Luo, J.; Hou, D. Microplastics in urban runoff: Global occurrence and fate. Water Res. 2022, 225, 119129. [Google Scholar] [CrossRef]
- Vega-Herrera, A.; Llorca, M.; Borrell-Diaz, X.; Redondo-Hasselerharm, P.E.; Abad, E.; Villanueva, C.M.; Farré, M. Polymers of micro(nano) plastic in household tap water of the Barcelona Metropolitan Area. Water Res. 2022, 220, 118645. [Google Scholar] [CrossRef]
- Conley, K.; Clum, A.; Deepe, J.; Lane, H.; Beckingham, B. Wastewater treatment plants as a source of microplastics to an urban estuary: Removal efficiencies and loading per capita over one year. Water Res. X 2019, 3, 100030. [Google Scholar] [CrossRef]
- Hidayaturrahman, H.; Lee, T.-G. A study on characteristics of microplastic in wastewater of South Korea: Identification, quantification, and fate of microplastics during treatment process. Mar. Pollut. Bull. 2019, 146, 696–702. [Google Scholar] [CrossRef]
- Long, Z.; Pan, Z.; Wang, W.; Ren, J.; Yu, X.; Lin, L.; Lin, H.; Chen, H.; Jin, X. Microplastic abundance, characteristics, and removal in wastewater treatment plants in a coastal city of China. Water Res. 2019, 155, 255–265. [Google Scholar] [CrossRef]
- Lv, X.; Dong, Q.; Zuo, Z.; Liu, Y.; Huang, X.; Wu, W.-M. Microplastics in a municipal wastewater treatment plant: Fate, dynamic distribution, removal efficiencies, and control strategies. J. Clean. Prod. 2019, 225, 579–586. [Google Scholar] [CrossRef]
- Long, Z.; Wang, W.; Yu, X.; Lin, Z.; Chen, J. Heterogeneity and Contribution of Microplastics From Industrial and Domestic Sources in a Wastewater Treatment Plant in Xiamen, China. Front. Environ. Sci. 2021, 9, 770634. [Google Scholar] [CrossRef]
- Simon, M.; van Alst, N.; Vollertsen, J. Quantification of microplastic mass and removal rates at wastewater treatment plants applying Focal Plane Array (FPA)-based Fourier Transform Infrared (FT-IR) imaging. Water Res. 2018, 142, 1–9. [Google Scholar] [CrossRef]
- Bond, T.; Ferrandiz-Mas, V.; Felipe-Sotelo, M.; van Sebille, E. The occurrence and degradation of aquatic plastic litter based on polymer physicochemical properties: A review. Crit. Rev. Environ. Sci. Technol. 2018, 48, 685–722. [Google Scholar] [CrossRef]
- Mason, S.A.; Garneau, D.; Sutton, R.; Chu, Y.; Ehmann, K.; Barnes, J.; Fink, P.; Papazissimos, D.; Rogers, D.L. Microplastic pollution is widely detected in US municipal wastewater treatment plant effluent. Environ. Pollut. 2016, 218, 1045–1054. [Google Scholar] [CrossRef]
- Murphy, F.; Ewins, C.; Carbonnier, F.; Quinn, B. Wastewater Treatment Works (WwTW) as a Source of Microplastics in the Aquatic Environment. Environ. Sci. Technol. 2016, 50, 5800–5808. [Google Scholar] [CrossRef] [Green Version]
- Lusher, A.L.; Munno, K.; Hermabessiere, L.; Carr, S. Isolation and Extraction of Microplastics from Environmental Samples: An Evaluation of Practical Approaches and Recommendations for Further Harmonization. Appl. Spectrosc. 2020, 74, 1049–1065. [Google Scholar] [CrossRef]
- Gago, J.; Galgani, F.; Maes, T.; Thompson, R.C. Microplastics in Seawater: Recommendations from the Marine Strategy Framework Directive Implementation Process. Front. Mar. Sci. 2016, 3, 1049–1065. [Google Scholar] [CrossRef] [Green Version]
- Primpke, S.; Wirth, M.; Lorenz, C.; Gerdts, G. Reference database design for the automated analysis of microplastic samples based on Fourier transform infrared (FTIR) spectroscopy. Anal. Bioanal. Chem. 2018, 410, 5131–5141. [Google Scholar] [CrossRef] [Green Version]
- Suzuki, G.; Uchida, N.; Tuyen, L.H.; Tanaka, K.; Matsukami, H.; Kunisue, T.; Takahashi, S.; Viet, P.H.; Kuramochi, H.; Osako, M. Mechanical recycling of plastic waste as a point source of microplastic pollution. Environ. Pollut. 2022, 303, 119114. [Google Scholar] [CrossRef]
- Koelmans, A.A.; Mohamed Nor, N.H.; Hermsen, E.; Kooi, M.; Mintenig, S.M.; De France, J. Microplastics in freshwaters and drinking water: Critical review and assessment of data quality. Water Res. 2019, 155, 410–422. [Google Scholar] [CrossRef]
- Bitter, H.; Krause, L.; Kirchen, F.; Fundneider, T.; Lackner, S. Semi-crystalline microplastics in wastewater plant effluents and removal efficiencies of post-treatment filtration systems. Water Res. X 2022, 17, 100156. [Google Scholar] [CrossRef]
- Bayo, J.; López-Castellanos, J.; Olmos, S. Membrane bioreactor and rapid sand filtration for the removal of microplastics in an urban wastewater treatment plant. Mar. Pollut. Bull. 2020, 156, 111211. [Google Scholar] [CrossRef] [PubMed]
Figure 1.
Sand-filter column for laboratory-scale study.

Figure 2.
Concentration of microplastics in samples from plastics recycling facility: (a) untreated and (b) treated.
Figure 2.
Concentration of microplastics in samples from plastics recycling facility: (a) untreated and (b) treated.


Figure 3.
(a) Type and total concentration of microplastic particles in the untreated sample; (b) type and total concentration of microplastic particles in the treated sample.
Figure 3.
(a) Type and total concentration of microplastic particles in the untreated sample; (b) type and total concentration of microplastic particles in the treated sample.

Figure 4.
Concentration of synthetic fragments in untreated samples before and after sand column filtration: (a) untreated and (b) treated sample.
Figure 4.
Concentration of synthetic fragments in untreated samples before and after sand column filtration: (a) untreated and (b) treated sample.

Figure 5.
Distribution of different polymers for both types of wastewater, before and after the sand- filter.
Figure 5.
Distribution of different polymers for both types of wastewater, before and after the sand- filter.

Figure 6.
Size fractions in the sand-filter backwash water from sand-filtered wastewater.


Table 1.
Concentration of microplastic particles, before and after the sand-filter.
| Sample | 1000–5000 µm | 500–1000 µm | 355–500 µm | 250–355 µm | 125–250 µm | 30–125 µm |
|---|---|---|---|---|---|---|
| Untreated + sand column | 0 | 0 | 0 | 0 | 0 | 0 |
| Treated + sand column | 2 | 1 | 0 | 0 | 3 | 0 |
Table 2.
Total number of fibers, before and after the sand-filter.
| Sample | 1000–5000 µm | 500–1000 µm | 355–500 µm | 250–355 µm | 125–250 µm | 30–125 µm |
|---|---|---|---|---|---|---|
| Untreated | 0 | 1 | 0 | 0 | 0 | 0 |
| Untreated + sand column | 0 | 2 | 0 | 0 | 0 | 0 |
| Treated | 6 | 3 | 1 | 1 | 0 | 1 |
| Treated + sand column | 2 | 0 | 0 | 0 | 0 | 0 |
Table 3.
Total number of fragments, before and after the sand-filter.
| Sample | 1000–5000 µm | 500–1000 µm | 355–500 µm | 250–355 µm | 125–250 µm | 30–125 µm |
|---|---|---|---|---|---|---|
| Untreated | 7 | 40 | 12 | 24 | 44 | 43 |
| Untreated + sand column | 0 | 0 | 0 | 1 | 0 | 1 |
| Treated | 29 | 32 | 21 | 13 | 14 | 2 |
| Treated + sand column | 0 | 1 | 0 | 0 | 3 | 0 |
Disclaimer/Publisher’s Note: The statements, opinions and data contained in all publications are solely those of the individual author(s) and contributor(s) and not of MDPI and/or the editor(s). MDPI and/or the editor(s) disclaim responsibility for any injury to people or property resulting from any ideas, methods, instructions or products referred to in the content. |
© 2023 by the authors. Licensee MDPI, Basel, Switzerland. This article is an open access article distributed under the terms and conditions of the Creative Commons Attribution (CC BY) license (https://creativecommons.org/licenses/by/4.0/).
Share and Cite
MDPI and ACS Style
Umar, M.; Singdahl-Larsen, C.; Ranneklev, S.B. Microplastics Removal from a Plastic Recycling Industrial Wastewater Using Sand Filtration. Water 2023, 15, 896. https://doi.org/10.3390/w15050896
AMA Style
Umar M, Singdahl-Larsen C, Ranneklev SB. Microplastics Removal from a Plastic Recycling Industrial Wastewater Using Sand Filtration. Water. 2023; 15(5):896. https://doi.org/10.3390/w15050896
Chicago/Turabian StyleUmar, Muhammad, Cecilie Singdahl-Larsen, and Sissel Brit Ranneklev. 2023. "Microplastics Removal from a Plastic Recycling Industrial Wastewater Using Sand Filtration" Water 15, no. 5: 896. https://doi.org/10.3390/w15050896
Note that from the first issue of 2016, this journal uses article numbers instead of page numbers. See further details here.