
Mapping and Assessment of Flood Risk in the Wadi Al-Lith Basin, Saudi Arabia

Civil Engineering Department, King Saud University, P.O. Box 800, Riyadh 11421, Saudi Arabia
*
Author to whom correspondence should be addressed.
Water 2023, 15(5), 902; https://doi.org/10.3390/w15050902
Submission received: 29 January 2023
/
Revised: 22 February 2023
/
Accepted: 24 February 2023
/
Published: 26 February 2023
(This article belongs to the Section Hydrology)
Abstract
:Flood risk mapping is vital in watershed management and planning, especially in reducing flood damages. In this study, a flood risk map was developed for the Wadi Al-Lith watershed (Saudi Arabia) by combining geographic information system techniques with a multi-criteria decision-making method known as the Analytical Hierarchy Process (AHP). Several factors were investigated in the study, including elevation, slope, topographic wetness index, drainage density, rainfall, soil and land use, and land cover. The watershed was divided into five regions: very high, high, moderate, low, and very low flooding danger areas. The results showed that 35.86% of the total watershed area is under high and very high flood risks, while 26.85% of the total area is under a moderate flood risk. Less than 38% of the total watershed area was under a low flooding risk. The results of the developed model were validated with the flooding event that occurred on 23 November 2018 in the study area. The model was also compared with the flood mapping of the 100-year return period generated by the HEC-RAS software. Both the developed model and the HEC-RAS software showed similar results. The findings demonstrated that the developed model could be used to develop flood risk maps, especially in watersheds that experience scarcity and shortages in the short-interval rainfall measurements and the stream flow gauges (e.g., Wadi Al-Lith watershed and other watersheds in Saudi Arabia). Additionally, the obtained results can provide helpful knowledge for the policy- and decision-makers to make the right decisions regarding the effectiveness of the protective structures of the study area against the risk of flash flooding in the future.
1. Introduction
Floods harm urban and non-urban regions more than any other natural disaster [1]. Every year, flood events affect millions of individuals [2,3]. Floods are estimated to have caused 43% of all documented natural disasters from 1995 to 2015, affecting 2.3 billion people worldwide, incurring USD 662 billion in damages, and killing 157,000 people [4].
Various factors can cause floods, such as climate change and human activities [5]. Climate change and environmental variations were found to be the most critical factors driving variations in seasonal precipitation, which can lead to flooding disasters [6,7]. Flooding will threaten more than 2 billion people by 2050 due to climate change, sea level rises, rapid population growth in flood-prone areas, and deforestation [8,9]. Additionally, climate change has a significant influence on the hydrological cycle and water resource systems. As a result, studying the water cycle and its temporal and geographical evolution under an environmental change has attracted significant academic interest [10,11]. The warming of the atmosphere, seas, and land has occurred since the beginning of industrialization [12]. The average global temperature increased by 0.9 to 1.2 degrees Celsius between 2010 and 2019 [13].
Future floods’ frequency and quantity will likely [14,15]. The effects of significant flooding occurrences brought on by climate change are anticipated to grow in the future, significantly increasing the overall flood risk [16,17].
Previous research showed that spatial planning is crucial to integrated disaster risk reduction, mainly because it contributes to long-term catastrophe mitigation [18]. The growth of artificial surfaces alters drainage characteristics, resulting in more inundated areas due to floods in both developed and undeveloped lands. As a result, more significant planning of land resource exploitation is required to limit flood effects over hazard-prone areas [19].
Flash floods usually occur in mountainous watersheds and are caused by heavy and intense rainfall events. Flash floods are widely recognized as one of the leading causes of the world’s most threatening and expensive natural hazards [20,21]. A global assessment from 1975 to 2002 found that 181 people were killed per flash flood event. The average mortality rate (the number of people killed compared to the number of people exposed to the event) is 3.62 percent [22].
Saudi Arabia is one of the countries that is vulnerable to flash floods, which may inflict various losses. Rainfall varies in time and space in arid to semi-arid locations, such as Saudi Arabia, where summers may be hot to extremely hot and winters can be mild to warm [23]. This leads to periodic flash floods that cause minimal damage to roadways, human life, infrastructure, and dams [24]. Various parts of Saudi Arabia have a number of flood occurrences every year [25,26]. The most frequent natural catastrophes in Saudi Arabia are flash floods, which are primarily caused by geographical and topographical aspects, in addition to other natural and human causes [25]. For example, heavy precipitation over northwestern areas in Saudi Arabia in 1985 caused significant flooding, considered the highest in 50 years, with more than 30 people reported dead [27]. Additionally, in January 1997, heavy rainfall descended on Western Saudi Arabia, mainly affecting Yanbu and the outskirts of Jeddah. The precipitation continued for 24 h; ten people were killed, and nearly 130,000 km2 of land was damaged [28]. Furthermore, in 2018, flooding inundated Al-Lith City (located in Western Saudi Arabia). The water level reached a height of more than 1.7 m in several areas of the town. The infrastructure was decimated, and the city’s services and institutions were destroyed, with more than 21 people drowned and 487 homes damaged [29]. Pictures of the city’s damage are shown in Figure 1 and Figure 2.
The location of flood catastrophes may be accurately predicted via flood risk mapping, which can assist in lessening their consequences [30]. The location of the flood is influenced by many factors that must be precisely mapped and identified. Therefore, by merging multiple databases, geographic information system (GIS) techniques can be utilized to perform spatial analysis [31]. One of the methods for evaluating multiple alternatives is the Analytical Hierarchy Process (AHP) [32,33]. AHP is a powerful decision-making approach that can be used in developing flood risk maps to compare the performance of the various criteria [34,35,36,37]. Using elevation, climate, land use data, soil data, and the GIS environment, the efficiency of flood analysis can be enhanced [38].
Duan and Gao [39] utilized the Stormwater Management Model (SWMM) to simulate how stormwater in Tung Chung’s drainage system flows off and to assess the system’s dependability in the face of past and anticipated high-precipitation situations. Through the implementation of two widely used measures (detention tanks and low-impact development), Li et al. [40] evaluated the control of urban flooding risk and drainage water quality analyses. The flow distribution pattern at a T-shaped traffic crossing was experimentally and statistically investigated by [41] to determine the effect of important road design characteristics under different flow rate scenarios and boundary circumstances, which is significant because the deployment of a highway major drainage system considerably enhances the capacity of the drainage system.
The main objective of the study was to evaluate flooding hazards in the Al-Lith area using the GIS-based multi-criteria perspective and AHP method. The findings of this study can help local decision-makers and control authorities to construct a base flood hazard analysis in order to determine the most necessary mitigation actions and acquire an understanding of how nearby populations could improve their resistance to future flooding. The paper is organized as follows: Section 2 and Section 3 introduce the study area, software, and datasets used in this study. The methodology is presented in Section 4. Section 5 and Section 6 present the results and discussion, respectively. Finally, the conclusions are drawn and summarized in Section 6.
2. Study Area
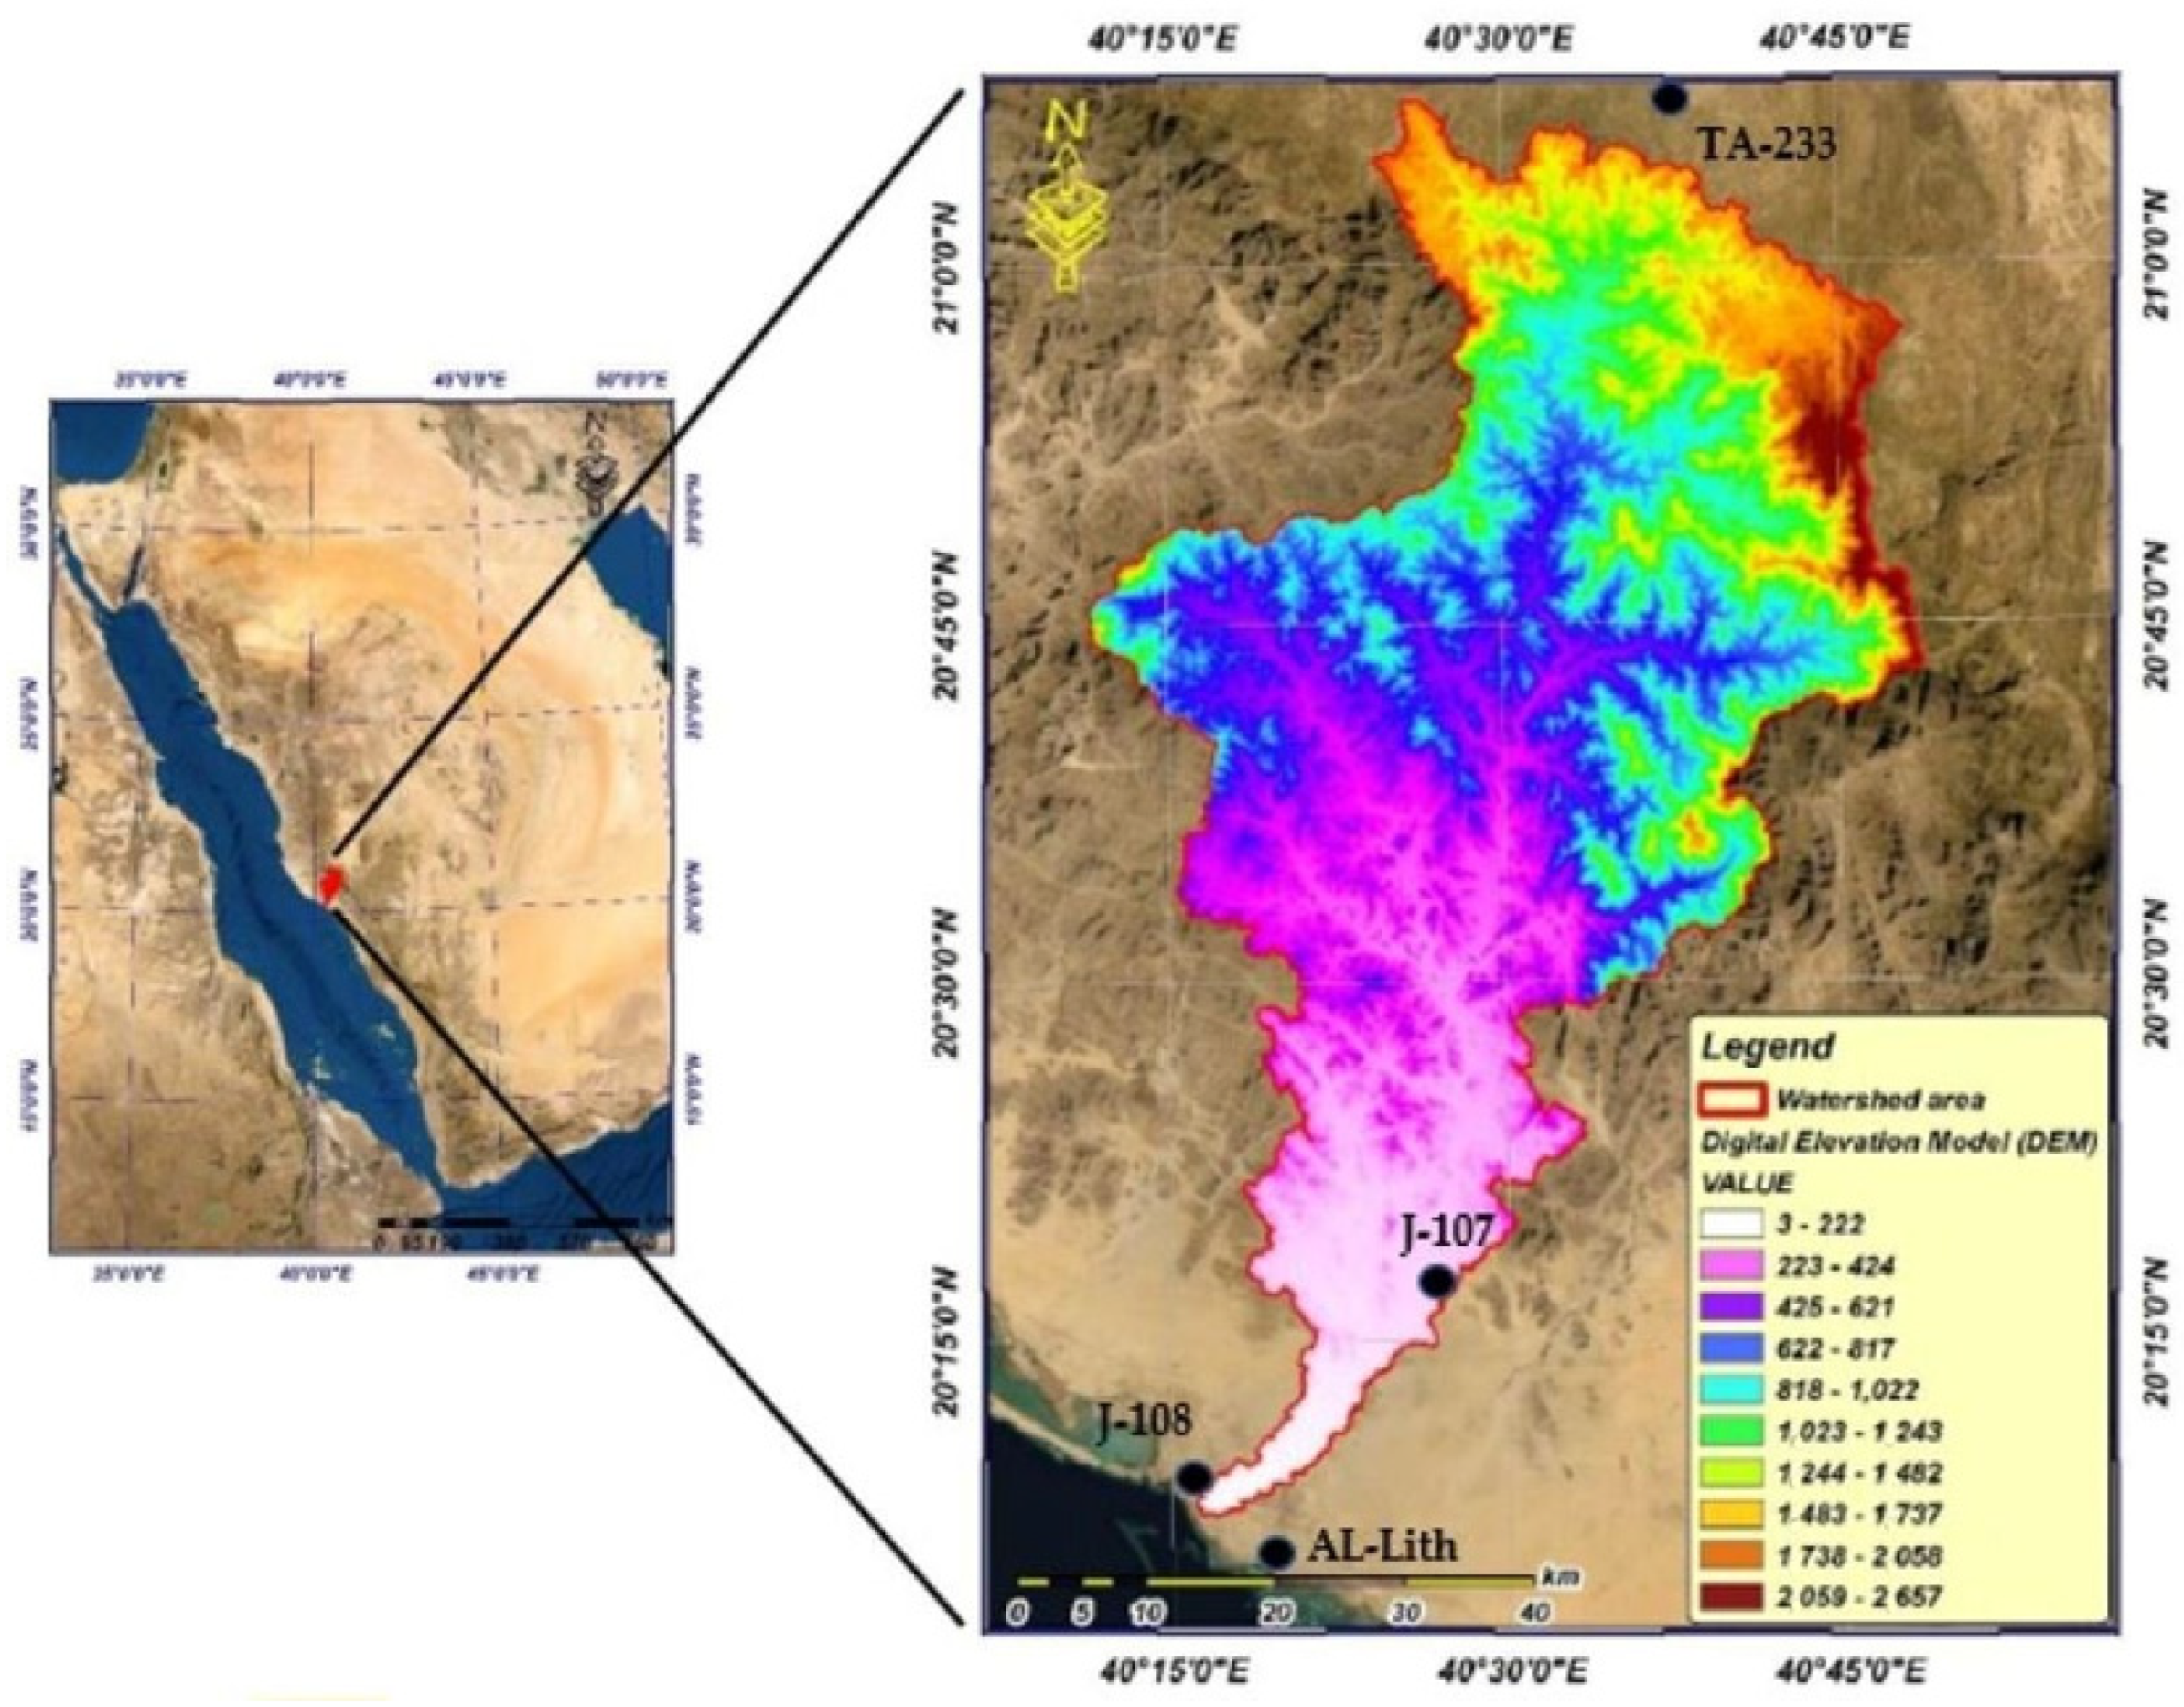
The Wadi Al-Lith area is surrounded to the east and north by the As-Sarawat high mountains and to the west by the Red Sea coastline, as shown in Figure 3. The basin of Wadi Al-Lith has an area of 3089 km2 and an estimated length of 109 km. It is situated between the latitudes (20°70′54″ and 21°7′7″) and the longitudes (40°11′ 26″ and 40°48′44″). Located 180 km southwest of the holy city of Mecca in Western Saudi Arabia, Al-Laith City is a tiny city with accessibility to major international roads. It is situated downstream of Wadi Al-Lith. The Wadi Al-Lith region is an arid to hyper-arid area, where July has the largest monthly average potential evaporation (200 mm), while February has the lowest (111 mm). The rainfall occurs only in the winter season from November to March, with only few days of rain in this period. The general wind direction is west to southwest in the summer and northwest to west in the winter. The greatest monthly mean wind speed is 39 km/h in September, while the lowest is 17.3 km/h in December.
3. Database
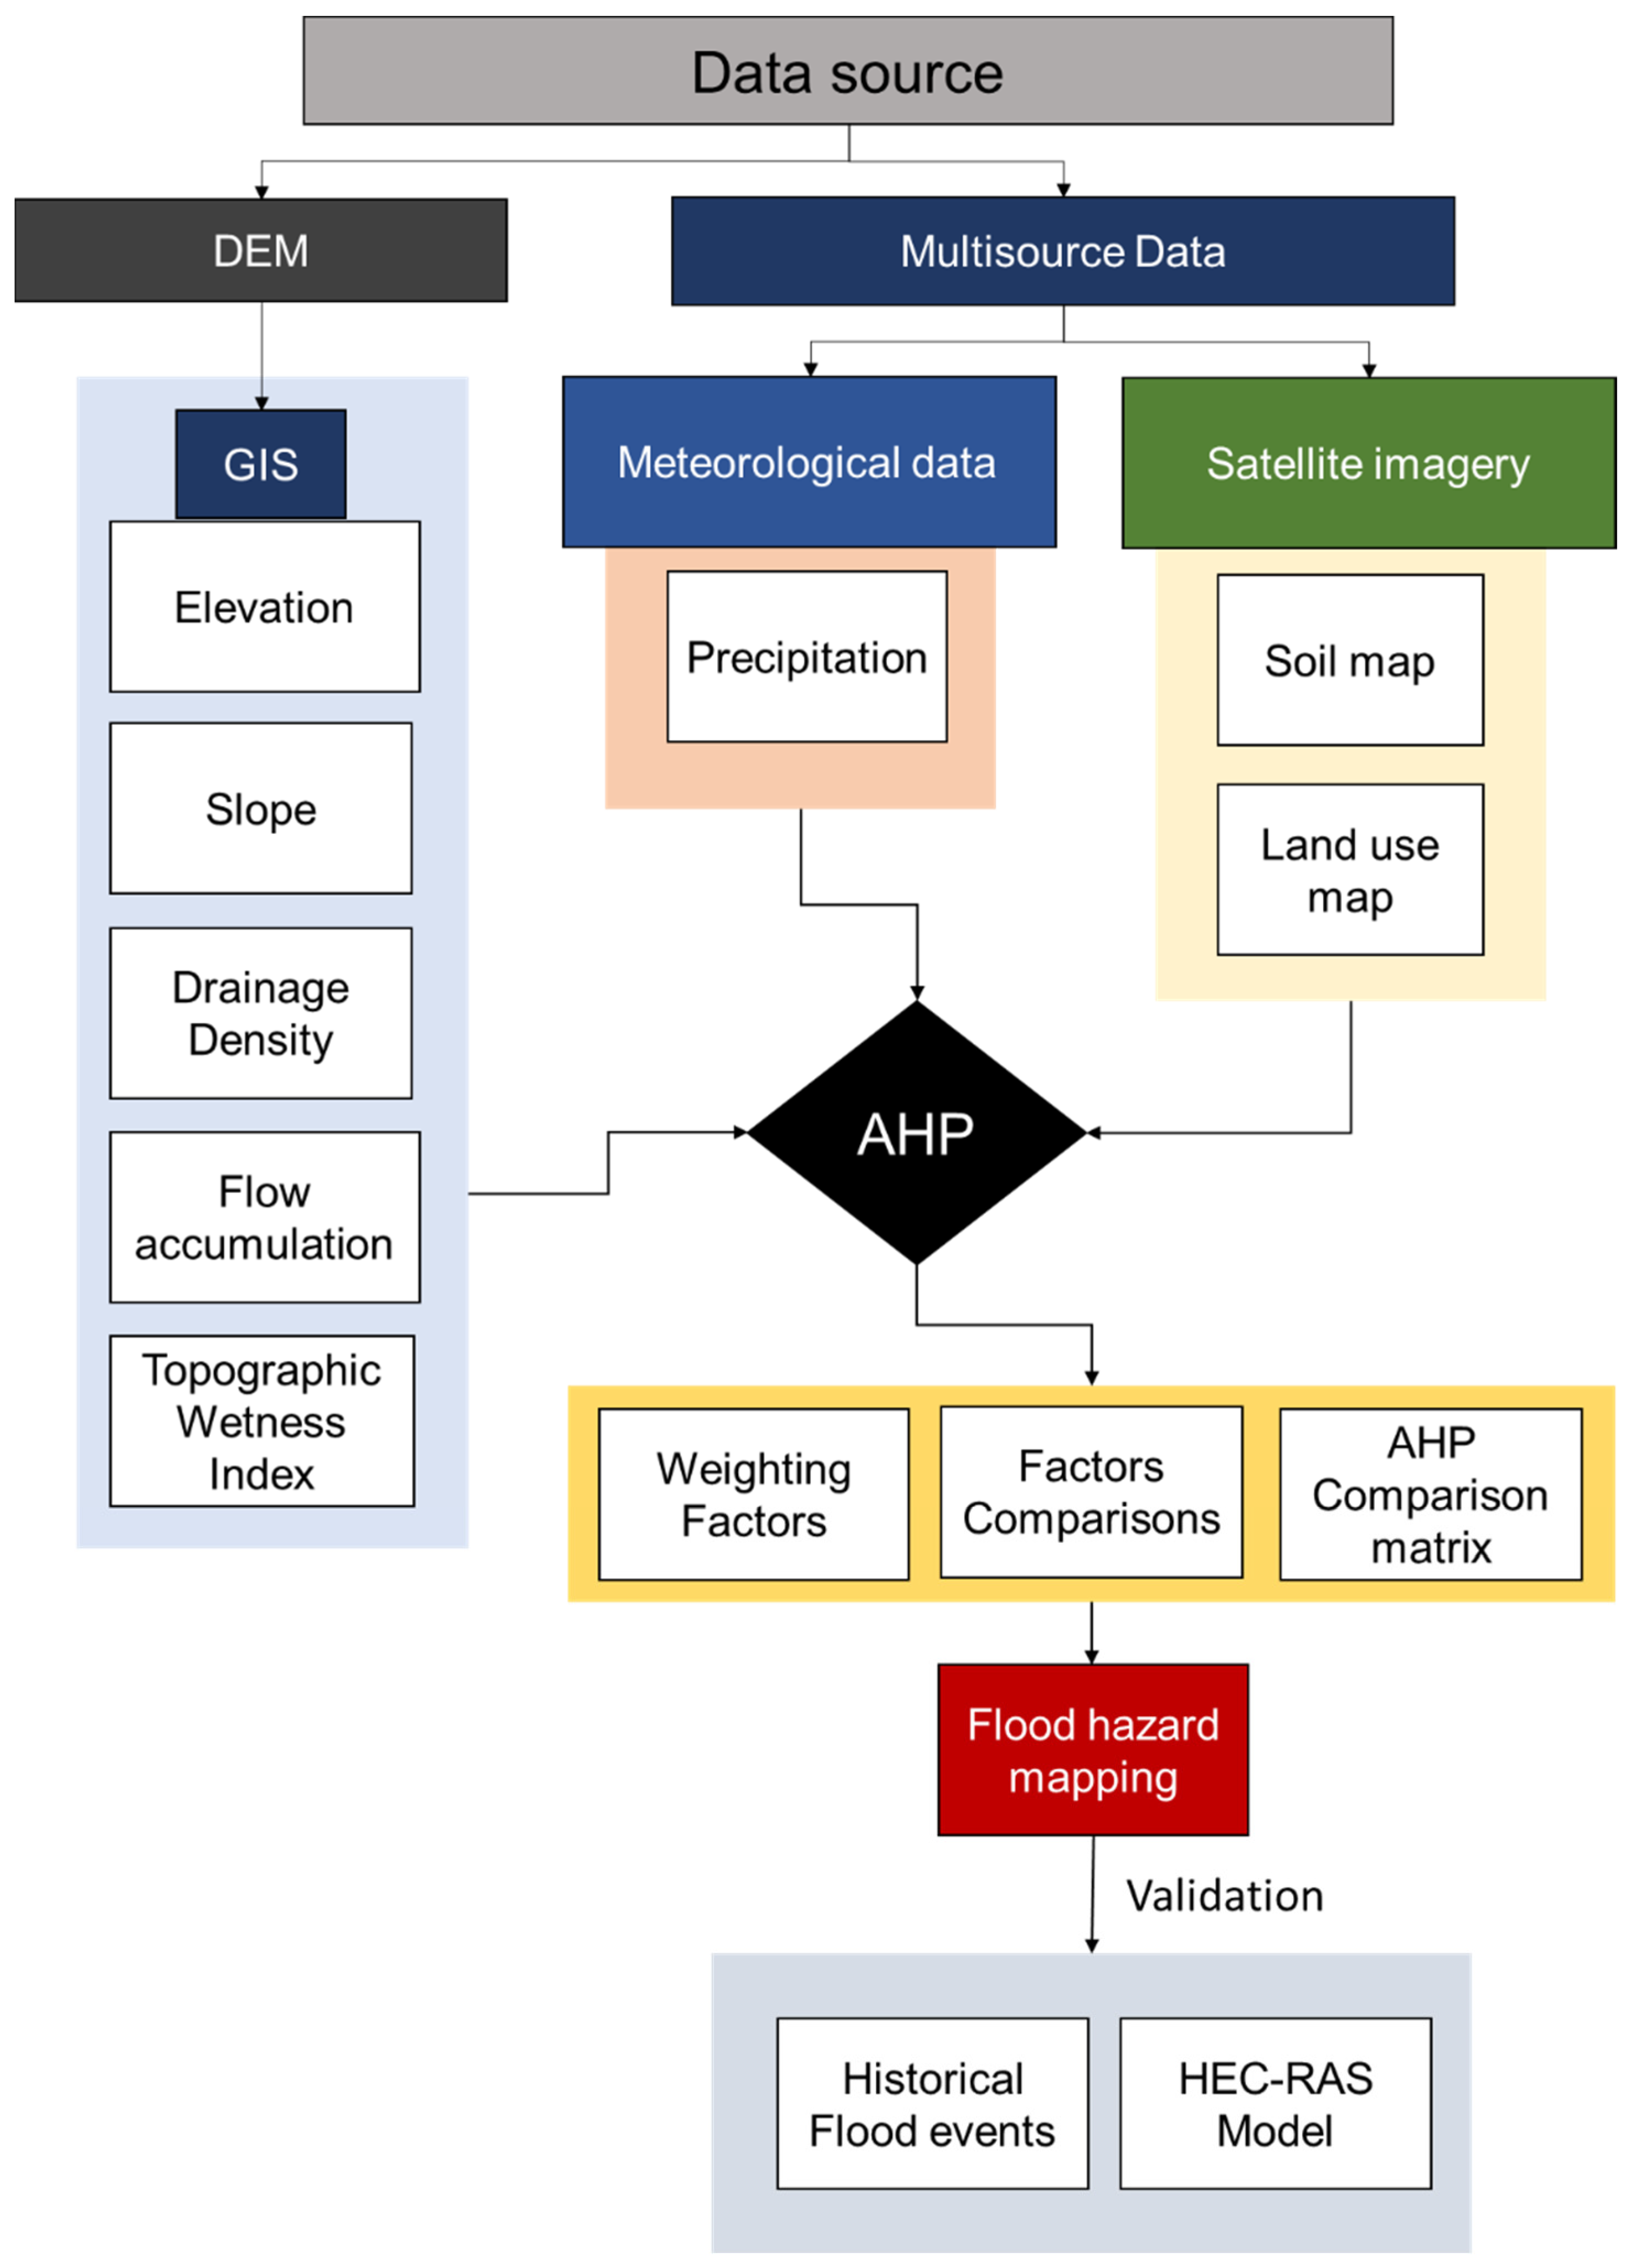
Data preparation is a crucial and proactive step in creating a flood susceptibility map. Data for the study area were gathered from several sources (Figure 4). Digital elevation model (DEM) data were obtained from King Abdulaziz City for Science and Technology with a resolution of 10 m. The DEM was processed in ArcGIS to create several layers, such as elevation, slope, drainage density, flow accumulation, and topographic wetness index (TWI) (Figure 4).
Daily observed rainfall data were obtained from the Ministry of Agriculture, Water, and Environment’s database. The daily maximum rainfall data from 2000 to 2020 were averaged and then interpolated over the study area using the inverse distance weighting (IDW) method. The soil-type data were downloaded from a digital soil map of the world (https://data.apps.fao.org/map/catalog/srv/eng/catalog.search#/metadata/446ed430-8383-11db-b9b2-000d939bc5d8. Accessed on 24 March 2022). The land use land cover data (LULC) were derived from satellite images from the USGS Earth Explorer website (https://earthexplorer.usgs.gov/. Accessed on 15 May 2022). The LULC map was built from satellite imagery using image classification techniques and a maximum likelihood algorithm in ArcGIS 10.8.
All the geospatial layers were resampled into raster format with a spatial resolution of 10 m × 10 m to obtain a uniform database.
4. Methodology
The overall methodology used in this study is shown in Figure 4. Seven factors were selected and found to be crucial in generating floods. The selected factors are similar to those adopted in earlier literature with the same watershed characteristics [43,44,45,46]. For all factors, the AHP method was used to perform weighting analysis, factor comparison, and the creation of an AHP comparison matrix (Figure 4). In other words, this weightage combination methodology of AHP was used to create the final flood vulnerability map after conducting a multi-criteria analysis. The outputs of the AHP model were then compared with a historical flood event and HEC-RAS modeling results. The following sections briefly discuss the selected factors and the AHP model.
4.1. Elevation Factor
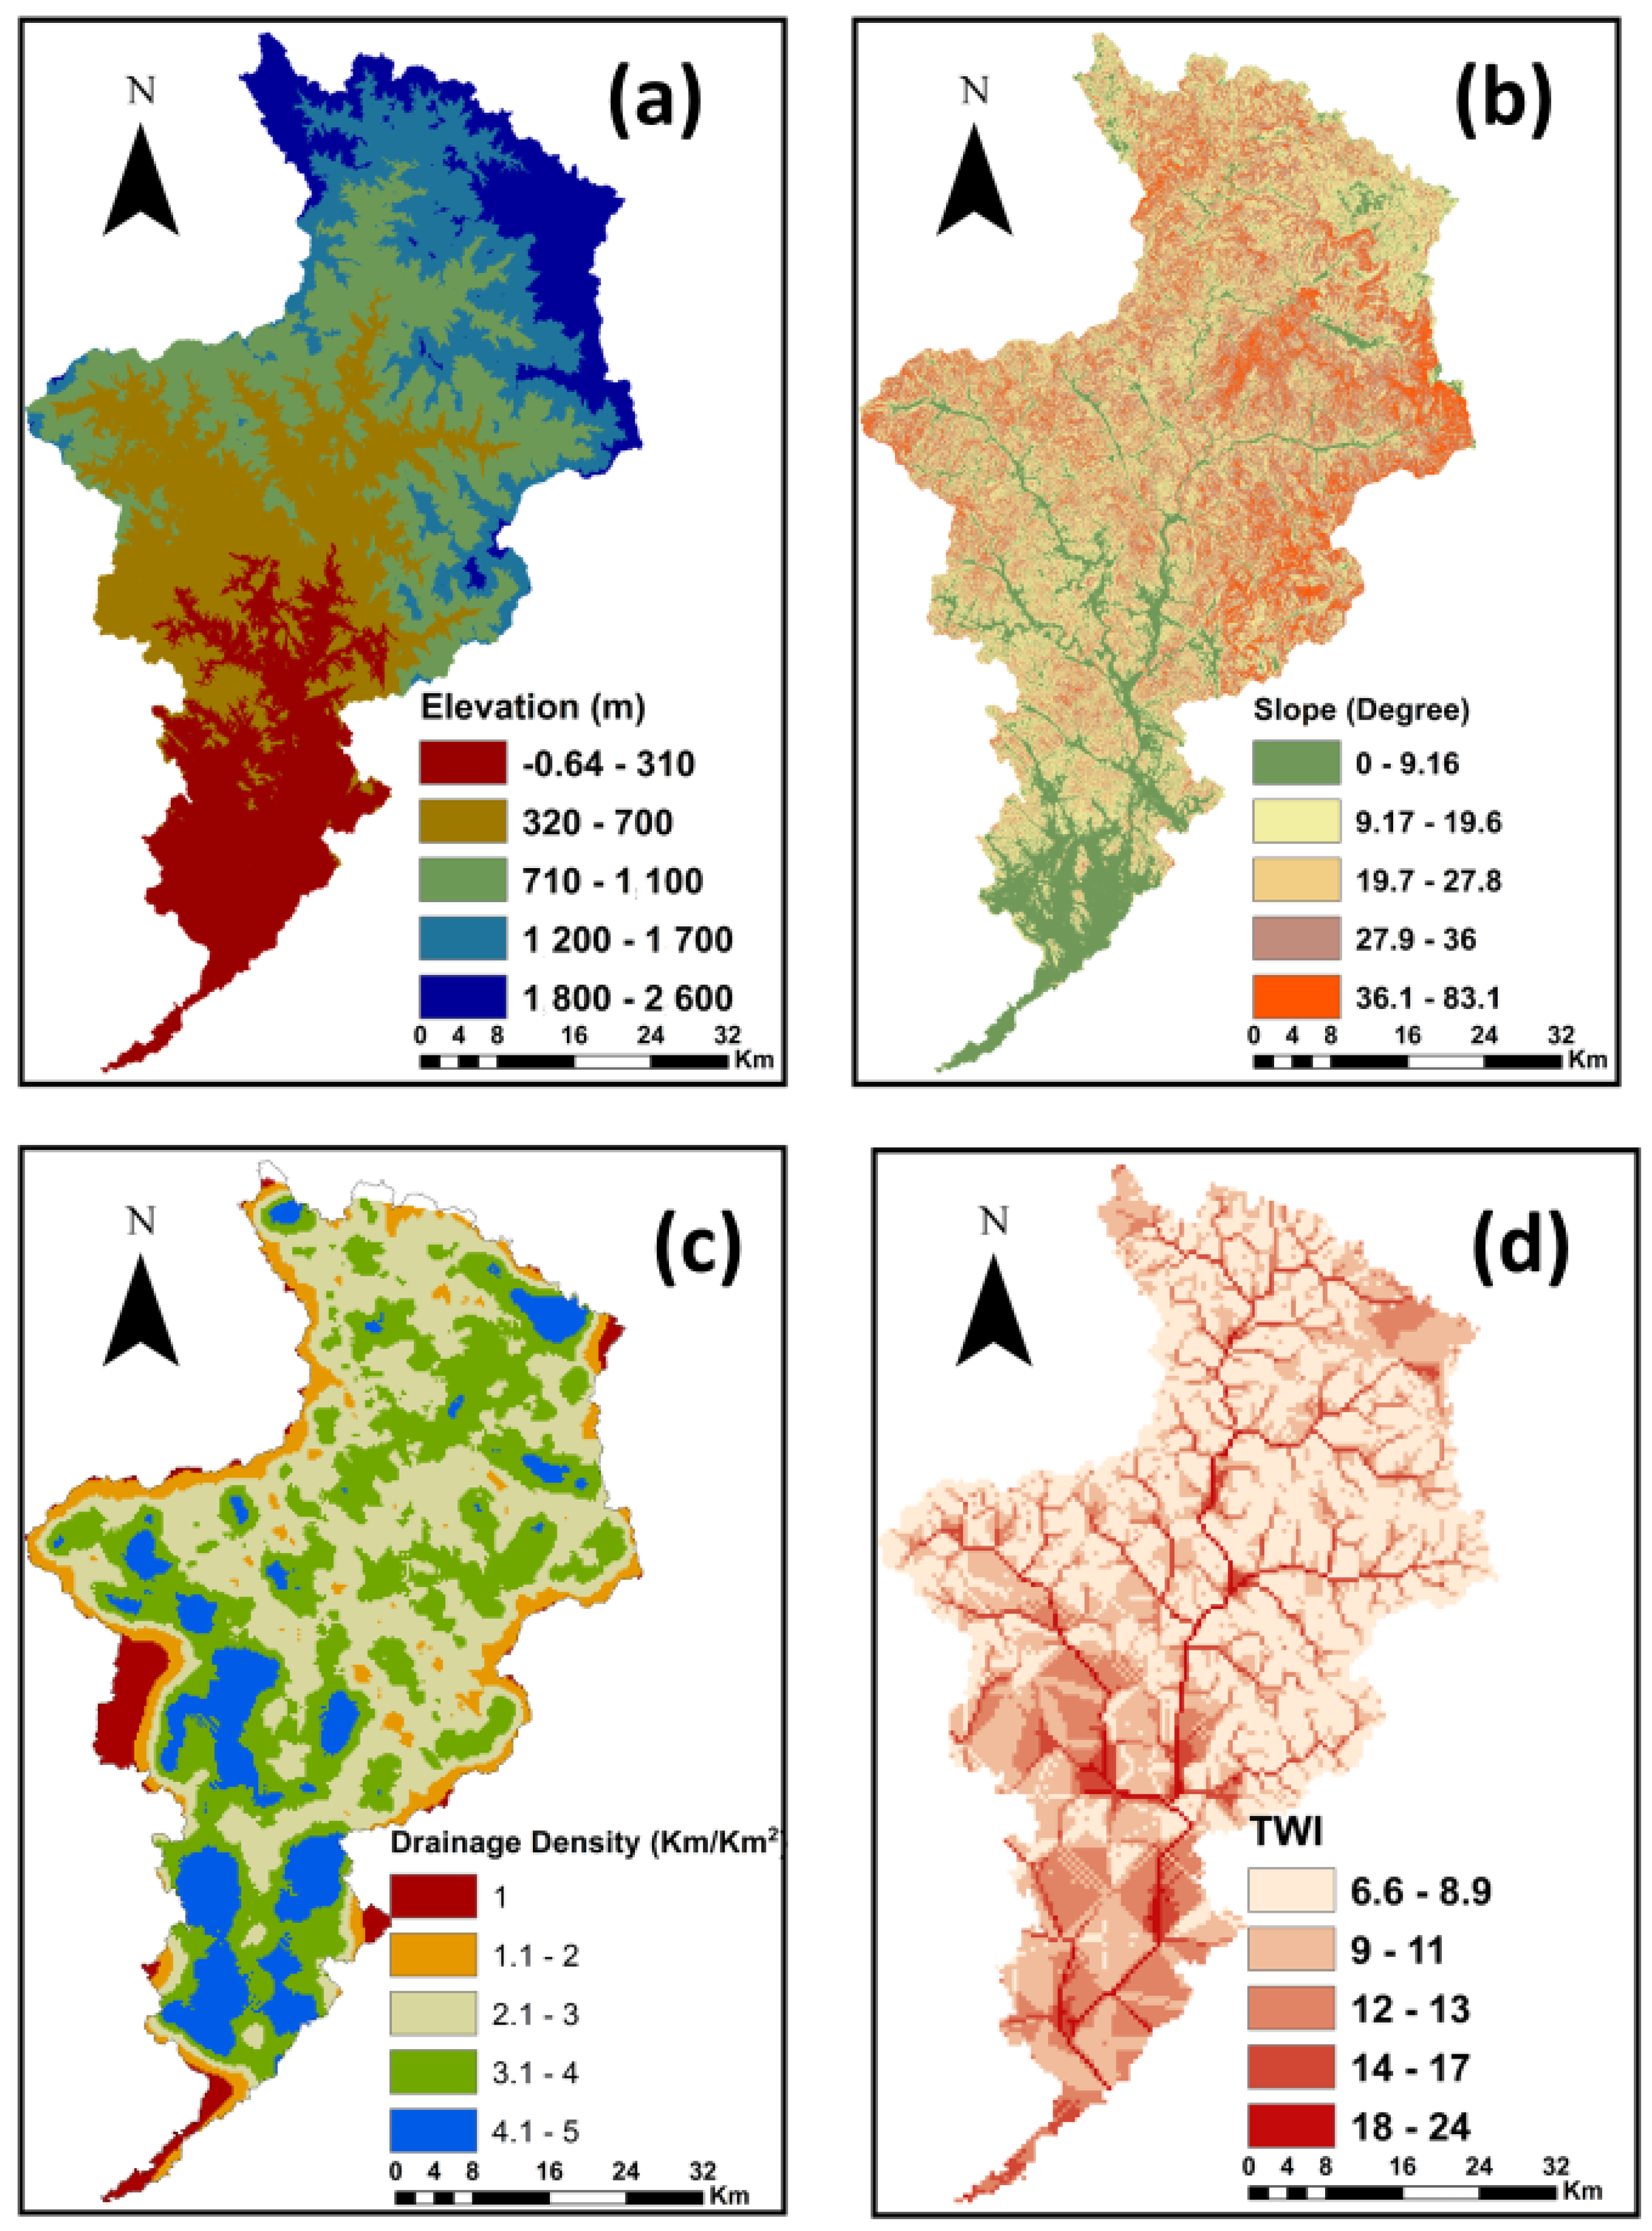
Elevation is an important factor that influences the overflow direction and how deep the water level is [36]. Therefore, elevation is one of the most significant factors in flood control [47]. Low land areas may be inundated more quickly when water flows from high altitudes to lowlands. Flooding is less likely in higher-elevation places than in lower-elevation areas [48,49]. In this study, the elevation map was prepared from the DEM with a 10 m resolution. The DEM was classified into five classes using ArcGIS 10.8, as shown in Figure 5a.
4.2. Slope Factor
The slope is a measure of how steeply or obliquely an object is inclined in relation to a horizontal plane [50]. The slope factor is an essential index of surface zones that are susceptible to flooding, and the slope considerably impacts the duration and rate of water flow. Flatter surfaces are more vulnerable to flooding than steeper terrain because the water travels more slowly, gathers for more extended periods, and accumulates there [36,50]. Using the surface tool in ArcGIS 10.8, the slope map was immediately generated from the DEM (10 m resolution), as shown in Figure 5b.
4.3. Drainage Density Factor
Drainage density is a fundamental concept in hydrological study and is calculated as the total drainage length to the basin area. The permeability, the ability of surface materials to erode, vegetation, slope, and time have an impact on drainage density. Inadequate drainage produces overland flow, which can clog drainage and water channels [50]. Infiltration and drainage density are inversely related, and a higher drainage density suggests greater runoff for the watershed and a decreased risk of flooding. These elements are also connected with erodible geological materials. Therefore, when the drainage density increases, the rating for drainage density declines [51].
The drainage density is determined as follows:
where D is the drainage density of the watershed; L is the overall length of the drainage channel in the watershed (km); A is the whole area of the watershed (km2).
D = L/A
Drainage density was calculated by using Equation (2) and the GIS toolbox, as shown in Figure 5c.
4.4. Topographic Wetness Index (TWI)
TWI is commonly applied to assess the impact of topography on overflow production and flow cumulation at any point in a stream watershed [1,49]. High-TWI zones are more vulnerable to floods, whereas lower-TWI regions are less vulnerable [52]. TWI was calculated from the flowing formula:
where As is the upstream contributing zone, and β is the slope gradient. TWI was simply determined in GIS by analyzing the DEM, as shown in Figure 5d.
4.5. Rainfall Factor
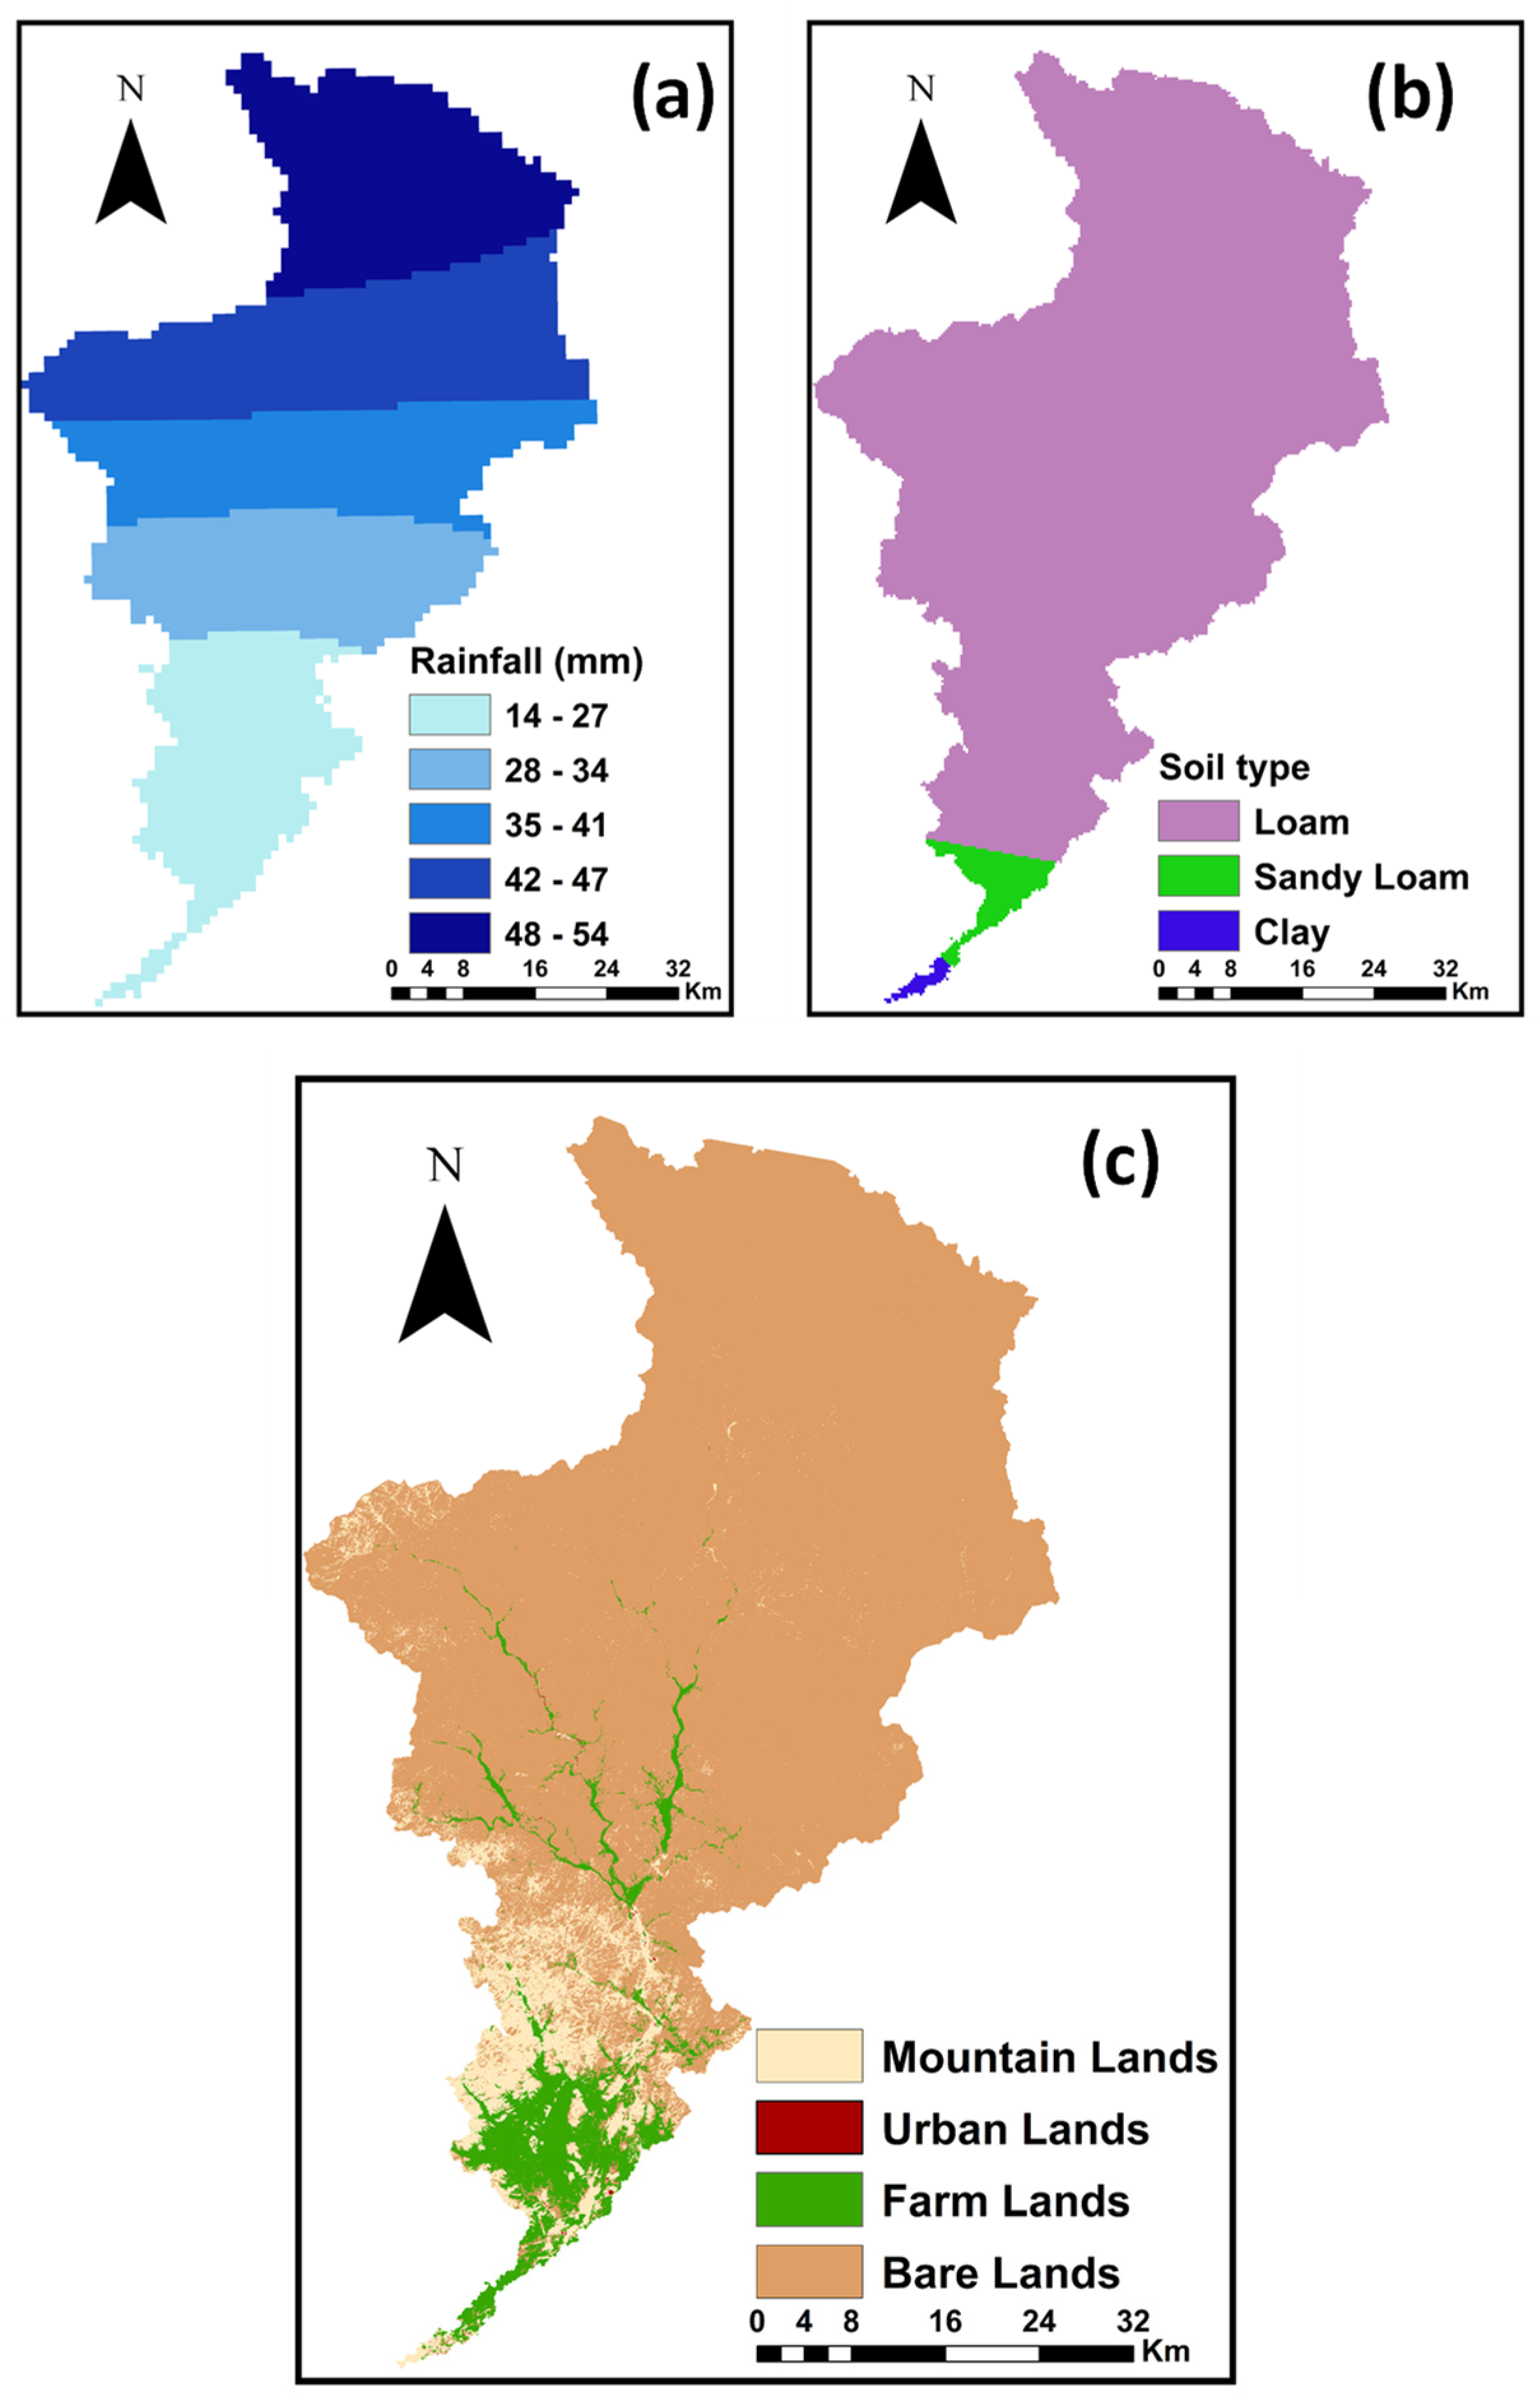
One of the primary causes of flash floods is heavy rainfall in a short period. Floods have consistently been the most prevalent cause of natural disaster mortality and are the most common catastrophe risk connected with climate change [53]. Changes in the global climate and individual climatic factors can affect floods. As a result of increased water vapor storage due to a warmer atmosphere, severe precipitation and subsequent flash flooding may be more likely [54]. The rainfall distribution map was created in ArcGIS 10.8 using inverse distance weighting (IDW) interpolation from the average rainfall, as shown in Figure 6a.
4.6. Soil Factor
Soil parameters in a basin, such as the soil layer thickness, permeability, infiltration rate, and the quantity of wetness in the soil before the rainfall event, directly influence the rainfall–runoff process [50,55]. The structure and infiltration capability of soils will considerably impact their ability to infiltrate water. Because of the capacities of different soil types, a decreased soil infiltration capacity leads to greater surface runoff, which increases the danger of floods [50,55]. When the water supply rates exceed the soil’s ability for infiltration, water moves down the slope as runoff over sloping terrain, resulting in floods [56]. Three classes of soil in the study area were extracted from satellite images, namely loam, sandy loam, and clay, as shown in Figure 6b.
4.7. Land Use/Land Cover Factor
Since the urban land expansion is increasing, the impervious cover is expanding, and forest cover is thinning in urban areas, all of which contribute to an increase in runoff. Many experts in the subject of flooding hazard management agree that land use/land cover change is a significant component of floods [54,57].
Using image categorization techniques and a maximum likelihood algorithm in ArcGIS 10.8, the LULC map was created from satellite imagery. Four categories were identified on the LULC map, namely bare land, farmland, mountains, and urban areas, as shown in Figure 6c.
4.8. Analytical Hierarchy Process (AHP)
The AHP procedure is divided into four steps: build the decision hierarchy; establish the relative relevance of characteristics and sub-attributes; assess each option and compute its total weight in relation to each attribute; and validate the consistency of subjective assessments [56]. Parameter layers are made in order to produce a flood risk map. The weight is then determined by reclassifying the qualifying classes.
Table 1 shows the weighted parameters in a hierarchical order. Multi-criteria decision-making (MCDM) was used to create the flood risk map, and AHP was utilized as an MCDM tool. Pairwise comparison was conducted for all potential criteria as part of the AHP process. Twenty-one pairwise comparisons were defined for seven criteria. The numbers outside of the diagonal represent a factor’s weight relative to the other elements.
As a result of comparing a component to itself, the diagonal values are all equal to one. Table 2 shows the normalized matrix. Each factor’s priority vector and weight have been calculated. Whenever the consistency ratio (CR) is less than the allowable limit of inconsistency, all pairwise comparisons are judged valid. The AHP allows for up to 10% inconsistency. Equation (3) was used to compute the CR.
where CI represents the consistency index, and RI represents the random consistency index, which is equal to 1.32 for seven factors [58], as shown in Table 3.
CR = CI/RI
CI was determined using Equation (4):
where n is the number of factors and λmax represents the product of the relative weights and the totality of each column of the comparison matrix. λmax for watershed factors contributing to floods is calculated using Table 1 and Table 2, as follows:
CI = (λ_max − n)/(n − 1)
λmax = 4.25 × 0.229 + 4.87 × 0.21 + 4.68 × 0.241 + 20 × 0.061 + 11 × 0.093 + 10.5 × 0.103 + 16 × 0.063 = 7.45.
The CR for the flood-contributing variables in the Wadi Al-Lith basin is 5.6%, in comparison to the typical 10%. Consequently, the pairwise matrix’s ranking is accepted.
5. Results
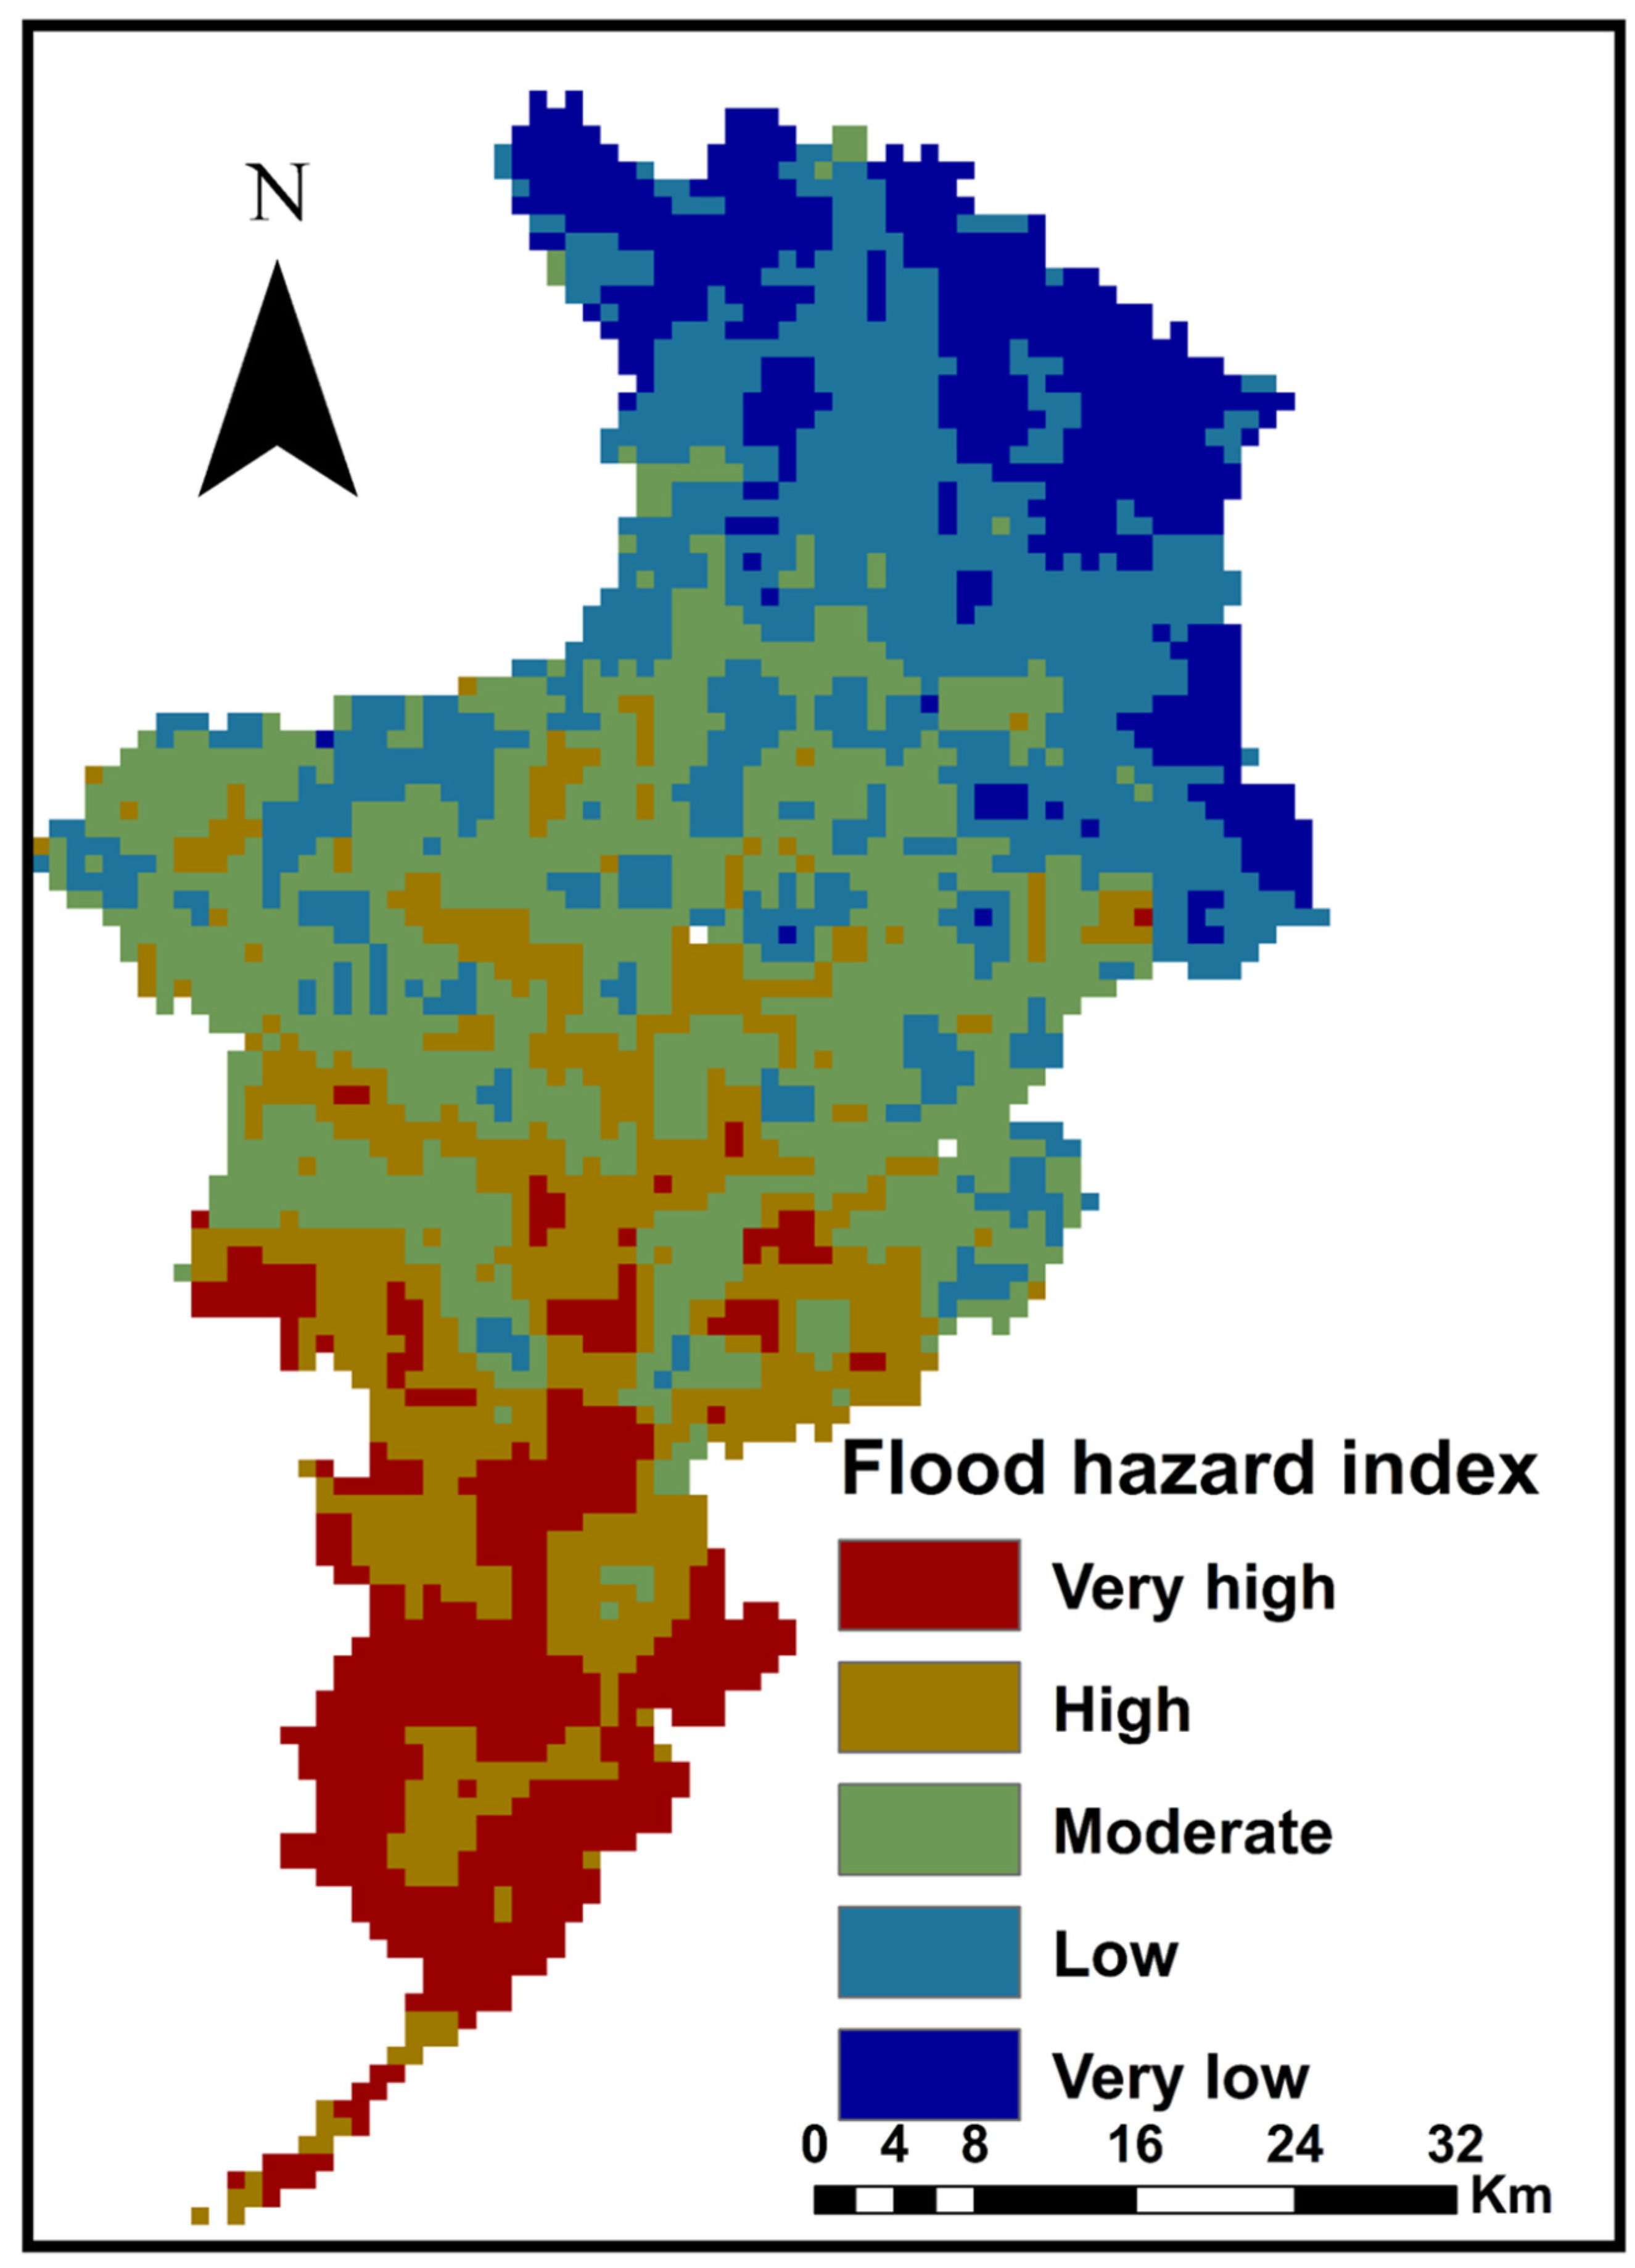
The pairwise contrast matrix and factor map are used to determine the weight and ranking of each factor. The weight value of the priority factor is presented as a percentage number between 0% and 100%. Table 4 includes a list of the targeted factors, their weights, and their rankings. Rankings ranged from 1 to 5, with 5 being the most influential factor and one being the least influential. The flooding hazard map for the study watershed was created using the data from Table 4, as shown in Figure 7. According to the watershed’s flooding hazard, there was a very high, high, moderate, low, and very low flooding hazard area, which was 12.71%, 23.15%, 26.85%, 24.23%, and 13.06% of the watershed area, respectively.
Validation and Modeling of Flood Hazards Using HEC-RAS
The primary goal of hazard mapping is to identify regions vulnerable to flooding. In this work, HEC-RAS was used to perform two-dimensional hydraulic modeling to assess the success and forecast proportion of the flood danger map based on prior flood incidences. We validated the model by comparing existing flood data to the newly acquired flood probability map.
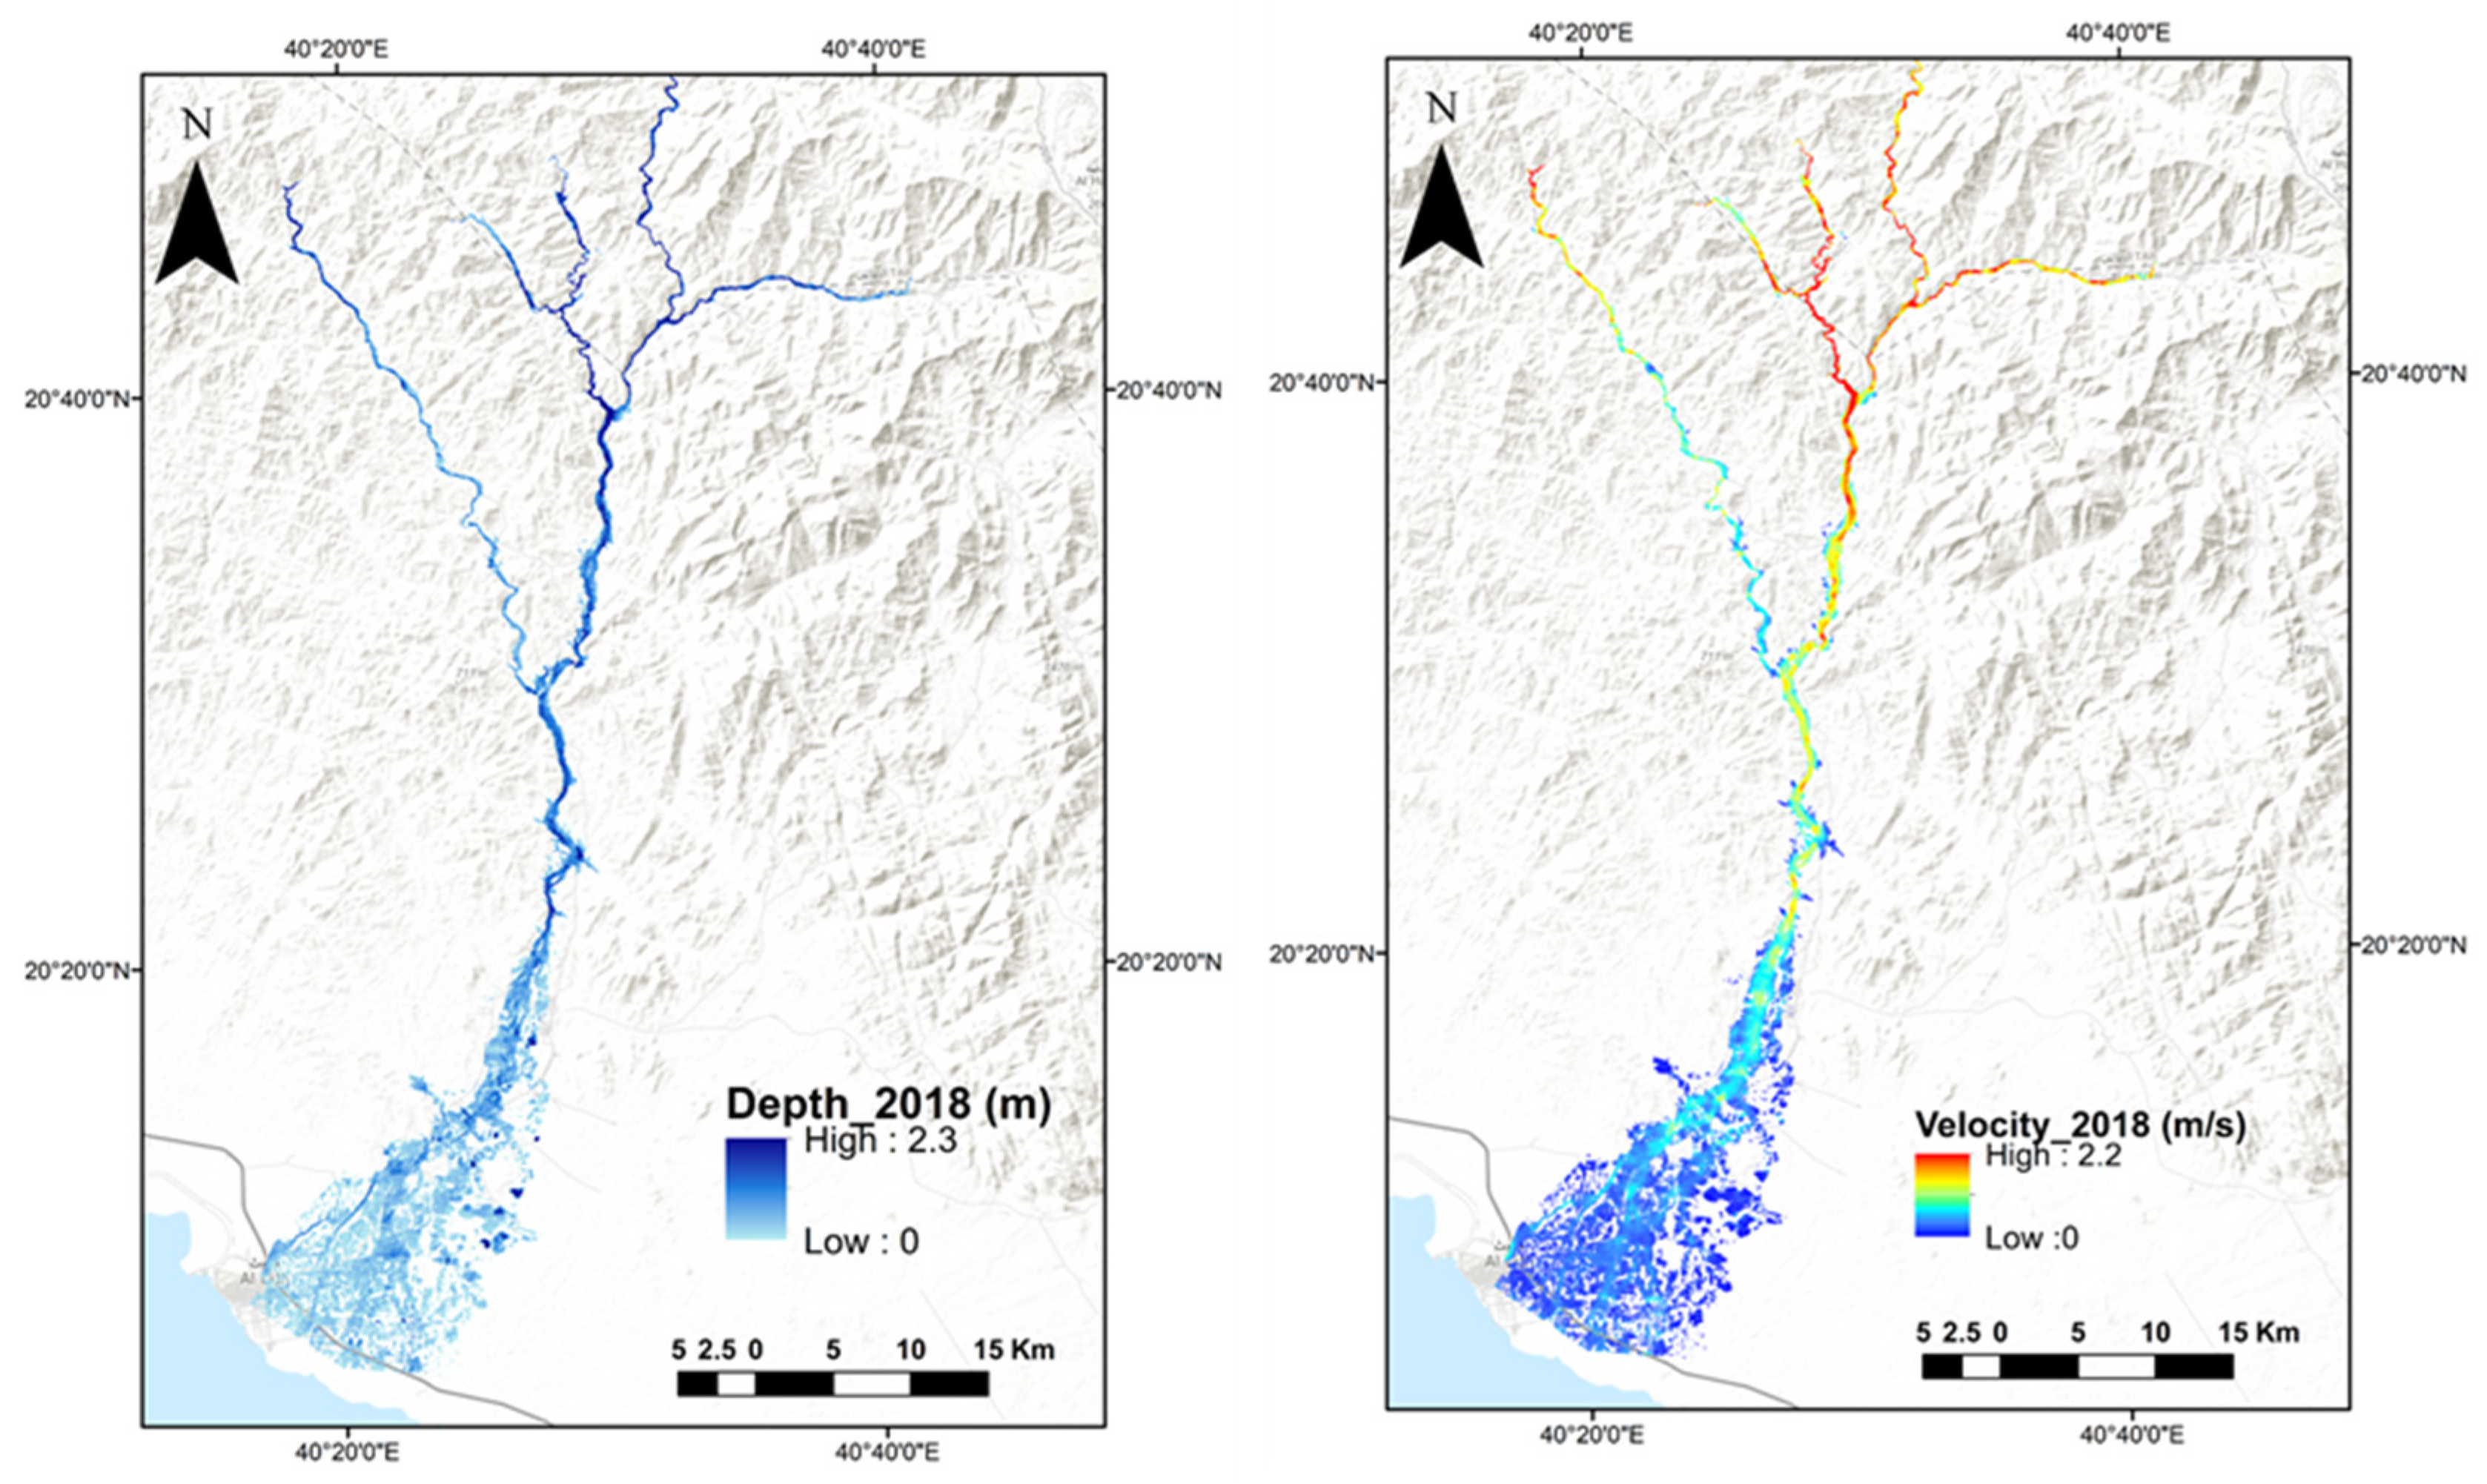
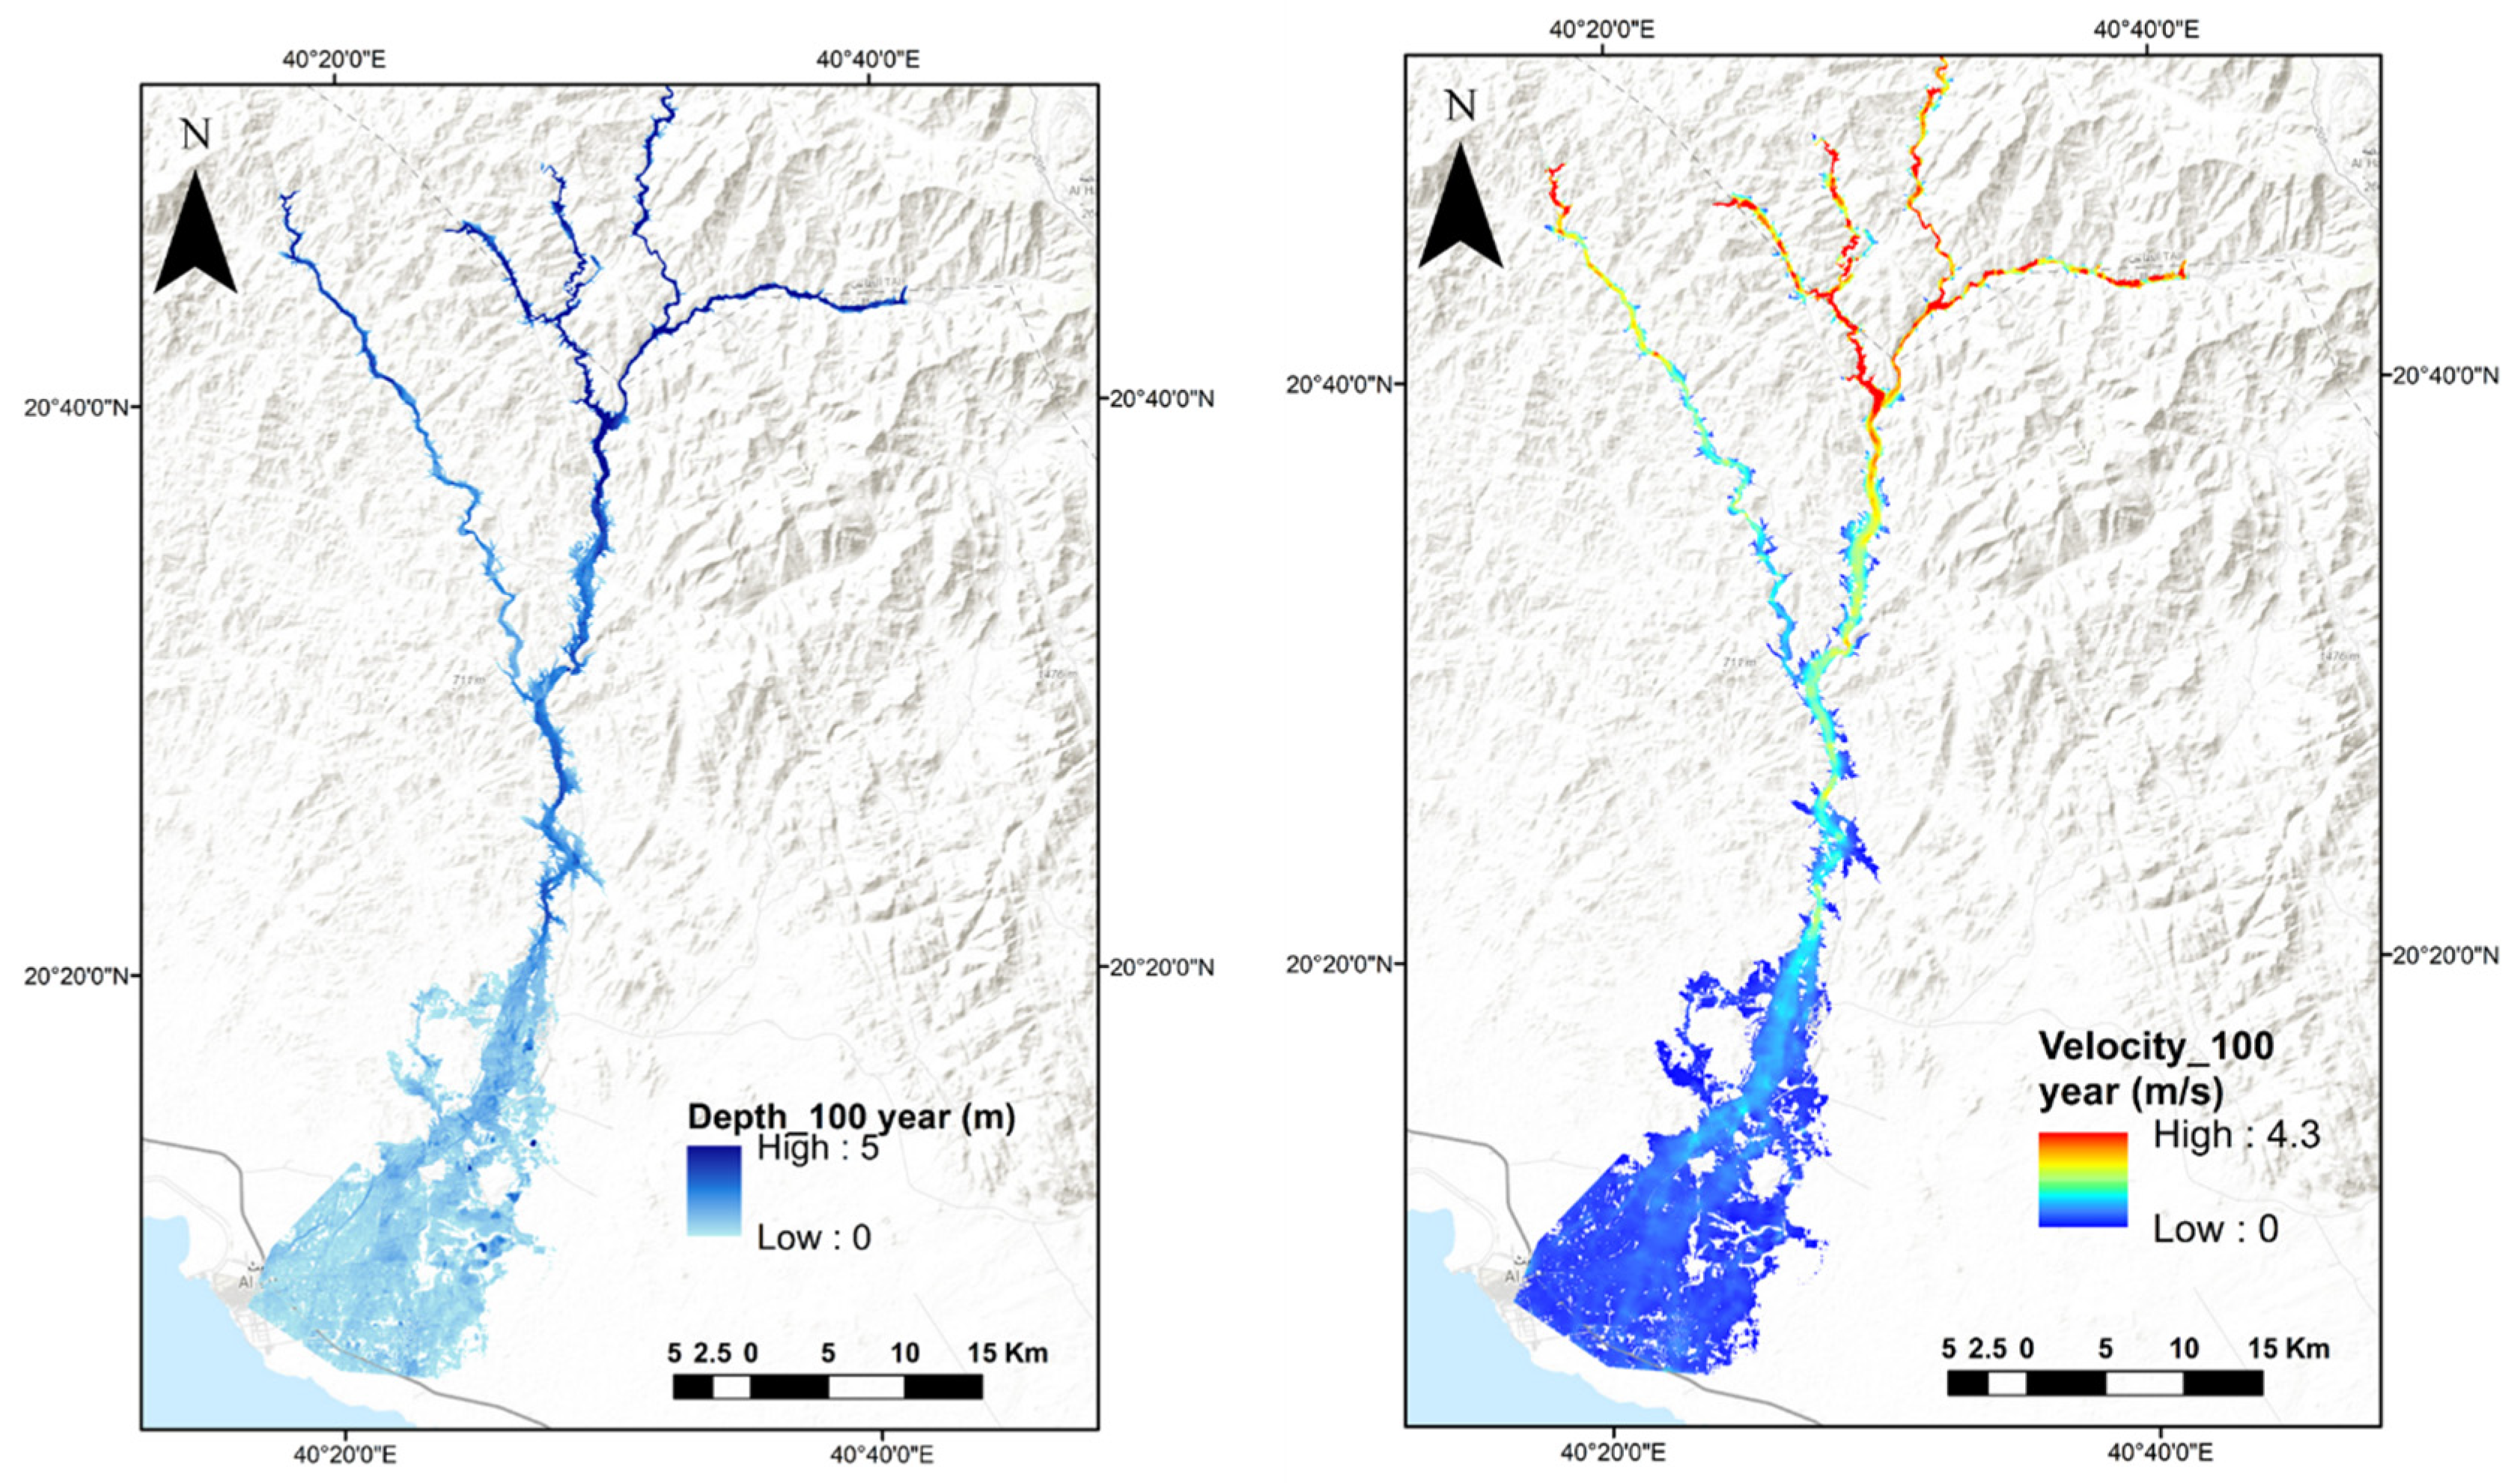
Two water runoff inundation scenarios were considered—the first was the peak discharge at the rainfall event on 23 November 2018, which yielded 1630.3 m3/s, and the runoff volume was 82,436,158.8 m3. The second scenario involved the highest discharge of the 100-year return period, which was predicted to be 7733.5 m3/s, and the runoff volume to be 385,259,846.4 m3.
Historical flooding occurrences and satellite images were utilized to confirm the recent floods in the region on 25 November 2018. This study was also used to test the models’ validity and compare them to model findings. The extent of the flood zone was shown in these scenarios, and the depth and speed of the water discharge were plotted to describe the danger level, as shown in Figure 8 and Figure 9.
Comparing AHP with HEC-RAS outputs revealed that AHP is adequate and accurate, particularly in the danger and exposure layers. The flood risk maps were consistent with the flood risk regions derived from historical data, particularly in high-risk areas.
6. Discussion
The current research attempted to implement a realistic solution for flood risk criteria in the ungauged watershed under severe conditions using the AHP technique, which has been applied in different watersheds, as discussed in previous research [1,31,36,44,45,46,47,59,60,61,62,63,64]. The AHP concept is more reliable than the traditional methods relying only on hydraulic models [64], where the AHP method considers the most important factors affecting the risk of flooding. Therefore, seven factors were important in the selected watershed: elevation, slope, topographic wetness index (TWI), drainage density, rainfall, soil, and land use/land cover. The weighted factors for mapping vulnerability using the AHP were 22.87%, 20.98%, 24.07%, 6.13%, 9.34%, 10.31%, and 6.3%, respectively. This indicates that the topography controls hydrological processes, taking a high weight percentage compared to the other significant factors.
The obtained results from the developed model were verified with the flood event that occurred in November 2018 and the HEC-RAS model’s output. The model captured more than 70% of the observed flooded area, resulting in the very good identification of the areas affected by the flood event of November 2018. Moreover, the results from the developed model matched to a great extent with the inundation flood event obtained from HEC-RAS. An IDF curve for the study area, considering long rainfall records covering the last two decades, was developed, and the storm event for 100-year return periods was used in the hydrological model to obtain the corresponding peak flood. This was used in the HEC-RAS model to obtain reliable results for channel flow analysis and floodplain determination. This resulted in the generation of maps representing flood inundation depths at different flood frequencies or a return period of 100 years.
The findings of this research agree with Gigović et al. [36]. More specifically, the results obtained from their study showed that elevation has an essential function in determining the movements of the overflow route and the height of the water level. Moreover, Rimba et al. [50] showed that slope is an essential aspect in regulating the pace and duration of the flow of water, since flatter surface areas are more vulnerable to flooding than steeper areas. In comparison with some studies performed on similar watersheds in the region and the surroundings, Alarifi et al. [44] conducted a study in the southwest region of Saudi Arabia. They identified that elevation represents the highest weight of the ten selected factors. Elevation was the primary component that triggered flash floods, followed by the slope and rainfall. Another work conducted by Ogato et al. [43] in Ethiopia identified slope as the primary cause of flash floods. They also concluded that high TWI values indicate poor drainage, and the watershed can be more saturated and susceptible to flash floods.
Overall, flood risk maps benefit policymakers, competent authorities, and local inhabitants [43,65]. They can assist in determining appropriate flood risk reduction strategies in watersheds [43,60,63]. With flood risk mapping, it is easier to identify the risk locations. Additionally, with a systematic approach such as the AHP method, there will be consistency in selecting how and where to decrease urban expansion in the risk areas. The presence of several infrastructures and the development of urban areas along the floodplain area could increase the flood intensity. This is what occurred in the last decade in the study area. The results showed that urbanization also affects hydrological processes, decreasing infiltration into the groundwater and increasing runoff.
The findings of this study could help land-use developers and government authorities to implement effective flood control measures to eliminate hazards associated with flash flooding. Decisions on where to build settlement zones, dams, and other flood control structures can be made based on the developed flood risk map. The proposed model can help authorities to decide where to construct buildings and where not to allow the creation of new buildings in flood-prone locations. However, most urban areas in Wadi Al-Lith are at a high or extremely high risk of flooding. To reduce the impact of flooding on the area, diversion canals, contour trenching, or even dams should be built, especially after the dam failure that occurred in 2018. As a result of the coupling of the MCDM-AHP-GIS methodology in the study area, managers, planners, designers, hydrologists, and decision-makers have a helpful tool that can identify flood hazard areas and analyze the flood risk index, making it simpler to make choices to minimize the flood risk.
7. Conclusions
In this paper, a flood danger zone map was built by applying the AHP method based on the GIS methodology for the Al-Lith watershed in Saudi Arabia. Seven parameters were evaluated in this study based on the topography, climate, soil, and land use data. Multi-criteria analysis was identified as necessary for risk analysis, especially when data are lacking. After calculating the weights, the final flooding hazard map was obtained using the ArcGIS software. Elevation, slope, and flash floods in the research region were triggered or produced mostly by TWI.
At the watershed scale, the northern part is less prone to floods. The southern part of the watershed, where urban areas are located, is very susceptible to floods due to the existence of flat and impervious areas. Specifically, the model results show the flooding hazard in the watershed, wherein 12.71%, 23.15%, 26.85%, 24.23%, and 13.06% of the watershed can be described as very high, high, moderate, low, and very low flooding risk zones, respectively. The model results were validated and compared with the flood that happened on November 23, 2018. Moreover, it was compared with the flood probability map of the 100-year return period, which was performed using HEC-RAS.
At the 100-year return period, runoff water flooded the downstream region (southern part of the watershed). This simulation indicates that most of the Al-Lith City region was exposed to the flood. Moreover, the results confirmed the flood event that happened on November 23, 2018. The current analysis showed specific sites where the flood risk was high or low. This will be very important to help decision-makers in flood planning and mitigation. AHP, coupled with GIS, can effectively handle complex challenges within large areas. AHP may be utilized as an alternate approach for creating flood inundation for watersheds when combined with the GIS framework. For example, the Al-Lith study area has a scarcity and shortage of short-interval rainfall measurements and stream flow gauges. The proposed methodology can be used for flood disaster mitigation for other watersheds in Saudi Arabia.
The findings from this research can reduce the danger to the local community from flood disasters. The AHP method was used in this study to create flood hazard maps, which are crucial tools for community officials to communicate the risks of flooding and develop emergency mitigation and readiness strategies for various target groups, particularly for residents of high-risk neighborhoods. The flood danger map created with the AHP and GIS matched the yearly maximum rainfall in the region from 1987 to 2018 and the past flood event in 2018, which was the most significant flood in the area.
The technical limitations of the AHP method are its output, which should be validated using flood events that have occurred in different years and represent the whole specified watershed. The percentage of the weighted factors is not constant; they vary from one watershed to another. Additionally, the risk zones are variable depending on the considered variables/factors and the hydrological characteristics of the watershed. The results of the AHP approach may be affected by the scarcity and shortage of short-interval rainfall measurements and stream flow gauges. As for the stated limitations, if the model can be validated with other models and observed flood events, it would be a good tool for the mapping and assessment of flood risk events.
Future research will analyze and identify the most influential components, and the study will be expanded to include a full investigation of computing technologies, such as artificial neural networks (ANNs) and machine learning approaches, for the prediction of flood hazards in the watershed.
Author Contributions
Conceptualization, I.H.E., A.Q.K. and A.O.A.; methodology, I.H.E., A.Q.K. and A.O.A.; validation, I.H.E. and A.O.A.; formal analysis, A.Q.K.; investigation, I.H.E. and A.O.A.; data curation, A.O.A. and A.Q.K.; writing—original draft preparation, I.H.E., A.Q.K. and A.O.A.; writing—review and editing, I.H.E., A.Q.K. and A.O.A.; visualization, I.H.E., A.Q.K. and A.O.A. All authors have read and agreed to the published version of the manuscript.
Funding
This research was funded by the National Plan for Science, Technology and Innovation (MAARIFAH), King Abdulaziz City for Science and Technology, Kingdom of Saudi Arabia, Award Number (13-WAT1027-02).
Data Availability Statement
Not applicable.
Acknowledgments
The authors extend their sincere appreciation to the National Plan for Science, Technology and Innovation (NPST), King Saud University, for funding the research project (13-WAT1027-02).
Conflicts of Interest
The authors declare no conflict of interest.
References
- Khosravi, K.; Nohani, E.; Maroufinia, E.; Pourghasemi, H.R. A GIS-Based Flood Susceptibility Assessment and Its Mapping in Iran: A Comparison between Frequency Ratio and Weights-of-Evidence Bivariate Statistical Models with Multi-Criteria Decision-Making Technique. Nat. Hazards 2016, 83, 947–987. [Google Scholar] [CrossRef]
- Sahana, M.; Sajjad, H. Vulnerability to Storm Surge Flood Using Remote Sensing and GIS Techniques: A Study on Sundarban Biosphere Reserve, India. Remote Sens. Appl. Soc. Environ. 2019, 13, 106–120. [Google Scholar] [CrossRef]
- Chan, S.W.; Abid, S.K.; Sulaiman, N.; Nazir, U.; Azam, K. A Systematic Review of the Flood Vulnerability Using Geographic Information System. Heliyon 2022, 8, e09075. [Google Scholar] [CrossRef] [PubMed]
- Wahlstrom, M.; Guha-Sapir, D. The Human Cost of Weather-Related Disasters 1995–2015; UNISDR: Geneva, Switzerland, 2015. [Google Scholar]
- Kourgialas, N.N.; Karatzas, G.P. Flood Management and a GIS Modelling Method to Assess Flood-Hazard Areas—A Case Study. Hydrol. Sci. J. 2011, 56, 212–225. [Google Scholar] [CrossRef]
- Seenirajan, M.; Natarajan, M.; Thangaraj, R.; Bagyaraj, M. Study and Analysis of Chennai Flood 2015 Using GIS and Multicriteria Technique. J. Geogr. Inf. Syst. 2017, 9, 126–140. [Google Scholar] [CrossRef] [Green Version]
- Shreevastav, B.B.; Tiwari, K.R.; Mandal, R.A.; Nepal, A. Assessing Flood Vulnerability on Livelihood of the Local Community: A Case from Southern Bagmati Corridor of Nepal. Prog. Disaster Sci. 2021, 12, 100199. [Google Scholar] [CrossRef]
- Abubakar, I.R.; Dano, U.L. Sustainable Urban Planning Strategies for Mitigating Climate Change in Saudi Arabia. Environ. Dev. Sustain. 2020, 22, 5129–5152. [Google Scholar] [CrossRef]
- Wwap, U. World Water Assessment Programme: The United Nations World Water Development Report 4: Managing Water under Uncertainty and Risk; UNESCO: Paris, France, 2012. [Google Scholar]
- Bekele, E.G.; Knapp, H.V. Watershed Modeling to Assessing Impacts of Potential Climate Change on Water Supply Availability. Water Resour. Manag. 2010, 24, 3299–3320. [Google Scholar] [CrossRef]
- Rabezanahary Tanteliniaina, M.F.; Rahaman, M.H.; Zhai, J. Assessment of the Future Impact of Climate Change on the Hydrology of the Mangoky River, Madagascar Using ANN and SWAT. Water 2021, 13, 1239. [Google Scholar] [CrossRef]
- Masson-Delmotte, V.; Zhai, P.; Pirani, A.; Connors, S.L.; Péan, C.; Berger, S.; Caud, N.; Chen, Y.; Goldfarb, L.; Gomis, M.I. Climate Change 2021: The Physical Science Basis; Contribution of working group, to the sixth assessment report of the intergovernmental panel on climate change; Cambridge University Press: Cambridge, UK, 2021; Volume 2. [Google Scholar]
- Chen, Y.; Wang, L.; Shi, X.; Zeng, C.; Wang, Y.; Wang, G.; Qiangba, C.; Yue, C.; Sun, Z.; Renzeng, O.; et al. Impact of Climate Change on the Hydrological Regimes of the Midstream Section of the Yarlung Tsangpo River Basin Based on SWAT Model. Water 2023, 15, 685. [Google Scholar] [CrossRef]
- Alfieri, L.; Burek, P.; Feyen, L.; Forzieri, G. Global Warming Increases the Frequency of River Floods in Europe. Hydrol. Earth Syst. Sci. 2015, 19, 2247–2260. [Google Scholar] [CrossRef] [Green Version]
- Arnell, N.W.; Gosling, S.N. The Impacts of Climate Change on River Flood Risk at the Global Scale. Clim. Change 2016, 134, 387–401. [Google Scholar] [CrossRef] [Green Version]
- Alfieri, L.; Bisselink, B.; Dottori, F.; Naumann, G.; de Roo, A.; Salamon, P.; Wyser, K.; Feyen, L. Global Projections of River Flood Risk in a Warmer World: River flood risk in a warmer world. Earths Future 2017, 5, 171–182. [Google Scholar] [CrossRef]
- Shustikova, I.; Domeneghetti, A.; Neal, J.C.; Bates, P.; Castellarin, A. Comparing 2D Capabilities of HEC-RAS and LISFLOOD-FP on Complex Topography. Hydrol. Sci. J. 2019, 64, 1769–1782. [Google Scholar] [CrossRef]
- Watson, V. Who Will Plan Africa’s Cities? Africa Research Institute: London, UK, 2013. [Google Scholar]
- Saha, A.K.; Agrawal, S. Mapping and Assessment of Flood Risk in Prayagraj District, India: A GIS and Remote Sensing Study. Nanotechnol. Environ. Eng. 2020, 5, 11. [Google Scholar] [CrossRef]
- Saharia, M.; Kirstetter, P.-E.; Vergara, H.; Gourley, J.J.; Hong, Y.; Giroud, M. Mapping Flash Flood Severity in the United States. J. Hydrometeorol. 2017, 18, 397–411. [Google Scholar] [CrossRef]
- Trigo, R.M.; Ramos, C.; Pereira, S.S.; Ramos, A.M.; Zêzere, J.L.; Liberato, M.L.R. The Deadliest Storm of the 20th Century Striking Portugal: Flood Impacts and Atmospheric Circulation. J. Hydrol. 2016, 541, 597–610. [Google Scholar] [CrossRef]
- Jonkman, S.N. Global Perspectives on Loss of Human Life Caused by Floods. Nat. Hazards 2005, 34, 151–175. [Google Scholar] [CrossRef]
- Peel, M.C.; Finlayson, B.L.; McMahon, T.A. Updated World Map of the Köppen-Geiger Climate Classification. Hydrol. Earth Syst. Sci. 2007, 11, 1633–1644. [Google Scholar] [CrossRef] [Green Version]
- Youssef, A.M.; Abu-Abdullah, M.M.; AlFadail, E.A.; Skilodimou, H.D.; Bathrellos, G.D. The Devastating Flood in the Arid Region a Consequence of Rainfall and Dam Failure: Case Study, Al-Lith Flood on 23th November 2018, Kingdom of Saudi Arabia. Z. Für Geomorphol. 2021, 63, 115–136. [Google Scholar] [CrossRef]
- Youssef, A.M.; Pradhan, B.; Sefry, S.A. Flash Flood Susceptibility Assessment in Jeddah City (Kingdom of Saudi Arabia) Using Bivariate and Multivariate Statistical Models. Environ. Earth Sci. 2015, 75, 12. [Google Scholar] [CrossRef]
- Hijji, M.; Amin, S.; Iqbal, R.; Harrop, W. A Critical Evaluation of the Rational Need for an IT Management System for Flash Flood Events in Jeddah, Saudi Arabia. In Proceedings of the 2013 Sixth International Conference on Developments in eSystems Engineering, Sharjah, United Arab Emirates, 7–10 December 2013; pp. 209–214. [Google Scholar]
- Elquliti, S.; Alfalatah, S.; Alghamdi, M.; Alabdali, Y.; Alrowaily, A. Impact Analysis for Flooding AREA, In Saudi Arabia. Int. J. Sci. Tech. Res. Eng. 2016, 1, 200–220. [Google Scholar]
- Alrehaili, N. An Investigation into Emergency Planning Requirements and Challenges of Disaster Management in the Kingdom of Saudi Arabia. Int. J. Disaster Manag. 2021, 4, 1–10. [Google Scholar] [CrossRef]
- Elkarim, A.A. Intergration remote sensing and hydrologic, hydroulic modelling on assessment flood risk and mitigation: Al-lith city, ksa. Int. J. GEOMATE 2020, 18, 252–280. [Google Scholar] [CrossRef]
- De Risi, R.; Jalayer, F.; De Paola, F.; Carozza, S.; Yonas, N.; Giugni, M.; Gasparini, P. From Flood Risk Mapping toward Reducing Vulnerability: The Case of Addis Ababa. Nat. Hazards 2020, 100, 387–415. [Google Scholar] [CrossRef] [Green Version]
- Mishra, K.; Sinha, R. Flood Risk Assessment in the Kosi Megafan Using Multi-Criteria Decision Analysis: A Hydro-Geomorphic Approach. Geomorphology 2020, 350, 106861. [Google Scholar] [CrossRef]
- Vahidnia, M.H.; Alesheikh, A.A.; Alimohammadi, A. Hospital Site Selection Using Fuzzy AHP and Its Derivatives. J. Environ. Manage. 2009, 90, 3048–3056. [Google Scholar] [CrossRef]
- Rajasekhar, M.; Sudarsana Raju, G.; Sreenivasulu, Y.; Siddi Raju, R. Delineation of Groundwater Potential Zones in Semi-Arid Region of Jilledubanderu River Basin, Anantapur District, Andhra Pradesh, India Using Fuzzy Logic, AHP and Integrated Fuzzy-AHP Approaches. HydroResearch 2019, 2, 97–108. [Google Scholar] [CrossRef]
- Siddayao, G.; Valdez, S.; Fernandez, P. Analytic Hierarchy Process (AHP) in Spatial Modeling for Floodplain Risk Assessment. Int. J. Mach. Learn. Comput. 2014, 4, 450–457. [Google Scholar] [CrossRef]
- Kazakis, N.; Kougias, I.; Patsialis, T. Assessment of Flood Hazard Areas at a Regional Scale Using an Index-Based Approach and Analytical Hierarchy Process: Application in Rhodope–Evros Region, Greece. Sci. Total Environ. 2015, 538, 555–563. [Google Scholar] [CrossRef]
- Gigović, L.; Pamučar, D.; Bajić, Z.; Drobnjak, S. Application of GIS-Interval Rough AHP Methodology for Flood Hazard Mapping in Urban Areas. Water 2017, 9, 360. [Google Scholar] [CrossRef] [Green Version]
- Wang, Y.; Hong, H.; Chen, W.; Li, S.; Pamučar, D.; Gigović, L.; Drobnjak, S.; Tien Bui, D.; Duan, H. A Hybrid GIS Multi-Criteria Decision-Making Method for Flood Susceptibility Mapping at Shangyou, China. Remote Sens. 2019, 11, 62. [Google Scholar] [CrossRef] [Green Version]
- Tripathi, A.K.; Agrawal, S.; Gupta, R.D. Cloud Enabled SDI Architecture: A Review. Earth Sci. Inform. 2020, 13, 211–231. [Google Scholar] [CrossRef]
- Duan, H.-F.; Gao, X. Flooding Control and Hydro-Energy Assessment for Urban Stormwater Drainage Systems under Climate Change: Framework Development and Case Study. Water Resour. Manag. 2019, 33, 3523–3545. [Google Scholar] [CrossRef]
- Li, F.; Yan, X.-F.; Duan, H.-F. Sustainable Design of Urban Stormwater Drainage Systems by Implementing Detention Tank and LID Measures for Flooding Risk Control and Water Quality Management. Water Resour. Manag. 2019, 33, 3271–3288. [Google Scholar] [CrossRef]
- Feng, W.; Shao, Z.; Gong, H.; Xu, L.; Yost, S.A.; Ma, H.; Chai, H. Experimental and Numerical Investigation of Flow Distribution Pattern at a T-Shape Roadway Crossing under Extreme Storms. Eng. Appl. Comput. Fluid Mech. 2022, 16, 2286–2300. [Google Scholar] [CrossRef]
- Elsebaie, I.H.; El Alfy, M.; Kawara, A.Q. Spatiotemporal Variability of Intensity–Duration–Frequency (IDF) Curves in Arid Areas: Wadi AL-Lith, Saudi Arabia as a Case Study. Hydrology 2022, 9, 6. [Google Scholar] [CrossRef]
- Ogato, G.S.; Bantider, A.; Abebe, K.; Geneletti, D. Geographic Information System (GIS)-Based Multicriteria Analysis of Flooding Hazard and Risk in Ambo Town and Its Watershed, West Shoa Zone, Oromia Regional State, Ethiopia. J. Hydrol. Reg. Stud. 2020, 27, 100659. [Google Scholar] [CrossRef]
- Alarifi, S.S.; Abdelkareem, M.; Abdalla, F.; Alotaibi, M. Flash Flood Hazard Mapping Using Remote Sensing and GIS Techniques in Southwestern Saudi Arabia. Sustainability 2022, 14, 14145. [Google Scholar] [CrossRef]
- Radwan, F.; Alazba, A.A.; Mossad, A. Flood Risk Assessment and Mapping Using AHP in Arid and Semiarid Regions. Acta Geophys. 2019, 67, 215–229. [Google Scholar] [CrossRef]
- Almodayan, A. Analytical Hierarchy (AHP) Process Method for Environmental Hazard Mapping for Jeddah City, Saudi Arabia. J. Geosci. Environ. Prot. 2018, 06, 143–159. [Google Scholar] [CrossRef] [Green Version]
- Das, S. Geospatial Mapping of Flood Susceptibility and Hydro-Geomorphic Response to the Floods in Ulhas Basin, India. Remote Sens. Appl. Soc. Environ. 2019, 14, 60–74. [Google Scholar] [CrossRef]
- Liuzzo, L.; Sammartano, V.; Freni, G. Comparison between Different Distributed Methods for Flood Susceptibility Mapping. Water Resour. Manag. 2019, 33, 3155–3173. [Google Scholar] [CrossRef]
- Das, S. Geographic Information System and AHP-Based Flood Hazard Zonation of Vaitarna Basin, Maharashtra, India. Arab. J. Geosci. 2018, 11, 576. [Google Scholar] [CrossRef]
- Rimba, A.B.; Setiawati, M.D.; Sambah, A.B.; Miura, F. Physical Flood Vulnerability Mapping Applying Geospatial Techniques in Okazaki City, Aichi Prefecture, Japan. Urban Sci. 2017, 1, 7. [Google Scholar] [CrossRef] [Green Version]
- Wondim, Y.K. Flood Hazard and Risk Assessment Using GIS and Remote Sensing in Lower Awash Sub-Basin, Ethiopia. J. Environ. Earth Sci. 2016, 6, 69–86. [Google Scholar]
- Khosravi, K.; Melesse, A.M.; Shahabi, H.; Shirzadi, A.; Chapi, K.; Hong, H. Chapter 33—Flood Susceptibility Mapping at Ningdu Catchment, China Using Bivariate and Data Mining Techniques. In Extreme Hydrology and Climate Variability; Melesse, A.M., Abtew, W., Senay, G., Eds.; Elsevier: Amsterdam, The Netherlands, 2019; pp. 419–434. ISBN 978-0-12-815998-9. [Google Scholar]
- Santato, S.; Bender, S.; Schaller, M. The European Floods Directive and Opportunities Offered by Land Use Planning, CSC Report 12; Climate Service Center: Hamburg, Germany, 2013; 79p. [Google Scholar]
- Hall, J.; Arheimer, B.; Borga, M.; Brázdil, R.; Claps, P.; Kiss, A.; Kjeldsen, T.R.; Kriaučiūnienė, J.; Kundzewicz, Z.W.; Lang, M. Understanding Flood Regime Changes in Europe: A State-of-the-Art Assessment. Hydrol. Earth Syst. Sci. 2014, 18, 2735–2772. [Google Scholar] [CrossRef] [Green Version]
- Zhiyu, L.; Xiaotao, C.; Zuhua, C.; Haotao, W.; Li, Z.; Lai, E.S.; Kunitsugu, M.; Kim, Y.; Cheong, T.S.; Chung, G. Guidelines on Urban Flood Risk Management (UFRM); ESCAP/WMO Typhoon Committee: Macao, China, 2013. [Google Scholar]
- Ouma, Y.O.; Tateishi, R. Urban Flood Vulnerability and Risk Mapping Using Integrated Multi-Parametric AHP and GIS: Methodological Overview and Case Study Assessment. Water 2014, 6, 1515–1545. [Google Scholar] [CrossRef]
- Fura, G.D. Analysing and Modelling Urban Land Cover Change for Run-off Modelling in Kampala, Uganda. Master’s Thesis, University of Twente, Enschede, The Netherlands, 2013. [Google Scholar]
- Saaty, T.L. What Is the Analytic Hierarchy Process? In Mathematical Models for Decision Support; Mitra, G., Greenberg, H.J., Lootsma, F.A., Rijkaert, M.J., Zimmermann, H.J., Eds.; Springer: Berlin, Heidelberg, 1988; pp. 109–121. ISBN 978-3-642-83557-5. [Google Scholar]
- Chakraborty, S.; Mukhopadhyay, S. Assessing Flood Risk Using Analytical Hierarchy Process (AHP) and Geographical Information System (GIS): Application in Coochbehar District of West Bengal, India. Nat. Hazards 2019, 99, 247–274. [Google Scholar] [CrossRef]
- Dano, U.L. Flash Flood Impact Assessment in Jeddah City: An Analytic Hierarchy Process Approach. Hydrology 2020, 7, 10. [Google Scholar] [CrossRef] [Green Version]
- Tariq, A.; Yan, J.; Ghaffar, B.; Qin, S.; Mousa, B.G.; Sharifi, A.; Huq, M.E.; Aslam, M. Flash Flood Susceptibility Assessment and Zonation by Integrating Analytic Hierarchy Process and Frequency Ratio Model with Diverse Spatial Data. Water 2022, 14, 3069. [Google Scholar] [CrossRef]
- Ramkar, P.; Yadav, S.M. Flood Risk Index in Data-Scarce River Basins Using the AHP and GIS Approach. Nat. Hazards 2021, 109, 1119–1140. [Google Scholar] [CrossRef]
- Souissi, D.; Zouhri, L.; Hammami, S.; Msaddek, M.H.; Zghibi, A.; Dlala, M. GIS-Based MCDM—AHP Modeling for Flood Susceptibility Mapping of Arid Areas, Southeastern Tunisia. Geocarto Int. 2020, 35, 991–1017. [Google Scholar] [CrossRef]
- Kittipongvises, S.; Phetrak, A.; Rattanapun, P.; Brundiers, K.; Buizer, J.L.; Melnick, R. AHP-GIS Analysis for Flood Hazard Assessment of the Communities Nearby the World Heritage Site on Ayutthaya Island, Thailand. Int. J. Disaster Risk Reduct. 2020, 48, 101612. [Google Scholar] [CrossRef]
- Dano, U.L. An AHP-Based Assessment of Flood Triggering Factors to Enhance Resiliency in Dammam, Saudi Arabia. GeoJournal 2022, 87, 1945–1960. [Google Scholar] [CrossRef]
Figure 1.
Floods in Al-Lith City on 25 November 2018 [27].
Figure 1.
Floods in Al-Lith City on 25 November 2018 [27].

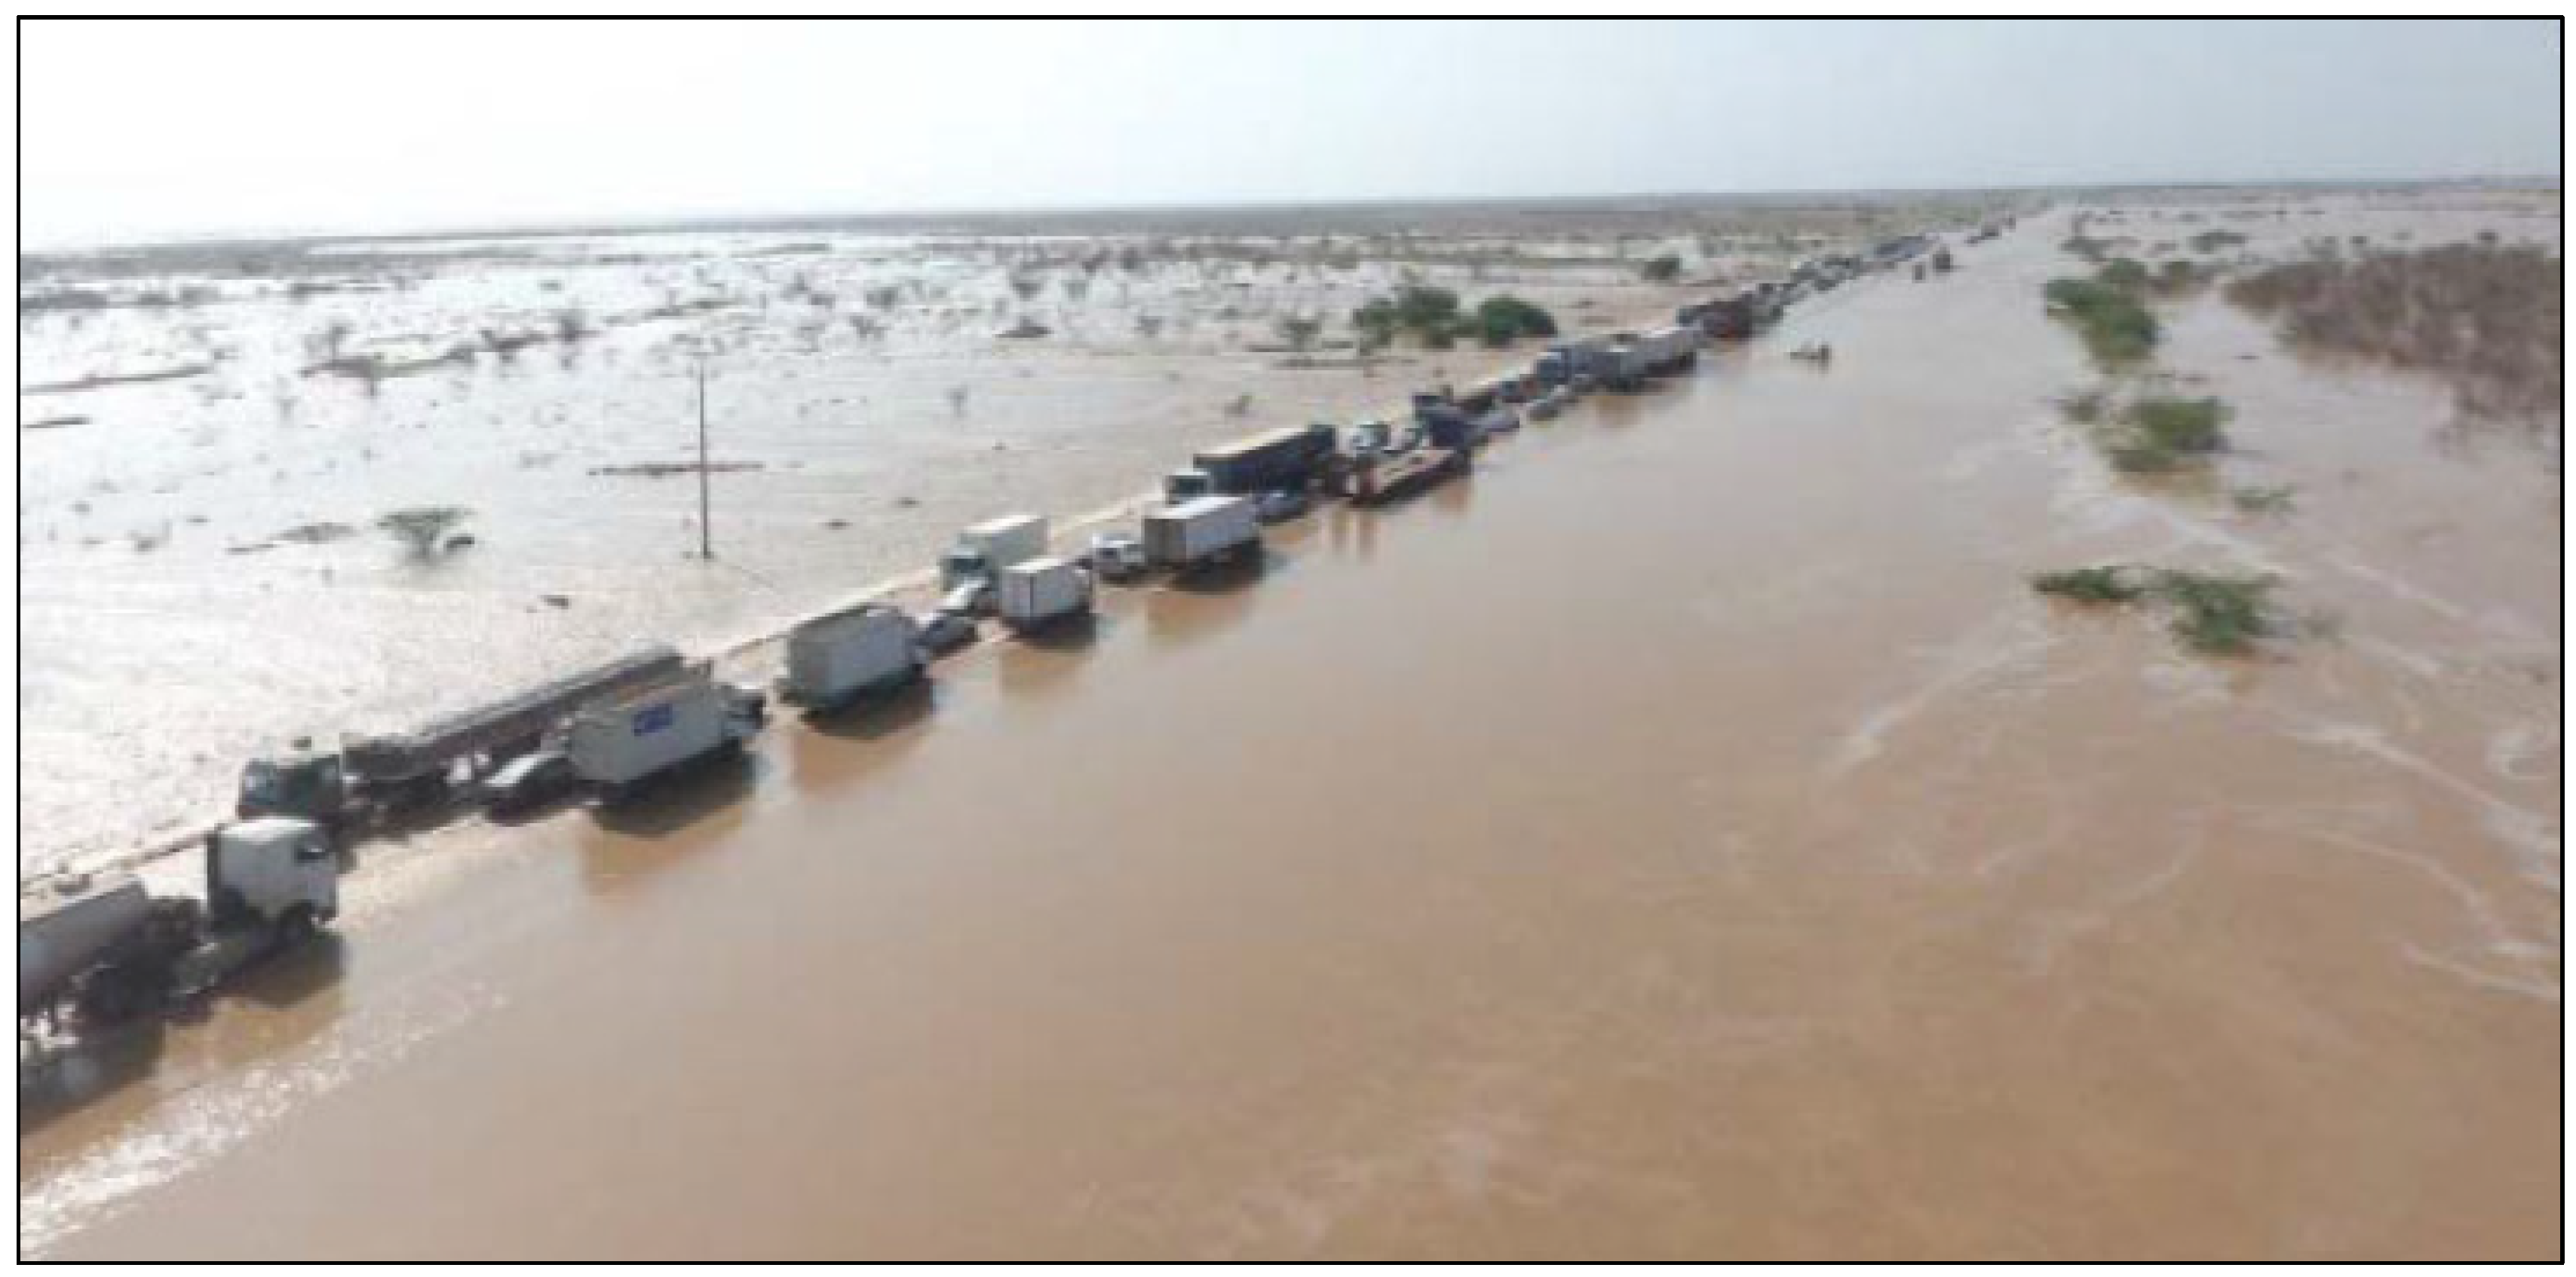
Figure 2.
International Jizan–Jeddah road under the flooding of the Wadi Al-Lith [29].
Figure 2.
International Jizan–Jeddah road under the flooding of the Wadi Al-Lith [29].

Figure 3.
Location of study area and digital elevation model of Wadi Al-Lith [42].
Figure 3.
Location of study area and digital elevation model of Wadi Al-Lith [42].

Figure 4.
Flow chart of the methodology in the present study.

Figure 5.
Flood hazard factors: (a) elevation; (b) slope; (c) drainage density; (d) topographic wetness index (TWI).
Figure 5.
Flood hazard factors: (a) elevation; (b) slope; (c) drainage density; (d) topographic wetness index (TWI).

Figure 6.
Flood hazard factors: (a) rainfall (average maximum daily values); (b) soil; (c) land use data.
Figure 6.
Flood hazard factors: (a) rainfall (average maximum daily values); (b) soil; (c) land use data.

Figure 7.
Flooding hazard map of the watershed.

Figure 8.
Flood water velocity and depth map of the Al-Lith Valley Basin impacting Al-Lith City in 2018.
Figure 8.
Flood water velocity and depth map of the Al-Lith Valley Basin impacting Al-Lith City in 2018.

Figure 9.
Water runoff depth and velocity from a 2D HEC-RAS model with a 100-year return period.


Table 1.
Ranking of flood hazard contributing factors in the watershed.
| Flood Hazard Factors | Elevation | Slope | TWI | Soil | Drainage Density | Rainfall | LULC |
|---|---|---|---|---|---|---|---|
| Elevation | 1 | 1 | 1 | 4 | 3 | 3 | 3 |
| Slope | 1 | 1 | 1 | 5 | 1 | 3 | 3 |
| TWI | 1 | 1 | 1 | 7 | 3 | 1 | 5 |
| Soil | 0.25 | 0.20 | 0.14 | 1 | 1 | 1 | 1 |
| Drainage Density | 0.33 | 1.00 | 0.33 | 1 | 1 | 1 | 1 |
| Rainfall | 0.33 | 0.33 | 1.00 | 1 | 1 | 1 | 2 |
| LULC | 0.33 | 0.33 | 0.20 | 1 | 1 | 0.5 | 1 |
| Total | 4.25 | 4.87 | 4.68 | 20 | 11 | 10.5 | 16 |
Table 2.
Weighted comparison.
| Flood Hazard Factors | Elevation | Slope | TWI | Soil | Drainage Density | Rainfall | LULC | Priority Vector X | Percent (%) |
|---|---|---|---|---|---|---|---|---|---|
| Elevation | 0.24 | 0.21 | 0.21 | 0.20 | 0.27 | 0.29 | 0.19 | 0.229 | 22.9 |
| Slope | 0.24 | 0.21 | 0.21 | 0.25 | 0.09 | 0.29 | 0.19 | 0.21 | 21.0 |
| TWI | 0.24 | 0.21 | 0.21 | 0.35 | 0.27 | 0.10 | 0.31 | 0.241 | 24.1 |
| Soil | 0.06 | 0.04 | 0.03 | 0.05 | 0.09 | 0.10 | 0.06 | 0.061 | 6.1 |
| Drainage Density | 0.08 | 0.21 | 0.07 | 0.05 | 0.09 | 0.10 | 0.06 | 0.093 | 9.3 |
| Rainfall | 0.08 | 0.07 | 0.21 | 0.05 | 0.09 | 0.10 | 0.13 | 0.103 | 10.3 |
| LULC | 0.08 | 0.07 | 0.04 | 0.05 | 0.09 | 0.05 | 0.06 | 0.063 | 6.3 |
| Total | 1 | 1 | 1 | 1 | 1 | 1 | 1 | 1 | 100 |
Table 3.
Random index (RI) [58].
Table 3.
Random index (RI) [58].
| Number of Criteria (N) | 1 | 2 | 3 | 4 | 5 | 6 | 7 | 8 | 9 | 10 |
| Random Index (RI) | 0 | 0 | 0.58 | 0.9 | 1.12 | 1.24 | 1.32 | 1.41 | 1.45 | 1.49 |
Table 4.
Ranking of the watershed’s weighted flooding hazard.
| Parameters | Relative Weight (%) | Reclassified Parameter | Ranking | Hazard |
|---|---|---|---|---|
| Elevation | 22.87 | 2000–2700 | 1 | Very low |
| 1500–1900 | 2 | Low | ||
| 880–1400 | 3 | Moderate | ||
| 420–870 | 4 | High | ||
| −9.1–410 | 5 | Very high | ||
| Slope | 20.98 | 37–83 | 1 | Very low |
| 28–38 | 2 | Low | ||
| 19–27 | 3 | Moderate | ||
| 7.9–18 | 4 | High | ||
| 0–7.8 | 5 | Very high | ||
| TWI | 24.07 | 6.6–9 | 1 | Very low |
| 9.1–11 | 2 | Low | ||
| 12.0–14 | 3 | Moderate | ||
| 15–17 | 4 | High | ||
| 18–25 | 5 | Very high | ||
| Soil | 6.13 | |||
| Loam | 2 | Low | ||
| Sandy Loam | 3 | Moderate | ||
| Clay | 4 | High | ||
| Drainage Density | 9.34 | 0–0.52 | 1 | Very low |
| 0.52–1.2 | 2 | Low | ||
| 1.3–1.7 | 3 | Moderate | ||
| 1.8–2.1 | 4 | High | ||
| 2.2–2.9 | 5 | Very high | ||
| Rainfall | 10.31 | 14–27 | 1 | Very low |
| 28–35 | 2 | Low | ||
| 36–41 | 3 | Moderate | ||
| 42–47 | 4 | High | ||
| 48–55 | 5 | Very high | ||
| LULC | 6.30 | |||
| Bare land | 2 | Low | ||
| Farmland | 3 | Moderate | ||
| Mountains | 4 | High | ||
| Urban area | 5 | Very high |
Disclaimer/Publisher’s Note: The statements, opinions and data contained in all publications are solely those of the individual author(s) and contributor(s) and not of MDPI and/or the editor(s). MDPI and/or the editor(s) disclaim responsibility for any injury to people or property resulting from any ideas, methods, instructions or products referred to in the content. |
© 2023 by the authors. Licensee MDPI, Basel, Switzerland. This article is an open access article distributed under the terms and conditions of the Creative Commons Attribution (CC BY) license (https://creativecommons.org/licenses/by/4.0/).
Share and Cite
MDPI and ACS Style
Elsebaie, I.H.; Kawara, A.Q.; Alnahit, A.O. Mapping and Assessment of Flood Risk in the Wadi Al-Lith Basin, Saudi Arabia. Water 2023, 15, 902. https://doi.org/10.3390/w15050902
AMA Style
Elsebaie IH, Kawara AQ, Alnahit AO. Mapping and Assessment of Flood Risk in the Wadi Al-Lith Basin, Saudi Arabia. Water. 2023; 15(5):902. https://doi.org/10.3390/w15050902
Chicago/Turabian StyleElsebaie, Ibrahim H., Atef Q. Kawara, and Ali O. Alnahit. 2023. "Mapping and Assessment of Flood Risk in the Wadi Al-Lith Basin, Saudi Arabia" Water 15, no. 5: 902. https://doi.org/10.3390/w15050902
Note that from the first issue of 2016, this journal uses article numbers instead of page numbers. See further details here.