Article

Chinese Violet Cress (Orychophragmusviolaceus L.) Yield and Nitrogen Balance in Response to Coupling Effects of Water–Nitrogen Application—A Case Study Using 15N Tracing Technique

1
Nanjing Hydraulic Research Institute, Nanjing 210000, China
2
Jiangsu Provincial Water and Soil Conservation Ecological Environment Monitoring Station, Nanjing 210037, China
3
Jiangsu Coastal Development Group Co., Ltd., Nanjing 210036, China
4
Jiangsu Coastal Ecological Science and Technology Development Co., Ltd., Nanjing 210036, China
5
College of Environment, Hohai University, Nanjing 210098, China
6
College of Hydrology and Water Resources, Hohai University, Nanjing 210098, China
*
Authors to whom correspondence should be addressed.
Water 2023, 15(5), 904; https://doi.org/10.3390/w15050904
Submission received: 9 February 2023 / Revised: 22 February 2023 / Accepted: 23 February 2023 / Published: 26 February 2023
(This article belongs to the Special Issue Improved Irrigation Management Practices in Crop Production)

Abstract

:
The accurate and efficient management of water and nitrogen is of significance for the intensive production of field-cultivated flowers. To investigate the effects of different irrigation and nitrogen application modes on the growth, development, and nitrogen use of Orychophragmus violaceus, three nitrogen application doses of 120, 160, and 200 kg/ha and three irrigation treatments of 50 + 30 mm (overwintering water and regreening water), 75 + 45 mm, and 100 + 60 mm were implemented. The 15N isotope tracing technique was used to investigate the fertilizer nitrogen use, soil nitrogen residue, and nitrogen balance of Orychophragmus violaceus, and the entropy weight coefficient evaluation model was employed to optimize the water and nitrogen strategy. Results showed that after the application of water and nitrogen, the fresh yield of Orychophragmus violaceus increased by 21.4–49.3%, W2N3 possessed the most obvious effect on promoting yield increase, and the fresh yield reached 31.1 t/ha. The highest plant nitrogen use efficiency (39.1%) was detected in W2N2, but no significant (p > 0.05) difference of nitrogen use efficiency was found between W2N2 andW3N2. After the peak flowering period, 23.8–39.1% of the fertilizer nitrogen was absorbed by the plants, 44.3–59.2% remained in the soil, and 13.7–21.6% was lost via deep seepage, a gaseous state, or other unknown ways. A higher application amount of water or nitrogen increased the risk of nitrogen loss. Among the treatments, W2N2 treatment has the highest entropy weight coefficient evaluation value of 0.905, indicating that W2N2 was the water–nitrogen coupling mode with optimal comprehensive benefits. It was recommended that 75 mm of overwintering water and 45 mm of regreening water combined with a 160 kg/ha nitrogen application amount is the suitable water and nitrogen regulation scheme for Orychophragmus violaceus.

1. Introduction

China suffered from the excessive application of chemical fertilizers, especially nitrogen fertilizers. Although nitrogen fertilizers promoted stable crop production, they caused a series of problems such as soil environmental damage, ecological degradation, and non-point source pollution [1]. In recent years, the investigation on water and nitrogen coupling schemes has been conducted in rice [2,3], maize [4,5], grapes [6], tomato [7], celery [8], and other crops, and abundant results have been achieved. However, most water-and-nitrogen-related studies focused on food and cash crops; little attention has been paid to green manure plants and ornamental plants. In addition, previous studies commonly used nitrogen fertilizers without 15N labeling as the materials, which could not effectively distinguish whether the measured N was from the fertilizer or soil when analyzing the nitrogen utilization and residues [9]. Therefore, the fertilizer N distribution and its driving mechanisms were unclear, which in turn affected the scientific decision on irrigation and N application regimes.
Many studies believe that there may be coupling effects between water and nitrogen [10,11], since the accurate management of water and nitrogen is of great importance for sustainable agriculture [12,13]. Nitrogen application can promote root growth, which is conductive for the roots to grow continuously and distribute widely in the soil, seeking water and nutrients for their development. Previous studies have shown that nitrogen application can significantly increase the depth of root penetration [14,15]. Water can promote the mineralization of soil organic nitrogen and provide more effective nutrients for crops. An early study shows that there is a significant positive correlation between soil water content and nitrogen mineralization, which can be expressed by a linear model [16]. Some studies have shown that different water and nitrogen supplies may affect the root depth, root weight, and root–shoot ratio, thus affecting the plant utilization efficiency for water and nitrogen [17,18]. The impact of water and nitrogen on different plants is quite different, and the appropriate water and nitrogen schemes for different plants should also be different. Therefore, it is necessary to conduct research on the appropriate water–nitrogen coupling effect for specific plants.
Chinese violet cress (Orychophragmus violaceus) is a well-adapted field flower widely distributed in the USA, Netherlands, Israel, China, etc. It germinates in winter and flowers in spring with a long flowering period [19,20]. Chinese violet cress can be used as an ornamental plant and also as a green manure plant cultivated during the gap period of crop rotation. However, in past years, since Chinese violet cress cannot bring any direct economic value, the research on the scientific cultivation—in particular, the water and fertilizer management—of Chinese violet cress were ignored. In this study, we assume that different combined supplies of irrigation water and nitrogen fertilizer have different effects on the crop yield and nitrogen absorption of Chinese violet cress as well as the nitrogen balance in the soil–crop system, and there exists an optimal water–nitrogen fertilizer co-ordinated treatment, which is conducive to crop yield increase and nitrogen fertilizer efficiency improvement. Therefore, we designed different irrigation and nitrogen application schemes to investigate the fertilizer nitrogen uptake, soil nitrogen residue, and nitrogen balance of Chinese violet cress, and introduced the entropy weight coefficient evaluation model to (1) evaluate the biomass and nitrogen use of Chinese violet cress under different water–nitrogen treatments; (2) investigate the nitrogen balance in the soil–plant system as influenced by the water and nitrogen supply; and (3) preferably select the water and nitrogen scheme with a higher yield and nitrogen use efficiency of Chinese violet cress but lower nitrogen residue and loss. The research results were expected to provide a theoretical and practical basis for the scientific management of Chinese violet cress.

2. Materials and Methods

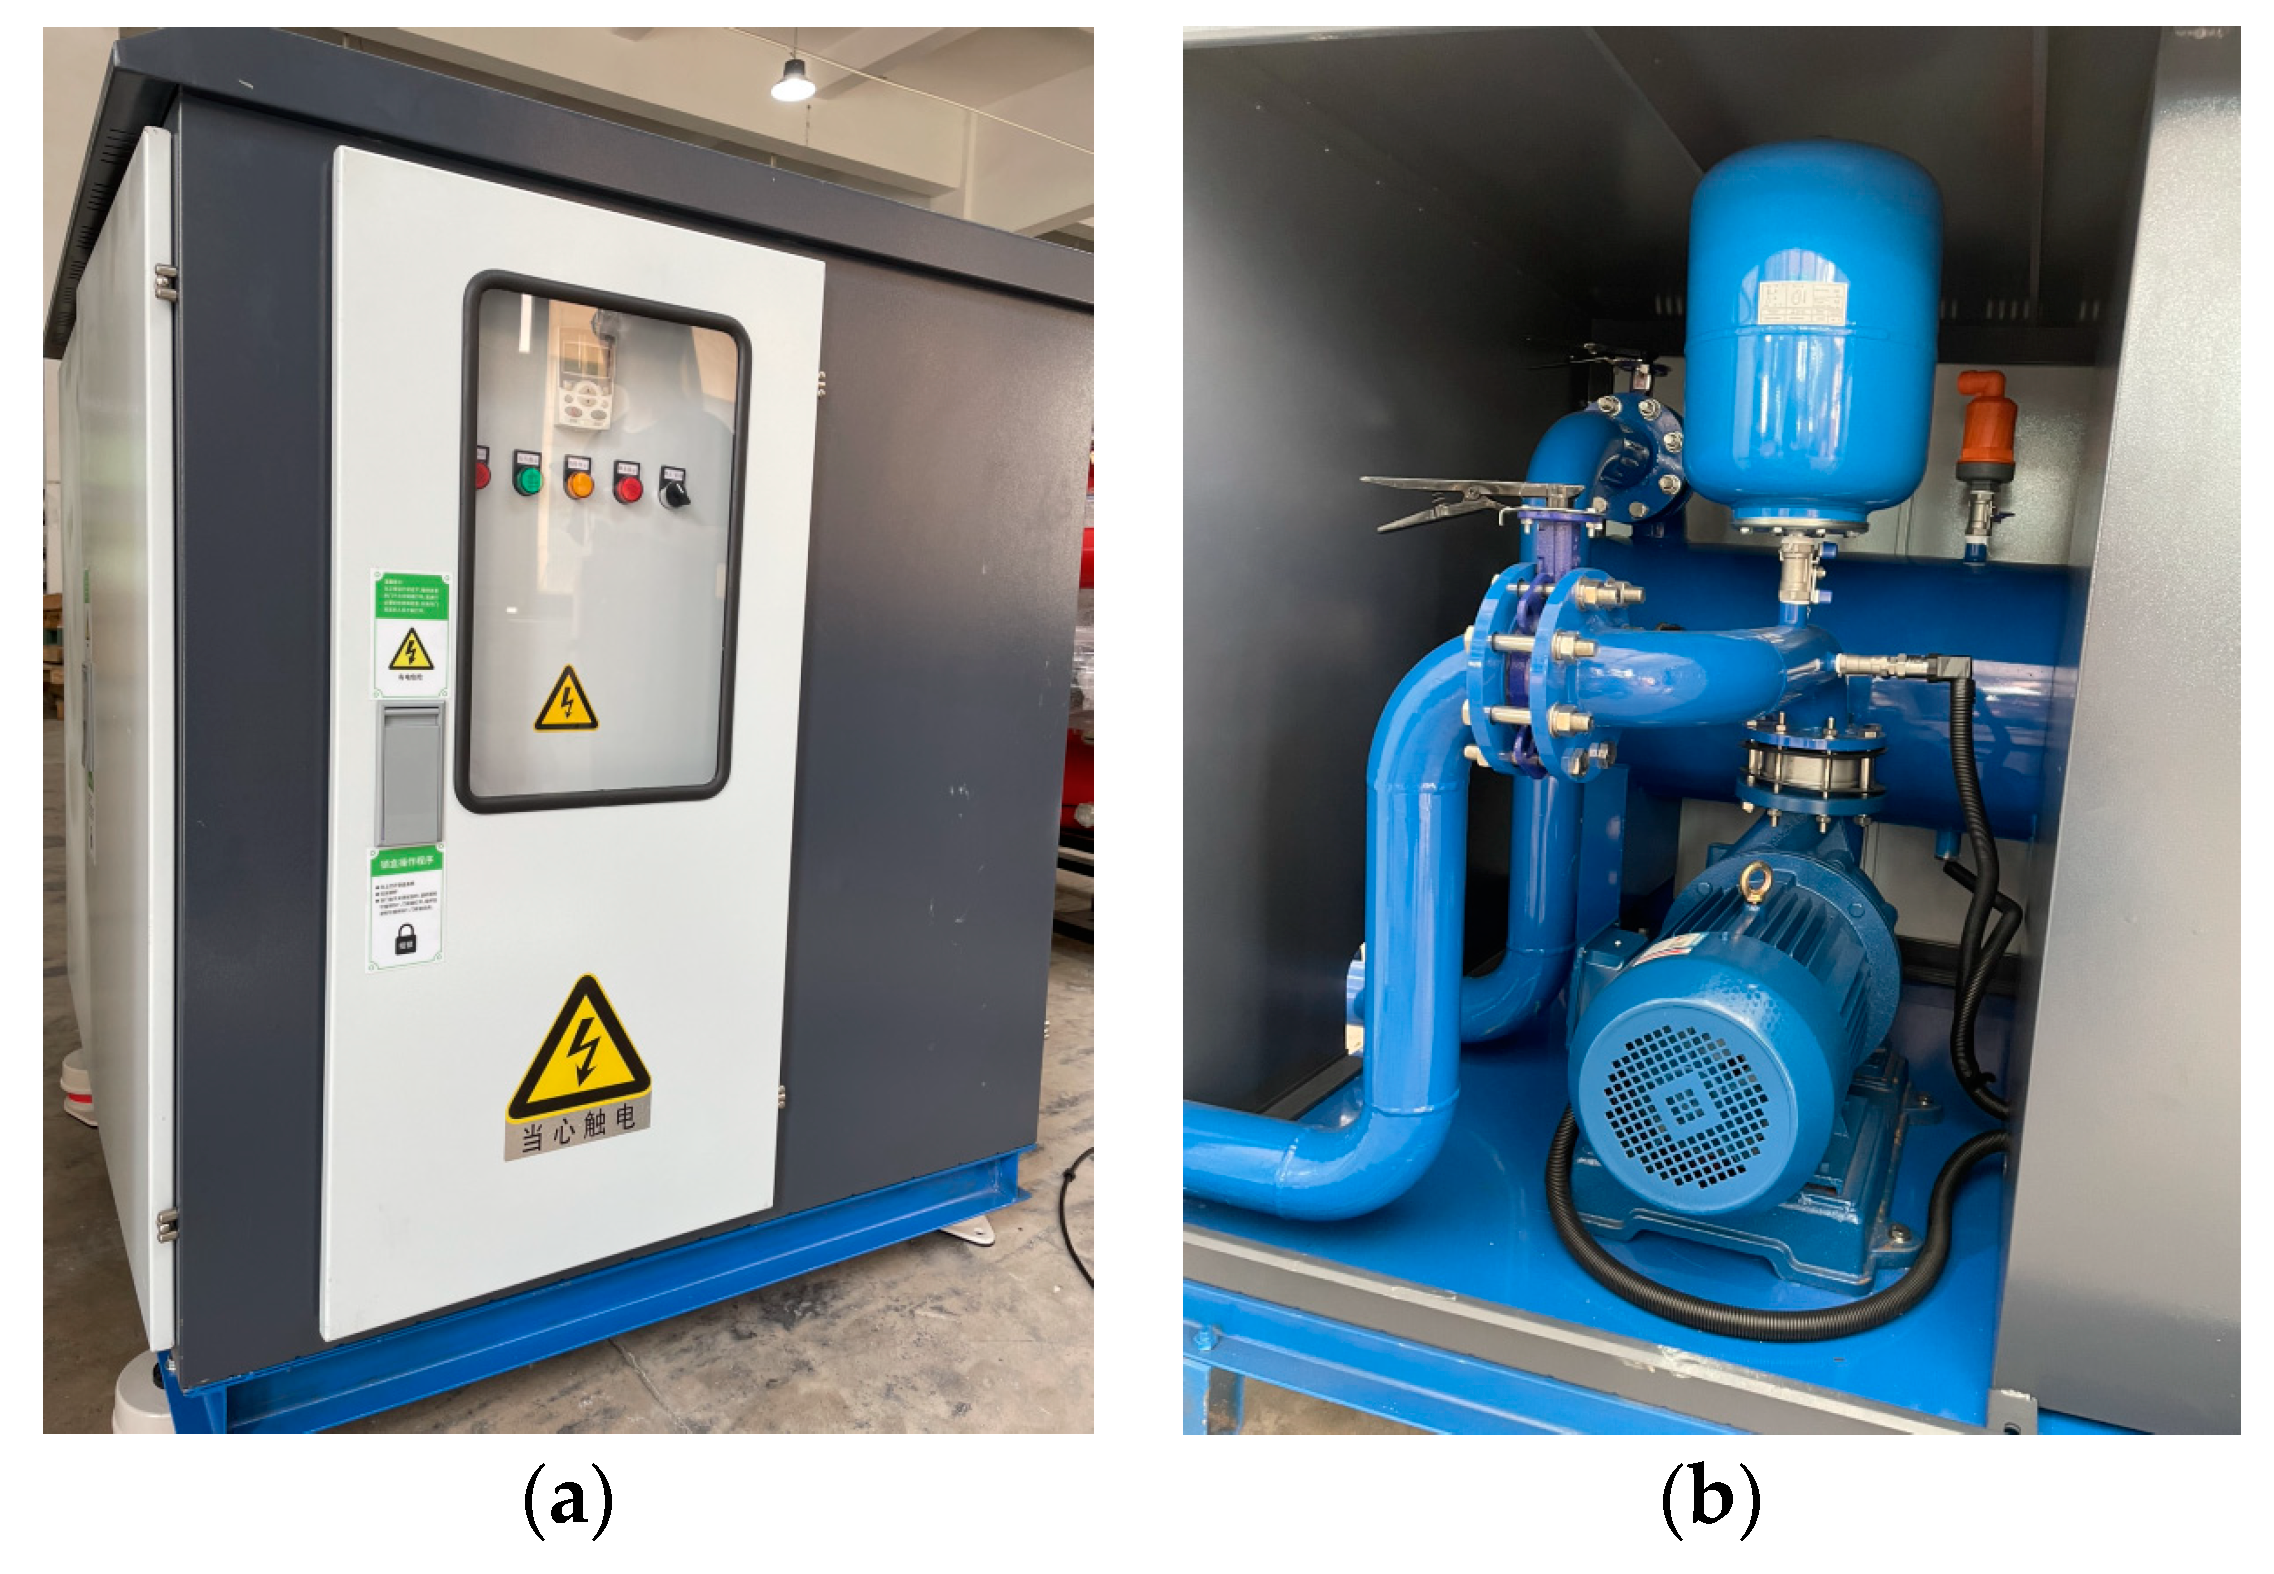
2.1. Experimental Site

The experiment was conducted from September 2020 to June 2021 at Tiaozini Reclamation Area, Dongtai City, Jiangsu Province. The experimental site is located at the junction of subtropical and warm temperate zone, with significant monsoon climate and abundant rainfall. It has four distinct seasons. The average rainfall from 2010 to 2020 is 1054.2 mm, and the sunshine duration is 2130.5 h. In recent years, the extreme maximum temperature is 38.6 °C, the extreme minimum temperature is −5.8 °C, and the mean air temperature is 23.6°C. The total rainfall during the whole experimental period was 255.5 mm, and the lowest rainfall occurred in February 2021, only 4.6 mm, and the highest was 68.2 mm in July 2021.
The soil properties were: total salt content of 3.6 g/kg, organic matter content of 2.2%, and available nitrogen, phosphorus, and potassium contents of 105.4 mg/kg, 7.9 mg/kg, and 98.4 mg/kg, respectively.

2.2. Experimental Design

Chinese violet cress was sown with rate of 6 g/m2 on 12 September 2020. The experiment contained three different irrigation rates and three nitrogen application rates, with no water and nitrogen supply as the control (CK), for a total of 10 treatments. Each treatment was replicated three times. The experimental site was not isolated from natural rainfall, and CK treatment did not accept additional irrigation water. During the experimental period, two times of irrigation (overwintering water and regreening water) were applied, on 15 December 2020 and 26 March 2021, respectively. Fertilizer varieties were urea (NH2CO2NH2), diammonium phosphate ((NH4)2·HPO4), and potassium sulfate (K2SO4) (produced by Stanley Fertilizer Inc., China). The amounts of diammonium phosphate (150 kg/ha) and potassium sulfate (120 kg/ha) were the same for each treatment, with 70% applied as basal fertilizer and 30% as topdressing fertilizer. The N application rates consisted of 120, 160, and 200 kg/ha and the irrigation rates consisted of 50 + 30 mm, 75 + 45 mm, and 100 + 60 mm, as shown in Table 1. The self-designed intelligent irrigation device was adopted for the irrigation (Figure 1a,b). This automatic irrigation device is connected to municipal water, so there is no filter. According to the system settings, it can automatically irrigate the plants without manual work.
The experiment was conducted using field block planting, with a single block area of 2 m × 2 m. Each treatment occupied three blocks, and the total experimental area covered an area of 120 m2. Different blocks were separated by 60 cm deep PVC panels to prevent lateral infiltration of water and fertilizer. A 0.5 m × 0.5 m micro-zone was set up in the center of each block, where the Chinese violet cresses were applied with the 15N-labeled urea (15NH2CO215NH2, abundance of 19.6%). Except for the use of 15N-labeled nitrogen fertilizer, other fertilization and irrigation measures as well as field management in the micro-zone were in line with that in the blocks.

2.3. Sampling and Measurement

Chinese violet cress biomass (fresh weight) (t/ha): At the end of the flowering period (27 May), samples of the whole Chinese violet cress plants were dug out from the micro-zone, the plant root was washed using clean water, and then the fresh weight of whole plant was measured.
Total nitrogen in plant or soil (%): After measurement of fresh weight, plant samples were placed into an oven at 70 °C temperature until they reached a constant weight. On 2 June, the soil samples in the profile of micro-zone were collected using a twist auger at each 10 cm a layer, to the depth of 80 cm, then the soil samples were placed in a ventilated room to dry naturally. The dried plant and soil samples were passed through 0.15 mm sieve, and the total N content was determined by Kjeldahl’s method after being dissolved with H2SO4-H2O2 [21].
15N atomic percentage excess (%): The 15N atomic percentage excess in plant or soil samples was determined by isotope mass spectrometry (Finniga-Mat-251, Mass-Spectrometers, Finnigan, Germany) [22].

2.4. Data Analysis

The nitrogen use efficiency (15NUE) of Chinese violet cress was calculated according to the equation [23]:
N dff = C s × E s E f
15 NUE = ( N dff M f ) × 100 %
where Ndff (kg/ha) is the fertilizer nitrogen uptake of Chinese violet cress, Cs (kg/ha) is the total nitrogen uptake of Chinese violet cress plants, Es (%) is the 15N atomic percent excess of Chinese violet cress plants, Ef (%) is the 15N abundance of the labeled nitrogen fertilizer, and Mf (kg/ha) is the total fertilizer nitrogen in the 15N-labeled nitrogen fertilizer.
Fertilizer nitrogen (15N) loss is calculated using the minusing method. The 15N loss is the difference between the total applied 15N and the residual 15N in the 0–80 cm soil layer plus the plant-absorbed 15N [16].
Data were analyzed using SPSS 17.0 software, and the significant differences among different treatments were calculated according to Duncan’s multiple range test [24].

3. Results

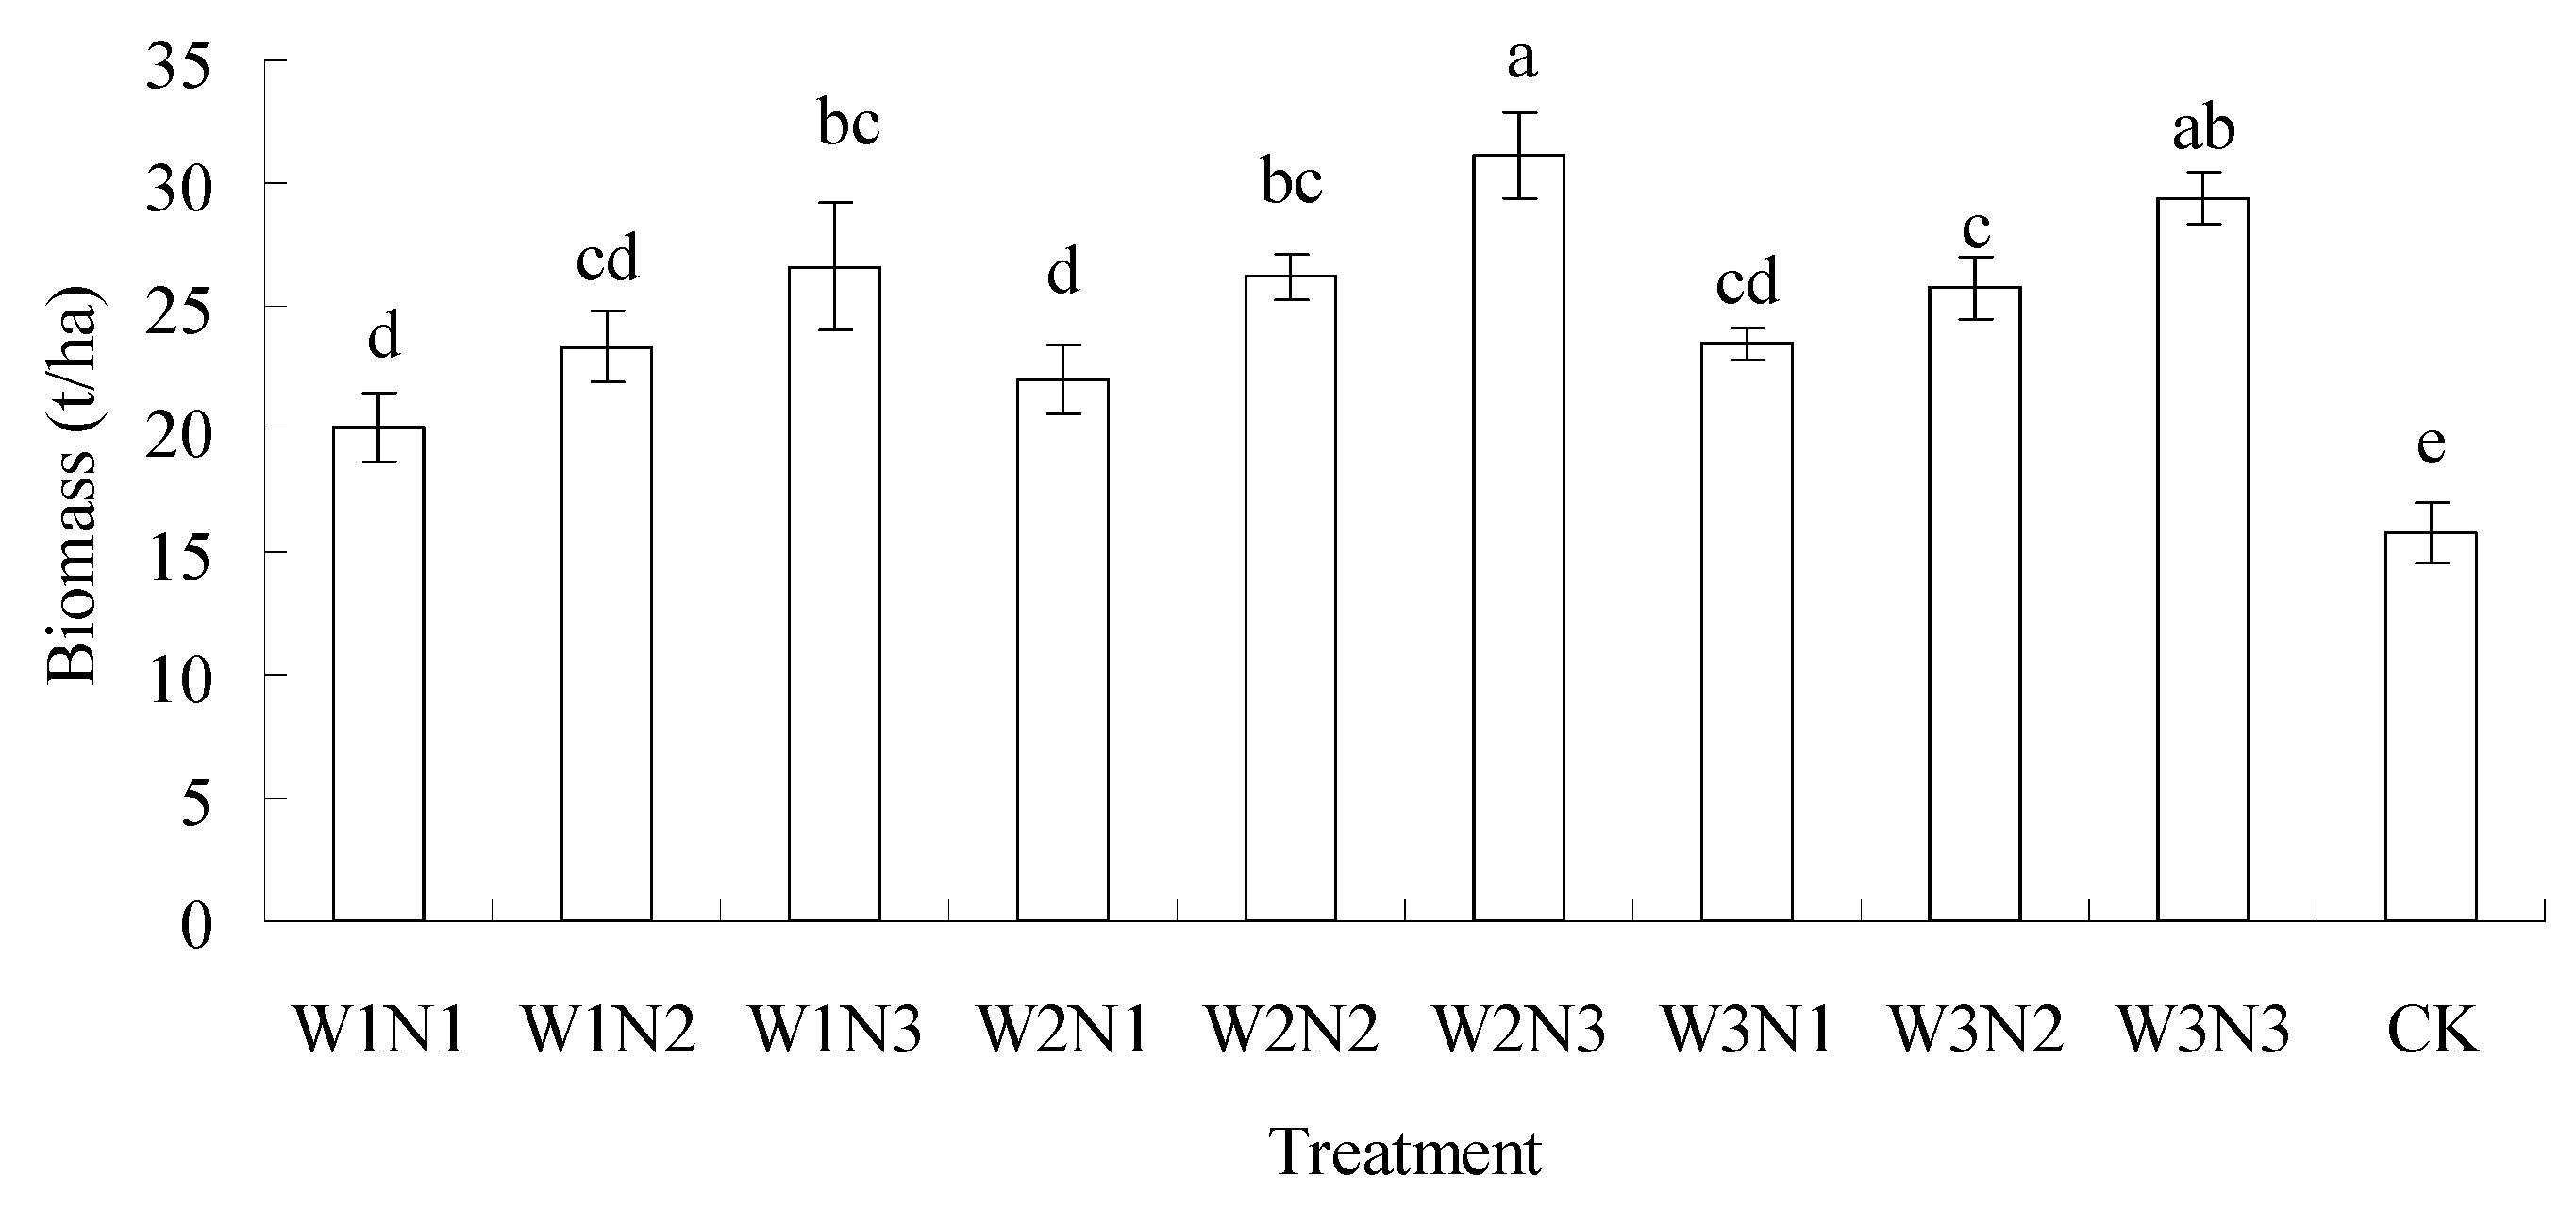
3.1. Biomass (Fresh Weight) Accumulation of Chinese Violet Cress

The effects of different water–nitrogen treatments on the biomass accumulation of Chinese violet cress were shown in Figure 2. The water–nitrogen treatments had a significant yield-promoting effect, and the fresh weight of Chinese violet cress increased by 21.4–49.3% for the different treatments compared to CK. The fresh weight of Chinese violet cress under W2N3 treatment was the highest, reaching 31.1 t/ha, which was not significantly (p > 0.05) different from that under W3N3. The fresh weight under W1N1 was the lowest, recorded as 20.1 t/ha. Under the same irrigation treatment, the fresh weight of Chinese violet cress was significantly and positively correlated with the applied nitrogen amount. Under the same nitrogen application amount, the fresh weight of Chinese violet cress in the W2 irrigation treatment was overall higher.

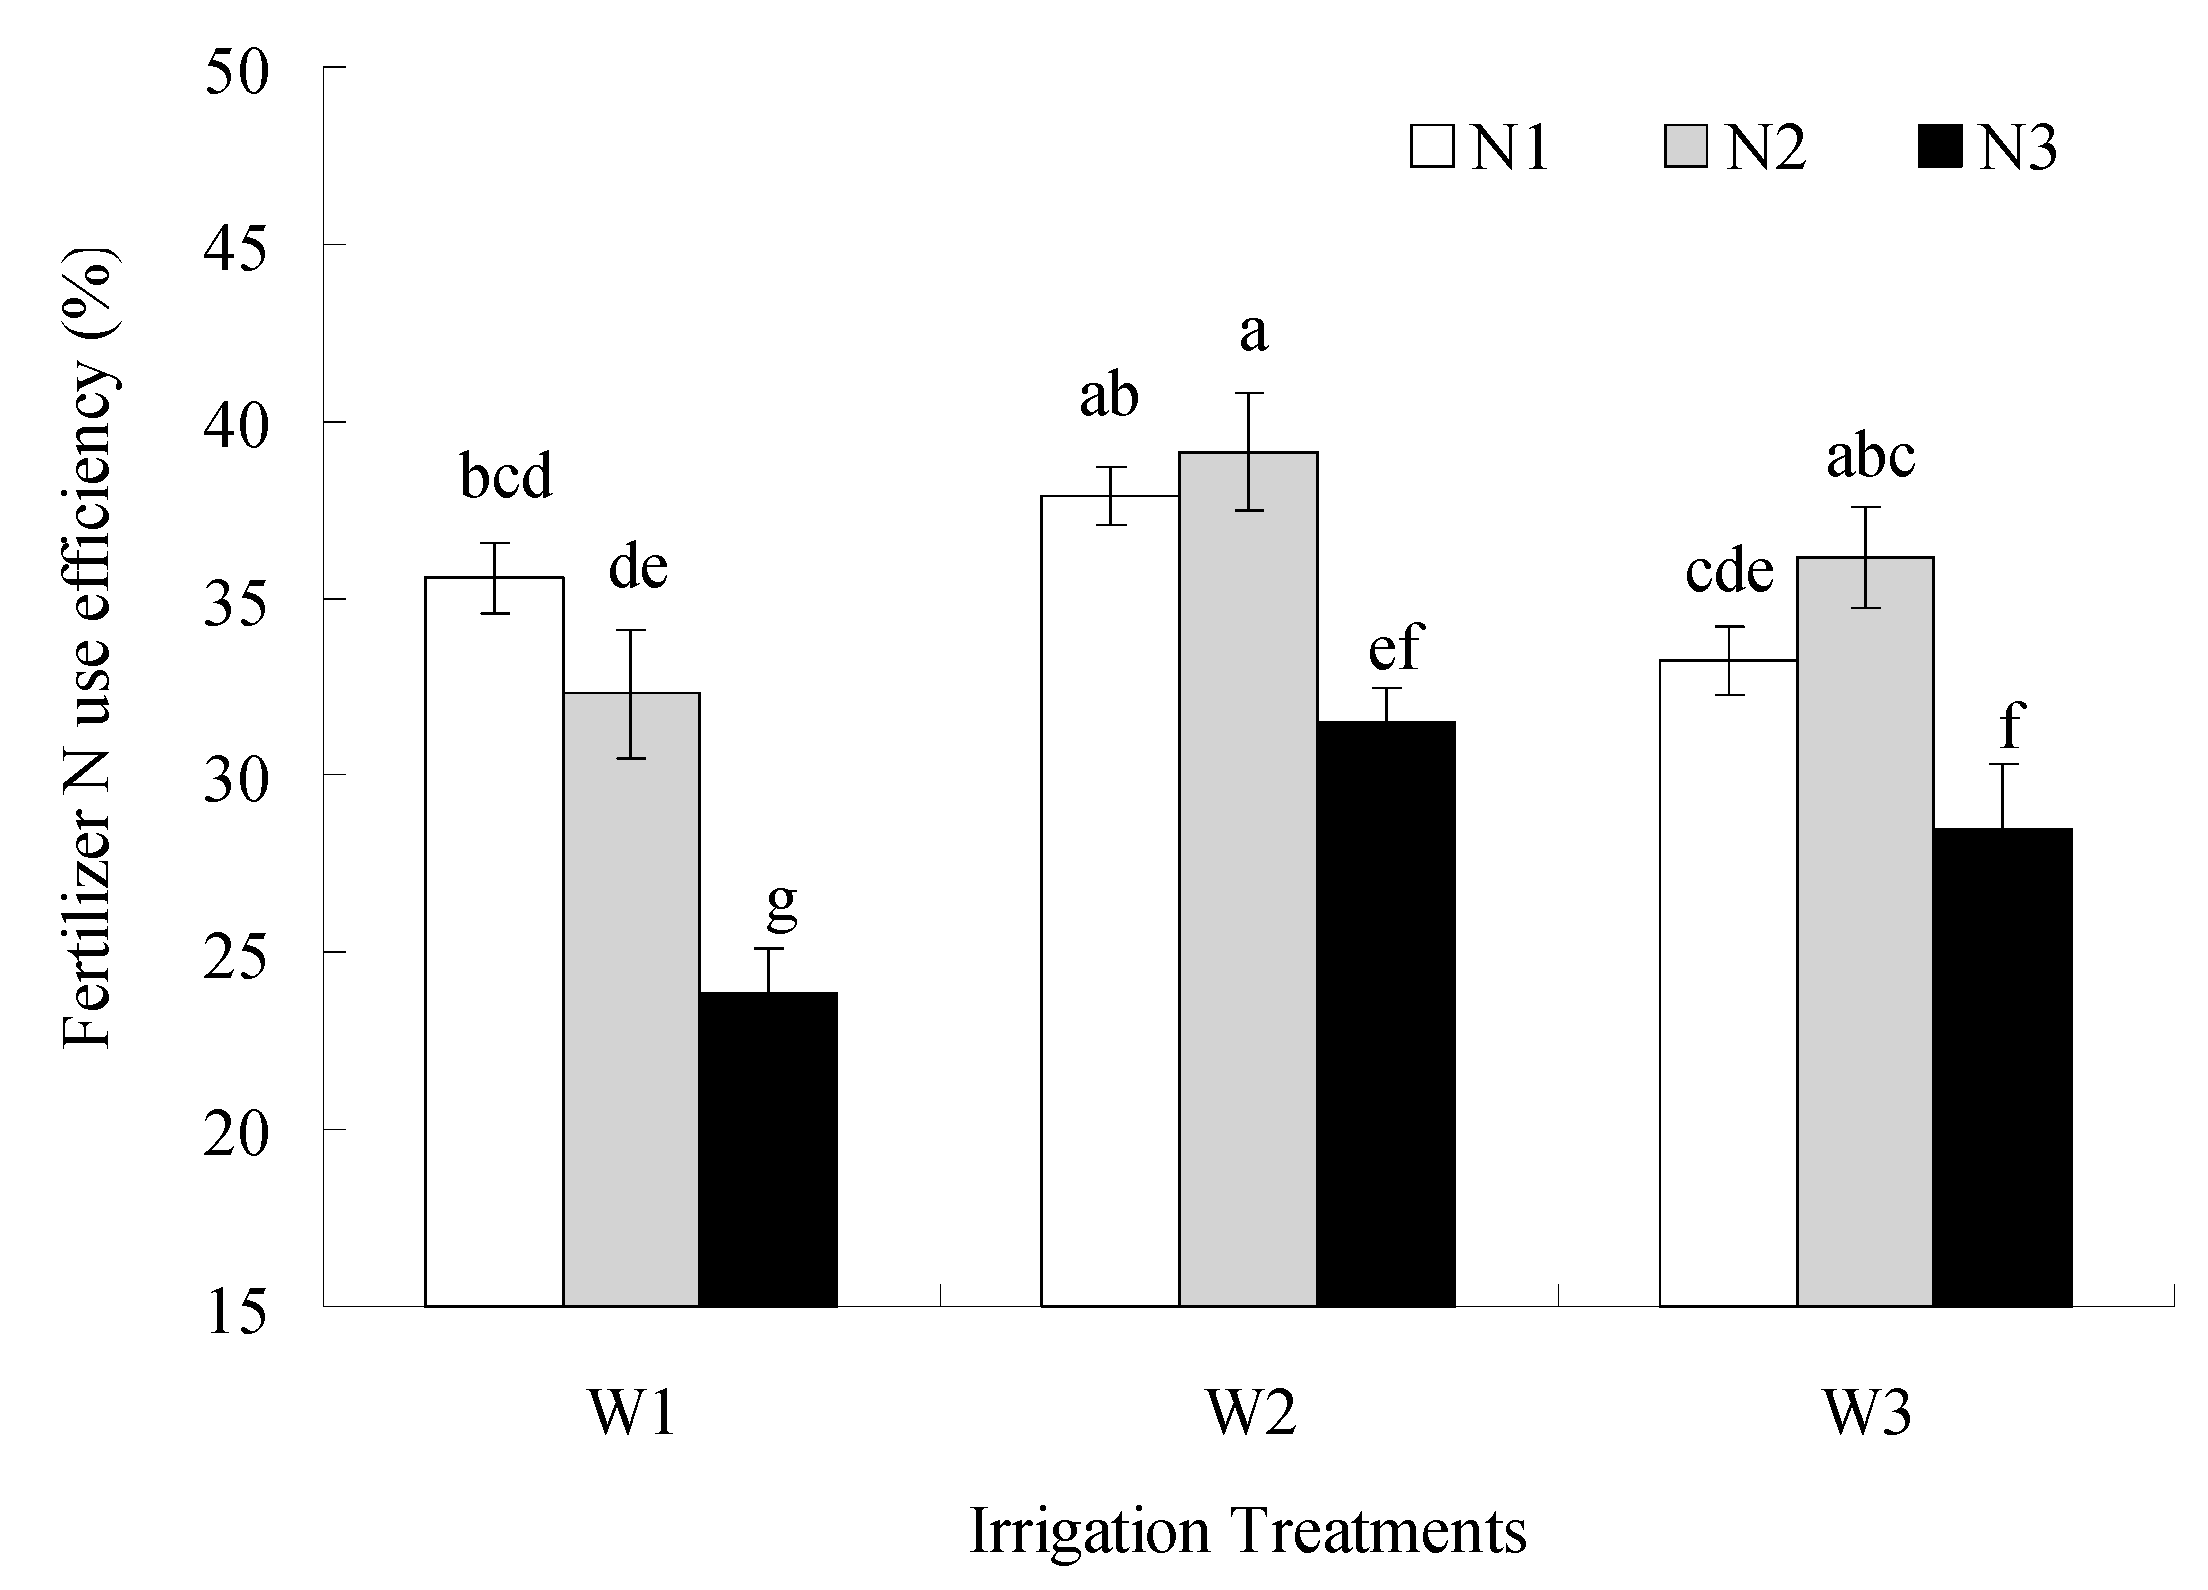
3.2. Fertilizer Nitrogen Use Efficiency of Chinese Violet Cress

The effect of different water–nitrogen treatments on the fertilizer nitrogen utilization efficiency of Chinese violet cress was displayed in Figure 3. The fertilizer nitrogen use efficiency of Chinese violet cress under different treatments ranged from 23.8 to 39.1%. The nitrogen use efficiency decreased when the nitrogen application rate was increased, and the decrease range was especially greater when the nitrogen application rate increased from 160 kg/ha to 200 kg/ha. Among the different treatments, the nitrogen use efficiency of W2N2 (39.1%) was the highest, but it was not significantly (p > 0.05) different from that of W3N2 (36.2%).

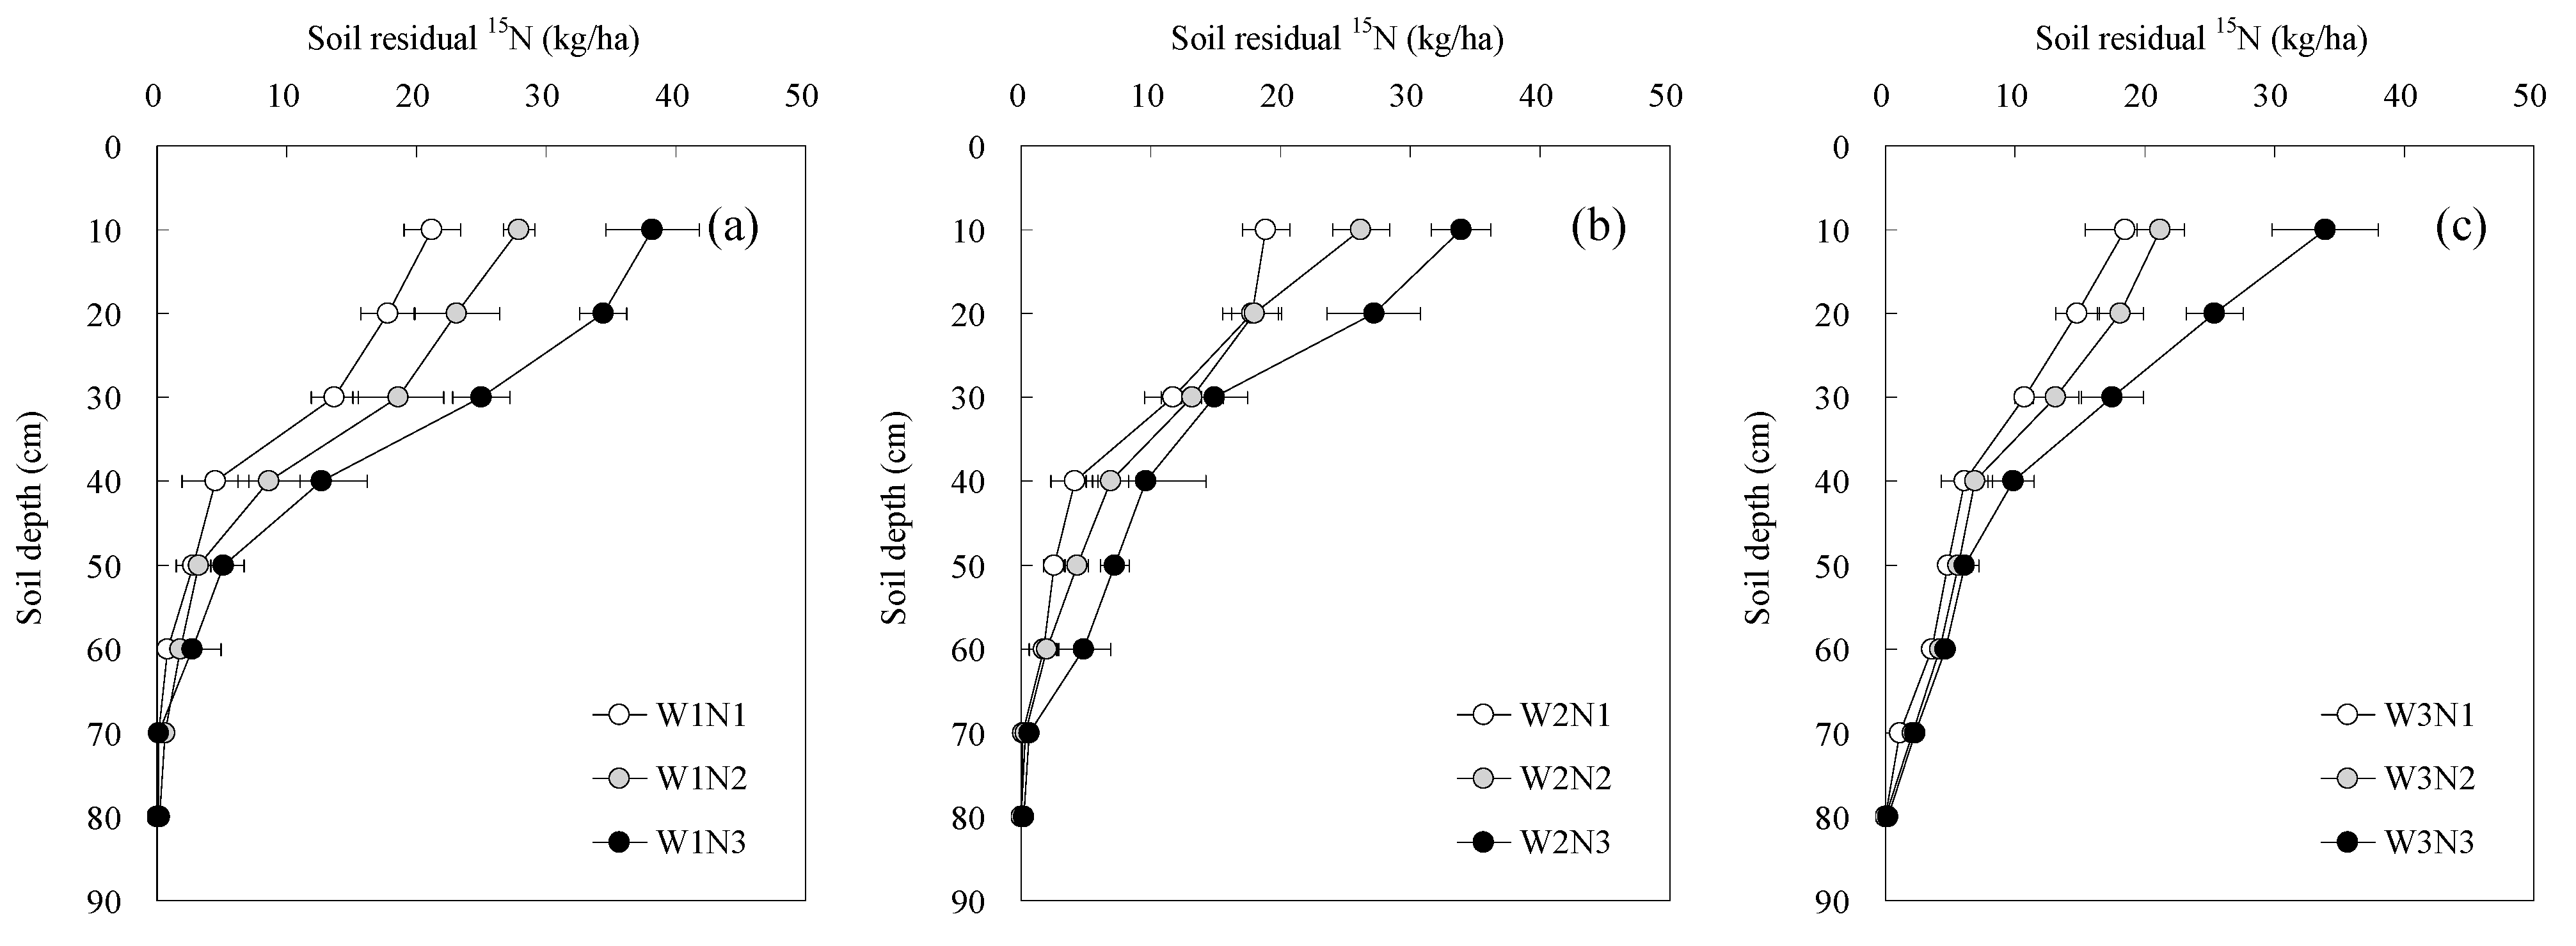
3.3. Distribution of Fertilizer Nitrogen in the Soil Profile

An obvious difference in the nitrogen distribution of the soil profiles was detected among the different treatments (Figure 4a–c), and this difference was more obvious in the 0–40 cm soil layer. However, the fertilizer nitrogen (15N) was almost undetectable in the 70 cm or below-70 cm soil layers. Under the same irrigation scheme, the increase in the N application rate significantly increased the soil fertilizer nitrogen residues. The nitrogen residues in the high nitrogen applied treatments W1N3, W2N3, and W3N3 reached 38.2, 33.6, and 33.9 kg/ha, respectively, which were visibly higher than those ofthe low N treatments (corresponding to W1N1, W2N1, and W3N1). On the contrary, under the same nitrogen application rate, the increase in the irrigation rate reduced the residual nitrogen amount in shallow soil, and this decrease was more obvious when the irrigation rate was increased from W1 to W2. When the irrigation amount increased from W1 to W2, the residual N amount in the 10 cm soil layer was reduced by 12.4%, 6.5%, and 12.7%, respectively, under the N1, N2, and N3 nitrogen applications.

3.4. Balance of Fertilizer Nitrogen

After the peak flowering period, 23.8–39.1% of the fertilizer nitrogen (15N) was absorbed by the Chinese violet cress plants, 44.3–59.2% was residual in the soil, and 13.7–21.6% was lost through deep seepage, a gaseous state, or other unknown pathways (Table 2). The total residual nitrogen amount was greater under a high nitrogen application treatment when the irrigation scheme was the same. The amounts of soil fertilizer nitrogen residues reached 118.33, 98.40, and 99.87 kg/ha for W1N3, W2N3, and W3N3, respectively, almost twice as much as in the low nitrogen application treatment. The lowest total residual nitrogen was found in the medium nitrogen application treatment (W2N2) at 70.88 kg/ha, but it was not significantly (p > 0.05) different compared to W3N2. Nitrogen loss was highest in W3N3, recorded as 43.13 kg/ha, indicating a significantly (p < 0.05) higher risk of nitrogen loss when under a high water and high nitrogen application treatment. The lowest nitrogen loss was found in the W1N1 treatment, at a rate of 16.44 kg/ha. The increased N application or irrigation amount resulted in more fertilizer nitrogen loss.

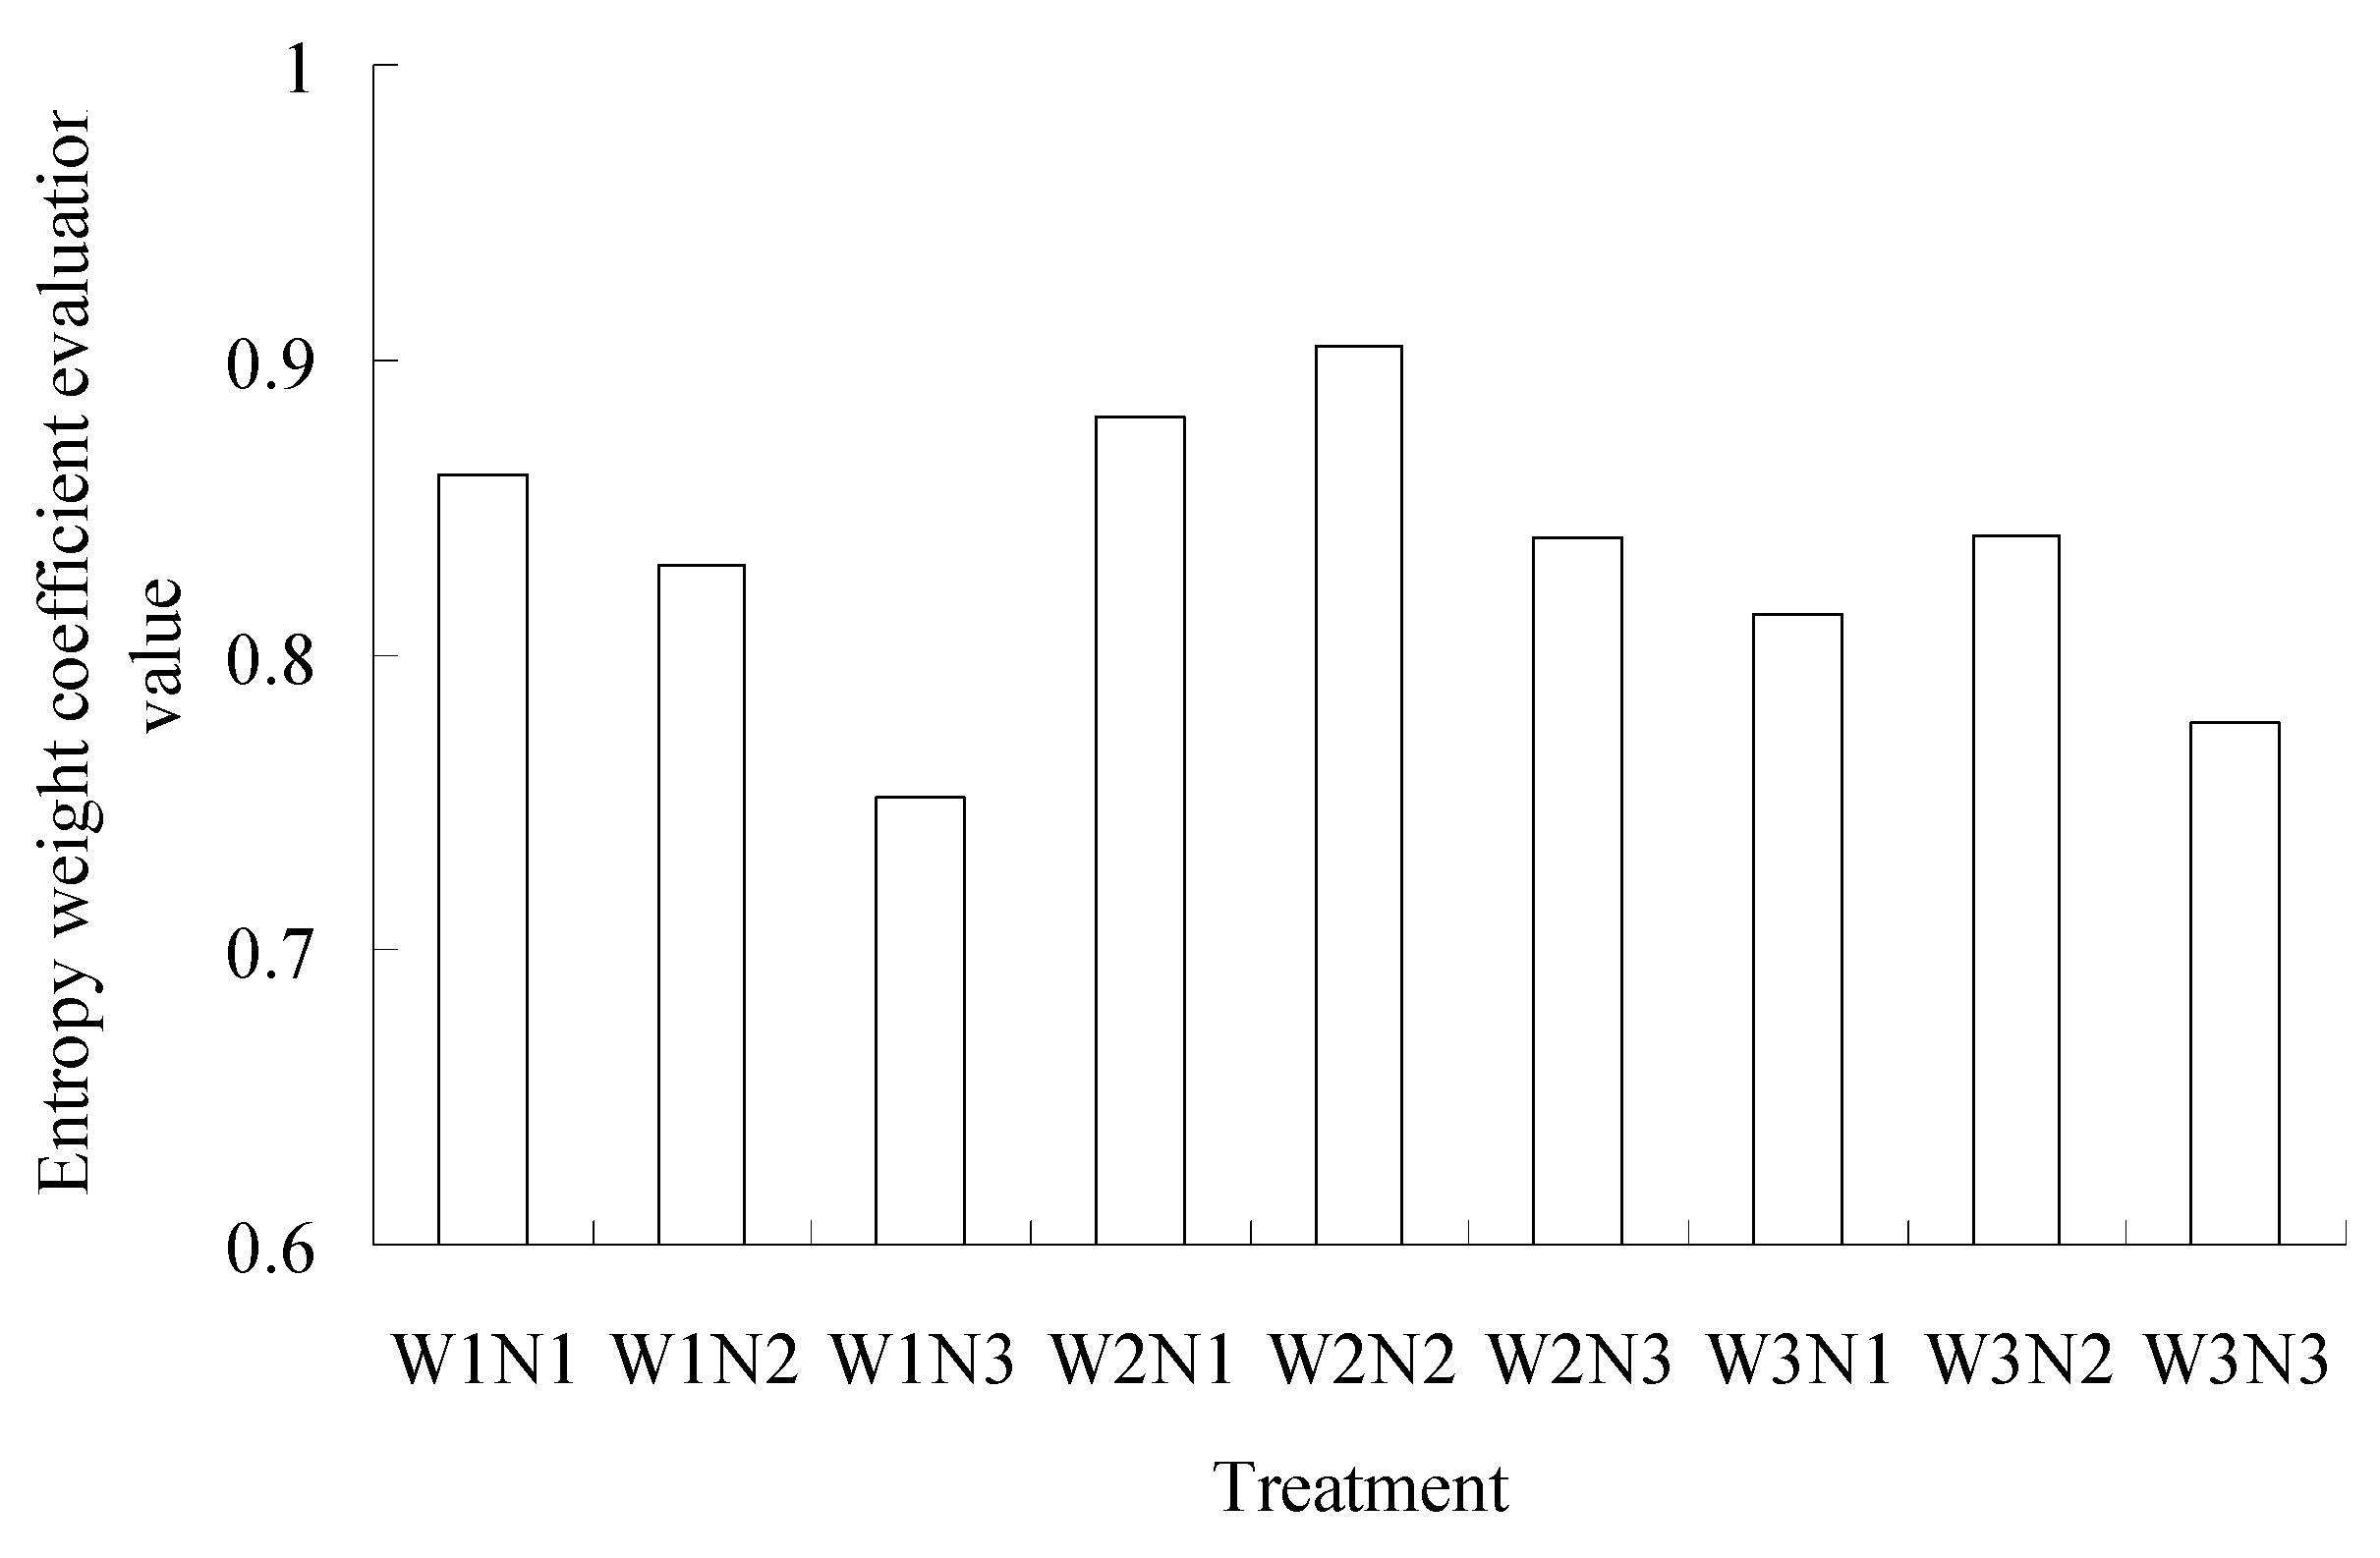
3.5. Entropy Weight Coefficient Evaluation of the Water–Nitrogen Schemes

In this study, the entropy weight coefficient evaluation model was used to evaluate the optimal water and nitrogen scheme for Chinese violet cress, and the preferences were oriented toward a high yield, high nitrogen use efficiency, low nitrogen residual, and low nitrogen loss. Therefore, the fresh weight of Chinese violet cress, fertilizer nitrogen use efficiency, nitrogen residual rate, and nitrogen loss rate were selected as the evaluation indices, as shown in Table 3.
The entropy weight coefficients were modeled for the indicators in Table 3 as the following steps [25,26]:
Assuming that there are m modes of water and nitrogen schemes for Chinese violet cress and n evaluation indicators, the evaluation matrix can be obtained using m schemes corresponding to n indicators as follows (m = 9 and n = 4 according to the experimental design and evaluation indicator selection in this study).
R = ( r i j ) m × n
where rij is the value of the jth indicator in the ith water–nitrogen regulation scheme. For a certain indicator rj, there is the information entropy:
E j = i = 1 m p i j ln p i j , ( j = 1 , 2 , 3 , n )
and
p i j = r i j / i 1 m r i j
The entropy value of the jth indicator value can be calculated by the following equation:
e j = 1 ln m E j ,   ( j = 1 ,   2 ,   3 , ,   n )
The objective weight of the jth indicator is calculated by the following equation:
θ j = ( 1 e j ) / i = 1 n ( 1 e j ) ,   ( j = 1 ,   2 ,   3 ,   ,   n )
The above calculation showed that 0 θ j 1 , j = 1 n θ j = 1 . When evaluating some specific water and nitrogen schemes, subjective experience also plays an important role. Therefore, the subjective weights ω 1 , ω 2 , ω 3 ,   ,   ω n was integrated with the objective weights θ j (j = 1,2,3,..., n) to obtain the new indicator weights:
α j = θ j ω j ¯ / j = 1 n θ j ω j ¯ ,   ( j = 1 ,   2 ,   3 , ,   n )
If the optimal value of each indicator column in the evaluation matrix R is r j , the evaluation matrix data can be normalized according to the r j value. The normalized value of r j is mainly determined by the nature of the indicators. In this study, the fresh weight and nitrogen utilization efficiency of Chinese violet cress are profitable indicators, which is in line with the principle of “the greater, the better”; the nitrogen residue and loss are loss indicators, in line with the principle of “the smaller, the better”. Therefore, the normalized index values dij can be obtained:
d i j = { r i j r j , r j = max { r i j } r j r i j , r j = min { r i j }
The entropy weight evaluation value λ i of different water–nitrogen schemes for Chinese violet cress can be calculated by the following equation:
λ i = j = 1 n α d i j ,   i = 1 ,   2 ,   3 , ,   m .
According to the model calculation method, the index values in Table 3 were analyzed and processed to obtain the objective weights of 0.2719, 0.3113, 0.1139, and 0.3028 for the four indicators of Chinese violet cress fresh weight, nitrogen use efficiency, nitrogen residue, and nitrogen loss, respectively. To prevent the subjective weights from interfering with the evaluation results, the subjective weights of the indicators were all set to 0.25 in this study. The calculated entropy weights of different Chinese violet cress water–nitrogen schemes were shown in Figure 5. According to the model principle, the W2N2 treatment obtained the highest entropy weight coefficient evaluation value of 0.905, indicating that W2N2 was the most effective water–nitrogen treatment for Chinese violet cress; i.e.,75 mm of overwintering water and 45 mm of regreening water combined with 160 kg/ha of fertilizer nitrogen application were the recommended for cultivating Chinese violet cress.

4. Discussion

There is a coupling effect between irrigation water and nitrogen fertilizer [27]. Irrigation water is the carrier of the nitrogen element, and suitable irrigation water is conducive to the formation of soluble nitrogen available for plants. On the contrary, a suitable amount of nitrogen application promotes the growth and development of the plant root system, which promotes the uptake of soil water by plant roots in a wider area [28]. In this study, the coupling effect of water and nitrogen was significant, and the highest fresh yield of Chinese violet cress was achieved under the treatment with a medium water and high nitrogen supply (W2N3), where a yield increase of 49.3% was detected compared to CK. The results of Chao [29] indicated that the fresh yield of Chinese violet cress could be increased by 88.3% maximally after irrigation and fertilization; this increase range was slightly higher compared to that of this study, probably due to the fact that the early research by Chao also increased the application of phosphorus fertilizer. Our overall results showed that the coupling effects of water and nitrogen existed in the growth of Chinese violet cress, which further extended the basal theory of water and nitrogen coupling. Nitrogen application might increase soil water availability, and the soil water constant changed after nitrogen application [30]. The soil available water, saturated water content, and field water capacity all increased as the nitrogen application amount increased, but the soil wilting humidity would not change [31]. In addition, some studies [32,33] have shown that nitrogen application can activate soil water in deeper layers, improve the ability of crops to absorb deep water, and promote the conversion of soil water that could not be easily absorbed into the available water. On the contrary, the appropriate water conditions were conducive to promoting the transport of mineral nutrients through mass flow and diffusion, and improving the intensity and amount of soil mineral nutrients absorbed by crops [34].
Plants can take up nutrients in the available state, and only when the content of available nutrients in the soil is extremely low do plants turn on the absorption mechanism to take up a small molecule of nitrogen in the organic state [35]. In this study, the nitrogen use efficiency under W1N3 was at the lower level among the treatments, which might be due to the fact that the relatively low irrigation amount of W1 was not conducive to transforming the nitrogen from the fertilizer state to available state. On the other hand, although irrigation water promoted the dissolution of nitrogen fertilizer in the soil to form the plant-preferred ammonium and nitrate nitrogen, an excessive water supply inevitably carries fertilizer nitrogen into deeper soil layers [36]. This study found that the increase in irrigation water decreased the fertilizer nitrogen content in shallow soil layers (Figure 4), this was consistent with the previous research results [37]. The low nitrogen use efficiency detected under W3N3 might also be explained by the fact that the irrigation amount of W3 caused more nitrogen loss or nitrogen migration to deeper soil below the main root zone, resulting in the decrease of nitrogen use efficiency; another reason might be that the plants could not absorb the excessive applied nitrogen at the N3 application rate, resulting in a nitrogen surplus and a decrease in nitrogen use efficiency. In addition, water and nitrogen have a significant impact on the plant root length and root–shoot ratio, thus affecting the plant water and nitrogen utilization. A study shows that the root and shoot biomass significantly varied with the N rates [38]. Another study points out that the root–shoot relationship is more affected by the planting pattern than by the N application rate [39]. Increasing the N supply may improve the root length density, surface area, and root dry weight [40]. However, it should be noticed that compared to being under water or nutrient stress, the plant roots under sufficient nitrogen will not grow into such depths.
This study found that about 50% of the fertilizer nitrogen remained in the soil after the bloom period, which was similar to the results of previous studies on many other plants. For example, in a flue-cured tobacco study by Hou [41] which observed that 62.4% of the applied nitrogen fertilizer remained in the soil after the tobacco harvest, the fertilizer nitrogen formed into soil nitrogen to be absorbed by subsequent plants. In tomato, it was found that 46.2% of fertilizer nitrogen remained in the soil at the end of the first crop of tomato cultivation [42]. The high proportion of residual fertilizer nitrogen might be due to the fact that a significant proportion of the nitrogen absorbed by the crop originated from the soil nitrogen, and the crop’s dependence on the soil N was more pronounced in the late growth stages [43]. The fertilizer nitrogen remaining in the soil would convert to soil nitrogen through a series of biochemical processes for the continued uptake by subsequent crops. A study by Dong [44] showed that the utilization efficiency of soil residual fertilizer nitrogen from the previous season by the subsequent crop could reach up to 14.1%.
After the absorption of water and nitrogen fertilizer, the plant biomass of the Chinese violet cress increased significantly, and the ornamental effect was better. Moreover, after the flowering period, the Chinese violet cress could be used as green manure and rolled into the soil, which could improve the soil quality and promote the growth of subsequent crops. The greater the Chinese violet cress yield was, the more exogenous ameliorators the soil received. Therefore, regulating Chinese violet cress growth with water and fertilizer was a pathway with double benefits. However, in recent years, investigations regarding water, fertilizer, and nitrogen-15 tracing were widely conducted in grain crops [45,46]; few studies focused on water and nitrogen management for Chinese violet cress. As one of the plants cultivated in the gap period between rotation crops, Chinese violet cress’s water and nitrogen absorption was also a key link in the nitrogen cycle of the “soil–crop” system, which should not be ignored. In this paper, the entropy weight coefficient evaluation method was used to select the most suitable water–nitrogen coupling mode for the Chinese violet cress. Since the selection of the Chinese violet cress water–nitrogen coupling mode involved multiple schemes and multiple indicators, only relying on subjective decision has various limitations; the entropy weight coefficient model provided a relatively more scientific pathway for the selection. However, it should be noted that the accuracy of the entropy weight coefficient evaluation model was affected by multiple factors such as the data quantity, scheme number, and the weight distribution. A greater data quantity and scheme number combined with a more reasonable weight distribution led to a more accurate calculation result of the entropy weight coefficient. The evaluation result by entropy weight coefficient in this study can be used to assist in the practical scheme decision, while when formulating a water–nitrogen strategy, the parameters might need minor changes. Moreover, this study investigated the absorption of 15N by Chinese violet cress and the residue and loss of 15N in the soil through the application of exogenous 15N. The future study may focus on how and how much the plant nitrogen of Chinese violet cress is absorbed by subsequent crops after rolling into the soil as fertilizer; this is conducive to the scientific cultivation and utilization of Chinese violet cress.

5. Conclusions

After the application of water and nitrogen, the fresh yield of Orychophragmus violaceus increased by 21.4–49.3%, W2N3 possessed the most obvious effect on promoting yield increase, and the fresh yield reached 31.1 t/ha. The highest plant nitrogen use efficiency (39.1%) was detected in W2N2, but no significant (p > 0.05) difference of nitrogen use efficiency was found between W2N2 andW3N2. After the peak flowering period, 23.8–39.1% of the fertilizer nitrogen was absorbed by the plants, 44.3–59.2% remained in the soil, and 13.7–21.6% was lost via deep seepage, a gaseous state or other unknown ways. Among the treatments, W2N2 was proven to be the water–nitrogen coupling mode with the optimal comprehensive benefits. We concluded that a 75 mm of overwintering water and 45 mm of regreening water combined with 160 kg/ha nitrogen application amount was the suitable water and nitrogen regulation scheme for Orychophragmus violaceus.

Author Contributions

Conceptualization and methodology, Q.J.; software, C.C.; validation, F.W., Y.Y. and H.P.; formal analysis, H.S.; investigation, J.Y.; resources, J.T.; data curation, Y.Y.; writing—original draft preparation, H.P.; writing—review and editing, Y.A.H.; visualization and supervision, J.Y.; project administration, Y.A.H. All authors have read and agreed to the published version of the manuscript.

Funding

This research was funded by [Jiangsu Coastal Group unveiled the project “Saline-alkali arable land irrigation and drainage optimization management and efficient salt reduction technology”], grant number [2022YHTDJB02-1].

Institutional Review Board Statement

Not applicable.

Informed Consent Statement

Not applicable.

Data Availability Statement

Not applicable.

Acknowledgments

The authors also thank the anonymous reviewers for their helpful comments and suggestions.

Conflicts of Interest

The authors declare that they have no known competing financial interests or personal relationships that could have appeared to influence the work reported in this paper.

References

  1. Zhang, Z.X.; Song, J.; Qi, Z.J.; Zhang, Z.H.; Huang, Y.; Wang, B. Effects of controlled irrigation nitrogen fertilizer reduction on soil nitrogen distribution and nitrogen use efficiency. J. Northeast Agric. Univ. 2022, 53, 42–49. [Google Scholar]
  2. Gui, J.; Chen, X.Y.; Liu, M.Q.; Zhuang, X.P.; Sun, Z.; Hu, F. Effects of water conservation and nitrogen reduction measures on soil microbial and microfauna communities in paddy field. Chin. J. Appl. Ecol. 2016, 27, 107–116. [Google Scholar]
  3. Li, R.N.; Li, Y.E.; Wang, B.; Wan, Y.F.; Li, J.L.; Ma, P.; Weng, S.M.; Qin, X.B.; Gao, Q.Z. Screening of Water and Nitrogen Optimization Management Model for Emission Reduction and Income Increase of Double Cropping Rice. Trans. Chin. Soc. Agric. Eng. 2020, 36, 105–113. [Google Scholar]
  4. Wang, X.M. Effects of Nitrogen Reduction and Water Conservation on Summer Maize Yield and Water and Nitrogen Use Efficiency in Guanzhong Plain; Northwest A&F University: Yangling, China, 2021. [Google Scholar]
  5. Wang, X.M.; Luo, W.H.; Liu, P.Z.; Zhang, Q.; Wang, R.; Li, J. Regulatory effects of water conservation and nitrogen reduction on dry matter and nitrogen accumulation, transport and yield in summer maize. China Agric. Sci. 2021, 54, 3183–3197. [Google Scholar]
  6. Hou, M.M.; Chen, J.N.; Yang, Q.; Lin, Z.Y.; Jin, Q.; Zhong, F.L. Characteristics of soil nitrogen behavior in coastal facilities under dark pipe drainage and organic fertilizer application. Trans. Chin. Soc. Agric. Mach. 2019, 50, 259–266. [Google Scholar]
  7. Li, X.F.; Ma, J.J.; Sun, X.H.; Shi, X.H.; Guo, X.H.; Lei, T. Effects of water conservation and nitrogen reduction on greenhouse tomato growth and water and nitrogen use efficiency. J. Drain. Irrig. Mech. Eng. 2021, 39, 1056–1061. [Google Scholar]
  8. Zhang, L.J.; Qu, J.S.; Yang, D.Y.; Feng, H.P.; Guo, W.Z.; Wang, C.L. Effects of water conservation and nitrogen reduction on growth, development and yield of overwintering celery in the upper reaches of the Yellow River. North Hortic. 2011, 11, 53–55. [Google Scholar]
  9. Mao, X.Y.; Chen, J.N.; Yang, Q.; Weng, J.L.; Lu, X.Y.; Jin, Q. Coupling Effect of Water and Nitrogen in Cabbage Based on ~(15)N Isotope Technique. Hubei Agric. Sci. 2019, 58, 76–80. [Google Scholar] [CrossRef]
  10. Morteza, O.; Jamuna, P. Nutritional properties of green gram germinated in mineral fortified soak water: I. Effect of dehulling on total and bioaccessible nutrients and bioactive components. J. Food Sci. Technol. 2017, 54, 871–879. [Google Scholar]
  11. Spangenberg, J.E.; Zufferey, V. Changes in soil water availability in vineyards can be traced by the carbon and nitrogen isotope composition of dried wines. Sci. Total Environ. 2018, 635, 178–187. [Google Scholar] [CrossRef]
  12. Li, T.; Zhou, X.; Liu, C.M.; Zhang, Y.X.; Wang, M.X. Effect Of Water-Nitrogen Coupling on Yield and water use efficiency of kidney bean. Fresenius Environ. Bull. 2021, 30, 6516–6529. [Google Scholar]
  13. Fan, Y.F.; He, L.Y.; Liu, Y.; Wang, S.F. Spatiotemporally optimize water-nitrogen management of crop planting in response to carbon emissions mitigation. J. Clean. Prod. 2022, 380, 13. [Google Scholar] [CrossRef]
  14. Wang, M.; Shi, S.; Lin, F.; Hao, Z.; Jiang, P.; Dai, G. Effects of soil water and nitrogen on growth and photosynthetic response of Manchurian ash (Fraxinus mandshurica) seedlings in northeastern China. PLoS ONE 2018, 7, e30754. [Google Scholar] [CrossRef] [PubMed] [Green Version]
  15. Guo, X.; Zhu, G.; Jiao, X.; Zhou, G. Effects of Nitrogen Application and Planting Density on Growth and Yield of Sesbania Pea Grown in Saline Soil. Curr. Sci. 2019, 116, 758–764. [Google Scholar] [CrossRef]
  16. Bai, J.; Zong, M.; Li, S.; Li, H.; Duan, C.; Feng, Y.; Peng, C.; Zhang, X.; Sun, D.; Lin, C.; et al. Nitrogen, water content, phosphorus and active iron jointly regulate soil organic carbon in tropical acid red soil forest. J. Soil Sci. 2020, 72, 446–459. [Google Scholar] [CrossRef]
  17. Linker, R.; Johnson-Rutzke, C. Modeling the effect of abrupt changes in nitrogen availability on lettuce growth, root-shoot partitioning and nitrate concentration. Agric. Syst. 2005, 86, 166–189. [Google Scholar] [CrossRef]
  18. Woodward, A.J.; Bennett, I.J.; Pusswonge, S. The effect of nitrogen source and concentration, medium pH and buffering on in vitro shoot growth and rooting in Eucalyptus marginata. Sci. Hortic. 2006, 110, 208–213. [Google Scholar] [CrossRef]
  19. Sun, X.G.; Jia, Z.K.; Zhang, Z.F. Study on the Flowering Biological Characteristics of Chinese violet cress. Hebei For. Sci. Technol. 2021, 9, 19–23. [Google Scholar] [CrossRef]
  20. Ouyang, Z.Y. Application Technology of Chinese violet cress Garden. For. Ecol. 2021, 37, 122–130. [Google Scholar] [CrossRef]
  21. Gu, J.T.; Wang, F.; Xu, Z.H.; Xu, J. Nitrogen utilization of summer maize under different water and fertilizer conditions based on ~(15)N tracing technology. Water-Sav. Irrig. 2021, 11, 83–87+96. [Google Scholar]
  22. Zhu, H.J.; Zhang, T.; Wang, X.H.; Wang, Y.; Shi, A.L. ~(15)N Tracer Technique Analysis of Nitrogen Utilization of Rice under Different Irrigation Modes. Mol. Plant Breed. 2021, 19, 3687–3697. [Google Scholar]
  23. Hou, M.M.; Shao, X.H.; Zhai, Y.M.; Yuan, Y.B.; Ding, F.Z. Nitrogen Reuse Analysis of Tobacco Field Fertilizer Based on ~(15)N TracerIng Technology. Trans. Chin. Soc. Agric. Eng. 2016, 32, 118–123. [Google Scholar]
  24. Hou, M.M.; Chen, J.N.; Lin, Z.Y.; Wang, J.W.; Li, H.B.; Chen, J.T.; Weng, J.L.; Lv, Y.W.; Jin, Q.; Zhong, F.L. Coupling effects and mechanisms of drip irrigation and microbial organic fertilizers on soil respiration in facilities. Trans. Chin. Soc. Agric. Eng. 2019, 35, 104–112. [Google Scholar]
  25. Shao, G.C.; Guo, R.Q.; Lan, J.J.; Chen, C.R.; Gao, Z. Evaluation of Entropy Weight Coefficient of Tomato Irrigation and Drainage Scheme under Rain Shelter Cultivation Conditions. J. Drain. Irrig. Mech. Eng. 2012, 30, 733–737. [Google Scholar]
  26. Hou, M.M.; Lin, Z.Y.; Chen, J.N.; Zhai, Y.M.; Jin, Q.; Zhong, F.L. Optimization on the Buried Depth of Subsurface Drainage under Greenhouse Condition Based on Entropy Evaluation Method. Entropy 2018, 20, 859. [Google Scholar] [CrossRef] [PubMed] [Green Version]
  27. Dong, Y.Y.; Guo, Y.; Wang, C.; Baimo, D.G.; Yuan, X.L.; Chen, J. Research progress on the effects of water and fertilizer regulation on flower production in facility cultivation. J. Inn. Mong. Univ. Natl. (Nat. Sci. Ed.) 2015, 30, 131–135. [Google Scholar]
  28. Guo, Y.N.; Zhou, J.C.; Wang, Q.H.; Song, B.Q. Research Progress on Coupling Effect of Crop Water and Nitrogen. Chin. Agric. Sci. Bull. 2019, 35, 1–5. [Google Scholar]
  29. Zhao, C.Y.; Wang, Y.Y.; Yin, X.D.; Dong, Q.J.; Zhu, G.L.; Liu, M.Q.; Li, X.H.; Hu, F.; Jiao, J.G. Effects of water and fertilizer regulation on nutrient accumulation and soil fertility of Peanuts in Chinese violet cress and post-stubble. Soils 2020, 52, 1222–1229. [Google Scholar]
  30. Grewal, D.S.; Dasgupta, R.; Farnell, A. Corrigendum to 'The speciation of carbon, nitrogen, and water in magma oceans and its effect on volatile partitioning between major reservoirs of the Solar System rocky bodies. Geochim. Cosmochim. 2020, 285, 274. [Google Scholar] [CrossRef]
  31. Naveen, H.R.; Naik, B.B.; Sreenivas, G.; Kumar, A.; Adinarayana, J.; Kumar, K.A.; Shankaraiah, M. Hyperspectral Remote Sensing for Determining Water and Nitrogen Stress in Maize during Rabi Season. Curr. J. Appl. Sci. Technol. 2020, 38, 1–9. [Google Scholar] [CrossRef] [Green Version]
  32. Zhang, X.; Teng, Z.; Zhang, H.; Cai, D.; Zhang, J.; Meng, F.; Sun, G. Nitrogen application and intercropping change microbial community diversity and physicochemical characteristics in mulberry and alfalfa rhizosphere soil. J. For. Res. 2021, 32, 2121–2133. [Google Scholar] [CrossRef]
  33. Obour, A.K.; Holman, J.D.; Assefa, Y. Grain sorghum productivity as affected by nitrogen rates and available soil water. Crop Sci. 2022, 62, 1360–1372. [Google Scholar] [CrossRef]
  34. Hou, L.; Lin, R.X.; Wang, X.J.; Li, H.; Zhao, C.Z.; Zhu, X.J.; Li, G.H. The Mechanisms of Pod Zone Nitrogen Application on Peanut Pod Yield. Russ. J. Plant Physiol. 2022, 69, 51. [Google Scholar] [CrossRef]
  35. Qiu, S.J.; Peng, P.Q.; Liu, Q.; Rong, X.M. Soil microbial biomass nitrogen and its role in nitrogen cycle. Chin. J. Ecol. 2006, 25, 443–448. [Google Scholar]
  36. Dong, X.X.; Liu, C.S.; Zhang, L.J.; Yuan, L.J.; Ju, X.T.; Liu, X.Y. Effects of water and nitrogen regulation in cultivated layers on deep soil accumulation NO_3--N transport and after-effects. China Agric. Sci. 2011, 44, 2476–2483. [Google Scholar]
  37. Jin, Q.; You, J.J.; Xie, M.X.; Qiu, Y.L.; Lei, S.H.; Ding, Q.; Chen, J.N. Drip Irrigation Reduced Fertilizer Nitrogen Loss from Lettuce Field-A Case Study Based on N-15 Tracing Technique. Water 2022, 14, 675. [Google Scholar] [CrossRef]
  38. Hou, M.M.; Shao, X.H.; Jin, Q.; Gao, X.L. A N-15 tracing technique-based analysis of the fate of fertilizer N: A 4-year case study in eastern China. Arch. Agron. Soil Sci. 2017, 63, 74–83. [Google Scholar] [CrossRef]
  39. Xu, R.; Chen, J.N.; Lin, Z.Y.; Chen, X.Y.; Hou, M.M.; Shen, S.S.; Jin, Q.; Zhong, F.L. Fate of urea-N-15 as influenced by different irrigation modes. RSC Adv. 2020, 10, 11317–11324. [Google Scholar]
  40. Sainju, U.M.; Allen, B.L.; Lenssen, A.W.; Ghimire, R.P. Root biomass, root/shoot ratio, and soil water content under perennial grasses with different nitrogen rates. Field Crop. Res. 2017, 210, 183–191. [Google Scholar] [CrossRef] [Green Version]
  41. Zhang, G.X.; Hou, Y.T.; Zhang, H.P.; Fan, H.Z.; Wen, X.X.; Han, J.; Liao, Y.C. Optimizing planting pattern and nitrogen application rate improves grain yield and water use efficiency for rain-fed spring maize by promoting root growth and reducing redundant root growth. Soil Tillage Res. 2022, 220, 16. [Google Scholar] [CrossRef]
  42. Xue, Y.F.; Zhang, W.; Liu, D.Y.; Yue, S.C.; Cui, Z.L.; Chen, X.P.; Zou, C.Q. Effects of nitrogen management on root morphology and zinc translocation from root to shoot of winter wheat in the field. Field Crop. Res. 2014, 161, 38–45. [Google Scholar] [CrossRef]
  43. Xu, Q.Q.; Liu, H.B.; Shang, X.Y.; Cheng, C.H.; Zhang, X.B.; Xia, C.; Zhang, Y.G.; Jin, H.Q.; Xu, S.X.; Yang, T.Z.; et al. Differences in leaf nitrogen accumulation and ammonia volatilization in upper leaves of flue-cured tobacco cultivars based on ~(15)N isotope tracing technology. Tob. Sci. Technol. 2019, 52, 10–16. [Google Scholar]
  44. Dong, X.X.; Liu, X.Y.; Ren, C.L.; Ji, Y.Z.; Ju, X.T.; Zhang, L.J. Nitrogen fertilizer effects and destination of winter wheat-summer maize rotation system in hygral cinnamon soil. China Agric. Sci. 2012, 45, 2209–2216. [Google Scholar]
  45. Wang, Z.; Liu, J.; Wang, Y.; Agathokleous, E.; Hamoud, Y.A.; Qiu, R.; Hong, C.; Tian, M.; Shaghaleh, H.; Guo, X. Relationships between stable isotope natural abundances (delta(13)C and delta(15)N) and water use efficiency in rice under alternate wetting and drying irrigation in soils with high clay contents. Front. Plant Sci. 2022, 13, 1077152. [Google Scholar] [CrossRef] [PubMed]
  46. Wang, Z.; Liu, J.; Hamoud, Y.A.; Wang, Y.; Qiu, R.; Agathokleous, E.; Hong, C.; Shaghaleh, H. Natural (15)N abundance as an indicator of nitrogen utilization efficiency in rice under alternate wetting and drying irrigation in soils with high clay contents. Sci. Total Environ. 2022, 838 Pt 4, 156528. [Google Scholar] [CrossRef]
Figure 1. The irrigation device:(a) external layout; (b) internal layout.
Water 15 00904 g001
Figure 2. Effect of different water–nitrogen treatments on biomass accumulation of Chinese violet cress: W1, W2, and W3 represent different irrigation rates of 50 + 30 mm (overwintering water and regreening water), 75 + 45 mm, and 100 + 60 mm. N1, N2, and N3 represent different nitrogen application rates of 120, 160, and 200 kg/ha. CK was the control treatment without irrigation or nitrogen fertilizer supply. Different letters represent significant difference at 0.05 level.
Water 15 00904 g002
Figure 3. Effect of different water–nitrogen treatments on nitrogen use efficiency of Chinese violet cress: W1, W2, and W3 represent different irrigation rates of 50 + 30 mm (overwintering water and regreening water), 75 + 45 mm, and 100 + 60 mm. N1, N2, and N3 represent different nitrogen application rates of 120, 160, and 200 kg/ha. Different letters represent significant difference at 0.05 level.
Water 15 00904 g003
Figure 4. Profile distribution of soil residual fertilizer nitrogen under different treatments (ac) W1, W2, and W3 represent different irrigation rates of 50 + 30 mm (overwintering water and regreening water), 75 + 45 mm, and 100 + 60 mm. N1, N2, and N3 represent different nitrogen application rates of 120, 160, and 200 kg/ha.
Water 15 00904 g004
Figure 5. Entropy weight coefficient evaluation values of different water–nitrogen regulation treatments for Chinese violet cress: W1, W2, and W3 represent different irrigation rates of 50 + 30 mm (overwintering water and regreening water), 75 + 45 mm, and 100 + 60 mm. N1, N2, and N3 represent different nitrogen application rates of 120, 160, and 200 kg/ha.
Water 15 00904 g005
Table 1. Experimental design.
TreatmentIrrigation Amount (mm)Nitrogen Application Amount (kg/ha)
Overwintering WaterRegreening WaterBasal FertilizerTopdressing Fertilizer
W1N150308436
W1N2503011248
W1N3503014060
W2N175458436
W2N2754511248
W2N3754514060
W3N1100608436
W3N21006011248
W3N31006014060
CK0000
Note: W1, W2, and W3 represent different irrigation rates of 50 + 30 mm (overwintering water and regreening water), 75 + 45 mm, and 100 + 60 mm. N1, N2, and N3 represent different nitrogen application rates of 120, 160, and 200 kg/ha. CK was the control treatment without additional irrigation or nitrogen fertilizer supply.
Table 2. Balance of fertilizer nitrogen (15N).
TreatmentTotal 15N Application (kg/ha)Plant Uptake 15N15N lossSoil Residual 15N
Amount (kg/ha)Ratio (%)Amount (kg/ha)Ratio (%)Amount (kg/ha)Ratio (%)
W1N112042.68 ± 1.23 ef35.616.44 ± 0.39 g13.760.88 ± 1.62 e50.7
W1N216051.68 ± 2.88 cd32.324.32 ± 0.26 de15.284.02 ± 3.14 c52.5
W1N320047.67 ± 2.61 de23.834.00 ± 2.54 c17.0118.33 ± 5.15 a59.2
W2N112045.48 ± 0.98 ef37.917.76 ± 0.78 fg14.856.76 ± 1.76 e47.3
W2N216062.61 ± 2.68 ab39.126.51 ± 2.03 d16.670.88 ± 4.70 d44.3
W2N320063.03 ± 1.98 a31.538.60 ± 1.80 b19.398.40 ± 3.77 b49.2
W3N112039.88 ± 1.18 f33.220.52 ± 1.03 ef17.159.60 ± 2.21 e49.7
W3N216057.87 ± 2.29 ab36.231.04 ± 0.47 c19.471.09 ± 2.74 d44.4
W3N320057.02 ± 3.68 bc28.543.13 ± 2.49 a21.699.87 ± 6.15 b49.9
All figures. Note: W1, W2, and W3 represent different irrigation rates of 50 + 30 mm (overwintering water and regreening water), 75 + 45 mm, and 100 + 60 mm. N1, N2, and N3 represent different nitrogen application rates of 120, 160, and 200 kg/ha. Different letters mean significant differences at 0.05 level.
Table 3. Evaluation indicators and indicator values.
TreatmentFresh Weight (kg/ha)Nitrogen Use Efficiency (%)Soil Residue(%)Nitrogen Loss (%)
W1N120.135.650.713.7
W1N223.432.352.515.2
W1N326.623.859.217.0
W2N122.037.947.314.8
W2N226.239.144.316.6
W2N331.131.549.219.3
W3N123.533.249.717.1
W3N225.836.244.419.4
W3N329.428.549.921.6
Note: W1, W2, and W3 represent different irrigation rates of 50 + 30 mm (overwintering water and regreening water), 75 + 45 mm, and 100 + 60 mm. N1, N2, and N3 represent different nitrogen application rates of 120, 160, and 200 kg/ha.
Disclaimer/Publisher’s Note: The statements, opinions and data contained in all publications are solely those of the individual author(s) and contributor(s) and not of MDPI and/or the editor(s). MDPI and/or the editor(s) disclaim responsibility for any injury to people or property resulting from any ideas, methods, instructions or products referred to in the content.

