
Life Cycle Analysis of Lab-Scale Constructed Wetlands for the Treatment of Industrial Wastewater and Landfill Leachate from Municipal Solid Waste: A Comparative Assessment
 ,
,  , and
, and
Abstract
:
1. Introduction
2. Materials and Methods
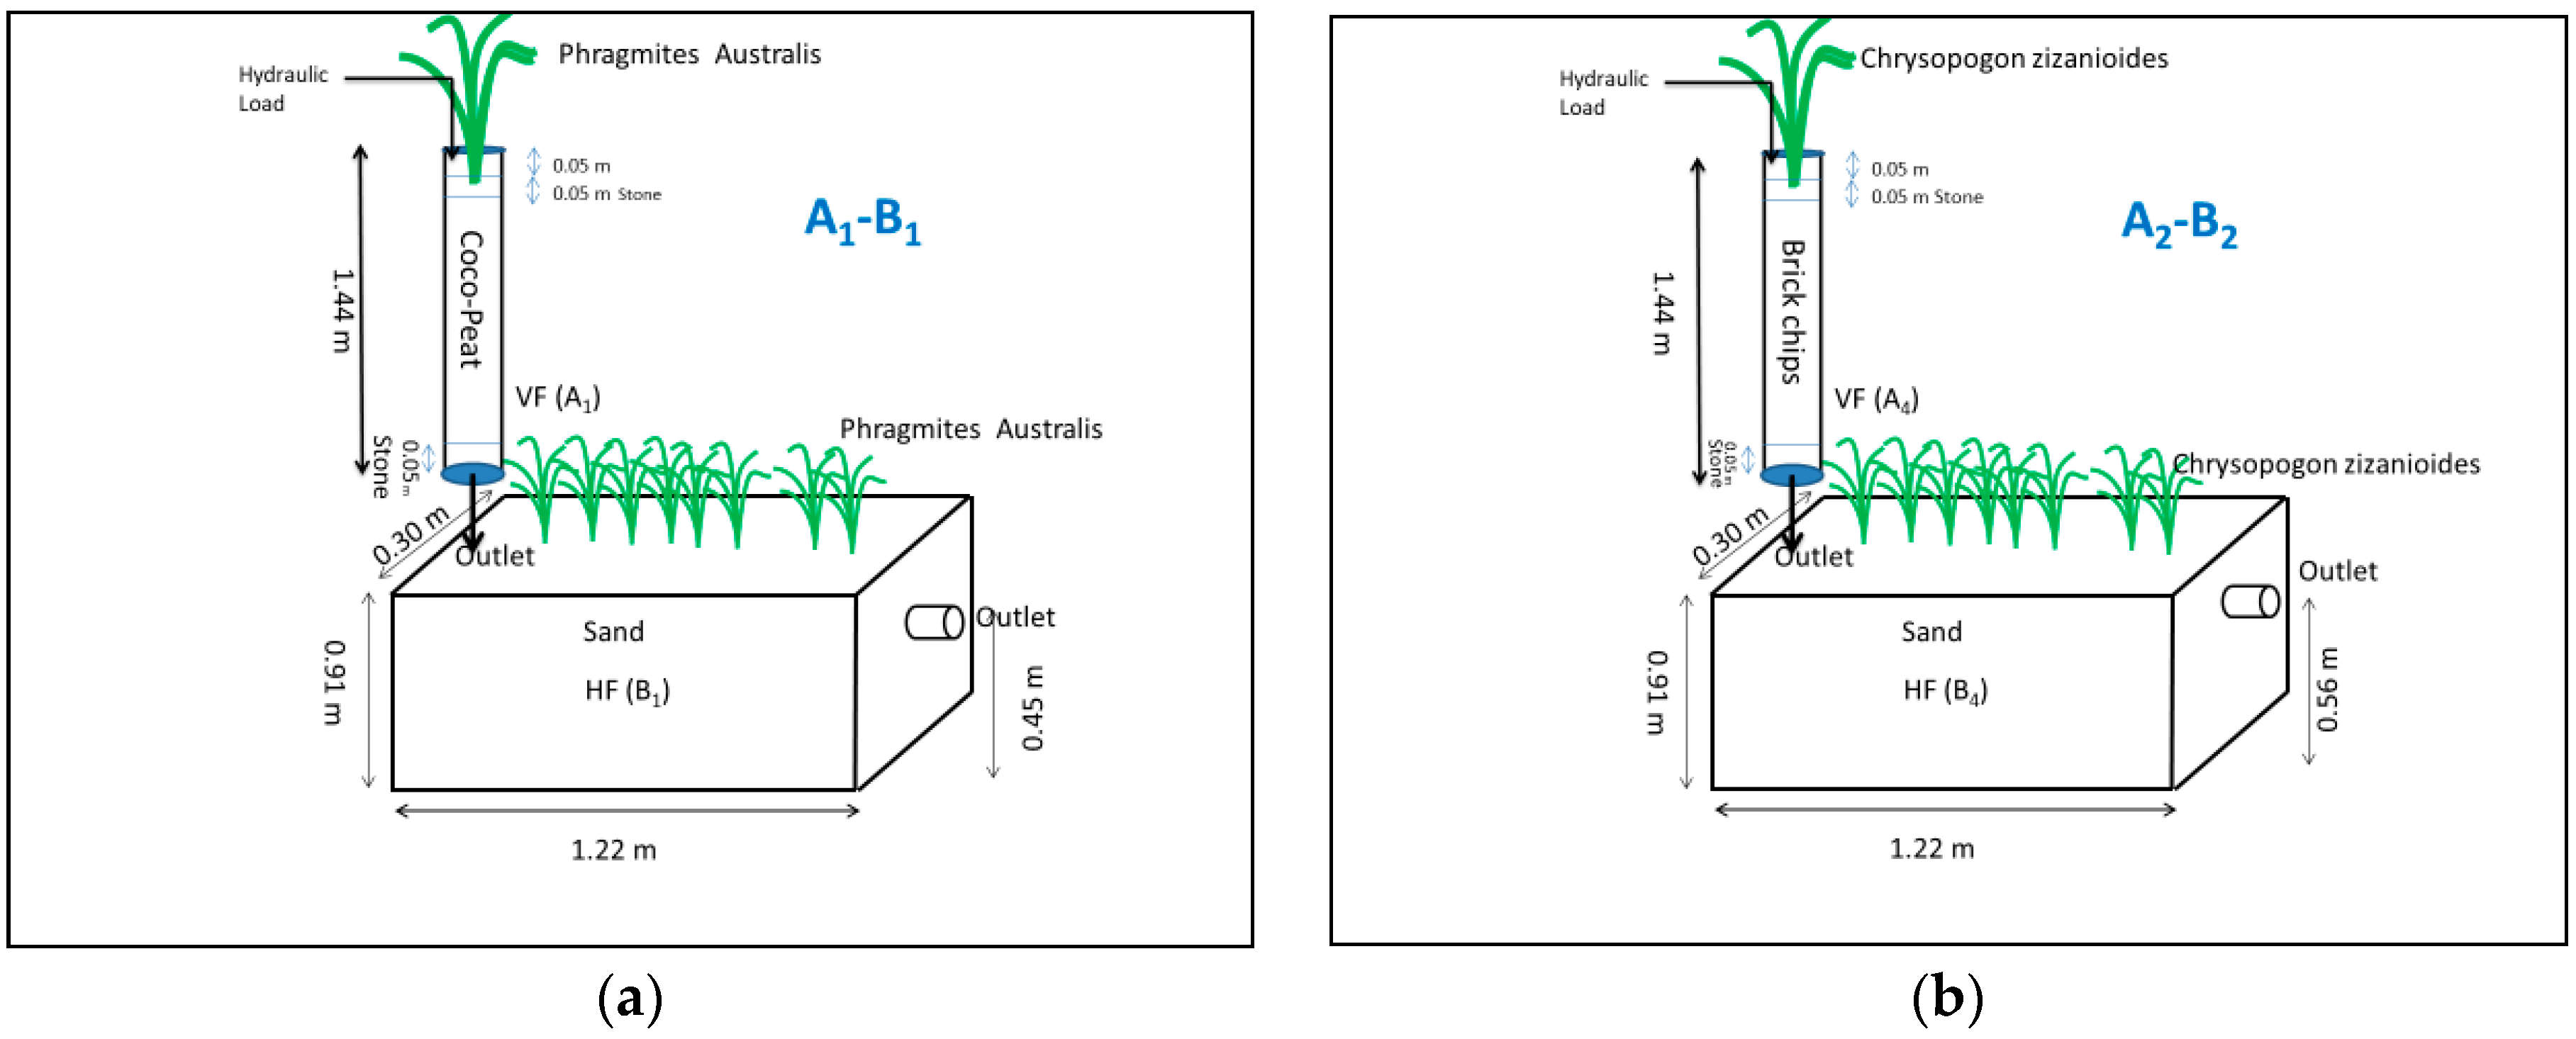
2.1. Description of CW Systems for the Treatment of Industrial Wastewater
2.2. Description of CW Systems for Landfill Leachate from Municipal Solid Waste
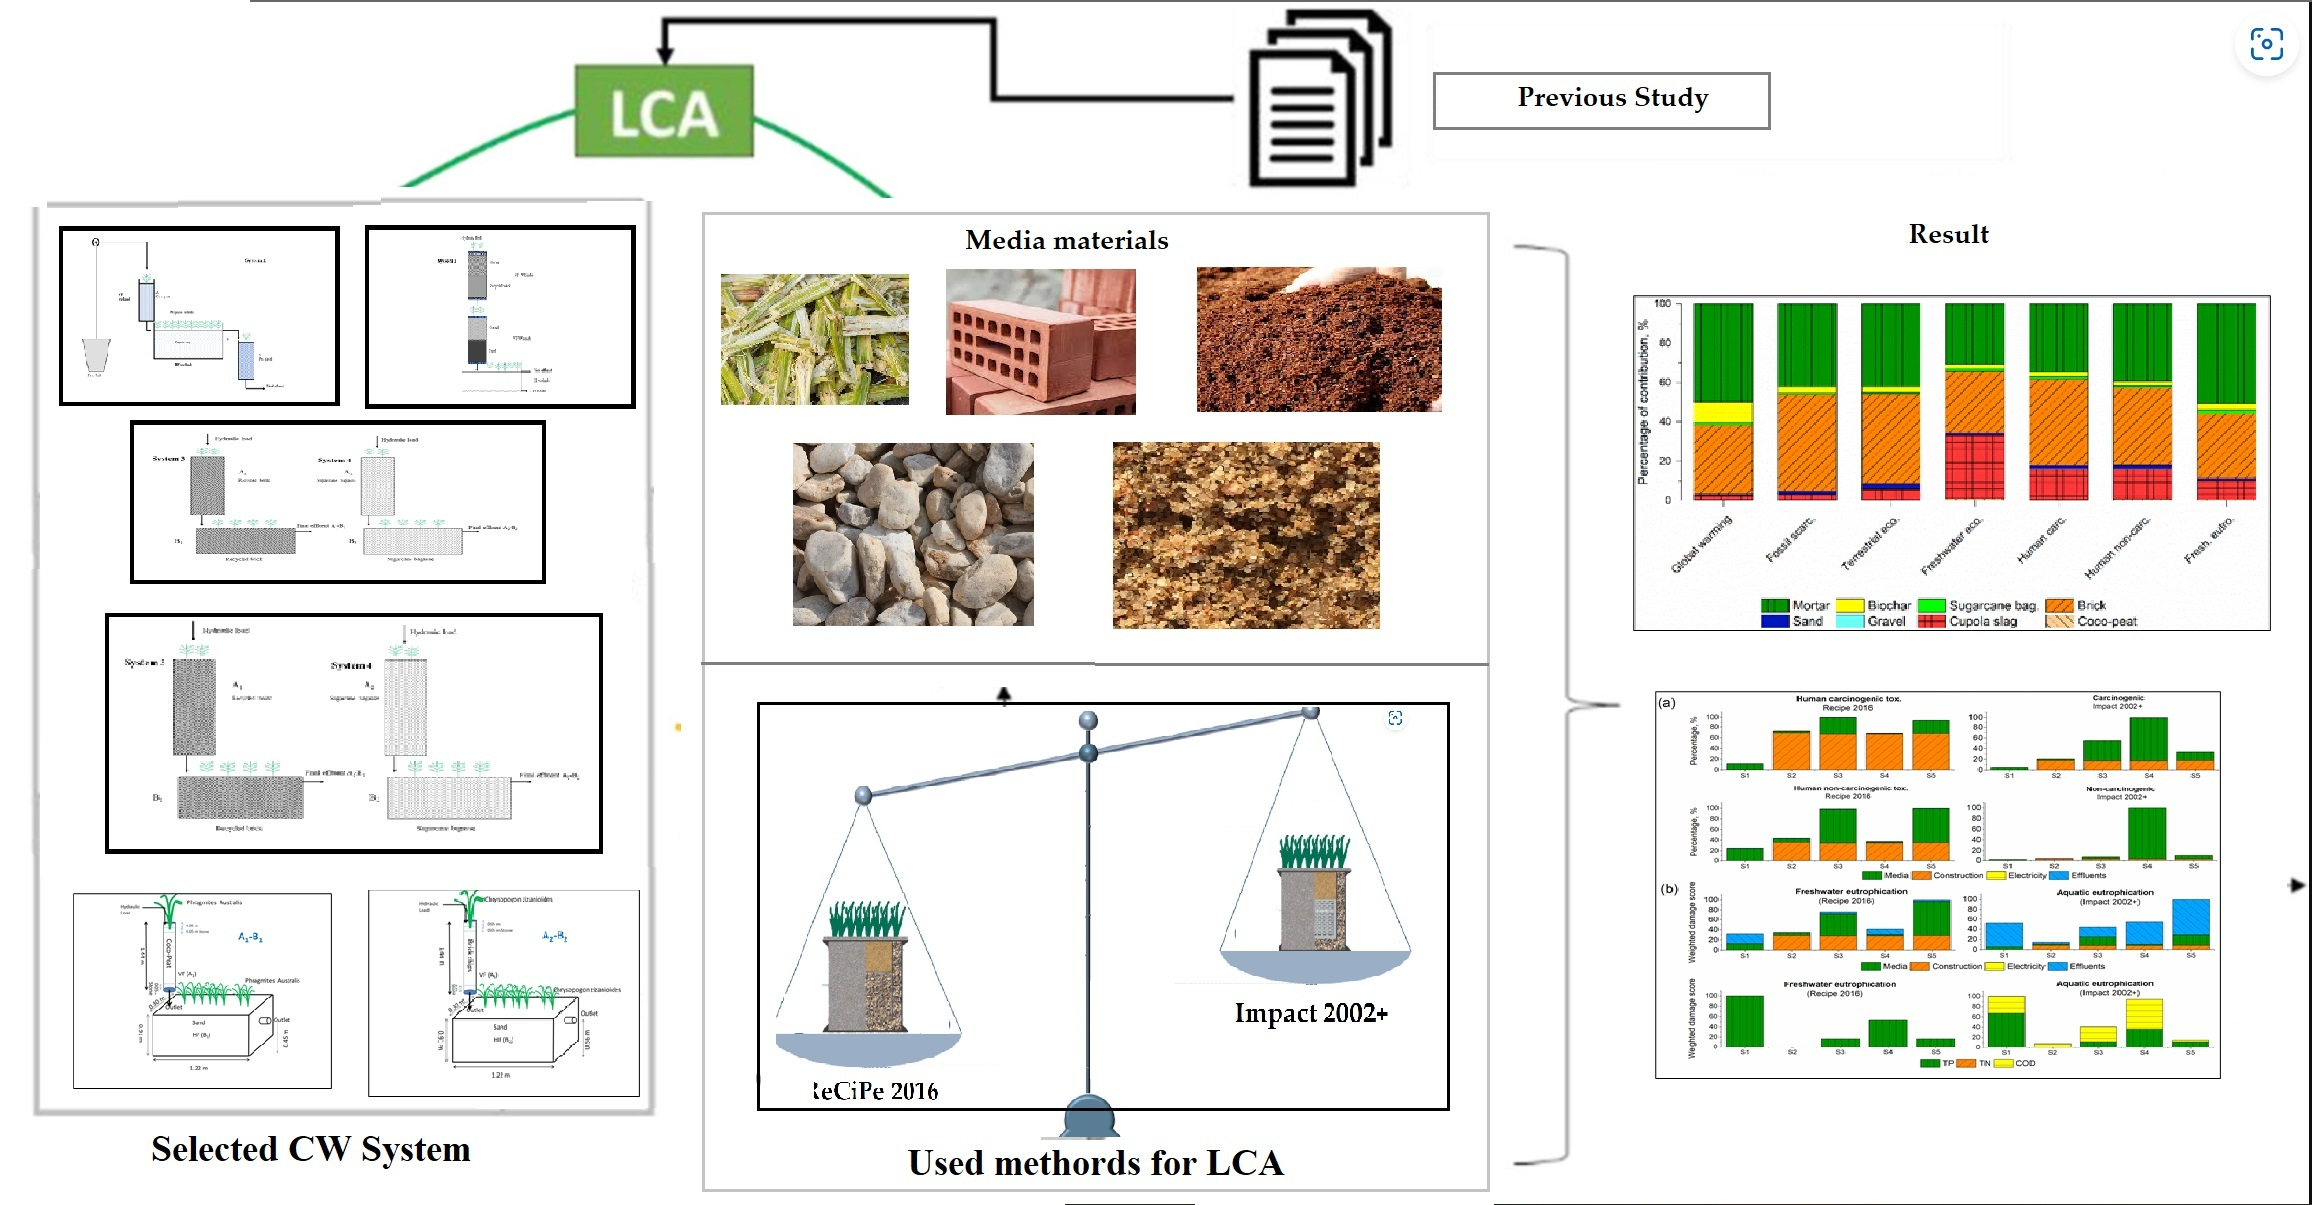
2.3. Life Cycle Assessment
2.4. Goal and Scope Definition
2.5. Inventory Analysis
2.6. Impact Assessment
2.7. Life Cycle Interpretation
3. Results and Discussion
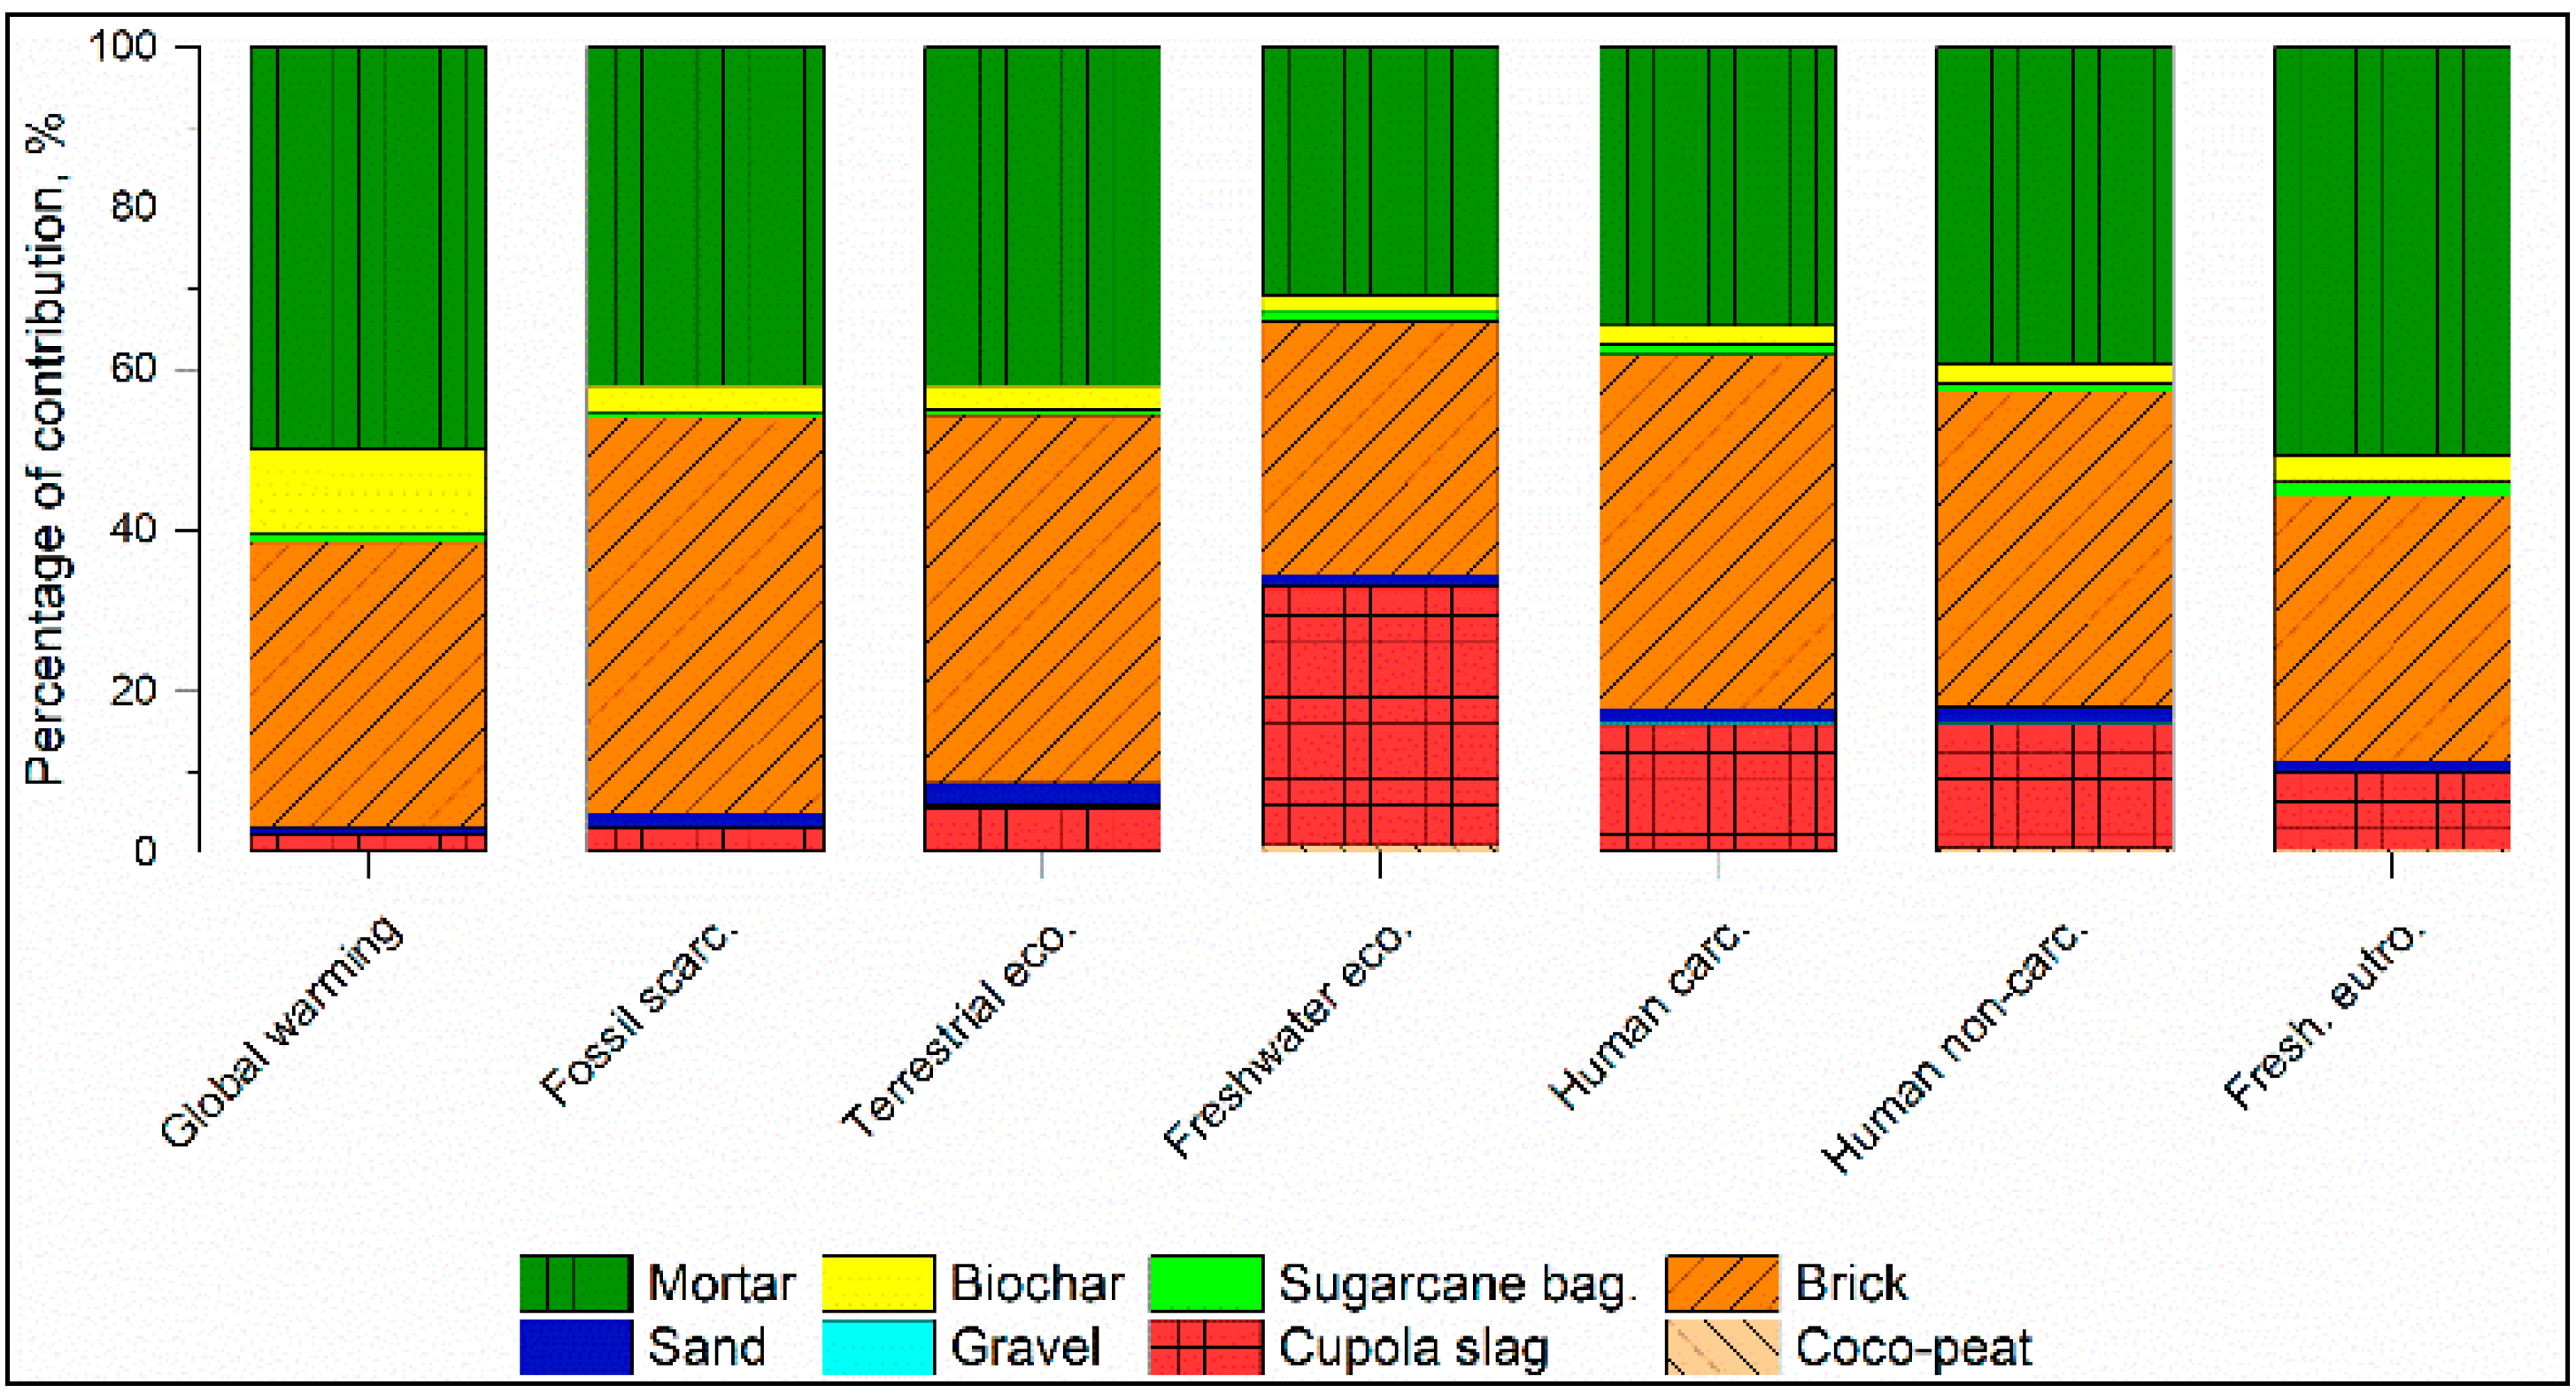
3.1. Assessment of the Impact from the Usage of Different Types of Media in Constructed Wetlands for the Treatment of Industrial Wastewater
3.1.1. Impact Assessment of the Overall Constructed Wetland Applications
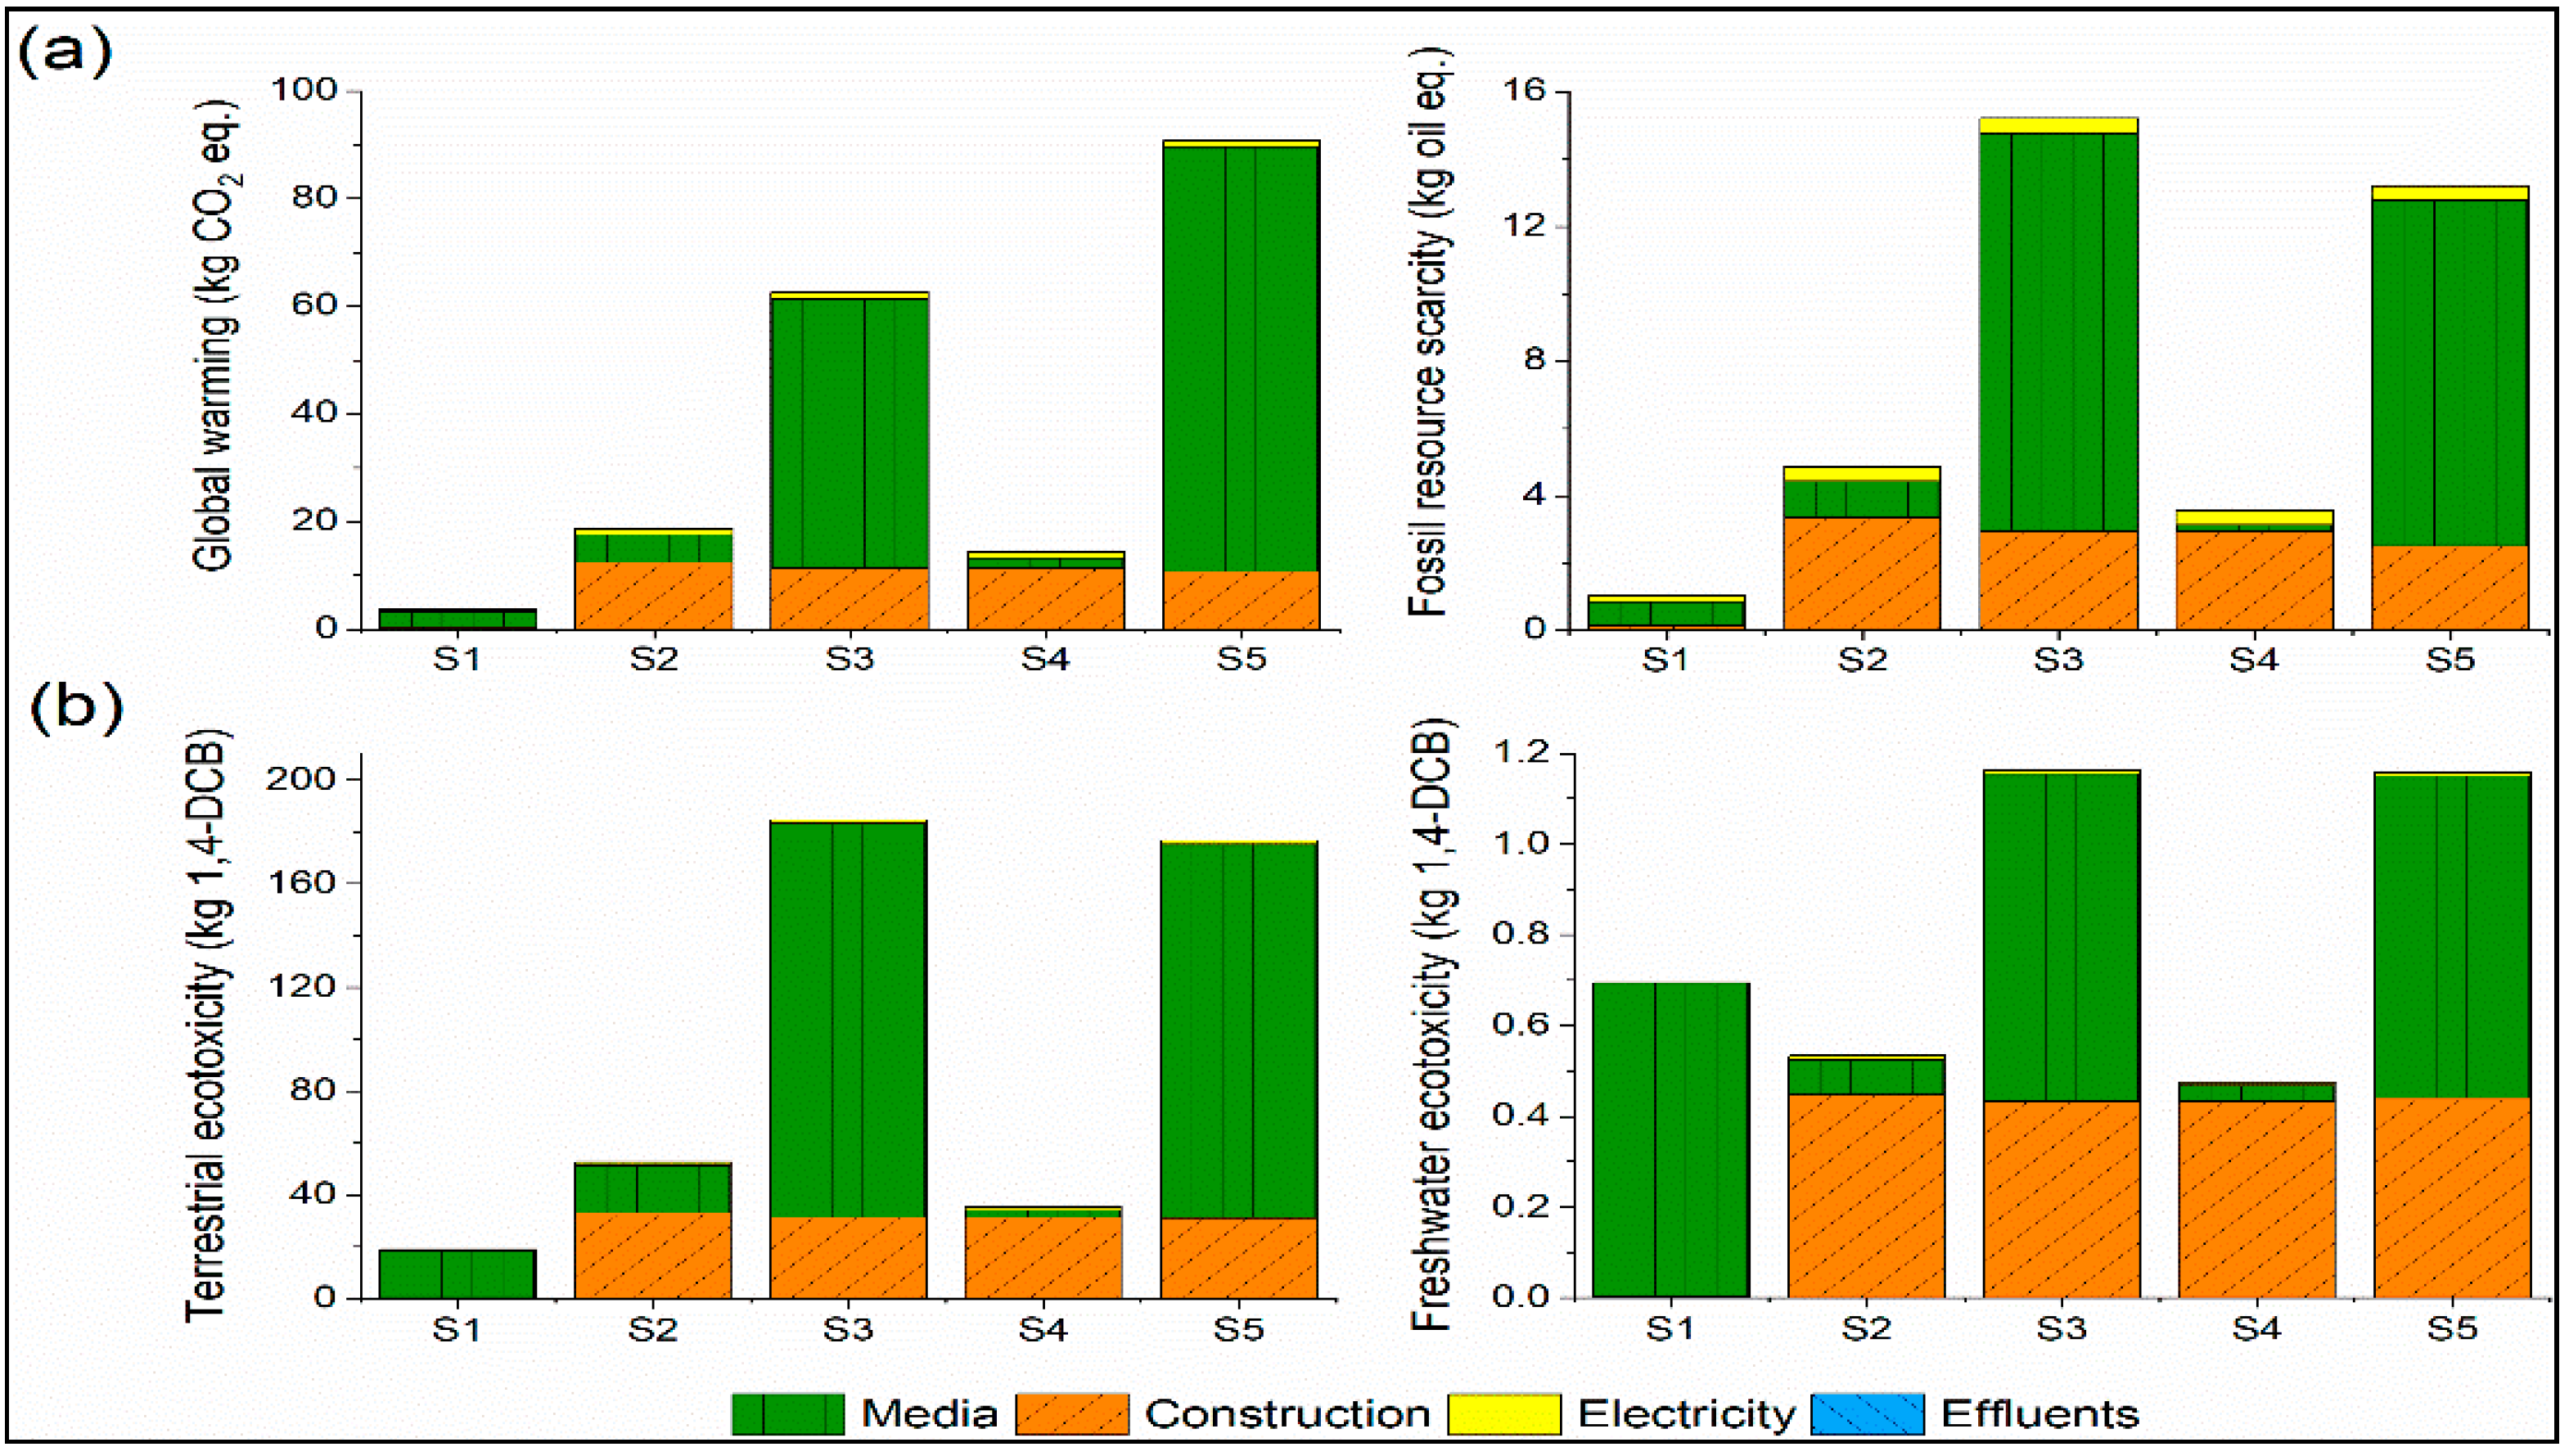
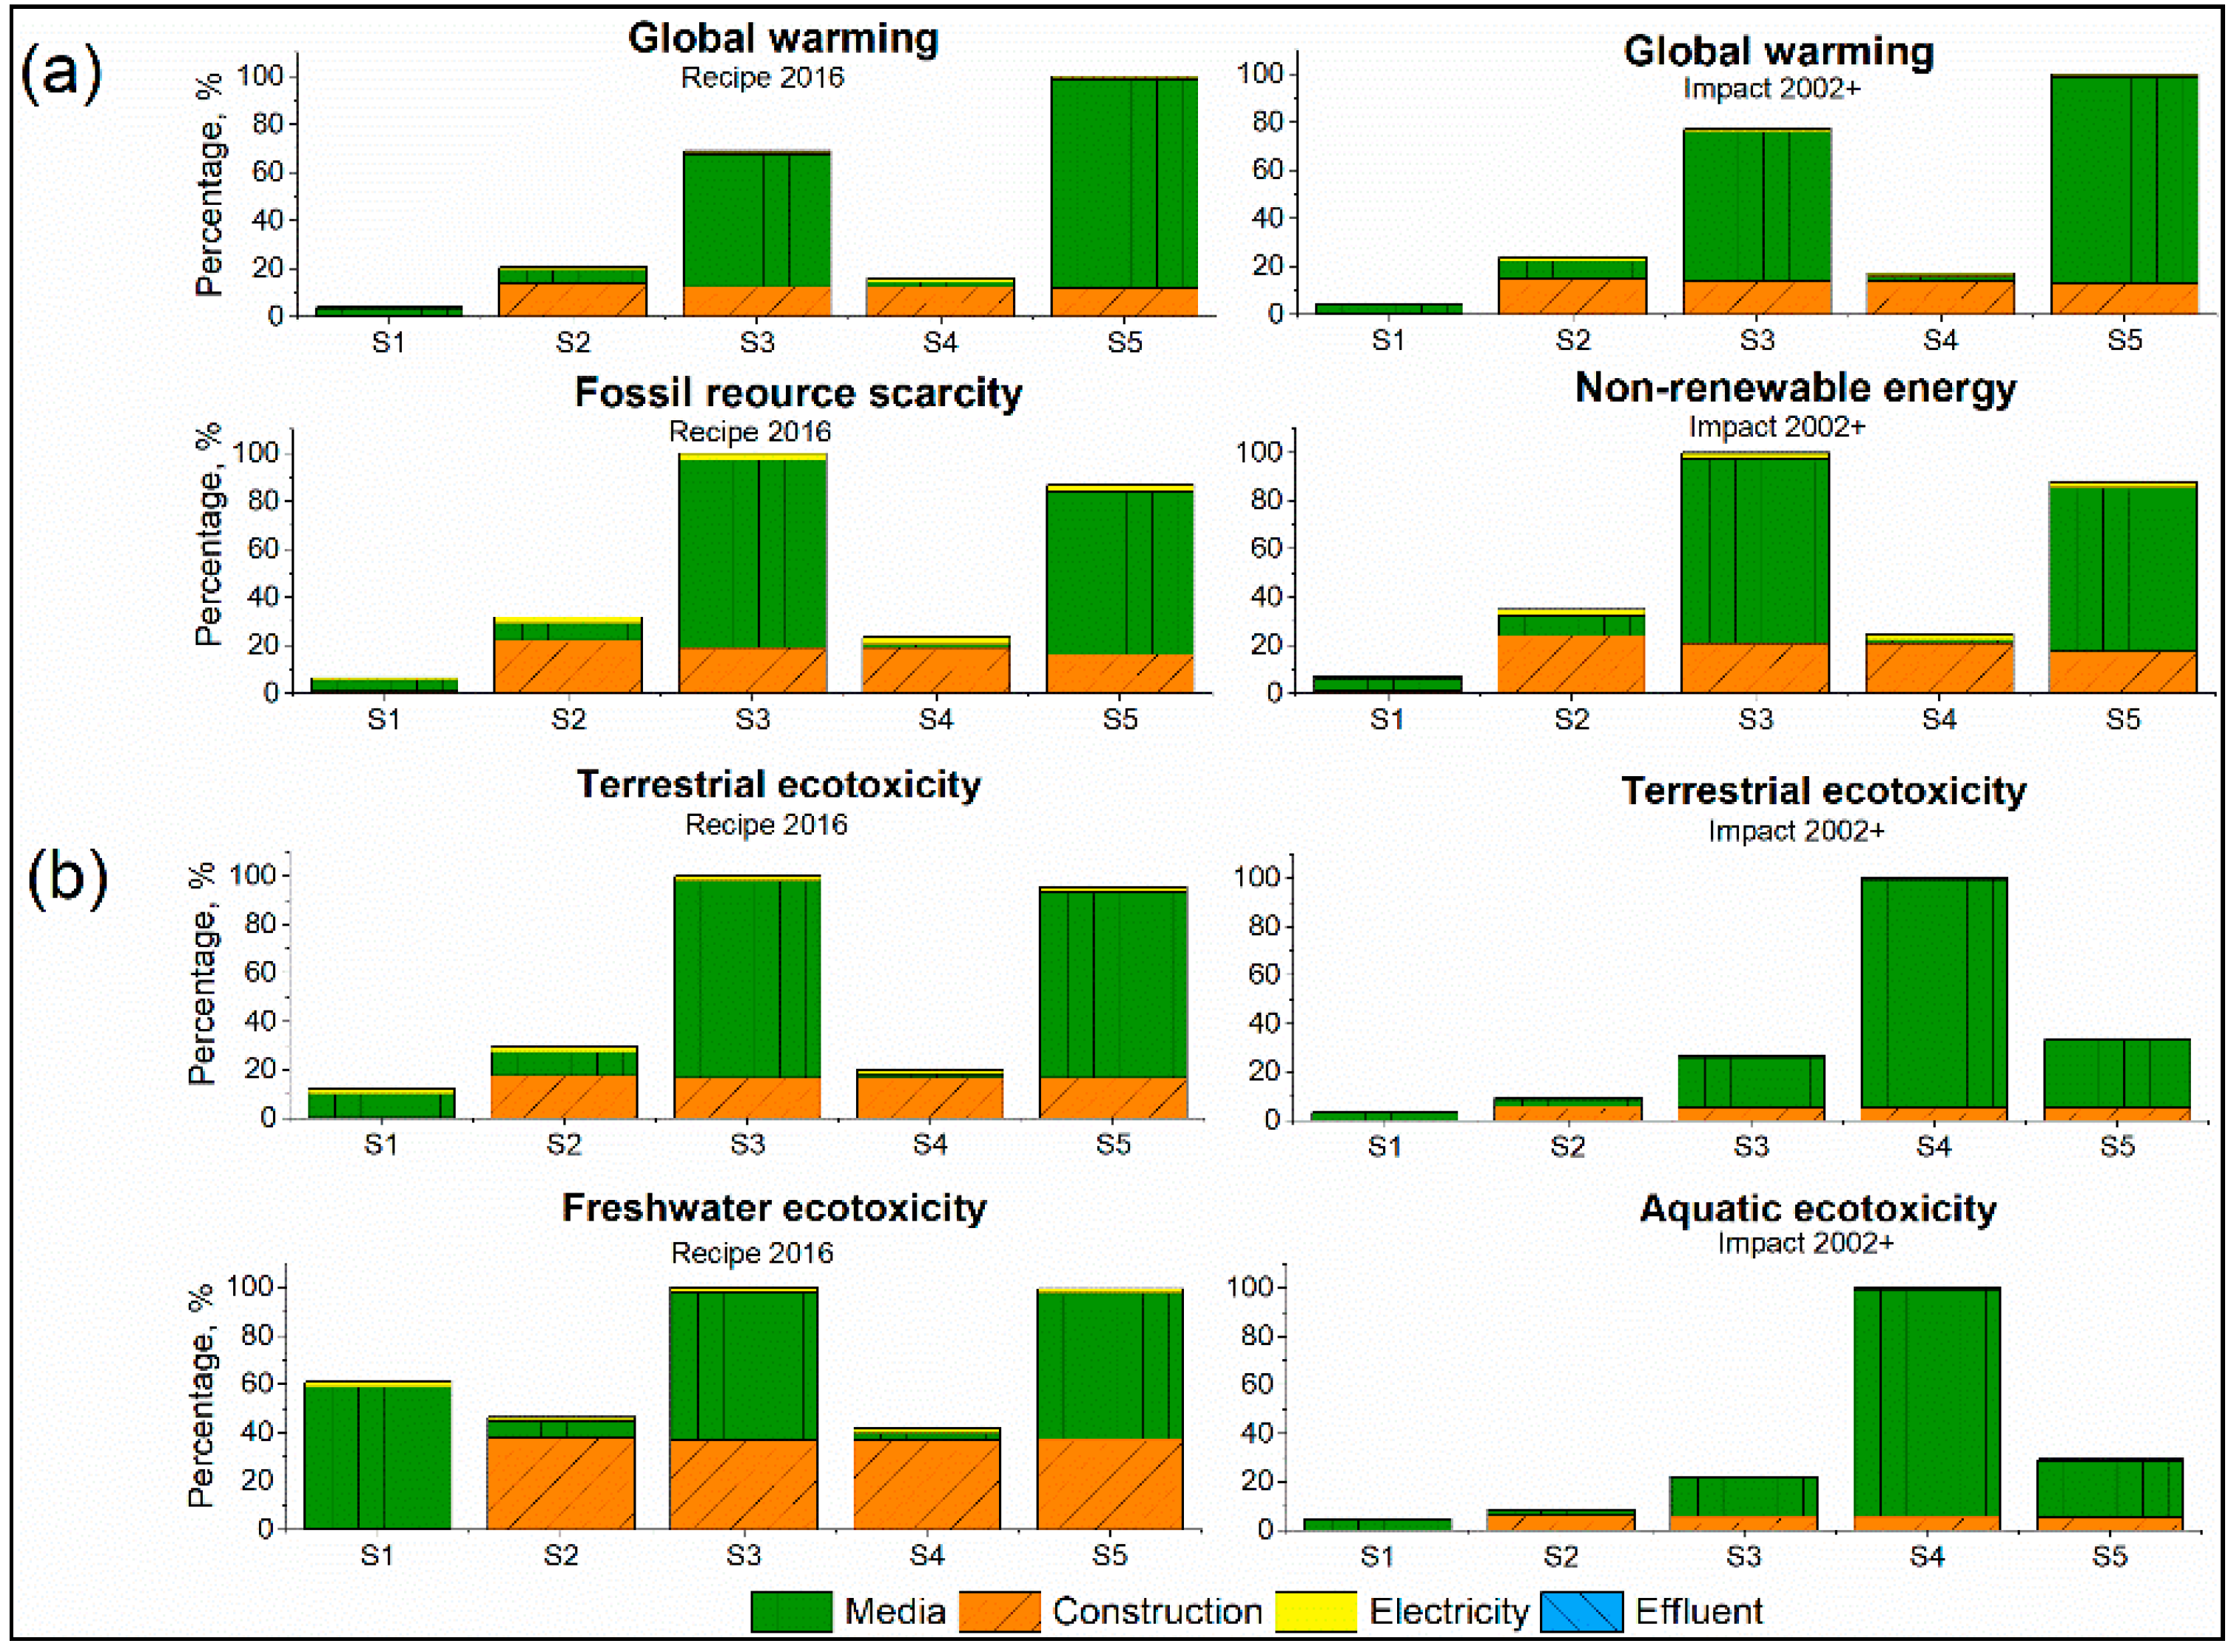
3.1.2. Global Warming and Fossil Resource Scarcity
3.1.3. Terrestrial and Freshwater Ecotoxicity
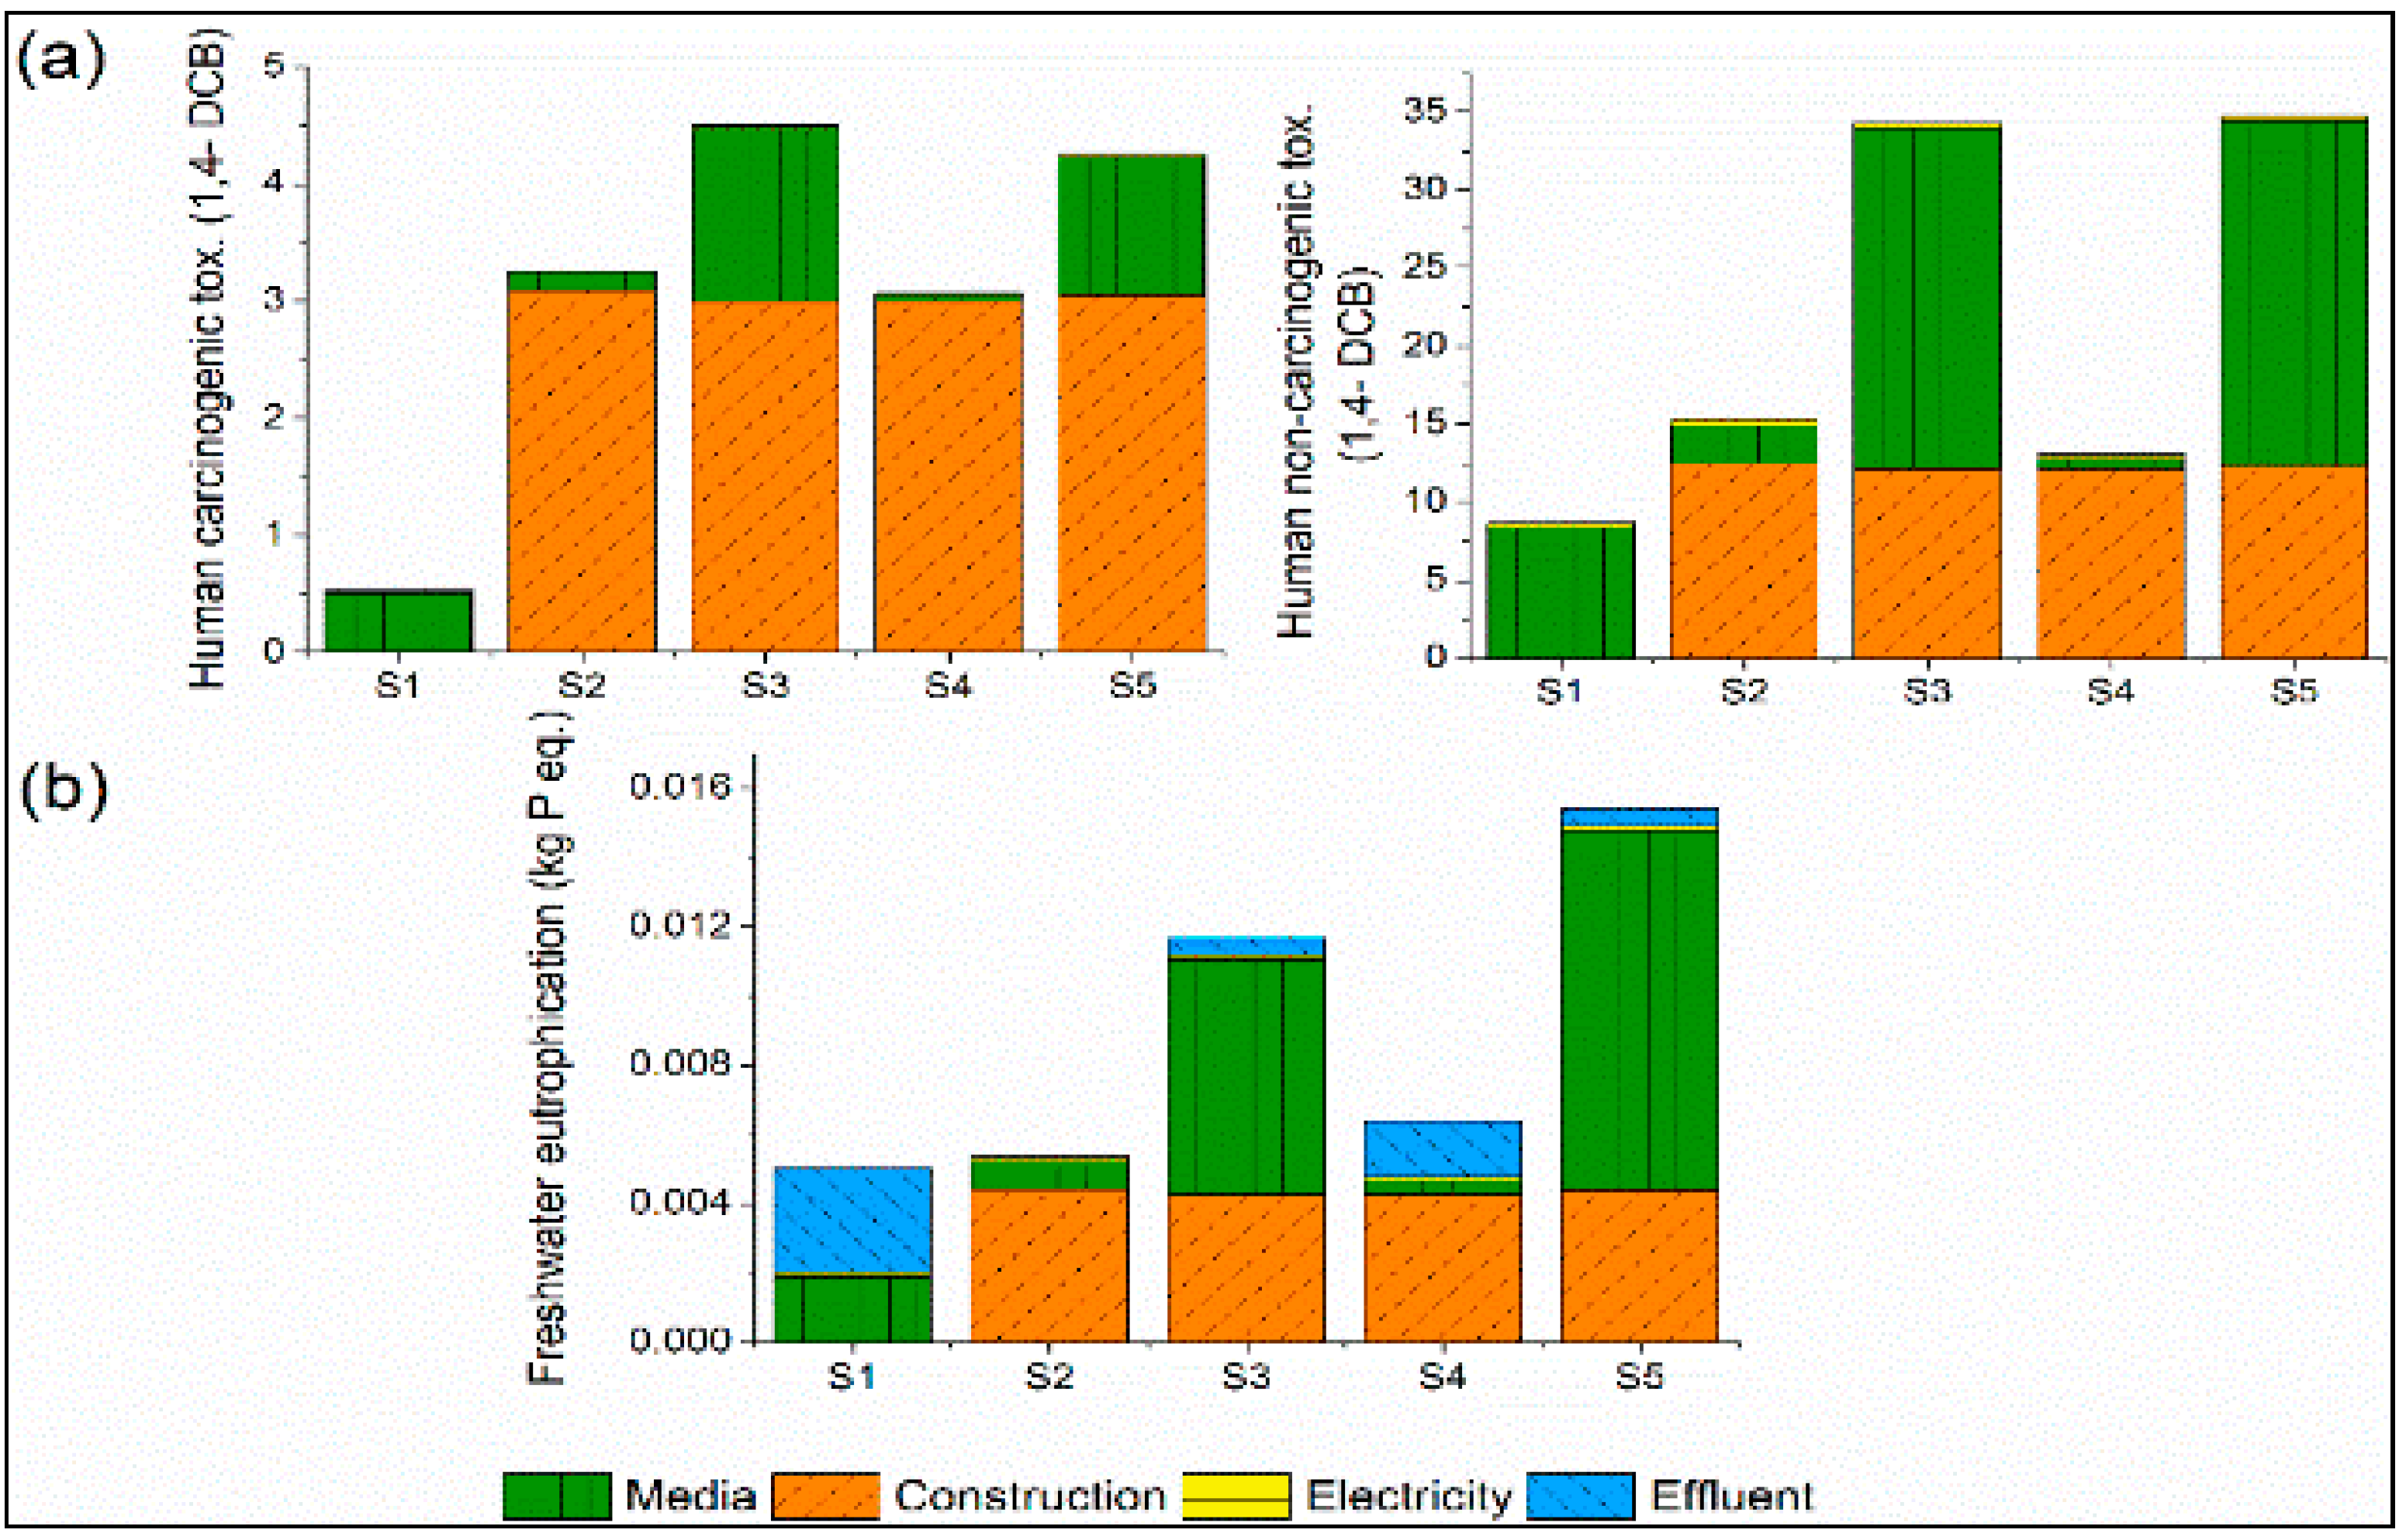
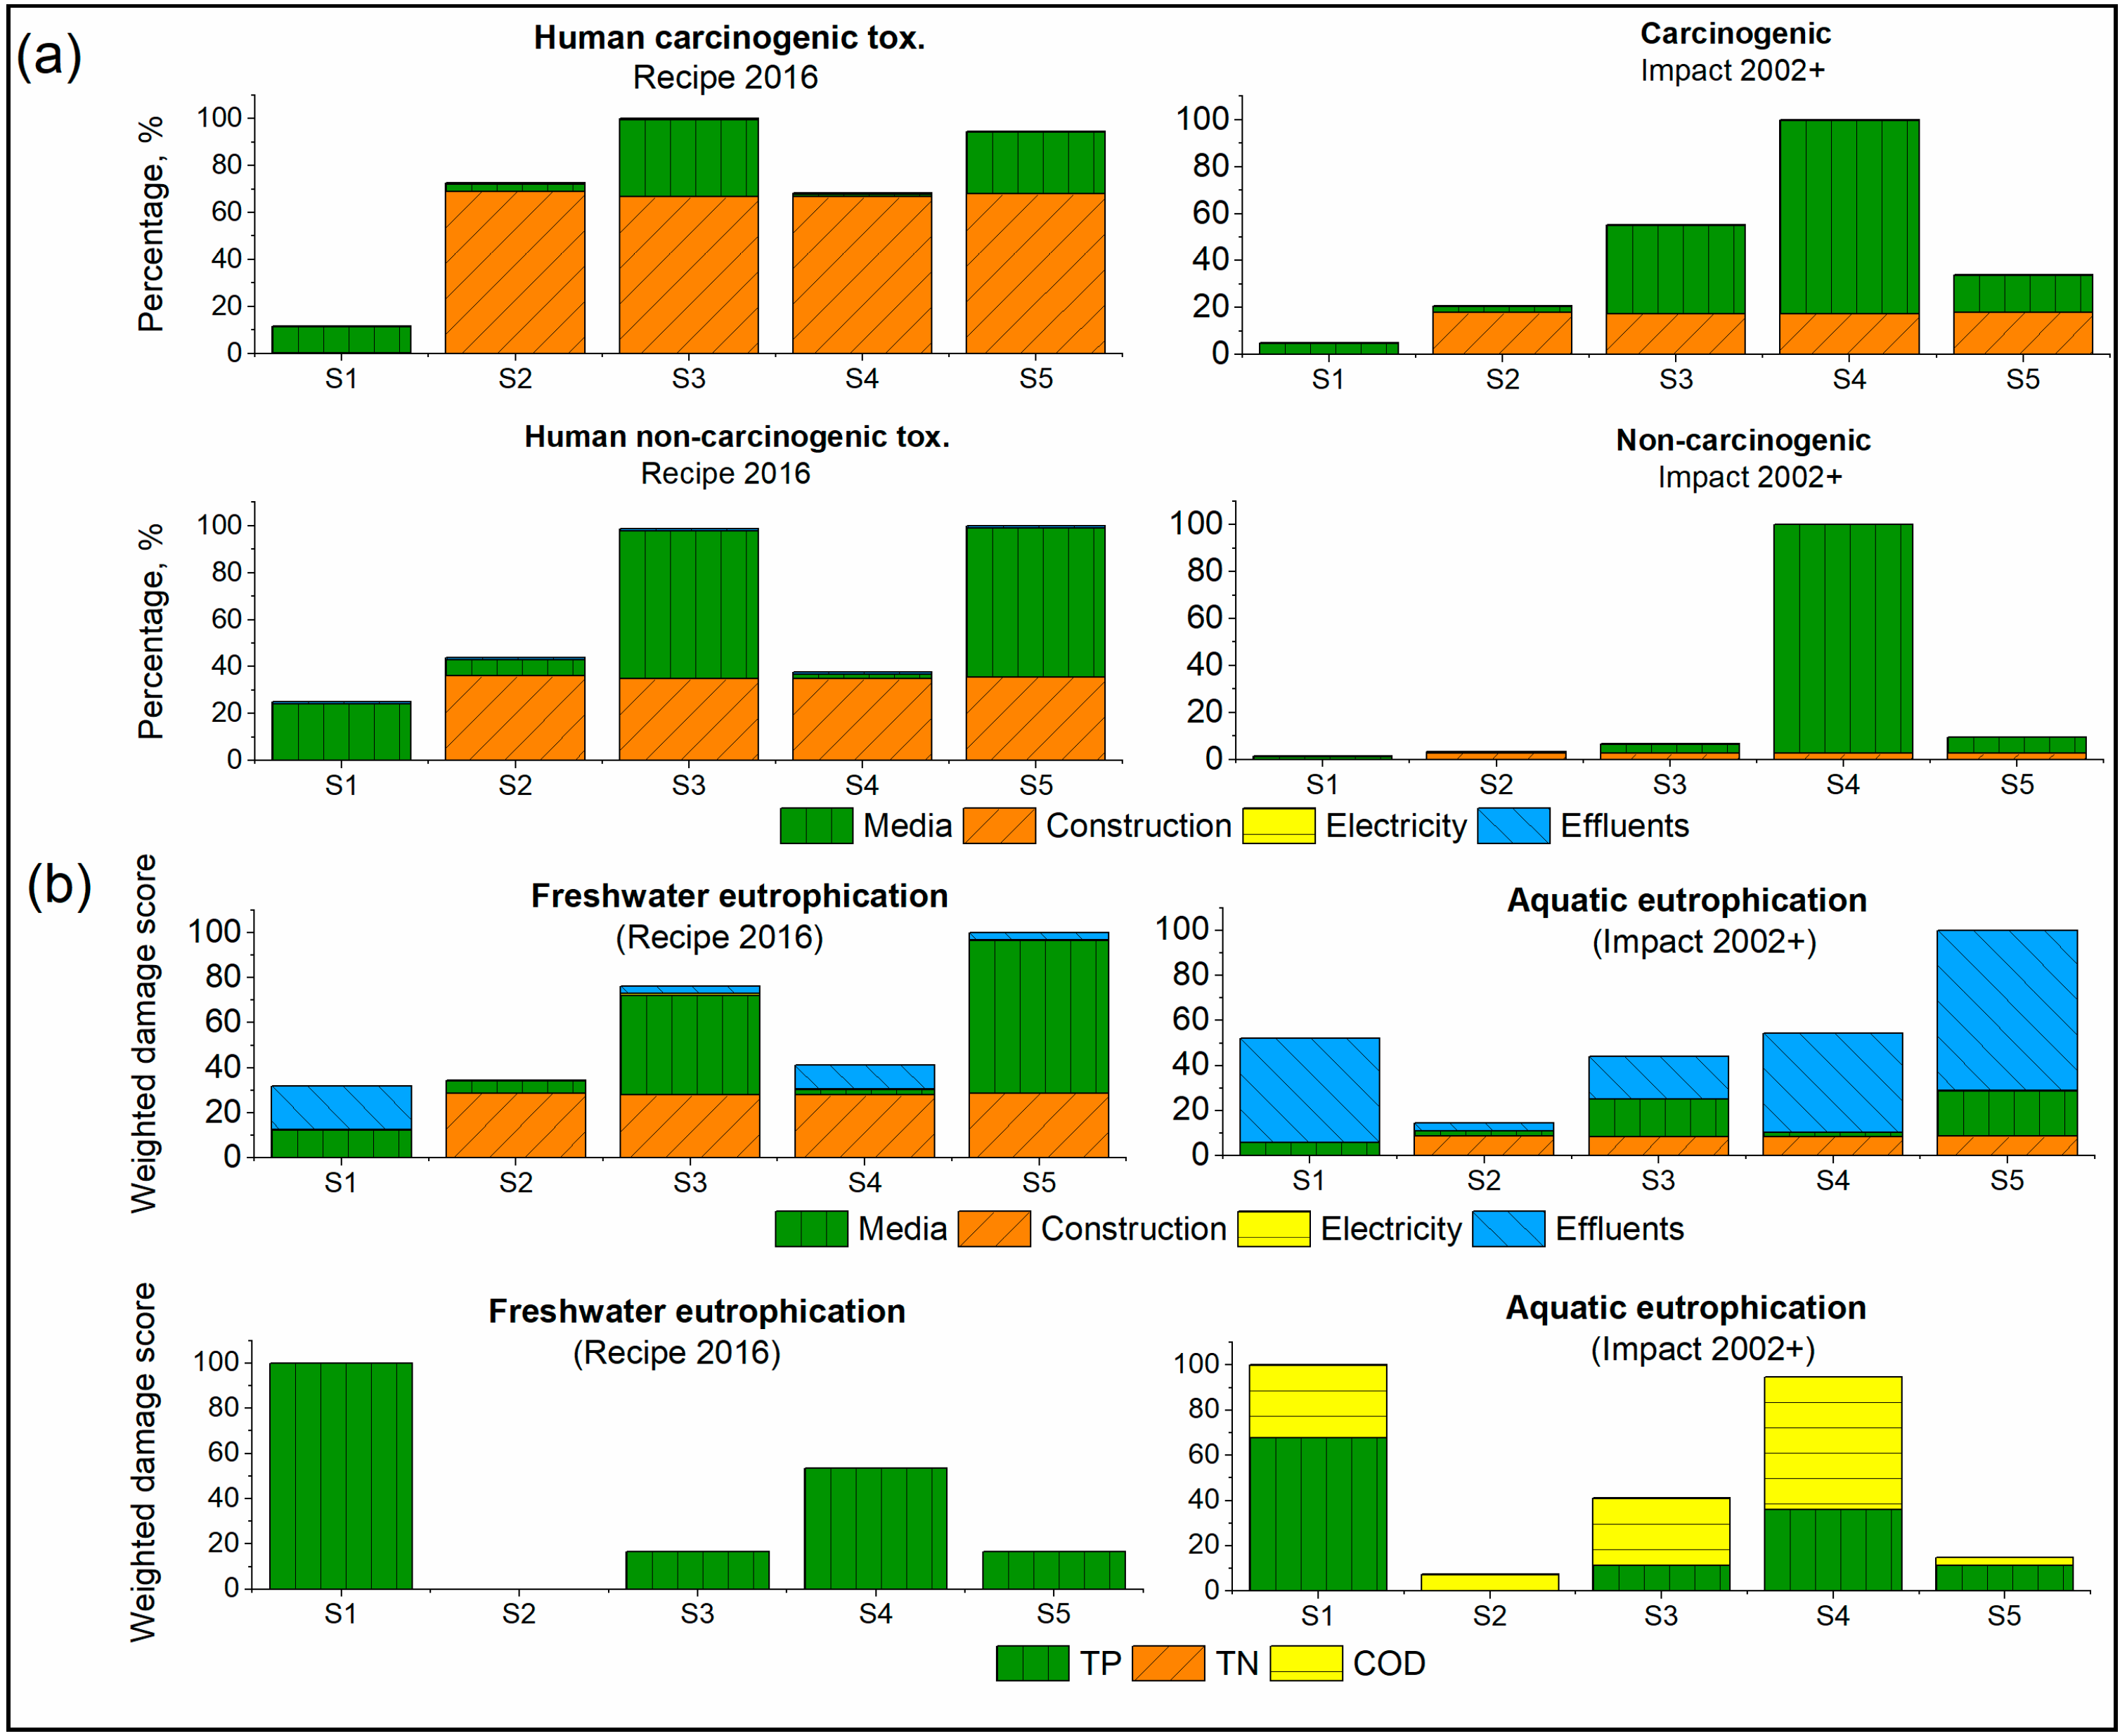
3.1.4. Human Carcinogenic and Non-Carcinogenic Toxicity
3.1.5. Freshwater Eutrophication
3.2. Assessment of the Impact from Constructed Wetland Systems for Landfill Leachate from Municipal Solid Waste
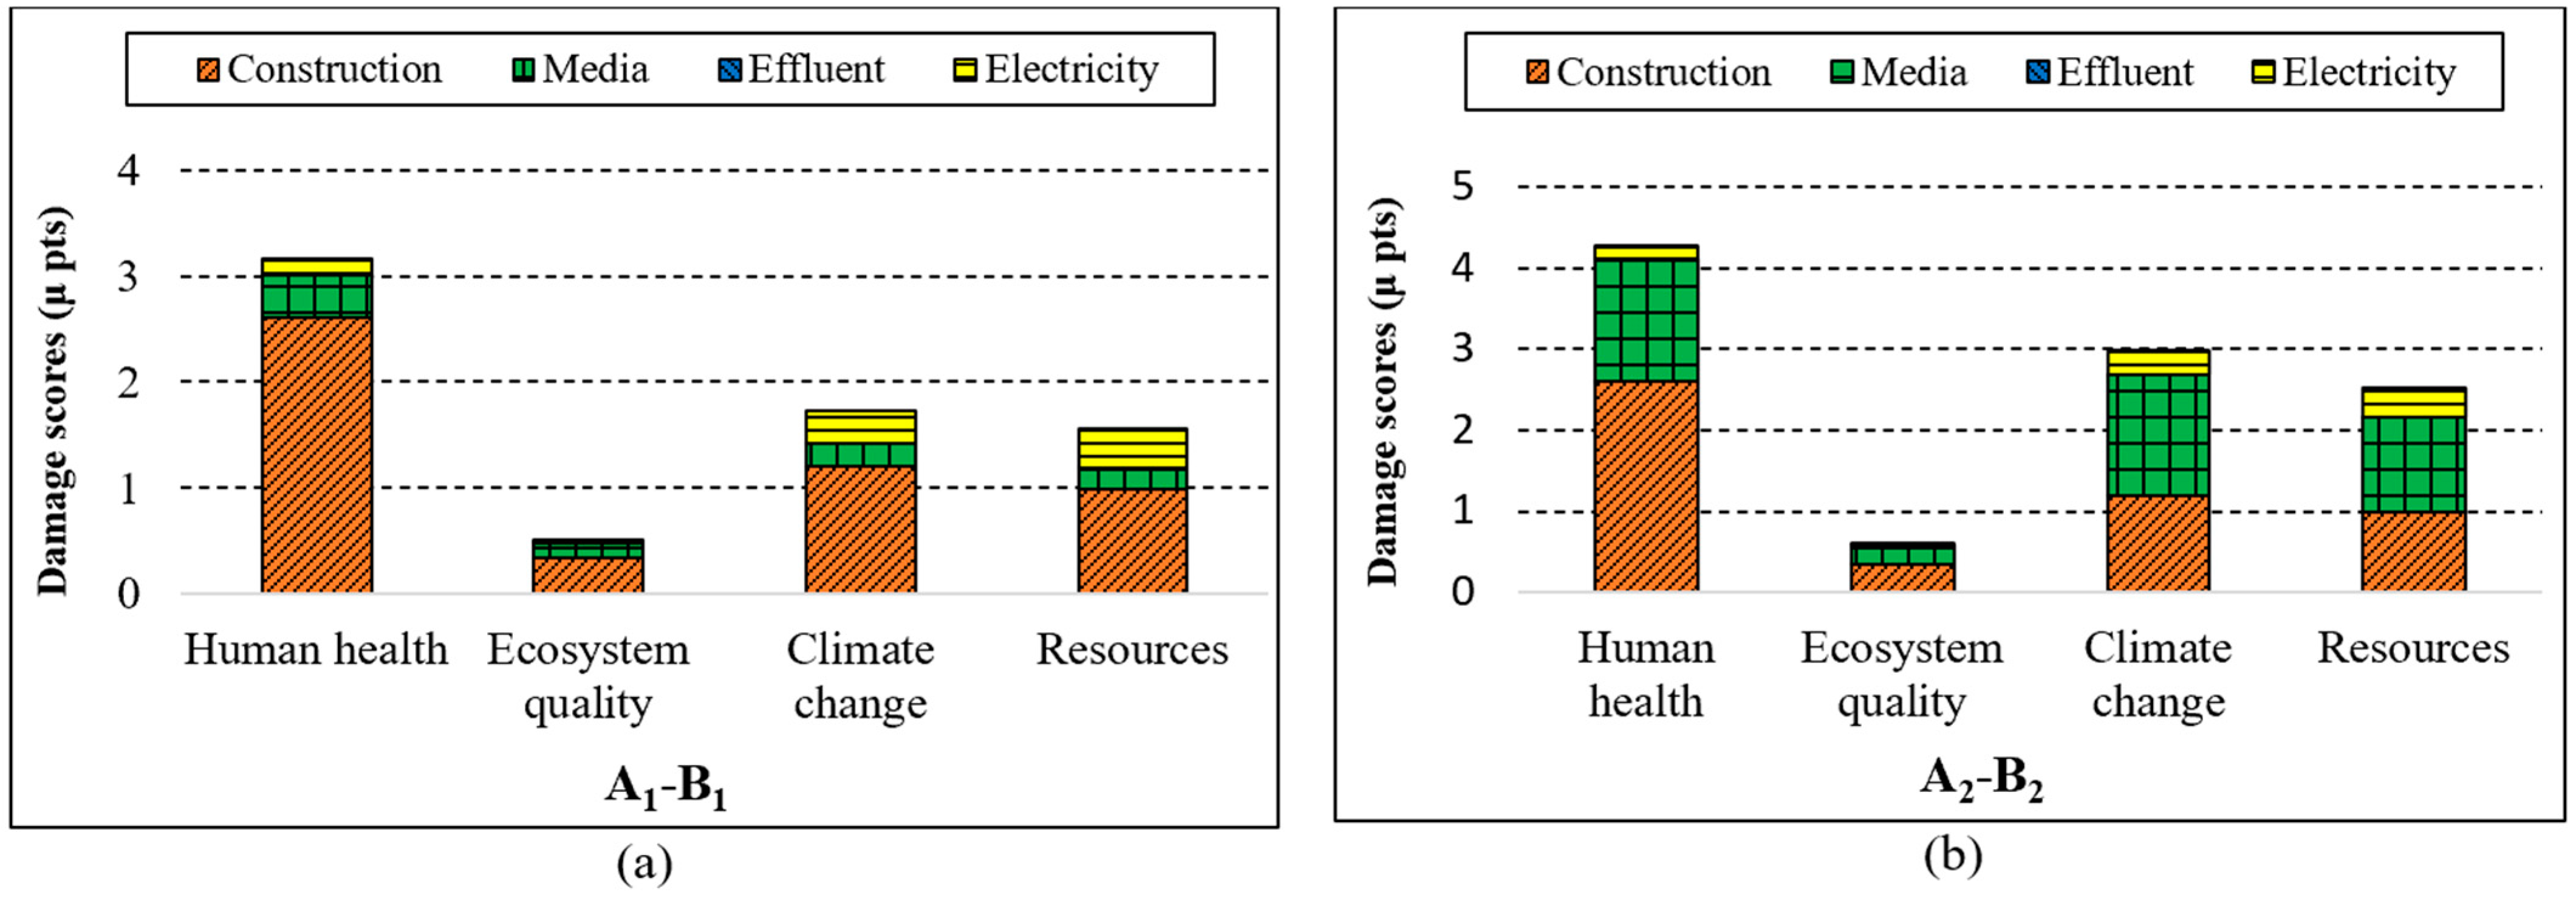
3.2.1. Damage Categories
3.2.2. Mid-Point Categories
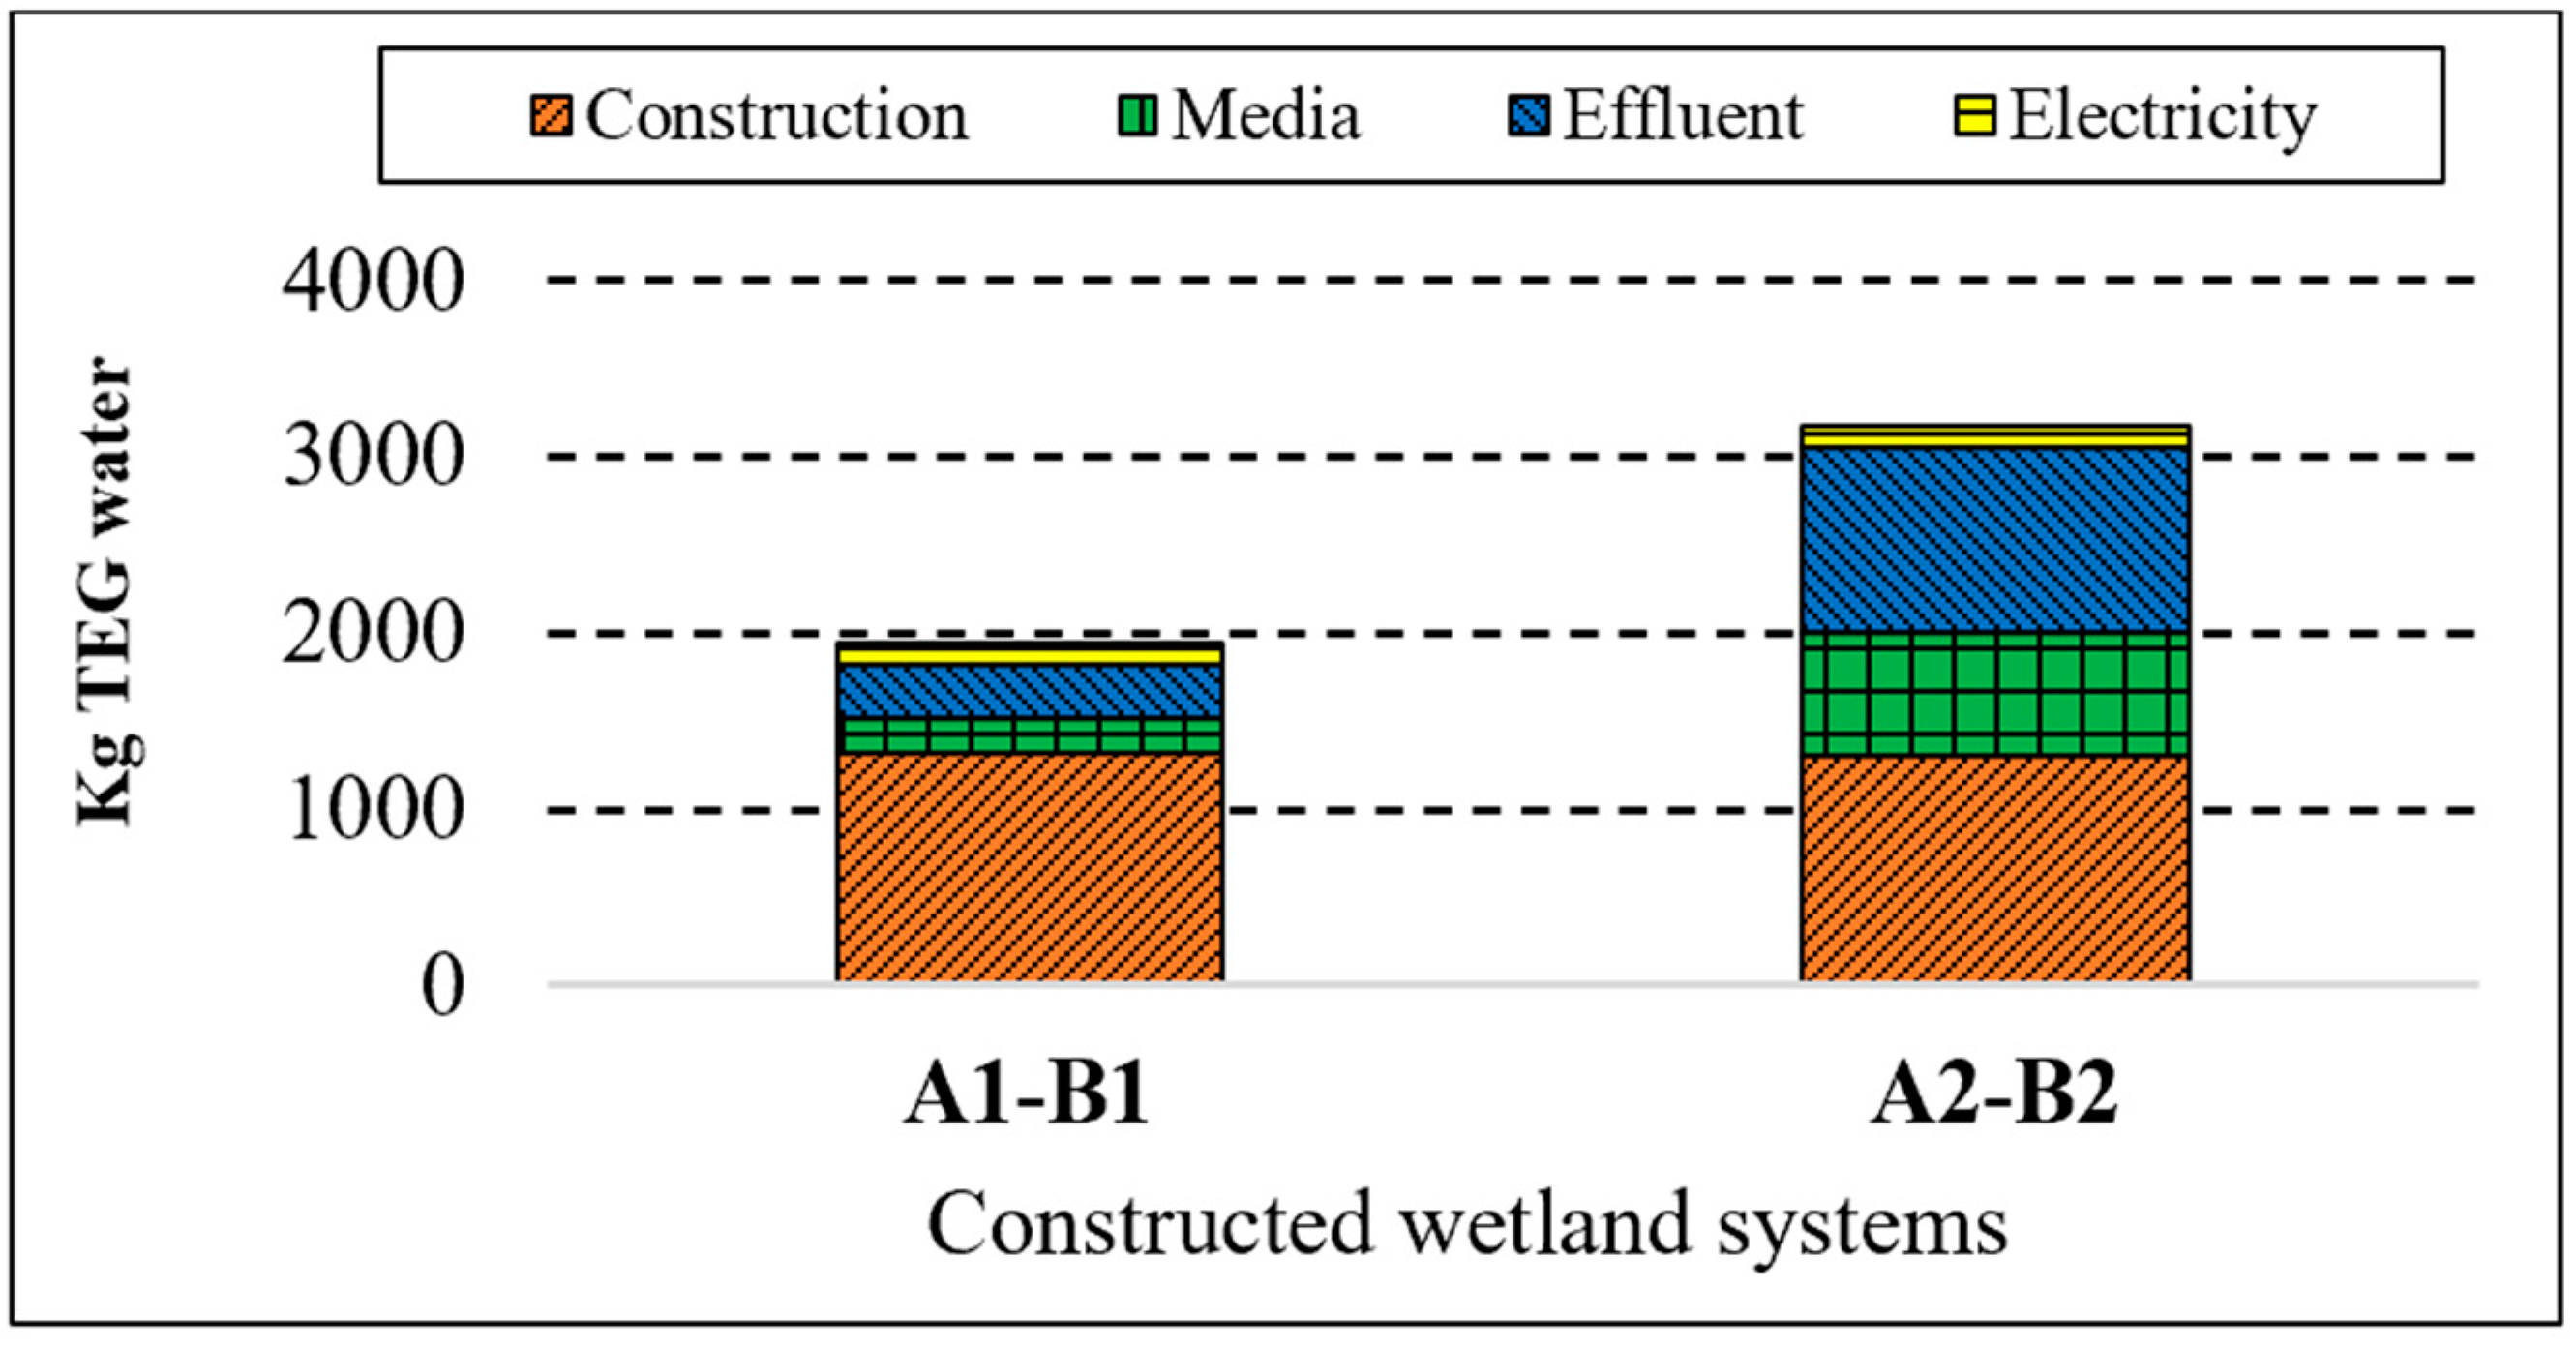
Aquatic Ecotoxicity
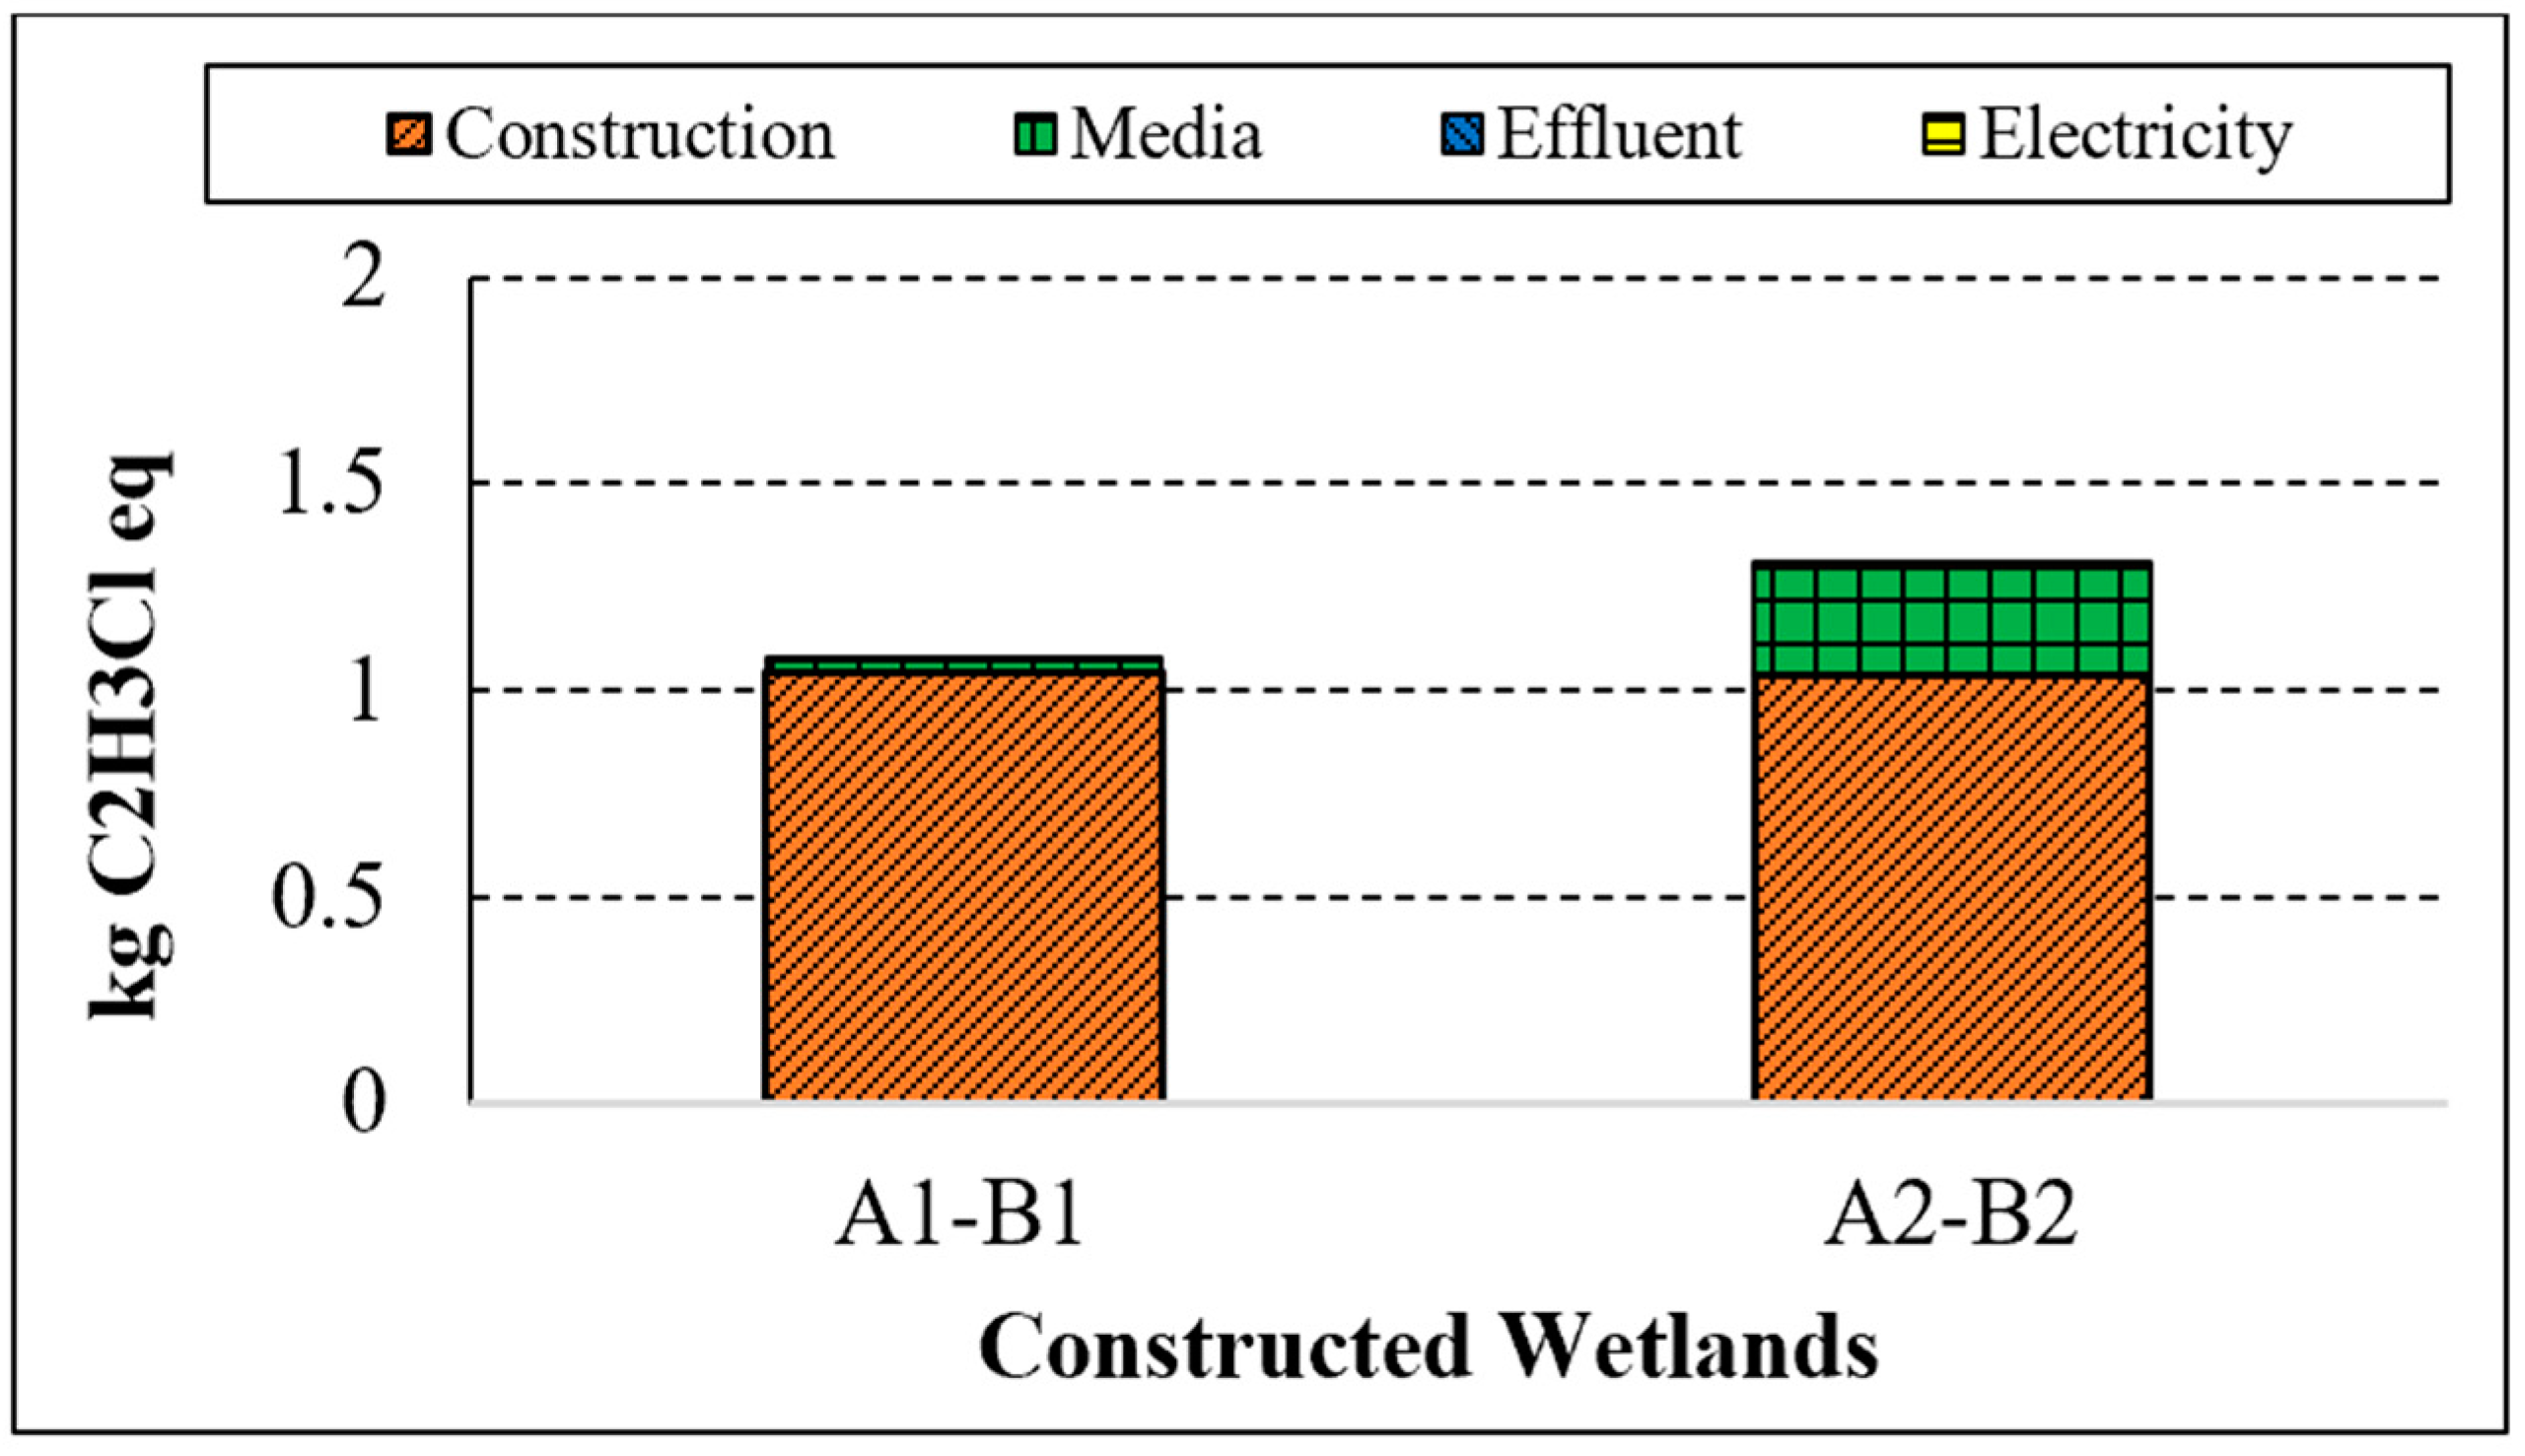
Carcinogens
Non-Carcinogens
3.3. Sensitivity of the Different LCA Methods on the Overall Impacts
3.4. Sensitivity Analysis of the Inventory Components
3.5. Uncertainty Analysis
4. Conclusions
Supplementary Materials
Author Contributions
Funding
Institutional Review Board Statement
Informed Consent Statement
Data Availability Statement
Acknowledgments
Conflicts of Interest
References
- Corbella, C.; Puigagut, J.; Garfí, M. Life cycle assessment of constructed wetland systems for wastewater treatment coupled with microbial fuel cells. Sci. Total. Environ. 2017, 584–585, 355–362. [Google Scholar] [CrossRef]
- Kadlec, R.; Wallace, S. Treatment Wetlands, 2nd ed.; CRC Press: Boca Raton, FL, USA, 2008. [Google Scholar]
- Saeed, T.; Sun, G. A review on nitrogen and organics removal mechanisms in subsurface flow constructed wetlands: Dependency on environmental parameters, operating conditions and supporting media. J. Environ. Manag. 2012, 112, 429–448. [Google Scholar] [CrossRef] [PubMed]
- Wu, H.; Zhang, J.; Ngo, H.H.; Guo, W.; Hu, Z.; Liang, S.; Fan, J.; Liu, H. A review on the sustainability of constructed wetlands for wastewater treatment: Design and operation. Bioresour. Technol. 2014, 175, 594–601. [Google Scholar] [CrossRef] [PubMed]
- Bohnes, F.A.; Hauschild, M.Z.; Schlundt, J.; Laurent, A. Life cycle assessments of aquaculture systems: A critical review of reported findings with recommendations for policy and system development. Rev. Aquac. 2018, 11, 1061–1079. [Google Scholar] [CrossRef] [Green Version]
- ISO 14040; Environmental Management—Life Cycle Assessment-Principles and Framework. International Standard: Geneva, Switzerland, 2006.
- Lutterbeck, C.A.; Kist, L.T.; Lopez, D.R.; Zerwes, F.V.; Machado, L. Life cycle assessment of integrated wastewater treatment systems with constructed wetlands in rural areas. J. Clean. Prod. 2017, 148, 527–536. [Google Scholar] [CrossRef]
- Garfí, M.; Flores, L.; Ferrer, I. Life Cycle Assessment of wastewater treatment systems for small communities: Activated sludge, constructed wetlands and high rate algal ponds. J. Clean. Prod. 2017, 161, 211–219. [Google Scholar] [CrossRef]
- Lopsik, K. Life cycle assessment of small-scale constructed wetland and extended aeration activated sludge wastewater treatment system. Int. J. Environ. Sci. Technol. 2013, 10, 1295–1308. [Google Scholar] [CrossRef] [Green Version]
- Nasution, M.A.; Wibawa, D.S.; Ahamed, T.; Noguchi, R. Comparative environmental impact evaluation of palm oil mill effluent treatment using a life cycle assessment approach: A case study based on composting and a combination for biogas technologies in North Sumatera of Indonesia. J. Clean. Prod. 2018, 184, 1028–1040. [Google Scholar] [CrossRef]
- Flores, L.; García, J.; Pena, R.; Garfí, M. Constructed wetlands for winery wastewater treatment: A comparative Life Cycle Assessment. Sci. Total. Environ. 2018, 659, 1567–1576. [Google Scholar] [CrossRef]
- Hassan, A.S.A.; Ahmed, H.Y.; Fadhil, H.A.; Zeghid, M.; Chehri, A.; El-Mottaleb, S.A.A. Implementation of Shared Laser–LED Sources in a Free Space Optics (FSO) Network under Environmental Impact. Electronics 2023, 12, 801. [Google Scholar] [CrossRef]
- DiMuro, J.L.; Guertin, F.M.; Helling, R.K.; Perkins, J.L.; Romer, S. A Financial and Environmental Analysis of Constructed Wetlands for Industrial Wastewater Treatment. J. Ind. Ecol. 2014, 18, 631–640. [Google Scholar] [CrossRef]
- Saeed, T.; Afrin, R.; Al Muyeed, A.; Sun, G. Treatment of tannery wastewater in a pilot-scale hybrid constructed wetland system in Bangladesh. Chemosphere 2012, 88, 1065–1073. [Google Scholar] [CrossRef] [PubMed]
- Saeed, T.; Khan, T. Constructed wetlands for industrial wastewater treatment: Alternative media, input biodegradation ratio and unstable loading. J. Environ. Chem. Eng. 2019, 7, 103042. [Google Scholar] [CrossRef]
- Saeed, T.; Muntaha, S.; Rashid, M.; Sun, G.; Hasnat, A. Industrial wastewater treatment in constructed wetlands packed with construction materials and agricultural by-products. J. Clean. Prod. 2018, 189, 442–453. [Google Scholar] [CrossRef]
- Saeed, T.; Yasmin, N.; Sun, G.; Hasnat, A. The use of biochar and crushed mortar in treatment wetlands to enhance the removal of nutrients from sewage. Environ. Sci. Pollut. Res. 2018, 26, 586–599. [Google Scholar] [CrossRef]
- Vandepaer, L.; Treyer, K.; Mutel, C.; Bauer, C.; Amor, B. The integration of long-term marginal electricity supply mixes in the ecoinvent consequential database version 3.4 and examination of modeling choices. Int. J. Life Cycle Assess. 2019, 24, 1409–1428. [Google Scholar] [CrossRef] [Green Version]
- Welz, T.; Hischier, R.; Hilty, L. Environmental impacts of lighting technologies—Life cycle assessment and sensitivity analysis. Environ. Impact Assess. Rev. 2011, 31, 334–343. [Google Scholar] [CrossRef]
- Niero, M.; Pizzol, M.; Bruun, H.G.; Thomsen, M. Comparative life cycle assessment of wastewater treatment in Denmark including sensitivity and uncertainty analysis. J. Clean. Prod. 2014, 68, 25–35. [Google Scholar] [CrossRef]
- Zhou, W.; Guan, K.; Peng, B.; Margenot, A.; Lee, D.; Tang, J.; Jin, Z.; Grant, R.; DeLucia, E.; Qin, Z.; et al. How does uncertainty of soil organic carbon stock affect the calculation of carbon budgets and soil carbon credits for croplands in the U.S. Midwest? Geoderma 2023, 429, 116254. [Google Scholar] [CrossRef]
- Rodriguez-Garcia, G.; Molinos-Senante, M.; Hospido, A.; Hernández-Sancho, F.; Moreira, M.; Feijoo, G. Environmental and economic profile of six typologies of wastewater treatment plants. Water Res. 2011, 45, 5997–6010. [Google Scholar] [CrossRef]
- Idrees, M.; Akbar, A.; Saeed, F.; Gull, M.; Eldin, S.M. Sustainable production of Low-Shrinkage fired clay bricks by utilizing waste plastic dust. Alex. Eng. J. 2023, 68, 405–416. [Google Scholar] [CrossRef]
- Bošković, I.; Radivojević, A. Life cycle greenhouse gas emissions of hemp-lime concrete wall constructions in Serbia: The impact of carbon sequestration, transport, waste production and end of life biogenic carbon emission. J. Build. Eng. 2023, 66, 105908. [Google Scholar] [CrossRef]
- Wang, C.-Q.; Chen, S.; Huang, D.-M.; Huang, Q.-C.; Li, X.-Q.; Shui, Z.-H. Safe environmentally friendly reuse of red mud modified phosphogypsum composite cementitious material. Constr. Build. Mater. 2023, 368, 130348. [Google Scholar] [CrossRef]
- Menghini, M.; Pedrazzani, R.; Feretti, D.; Mazzoleni, G.; Steimberg, N.; Urani, C.; Zerbini, I.; Bertanza, G. Beyond the Black Box of Life Cycle Assessment in the Wastewater Treatment Plants: Which Help from the Bioassays? Preprints 2023, 2023010232. [Google Scholar] [CrossRef]
- Renou, S.; Thomas, J.; Aoustin, E.; Pons, M. Influence of impact assessment methods in wastewater treatment LCA. J. Clean. Prod. 2008, 16, 1098–1105. [Google Scholar] [CrossRef]
- Owsianiak, M.; Laurent, A.; Bjørn, A.; Hauschild, M.Z. IMPACT 2002+, ReCiPe 2008 and ILCD’s recommended practice for characterization modelling in life cycle impact assessment: A case study-based comparison. Int. J. Life Cycle Assess. 2014, 19, 1007–1021. [Google Scholar] [CrossRef]


| Unit | S1 | S2 | S3 | S4 | S5 | |
|---|---|---|---|---|---|---|
| System Characteristics | ||||||
| Flow rate | L d−1 | 38 | 4 | 4 | 4 | 6 |
| Plants used | Phragmites australis | Phragmites australis | Canna indica | Canna indica | Phragmites australis | |
| Hydraulic retention time | D | 12.5 | 32.8 | 27.9 | 27.9 | 28.3 |
| No. of vertical CW cells | 2 | 2 | 1 | 1 | 1 | |
| vertical cell dimensions | m (H × D) | 0.73 × 0.91 | 1.5 × 0.15 | 1.53 × 0.15 | 1.53 × 0.15 | 2.13 × 0.15 |
| No. of horizontal CW cells | 1 | 1 | 1 | 1 | 1 | |
| horizontal cell dimensions | m (H × L × W) | 0.78 × 1.32 × 1.01 | 0.5 × 1.22 × 0.61 | 0.92 × 0.90 × 0.30 | 0.92 × 0.90 × 0.30 | 0.91 × 1.22 × 0.61 |
| Influent quality | ||||||
| BOD5 | mg/L | 4200 (43.5) | 131.5 (3.4) | 215 (6.1) | 215 (5.5) | 96.4 (4.5) |
| COD | mg/L | 11500 (410.2) | 420.3 (13.3) | 1098 (32.5) | 1098 (21.4) | 171.5 (10.5) |
| TN | mg/L | 100.3 (5.4) | 31.3 (1.9) | 17.3 (1.5) | 17.3 (1.4) | 59.3 (3.5) |
| TP | mg/L | 30 (2.1) | 2.3 (0.2) | 4.6 (0.12) | 4.6 (0.2) | 14.1 (0.4) |
| Effluent quality | ||||||
| BOD5 | mg/L | 80 (3.5) | 8.8 (1.5) | 28.4 (3.5) | 56.2 (4.8) | 3.7 (0.5) |
| COD | mg/L | 200 (5.1) | 45.2 (3.9) | 184 (4.2) | 362.9 (8.2) | 22.2 (1.5) |
| TN | mg/L | 49.8 (5.2) | 3.1 (0.15) | 3.4 (0.2) | 5.6 (0.3) | 2.4 (0.2) |
| TP | mg/L | 3 (0.25) | 0 | 0.5 (0.05) | 1.6 (0.01) | 0.5 (0.01) |
| Reference | [14] | [15] | [16] | [16] | [17] |
| CW Systems | ||||||
|---|---|---|---|---|---|---|
| Unit | S1 | S2 | S3 | S4 | S5 | |
| Construction materials | ||||||
| PVC | kg/m3 | 0.125 | 1.562 | 1.195 | 1.197 | 0.757 |
| Steel | kg/m3 | _ | 3.59 | 3.51 | 3.51 | 3.63 |
| Media materials | ||||||
| Coco-peat | kg/m3 | 0.274 | _ | _ | _ | _ |
| Scraped metals | kg/m3 | 38.06 | _ | _ | _ | _ |
| Local gravel | kg/m3 | 31.23 | 8 | _ | _ | _ |
| Cement mortar | kg/m3 | _ | 8.88 | _ | _ | 232.48 |
| Brick | kg/m3 | _ | 5.92 | 154.15 | _ | _ |
| Sylhet sand | kg/m3 | _ | 108.04 | _ | _ | 95.36 |
| Sugarcane bagasse | kg/m3 | _ | _ | _ | 16.08 | _ |
| Biochar | kg/m3 | _ | _ | _ | _ | 7.89 |
| Electricity | kWh/m3 | 0.67 | 1.65 | 1.70 | 1.70 | 1.67 |
| Direct emissions to water | ||||||
| TN | g/m3 | 49.8 | 3.1 | 3.4 | 5.6 | 2.4 |
| TP | g/m3 | 3 | 0 | 0.5 | 1.6 | 0.5 |
| COD | g/m3 | 200 | 45.2 | 184 | 362.9 | 22.2 |
| CW System | Raw Water Impact on Freshwater Eutrophication (kg P eq.) | Treated Water Impact on Freshwater Eutrophication (kg P eq.) | Treatment Efficiency (%) | Types of Wastewater Treated |
|---|---|---|---|---|
| S1 | 0.0300 | 0.0030 | 90.00 | Tannery |
| S2 | 0.0023 | 0.0000 | 100.00 | Industrial |
| S3 | 0.0046 | 0.0005 | 89.13 | Industrial |
| S4 | 0.0046 | 0.0016 | 65.22 | Industrial |
| S5 | 0.0141 | 0.0005 | 96.45 | Sewage |
| CWs | Parameters | Impact Categories | ||||||
|---|---|---|---|---|---|---|---|---|
| Global Warming | Terrestrial Ecotoxicity | Freshwater Ecotoxicity | Human Carcinogen | Human Non-Carcinogen | Fossil Scarc. | Freshwater Eutro. | ||
| S1 | Slag | ±0.416 | ±0.733 | ±0.934 | ±0.922 | ±0.910 | ±0.342 | ±0.353 |
| Gravel | ±0.063 | ±0.119 | ±0.013 | ±0.033 | ±0.035 | ±0.065 | ±0.017 | |
| S2 | Steel | ±0.440 | ±0.524 | ±0.775 | ±0.903 | ±0.780 | ±0.299 | ±0.798 |
| PVC | ±0.169 | ±0.079 | ±0.043 | ±0.046 | ±0.041 | ±0.312 | ±0.023 | |
| Mortar | ±0.120 | ±0.088 | ±0.045 | ±0.012 | ±0.050 | ±0.064 | ±0.068 | |
| Brick | ±0.094 | ±0.106 | ±0.051 | ±0.017 | ±0.055 | ±0.082 | ±0.048 | |
| S3 | Steel | ±0.136 | ±0.151 | ±0.352 | ±0.642 | ±0.339 | ±0.102 | ±0.358 |
| Brick | ±0.776 | ±0.811 | ±0.613 | ±0.328 | ±0.637 | ±0.613 | ±0.579 | |
| S4 | Steel | ±0.543 | ±0.742 | ±0.845 | ±0.940 | ±0.890 | ±0.381 | ±0.656 |
| PVC | ±0.162 | ±0.087 | ±0.037 | ±0.038 | ±0.037 | ±0.310 | ±0.015 | |
| Bagasse | ±0.110 | ±0.068 | ±0.051 | ±0.016 | ±0.047 | ±0.044 | ±0.056 | |
| S5 | Biochar | ±0.145 | ±0.049 | ±0.032 | ±0.016 | ±0.033 | ±0.050 | ±0.040 |
| Steel | ±0.098 | ±0.163 | ±0.366 | ±0.701 | ±0.346 | ±0.120 | ±0.127 | |
| Mortar | ±0.695 | ±0.711 | ±0.549 | ±0.249 | ±0.576 | ±0.666 | ±0.617 | |
| CWs | Parameters | Impact Categories | ||||||
|---|---|---|---|---|---|---|---|---|
| Global Warming | Terrestrial Ecotoxicity | Freshwater Ecotoxicity | Human Carcinogen | Human Non-Carcinogen | Fossil Scarc. | Freshwater Eutro. | ||
| S1 | CV | ±7.09% | ±8.58% | ±9.28% | ±9.17% | ±9.50% | ±6.46% | ±9.44% |
| CI | ±0.44% | ±0.53% | ±0.58% | ±0.57% | ±0.59% | ±0.40% | ±0.59% | |
| S2 | CV | ±5.04% | ±5.81% | ±7.73% | ±9.05% | ±7.81% | ±4.87% | ±8.01% |
| CI | ±0.31% | ±0.36% | ±0.48% | ±0.56% | ±0.48% | ±0.30% | ±0.49% | |
| S3 | CV | ±8.21% | ±8.28% | ±7.35% | ±7.74% | ±7.27% | ±7.83% | ±6.87% |
| CI | ±0.51% | ±0.51% | ±0.46% | ±0.48% | ±0.45% | ±0.49% | ±0.43% | |
| S4 | CV | ±6.79% | ±7.93% | ±8.59% | ±9.45% | ±9.33% | ±5.76% | ±6.88% |
| CI | ±0.42% | ±0.49% | ±0.53% | ±0.59% | ±0.58% | ±0.36% | ±0.43% | |
| S5 | CV | ±7.40% | ±7.36% | ±6.67% | ±7.62% | ±6.49% | ±7.10% | ±6.81% |
| CI | ±0.46% | ±0.46% | ±0.41% | ±0.47% | ±0.40% | ±0.44% | ±0.42% | |
Disclaimer/Publisher’s Note: The statements, opinions and data contained in all publications are solely those of the individual author(s) and contributor(s) and not of MDPI and/or the editor(s). MDPI and/or the editor(s) disclaim responsibility for any injury to people or property resulting from any ideas, methods, instructions or products referred to in the content. |
© 2023 by the authors. Licensee MDPI, Basel, Switzerland. This article is an open access article distributed under the terms and conditions of the Creative Commons Attribution (CC BY) license (https://creativecommons.org/licenses/by/4.0/).
Share and Cite
Alam, M.K.; Islam, M.A.S.; Saeed, T.; Rahman, S.M.; Majed, N. Life Cycle Analysis of Lab-Scale Constructed Wetlands for the Treatment of Industrial Wastewater and Landfill Leachate from Municipal Solid Waste: A Comparative Assessment. Water 2023, 15, 909. https://doi.org/10.3390/w15050909
Alam MK, Islam MAS, Saeed T, Rahman SM, Majed N. Life Cycle Analysis of Lab-Scale Constructed Wetlands for the Treatment of Industrial Wastewater and Landfill Leachate from Municipal Solid Waste: A Comparative Assessment. Water. 2023; 15(5):909. https://doi.org/10.3390/w15050909
Chicago/Turabian StyleAlam, Md. Kawser, Md. Al Sadikul Islam, Tanveer Saeed, Sheikh Mokhlesur Rahman, and Nehreen Majed. 2023. "Life Cycle Analysis of Lab-Scale Constructed Wetlands for the Treatment of Industrial Wastewater and Landfill Leachate from Municipal Solid Waste: A Comparative Assessment" Water 15, no. 5: 909. https://doi.org/10.3390/w15050909