
Influence of Water Treatment Technology on the Stability of Tap Water

1
Department of Water Purification and Protection, Faculty of Civil, Environmental Engineering and Architecture, Rzeszow University of Technology, 35-959 Rzeszow, Poland
2
Department of Water Supply and Sewerage Systems, Faculty of Civil, Environmental Engineering and Architecture, Rzeszow University of Technology, 35-959 Rzeszow, Poland
*
Author to whom correspondence should be addressed.
Water 2023, 15(5), 911; https://doi.org/10.3390/w15050911
Submission received: 19 January 2023
/
Revised: 8 February 2023
/
Accepted: 24 February 2023
/
Published: 27 February 2023
(This article belongs to the Special Issue Recent Advances in Monitoring and Treatment of Drinking Water Quality)
Abstract
:Control of water quality changes in the distribution system is an important issue, due to consumer health, and a threat to technical infrastructure. Annual monitoring of water quality allowed us to analyze the physical, chemical, and biological stability of water produced in two different technological systems. The article examines the extent to which water purification technology affects the possibility of uncontrolled changes in water quality during its transport to the consumer (the risk of secondary water pollution has been estimated). Based on the obtained results, it was found that the groundwater treatment system based on the following processes—aeration, coagulation, sedimentation, filtration, and disinfection—does not ensure the effective elimination of biogenic substances that determine sanitary safety. The treatment technology extended by an additional biofiltration process on granulated activated carbons (GAC) contributed to the improvement of the quality of the treated water (lowering the content of nutrients) and reduced the risk of losing the biological stability of the water in the distribution system. The biofiltration process did not change the physical and chemical stability of the water; the calculated corrosiveness indicators showed that the waters are devoid of aggressive properties, with a tendency to precipitate CaCO3. The production of stable water is a step forward in controlling water quality from source to tap.
1. Introduction
Drinking water is delivered to customers through a network of pipelines called the drinking water distribution system (DWDS). As a result of the physical, chemical, and biochemical processes taking place in the DWDS, the quality of the transported water often deteriorates [1,2]. The consequence of deterioration in water quality may be its turbidity and color, as well as an increased number of microorganisms that pose a threat to consumer health [3,4,5,6]. According to the recommendations of the World Health Organization (WHO), water introduced into the distribution system should be characterized by physical, chemical, and microbiological stability, to limit the possibility of uncontrolled changes in water quality during its transport [7].
Physically stable water is water whose turbidity value does not exceed 0.8 NTU [8,9]. Increased water turbidity is a major concern for water acceptability by consumers who raise concerns about visually assessed water quality. The increase in turbidity itself does not pose a direct threat to human health but, in some situations, it may indicate disturbances in the water treatment process. Among consumer complaints about water services, more than 40% are concerned about the deterioration of the aesthetic aspects of water [10]. The distinct color of the water may result from the presence of iron and manganese compounds formed as a result of pipe biocorrosion or during the oxidation/reduction of these compounds by biofilm microorganisms [11,12,13].
Chemically stable water does not cause deposits on the internal surfaces of the installation materials and does not contribute to their destruction due to corrosion [6,14]. The multitude of factors influencing the interactions between flowing water and water pipes makes it very difficult to fully define the requirements for the chemical stability of water. Although numerous indices can be used to assess the corrosiveness of water (e.g., the Langelier, Ryznar, and Strohecker index [15]), due to the complexity of the corrosion process, none of these provide a complete assessment of the corrosion rate in the water environment.
Biologically stable water does not contain microorganisms and does not support their development in the distribution system [16,17]. All factors that enable the formation and development of biofilm on the internal surfaces of water pipes are not sufficiently understood. However, it is in no doubt that the main condition for the development of microorganisms indicating the lack of water stability is the presence of biogenic substances [18,19]. Obtaining biologically stable water during treatment processes is not a simple task, because microorganisms can multiply even at low concentrations of nutrient substrates. The literature on the subject states that the threshold values of nutrients that limit secondary growth of microorganisms in distribution systems should be: biodegradable organic carbon (BDOC) < 0.25 g C/m3, nitrogen compounds < 0.2 g N/m3,, and phosphorus compounds < 0.03 g PO43− /m3 [18,20,21,22].
The stable physicochemical and microbiological quality of water depends on many factors, among which the following should be mentioned: availability of nutrients [23,24], water temperature [11,25,26], presence of residual disinfectant [27,28,29], the condition of the network, and internal installations [14,30,31], hydraulic conditions in the network [32,33] and interactions between organisms [19]. Obtaining biologically stable water requires not only the production of clean and safe water, but also limitation of changes during its distribution, which may lead to an uncontrolled increase in the number of microorganisms that pose a health risk.
The article analyzes and evaluates the risk of losing tap water’s physicochemical and biological stability for the current water treatment system and the system supplemented with the biofiltration process on granulated activated carbons (GAC). To what extent the introduction of the biofiltration process will improve the parameters of tap water, and thus reduce the risk of uncontrolled changes in water quality in the distribution system, was assessed. Because secondary water pollution in the network is a threat to both the technical infrastructure and the health of consumers, the possibility of estimating changes in water quality during its transport is a very important issue.
2. Materials and Methods
2.1. Characteristics of the Research Object
The water treatment plant (WTP(I)) is supplied from an unconfined quaternary aquifer with a depth of approximately 15 m below ground level, using 27 wells. The physicochemical quality of the water being captured is presented in Table 1.
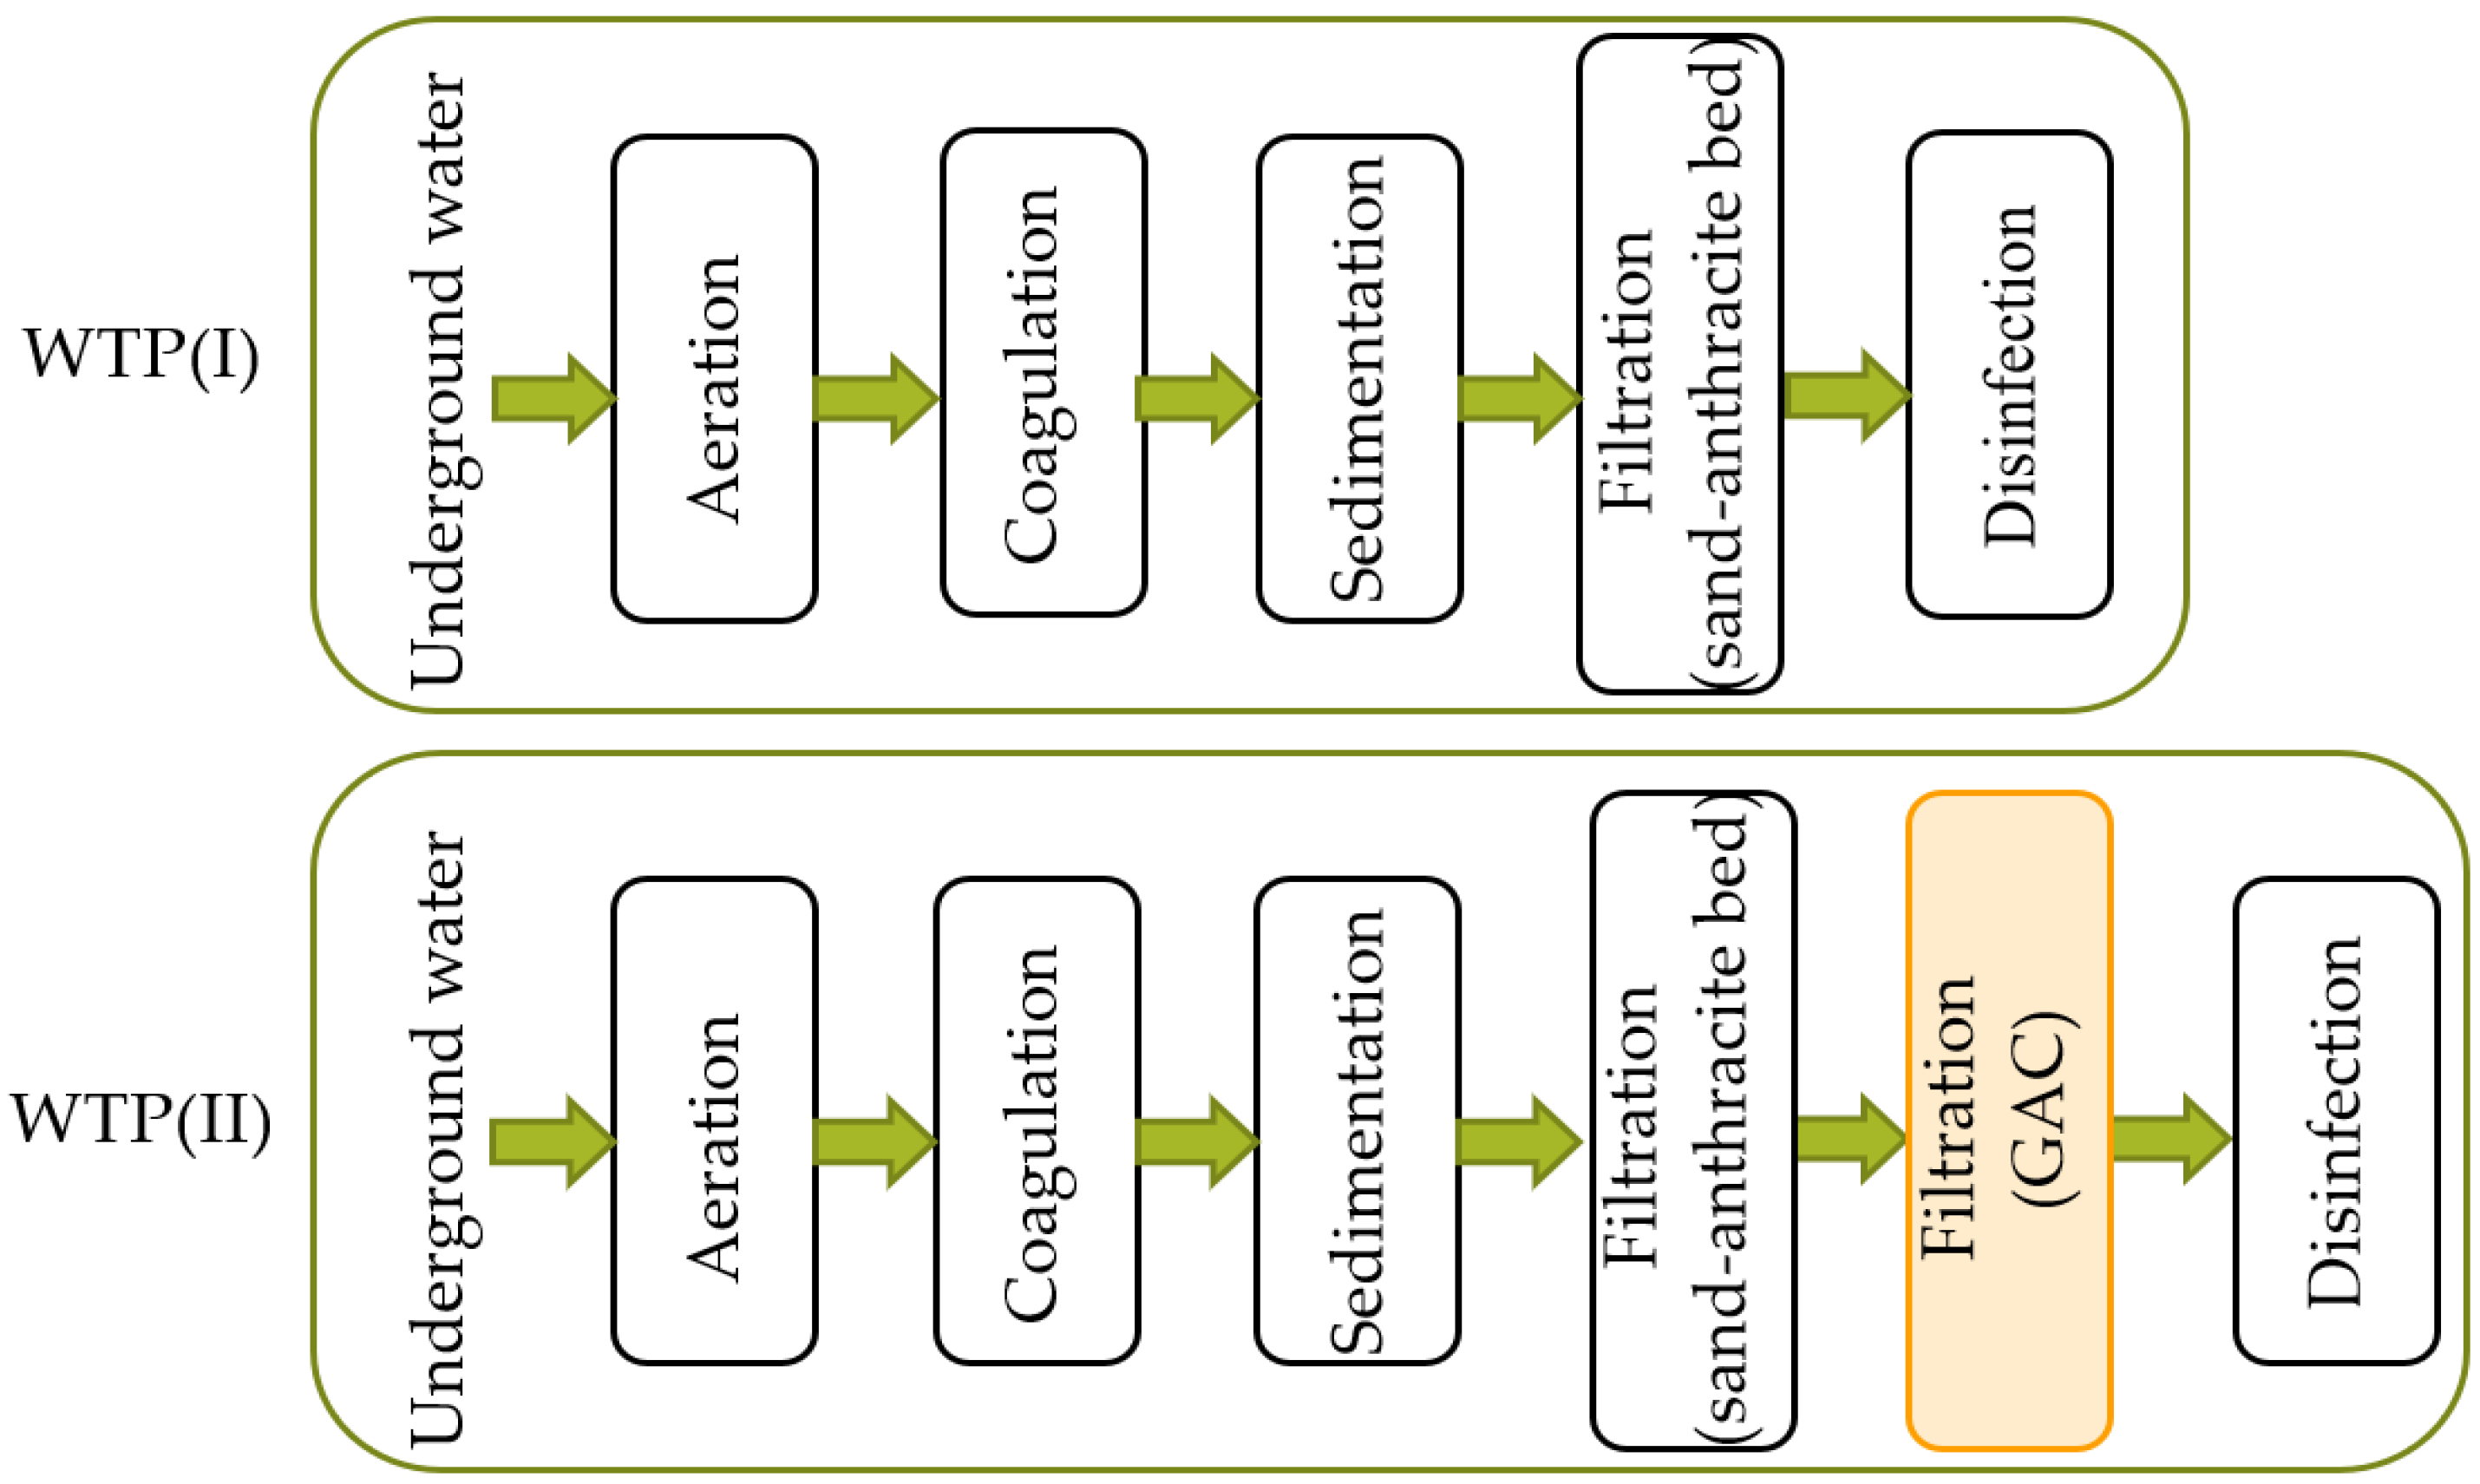
For research purposes, the current water treatment system WTP(I), including the aeration, coagulation, sedimentation, and disinfection processes, was supplemented with a second stage of filtration on granulated activated carbons WTP(II) (Figure 1). The model filters worked for 450 days. Water samples for analysis were collected twice a month after the first-degree filtration process (WTP(I)) and after the biofiltration process (WTP(II)). The results presented in the paper come from the period of 70–450 days of filter operation. During this period, the contaminants present in the water were removed through biological processes.
2.2. Determination of Stability of the Treated Water
The physical, chemical, and biological stability of the water before and after the biofiltration process on granulated activated carbons was assessed. The physical stability of the water was determined based on changes in the turbidity of the water; if the value of the turbidity was less than 0.8 NTU, the water was considered physically stable [8,9]. Chemical stability was determined using the following indices: Langelier, Ryznar, and Strohecker (Table 2).
The biological stability of water was assessed based on the content of biogenic compounds: carbon, nitrogen, and phosphorus. The following threshold values were adopted to determine the biological stability of water: BDOC ≤ 0.25 g C/m3; ∑Ninorg ≤ 0.2 g N/m3; PO43− ≤ 0.03 g PO43−/m3 [18,24]. It was assumed that the content of BDOC in groundwater is described by the following relation: BDOC = 9% DOC [18]. Based on the test results obtained, the percentage number of samples that met the criteria of biological stability for waters before and after the biofiltration process was determined.
A detailed list of the physicochemical parameters, methods, and equipment determined necessary to perform the analysis is presented in Table 3.
2.3. Method of Estimating the Risk of Instability of Tap Water
Technological safety is the ability of the water treatment system to avoid hazards that can result in: (1) failure to meet the quality parameters of the treated water (health risk) or (2) a threat to the technical infrastructure (technical risk). Threats resulting from undesirable events may occur during water intake, treatment, and distribution. The measure of the loss of technological security is the risk of failure to meet the required water quality parameters, which may adversely affect the change in the quality of water supplied to consumers. The risk of a lack of biological stability of water in the distribution system was determined based on the risk function f(r). The risk function was defined as the expected value of losses in specific operating conditions of the water supply network, which can determine the susceptibility of the system to the risk of loss of water biostability. The risk is defined as the probability of exceeding the assumed water quality parameters, i.e., BDOC ≤ 0.25 g C/m3, ∑Ninorg ≤ 0.2 g N/m3, PO43− ≤ 0.03 g PO43−/m3 [35,36]. The measure of the risk of losing the physicochemical stability of water is the expected value associated with exceeding the water corrosiveness indices, taking into account the tendency to form protective layers, as well as the precipitation and dissolution of sediments. The assessment was made based on the following indices: Langelier, Ryznar, and Strohecker.
The risk of loss of biological stability water was determined on the basis of dependence [37]:
where:
rb = E(Ci|Ci ≥ Cgr) = ∑i Pi × Ci
Cgr = f(S1, S2, S3)
- E(Ci|Ci ≥ Cgr)—the expected value of losses Ci greater the limit losses Cgr,
- Pi—the probability of losses Ci,
- S1—BDOC content indicator [g C/m3],
- S2—Ninorg content indicator [g N/m3],
- S3—PO43− content indicator [g PO43−/m3].
On the assumption:
- PS—the probability of not exceeding the limit values S1, S2, S3,
- PSi—the probability of not exceeding the limit values S1, S2, S3 in a given water sample,
- PP—the probability of exceeding the limit values S1, S2, S3,
- PPi—the probability of exceeding the limit values S1, S2, S3 in a given water sample.
PS = ∑ Pi and Pp = ∑ Pi
The PS and PP values were determined based on the percentage of water samples in which the limit values of biogenic substrates adopted for the assessment of water biostability were exceeded (BDOC ≤ 0.25 g C/m3, ∑Ninorg. ≤ 0.2 g N/m3, PO43− ≤ 0.03 g PO43−/m3).
The risk of loss of physicochemical stability and water was determined based on dependence [37]:
where:
rch = E(Ci|Ci ≥ Cgr) = ∑i Pi × Ci
Cgr = f(I1, I2, I3)
- I1—criterion corresponding to the value determined for the Langelier index,
- I2—criterion corresponding to the value determined for the Ryznar index,
- I3—criterion corresponding to the value determined for the Strohecker index.
To meet the given condition of maintaining chemical stability, one corrosivity parameter is sufficient; if all the determined parameters are available, the parameter with the most acceptable value is considered.
2.4. Assessment of the Impact of Treatment Technology on the Formation of Biofilm on the Installation Material
Samples of polyethylene (PE) materials with dimensions of 1 × 1 cm were placed for 180 days in glass vessels filled with two types of water produced in the WTP(I) and WTP(II) systems. The tests were carried out in the form of a vascular test at room temperature, without access to light. The influence of the water purification method on the process of biofilm formation was assessed based on SEM images of the surface of the installation material, taken with a Joel SEM 5500-LV scanning microscope.
3. Results
3.1. Physical and Chemical Stability
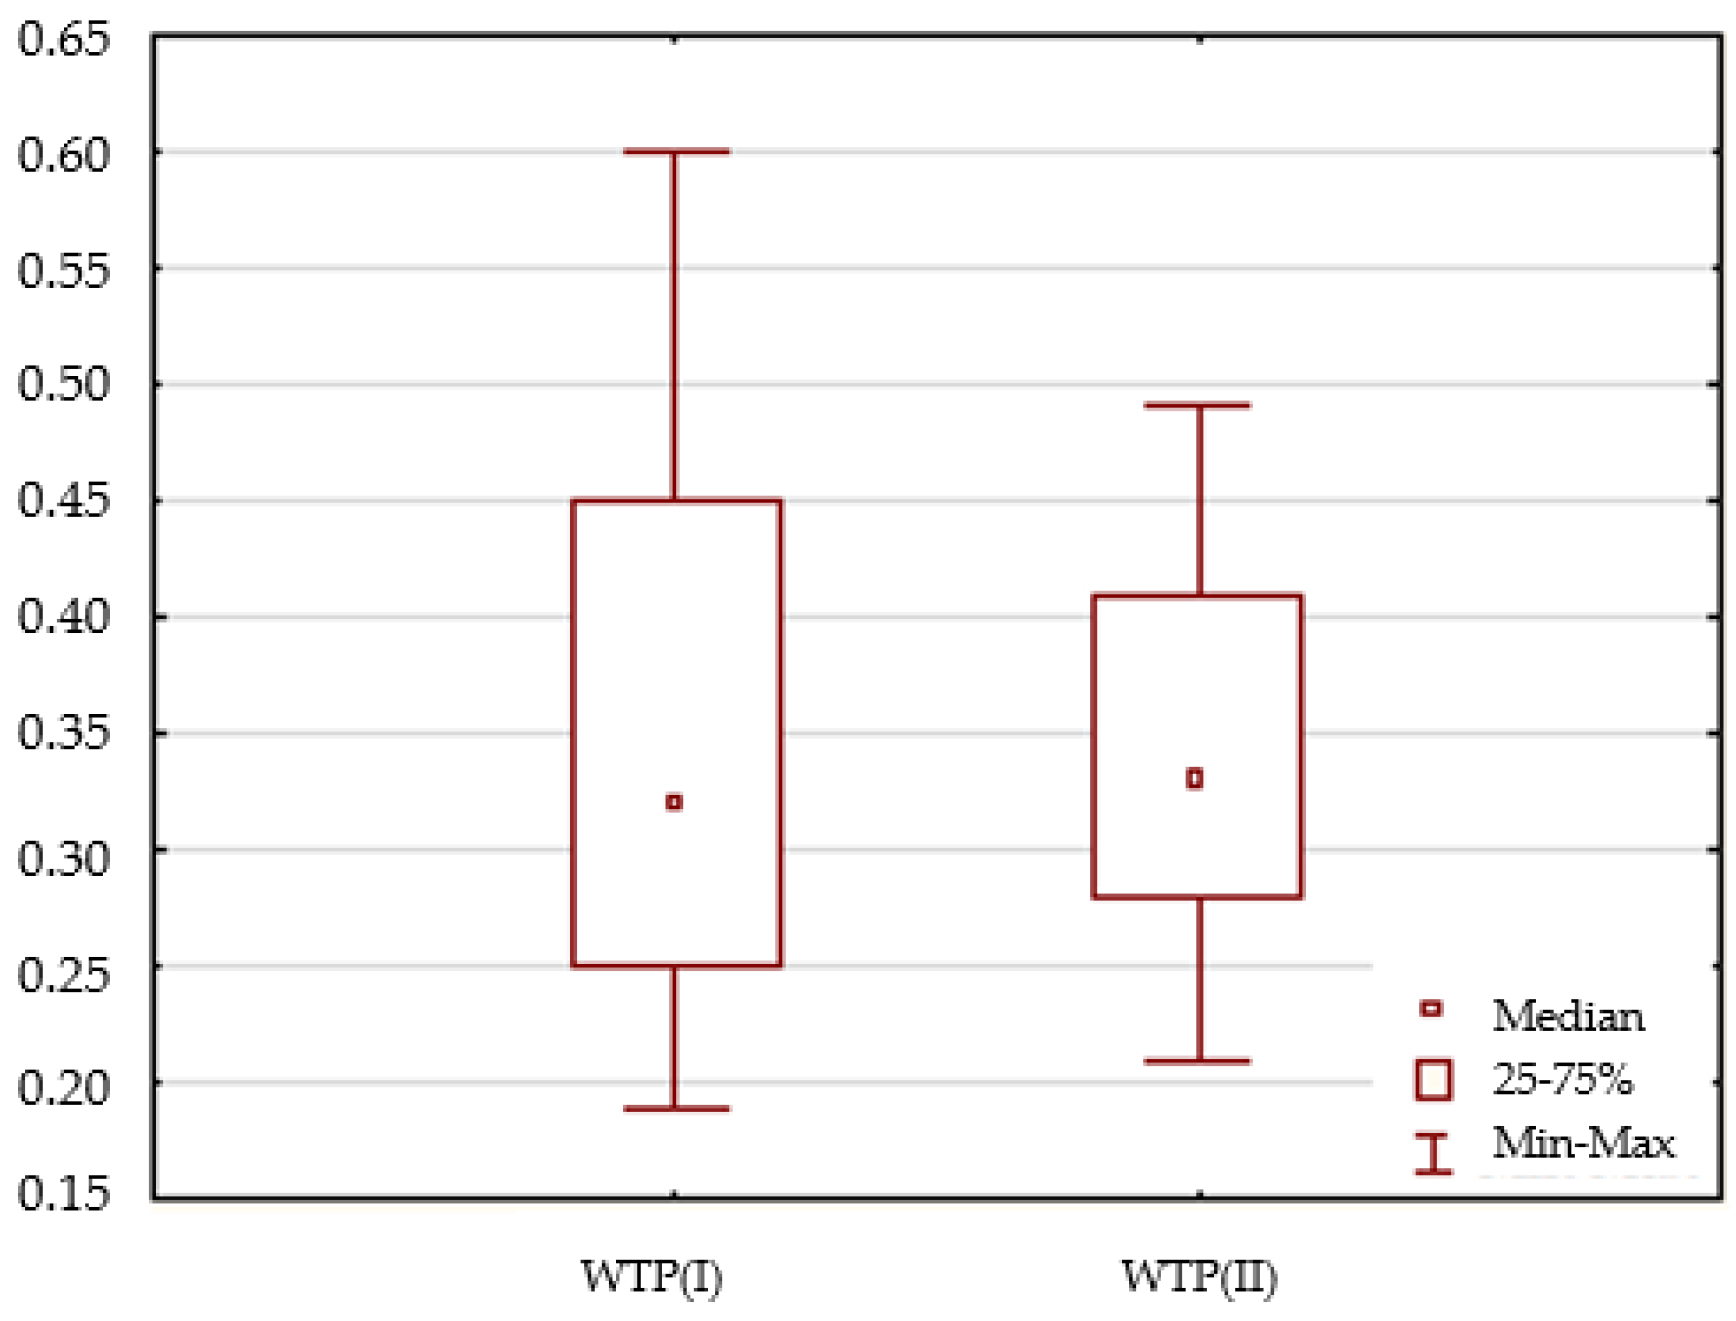
The physical stability of water can be determined by turbidity, which should not exceed 0.8 NTU [8,9]. The water analysis of WTP(I) and WTP(II) showed that the critical turbidity value was not exceeded in all samples taken. The obtained values oscillated in the range of 0.21–0.60 NTU (Figure 2). The mean values for WTP(I) and WTP(II) were 0.432 and 0.342 NTU, respectively (Table 5).
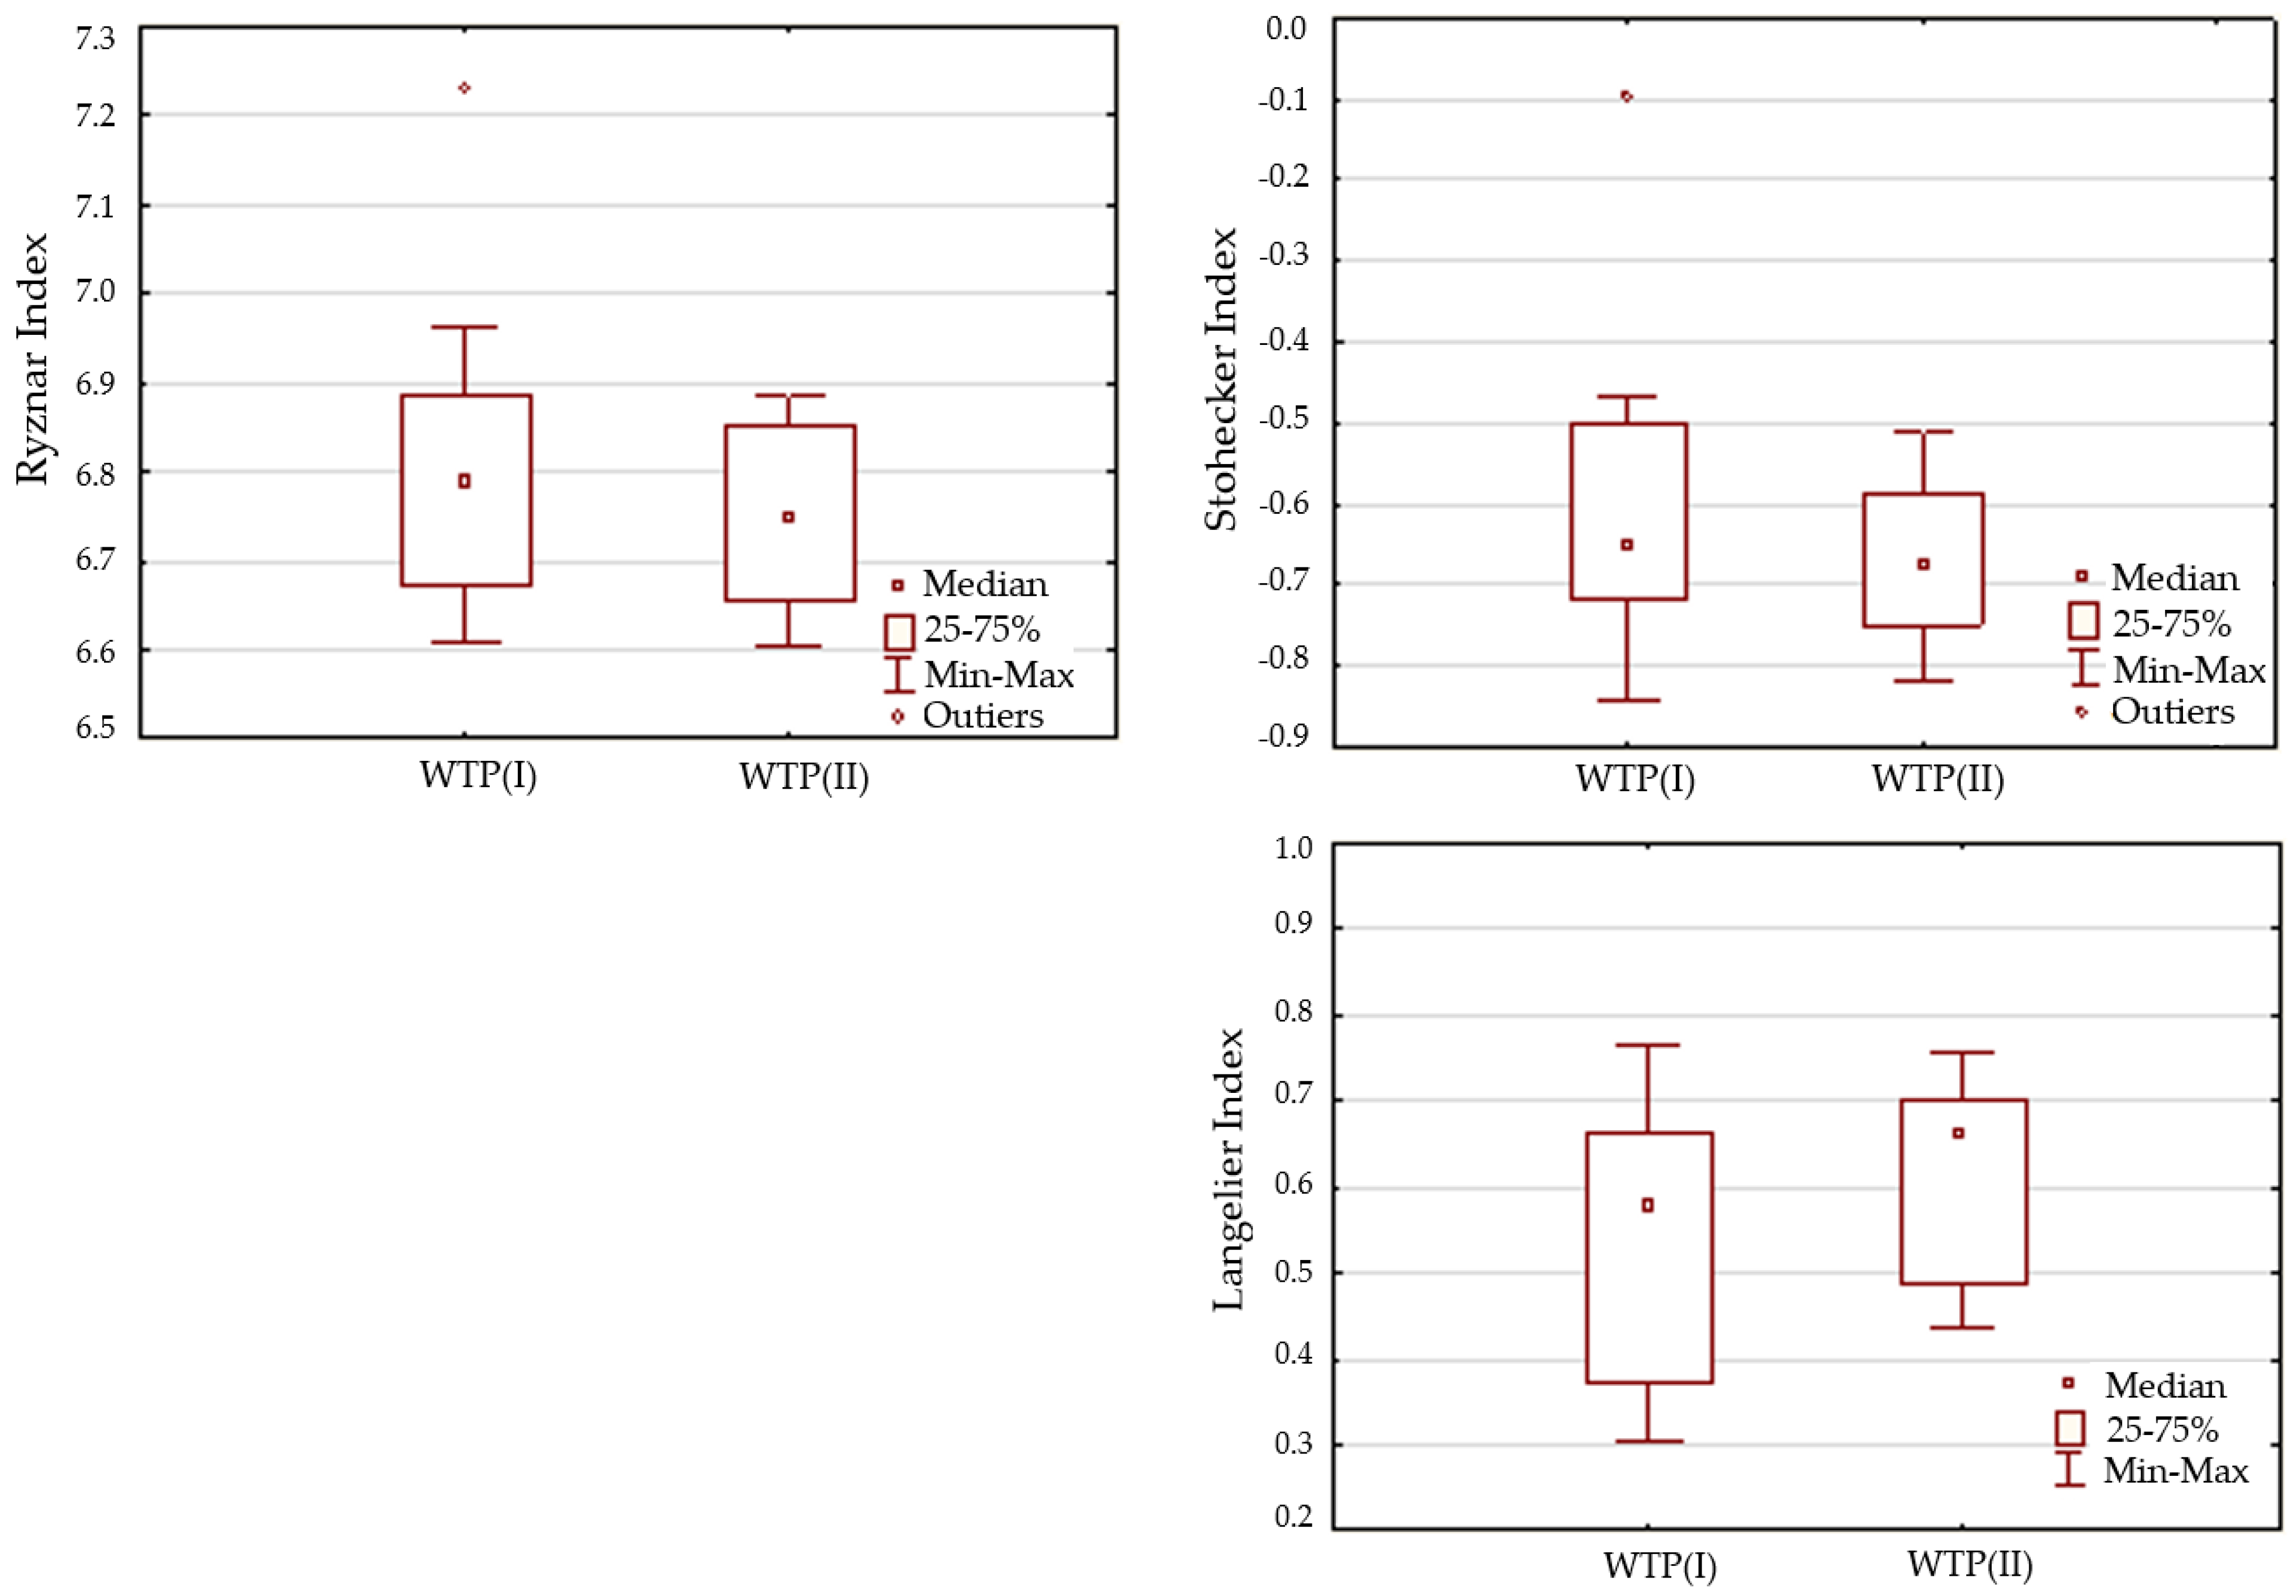
The statistical results of the parameters necessary to assess the physicochemical stability of water are presented in Table 5. To predict the corrosion of pipes in water supply networks, the corrosion trend was assessed using the following indices: Langelier (IL), Ryznar (IR), and Strohecker (IST) (Figure 3). Due to the large number of factors influencing the course of corrosion processes and their interactions, it is only possible to assess the quality of water in most cases.
The Langelier index values for the analyzed samples were always positive (0.3–0.77) and the Strohecker index negative (−0.1–−0.84), which indicated a tendency to precipitate CaCO3 sediments (water non-aggressive). The Ryznar index values were in the range of 6.6 < IR < 7 (except for one sample for WTP(I)), indicating poor precipitation or incipient corrosion) (Figure 3). The obtained test results allow conclusions that the biofiltration process does not change the corrosive properties of water. The physicochemical parameters of water that determine the corrosion properties are comparable for WTP(I) and WTP(II).
According to the adopted risk assessment criteria, the quality of the water produced in WTP(I) and WTP(II) was at the level of tolerable risk, because, in all analyzed samples, at least one of the criteria was met, i.e., 0.5 < IL < 0.5, 6.2 < IR < 6.8 and IST < 0.5 (75% of samples met two out of three criteria). The obtained values indicate that the chemical stability of the water will not be lost during the transport of the analyzed water in the distribution system. By analyzing each indicator separately, it can be concluded that the IR and IST values are within the tolerable risk area for WTP(I) and WTP(II) (IR = 62.5% and IST = 100%) (Table 6). In the case of IL values, most samples were assigned to the tolerable level (75–87.5% of samples). The analysis of the tested water showed that the pH value oscillated in the range of 7.62 to 8.35 (moderately alkaline water).
3.2. Biological Stability
The content of the biodegradable fraction in the waters analyzed ranged from 0.55 to 0.62 g C/m3 for WTP(I) and from 0.05 to 0.38 g C/m3 for WTP(II) (Figure 4). The test results obtained allow us to conclude that, in the water treated in the coagulation–sedimentation–filtration process, values ≤ 0.25 g C/m3 were not achieved. For WTP(II), only 29.4% of BDOC values were higher than 0.25 g C/m3.
The biofiltration process not only removed organic pollutants but also contributed to the reduction of the ammonium nitrogen content (on average by 56%). The content of this form of nitrogen in the water flowing to the biofilter ranged from 0 to 1.05 g N-NH4+/m3, while after biofiltration it was at the level of 0–0.5 g N-NH4+/m3. Nitrite nitrogen in water after WTP(I) reached values of 0–0.015 g N-NO2−/m3 and after WTP(II) 0–0.12 N-NO2−/m3. On the other hand, nitrate nitrogen concentrations for the entire study period obtained comparable values for WTP(I) and WTP(II), ranging from 0.087 to 0.976 g N-NO3−/m3. Among the forms of nitrogen compounds analyzed, nitrates represented the largest share (in water after WTP(I) on average 69% and after WTP(II) 81%) (Table 7).
The analysis of the test results obtained showed that the method is insufficient in removing inorganic nitrogen. In the case of WTP(I), 100% of the analyzed water samples exceeded the value of 0.2 g Ninorg./m3 (Table 6). The introduction of the biofiltration process into the technological treatment system allowed for a reduction in the value of inorganic nitrogen by an average of 22.7%. The content of phosphate ions changed to a small extent (from 0 to 0.002 g PO43−/m3); therefore, in none of the analyzed samples, the value of 0.03 g PO43−/m3 recommended for maintaining water biostability was not exceeded (Table 7).
Ensuring the required values of the physicochemical parameters of water, in particular biogenic compounds, reduces the risk of secondary water pollution in the distribution system. The introduction of the biofiltration process into the WTP(I) system contributed to the increase in the biological stability of water, as evidenced by the higher number of water samples reaching the values of BDOC ≤ 0.25 g C/m3, inorganic nitrogen ≤ 0.2 g Ninorg./m3 and phosphates ≤ 0.03 g PO43−/m3 (Table 8).
Based on the data presented in Table 8, the probabilities of exceeding (PP) and the probability of not exceeding (PS) the limit values were determined based on the parameters analyzed (BDOC, Ninorg., PO43−) and the method of groundwater treatment. Table 9 presents the PP and PS probabilities, as well as the calculated expected loss values for the analyzed risk areas for WTP(I) and WTP(II), i.e., (1) tolerable risk RTb (indicating that the water will be biologically stable); (2) controlled risk RKb (indicating the possibility of deterioration of the quality of tap water in the distribution system); and (3) the risk of unacceptable RNAb (indicating the lack of biological stability of water).
Based on the test results obtained, it was found that, in the case of water treated in the WTP(I) system, 100% of the samples are in the controlled risk area, which indicates the possibility of water quality degradation in the distribution system. Therefore, the quality of treated water must be controlled, and the content of nutrients present in the water should be reduced. Due to insufficient elimination of organic and nitrogen compounds in the processes of coagulation–sedimentation–filtration, it is necessary to introduce additional unit processes to the WTP(I) system.
The introduction of the biofiltration process on granulated activated carbon to the WTP(I) system increased the percentage of samples assigned to the tolerable risk category (i.e., 70.6%). The remaining 29.4% of water samples correspond to the controlled risk area (water quality requires control and reduction of the content of nutrients; however, there are reasons to maintain the biostability of water in the distribution system). The values of expected losses that determine the biological stability of tap water for specific risk areas were the following:
- (1)
- Tolerated risk: 0.019702—WTP(I) and 0.734118—WTP(II),
- (2)
- Controlled risk: 0.970497—WTP(I) and 0.263289—WTP(II),
- (3)
- Unacceptable risk: 0.009801—WTP(I) and 0.002593—WTP(II) (Table 9).
The obtained test results confirm that the introduction of the biofiltration process into the water treatment system ensures the production of water with better parameters and reduces the possibility of secondary water contamination in the distribution system. In the active carbon bed, impurities can be removed in the adsorption process, as well as in biochemical processes with the participation of microorganisms [38,39]. As the time of the operation of biofilters increases, the sorption properties of the filter materials are exhausted, and the effectiveness of the removal of pollutants is determined by the intensity of the biodegradation processes.
Water treatment technology also influences the development and structure of biofilms. One of the methods of observing the formed biofilm is scanning electron microscopy (SEM), which makes it possible to determine the changes taking place on installation materials as a result of colonization by microorganisms. The primary polyethylene surface was completely colonized by microorganisms as a result of contact with water produced for WTP(I). On the surface of the PE material in contact with water after the biofiltration process, microcolonies were observed, but the original structure of the material was also preserved (part of the surface was unchanged due to the activity of microorganisms) (Figure 5). The formation of biofilm depends on the quality of the produced tap water and the physical structure of the installation material [40]. As a result of their hydrophobic properties, polymeric materials may initially delay the biofilm formation phase (i.e., the adhesion of microorganisms). After colonizing the surface of the polymeric material, the subsequent stages of biofilm formation may proceed faster than in the case of pipes made of iron and steel materials. Plastic pipes may create a more favorable environment for potentially pathogenic taxa than cast iron [41].
4. Discussion
Water companies are obliged to supply water of appropriate quality continuously and reliably in the required quantity and at the appropriate pressure. Technological water treatment systems should ensure not only the removal of pollutants to the normative values, but also guarantee the constant quality of water during its transport to the consumer. The phenomenon of secondary contamination of tap water is observed in many distribution systems, and its main cause is the lack of physical, chemical, and biological stability of water [10,19,42].
Determining the requirements for the physicochemical stability of water is very difficult, due to the multitude of factors affecting the interactions between flowing water and water pipes. The result of the lack of physical and chemical stability of water may be the precipitation of sparingly soluble deposits on the internal surfaces of materials (mainly CaCO3) and electrochemical corrosion of pipelines. The test results confirm that the corrosion resistance of carbon steel increases with increasing pH of the analyzed water [43]. To prevent corroding of the copper pipes, it is necessary to ensure a pH above 7.5 [44]. Precipitated deposits and corrosion products stimulate the formation of biofilms in the network. Corrosion tubercles provide potential niches in which microorganisms can be protected from bulk water and have increased surface area for survival and proliferation [45,46]. This problem can result in reduced pipe life and create a serious public health problem [15]. Both for the WTP(1) and WTP(II) systems, the analyzed water was characterized by physicochemical stability with a tendency to precipitate lime deposits (corrosive properties of water are weakened). The tested water was in the area of tolerable risk, which indicates the possibility of maintaining water stability during its transport through the distribution system. If the water was in an area of an unacceptable level of safety, the parameters of the treated water should be improved, and their correlation with hydraulic conditions analyzed. The right selection of materials for the construction of water supply systems and internal installations is also of key importance. When designing a water supply network, installation materials should be selected to ensure an appropriate level of water safety during its transport to the consumer. It should be noted that the installation material of the internal water supply network should be adapted to the parameters of the water, and not vice versa. Materials should not be susceptible to corrosion and should prevent water contamination [47].
The main factor determining the lack of biological stability of water in the distribution system is the presence of nutrients. The content of carbon, nitrogen, and phosphorus compounds provides information not only about the usefulness and effectiveness of a given process in water treatment, but also about the possibility of secondary water contamination in the water supply network [18,48]. Conventional water treatment processes—i.e., coagulation, sedimentation, filtration, and disinfection—do not effectively remove nutrients, particularly biodegradable dissolved organic carbon (BDOC) and assimilation organic carbon (AOC) [49]. It should be emphasized that drinking water production plants are not required to control the content of phosphorus compounds and the biodegradable organic fraction. Knowledge of this subject is crucial in assessing the biostability of water, as the introduction of unstable water into the distribution system poses a health risk to consumers [19,50]. To maintain the stability of the water and reduce the risk of secondary contamination, two of the three nutrients that determine the growth of microorganisms must be removed. In studies [18], the content of the BDOC fraction in water introduced into the distribution system ranged from 0.05 to 0.88 g C/m3, depending on the type of treated water and the unit processes used. The efficiency of BDOC elimination was 30–84%, and the number of samples that met the conditions for biologically stable water reached 95.8% for surface water and 100% for infiltration water [18]. In the work [51], the BDOC fraction was from 3 to 11% of DOC, and the value at the point of use was 0.185 g C/m3. Terry et al. [52] found that BDOC constituted 20% of the total organic carbon (TOC) in non-ozonated water. For ozonated waters, the biodegradable fraction values were higher and amounted to 30% TOC. The efficiency of the removal of the BDOC fraction in the biofiltration process is influenced by the type of water intake and the degree of its contamination; the contact time of the treated water with the bed; and the temperature at which the process is carried out. For lower temperatures (5 °C) with a 12-min contact time, the removal efficiency of BDOC is approximately 22%, while increasing the water temperature to 25 °C can increase the elimination of BDOC by up to 50% [53]. The efficiency of TOC removal in the biofiltration process can range from 70% to 33% [48]. The test results indicate that the introduction of biofiltration on granulated activated carbons into the system increased DOC removal efficiency by 68% on average. In Europe, the permissible content of TOC in water intended for consumption has been defined as “without incorrect changes”, and water treatment plants producing water in quantities less than 10,000 m3 per day are not required to monitor this parameter [54]. However, water treatment systems should strive to reduce the content of organic compounds in the produced water as much as possible, to ensure the biostability of the transported water and reduce health risks. It should also be emphasized that organic pollutants can react with chemicals used during water disinfection. The reaction of organic matter with chlorine can produce chlorites, bromates, and disinfection byproducts (DPB). These compounds are harmful to the health of consumers and may be carcinogenic and mutagenic [55,56]. Taking into account the growing demands of drinking water consumers and the constantly deteriorating quality of the intake water, many water treatment plants will be forced to modernize the current technological systems or improve the efficiency of unit processes. The production of stable water is a step forward in controlling water quality from the source to the tap.
5. Conclusions
The underground water treatment system based on the following processes does not ensure the effective elimination of biogenic substances that are crucial for sanitary safety: aeration coagulation, sedimentation, filtration, and disinfection. Despite meeting all the quality requirements for drinking water, the water was biologically unstable and the risk of secondary contamination was within the controlled risk area (the parameters of the water produced to indicate the possibility of changes in its quality in the distribution system).
The purification technology, extended with the process of biofiltration on granulated activated carbons (GAC), allowed reduction of the risk of losing water biostability. The values of BDOC and inorganic nitrogen decreased, on average, by 69% and 23% (BDOC ≤ 0.25 g C/m3 was recorded in 70.6% of the analyzed samples; N < 0.2 g Ninorg/m3 in 11.8%). The water purification technology had an impact on the structure of the biofilms formed on the installation material.
The biofiltration process did not change the physical and chemical stability of the water. The tested water samples did not exceed the value of 0.8 NTU, and the calculated Langelier, Ryznar, and Stohecker corrosivity indices showed that the waters were devoid of aggressive properties, with a tendency to CaCO3 precipitation.
Author Contributions
Conceptualization, A.D. and D.P.; methodology, A.D. and B.T.-C.; formal analysis, A.D. and D.P.; investigation, A.D.; resources, D.P.; writing—original draft preparation, A.D. and D.P.; writing—review and editing, B.T.-C.; visualization, A.D.; supervision, D.P.; project administration, A.D. and D.P.; funding acquisition, D.P. All authors have read and agreed to the published version of the manuscript.
Funding
This research was funded under the UPB contract: PB29.B0.23.001.
Conflicts of Interest
The authors declare no conflict of interest.
References
- Liu, G.; Verberk, J.Q.J.C.; Van Dijk, J.C. Bacteriology of Drinking Water Distribution Systems: An Integral and Multidimensional Review. Appl. Microbiol. Biotechol. 2013, 97, 9265–9276. [Google Scholar] [CrossRef]
- Baloïtcha, G.M.P.; Mayabi, A.O.; Home, P.G. Evaluation of Water Quality and Potential Scaling of Corrosion in the Water Supply Using Water Quality and Stability Indices: A Case Study of Juja Water Distribution Network, Kenya. Heliyon 2022, 8, e09141. [Google Scholar] [CrossRef]
- Liu, G.; Ling, F.Q.; van der Mark, E.J.; Zhang, X.D.; Knezev, A.; Verberk, J.Q.J.C.; van der Meer, W.G.J.; Medema, G.J.; Liu, W.T.; van Dijk, J.C. Comparison of Particle-Associated Bacteria from a Drinking Water Treatment Plant and Distribution Reservoirs with Different Water Sources. Sci. Rep. 2016, 6, 20367. [Google Scholar] [CrossRef] [PubMed]
- van der Wielen, P.W.J.J.; Bakker, G.; Atsma, A.; Lut, M.; Roeselers, G.; de Graaf, B. A Survey of Indicator Parameters to Monitor Regrowth in Unchlorinated Drinking Water. Environ. Sci. Water Res. Technol. 2016, 2, 683–692. [Google Scholar] [CrossRef]
- Favere, J.; Buysschaert, B.; Boon, N.; De Gusseme, B. Online Microbial Fingerprinting for Quality Management of Drinking Water: Full-Scale Event Detection. Water Res. 2020, 170, 115353. [Google Scholar] [CrossRef] [PubMed]
- Płuciennik-Koropczuk, E.; Kumanowska, P. Chemical Stability of Water in the Water Supply Network—Preliminary Research. Civ. Environ. Eng. Rep. 2018, 28, 79–89. [Google Scholar] [CrossRef] [Green Version]
- World Health Organization. Guidelines for Drinking-Water Quality, 4th ed.; World Health Organization: Geneva, Switzerland, 2011; ISBN 978-92-4-154815-1. [Google Scholar]
- Vreeburg, J.H.G.; Schippers, D.; Verberk, J.Q.J.C.; van Dijk, J.C. Impact of Particles on Sediment Accumulation in a Drinking Water Distribution System. Water Res. 2008, 42, 4233–4242. [Google Scholar] [CrossRef]
- Liu, G.; Zhang, Y.; Knibbe, W.-J.; Feng, C.; Liu, W.; Medema, G.; van der Meer, W. Potential Impacts of Changing Supply-Water Quality on Drinking Water Distribution: A Review. Water Res. 2017, 116, 135–148. [Google Scholar] [CrossRef]
- Vreeburg, I.J.; Boxall, J.B. Discolouration in Potable Water Distribution Systems: A Review. Water Res. 2007, 41, 519–529. [Google Scholar] [CrossRef]
- Fish, K.E.; Sharpe, R.L.; Biggs, C.A.; Boxall, J.B. Impacts of Temperature and Hydraulic Regime on Discolouration and Biofilm Fouling in Drinking Water Distribution Systems. PLoS Water 2022, 1, e0000033. [Google Scholar] [CrossRef]
- Dang, Y.T.H.; Power, A.; Cozzolino, D.; Dinh, K.B.; Ha, B.S.; Kolobaric, A.; Vongsvivut, J.; Truong, V.K.; Chapman, J. Analytical Characterisation of Material Corrosion by Biofilms. J. Bio-Tribo-Corros. 2022, 8, 50. [Google Scholar] [CrossRef]
- Cerrato, J.M.; Falkinham, J.O.; Dietrich, A.M.; Knocke, W.R.; McKinney, C.W.; Pruden, A. Manganese-Oxidizing and -Reducing Microorganisms Isolated from Biofilms in Chlorinated Drinking Water Systems. Water Res. 2010, 44, 3935–3945. [Google Scholar] [CrossRef] [PubMed]
- Jachimowski, A. Factors affecting water quality in a water supply network. J. Ecol. Eng. 2017, 18, 110–117. [Google Scholar] [CrossRef]
- García-Ávila, F.; Ramos-Fernández, L.; Zhindón-Arévalo, C. Estimation of Corrosive and Scaling Trend in Drinking Water Systems in the City of Azogues, Ecuador. Rev. Ambiente Água 2018, 13, 1. [Google Scholar] [CrossRef]
- Wang, Q.; Tao, T.; Xin, K. The Relationship between Water Biostability and Initial Bacterial Growth Variations to Different Organic Carbon Concentrations. Procedia Eng. 2014, 89, 160–167. [Google Scholar] [CrossRef] [Green Version]
- Zhang, J.; Li, W.-Y.; Wang, F.; Qian, L.; Xu, C.; Liu, Y.; Qi, W. Exploring the Biological Stability Situation of a Full Scale Water Distribution System in South China by Three Biological Stability Evaluation Methods. Chemosphere 2016, 161, 43–52. [Google Scholar] [CrossRef]
- Wolska, M. Usuwanie substancji biogennych w technologii oczyszczania wody przeznaczonej do spożycia przez ludzi; Oficyna Wydawnicza Politechniki Wrocławskiej: Wrocław, Poland, 2015. (In Polish) [Google Scholar]
- Prest, E.I.; Hammes, F.; van Loosdrecht, M.C.M.; Vrouwenvelder, J.S. Biological Stability of Drinking Water: Controlling Factors, Methods, and Challenges. Front. Microbiol. 2016, 7, 1. [Google Scholar] [CrossRef] [Green Version]
- Niquette, P.; Servais, P.; Savoir, R. Bacterial Dynamics in the Drinking Water Distribution System of Brussels. Water Res. 2001, 35, 675–682. [Google Scholar] [CrossRef]
- LeChevallier, M.W.; Shaw, N.E.; Kaplan, L.A.; Bott, T.L. Development of a rapid assimilable organic carbon method for water. App. Environ. Microb. 1993, 59, 1526–1531. [Google Scholar] [CrossRef] [Green Version]
- Prévost, M.; Rompré, A.; Coallier, J.; Servais, P.; Laurent, P.; Clément, B.; Lafrance, P. Suspended Bacterial Biomass and Activity in Full-Scale Drinking Water Distribution Systems: Impact of Water Treatment. Water Res. 1998, 32, 1393–1406. [Google Scholar] [CrossRef]
- Fang, W.; Hu, J.Y.; Ong, S.L. Influence of Phosphorus on Biofilm Formation in Model Drinking Water Distribution Systems. J. Appl. Microbiol. 2009, 106, 1328–1335. [Google Scholar] [CrossRef] [PubMed]
- Wolska, M.; Mołczan, M. Ocena Stabilności Wody Wprowadzanej Do Sieci Wodociągowej. Ochr. Sr. 2015, 37, 51–56. (In Polish) [Google Scholar]
- Francisque, A.; Rodriguez, M.J.; Miranda-Moreno, L.F.; Sadiq, R.; Proulx, F. Modeling of Heterotrophic Bacteria Counts in a Water Distribution System. Water Res. 2009, 43, 1075–1087. [Google Scholar] [CrossRef] [PubMed]
- Vital, M.; Hammes, F.; Egli, T. Competition of Escherichia coli O157 with a Drinking Water Bacterial Community at Low Nutrient Concentrations. Water Res. 2012, 46, 6279–6290. [Google Scholar] [CrossRef]
- Nescerecka, A.; Rubulis, J.; Vital, M.; Juhna, T.; Hammes, F. Biological Instability in a Chlorinated Drinking Water Distribution Network. PLoS ONE 2014, 9, e96354. [Google Scholar] [CrossRef] [Green Version]
- Gillespie, S.; Lipphaus, P.; Green, J.; Parsons, S.; Weir, P.; Juskowiak, K.; Jefferson, B.; Jarvis, P.; Nocker, A. Assessing Microbiological Water Quality in Drinking Water Distribution Systems with Disinfectant Residual Using Flow Cytometry. Water Res. 2014, 65, 224–234. [Google Scholar] [CrossRef]
- Zhu, Z.; Wu, C.; Zhong, D.; Yuan, Y.; Shan, L.; Zhang, J. Effects of Pipe Materials on Chlorine-Resistant Biofilm Formation Under Long-Term High Chlorine Level. Appl. Biochem. Biotechnol. 2014, 173, 1564–1578. [Google Scholar] [CrossRef]
- Liu, S.; Gunawan, C.; Barraud, N.; Rice, S.A.; Harry, E.J.; Amal, R. Understanding, Monitoring, and Controlling Biofilm Growth in Drinking Water Distribution Systems. Environ. Sci. Technol. 2016, 50, 8954–8976. [Google Scholar] [CrossRef]
- Wąsowski, J.; Kowalski, D.; Kowalska, B.; Kwietniewski, M.; Zawilska, M. Water Quality Changes in Cement-Lined Water Pipe Networks. Appl. Sci. 2019, 9, 1348. [Google Scholar] [CrossRef] [Green Version]
- Liu, J.; Luo, Z.; Liu, K.; Zhang, Y.; Peng, H.; Hu, B.; Ren, H.; Zhou, X.; Qiu, S.; He, X.; et al. Effect of Flushing on the Detachment of Biofilms Attached to the Walls of Metal Pipes in Water Distribution Systems. J. Zhejiang Univ. Sci. A 2017, 18, 313–328. [Google Scholar] [CrossRef]
- Tsagkari, E.; Sloan, W.T. Turbulence Accelerates the Growth of Drinking Water Biofilms. Bioprocess Biosyst. Eng. 2018, 41, 757–770. [Google Scholar] [CrossRef] [PubMed] [Green Version]
- Atekwana, E.A.; Atekwana, E.A.; Rowe, R.S.; Werkema, D.D.; Legall, F.D. The Relationship of Total Dissolved Solids Measurements to Bulk Electrical Conductivity in an Aquifer Contaminated with Hydrocarbon. Appl. Geophys. 2004, 56, 281–294. [Google Scholar] [CrossRef]
- Tchórzewska-Cieślak, B.; Papciak, D.; Pietrucha-Urbanik, K.; Pietrzyk, A. Safety Analysis of Tap Water Biostability. Archit. Civ. Eng. Environ. 2018, 11, 149–154. [Google Scholar] [CrossRef] [Green Version]
- Papciak, D.; Tchórzewska-Cieslak, B.; Pietrucha-Urbanik, K.; Pietrzyk, A. Analysis of the Biological Stability of Tap Water based on Risk Analysis and Parameters Limiting the Secondary Growth of Microorganisms in Water Distribution Systems. Desalination Water Treat. 2018, 117, 1–8. [Google Scholar] [CrossRef]
- Tchórzewska-Cieślak, B.; Papciak, D.; Pietrucha-Urbanik, K. Szacowanie Ryzyka Zmian Jakości Wody w Sieci Wodociągowej; Oficyna Wydawnicza Politechniki Rzeszowskiej: Rzeszów, Poland, 2017. (In Polish) [Google Scholar]
- Simpson, D.R. Biofilm Processes in Biologically Active Carbon Water Purification. Water Res. 2008, 42, 2839–2848. [Google Scholar] [CrossRef] [PubMed]
- Jin, P.; Jin, X.; Wang, X.; Feng, Y.; Wang, X.C. Biological Activated Carbon Treatment Process for Advanced Water and Wastewater Treatment. In Biomass Now—Cultivation and Utilization; Matovic, M.D., Ed.; InTech: London, UK, 2013; ISBN 978-953-51-1106-1. [Google Scholar]
- Papciak, D.; Domoń, A.; Zdeb, M.; Skwarczyńska-Wojsa, A.; Konkol, J. Optimization of Quantitative Analysis of Biofilm Cell from Pipe Materials. Coatings 2021, 11, 1286. [Google Scholar] [CrossRef]
- Goraj, W.; Pytlak, A.; Kowalska, B.; Kowalski, D.; Grządziel, J.; Szafranek-Nakonieczna, A.; Gałązka, A.; Stępniewska, Z.; Stępniewski, W. Influence of Pipe Material on Biofilm Microbial Communities Found in Drinking Water Supply System. Environ. Res. 2021, 196, 110433. [Google Scholar] [CrossRef]
- Kowalska, B.; Kowalski, D.; Hołota, E. Fractal-Heuristic Method of Water Quality Sensor Locations in Water Supply Network. Water 2020, 12, 832. [Google Scholar]
- Yao, J.; Ge, H.; Zhang, Y.; Wang, X.; Xie, S.; Sheng, K.; Meng, X.; Zhao, Y. Influence of PH on Corrosion Behavior of Carbon Steel in Simulated Cooling Water Containing Scale and Corrosion Inhibitors. Mater. Corros. 2020, 71, 1266–1275. [Google Scholar] [CrossRef]
- Jo, K.-H.; Kim, S.-I.; Woo, D.-S. Effects of PH, Alkalinity, Chloride Ion on the Copper Pipe Corrosion. Korean J. Environ. Health Sci. 2007, 33, 43–48. [Google Scholar] [CrossRef] [Green Version]
- Pan, R.; Zhang, K.; Cen, C.; Zhou, X.; Xu, J.; Wu, J.; Wu, X. Characteristics of Biostability of Drinking Water in Aged Pipes after Water Source Switching: ATP Evaluation, Biofilms Niches and Microbial Community Transition. Environ. Pollut. 2021, 271, 116293. [Google Scholar] [CrossRef] [PubMed]
- Gomez-Smith, C.K.; LaPara, T.M.; Hozalski, R.M. Sulfate Reducing Bacteria and Mycobacteria Dominate the Biofilm Communities in a Chloraminated Drinking Water Distribution System. Environ. Sci. Technol. 2015, 49, 8432–8440. [Google Scholar] [CrossRef]
- Pietrucha-Urbanik, K.; Tchórzewska-Cieślak, B.; Papciak, D.; Skrzypczak, I. Analysis of Chemical Stability of Tap Water in Terms of Required Level of Technological Safety. Arch. Environ. Prot. 2017, 43, 3–12. [Google Scholar] [CrossRef] [Green Version]
- Domoń, A.; Papciak, D.; Tchórzewska-Cieślak, B.; Pietrucha-Urbanik, K. Biostability of Tap Water—A Qualitative Analysis of Health Risk in the Example of Groundwater Treatment (Semi-Technical Scale). Water 2018, 10, 1764. [Google Scholar] [CrossRef] [Green Version]
- Chen, C.; Zhang, X.; He, W.; Lu, W.; Han, H. Comparison of Seven Kinds of Drinking Water Treatment Processes to Enhance Organic Material Removal: A Pilot Test. Sci. Total Environ. 2007, 382, 93–102. [Google Scholar] [CrossRef] [PubMed]
- Pons, W.; Young, I.; Truong, J.; Jones-Bitton, A.; McEwen, S.; Pintar, K.; Papadopoulos, A. A Systematic Review of Waterborne Disease Outbreaks Associated with Small Non-Community Drinking Water Systems in Canada and the United States. PLoS ONE 2015, 10, e0141646. [Google Scholar] [CrossRef] [PubMed]
- Rosińska, A. Zawartość Wybranych Mikrozanieczyszczeń Organicznych w Wodzie Przygotowywanej Do Spożycia. Technol. Wody 2018, 2, 10–15. (In Polisch) [Google Scholar]
- Terry, L.G.; Summers, R.S. Biodegradable Organic Matter and Rapid-Rate Biofilter Performance: A Review. Water Res. 2018, 128, 234–245. [Google Scholar] [CrossRef]
- Laurent, P.; Prévost, M.; Cigana, J.; Niquette, P.; Servais, P. Biodegradable Organic Matter Removal in Biological Filters: Evaluation of the CHABROL Model. Water Res. 1999, 33, 1387–1398. [Google Scholar] [CrossRef]
- Directive (EU) 2020/2184 of the European Parliament and of the Council of 16 December 2020 on the Quality of Water Intended for Human Consumption. Available online: https://eur-lex.europa.eu/eli/dir/2020/2184/oj (accessed on 5 January 2023).
- Tak, S.; Vellanki, B.P. Natural Organic Matter as Precursor to Disinfection Byproducts and Its Removal Using Conventional and Advanced Processes: State of the Art Review. J. Water Health 2018, 16, 681–703. [Google Scholar] [CrossRef]
- Li, X.-F.; Mitch, W.A. Drinking Water Disinfection Byproducts (DBPs) and Human Health Effects: Multidisciplinary Challenges and Opportunities. Environ. Sci. Technol. 2018, 52, 1681–1689. [Google Scholar] [CrossRef] [PubMed]
Figure 1.
Technological system for the treatment of groundwater.

Figure 2.
Turbidity value obtained for WTP(I) and WTP(II).

Figure 3.
Values of water corrosivity indices for the WTP(I) and WTP(II) systems.

Figure 4.
BDOC content obtained in treated water for WTP(I) and WTP(II).

Figure 5.
The structure of the formed biofilm on the polyethylene material depending on the treatment technology used: (a) WTP(I) and (b) WTP(II).
Figure 5.
The structure of the formed biofilm on the polyethylene material depending on the treatment technology used: (a) WTP(I) and (b) WTP(II).


Table 1.
Physicochemical quality of underground water (data from WTP(I)).
| Indicator | Unit | Values |
|---|---|---|
| Turbidity | NTU | 8.0–14.0 |
| Color | g Pt/m3 | 40–100 |
| Total organic carbon (TOC) | g C/m3 | 11.0–14.5 |
| Permanganate value | g O2/m3 | 11.0–18.1 |
| Ammonia nitrogen | g NH4+/m3 | 1.20–1.98 |
| pH | - | 6.4–7.0 |
| Temperature | °C | 10.8–12.1 |
| Alkalinity | val/m3 | 2.5–4.5 |
| Hardness | g CaCO3/m3 | 200–470 |
| Sulphate | g SO42−/m3 | 60–240 |
| Conductivity | µS/cm | 430–1016 |
| Langelier Saturation Index (IL) | ||
|---|---|---|
| Equation | Value | Water Feature |
| IL = pH − pHs pHs = (9.3 + A + B) − (C + D) pH = pH measured in situ. pHs = pH at saturation pHs A = (log10 [TDS *] − 1)/10, B = –13.12 × log10 (°C + 273) + 34.55, C = log10 [Ca+2 mg L−1 as CaCO3] − 0.4 D = log10 [Alcal. as CaCO3 ] TDS = E × ke, E—conductivity [µs/cm], ke = 0.55–0.8, assumed: 0.64 | IL > 0 IL = 0 (−0.5 to +0.5 is considered a “zero”) IL < 0 | Water can dissolve calcium compounds and its corrosion properties are enhanced Water is stable: it does not tend to precipitate or dissolve calcium carbonate, and the corrosion properties are weakened Water can precipitate lime and its corrosion properties are weakened |
| Ryznar Stability Index (IR) | ||
| IR = 2 pHs − pH pHs = pH at saturation pH = pH measured in situ. | IR ˂ 5.5 5.5 ˂ IR ˂ 6.2 6.2 ˂ IR ˂ 6.8 6.8 ˂ IR ˂ 8.5 IR ˃ 8.5 | Heavy scale likely to form Moderate scale-forming Is considered neutral Low corrosion High corrosion |
| Strohecker Index (Ist) | ||
| IST = pHn − pHo pHn= 11.39 − 2lgA pHn—pH value corresponding to carbonate-calcium equilibrium, pHo—pH of the examined water, A—the amount of bounded CO2, g/m3 CO2. | IST < 0.5, 0.5 < IST < 2.0 2.0 < IST < 4.0 | Nonaggressive water Water with average aggressiveness Aggressive water |
Table 3.
Summary of analytical methods for laboratory experiments.
| Parameter | Norm | Method/Device |
|---|---|---|
| Dissolved organic carbon | PN-EN 1484:1999 | TOC analyzer Sievers 5310 C (SUEZ, Boulder, CO, USA) |
| Turbidity | PN-EN ISO 7027:2003 | 2100P ISO turbidimeter (Hach, Germany) |
| Ammonium nitrogen | PN-C-04576-4:1994P | Direct nesslerization method |
| Nitrite nitrogen | PN-EN ISO 10304-1 2009 | The colorimetric method by Nitrite Test Merck 114408 (Merck, Germany) |
| Nitrate nitrogen | PN-82/C-04576/08 | The spectrophotometric method with sodium salicylate and sulfuric acid, Hach–Lange DR 500 spectrophotometer (Hach, Germany) |
| Phosphates | PN-EN ISO 6878:2006 | Spectrometric method using ammonium molybdate, Hach–Lange DR 500 spectrophotometer (Hach, Germany) |
| Conductivity | PN-EN 27888:1999 | Hach-Lange oxygen probe (Hach, Germany) |
| pH | PN-EN ISO 10523:2012 | Pehametr Hach–Lange HQ40d Multi (Hach, Germany) |
| Alkalinity | PN-EN ISO 9963-2:2001 | Titration method with hydrochloric acid |
Table 4.
Risk criteria determining the technological level of safety of the water treatment process.
Table 4.
Risk criteria determining the technological level of safety of the water treatment process.
| Tolerable risk The parameters of tap water ensure the maintenance of the biological and physicochemical stability of water during its transport in the water supply network. | |
| Biological stability RTb1 (S1 = BDOC ≤ 0.25) ˄ (S2 = Ninorg. ≤ 0.2) ˄ (S3 = PO43− ≤ 0.03) ˅ RTb2 (S1 = BDOC ≤ 0.25) ˄ (S2 = Ninorg. ≤ 0.2) ˄ (S3 = PO43− > 0.03) ˅ RTb3 (S1 = BDOC ≤ 0.25) ˄ (S2 = Ninorg. > 0.2) ˄ (S3 = PO43− ≤ 0.03) ˅ RTb4 (S1 = BDOC > 0.25) ˄ (S2 = Ninorg. ≤ 0.2) ˄ (S3 = PO43− ≤ 0.03) | Physicochemical stability RTch (I1 = IL = −0.5 ÷ 0.5) ˅ (I2 = IR= 6.2÷6.8) ˅ (I3 = IST < 0.5) |
| Controlled risk The parameters of tap water requiring control and reduction—parameters of tap water indicate the possibility of changes in the stability of water in the distribution system and mild corrosion may occur (there are no protective CaCO3 layers). | |
| Biological stability RKb1 S1 = BDOC > 0.25) ˄ (S2 = Ninorg. > 0.2) ˄ (S3 = PO43− ≤ 0.03) ˅ RKb2 (S1 = BDOC > 0.25) ˄ (S2 = Ninorg. ≤ 0.2) ˄ (S3 = PO43− > 0.03) ˅ RKb3 (S1 = BDOC ≤ 0.25) ˄ (S2 = Ninorg. > 0.2) ˄ (S3 = PO43− > 0.03) | Physicochemical stability RKch (I1 = IL = −3 ÷ −0.5 ˅ 0.5 ÷3) ˅ (I2 = IR= 6.8÷8.5 ˅ 5.5÷6.2) ˅ (I3 = IST > 0.5÷2) |
| Unacceptable risk Water quality does not ensure the stability of water in the water supply network; high probability of secondary water pollution and rapid corrosion. | |
| Biological stability RNab (S1 = BDOC > 0.25) ˄ (S2 = Ninorg. > 0.2) ˄ (S3 = PO43− > 0.03) | Physicochemical stability RNach (I1 = IL = −5 ÷ −3 ˅ 3÷4) ˅ (I2 = IR= <5.5 ˅ > 8.5 ˅ (I3 = IST > 2÷4) |
Table 5.
Summary of the physicochemical parameters necessary to assess the corrosive properties of WTP(I) and WTP(II) water.
Table 5.
Summary of the physicochemical parameters necessary to assess the corrosive properties of WTP(I) and WTP(II) water.
| Parameter | Water Quality for the WTP(I) System | ||||||
|---|---|---|---|---|---|---|---|
| Unit | Min | Max | Mean | Median | SD * | V ** | |
| Turbidity | NTU | 0.190 | 0.750 | 0.432 | 0.450 | 0.14 | 0.33 |
| Ph | - | 7.620 | 8.290 | 7.897 | 7.830 | 0.16 | 0.02 |
| Conductive | µS/cm | 634.00 | 899.00 | 788.94 | 815.00 | 82.23 | 0.10 |
| Alkalinity | val/m3 | 3.100 | 5.400 | 4.714 | 4.750 | 0.56 | 0.12 |
| Total hardness | val/m3 | 6.840 | 9.600 | 7.694 | 7.620 | 0.64 | 0.08 |
| Calcium content | g Ca2+/m3 | 6.160 | 6.840 | 6.466 | 6.322 | 0.27 | 0.04 |
| Water quality for the WTP(II) system | |||||||
| Turbidity | NTU | 0.210 | 0.490 | 0.342 | 0.330 | 0.09 | 0.25 |
| pH | - | 7.770 | 8.350 | 8.028 | 8.010 | 0.16 | 0.02 |
| Conductive | µS/cm | 694.00 | 966.00 | 809.12 | 827.00 | 68.73 | 0.08 |
| Alkalinity | val/m3 | 4.500 | 5.100 | 4.736 | 4.700 | 0.16 | 0.03 |
| Total hardness | val/m3 | 6.880 | 7.920 | 7.425 | 7.440 | 0.30 | 0.04 |
| Calcium content | g Ca2+/m3 | 6.200 | 7.080 | 6.465 | 6.420 | 0.29 | 0.04 |
Note: * Standard deviation, ** Variation coefficient.
Table 6.
Percentage of samples that meet the water chemical stability criteria.
| Risk Area | Index | WTP(I) | WTP(II) |
|---|---|---|---|
| [%] | |||
| Tolerable risk RTch | 0.5 < IL < 0.5 | 25.00 | 12.50 |
| 6.2 < IR < 6.8 | 62.50 | 62.50 | |
| IST < 0.5 | 100.00 | 100.00 | |
| Controlled risk RKch | 0.5 > IL > 3 | 75.00 | 87.5 |
| 6.8 > IR > 8.5 | 37.50 | 37.50 | |
| 0.5 > IST > 2 | 0.00 | 0.00 | |
Table 7.
The content of biogenic compounds for WTP(I) and WTP(II).
| Parameter | Water Quality for the WTP(I) System | ||||||
|---|---|---|---|---|---|---|---|
| Unit | Min | Max | Mean | Median | SD * | V ** | |
| DOC | g C/m3 | 6.15 | 11.50 | 8.59 | 7.91 | 1.37 | 0.16 |
| BDOC | g C/m3 | 0.656 | 0,761 | 0.714 | 0.711 | 0.03 | 0.04 |
| Ammonium nitrogen | g N-NH4+/m3 | 0.000 | 1.050 | 0.281 | 0.200 | 0.28 | 1.25 |
| Nitrite nitrogen | g N-NO2−/m3 | 0.000 | 0.015 | 0.002 | 0.002 | 0.00 | 1.98 |
| Nitrate nitrogen | g N-NO3−/m3 | 0.277 | 0.976 | 0.636 | 0.658 | 0.21 | 0.32 |
| Inorganic nitrogen | g Ninorg./m3 | 0.279 | 1.964 | 0.918 | 0.808 | 0.39 | 0.42 |
| Phosphates | g PO43−/m3 | 0.000 | 0.002 | 0.000 | 0.000 | 0.00 | 1.72 |
| Water quality for the WTP(II) system | |||||||
| DOC | g C/m3 | 0.64 | 5.22 | 2.78 | 2.87 | 1.53 | 0.55 |
| BDOC | g C/m3 | 0.051 | 0.372 | 0.218 | 0.232 | 0.11 | 0.51 |
| Ammonium nitrogen | g N-NH4+/m3 | 0.000 | 0.500 | 0.125 | 0.100 | 0.15 | 1.18 |
| Nitrite nitrogen | g N-NO2−/m3 | 0.000 | 0.120 | 0.009 | 0.002 | 0.03 | 3.11 |
| Nitrate nitrogen | g N-NO3−/m3 | 0.087 | 0.912 | 0.573 | 0.658 | 0.26 | 0.46 |
| Inorganic nitrogen | g Ninorg./m3 | 0.118 | 1.173 | 0.710 | 0.777 | 0.28 | 0.40 |
| Phosphates | g PO43−/m3 | 0.000 | 0.001 | 0.000 | 0.000 | 0.00 | 1.09 |
Note: * Standard deviation, ** Variation coefficient.
Table 8.
Percentage of samples meeting the water biostability criteria.
| Parameter | Index | WTP(I) | WTP(II) |
|---|---|---|---|
| [%] | |||
| BDOC | ≤0.25 g C/m3 | 0 | 70.6 |
| N | ≤0.2 g Ninorg./m3 | 0 | 11.8 |
| P | ≤0.03 g PO43−/m3 | 100 | 100 |
Table 9.
Summary of the probabilities of exceeding (PP) and the probabilities of not exceeding (PS) the limit values of nutrients and the values of expected losses E(C) determined for WTP(I) and WTP(II).
Table 9.
Summary of the probabilities of exceeding (PP) and the probabilities of not exceeding (PS) the limit values of nutrients and the values of expected losses E(C) determined for WTP(I) and WTP(II).
| WTP(I) | WTP(II) | |||||||||
|---|---|---|---|---|---|---|---|---|---|---|
| RTb1 | PSBDOC | PSNinorg. | PSPO43− | E(C) | n [%] | PSBDOC | PSNinorg. | PSPO43− | E(C) | n * [%] |
| 0.01 | 0.01 | 0.99 | 0.000099 | 0 | 0.706 | 0.118 | 0.99 | 0.082475 | 11.7 | |
| RTb2 | PSBDOC | PSNinorg. | PpPO43− | E(C) | n [%] | PSBDOC | PSNinorg. | PpPO43− | E(C) | n [%] |
| 0.01 | 0.01 | 0.01 | 0.000001 | 0 | 0.706 | 0.118 | 0.01 | 0.000833 | 0 | |
| RTb3 | PSBDOC | PPNinorg. | PsPO43− | E(C) | n [%] | PSBDOC | PPNinorg. | PsPO43− | E(C) | n [%] |
| 0.01 | 0.99 | 0.99 | 0.009801 | 0 | 0.706 | 0.882 | 0.99 | 0.616465 | 58.8 | |
| RTb4 | PPBDOC | PSNinorg. | PsPO43− | E(C) | n [%] | PPBDOC | PSNinorg. | PsPO43− | E(C) | n [%] |
| 0.01 | 0.009801 | 0 | 0.294 | 0.118 | 0.99 | 0.034345 | 0 | |||
| ∑ RTb1-4 | 0.019702 | - | ∑ RTb1-4 | 0.734118 | - | |||||
| RKb1 | PPBDOC | PPNinorg. | PsPO43− | E(C) | n [%] | PPBDOC | PPNinorg. | PsPO43− | E(C) | n [%] |
| 0.99 | 0.99 | 0.99 | 0.970299 | 100 | 0.294 | 0.882 | 0.99 | 0.256715 | 29.4 | |
| RKb2 | PPBDOC | PSNinorg. | PPPO43− | E(C) | n [%] | PPBDOC | PSNinorg. | PPPO43− | E(C) | n [%] |
| 0.99 | 0.01 | 0.01 | 0.000099 | 0 | 0.294 | 0.118 | 0.01 | 0.000347 | 0 | |
| RKb3 | PSBDOC | PPNinorg. | PPPO43− | E(C) | n [%] | PSBDOC | PPNinorg. | PPPO43− | E(C) | n [%] |
| 0.01 | 0.99 | 0.01 | 0.000099 | 0 | 0.706 | 0.882 | 0.01 | 0.006227 | 0 | |
| ∑ RKb1-3 | 0.970497 | - | ∑ RKb1-3 | 0.263289 | - | |||||
| RNAb | PPBDOC | PPNinorg. | PPPO43− | E(C) | n [%] | PPBDOC | PPNinorg. | PPPO43− | E(C) | n [%] |
| 0.99 | 0.99 | 0.01 | 0.009801 | 0 | 0.294 | 0.882 | 0.01 | 0.0025931 | 0 | |
Note: * Number of samples.
Disclaimer/Publisher’s Note: The statements, opinions and data contained in all publications are solely those of the individual author(s) and contributor(s) and not of MDPI and/or the editor(s). MDPI and/or the editor(s) disclaim responsibility for any injury to people or property resulting from any ideas, methods, instructions or products referred to in the content. |
© 2023 by the authors. Licensee MDPI, Basel, Switzerland. This article is an open access article distributed under the terms and conditions of the Creative Commons Attribution (CC BY) license (https://creativecommons.org/licenses/by/4.0/).
Share and Cite
MDPI and ACS Style
Domoń, A.; Papciak, D.; Tchórzewska-Cieślak, B. Influence of Water Treatment Technology on the Stability of Tap Water. Water 2023, 15, 911. https://doi.org/10.3390/w15050911
AMA Style
Domoń A, Papciak D, Tchórzewska-Cieślak B. Influence of Water Treatment Technology on the Stability of Tap Water. Water. 2023; 15(5):911. https://doi.org/10.3390/w15050911
Chicago/Turabian StyleDomoń, Andżelika, Dorota Papciak, and Barbara Tchórzewska-Cieślak. 2023. "Influence of Water Treatment Technology on the Stability of Tap Water" Water 15, no. 5: 911. https://doi.org/10.3390/w15050911
Note that from the first issue of 2016, this journal uses article numbers instead of page numbers. See further details here.