
Fluorine-Rich Shallow Groundwater in Weigan River Basin (Xinjiang): Enrichment Factors and Spatial Distribution


1
The First Regional Geological Survey Brigade of the Xinjiang Uygur Autonomous Region Geology and Mineral Exploration and Development Bureau, Urumqi 830011, China
2
School of Resources and Geosciences, China University of Mining and Technology, Xuzhou 221008, China
3
School of Geology and Mining Engineering, Xinjiang University, Urumqi 830046, China
*
Authors to whom correspondence should be addressed.
†
These authors contributed equally to this work.
Water 2023, 15(5), 926; https://doi.org/10.3390/w15050926
Submission received: 4 February 2023
/
Revised: 24 February 2023
/
Accepted: 24 February 2023
/
Published: 27 February 2023
(This article belongs to the Special Issue Groundwater Quality and Human Health Risk)
Abstract
:Long-term usage of drinking water with excessive fluoride concentration (above 1.5 mg/L) is known to harm human health. Since the fluoride concentration in the shallow groundwater of the Weigan River Basin, China, exceeds this level, this study explored fluoride’s sources and enrichment mechanism for this basin. Based on information retrieval and regional geological environment analyses, 47 sets of shallow groundwater samples in the Weigan River Basin were collected and analyzed. The research results show that the fluoride content in the drainage basin of the research area ranged from 0.2 to 5.46 mg/L, with an average value of 1.14 mg/L. The test results showed that 40.43% of the water sample test results exceeded the national domestic drinking water safety standard (1.0 mg/L). The average pH value of the research area was 8.37, which was slightly basic. Type Na+–Cl−/(SO42−) was the primary hydrochemical type. In the research area, groundwater with a high fluoride concentration contained much sodium and little calcium. The main mechanism of excessive fluoride formation in the groundwater was the continued dissolution of fluorine-containing minerals (fluorite) in the research area, while the main fluorine source was weathering of silicate rocks and evaporites. Evaporation-crystallization and cation exchange were the main factors controlling fluorine enrichment. These findings indicate that physicochemical processes are the major mechanisms for controlling F− enrichment and that may be useful for studying F− occurrence in groundwater in arid and semi-arid areas.
1. Introduction
Fluorine is one of the essential trace elements needed by the human body. When groundwater is the primary source of drinking water, users will have dental caries if the fluoride concentration of the groundwater is less than 0.5 mg/L. It could enter the human body through the ingestion of food, drinking water, inhalation, and dermal contact. However, drinking water is the most important exposure pathway of fluoride, as about 75–90% of fluoride intake [1,2]. However, if the fluoride concentration of the groundwater exceeds 1.0 mg/L, people will suffer from fluorosis (a common disorder characterized by hypomineralization of tooth enamel caused by ingestion of excessive fluoride during enamel formation) or have other disease symptoms [1,2,3,4,5]. Many scholars have conducted in-depth research on the formation mechanism and hydrochemical processes of high fluoride (F−) groundwater [5,6,7,8,9]. According to statistics, over 260 million people are affected by groundwater with too much fluoride in 25 countries, including India [6,7], most African countries [8], Mexico [9], and China [10,11,12].
The World Health Organization (WHO) recommends that drinking water’s highest permissible fluoride concentration should be 1.5 mg/L. China has stipulated that the fluoride concentration in drinking water should not exceed 1.0 mg/L. In China, groundwater with a high fluoride concentration (≥1.0 mg/L) is widely distributed in Inner Mongolia [13], Shanxi [14,15], Guizhou [16], Xinjiang [17], etc. The Weigan River Basin is a vital river basin north of the Tarim Basin, Xinjiang, located to the south of the Tianshan Mountains, Xinjiang. The fluoride concentration of the groundwater in the Weigan River Basin is somewhat too high. The residents of the Weigan River Basin, who mainly use the groundwater from their wells as drinking water, are known to have some symptoms related to fluorosis [18,19]. However, to the best of the authors’ knowledge, the source and enrichment of fluorine in the Weigan River Basin have not been systematically explored.
Taking the shallow groundwater of the Weigan River Basin as the research object, this study analyzed and discussed the sources and enrichment mechanism of fluorine in the shallow groundwater of the Weigan River Basin. The results are considered instrumental in preventing excessive fluorine-induced fluorosis of the Weigan River Basin residents, providing a theoretical substantiation for the rational use and protection of the groundwater resources of the river basin.
2. Materials and Methods
2.1. Overview of the Research Area
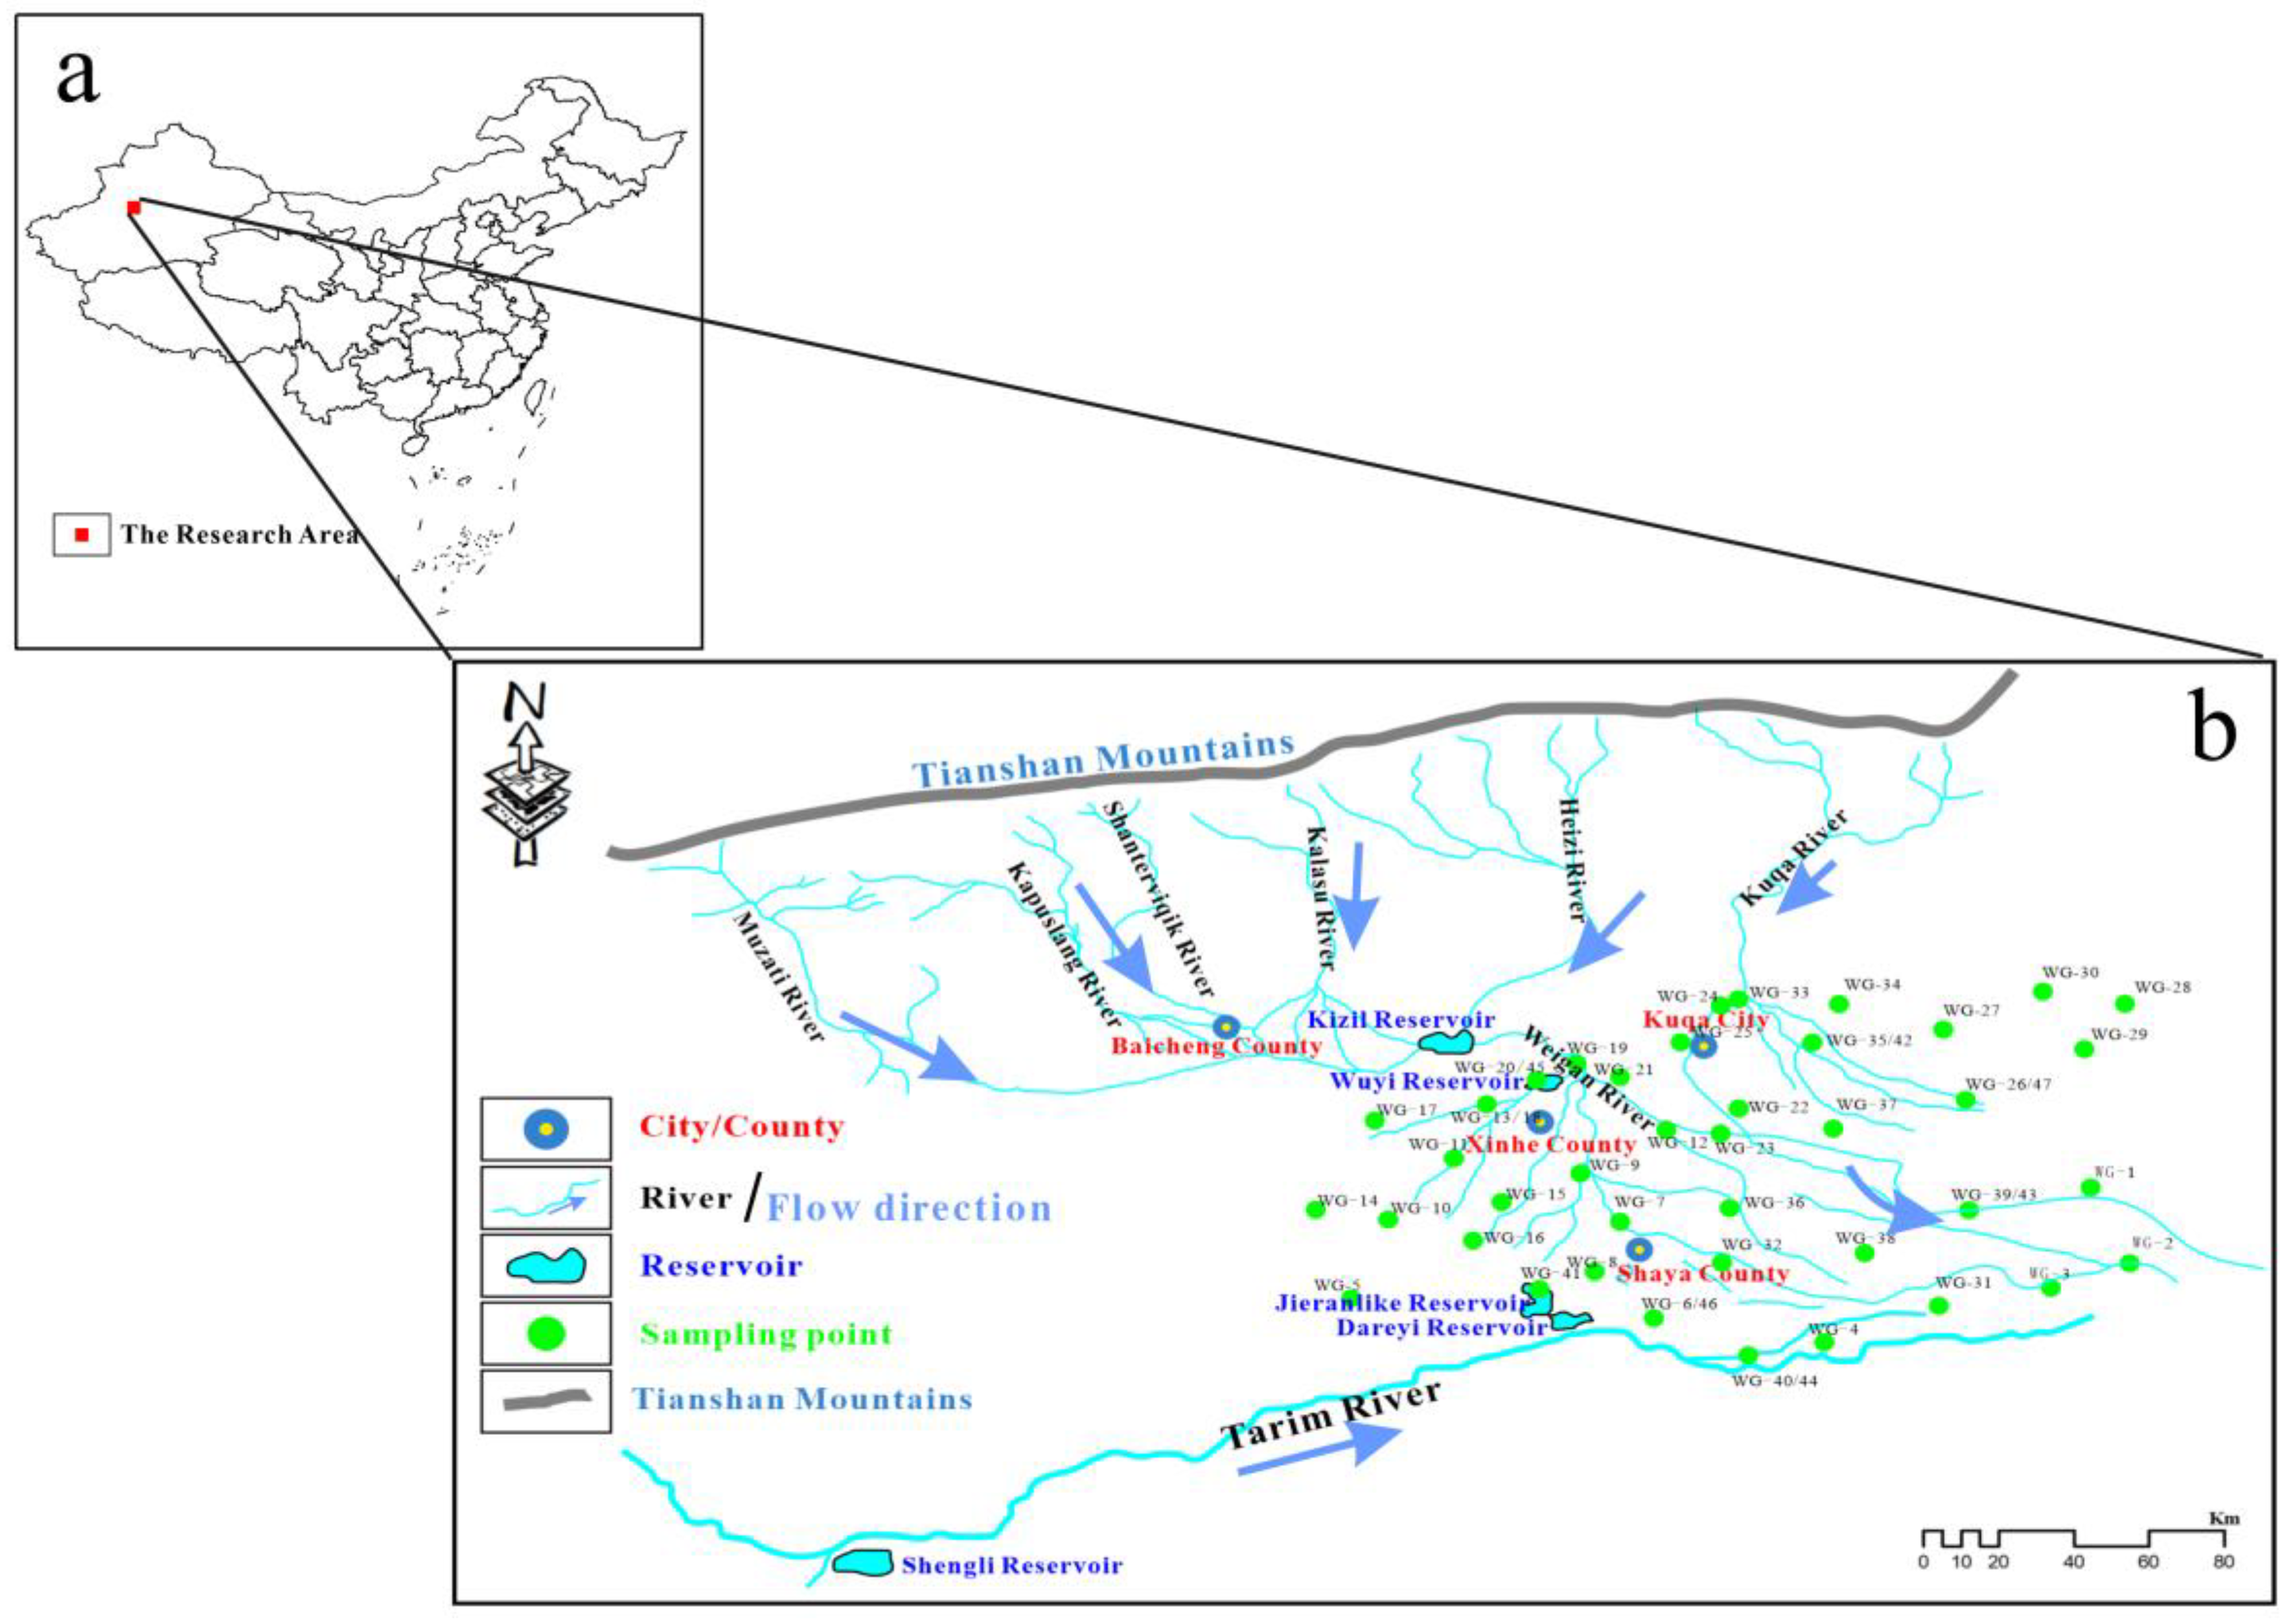
The Weigan River Basin is between the southern slope of the Tianshan Mountains’ middle section and the Tarim Platform’s northern margin in Xinjiang, China. The Weigan River has six tributaries, including the Muzart River and the Kizil River. The tributaries join the mainstream in the Weigan River Basin and form the Weigan River. The Weigan River is a confluence river among mountains. Its tributaries originate from Khan Tengri Peak and its branches. The terrain of the Weigan River Basin gradually descends from north to south. The geographical coordinates are 80°10′ E to 84°10′ E and 40°50′ N to 42°40′ N. Five counties—Baicheng County, Kuqa County (part), Xinhe County, Shaya County, and Wensu County (only a very small part)—are distributed in the oases of the Weigan River Basin, and Shaya County is located in the central part of an oasis. The climate of the research area is a typical temperate, extremely dry climate; the multiyear average annual precipitation is 56 mm, and the multiyear average yearly evaporation is 2356 mm [20]. The river flows north to south through an inclined piedmont plain consisting of the alluvial-pluvial fans that formed in the early stage of the river, finally joining the mainstream of the Tarim River.
The Weigan River Basin is in the concave region north of the Tarim Platform. The outcrop, with various rock layers from Archean to Cenozoic ones, is a depression at the platform’s edge, mainly consisting of fully-developed Mesozoic and Cenozoic sediments [21,22]. Detailed information on the strata of the Weigan River Basin is presented in Figure 1.
2.2. Sample Collection and Tests
In October 2020, the authors went to the research area with some investigators of the First Regional Geological Survey Brigade of the Xinjiang Uygur Autonomous Region Geology and Mineral Exploration and Development Bureau and collected 47 shallow groundwater samples. The hydrological and sampling point distribution maps are illustrated in Figure 1b.
At each sampling site, the geographical coordinates were recorded by a hand-held global positioning system. Polyethylene bottles of 1000 mL, which were rinsed with deionized water and dried before sampling, were used to sample water. The samples were tested at the School of Resources and Geosciences, China University of Mining and Technology, the Institute of Hydrogeology and Environmental Geology, Chinese Academy of Geological Sciences. All samples were stored at 4 °C in the dark until analysis.
During sampling, all water samples were filtered through 0.45 μm membranes on site. Samples were collected in three new 350 mL polyethylene bottles. For metallic element analysis, reagent-quality HNO3 with a molar concentration of up to 14 M was added to one of these polyethylene bottles until the sample’s pH reached 1. These bottles were rinsed with deionized water twice before sampling. Unstable hydrochemical parameters, including water temperature and pH, were measured in situ using a portable Hanna EC and pH meter calibrated before use.
Alkalinity was measured on the sampling day using the Gran titration method (a method for calculating total alkalinity based on the principle of the Gran function). F− and major anions and cations (HCO3−, SO42−, Cl−, NO3−, Ca2+, Mg2+, Na+, K+) were determined using an ultraviolet spectrophotometer and ion chromatography, respectively.
3. Results
3.1. Hydrochemical Characteristics
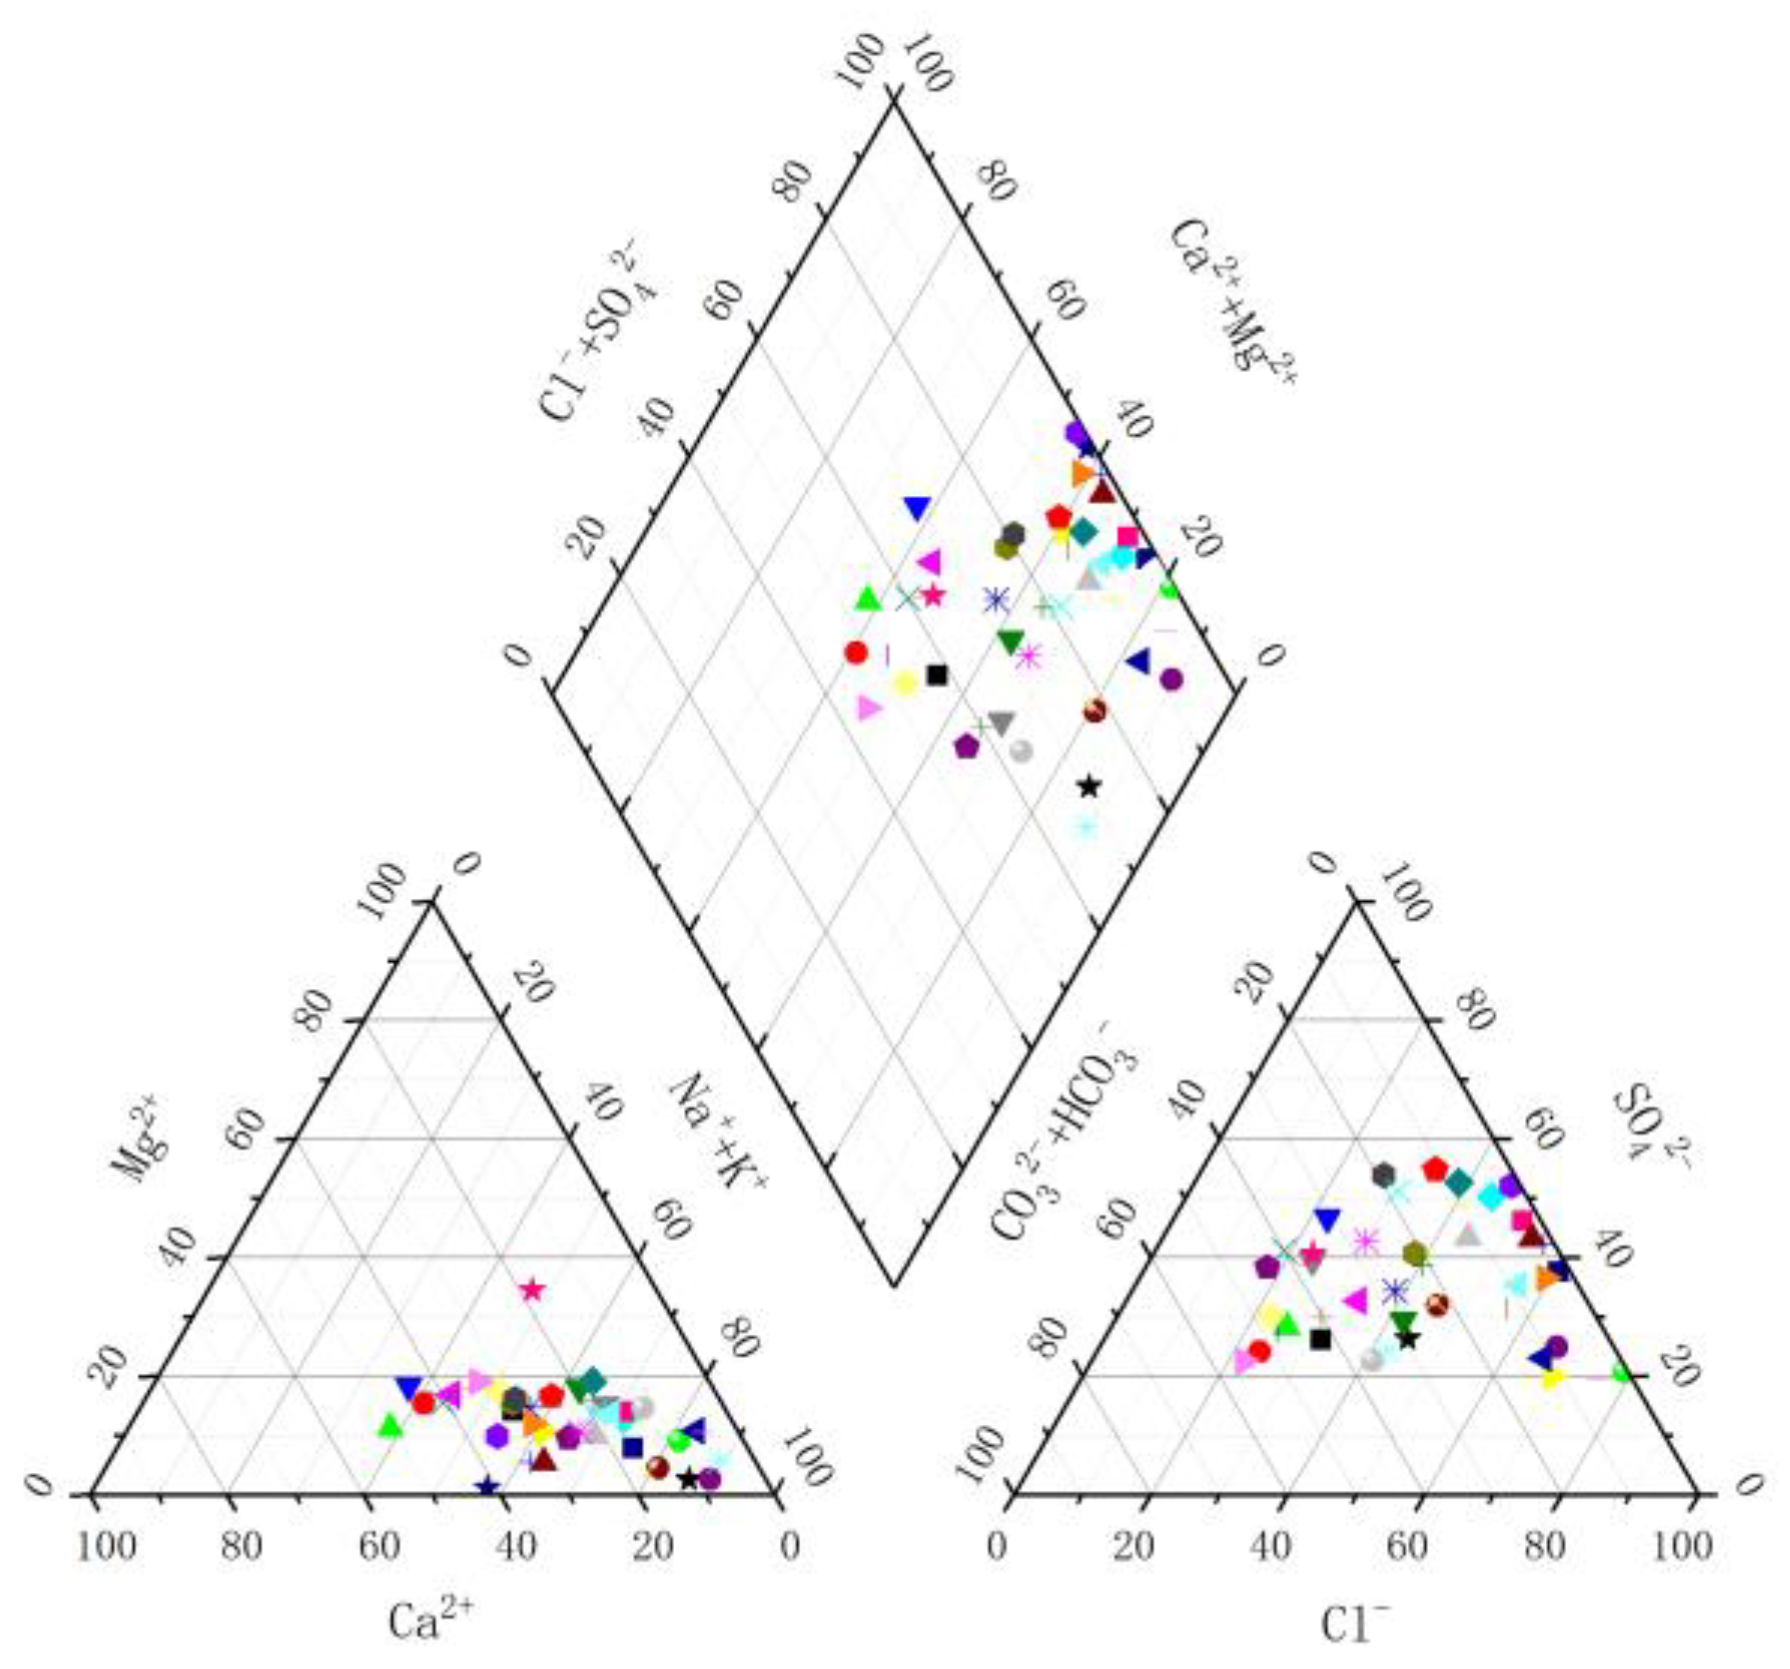
A Piper diagram was drawn according to the test results of the collected samples, as shown in Figure 2.
The main hydrochemical type of the research area was Na+–Cl−/(SO42−), and the other types included (Ca2+ + Mg2+)–Cl−/(SO42−) and Ca2+–HCO3−, which somewhat differed from the research results of the Aksu River Basin [23,24] but were similar to those on groundwater with a high fluoride concentration in the oases of the Yarkant River Basin [25], the Kashgar River Basin [26], and the Hotan River Basin [27]. It is noteworthy that the above five rivers are all confluence rivers among the mountains of the Tarim Basin.
The test results on the 47 groundwater samples from the research area were obtained and summarized in Table 1.
The average pH value of the shallow groundwater samples of the research area was 8.37, mainly ranging from 7.67 to 8.46, which indicated that the water area of the research area was slightly basic. The only exceptions were four samples (H41, H26, H42, and H27) with pH values of 9.42, 9.91, 10.1, and 10.8, respectively (see Appendix A).
As seen in Table 1, the total dissolved solids’ (TDS) concentration range of the groundwater of the research area ranged from 296 to 19,653 mg/L, with an average value of 2647 mg/L, significantly exceeding the upper limit of 1000 mg/L specified in the GB5749-2006 standard. Thus, the water-soluble ion level of the research area was too high. The electrical potential (Eh) value range of the groundwater in the research area was 45–142 mV, with an average value of 113 mV, indicating that all groundwater samples were in an oxidation state.
The total hardness (TH) range of the groundwater samples ranged from 51.3 to 4974 mg/L, with an average value of 787 mg/L, significantly exceeding the upper limit of 450 mg/L specified in the GB5749-2006 standard. The Pearson correlation coefficient between TH and TDS was 0.969, indicating a significant positive correlation.
3.2. Fluoride Distribution Law in the Groundwater of the Research Area
For all the collected 47 samples, the fluorine concentration ρ(F−) was between 0.2 and 5.46 mg/L, and the average value was 1.14 mg/L. The ρ(F−) value of 9 samples was ≤0.5 mg/L, accounting for 19.15% of all samples, and that of 19 samples was ≥1 mg/L, accounting for 40.43% of all samples. The ρ(F−) of the remaining 19 samples ranged from 0.5 to 1.0 mg/L.
The rest of this paper is subdivided into subsections, describing the experimental results, their interpretation, and empirical conclusions.
3.3. Relationship between the Fluoride Ion Concentration and the Hydrochemical Index
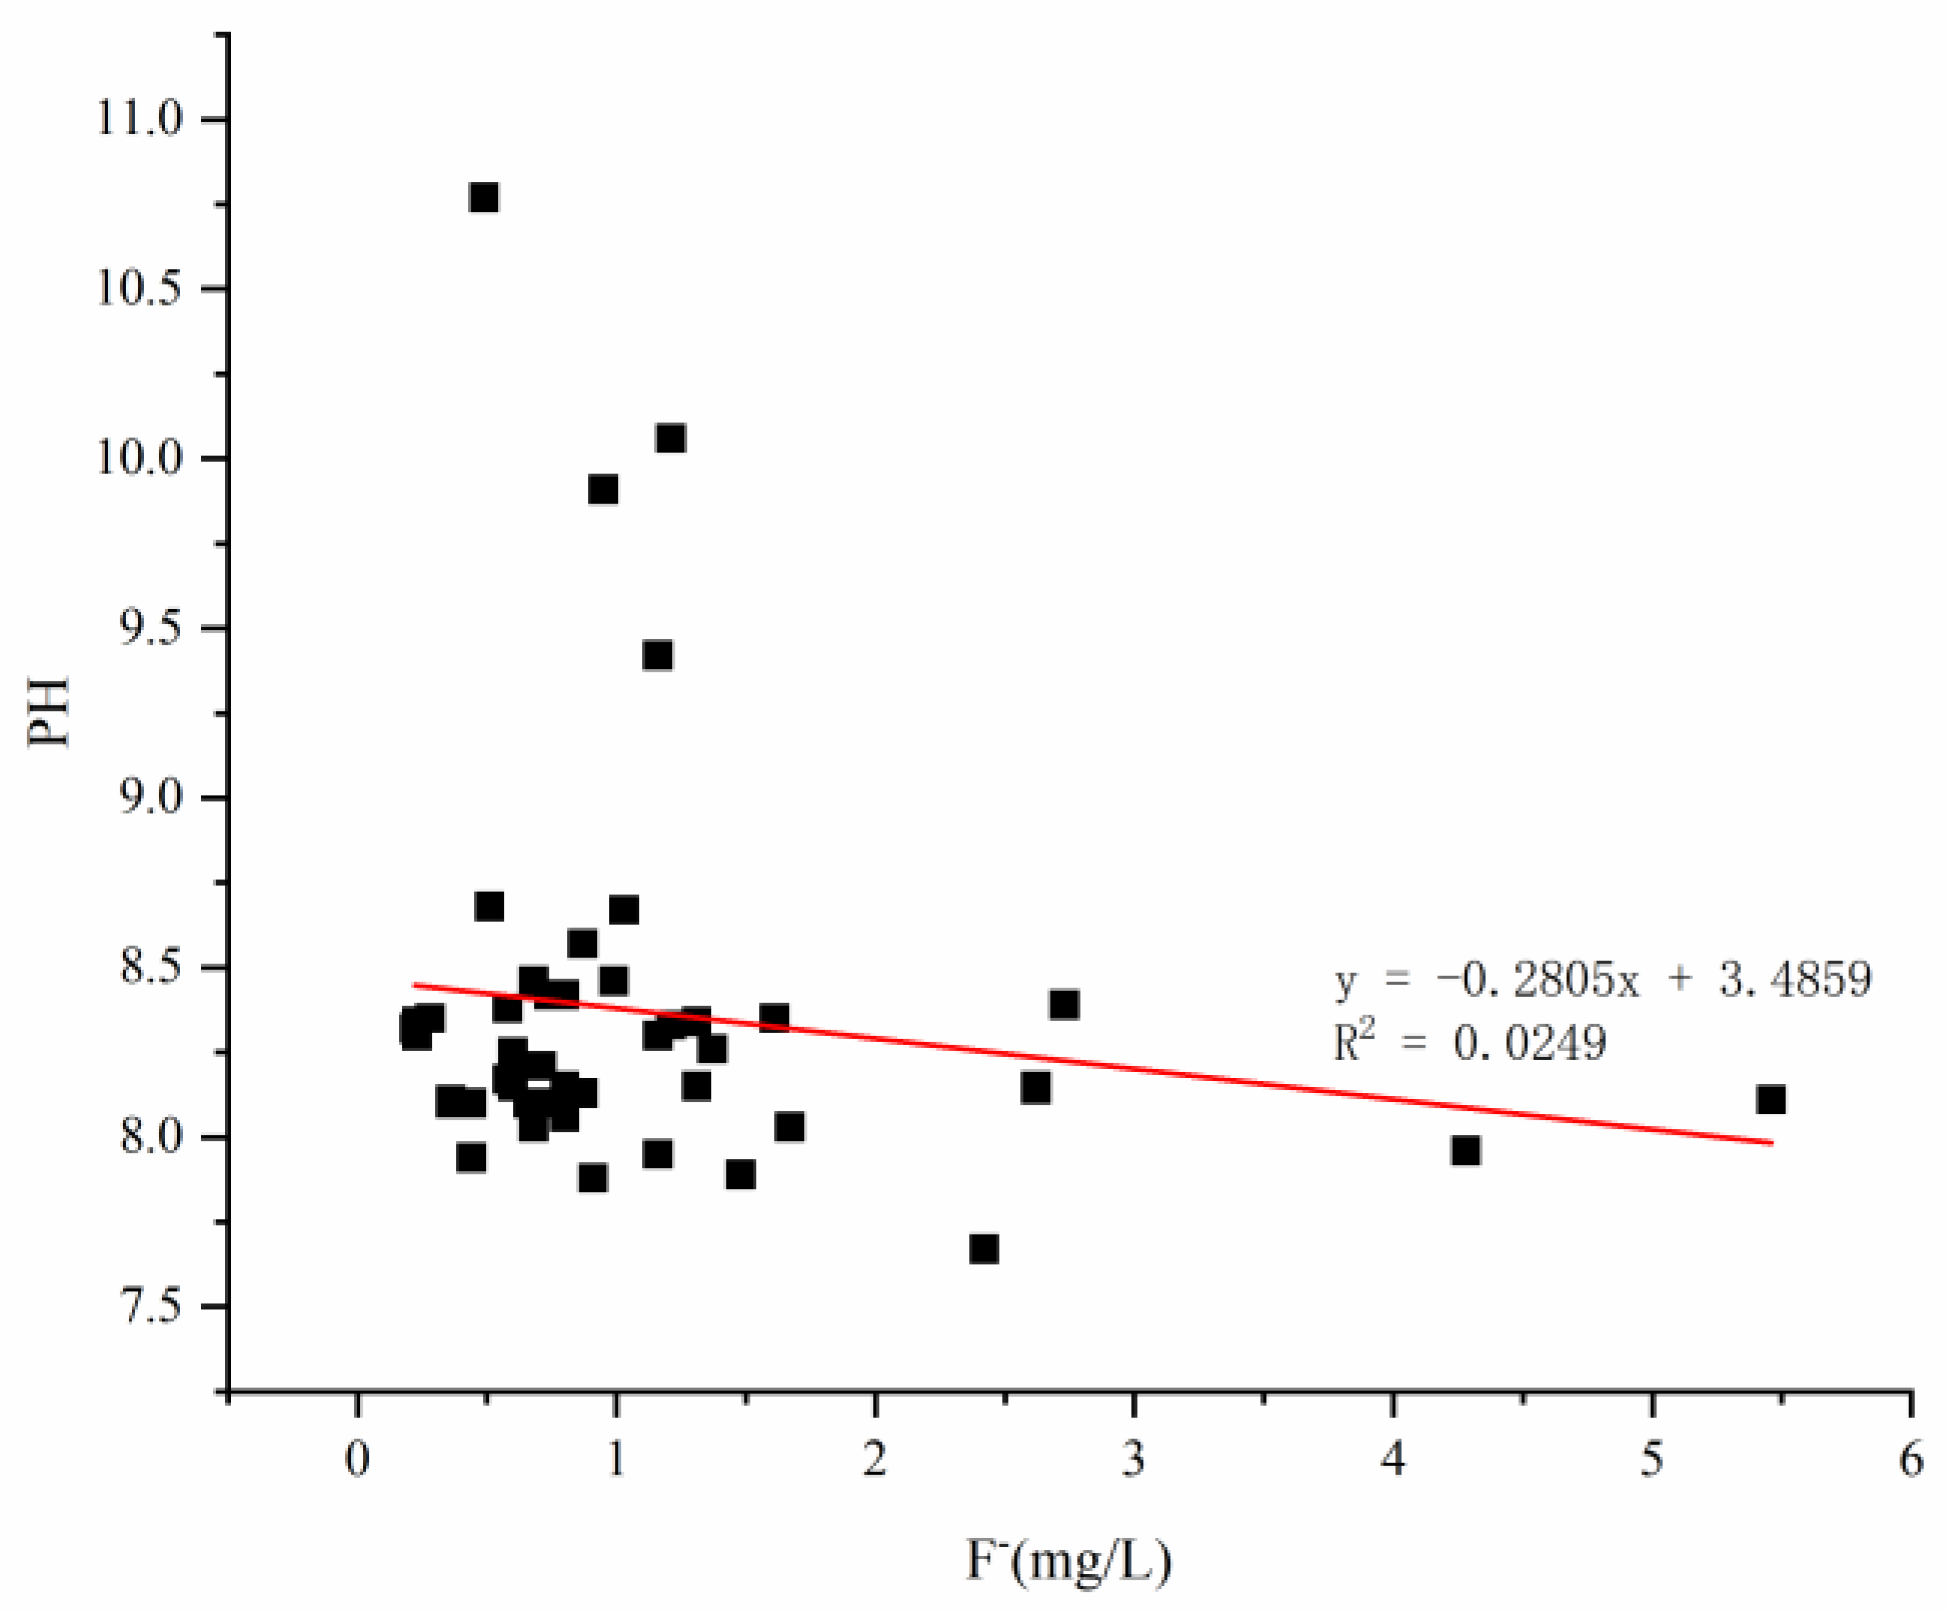
3.3.1. Relationship between ρ[F−] and pH Values
According to Table 1, the pH range of the groundwater samples with low fluoride concentrations (below 1.0 mg/L) was 7.88–10.8, with an average value of 8.38; that of samples with high fluoride concentrations (no less than 1.0 mg/L) was 7.67–10.1, with an average value of 8.35. Thus, the whole research area was in a slightly basic environment with extremely active fluoride ions, providing good conditions for the migration and transfer of fluorides. It further facilitated the formation of widespread groundwater with a high fluoride concentration. Considering the relationship between ρ[F−] and pH values, as shown in Figure 3, the correlation between the fluoride ion mass concentration and the pH value was not significant (R2 = 0.0249). These results were inconsistent with those on groundwater with a high fluoride concentration [23,24] in the Aksu Prefecture of China. This inconsistency might be related to some factors, such as the surrounding rock type of the river basin and groundwater recharge.
The above low correlation between ρ[F−] and pH differed from the significant positive correlation between these parameters of groundwater with a high fluoride concentration in the Zhangye Basin of Northwest China [28] and the Datong Basin of North China [10,29,30]. This difference was mainly caused by the difference in the climate and geographic environment of the research area and some other factors.
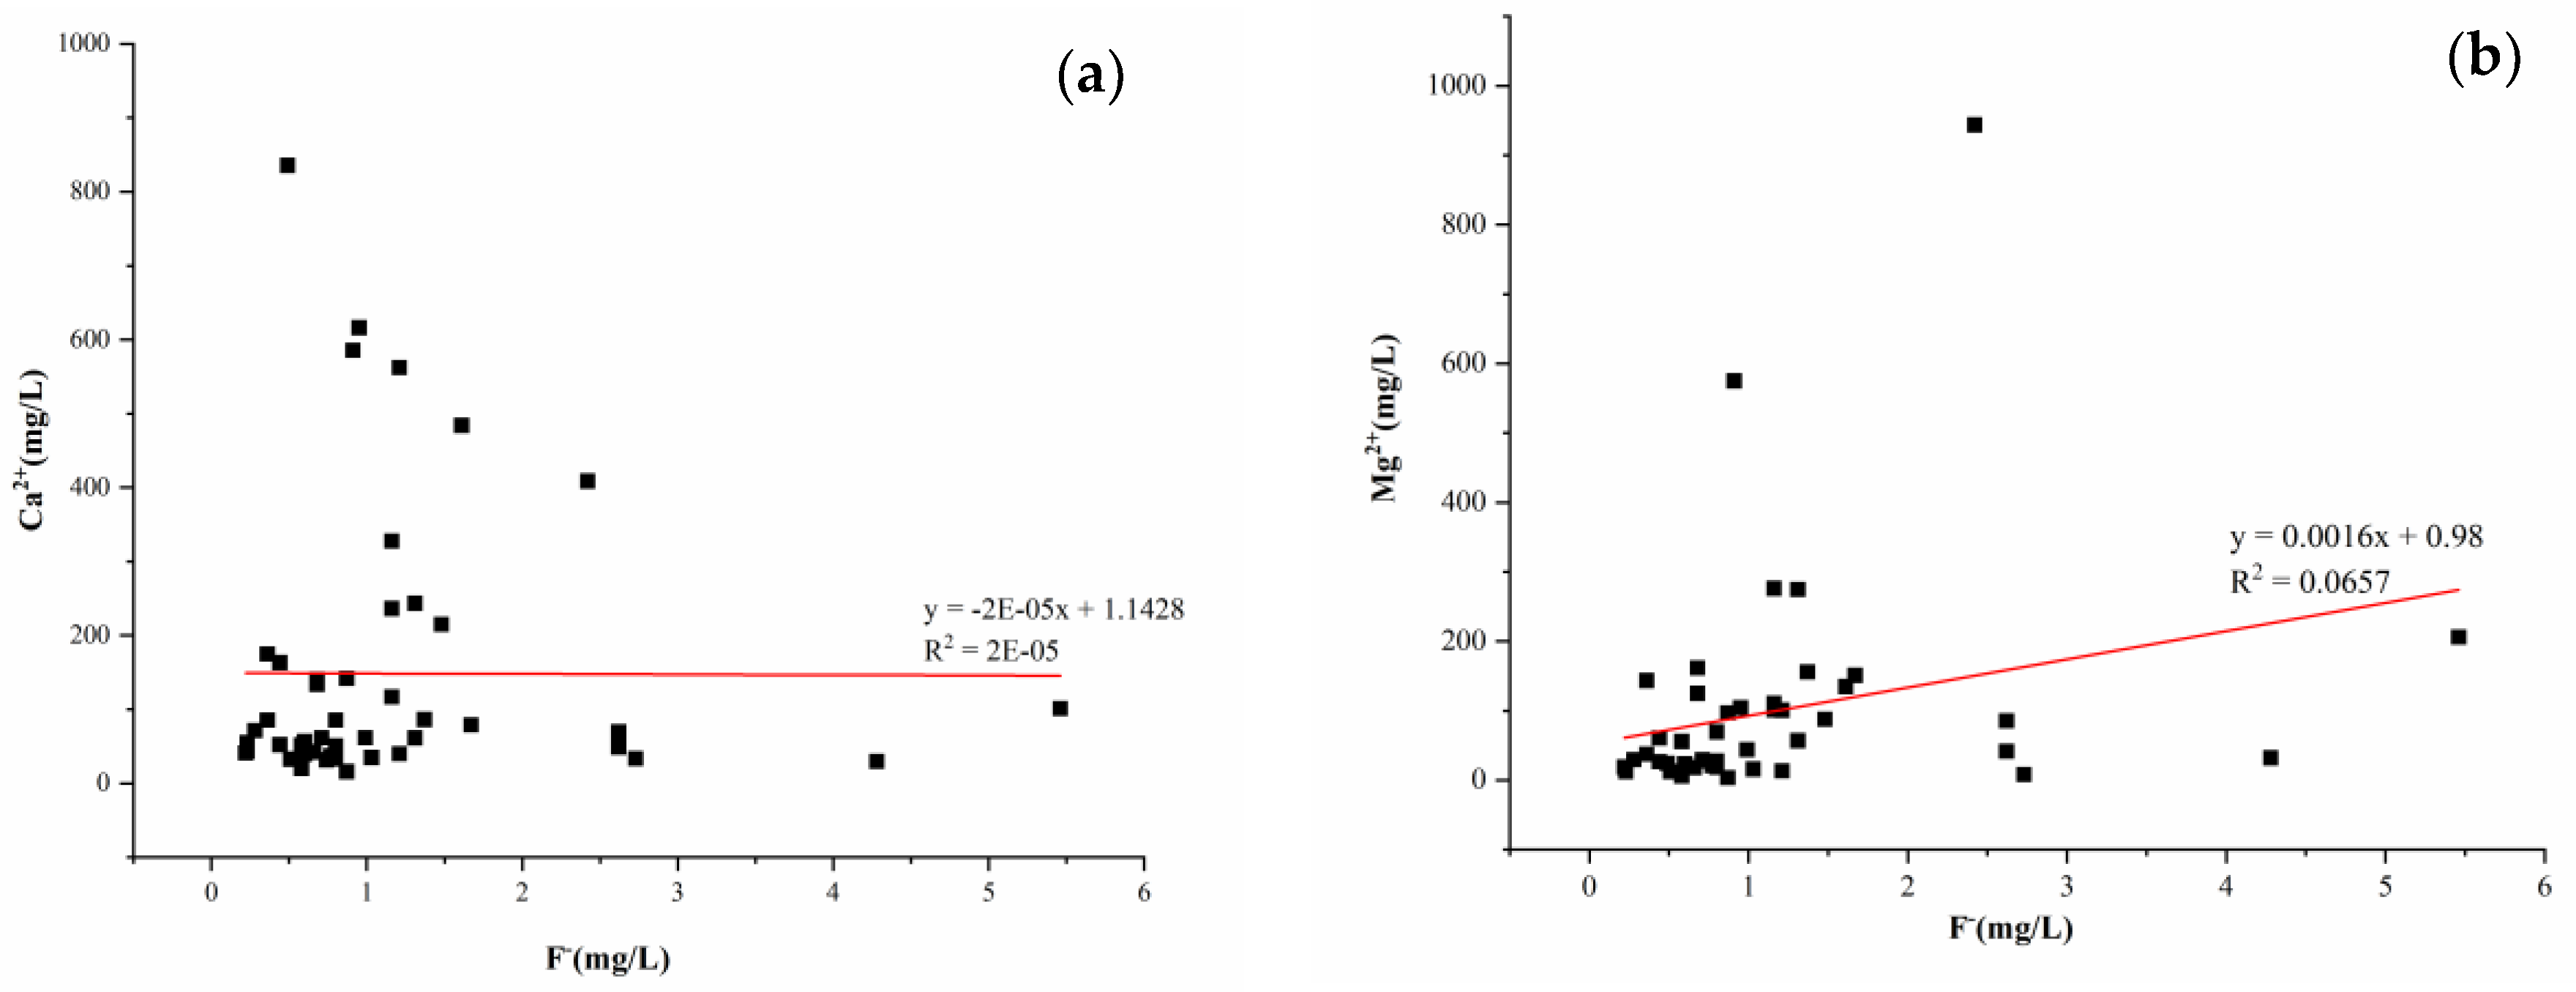
3.3.2. Relationship between the ρ[F−] Value and the Calcium and Magnesium Ion Mass Concentrations
A negative correlation between the ρ[F−] and the calcium ion mass concentration was observed in the groundwater samples of the research area (Figure 4a), which indicated some other deionization in the groundwater, such as carbonate rock sedimentation and cation exchange adsorption. This result was consistent with the low Ca2+ concentration of the widespread groundwater environment with a high fluoride concentration [10,15].
The correlation between ρ[F−] of the groundwater samples and ρ[Mg2+] was not significant (Figure 4b). The results proved there was some other deionization in the groundwater of the research area.
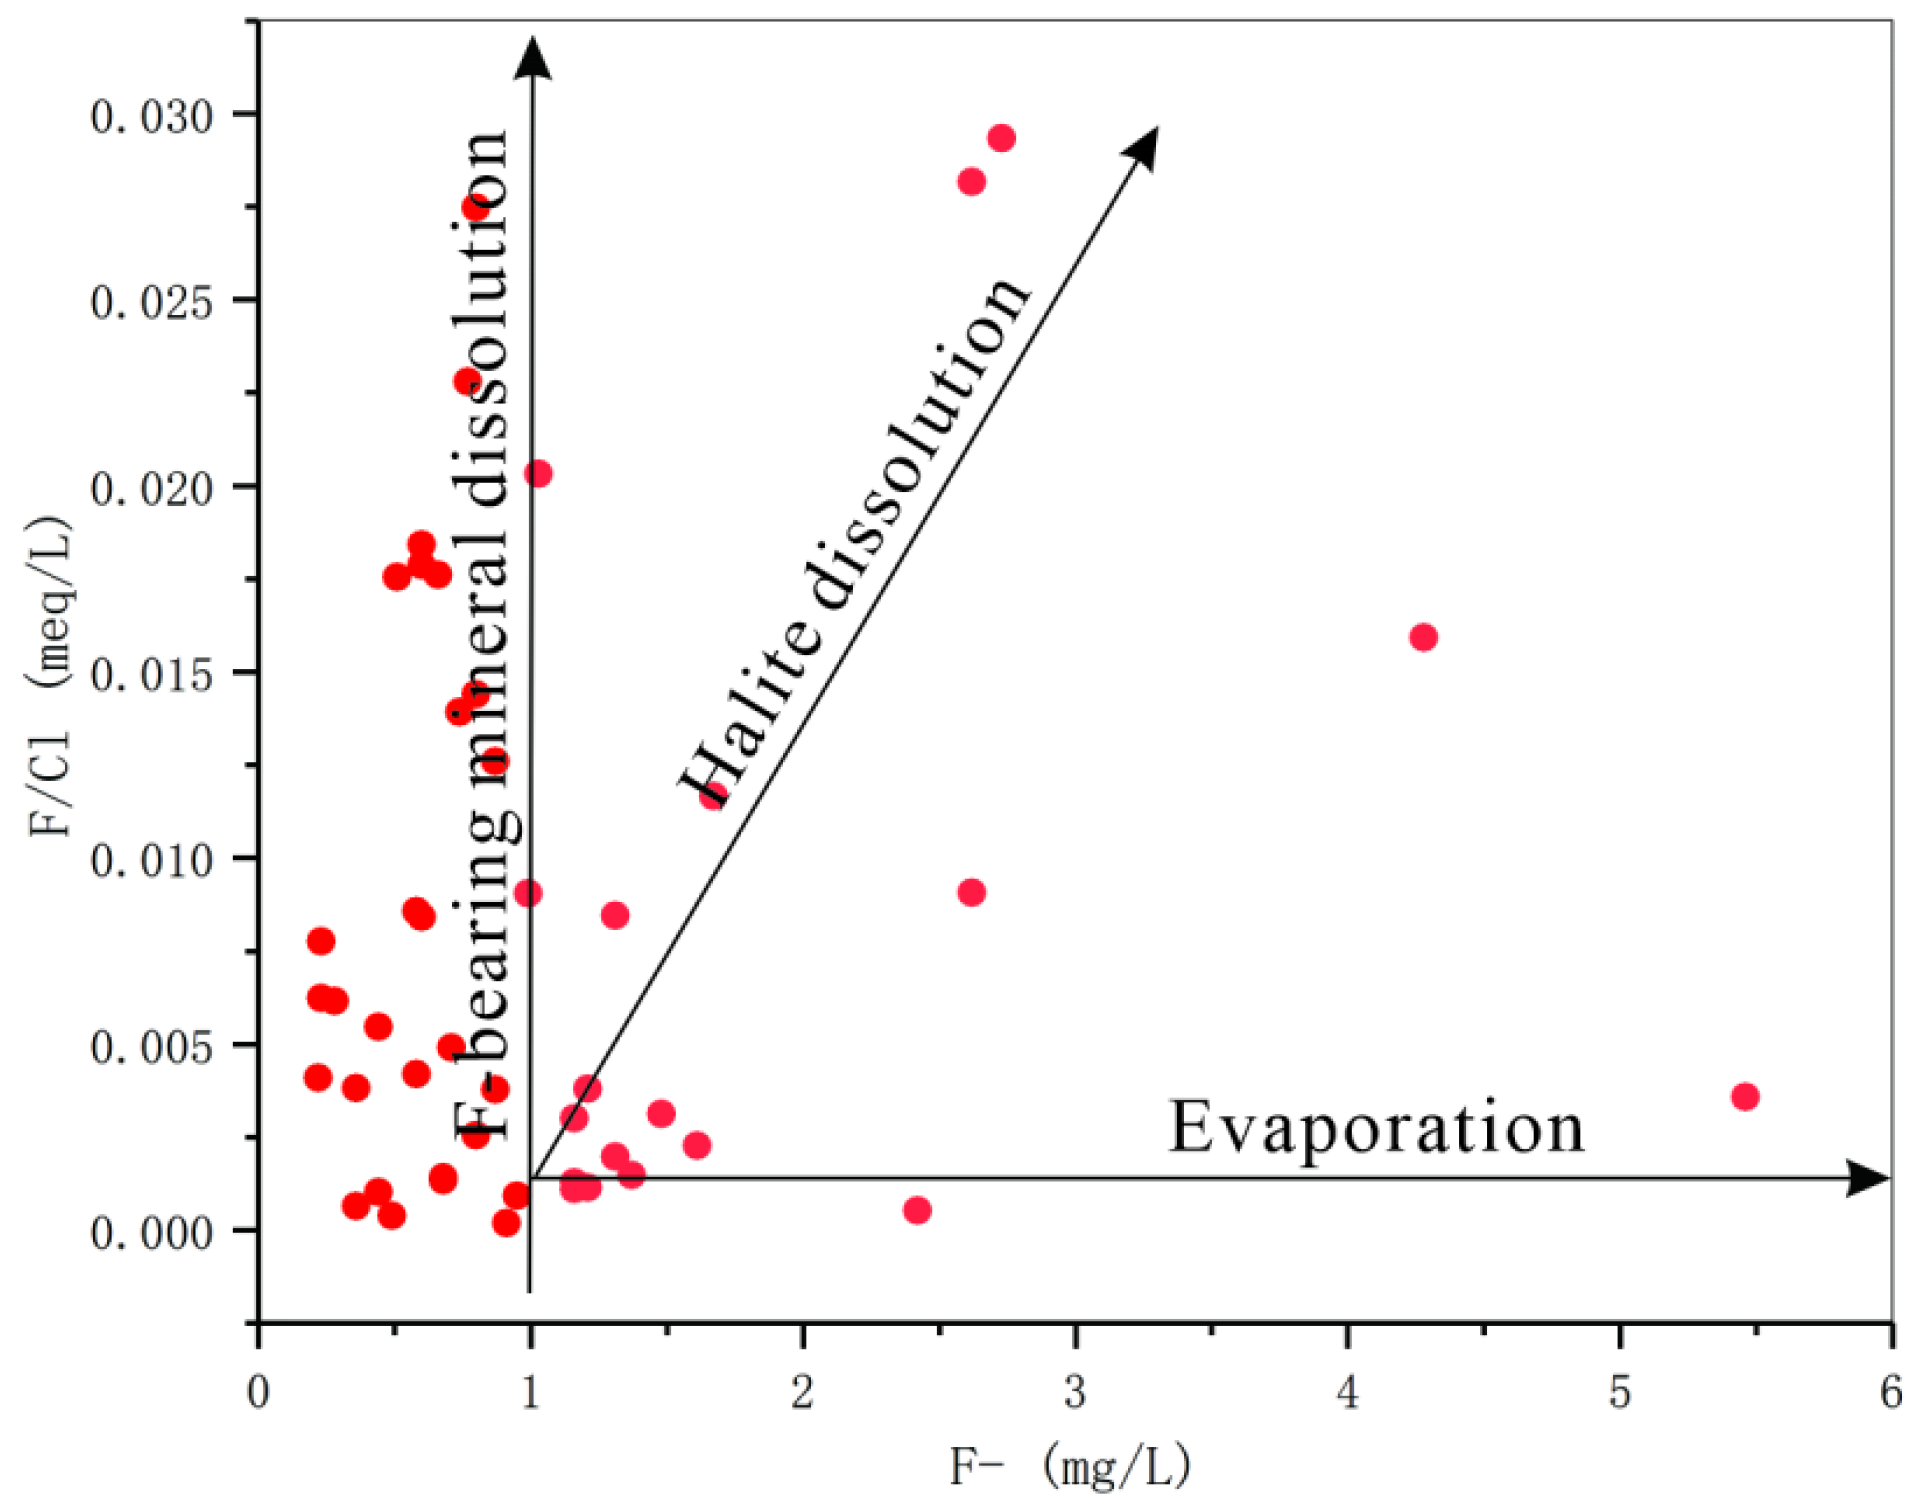
3.3.3. Relationship between ρ[F−] and the F−/Cl− Ratio
The results of previous studies on the relationship between F− and Cl− in the groundwater of basins in northern China, such as the Yuncheng Basin [10,11] and Datong Basin [17], have shown that ρ[F−] and ρ[Cl−] kept changing synchronously in the groundwater if the evaporation-concentration process mainly controlled the fluoride enrichment in the relevant region, and then the ratio became stable as ρ[F−] increased [31].
Figure 5 shows that in the research area, groundwater with a low fluoride concentration (below 1.0 mg/L) was mainly affected by the dissolution of fluorine-containing minerals, and groundwater with a high fluoride concentration (ρ[F−] ≥ 1.0 mg/L) was mainly affected jointly by the dissolution and evaporation-crystallization of halite.
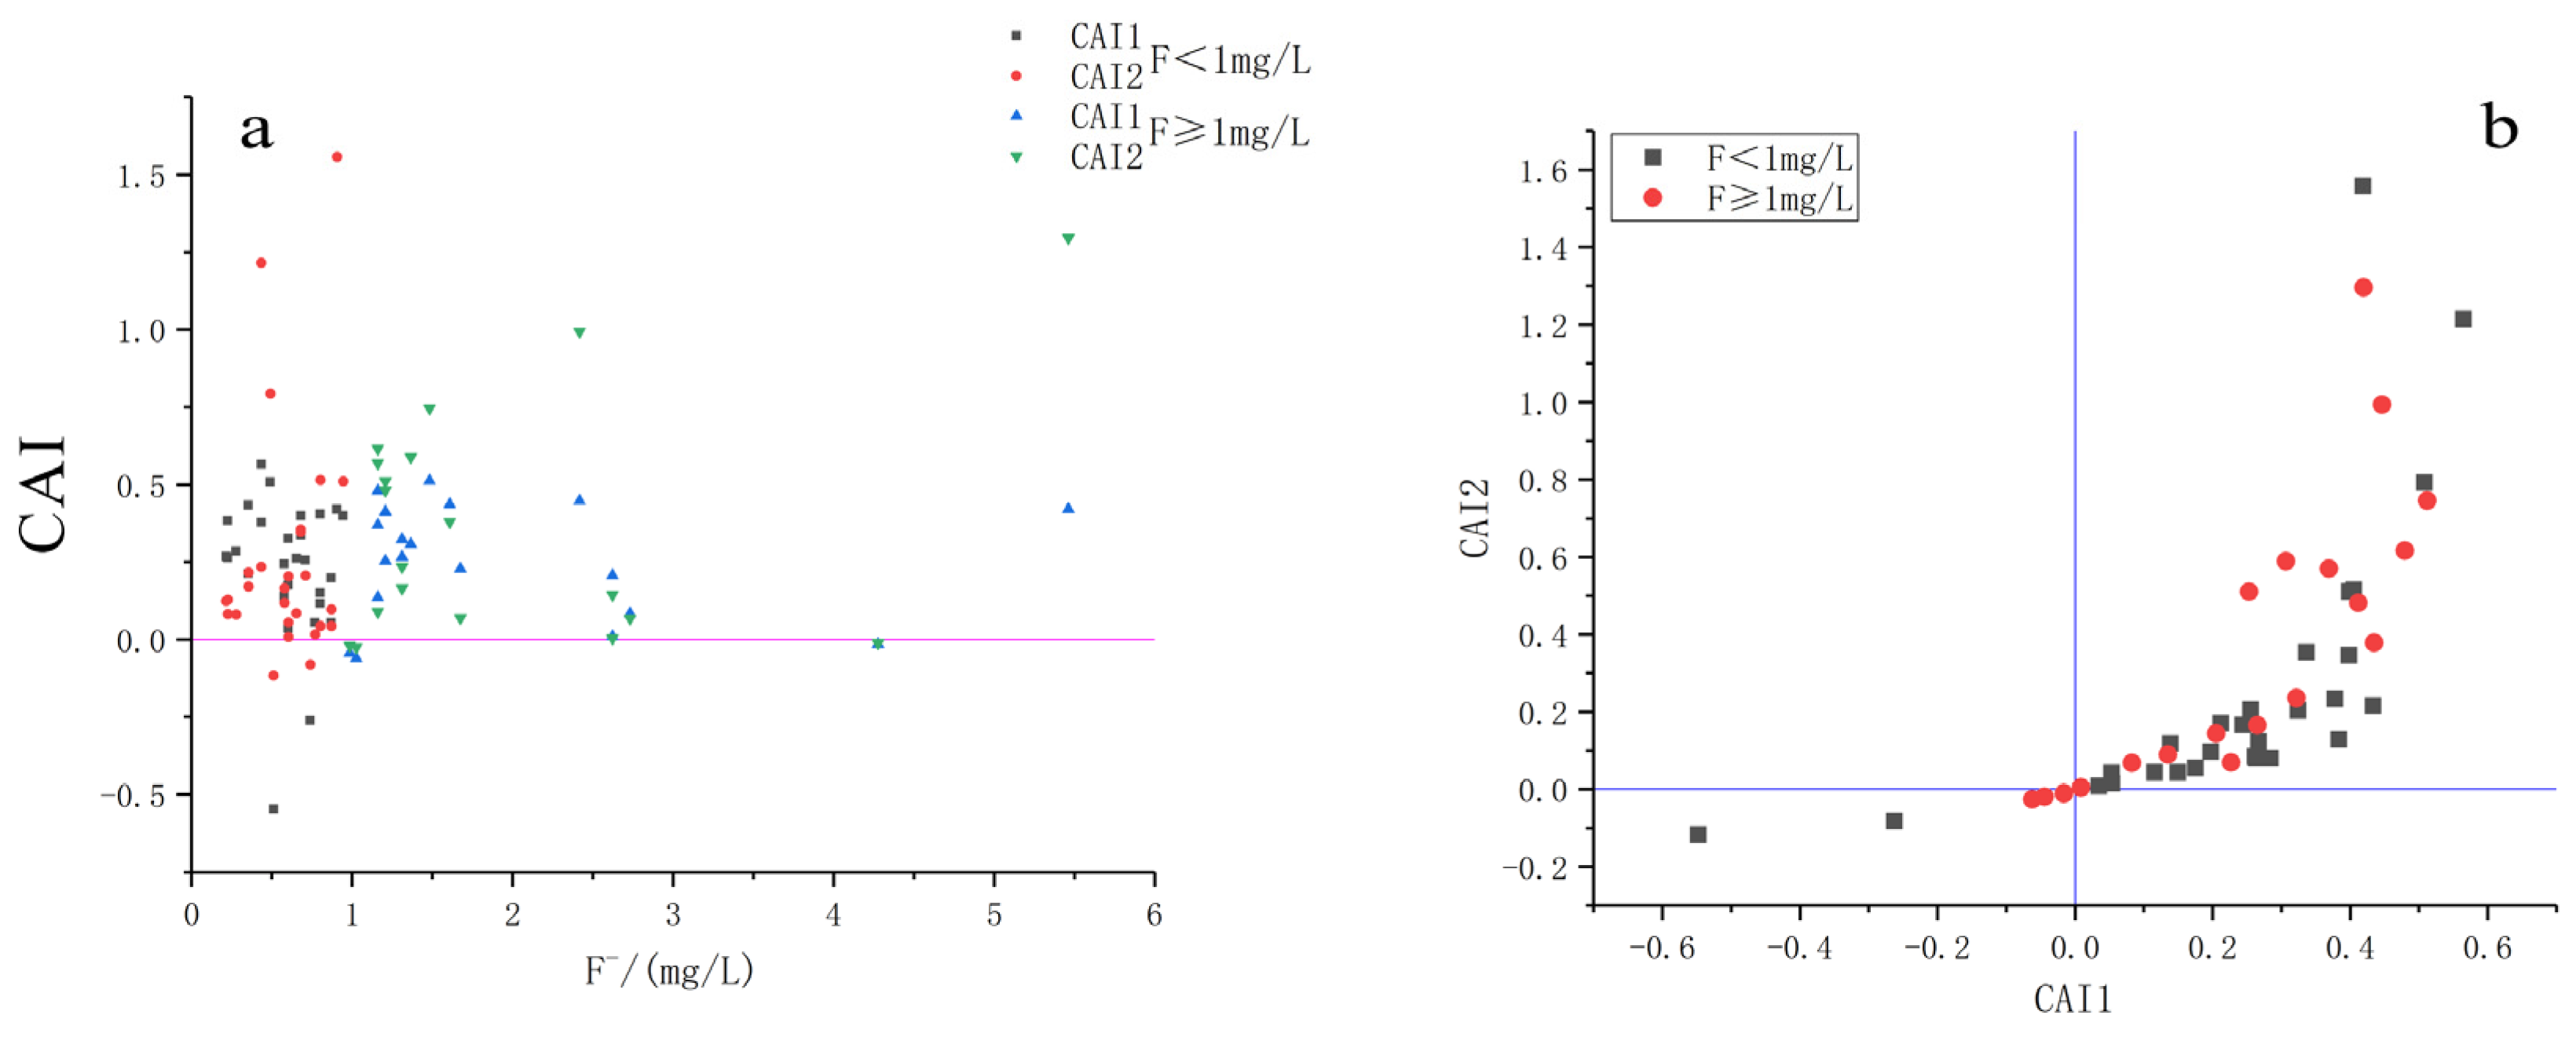
3.3.4. Cation Exchange
Differences in cation absorption energy ensure the cation exchange. Chlor-alkali indices (CAI-1 and CAI-2) show the absorption among Ca2+, Mg2+, and Na+ in groundwater [32,33].
Thirty-seven of all groundwater samples (75%) were in the positive value area of Figure 6a, indicating that some significant cation exchange occurred between Ca2+ and Mg2+ ions of the groundwater, while Na+ and K+ ions were absorbed on the aquifer particle surfaces.
The Na+ concentration variation range of the groundwater samples was 37.12–5086.34 mg/L, and the average value was 597.65 mg/L. The Ca2+ concentration variation range of the groundwater samples was 15.83–835.47 mg/L, and the average value was 148.62 mg/L. The Mg2+ concentration variation range of the groundwater samples was 3.65–943.57 mg/L, and the average value was 98.41 mg/L. The above results showed that the Na+ concentration was generally high. In contrast, concentrations of both Ca2+ and Mg2+ ions were generally low. The average value of the Na+ concentrations was four times as high as the average value of the Ca2+ concentration and six times as high as the average value of the Mg2+ concentration in the research area. The results reflected the significant cation exchange between the Ca2+ and Mg2+ of the water area and Na+ and K+ ions absorbed on the aquifer particle surfaces of the surrounding rocks in the research area. It also indicated that the cation exchange between water and rocks was significant. Meanwhile, the results have reflected the existence of some other deionization in the research area.
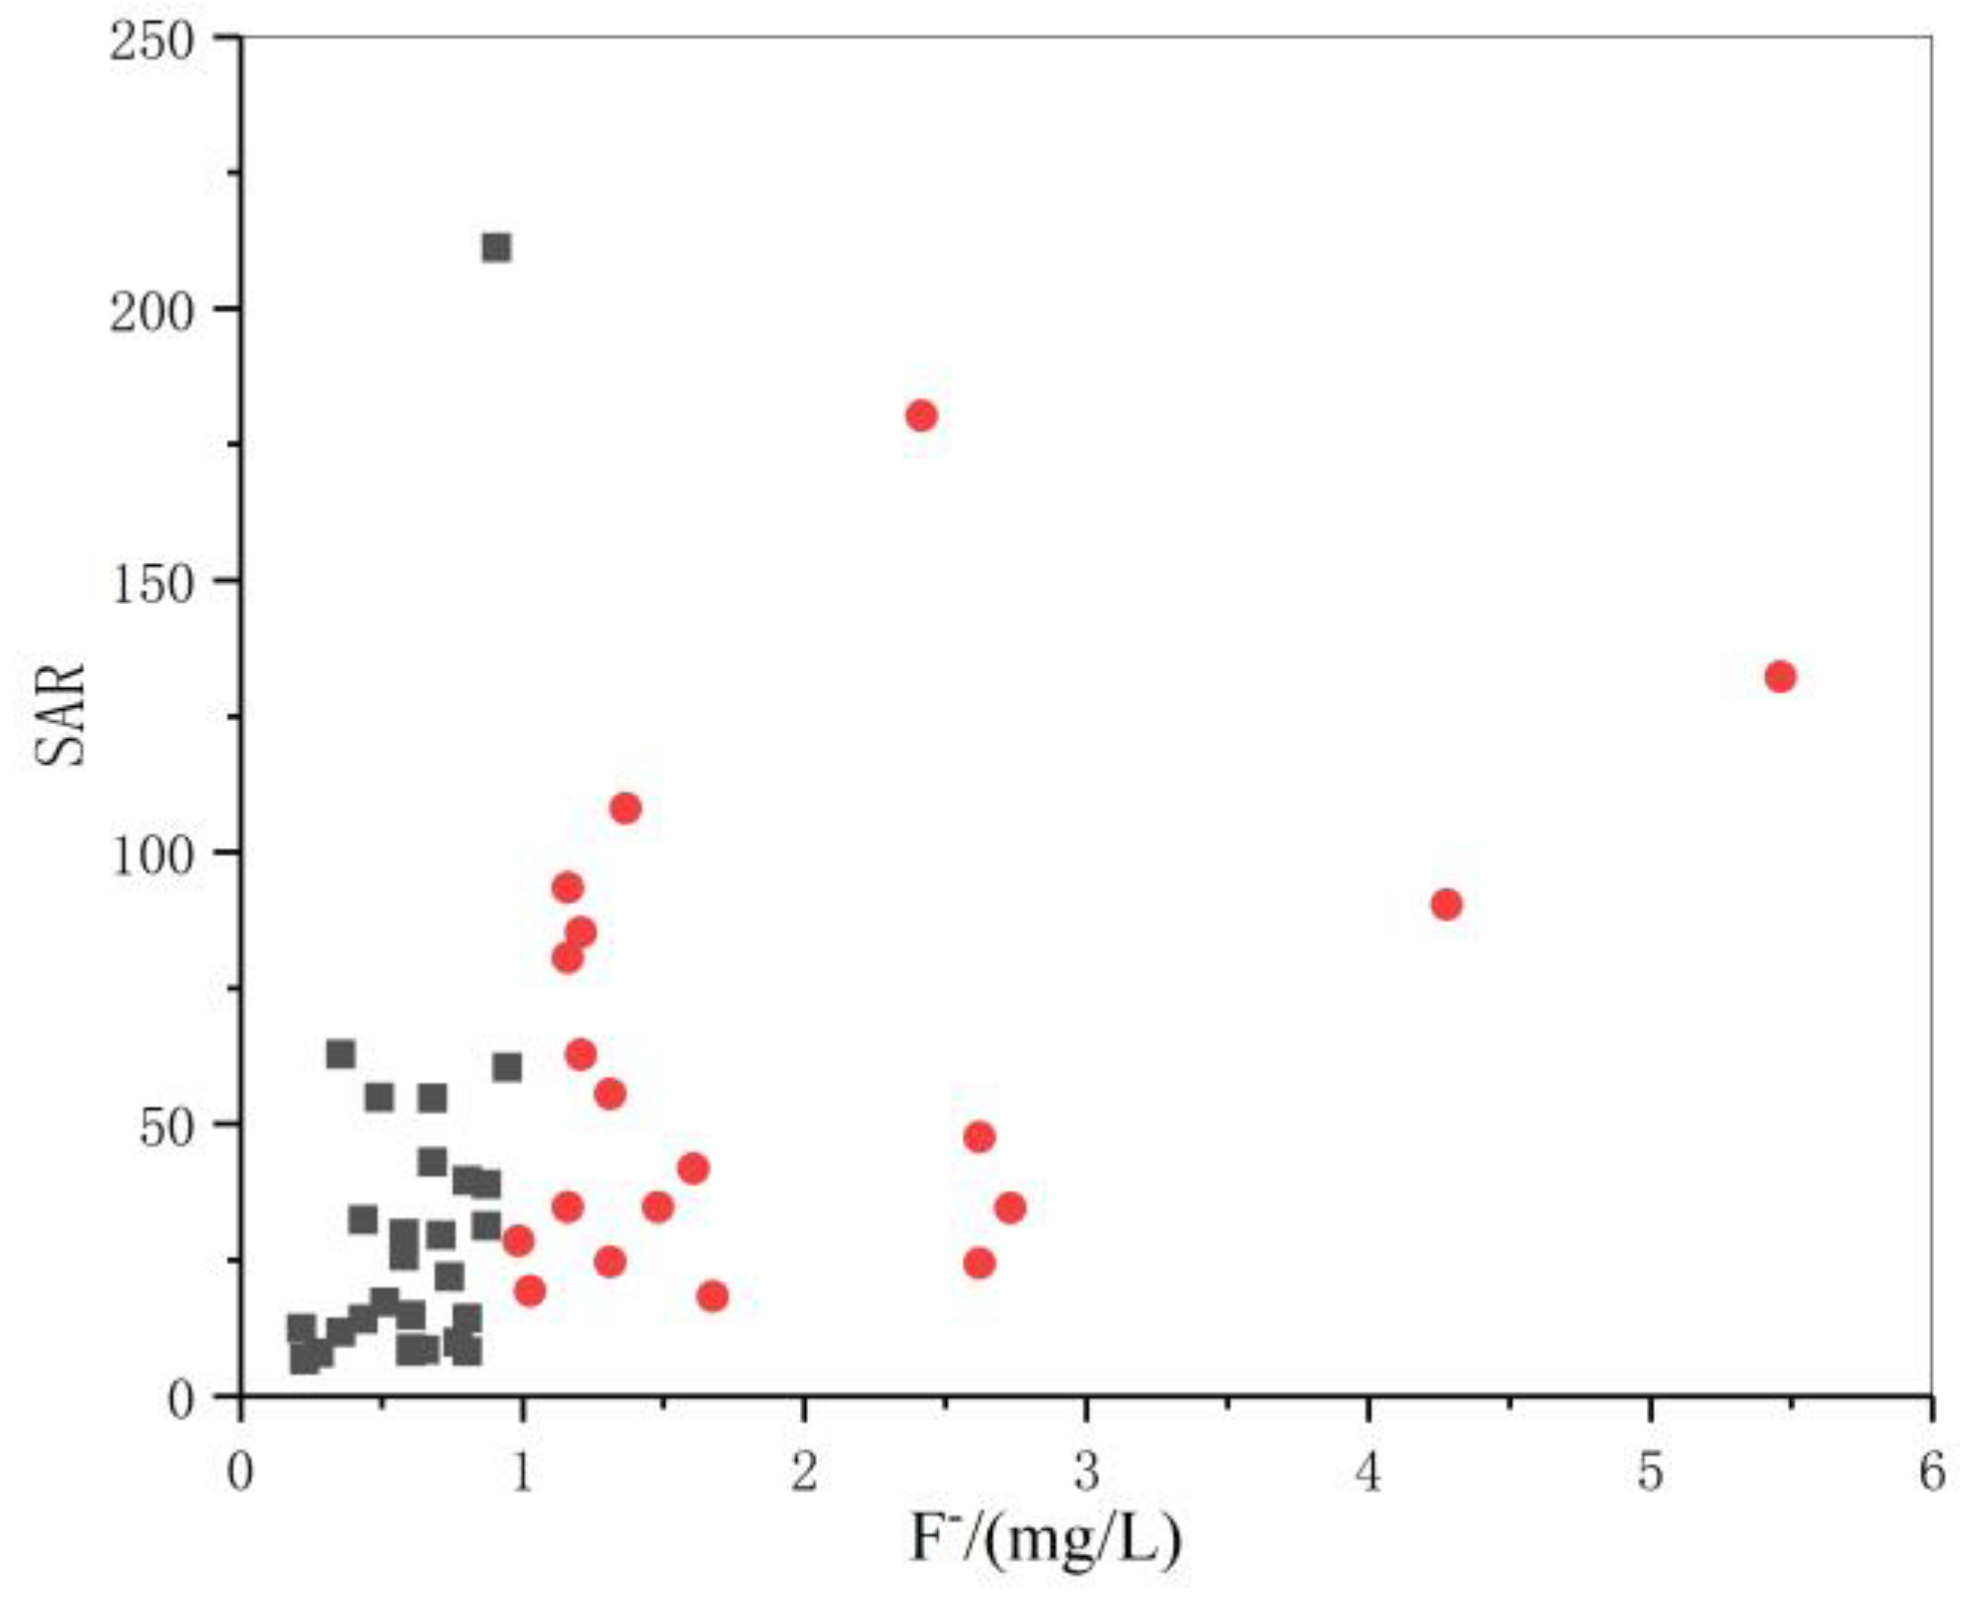
The sodium absorption ratio (SAR) is a standard index used to reflect the alternating absorption between Ca2+, Mg2+, and Na+ ions in groundwater [30]. The Pearson correlation between ρ[F−] and the SAR values in the research area was analyzed and found to be significant at the 0.01 level (both sides). The average value (62.96) of the SARs of the groundwater with a high fluoride concentration was higher than that of the SARs of the groundwater with a low fluoride concentration (31.63). This implied that the alternating absorption between Ca2+ and Mg2+ in the groundwater with a high fluoride concentration and Na+ in the water-containing medium was stronger than the alternating absorption between Ca2+ and Mg2+ in the groundwater with a low fluoride concentration and Na+ in the water-containing medium. The average value of the Na+ concentration was four times as high as that of the Ca2+ concentration and six times as high as that of the Mg2+ concentration in the research area, which was caused by the different absorption capacities between the ions. The absorption capacity of Ca2+ on rock or soil surfaces was slightly stronger than that of Mg2+, while those of Ca2+ and Mg2+ ions on mineral surfaces were much stronger than the absorption capacity of Na+ on mineral surfaces.
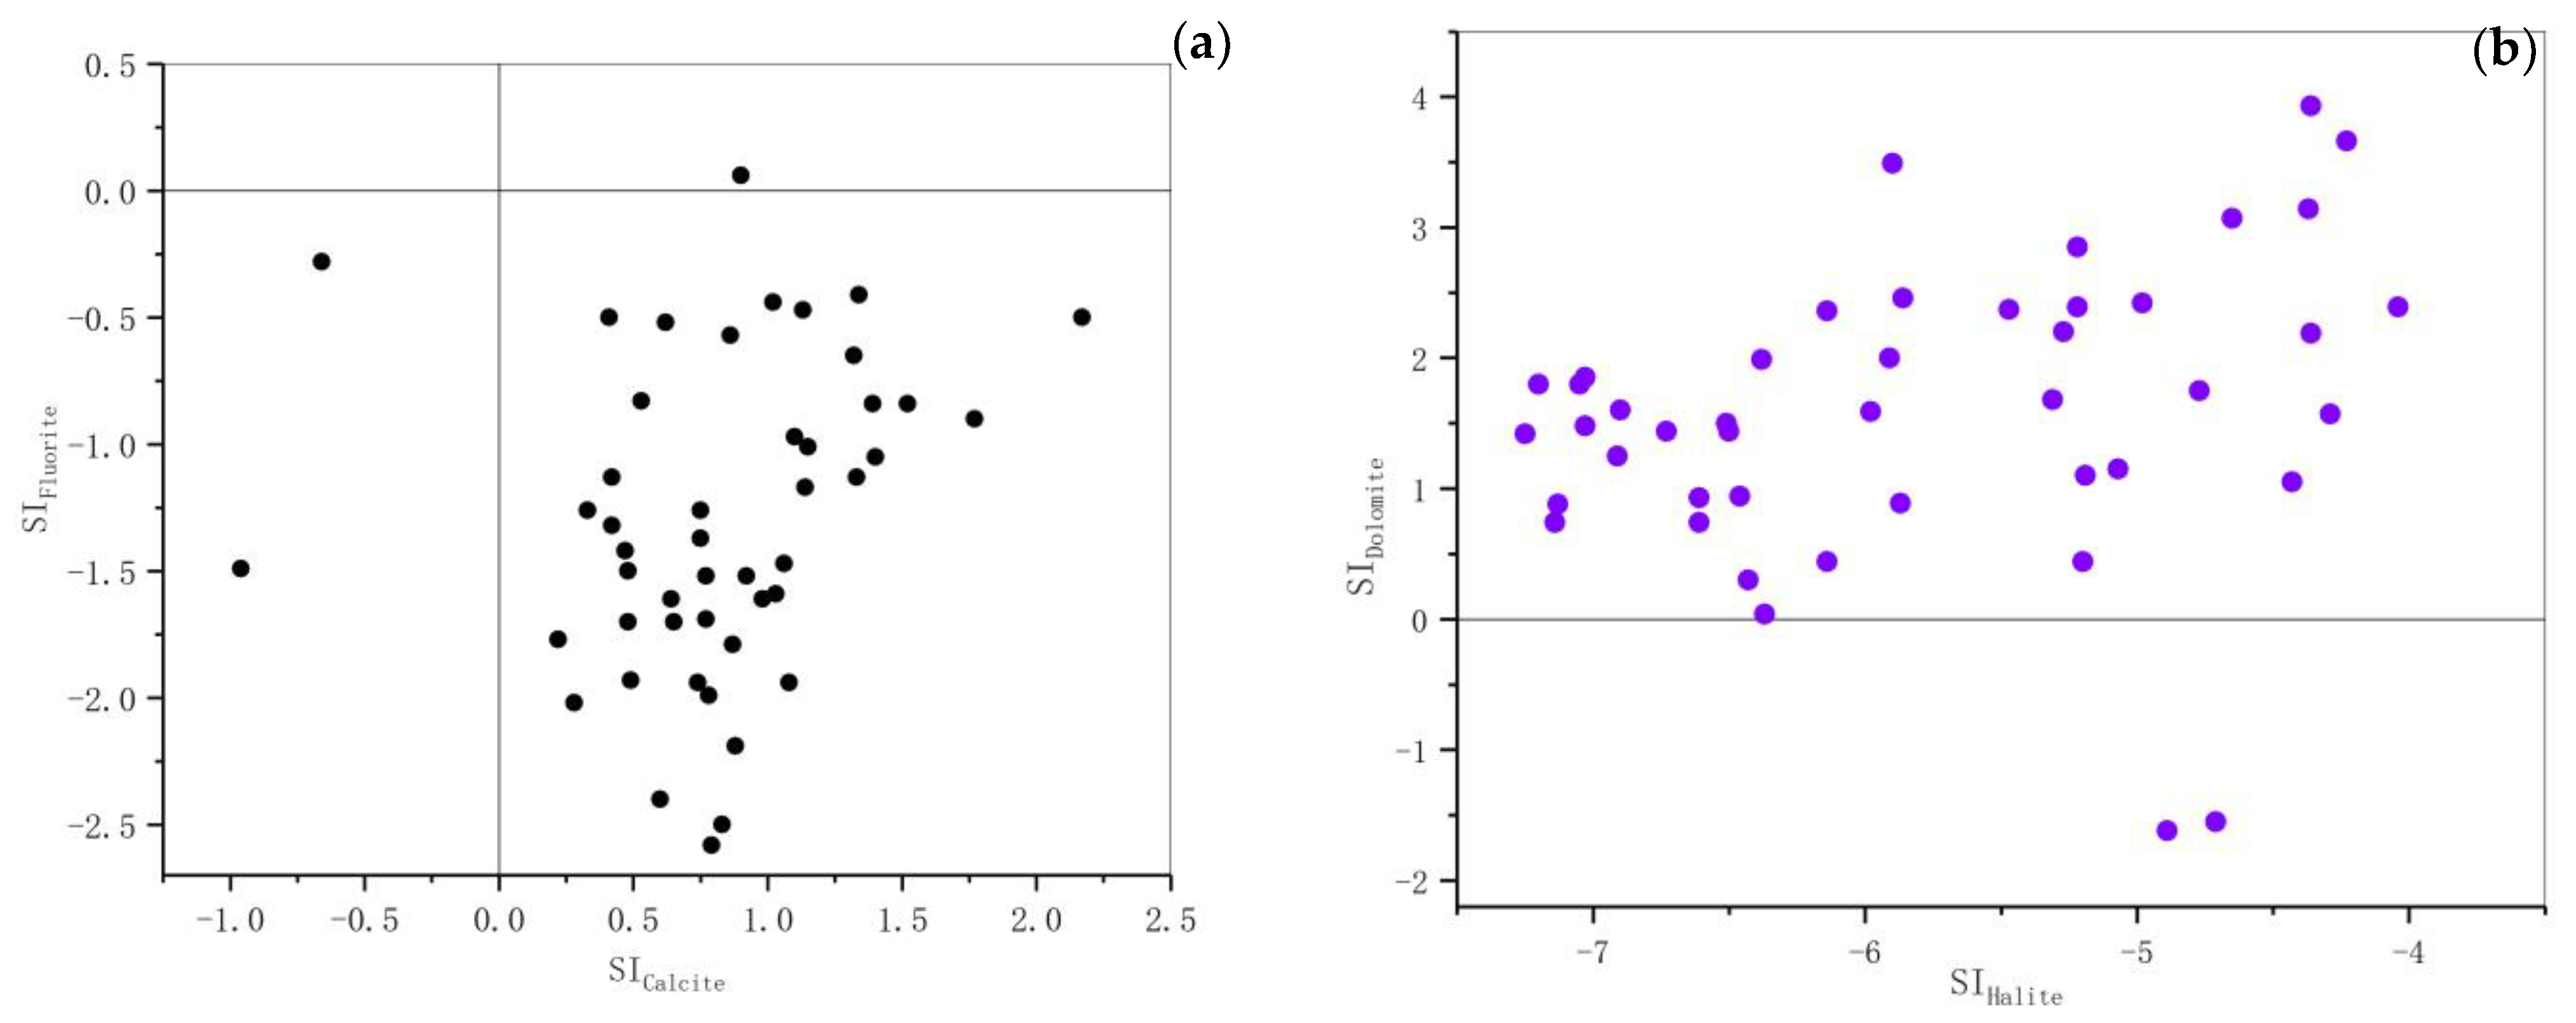
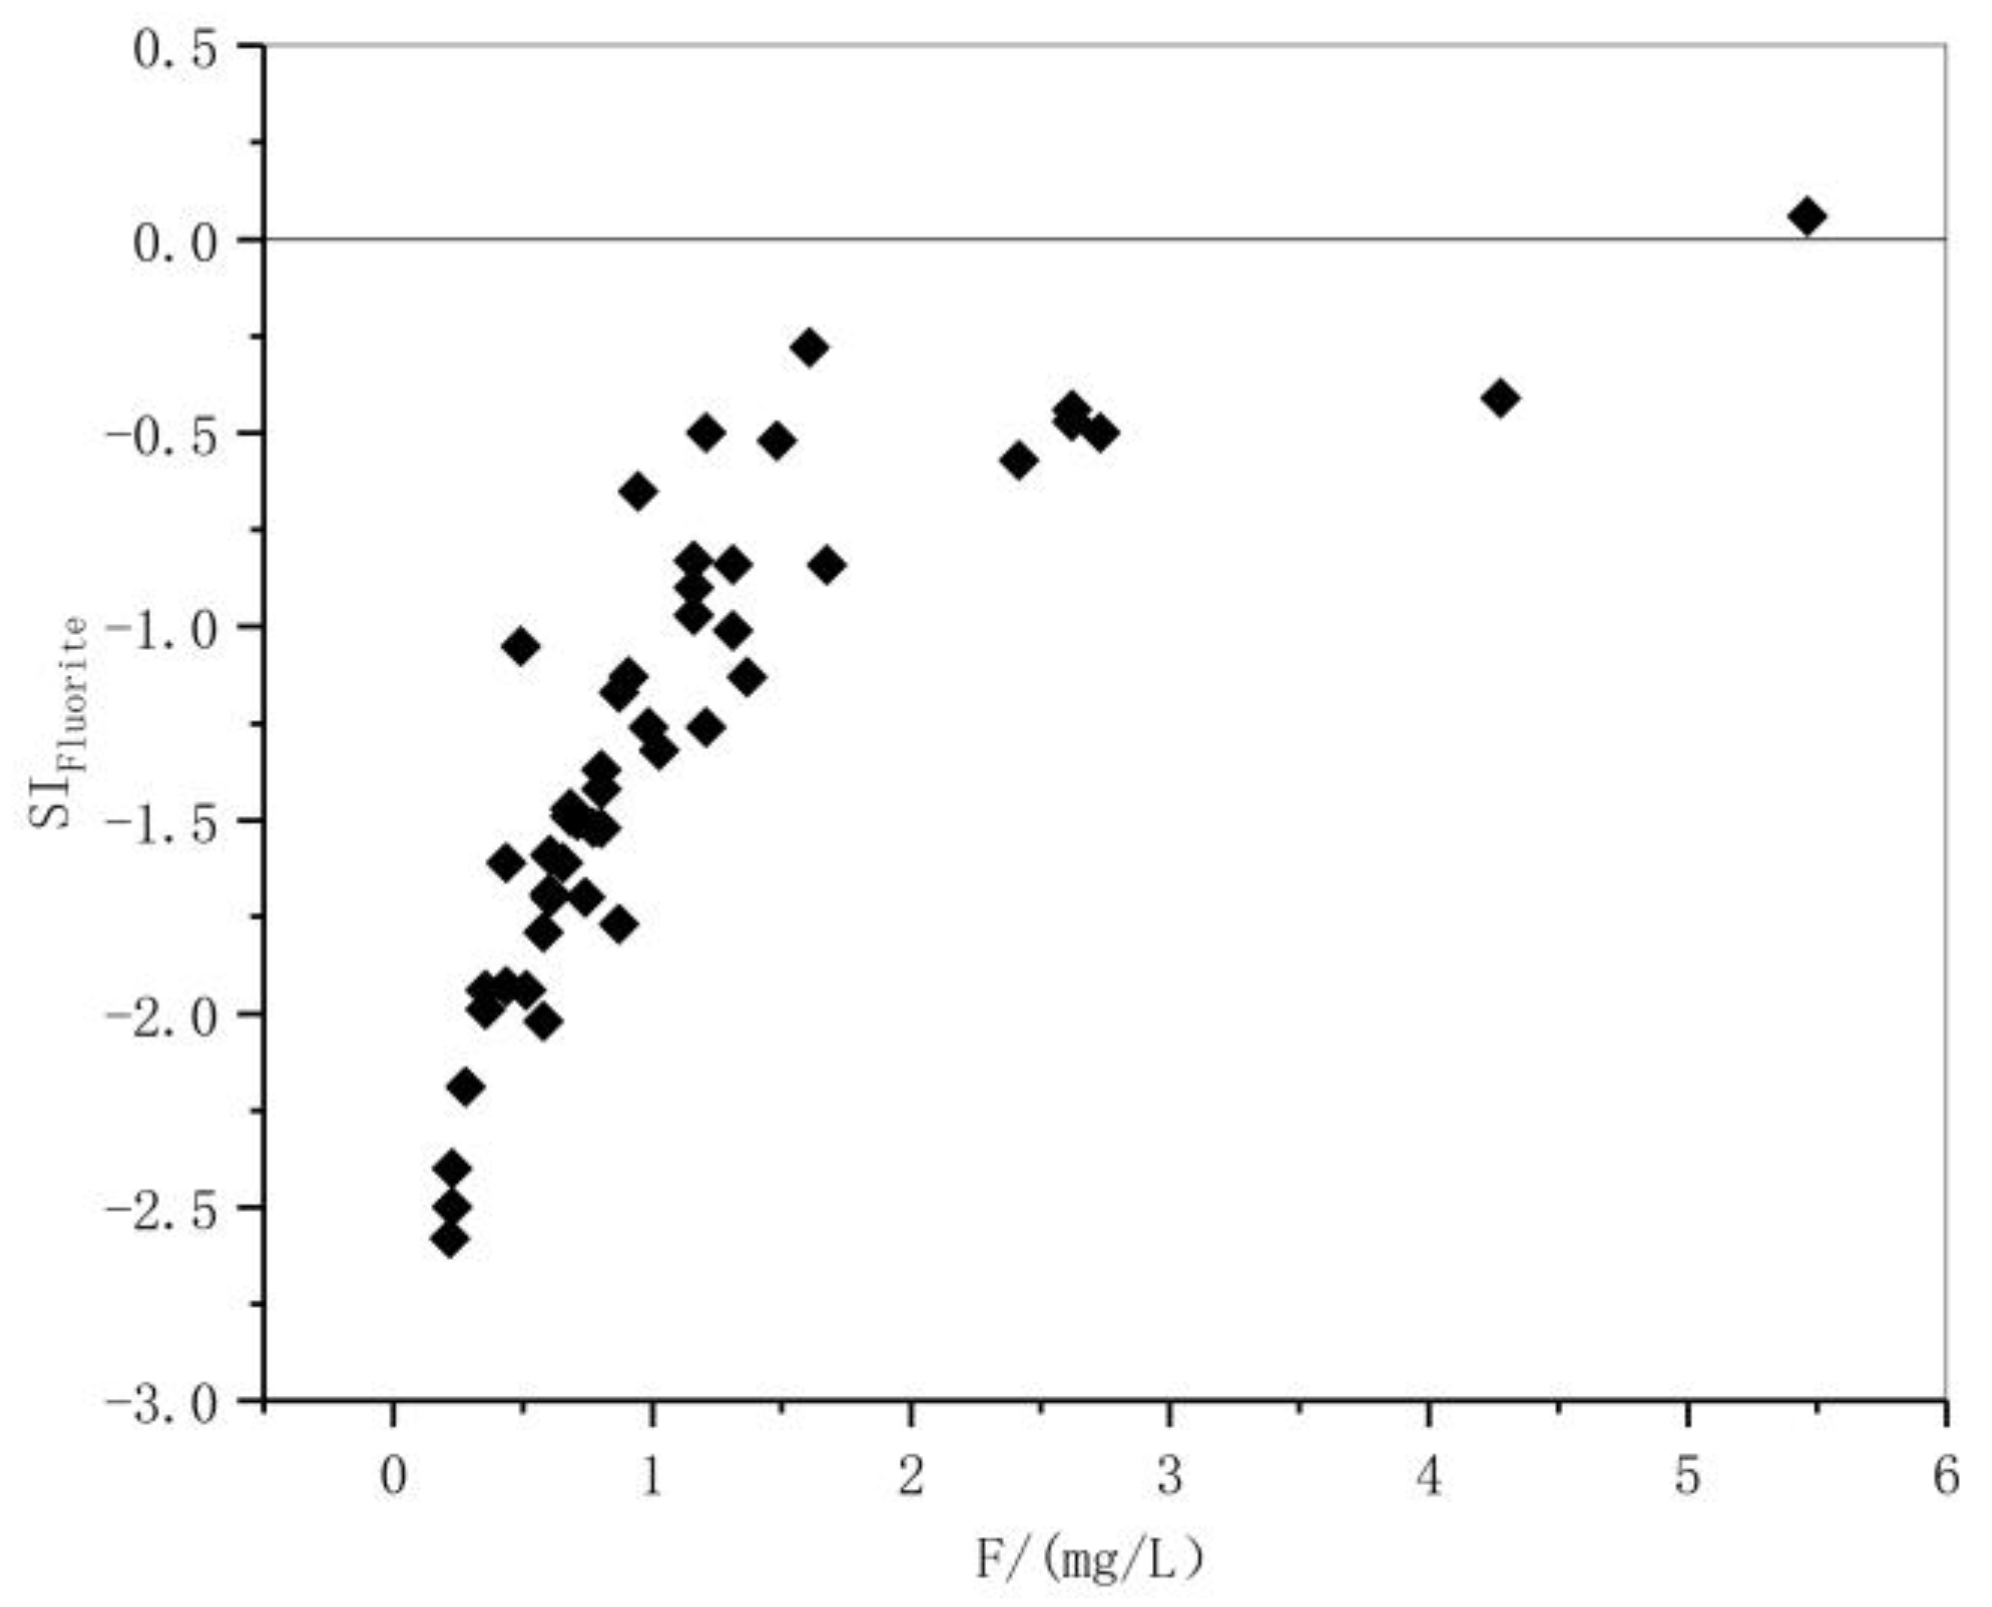
3.4. Saturation Indices of Fluorite, Dolomite, Calcite, and Halite in the Groundwater
The saturation degrees of calcite, dolomite, fluorite, and other minerals in the research area were calculated using PHREEQC software [34,35]. Figure 8a shows that the calcite in 45 of 47 sets of shallow groundwater samples (i.e., 95.7%) was in the saturation state, and the fluorite in 46 of 47 sets of shallow groundwater samples (97.9%) was in the unsaturated state. Figure 8b shows that the dolomite was in the saturation state in 45 sets of shallow groundwater samples, accounting for 95.7% of all tested shallow groundwater samples. The dolomite in only two shallow groundwater samples was in the unsaturated state, accounting for only 4.26%. Meanwhile, all halite in the research area was unsaturated.
It can be inferred from Figure 5 and Figure 8a,b that the groundwater contained so much fluoride because it continued to dissolve fluorine-containing minerals (fluorite) in the research area. According to Figure 4a, the correlation between ρ[F−] and ρ[Ca2+] was negative, the fluorite in the research area was in the unsaturated state (Figure 8a). The correlation between ρ[F−] and Sifluorite was significantly positive (Figure 9), and the concentration of HCO3− was generally too high in the research area. The mechanism that caused fluorite to continue to dissolve in the research area was the decrease in the Ca2+ concentration in the groundwater. The fluorite in water and rocks was unsaturated and constantly dissolved, which led to the continuous increase in ρ[F−] in the groundwater.
Calcite, dolomite, and fluorite are minerals containing Ca2+. Carbonatite sedimentation is one of the Ca2+ concentration decline mechanisms. According to the results computed via PHREEQC software, both calcite and dolomite in the research area were in the saturation state (Figure 8a,b), and Ca2+ precipitated in the groundwater as this type of mineral was deposited.
According to Figure 6 and Figure 7, intense cation exchange occurred in the groundwater of the research area, and intense cation exchange was another mechanism causing the Ca2+ concentration to decline. A significant exchange existed between Ca2+ in the groundwater and Na+ in the surrounding rocks. Meanwhile, the HCO3− concentration in the groundwater was high, and Ca2+ was more likely to be absorbed on the particle surfaces than Na+, which then caused Ca2+-containing minerals to deposit and the Ca2+ concentration in the groundwater to decrease (Formulas (1)–(3)).
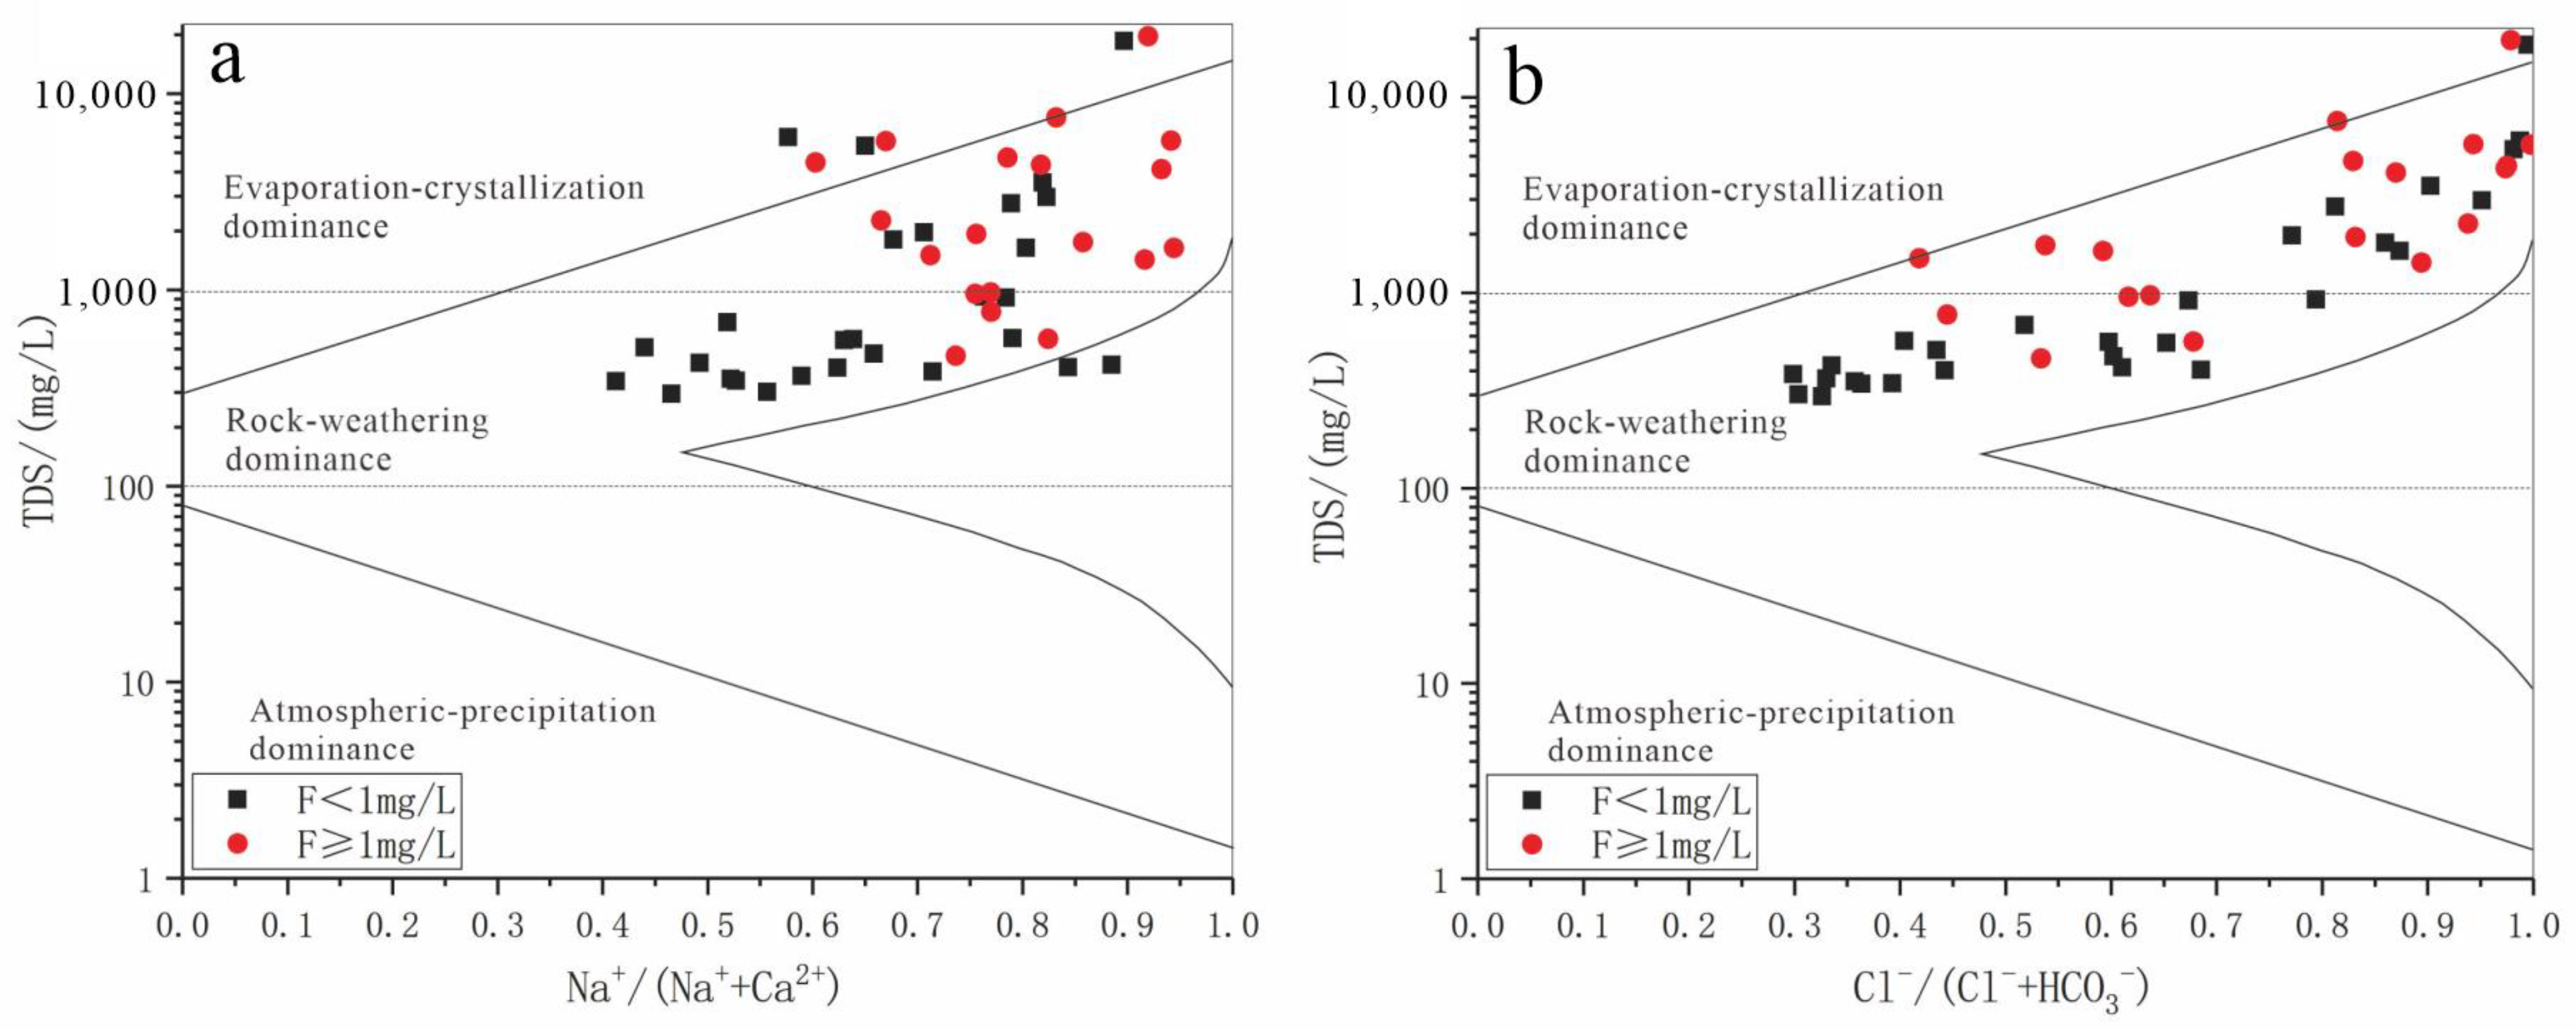
3.5. Analyses of the Main Ion Sources
As it was earlier mentioned (Table 1), the TDS concentration range of the groundwater samples of the research area was 296–19,653 mg/L, and the average value was 2647.4 mg/L. The main source of chemical substances in groundwater in this area was determined through a Gibbs map; the Cl−/(Cl− + HCO3−) ratio range of the research area was 0.30–1.00, and the average ratio was 0.68. The Na+/(Na+ + Ca2+) ratio ranged from 0.41 to 0.94, with an average ratio of 0.72. Thus, the samples in the research area were mainly distributed in the middle and upper right areas of the Gibbs map (Figure 10a,b), indicating that the main hydrochemical process was evaporation-crystallization and rock weathering.
The research area was at the southern foot of the Tianshan Mountains, an inland part of Eurasia, and it was to the north of the Tarim Basin. The site had a typical temperate continental (dry) climate, with intense evaporation in the river basin area. The conclusion that the fluoride enrichment of the research area was affected by the evaporation-crystallization process was confirmed by the fact that the F−/Cl− ratio of the groundwater of the research area (Figure 5) increased with the ρ[F−] value.
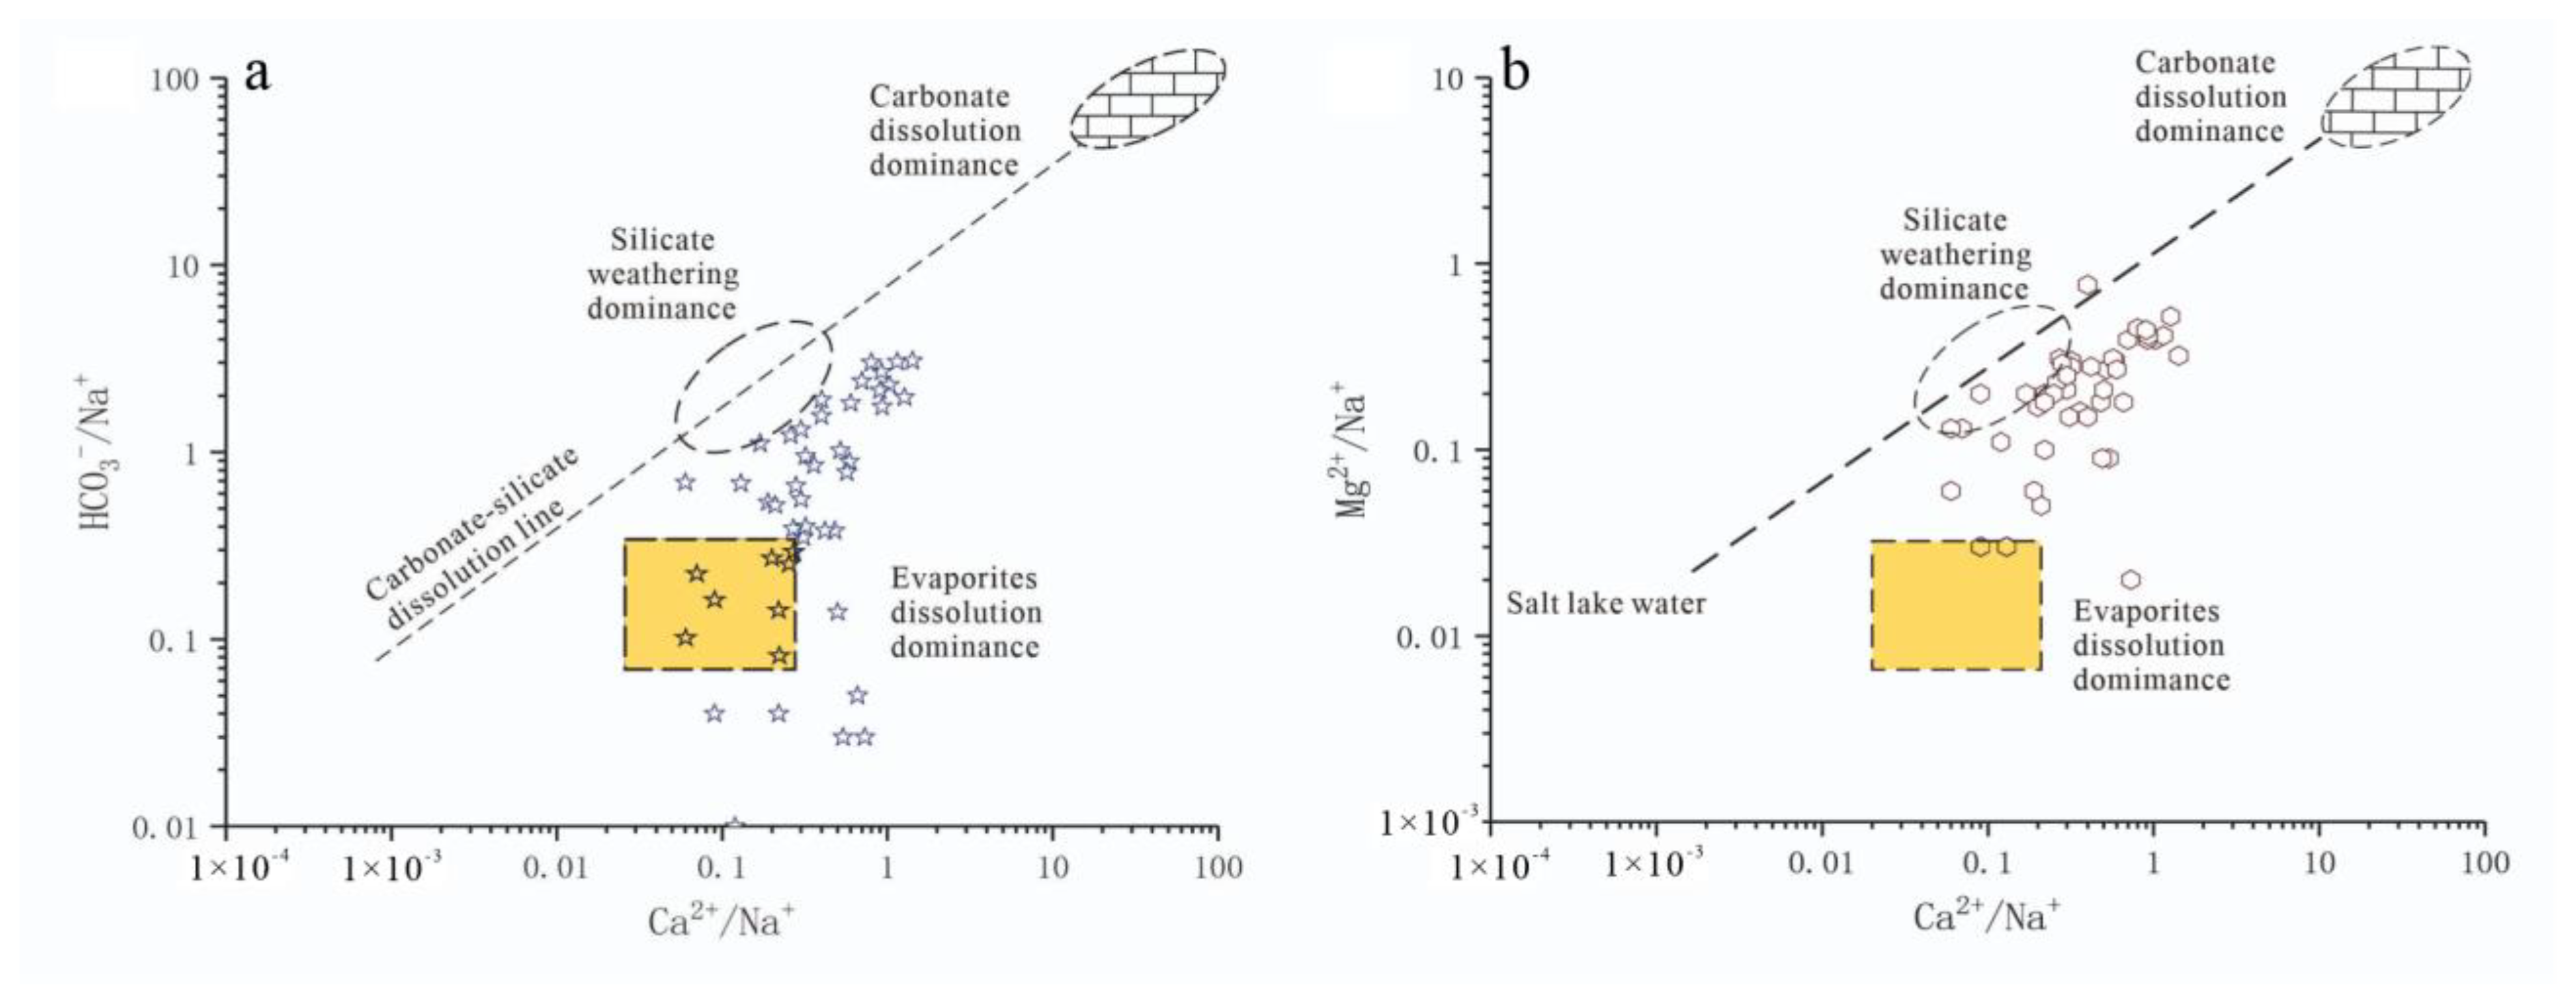
Generally, groundwater inherits ions from soil or sediment during rock–water interaction. In order to give a specific view of mineral weathering in groundwater, a bivariate diagram is used. The normalized molar ratio of sodium (Ca/Na, HCO3/Na and Mg/Na ratios) have been calculated to check the main controlling lithology. Generally, all samples fall near the carbonate-silicate weathering line and silicate dominant zone, which indicates that silicate dissolution plays a leading role in groundwater chemistry and may even involve the silicate and carbonate dissolution process.
Weathering was one of the hydrochemical processes controlling the groundwater quality of the research area. A weathering control map for different rock types of the research area (Figure 11a,b) was drawn using the quantitative substance relationships between Mg2+/Na+ and Ca2+/Na+, as well as between HCO3−/Na+ and Ca2+/Na+. The ions in the research area were mainly induced by weathering of carbonate rocks and some evaporites. The results conform to the distribution characteristics of the substantial calc-alkalic magmatic rocks in Xinjiang’s southern section of the Tianshan Mountains [36,37].
Figure 11a shows that the HCO3−/Na+ ratios of 32 samples from the research area were less than 1, and all samples were below the carbonate rock-silicate rock dissolution line. According to Figure 11b, the Mg2+/Na+ ratios of 46 samples were distributed below the carbonate rock-silicate rock dissolution line and in the bottom left of the figure. These 46 samples accounted for 97.8% of the total samples. This finding implied that the ions in the research area were induced by weathering of silicate rocks and some evaporites. This was because brown soil, desert soil, and solonchak containing chloride and sulfate existed in the research area’s mountain foot and piedmont plain [38]. The evaporites mainly consisted of gypsum and water-soluble salts. There existed a widespread sedimentary stratum of terrigenous clasts consisting of Paleozoic carbonate, dolomite, and marble in the bases of Cenozoic metamorphic rocks in the drainage basin of the headstream of the Weigan River, an important tributary of the Tarim River. Some fluoride-containing minerals, such as mica, amphibole, tourmaline, apatite, fluoride, and rock crystals, were widely distributed in the drainage basin [37,39].
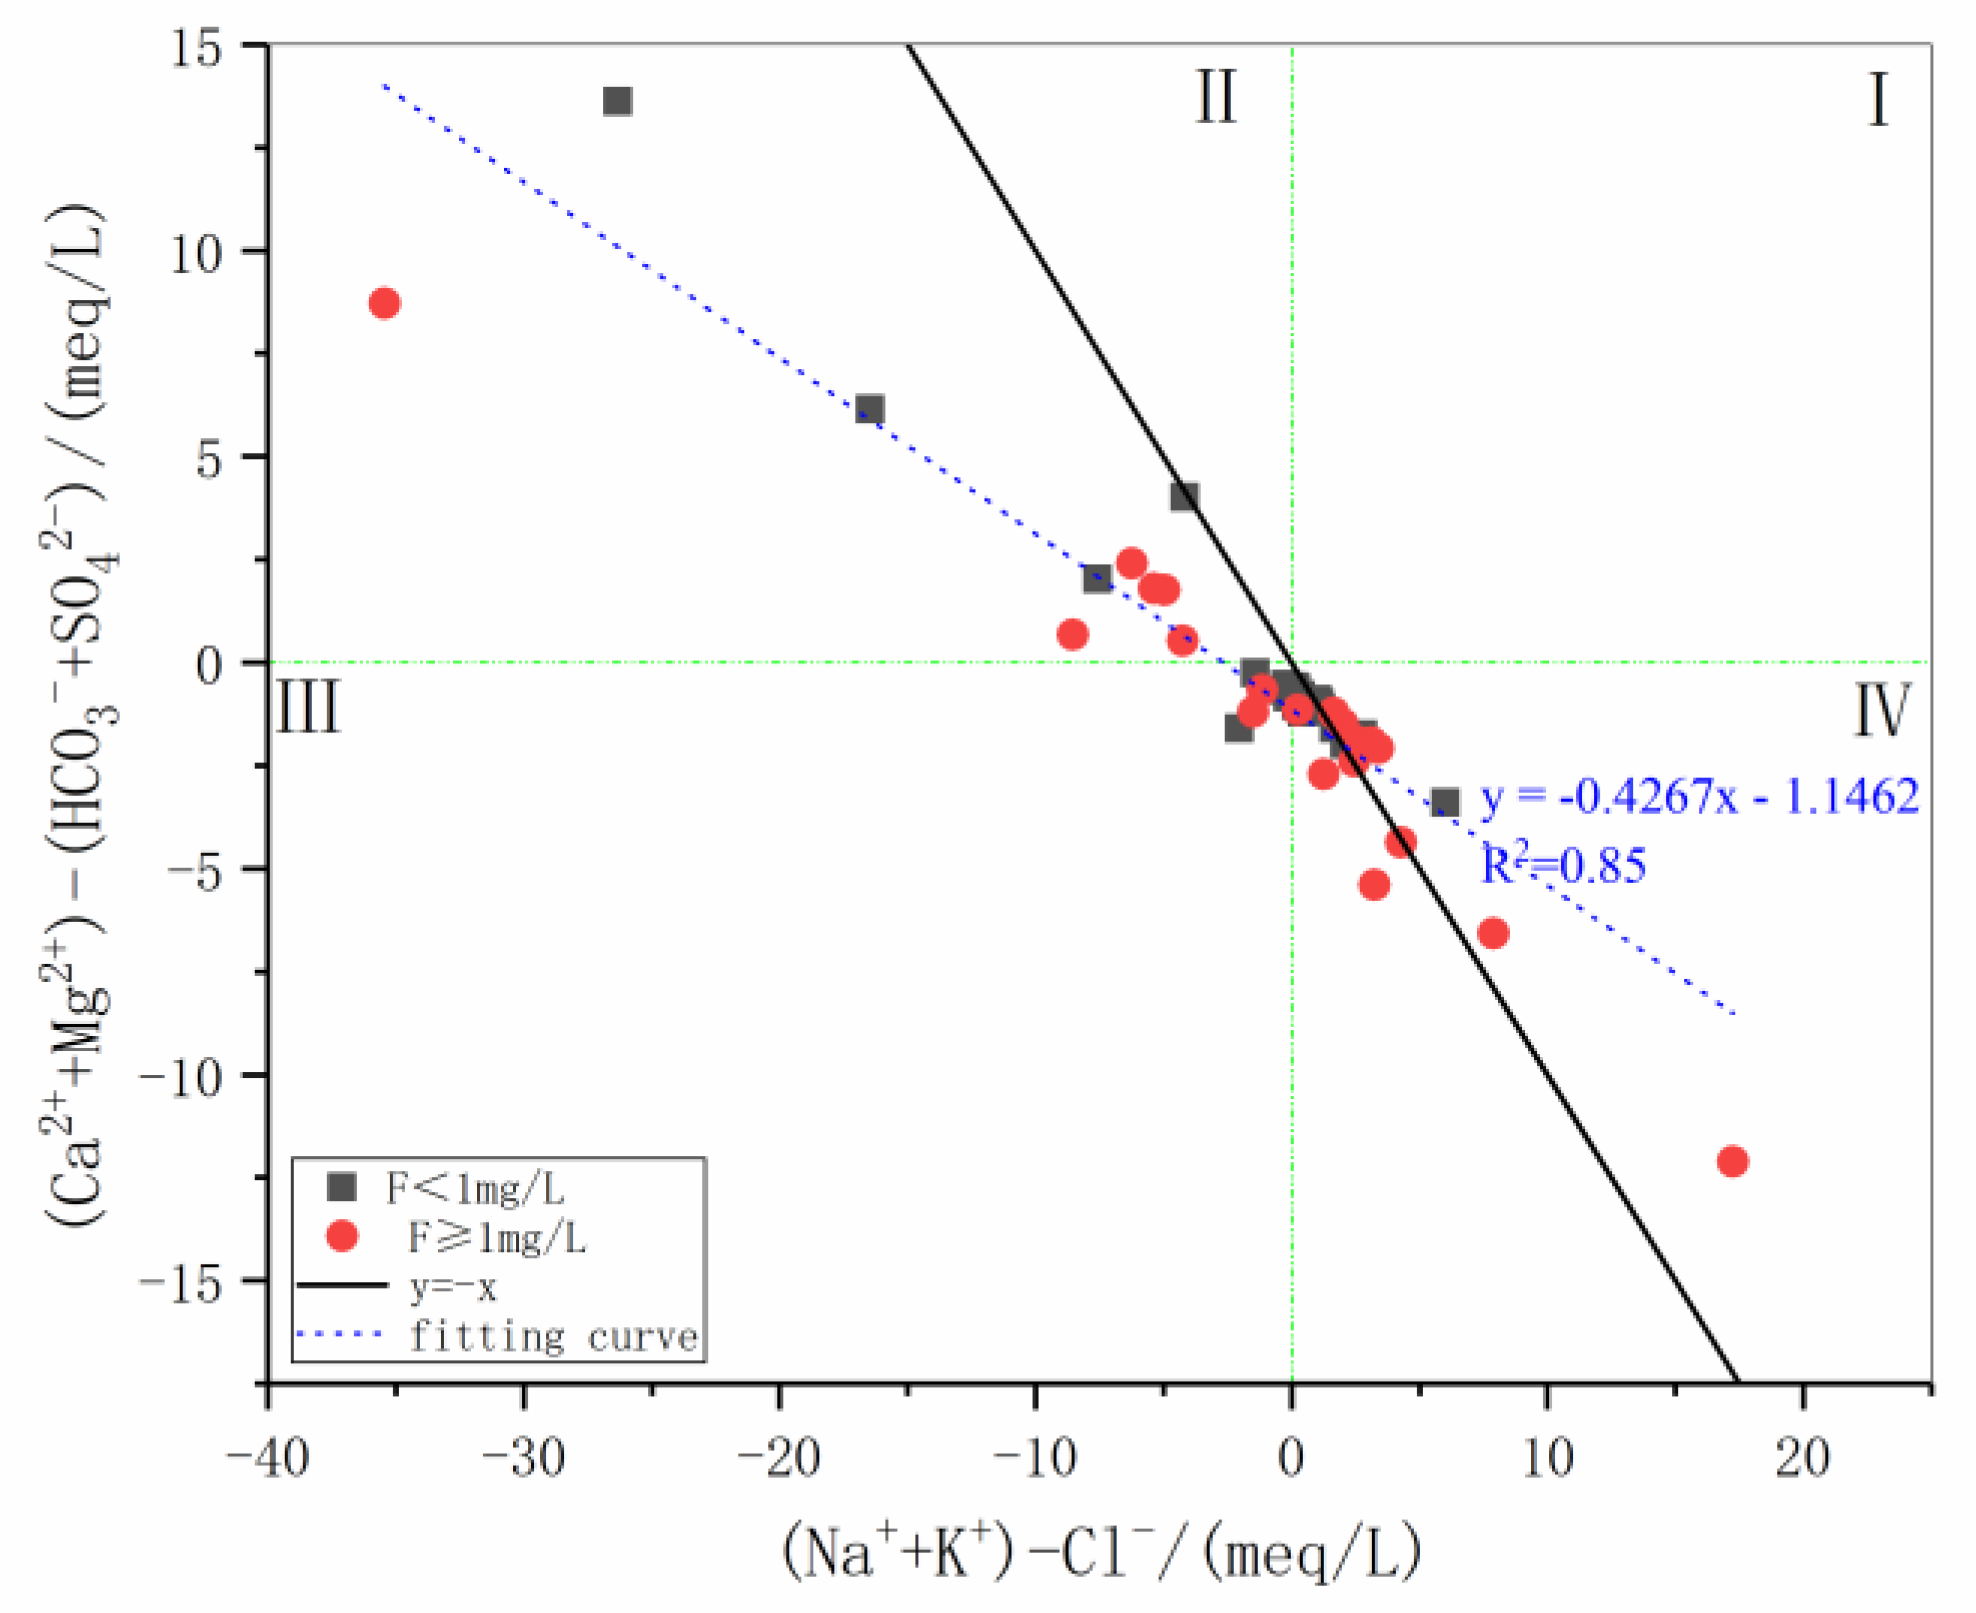
In addition, the ion exchange of the research area was qualitatively evaluated via the diagram [39,40,41] of the substance amount relationship between (Ca2+ + Mg2+)–(HCO3− + SO42−) and (Na+ + K+)–Cl− (Figure 12). If all the cation exchange reactions were carried out in the water, the slope between (Ca2+ + Mg2+)–(HCO3− + SO42−) and (Na+ + K+)–Cl− should be −1 (i.e., y = −x) [42]. The slope of the fitted curve between (Ca2+ + Mg2+)–(HCO3− + SO42−) and (Na+ + K+)–Cl− of the samples of the research area was −0.43 (R2 = 0.85) (Figure 12). Meanwhile, it is worth noting that 33 samples (accounting for 70% of all samples) of the research area were in the fourth quadrant, indicating that numerous ions (Na+ + K+) gathered around (Ca2+ + Mg2+) ions in the research area. This confirmed the weathering of many silicate rocks containing abundant albite and orthoclase, as well as the weathering of anorthite and akermanite. It also confirmed that the cation exchange in the groundwater of the research area was one of the essential hydrochemical processes of water quality evolution, and the process was an intense reaction.
Some chemical reactions, such as the carbonation of primary silicates as a natural weathering process and the decomposition of atmospheric CO2 in water, can produce HCO3− in natural water. The relevant ion formation mechanism can be further confirmed using the ratio of HCO3−/(HCO3− + SO42−) [41,43].
The average value of the HCO3−/(HCO3− + SO42−) ratios of the samples under study was 0.41, and the average amount of SO42− was three times as high as that of HCO3−, indicating that the weathering of rocks in the research area was jointly affected by carbonation and sulfide oxidation (Formula 4). Moreover, it also proved that the main hydrochemical type of the research area was Cl−/SO42−–Na+ instead of HCO3−–Na+, although it was widely believed that the main hydrochemical type of the research area was HCO3−–Na+.
3.6. Analyses of the Main Constituents
Figure 10 and Figure 11 show that the ions in the groundwater of the research area were mainly induced by the weathering of silicate rocks. To further analyze the main source of the ions in the research area, the main constituent factors of the hydrochemical constituents were analyzed. The Kaiser–Meyer–Olkin (KMO) test and Bartlett’s test of sphericity were carried out until the results were accepted. Then, a factor loading matrix (Table 2) was obtained by applying varimax rotation.
Table 2 shows that the EOF1 loading was mainly distributed in CODMn, TDS, Ca2+, K+, Mg2+, Na+, SO42−, and Cl−. The hydrolysis of evaporites occurred in the research area because silicate rock weathering erosion was the primary hydrochemical erosion. Therefore, EOF1, with a variance contribution rate of 37.46%, should be used to indicate weathering erosion of silicate rocks such as mica and feldspar and include sulfide oxidation (Formula 4) and hydrolytic erosion (Formula 5). The variance contribution rate of EOF2 was 18.91%, and the loading was mainly distributed in pH, EH, Ca2+, and NO2−. It should indicate dissolved erosion of evaporite rocks represented by gypsum salt. Because there was little CaSO4 in the evaporites of the river system of the Tianshan Mountains, the weathering of potassium or magnesium-containing halite was the main form of weathering [35,38]. A relatively significant loading of EOF3 with a variance contribution rate of 17.17% was in K+, NO3−, and Se. This was mainly because the upstream of the research area was a mountainous area with a low population density and limited human activity. There was hardly any supply related to agricultural irrigation, such as inorganic chemical fertilizer, soil organic nitrogen, and domestic sewage. Therefore, they might have come from the nitrogen oxide sedimentation of aerosols. The relatively significant loading of EOF4 with a variance contribution rate of 10.72% was in F−, HCO3−, and CO32−. Therefore, EOF4 should be used to indicate erosion of silicate rocks and evaporites caused by the H+ generated through carbonation.
4. Conclusions
(1) For the water area of the research area, the fluorine concentration ρ(F−) was between 0.2 and 5.46 mg/L, the average value was 1.14 mg/L, and the average pH value was 8.37. The environment of the water area was slightly basic, Na+–Cl−/SO42− was the main hydrochemical type, while other types, such as (Ca2+ + Mg2+)–Cl−/SO42− and Ca2+–HCO3−, also existed.
(2) The main reason why the groundwater contained so much fluoride was that the groundwater continued to dissolve fluorine-containing minerals (CaF2) in the research area. The mechanism causing the continued fluorite dissolution in the research area was the decreased Ca2+ concentration in the groundwater. On the one hand, carbonate rock sedimentation caused the Ca2+ concentration to decline. However, intense cation exchange was carried out in the research area’s groundwater, and a significant interaction existed between Ca2+ in the groundwater and Na+ in the surrounding rocks, causing Ca2+-containing minerals to deposit.
(3) Significant weathering of carbonate rocks and some evaporites was observed in the research area. The fluoride mainly came from hydrolysates of weathered silicate and evaporites. The main factors controlling fluorine enrichment in the river basin were evaporation-crystallization and cation exchange between water and rocks in the river basin.
These findings indicate that physicochemical processes play crucial roles in driving F− enrichment and that may be useful for studying F− occurrence in groundwater in arid and semi-arid areas.
Author Contributions
Investigation, F.S., T.L. (Tianchao Liu) and T.L. (Tong Li); writing—original draft, F.S. and T.L. (Tianchao Liu); methodology, Z.Z. and F.S.; supervision, Z.Z. and F.S.; resources, Z.Z. and F.S.; project administration, Z.Z. and F.S.; writing—review and editing, Z.Z. and F.S.; field support, T.L. (Tong Li). All authors have read and agreed to the published version of the manuscript.
Funding
This research was funded by an ecological environment survey of mining development in the middle section of the Tianshan Mountains (2022xjkk1001)—Investigation on Ecological and Environmental Effects of National Major Energy Projects on the North Slope of Tianshan Mountains.
Data Availability Statement
The data used to support the findings of this study are included within the manuscript.
Acknowledgments
We appreciate the anonymous reviewers for their constructive comments.
Conflicts of Interest
The authors declare that there are no conflict of interest.
Appendix A

Table A1.
Sample test results.
| Sample ID | pH | EH | CaCO3 | CODMn | TDS | Ca2+ | K+ | Mg2+ | Na+ | SO42− | Cl− | HCO3− | F− | NO3− + NO2− |
|---|---|---|---|---|---|---|---|---|---|---|---|---|---|---|
| H1 | 7.95 | 123 | 2001.6 | 3.20 | 7543.0 | 327.79 | 65.23 | 276.23 | 1623.48 | 2354.00 | 1952.59 | 445.45 | 1.16 | 93.23 |
| H2 | 8.25 | 128 | 224.4 | 1.40 | 424.0 | 56.52 | 6.11 | 21.57 | 54.82 | 138.16 | 63.14 | 125.09 | 0.60 | 1.25 |
| H3 | 7.94 | 132 | 651.3 | 1.56 | 1802.0 | 163.23 | 7.79 | 60.70 | 342.24 | 234.34 | 804.01 | 131.19 | 0.44 | 5.09 |
| H4 | 8.03 | 124 | 805.6 | 1.04 | 1500.0 | 79.02 | 11.34 | 150.87 | 195.78 | 468.25 | 268.00 | 372.22 | 1.67 | 2.49 |
| H5 | 8.67 | 118 | 154.0 | 0.64 | 460.0 | 34.83 | 2.79 | 15.97 | 97.32 | 134.38 | 94.30 | 82.38 | 1.03 | 0.03 |
| H6 | 7.67 | 128 | 4974.0 | 5.40 | 19,653.0 | 408.57 | 23.99 | 943.57 | 4683.93 | 3630.00 | 8509.42 | 183.06 | 2.42 | 2.37 |
| H7 | 8.46 | 98 | 344.2 | 0.64 | 972.0 | 61.76 | 5.95 | 43.91 | 206.51 | 341.44 | 203.48 | 115.94 | 0.99 | 0.03 |
| H8 | 8.03 | 143 | 844.3 | 2.24 | 2968.0 | 133.99 | 12.83 | 125.12 | 622.66 | 861.96 | 957.86 | 48.82 | 0.68 | 1.08 |
| H9 | 8.42 | 110 | 200.2 | 0.52 | 568.0 | 31.54 | 6.24 | 27.77 | 119.07 | 164.12 | 99.26 | 146.45 | 0.74 | 0.05 |
| H10 | 8.15 | 137 | 492.5 | 0.76 | 1642.0 | 85.43 | 2.99 | 69.51 | 348.34 | 373.30 | 590.60 | 85.43 | 0.80 | 0.12 |
| H11 | 8.21 | 113 | 277.6 | 0.56 | 925.0 | 61.80 | 2.05 | 29.27 | 199.26 | 263.21 | 270.52 | 70.17 | 0.71 | 0.06 |
| H12 | 8.10 | 116 | 170.2 | 0.64 | 364.0 | 37.30 | 6.18 | 20.80 | 53.55 | 85.03 | 63.14 | 128.14 | 0.77 | 0.73 |
| H13 | 7.88 | 129 | 3860.1 | 6.32 | 18,567.0 | 585.46 | 41.41 | 575.04 | 5086.34 | 2320.56 | 8822.80 | 48.82 | 0.91 | 0.66 |
| H14 | 8.15 | 111 | 400.3 | 0.36 | 956.0 | 61.31 | 7.10 | 56.88 | 189.13 | 201.87 | 289.46 | 180.01 | 1.31 | 0.35 |
| H15 | 8.10 | 108 | 193.2 | 0.44 | 352.0 | 42.59 | 4.73 | 18.13 | 46.54 | 77.73 | 69.48 | 125.09 | 0.66 | 3.42 |
| H16 | 8.30 | 111 | 715.6 | 0.56 | 1924.0 | 116.93 | 13.51 | 101.12 | 362.80 | 404.79 | 723.18 | 146.45 | 1.16 | 0.03 |
| H17 | 8.06 | 109 | 164.1 | 1.16 | 302.0 | 33.12 | 4.83 | 18.76 | 41.61 | 54.80 | 54.59 | 125.09 | 0.80 | 0.72 |
| H18 | 7.96 | 115 | 217.2 | 1.28 | 1634.0 | 29.78 | 6.78 | 32.23 | 502.68 | 288.65 | 501.40 | 344.76 | 4.28 | 0.37 |
| H19 | 8.26 | 116 | 870.7 | 1.88 | 4124.0 | 86.39 | 13.92 | 155.93 | 1188.64 | 609.99 | 1735.63 | 259.34 | 1.37 | 0.48 |
| H20 | 8.15 | 105 | 544.4 | 1.60 | 1745.0 | 69.45 | 9.78 | 85.51 | 419.13 | 298.00 | 539.97 | 463.75 | 2.62 | 0.74 |
| H21 | 8.33 | 127 | 154.0 | 1.48 | 1426.0 | 40.13 | 2.70 | 13.27 | 440.13 | 221.11 | 593.01 | 70.17 | 1.21 | 0.11 |
| H22 | 8.15 | 120 | 214.2 | 0.64 | 472.0 | 45.17 | 3.54 | 23.37 | 86.97 | 119.75 | 134.00 | 88.48 | 0.60 | 0.14 |
| H23 | 8.57 | 112 | 51.3 | 0.80 | 416.0 | 15.83 | 0.78 | 3.65 | 121.52 | 76.71 | 129.19 | 82.38 | 0.87 | 0.03 |
| H24 | 8.38 | 122 | 77.1 | 0.60 | 404.0 | 19.95 | 1.20 | 5.98 | 107.58 | 87.86 | 126.27 | 57.97 | 0.58 | 0.03 |
| H25 | 8.10 | 119 | 243.2 | 0.56 | 556.0 | 52.18 | 3.64 | 26.55 | 88.93 | 158.31 | 148.89 | 79.33 | 0.44 | 0.03 |
| H26 | 9.91 | 70 | 1976.6 | 2.64 | 5412.0 | 616.14 | 14.25 | 104.19 | 1145.05 | 1452.00 | 1928.48 | 36.61 | 0.95 | 8.75 |
| H27 | 10.77 | 45 | 2110.7 | 3.52 | 6023.0 | 835.47 | 23.50 | 24.20 | 1137.85 | 1463.44 | 2362.39 | 30.51 | 0.49 | 10.08 |
| H28 | 8.35 | 116 | 1786.4 | 1.52 | 4468.0 | 484.06 | 11.12 | 134.82 | 735.33 | 1479.28 | 1321.01 | 33.56 | 1.61 | 6.01 |
| H29 | 8.34 | 102 | 1796.4 | 2.00 | 4726.0 | 243.39 | 22.42 | 274.59 | 892.69 | 1699.28 | 1245.71 | 256.28 | 1.31 | 25.87 |
| H30 | 8.46 | 92 | 1020.8 | 1.52 | 2768.0 | 140.91 | 12.62 | 161.73 | 527.96 | 811.36 | 898.30 | 207.47 | 0.68 | 3.94 |
| H31 | 8.68 | 118 | 144.5 | 0.56 | 384.0 | 32.83 | 2.30 | 12.49 | 82.18 | 117.22 | 54.59 | 128.14 | 0.51 | 3.44 |
| H32 | 8.42 | 121 | 252.2 | 0.48 | 562.0 | 50.70 | 2.53 | 27.61 | 89.60 | 207.24 | 104.22 | 70.17 | 0.80 | 0.18 |
| H33 | 8.13 | 122 | 775.6 | 0.80 | 1964.0 | 141.83 | 5.35 | 97.00 | 341.10 | 693.97 | 431.78 | 128.14 | 0.87 | 47.29 |
| H34 | 8.11 | 114 | 1045.8 | 1.28 | 3516.0 | 174.85 | 9.32 | 143.42 | 792.31 | 1146.64 | 1017.42 | 109.84 | 0.36 | 8.89 |
| H35 | 8.34 | 111 | 174.9 | 0.44 | 296.0 | 42.62 | 3.09 | 15.10 | 37.12 | 54.97 | 54.59 | 112.89 | 0.23 | 4.68 |
| H36 | 8.30 | 113 | 200.6 | 0.52 | 342.0 | 55.11 | 3.21 | 12.26 | 38.70 | 75.13 | 67.99 | 118.99 | 0.23 | 7.07 |
| H37 | 8.35 | 110 | 311.8 | 0.76 | 510.0 | 71.40 | 4.30 | 29.45 | 56.12 | 175.65 | 84.37 | 109.84 | 0.28 | 6.58 |
| H38 | 8.32 | 121 | 182.5 | 0.56 | 402.0 | 41.24 | 4.38 | 18.74 | 68.39 | 81.11 | 99.26 | 125.09 | 0.22 | 2.91 |
| H39 | 8.10 | 123 | 382.2 | 0.52 | 684.0 | 85.66 | 6.08 | 37.69 | 92.34 | 167.46 | 173.71 | 161.70 | 0.36 | 11.60 |
| H40 | 7.89 | 135 | 912.7 | 1.00 | 2262.0 | 214.91 | 3.68 | 87.81 | 427.24 | 544.37 | 883.41 | 57.97 | 1.48 | 1.67 |
| H41 | 9.42 | 101 | 1070.9 | 3.00 | 4326.0 | 236.37 | 12.86 | 110.73 | 1060.88 | 1053.36 | 1702.31 | 45.76 | 1.16 | 2.07 |
| H42 | 10.06 | 80 | 1886.5 | 2.40 | 5724.0 | 562.33 | 14.49 | 100.71 | 1141.39 | 1571.68 | 1965.35 | 5.10 | 1.21 | 9.55 |
| H43 | 8.39 | 101 | 120.1 | 0.80 | 562.0 | 33.45 | 1.99 | 8.04 | 157.34 | 126.10 | 173.71 | 82.38 | 2.73 | 0.47 |
| H44 | 8.11 | 111 | 1115.9 | 3.28 | 5768.0 | 101.38 | 10.76 | 206.19 | 1640.05 | 734.36 | 2844.51 | 170.86 | 5.46 | 1.05 |
| H45 | 8.17 | 99 | 373.3 | 0.56 | 914.0 | 52.05 | 6.25 | 55.73 | 188.93 | 246.75 | 258.08 | 125.09 | 0.58 | 0.15 |
| H46 | 8.20 | 105 | 171.1 | 1.92 | 344.0 | 39.68 | 6.21 | 19.48 | 44.24 | 100.67 | 61.19 | 94.58 | 0.60 | 0.04 |
| H47 | 8.14 | 119 | 304.2 | 1.00 | 772.0 | 48.76 | 8.47 | 41.62 | 163.64 | 173.18 | 173.71 | 216.62 | 2.62 | 1.94 |
Note: the pH is dimensionless, the unit of Eh is mV, and the unit of all the other indexes is mg/L.
References
- Kut, K.; Sarswat, A.; Srivastava, A.; Pittman, C.U.; Mohan, D. A review of fluoride in african groundwater and local reme-diation methods. Groundw. Sustain. Dev. 2016, 2, 190–212. [Google Scholar] [CrossRef]
- Demelash, H.; Beyene, A.; Abebe, Z.; Melese, A. Fluoride concentration in ground water and prevalence of dental fluorosis in Ethiopian Rift Valley: Systematic review and meta-analysis. BMC Public Health 2019, 19, 163. [Google Scholar] [CrossRef] [Green Version]
- Battaleb-Looie, S.; Moore, F.; Jacks, G.; Ketabdari, M.R. Geological sources of fluoride and acceptable intake of fluoride in an endemic fluorosis area, southern Iran. Environ. Geochem. Health 2012, 34, 641–650. [Google Scholar] [CrossRef]
- Karthikeyan, K.; Nanthakumar, K.; Velmurugan, P.; Tamilarasi, S.; Lakshmanaperumalsamy, P. Prevalence of certain inorganic constituents in groundwater samples of Erode district, Tamilnadu, India, with special emphasis on fluoride, fluorosis and its remedial measures. Environ. Monit. Assess. 2008, 160, 141–155. [Google Scholar] [CrossRef] [PubMed]
- Yadav, K.K.; Kumar, S.; Pham, Q.B.; Gupta, N.; Rezania, S.; Kamyab, H.; Yadav, S.; Vymazal, J.; Kumar, V.; Tri, D.Q.; et al. Fluoride contamination, health problems and remediation methods in Asian groundwater: A comprehensive review. Ecotoxicol. Environ. Saf. 2019, 182, 109362. [Google Scholar] [CrossRef]
- Adimalla, N.; Qian, H.; Nandan, M. Groundwater chemistry integrating the pollution index of groundwater and evaluation of potential human health risk: A case study from hard rock terrain of south India. Ecotoxicol. Environ. Saf. 2020, 206, 111217. [Google Scholar] [CrossRef]
- Brindha, K.; Rajesh, R.; Murugan, R.; Elango, L. Fluoride contamination in groundwater in parts of Nalgonda District, Andhra Pradesh, India. Environ. Monit. Assess. 2010, 172, 481–492. [Google Scholar] [CrossRef] [PubMed]
- Elumalai, V.; Nwabisa, D.P.; Rajmohan, N. Evaluation of high fluoride contaminated fractured rock aquifer in South Africa—Geochemical and chemometric approaches. Chemosphere 2019, 235, 1–11. [Google Scholar] [CrossRef] [PubMed]
- Carrillo-Rivera, J.; Cardona, A.; Edmunds, W. Use of abstraction regime and knowledge of hydrogeological conditions to control high-fluoride concentration in abstracted groundwater: San Luis Potosí basin, Mexico. J. Hydrol. 2002, 261, 24–47. [Google Scholar] [CrossRef]
- Li, D.; Gao, X.; Wang, Y.; Luo, W. Diverse mechanisms drive fluoride enrichment in groundwater in two neighboring sites in northern China. Environ. Pollut. 2018, 237, 430–441. [Google Scholar] [CrossRef]
- Li, C.; Gao, X.; Liu, Y.; Wang, Y. Impact of anthropogenic activities on the enrichment of fluoride and salinity in groundwater in the Yuncheng Basin constrained by Cl/Br ratio, δ18O, δ2H, δ13C and δ7Li isotopes. J. Hydrol. 2019, 579, 124211. [Google Scholar] [CrossRef]
- Zhang, Q.; Xu, P.; Qian, H.; Yang, F. Hydrogeochemistry and fluoride contamination in Jiaokou Irrigation District, Central China: Assessment based on multivariate statistical approach and human health risk. Sci. Total. Environ. 2020, 741, 140460. [Google Scholar] [CrossRef] [PubMed]
- Guo, H.; Zhang, Y.; Xing, L.; Jia, Y. Spatial variation in arsenic and fluoride concentrations of shallow groundwater from the town of Shahai in the Hetao basin, Inner Mongolia. Appl. Geochem. 2012, 27, 2187–2196. [Google Scholar] [CrossRef]
- Wang, Y.; Shvartsev, S.L.; Su, C. Genesis of arsenic/fluoride-enriched soda water: A case study at Datong, northern China. Appl. Geochem. 2009, 24, 641–649. [Google Scholar] [CrossRef]
- Tang, Q.; Xu, Q.; Zhang, F.; Huang, Y.; Liu, J.; Wang, X.; Yang, Y.; Liu, X. Geochemistry of iodine-rich groundwater in the Taiyuan Basin of central Shanxi Province, North China. J. Geochem. Explor. 2013, 135, 117–123. [Google Scholar] [CrossRef]
- Dai, S.; Li, W.; Tang, Y.; Zhang, Y.; Feng, P. The sources, pathway, and preventive measures for fluorosis in Zhijin County, Guizhou, China. Appl. Geochem. 2007, 22, 1017–1024. [Google Scholar] [CrossRef]
- Su, H.; Kang, W.; Kang, N.; Liu, J.; Li, Z. Hydrogeochemistry and health hazards of fluoride-enriched groundwater in the Tarim Basin, China. Environ. Res. 2021, 200, 111476. [Google Scholar] [CrossRef]
- Wang, G.Q.; Xiao, B.Y.; Huang, Y.Z.; Yao, H.; Hu, Y.; Qian, R.C.; Zhang, C.; Liu, K.T.; Gu, Y.L. Epidemiological studies on endemic fluorosis and arsenism in xinjiang. Chin. J. Prev. Med. 1995, 1, 30–33. [Google Scholar]
- Ma, P.J.; Wang, T.T.; Xia, R.X.; Lin, Q. Review and Prospect of endemic disease control in Xinjiang. Dis. Prev. Control. Bull. 2020, 35, 86–89. [Google Scholar] [CrossRef]
- Meng, L.; Ding, J.; Wang, J.; Ge, X. Spatial distribution of soil salinity in Ugan-Kuqa River delta oasis based on environmental variables. Trans. Chin. Soc. Agric. Eng. (Trans. CSAE) 2019, 36, 175–181. [Google Scholar]
- Liu, C.; Cao, Y.; Yang, H.; Jiao, P.; Gu, Q. Discussion on Paleogene-Neogene Environmental Change of Salt Lakes in Kuqa Foreland Basin and Its Potash-forming Effect. Acta Geosci. Sin. 2013, 34, 12. [Google Scholar] [CrossRef]
- Hu, S.; Song, Y.; Tian, C.; Li, Y.; Li, X.; Chen, X. Suitable scale of Weigan River plain oasis. Sci. China Ser. D Earth Sci. 2007, 50, 56–64. [Google Scholar] [CrossRef]
- Pan, H.Y.; Zhou, C.J.; Bi, J.B.; Liu, Y.D.; Huang, L.W. Hydrochemical characteristics and fluoride enrichment mechanisms of high-fluoride grounderwater in a typical piedmont proluvial fan in aksu area, xinjiang, China. Bull. Geol. Sci. Technol. 2021, 40, 194–203. [Google Scholar] [CrossRef]
- Li, Q.; Jia, R.L.; Zhou, J.L.; Wang, Y.P. Analysis of chemical characteristics of high-fluoride groundwater in Aksu prefecture, Xinjiang. J. Arid. Land Resour. Environ. 2013, 27, 87–92. [Google Scholar] [CrossRef]
- Zhang, J.; Zhou, J.L.; Nai, W.H.; Zeng, Y.Y.; Chen, Y.F. Characteristics of high fluoride groundwater in plain of Yarkant river basin in Xinjiang. J. Arid. Land Resour. Environ. 2020, 34, 100–106. [Google Scholar] [CrossRef]
- Li, L.; Zeng, Y.Y.; Luan, F.J.; Zhou, J.L.; Tan, P.F.; Wang, X.C.; Li, J.Z.; Feng, J.H. The Enrichment Factors of High Fluoride Ground-water in the Kashgar River Basin, Xinjiang. Ground Water 2020, 42, 1–3. [Google Scholar] [CrossRef]
- Li, L.; Zhou, J.L.; Qi, W.Q.; Chen, F.; Zeng, Y.Y.; Chen, Y.F. Distribution and formation process of fluorine in groundwater in oasis area of Hotan river basin. J. Arid. Land Resour. Environ. 2019, 33, 112–118. [Google Scholar] [CrossRef]
- He, J.; An, Y.; Zhang, F. Geochemical characteristics and fluoride distribution in the groundwater of the Zhangye Basin in Northwestern China. J. Geochem. Explor. 2013, 135, 22–30. [Google Scholar] [CrossRef]
- Guo, H.; Wang, Y. Geochemical characteristics of shallow groundwater in Datong basin, northwestern China. J. Geochem. Explor. 2005, 87, 109–120. [Google Scholar] [CrossRef]
- Su, C.; Wang, Y.; Xie, X.; Li, J. Aqueous geochemistry of high-fluoride groundwater in Datong Basin, Northern China. J. Geochem. Explor. 2013, 135, 79–92. [Google Scholar] [CrossRef]
- Olaka, L.A.; Wilke, F.D.; Olago, D.O.; Odada, E.O.; Mulch, A.; Musolff, A. Groundwater fluoride enrichment in an active rift setting: Central Kenya Rift case study. Sci. Total. Environ. 2016, 545–546, 641–653. [Google Scholar] [CrossRef]
- Vasanthavigar, M.; Srinivasamoorthy, K.; Prasanna, M.V. Evaluation of groundwater suitability for domestic, irrigational, and industrial purposes: A case study from Thirumanimuttar river basin, Tamilnadu, India. Environ. Monit. Assess. 2011, 184, 405–420. [Google Scholar] [CrossRef]
- Mao, R.Y.; Guo, H.M.; Jia, Y.F.; Jiang, X.Y.; Cao, Y.S.; Zhao, W.G.; Wang, Z. Distribution characteristics and genesis of fluoride grounderwater in the Hetao basin, Inner Mongolia. Earth Sci. Front. 2016, 23, 9. [Google Scholar] [CrossRef]
- Zhang, S.; Hu, L.; Qiao, D.; Feng, D.; Wang, H. Vacuum tribological performance of phosphonium-based ionic liquids as lubricants and lubricant additives of multialkylatedcyclopentanes. Tribol. Int. 2013, 66, 289–295. [Google Scholar] [CrossRef]
- Ye, C.Y.; Zheng, J.P. Study on existence forms of chemical compositions and saturation indexes of waters from Gasikule Salt Lake, Qinghai Province. Sci. Technol. Rev. 2016, 34, 11. [Google Scholar]
- Fu, W. Analyses of chemical components in water for endemic fluorosis region in basin of Aksu river. J. Shaanxi No Rmal Univ. (Nat. Sci. Ed.) 2002, 4, 96–101. [Google Scholar]
- Mountaineering Scientific Expedition Team of the Chinese Academy of Sciences. In Textbook of Geology and Paleontology of the Tomur Peak Area in Tianshan; Xinjiang People’s Publishing House: Urumqi, Xinjiang, China, 1985; pp. 45–50.
- Zeng, J.H. Types of saline soil and some characteristics of salt accumulation in arid areas of China. Chin. J. Soil Sci. 1963, 1, 35–42. [Google Scholar] [CrossRef]
- Jia, C.S. Textbook of Studies om origins and migration direction of petroleum in shaya uplift of tarim basin; China University of mining and Technology (Beijing): Beijing, China, 2012; pp. 41–44. [Google Scholar]
- Yang, S.Y. Late Hydrocarbon Generation in Baichengsag of the Tarim Basin; China University of mining and Technology (Beijing): Beijing, China, 2020. [Google Scholar]
- Wang, J.; Han, H.D.; Xu, J.L.; Li, Y.S. Hydrochemical characteristics of the mountain runoff in Tarim River Basin, China. China Environ. Sci. 2021, 41, 1576–1587. [Google Scholar] [CrossRef]
- Dedzo, M.G.; Tsozué, D.; Mimba, M.E.; Teddy, F.; Nembungwe, R.M.; Linida, S. Importance of Rocks and Their Weathering Products on Groundwater Quality in Central-East Cameroon. Hydrology 2017, 4, 23. [Google Scholar] [CrossRef] [Green Version]
- Bisht, H.; Arya, P.C.; Kumar, K. Hydro-chemical analysis and ionic flux of meltwater runoff from Khangri Glacier, West Kameng, Arunachal Himalaya, India. Environ. Earth Sci. 2018, 77, 598. [Google Scholar] [CrossRef]
Figure 1.
Overall geological and water system information of the research area and the sampling site distribution map. (a) Equivalent location map of the research area in China, (b) hydrological distribution and sampling point distribution map.
Figure 1.
Overall geological and water system information of the research area and the sampling site distribution map. (a) Equivalent location map of the research area in China, (b) hydrological distribution and sampling point distribution map.

Figure 2.
Piper diagram of the groundwater.

Figure 3.
Relationship between the ρ[F−] and the pH value.

Figure 4.
Relationship between the F− mass concentration and the Ca2+ (a) and Mg2+ (b) mass concentrations in the groundwater samples.
Figure 4.
Relationship between the F− mass concentration and the Ca2+ (a) and Mg2+ (b) mass concentrations in the groundwater samples.

Figure 5.
Relationship between the ρ[F−] and the [F−]/[Cl−] ratio.

Figure 6.
Chloro-alkaline indices (CAI) used to describe cation exchange; ρ[F−] and CAI of groundwater samples (a); CAI1 and CAI2 of groundwater samples (b).
Figure 6.
Chloro-alkaline indices (CAI) used to describe cation exchange; ρ[F−] and CAI of groundwater samples (a); CAI1 and CAI2 of groundwater samples (b).

Figure 7.
Relationship between ρ[F−] and the SAR.

Figure 8.
Diagram of the relationship between calcite and fluorite (a) and the relationship between dolomite and halite (b) in the groundwater.
Figure 8.
Diagram of the relationship between calcite and fluorite (a) and the relationship between dolomite and halite (b) in the groundwater.

Figure 9.
Diagram of the relationship between ρ[F−] and the fluorite saturation index (fluorite SI).
Figure 9.
Diagram of the relationship between ρ[F−] and the fluorite saturation index (fluorite SI).

Figure 10.
Variation of the weight Na+/(Na+ + Ca2+) ratio (a) and Cl−/(Cl− + HCO3−) ratio (b) as a function of TDS value of groundwater samples in modified Gibbs scheme diagrams.
Figure 10.
Variation of the weight Na+/(Na+ + Ca2+) ratio (a) and Cl−/(Cl− + HCO3−) ratio (b) as a function of TDS value of groundwater samples in modified Gibbs scheme diagrams.

Figure 11.
Weathering control diagram of different types of rocks in the research area. Bivariate plots of Na+ normalized molar ratios Ca2+/Na+ against HCO3−/Na+ (a) and Mg2+/Na+ ratios (b) to examine the dominant mineral weathering in the area.
Figure 11.
Weathering control diagram of different types of rocks in the research area. Bivariate plots of Na+ normalized molar ratios Ca2+/Na+ against HCO3−/Na+ (a) and Mg2+/Na+ ratios (b) to examine the dominant mineral weathering in the area.

Figure 12.
Amount of substance between (Ca2+ + Mg2+)–(HCO3− + SO42−) and (Na+ + K+)–Cl−.

Table 1.
Statistical table of the hydrochemical parameters of the samples for different types of groundwater.
Table 1.
Statistical table of the hydrochemical parameters of the samples for different types of groundwater.
| ρ[F−] < 1.0 mg/L | ρ[F−] ≥ 1.0 mg/L | All Sets of Samples | ||||||||
|---|---|---|---|---|---|---|---|---|---|---|
| Min | Max | Ave | Min | Max | Ave | Min | Max | Ave | SE | |
| pH | 7.88 | 10.8 | 8.38 | 7.67 | 10.1 | 8.35 | 7.67 | 10.8 | 8.37 | 0.08 |
| Eh | 45 | 142 | 113 | 80 | 135 | 113 | 45 | 142 | 112 | 2.46 |
| TH | 51.3 | 3860 | 600 | 120 | 4974 | 1062 | 51.3 | 4974 | 786 | 0.52 |
| TDS | 296 | 18,567 | 1924 | 460 | 19,653 | 2827 | 296 | 19,653 | 2647 | 583 |
| Na+ + K+ | 72.8 | 1159 | 435 | 212 | 1650 | 862 | 72.8 | 1651 | 607 | 149 |
| Ca2+ | 15.83 | 835 | 134 | 29.8 | 562 | 171 | 15.8 | 835 | 149 | 27.1 |
| Mg2+ | 3.65 | 575 | 63.8 | 8.04 | 944 | 150 | 3.65 | 944 | 98.4 | 23.4 |
| F− | 0.22 | 0.95 | 0.6 | 1 | 5.46 | 1.94 | 0.22 | 5.46 | 1.14 | 0.15 |
| Cl− | 54.6 | 8822 | 712 | 94.3 | 8509 | 1354 | 54.6 | 8823 | 971 | 261 |
| HCO3− | 30.5 | 207.5 | 104 | 5.1 | 464 | 186 | 5.1 | 464 | 137 | 14.7 |
| CO32− | 0 | 12 | 6.22 | 0 | 96.0 | 21.2 | 0 | 96.03 | 12.3 | 2.51 |
| SO42− | 54.8 | 2321 | 422 | 126 | 3630 | 860 | 54.8 | 3630 | 599 | 110 |
Note: the pH is dimensionless, the unit of Eh is mV, and the unit of all the other indexes is mg/L.
Table 2.
Loading matrix for the hydrochemical constituent factor analysis of the research area.
| EOF1 | EOF2 | EOF3 | EOF4 | |
|---|---|---|---|---|
| pH | −0.05 | 0.95 | −0.04 | −0.07 |
| EH | 0.07 | −0.87 | 0.04 | −0.13 |
| CODMn | 0.92 | 0.2 | 0.09 | 0.15 |
| TDS | 0.98 | 0.08 | 0.11 | 0.09 |
| Ca2+ | 0.64 | 0.69 | 0.21 | −0.05 |
| K+ | 0.62 | 0.11 | 0.66 | 0.2 |
| Mg2+ | 0.93 | −0.18 | 0.11 | 0.14 |
| Na+ | 0.98 | 0.02 | 0.05 | 0.1 |
| SO42− | 0.87 | 0.22 | 0.35 | 0.11 |
| Cl− | 0.99 | 0.04 | −0.02 | 0.06 |
| CO32− | 0.05 | 0.33 | 0.38 | 0.63 |
| HCO3− | −0.06 | −0.36 | 0.4 | 0.72 |
| F− | 0.21 | −0.1 | −0.24 | 0.82 |
| NO3− | 0.08 | 0 | 0.96 | 0.1 |
| NO2− | 0.31 | 0.81 | 0.36 | 0.02 |
| Se | 0.16 | 0.13 | 0.93 | 0.06 |
| As | −0.17 | −0.14 | −0.08 | −0.3 |
| Variance contribution rate % | 37.46 | 18.91 | 17.17 | 10.72 |
| Accumulative contribution rate % | 37.46 | 56.38 | 73.55 | 84.26 |
Disclaimer/Publisher’s Note: The statements, opinions and data contained in all publications are solely those of the individual author(s) and contributor(s) and not of MDPI and/or the editor(s). MDPI and/or the editor(s) disclaim responsibility for any injury to people or property resulting from any ideas, methods, instructions or products referred to in the content. |
© 2023 by the authors. Licensee MDPI, Basel, Switzerland. This article is an open access article distributed under the terms and conditions of the Creative Commons Attribution (CC BY) license (https://creativecommons.org/licenses/by/4.0/).
Share and Cite
MDPI and ACS Style
Liu, T.; Shao, F.; Zhang, Z.; Li, T. Fluorine-Rich Shallow Groundwater in Weigan River Basin (Xinjiang): Enrichment Factors and Spatial Distribution. Water 2023, 15, 926. https://doi.org/10.3390/w15050926
AMA Style
Liu T, Shao F, Zhang Z, Li T. Fluorine-Rich Shallow Groundwater in Weigan River Basin (Xinjiang): Enrichment Factors and Spatial Distribution. Water. 2023; 15(5):926. https://doi.org/10.3390/w15050926
Chicago/Turabian StyleLiu, Tianchao, Fengjun Shao, Zizhao Zhang, and Tong Li. 2023. "Fluorine-Rich Shallow Groundwater in Weigan River Basin (Xinjiang): Enrichment Factors and Spatial Distribution" Water 15, no. 5: 926. https://doi.org/10.3390/w15050926
Note that from the first issue of 2016, this journal uses article numbers instead of page numbers. See further details here.