Article

Source Water Apportionment Using Stable Isotopes for Typical Riparian Plants along the Manas River in Xinjiang, Northwest China

1
College of Water Conservancy & Architectural Engineering, Shihezi University, Shihezi 832000, China
2
Key Laboratory of Cold and Arid Regions Eco-Hydraulic Engineering of Xinjiang Production & Construction Corps, Shihezi 832000, China
3
Key Laboratory of Cenozoic Geology and Environment, Institute of Geology and Geophysics, Chinese Academy of Sciences, Beijing 100029, China
4
College of Hydrology and Water Resources, Hohai University, Nanjing 211100, China
5
Institute of Geographic Sciences and Natural Resources Research, Beijing 100101, China
6
College of Resource and Environment, University of Chinese Academy of Sciences, Beijing 100049, China
7
College of Water Resources and Architectural Engineering, Northwest Agriculture and Forestry University, Yangling 712100, China
8
Department of Earth and Planetary Sciences, University of Texas at San Antonio, TX 78249, USA
*
Authors to whom correspondence should be addressed.
These authors contributed equally to this work.
Water 2023, 15(5), 927; https://doi.org/10.3390/w15050927
Submission received: 31 December 2022 / Revised: 17 February 2023 / Accepted: 24 February 2023 / Published: 27 February 2023
(This article belongs to the Section Hydrogeology)

Abstract

:
Clarifying the water uptake patterns and competition among riparian plants under different ecological water conveyance conditions is crucial for the stability of the riparian ecosystem in arid areas. Here, we have utilized the Bayesian isotope mixing model to quantify the plant water sources for two typical riparian plants (Tamarix ramosissima and Phragmites australis) along the Manas River in Xinjiang, Northwest China. The water competition relationship between these two typical riparian plants is evaluated using the proportional similarity index (PSI). Our findings demonstrated the following: (1) The climate in the study area is dry and strongly evaporative, and the slope and intercept of the local meteoric water line are smaller than the global meteoric water line. The interconversion between surface water and groundwater occurred mainly in the upper reaches of the river. (2) At the sample site with the long-term ecological water conveyance, the water uptake pattern for typical riparian plants is predominantly shallow soil water or the uniform use of potential water sources. Among them, the utilization rate of shallow soil water reached 30.7 ± 12.6%. At sample sites with intermittent ecological water conveyance and the non-ecological water conveyance sample site, the growth of T. ramosissima and P. australis primarily uses deep soil water and groundwater, with mean values of 34.5 ± 5.1% and 32.2 ± 1.9%, respectively. (3) The water competition between plants at the intermittent ecological water conveyance and non-ecological water conveyance sample sites was more intense. However, the long-term ecological water conveyance effectively reduced water competition among plants. Our results will provide basic theoretical support for maintaining the stability of the Manas River riparian ecosystem and determining environmental flows.

1. Introduction

Riparian ecosystems are one of the most fragile ecosystems [1]. Under the influence of climate change and human activities, many rivers are drying up or becoming intermittent rivers, groundwater levels in riparian zones are declining, and the soil water content is gradually decreasing [2,3,4]. Riparian plant water sources and use patterns shift due to these alterations to river ecohydrological processes [5,6]. In recent years, ecological water conveyance (people regulate water conservancy establishment to divert water from upstream rivers or reservoirs to downstream rivers) has been widely used to recharge rivers to maintain environmental flows and improve the stability of riparian ecosystems [7,8,9]. Although there is evidence that river water is not the primary source of water for riparian vegetation [10], the water source for riparian vegetation must be clarified in order to determine whether riparian plant water uptake processes respond to ecological water conveyance.
Hydrogen and oxygen stable isotopes (δ2H and δ18O) in water bodies are widely used to identify and quantify plant water sources [11,12,13]. Isotopic fractionation does not occur in the process of plant roots obtaining water from potential water sources and then transporting that water to plant organs in the form of liquid flow, except for certain salt-tolerant plant species [14]. Thus, the isotopic composition of plant xylem water is the result of the mixing of potential water sources [15], and the differences in isotopic composition between plant xylem water and potential water sources are compared to identify plant water sources [16]. Water sources for riparian plants include soil water, groundwater, surface runoff, and precipitation [17,18]. Some riparian plants have an ecohydrological separation of water uptake processes, which mainly absorb and utilize soil water and groundwater [19]. Meanwhile, the proportions of different water sources used by riparian plants have spatial and temporal variations, which are closely related to factors such as water table depth [20,21], wet and dry period transitions [22,23], and plant root characteristics [23,24]. During wet periods, riparian plants mostly use shallow soil water, whereas during dry periods, deep soil water and groundwater are the primary water sources for riparian plants [25,26]. Shallow-rooted plants mainly use shallow soil water, while medium- and deep-rooted plants mostly use deep soil water or groundwater [13,27]. The above studies focused on exploring the water sources of riparian plants in natural rivers [28]. However, less research has been undertaken on the water sources of riparian plants under different ecological water conveyance conditions in arid zones.
The Manas River is an inland river of ecological importance in Xinjiang, Northwest China. Moreover, it is the largest river on the northern slopes of the Tianshan Mountains, with an annual runoff of 1.34×10⁹ m3 [29]. However, the more than 96% surface water utilization rate in the Manas River basin has led to the deterioration of water source conditions in the riparian habitat of the Manas River and the gradual degradation of riparian vegetation [30,31]. Studies of riparian plants of the Manas River primarily focus on species surveys and plant community differences under varying river-groundwater types [32,33]. There is still a lack of studies on the differences in plant water uptake patterns under different ecological water conveyance conditions. Therefore, it is necessary to clarify the water sources of riparian plants to protect and restore the riparian vegetation of the Manas River. In this study, we collected samples of riparian vegetation from highly regulated rivers and different water bodies, using stable isotopes (δ2H, δ18O), the MixSIAR model, and the proportional similarity index (PSI) to achieve the following objectives: (1) to quantify the water sources of riparian vegetation under different ecological water transfer patterns and (2) to clarify the water competition between riparian plants.

2. Materials and Methods
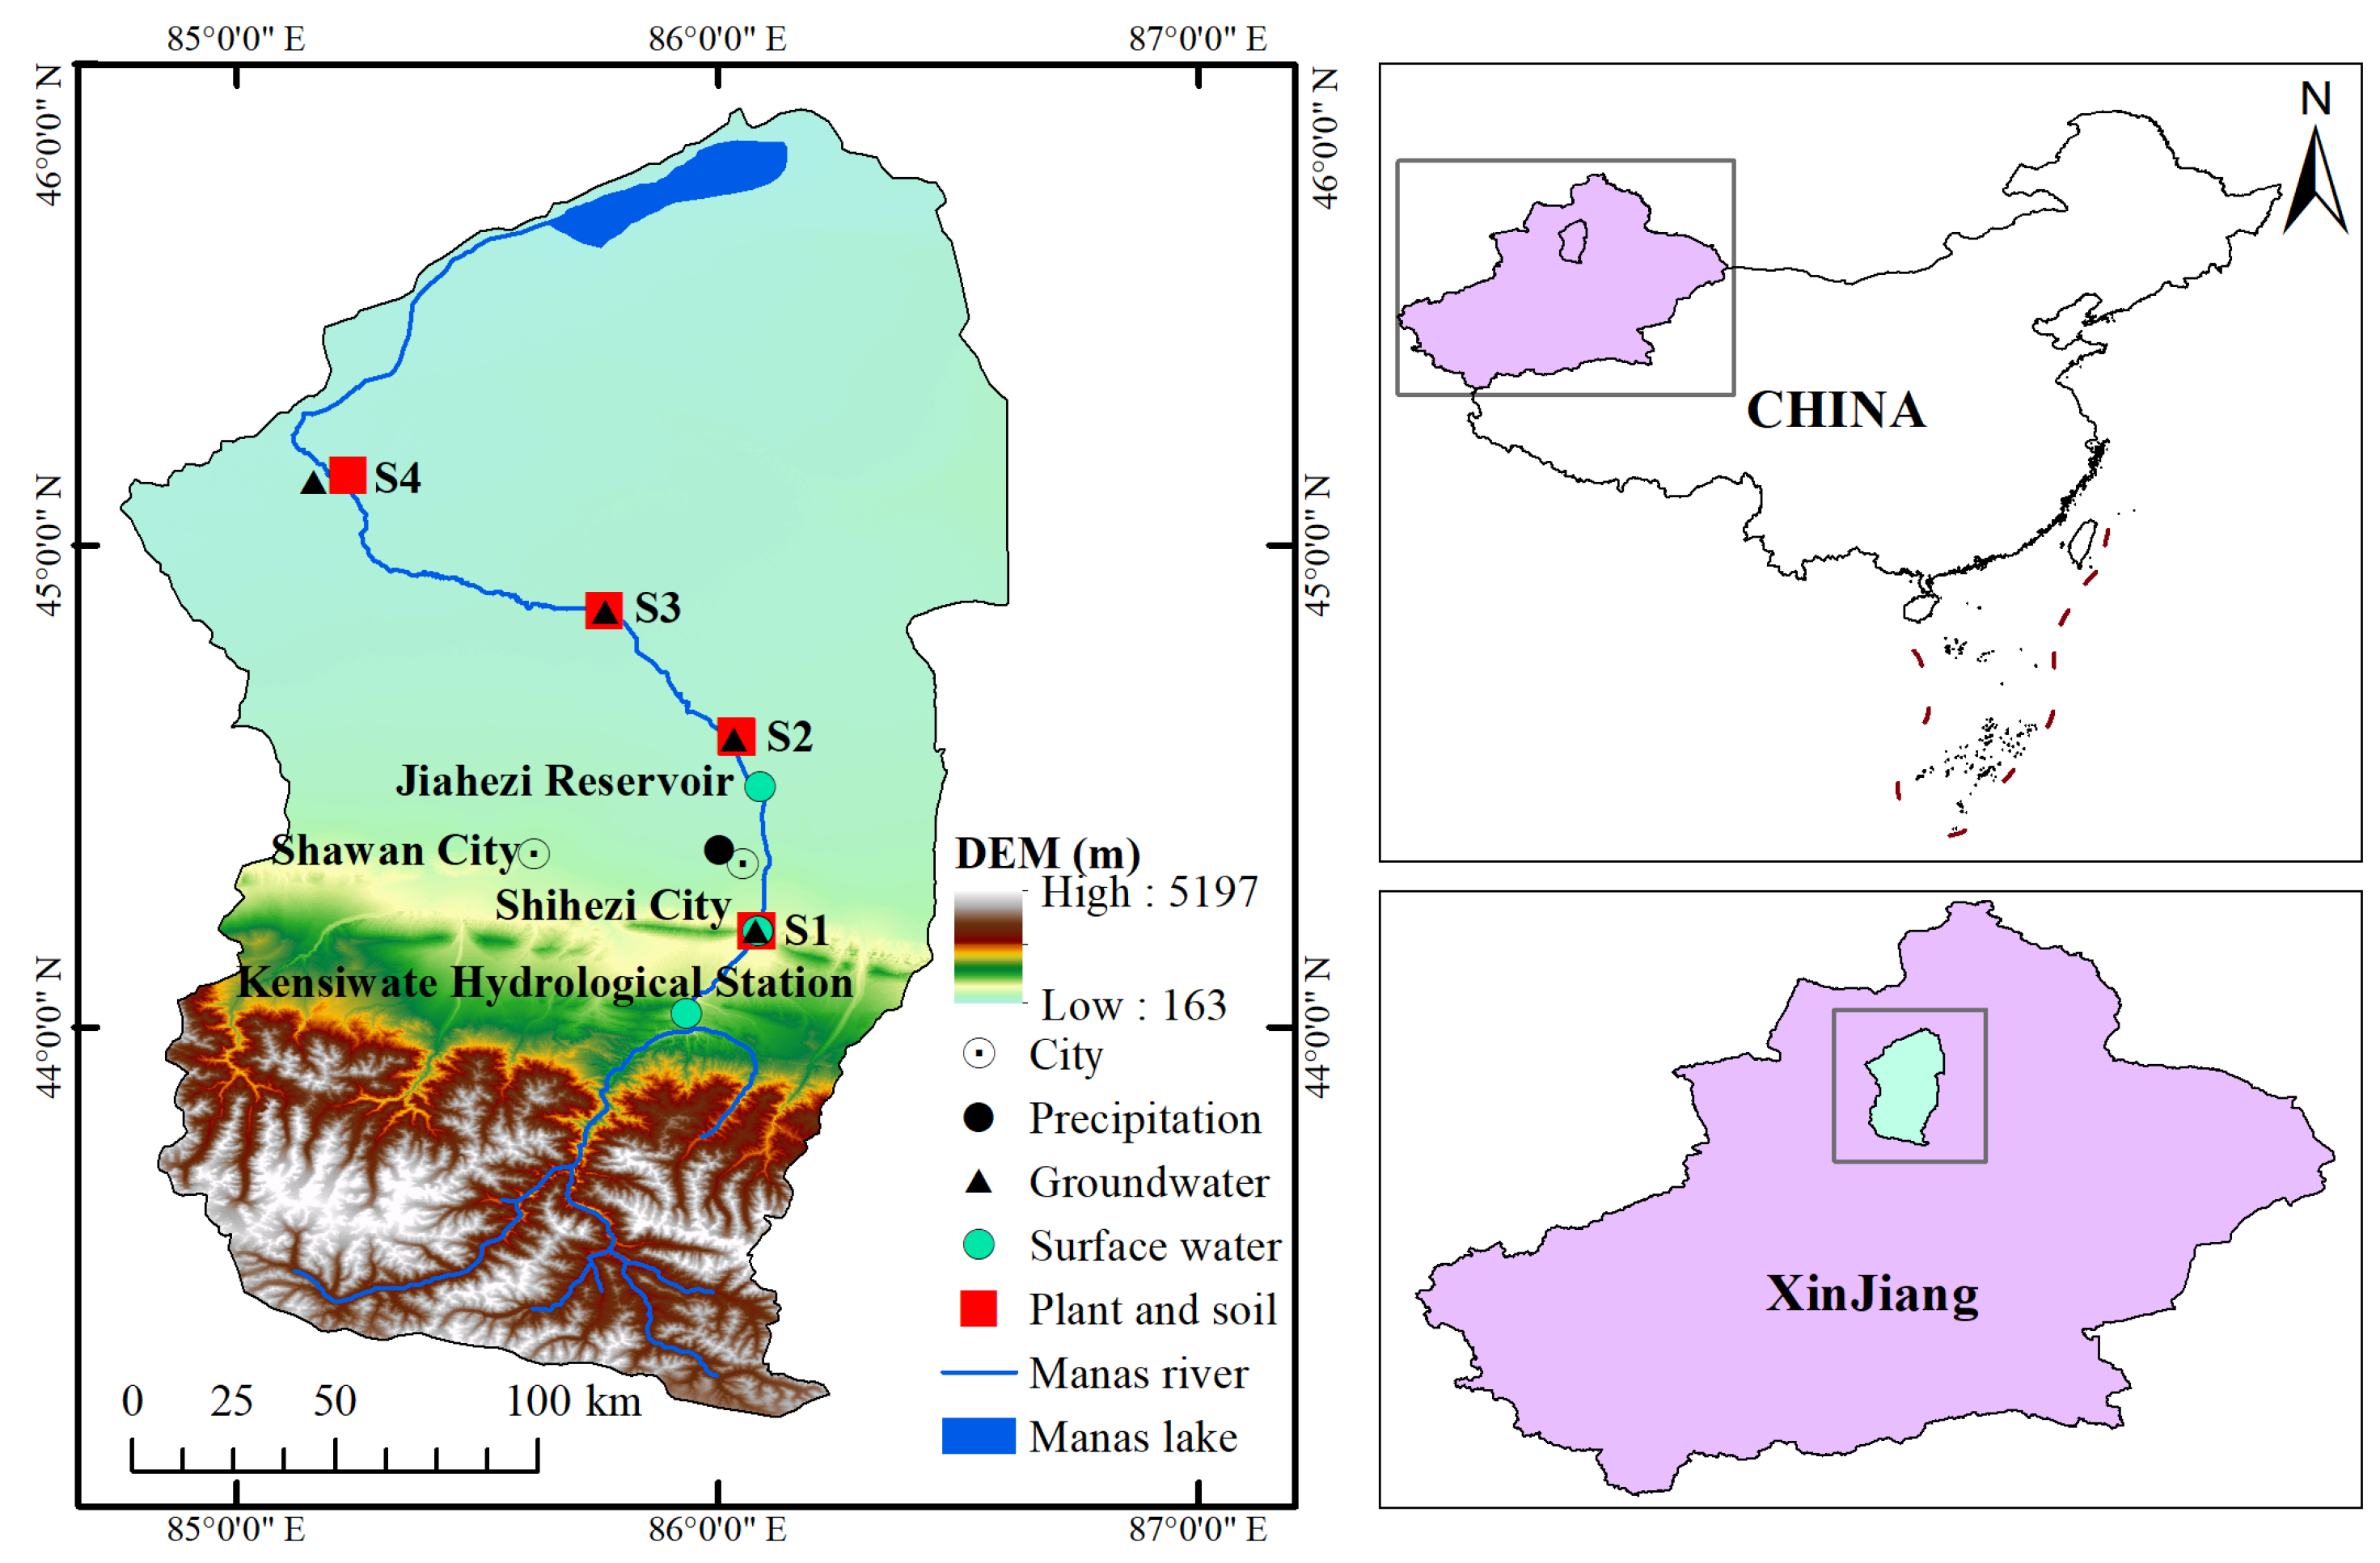
2.1. Study Area

The Manas River Basin is a drainage basin that belongs to part of the mountain-basin system. The basin is located in the middle of the northern foot of the Tianshan Mountains and the southern edge of the Junggar Basin (Figure 1). It is a typical temperate continental arid climate, with scarce precipitation and intense evaporation in the basin. The average annual temperature is 5.9 °C, the average annual precipitation is 338.2 mm, and the potential evaporation is 1550.2 mm [34,35]. The Manas River originates from glacier No. 43 of the Eren Habirga Mountains in the middle of the northern Tianshan Mountains. It is the largest river in the Manas River Basin, with a total length of 504.3 km and an average annual runoff of 1.34 × 10⁹ m3. The riparian vegetation is mainly dominated by the families Tamarixaceae, Gramineae, Quinoa, and Leguminosae, including Tamarix ramosissima, Phragmites australis, Calamagrostis pseudophragmites, Suaeda glauca, Kalidium foliatum, Sophora alopecuroides, Kochia prostrata, Glycyrrhiza uralensi, and other plants [36].

2.2. Sample Collection and Analysis

2.2.1. Sample Collection

Through the local water resources management department, we learned that the ecological water conveyance flow for site S1 is 179 million m³/a. The intermittent ecological water conveyance flow at sites S2 and S3 is 83 million m³/a, but the river will dry up when there is no ecological water conveyance; the river has been dry for a long time at site S4. According to the continuity and flow difference of ecological water transfer in different reaches, there are three types of ecological water conveyance, including long-term ecological water conveyance, intermittent ecological water transfer, and non-ecological water conveyance reaches. Therefore, a total of four sample sites were deployed along the Manas River, including a sample site with long-term ecological water conveyance riparian (S1), two sample sites (S2 and S3) with intermittent ecological water conveyance riparian, and a sample site (S4) with non-ecological water conveyance riparian. In addition, precipitation monitoring stations were established near these four sample sites. Typical plant, soil, groundwater, and surface water samples were collected during the first week of June and July 2022, and precipitation samples were obtained from April to July 2022.
Plant samples were collected between 0900 and 1100 CST to minimize the impact of variations in light, temperature, and humidity. We collected multiple 3–5 cm samples of T. ramosissima branches and P. australis roots and stripped them of their bast and green leaves, then quickly packed them into 12 mL screw-top glass bottles, which we sealed with parafilm, and stored them in a −20 °C refrigerator until time of analysis.
Soil samples were obtained from 0–150 cm near the plants using a soil auger. The shallow soil water isotopes are easily influenced by processes such as precipitation and evaporation, whereas stable isotopes in soil water tend to stabilize as sample depth increases. Thus, soil samples were collected every 10 cm from 0–40 cm, every 20 cm from 40–100 cm, and every 25 cm from 100–150 cm. The soil layer below 100 cm in sample site S1 contains many pebbles, so only 0–100 cm soil samples were collected at S1. Soil samples were packed in 12 mL screw-top glass bottles, sealed with parafilm, and refrigerated until isotopic analysis. The soil water content (SWC) was measured using a standard loss-on-drying method at 105 °C for 24 h, and the gravimetric SWC was reported as percentage (%).
Precipitation monitoring stations were established near Shihezi City to collect daily precipitation. The precipitation samples were collected after each rain event, sealed in pre-cleaned bottles with no headspace, and refrigerated until isotopic analysis.
Groundwater was collected from irrigation wells near the plant sample sites, and the wells were pumped for 10 min before sampling to avoid collecting stagnant water. During the collection period, the river water was present at sample site S1 and absent at sites S2, S3, and S4, yet there were indications of ecological water conveyance recharge at sites S2 and S3 (puddles in low areas and wet river channels). In addition, we collected river water at the Kensiwate hydrological station and reservoir water at the Jiahezi reservoir. Groundwater and surface water samples were collected in pre-cleaned bottles, sealed with parafilm, and refrigerated until isotopic analysis.

2.2.2. Isotopic Analysis

The water contained in the xylem and soil samples was collected using an automatic cryogenic vacuum distillation system (LI-2000, LICA, Beijing, China). No isotopic fractionation occurred during water extraction. All water samples were filtered through 0.22-μm filters after extraction. The measurements of stable hydrogen and oxygen isotopes (δ2H and δ18O) were performed using a liquid water isotope analyzer (model DLT-100, Los Gatos Research, San Jose, CA, USA) at Shihezi University. The measurement precisions for δ2H and δ18O were ±0.4‰ and ±0.15‰, respectively. The measured 18O and 2H abundances were expressed in per mil (‰) relative to the standard Vienna standard mean ocean water (V-SMOW):
δ = R SA R ST   R ST × 10 3
where RSA denotes the isotope ratio of the rare to more abundant isotope species in the measured sample, and RST denotes the isotope ratio in standard V-SMOW.
Due to δ2H fractionation during root water uptake, there are typically large δ2H offsets between plant water and its potential sources [37]. Li et al. [38] proposed the deviation of plant xylem with respect to potential water source line (PWL) based on LC-excess and SW-excess equations, which was described as PW-excess:
PW excess = δ 2 H σ δ 18 O Λ
where σ and Λ denote the slope and intercept of the PWL (the PWL was proposed by performing a linear regression on potential water sources isotope data), and δ2H and δ18O denote the isotopic compositions of plant xylem water. Negative PW-excess indicates that plant xylem δ2H is more depleted than potential water. In contrast, the positive value of PW-excess means that the δ2H in xylem water is more enriched than the PWL. The δ2H value of xylem water is corrected by subtracting the corresponding PW-excess from the original value.

2.2.3. MixSIAR Model

In this study, the contribution percentages of potential water sources to plant water were calculated using the MixSIAR model based on the R language [39]. Compared with the linear mixed model, the MixSIAR model combines the functions of model random effect classification variables and residual and process error analysis to further improve accuracy. The plant xylem original δ18O and corrected δ2H by the PWL (subtracting the PW-excess from the original δ2H) were utilized in the mixing model. Based on the soil water isotope composition characteristics, the soil was divided into three layers, with 0–30 cm as shallow soil, 30–80 cm as middle soil, and 80–150 cm as deep soil. The isotopic compositions of plant xylem water were set as the mixture data, whereas the isotopic values of soil water in each layer and groundwater were set as the source data. The model parameters were selected as “Process Only” for the error structure and “very long” for the Markov chain Monte Carlo (MCMC) run length.

2.2.4. Proportional Similarity Index

The proportional similarity index (PSI) was used to assess the water competition between the two typical riparian plants in this study [40]. The PSI of proportional contributions (Pi) of different water resources between T. ramosissima and P. australis was calculated as follows:
PSI = 1 0.5 i = 1 n   P 1 i P 2 i  
where p1 and p2 are proportions (in %) of water uptake from potential water sources for T. ramosissima and P. australis, respectively. The closer the PSI converges to 1, the more intense competition for water resources between the two species.

3. Results and Discussion

3.1. Stable Isotope Compositions of Different Water Bodies

The temporal variations of isotope compositions in precipitation, together with the observed precipitation amount and temperature in the study area, are shown in Figure 2. There were a total of 22 rain events during our sampling period. The δ18O and δ2H of precipitation decreased from −6.4‰ and −46.92‰ to 29.76‰ and 6.33‰, with an average of −1.68 ± 3.97‰ and −12.00 ± 23.21‰, respectively. Both the temperature and precipitation amount effects of precipitation isotopes are significant: precipitation δ18O is positively correlated with temperature (R2 = 0.41, p < 0.01) and negatively correlated with the precipitation amount (R2 = 0.38, p < 0.01). The linear fit yielded a local meteoric water line (LMWL) of δ2H = 5.69 δ18O − 3.03 (R2 = 0.91, p < 0.001) in the study area (Figure 3). The slope and intercept of the local meteoric water line equation in the study area are smaller than the global meteoric water line because the sub-cloud evaporative process is particularly evident in the arid Manas River basin [41]. The Manas River basin is located in the abdomen of the Asia–Europe continent, and the water vapor source is single, with 96% coming from stratospheric water vapor. The secondary evaporation under clouds occurs during the descent of precipitation due to the low relative humidity and low rainfall amount in the study area, leading to unbalanced fractionation of the stable hydrogen and oxygen isotopes in precipitation [42]. In addition, the isotopic values of precipitation in the arid zone are more enriched in the summer months and depleted in the drier winter, resulting in the relative enrichment of δ2H and δ18O in our precipitation samples [43].
The surface water point is located between groundwater and precipitation (Figure 3), with a bias toward groundwater, and surface water is recharged by precipitation and groundwater. The surface water becomes isotopically enriched during transport under the influence of evaporation, and the δ2H and δ18O values increased from −69.71‰ and −10.68‰ to −67.59‰ and −9.96‰, and mean values were −69.44 ± 3.95‰ and −10.51 ±0.45‰, respectively. The stable isotopes in surface water in July were more depleted than in June. The stable hydrogen and oxygen isotope values of glacial meltwater are depleted compared to other water bodies [44,45]. From May to July, when the temperature rises and the rate of snow and ice melt in the mountains accelerates, snow and ice meltwater become the primary source of recharge for river water in the Manas River, and the river water is gradually depleted in δ2H and δ18O over time. However, unlike the results of decreasing stable hydrogen and oxygen isotope abundance along the flow in some sections of the Yellow River [46], it is possible that there are fewer recharge sources in the middle and lower reaches of the Manas River or the intense evaporation is greater than the influence of other water bodies on the river water recharge in the arid zone.
The differences in the spatial distribution of groundwater δ2H and δ18O values were significant (p < 0.05) using one-way ANOVA, while the differences in the temporal distribution were not significant (p > 0.05) using Student’s t-test. From sample sites S1 to S4, the groundwater δ2H and δ18O values decreased from −72.42‰ and −10.93‰ to −85.31‰ and −12.02‰, with an average of −80.01 ± 5.46‰ and −11.60 ± 0.53‰, respectively. Unlike other water bodies, the temporal variations of stable hydrogen and oxygen isotopes in the groundwater were small, indicating that the groundwater recharge process was complicated and the recharge cycle was lengthy [47,48]. Moreover, the difference in groundwater isotopes between sample sites is great, indicating different aquifers’ existence [49]. The isotope values of the groundwater and river water in the upper reaches of the Manas River are very close, indicating a recharge exchange relationship between the two water sources. However, according to the isotope changes of river water along the flow, it can be inferred that the isotope values of river water in the middle and lower reaches are more enriched than those of groundwater, indicating that the recharge and discharge relationship between the two water bodies in the middle and lower reaches is weaker. Therefore, it can be inferred that the recharge and discharge processes of groundwater and surface water mainly occurred in the upper reaches of the Manas River. Wang et al. [50] studied the characteristics of the groundwater level, water chemistry, and water isotope in the Manas River basin and found that the groundwater of the basin mainly comes from runoff and precipitation in the upper reaches of the Manas River.
Riparian habitats are unique habitats where multiple water bodies exchange with each other [51]. Factors such as the lateral recharge of river water, groundwater recharge, infiltration of precipitation, and evaporation cause spatial and temporal heterogeneity in soil water isotopic compositions and SWC. Soil water δ2H and δ18O values became more negative as the soil depth increased, and the SWC gradually increased. The stable isotope compositions of soil water were gradually enriched from S1 to S4 (Figure 4), as the SWC gradually decreased from S1 to S4 (Table 1). The mean values of δ18O and δ2H of soil samples were −7.39 ± 4.54‰ and −64.99 ± 20.33‰, with the variation of δ18O ranging from −13.30‰ to 6.64‰, and the variation of δ2H ranging from −93.23‰ to −4.01‰. Soil water δ2H and δ18O values were higher in July than in June, which might be affected by the isotope compositions in river water and precipitation. The regional soil water line (SWL) was δ2H = 3.89 δ18O − 36.22 (R2 = 0.76, N = 68) (Figure 3), and the slope and intercept were smaller than the LMWL, indicating that soil water was subject to intense evaporation. Precipitation is an essential input to hydrological processes and impacts the formation of regional water resources and stable hydrogen and oxygen isotope fractions in water bodies [52]. Precipitation recharges only shallow soils in arid and semi-arid regions [53]. During the sampling period, precipitation is more enriched in δ2H and δ18O than in other water bodies, and groundwater is more depleted than in other water bodies. Precipitation infiltration recharges shallow soil water, groundwater recharges medium and deep soil water through soil intergranular capillaries, and river water laterally recharges all layers of soil water. Under the influence of various water bodies on soil water, the δ2H and δ18O of soil water becomes gradually depleted with the increase of soil depth [54,55]. The use of water isotopes alone to demonstrate the transformation process between water bodies still has limitations. Therefore, additional tracers need to be included in subsequent studies to accurately describe the process.

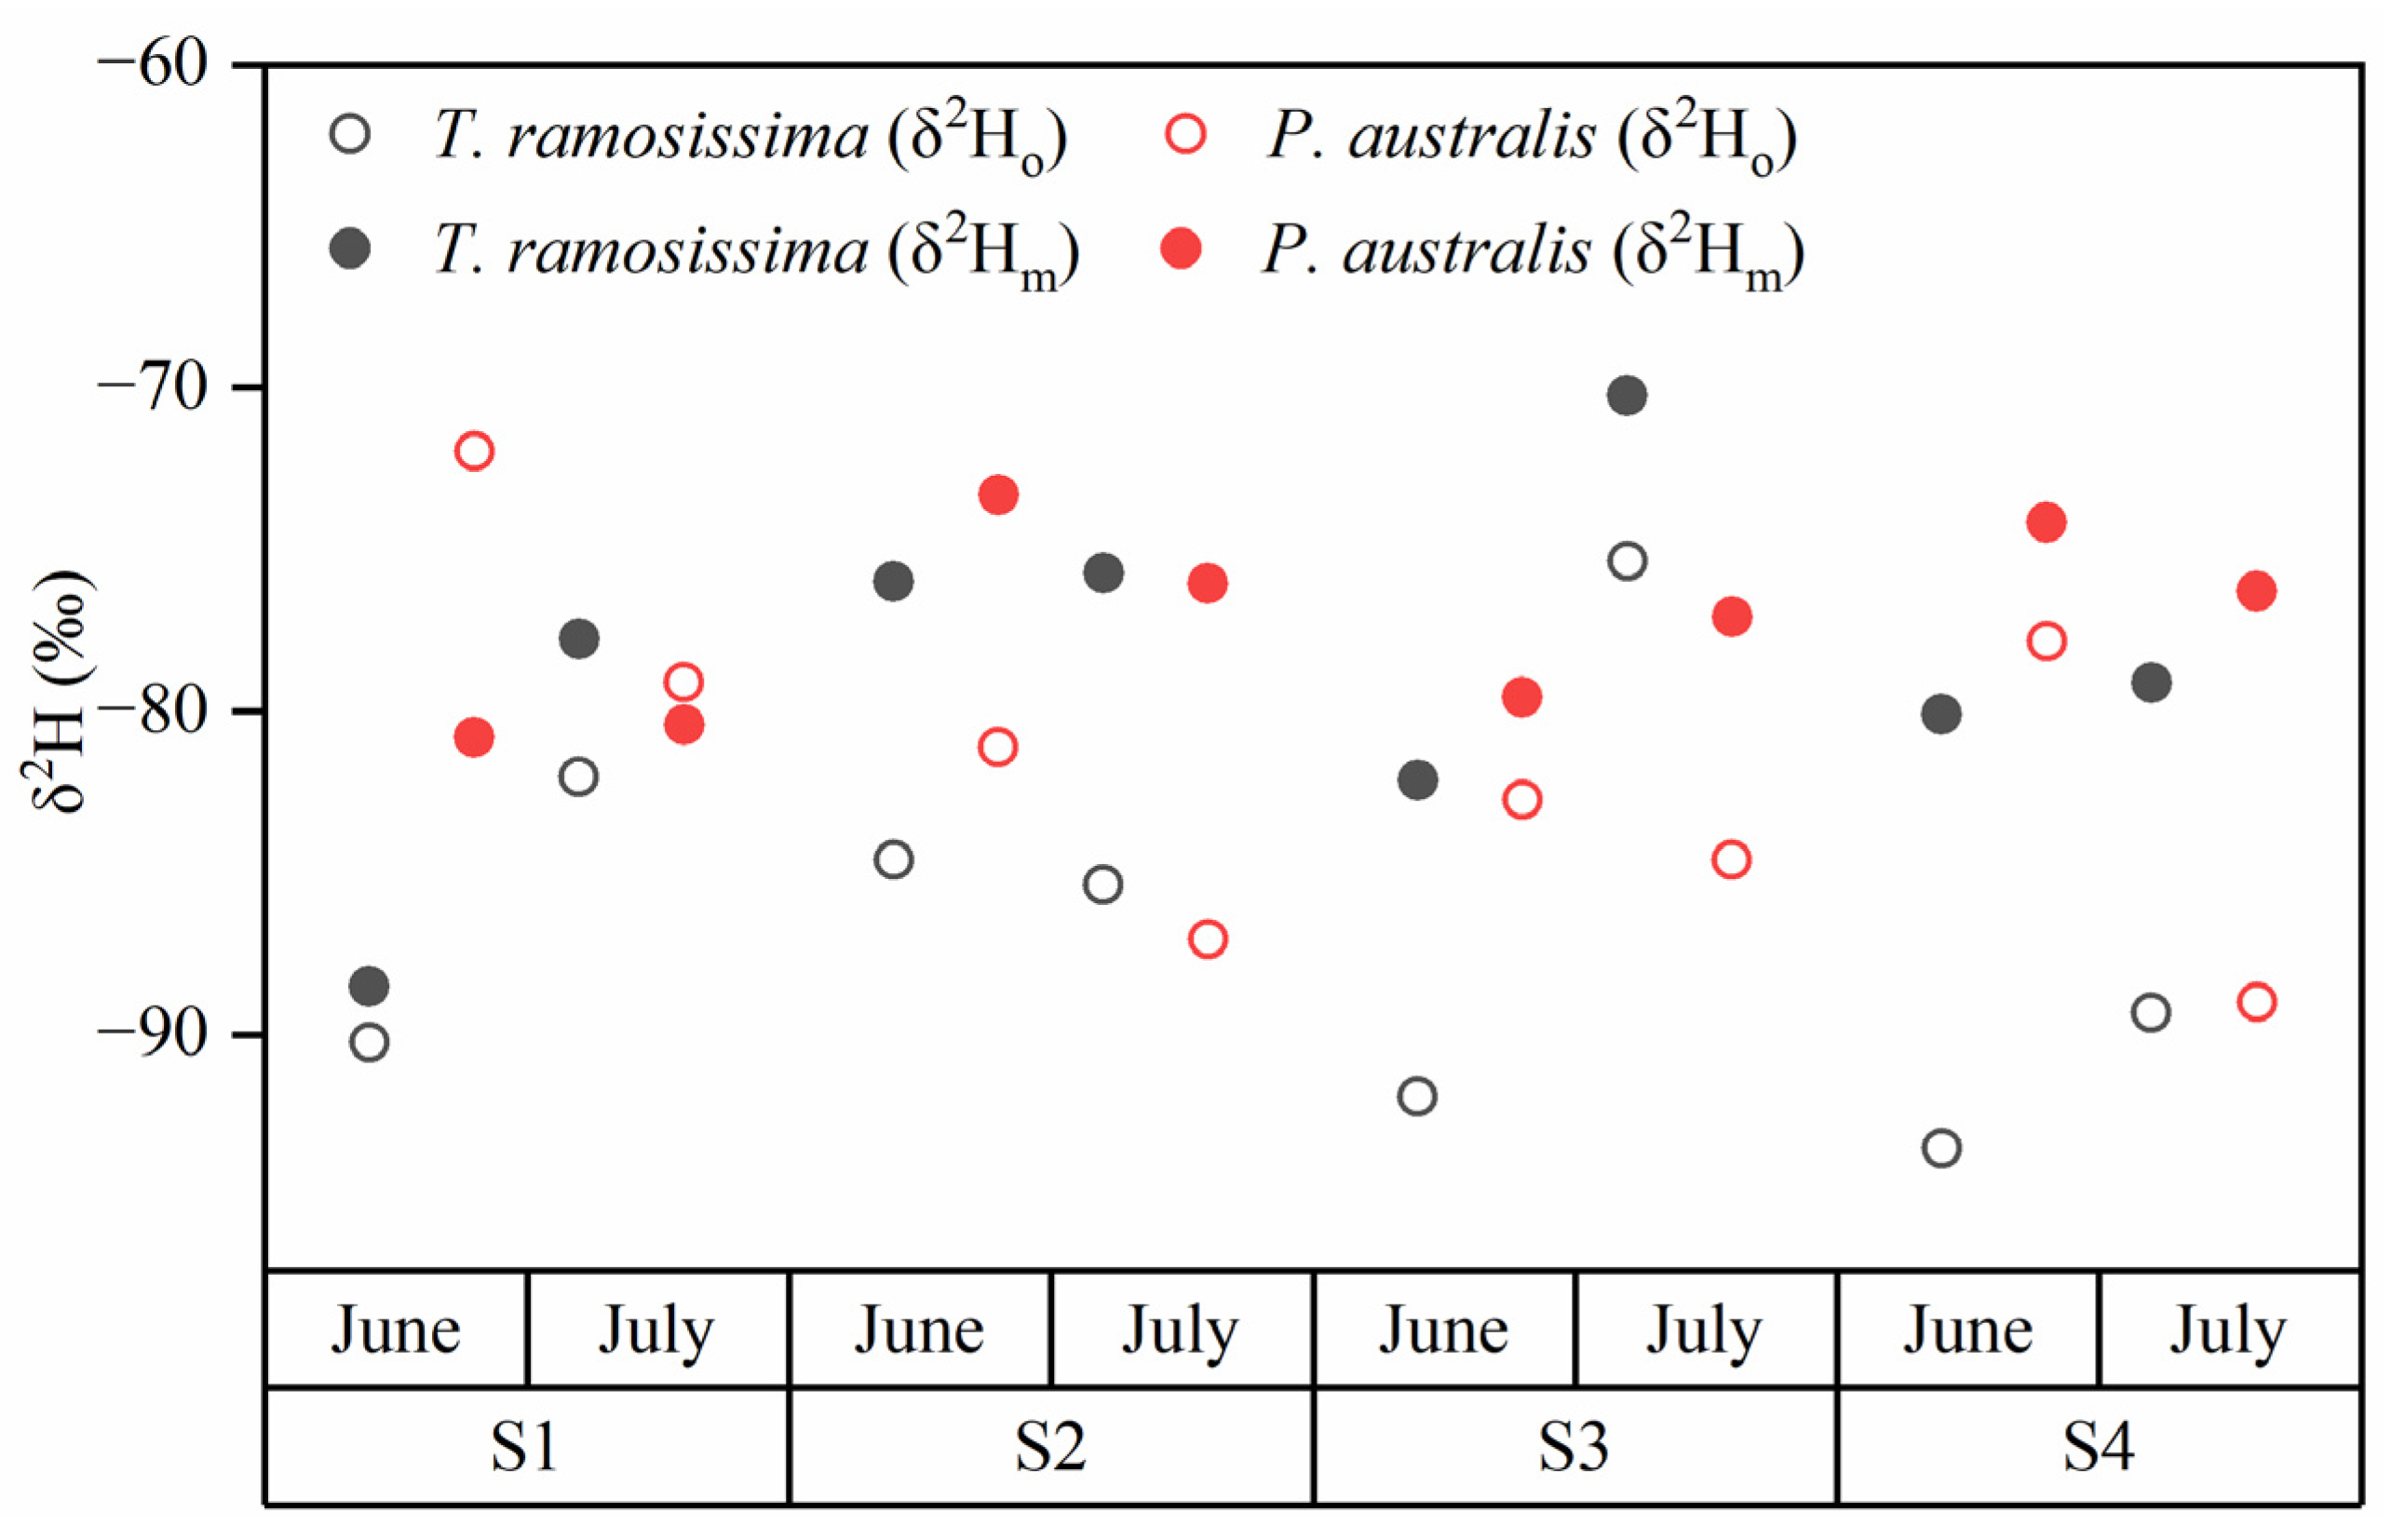
3.2. Stable Isotope Compositions of Plant Water

The isotopic compositions of plant water reflect the mixing of various water sources with different isotopic signatures. The mean values of δ18O and δ2H in xylems of T. ramosissima in June are −11.11 ± 0.56‰ and −90.08 ± 3.89‰, and those of P. australis are −9.74 ± 0.98‰ and −78.41 ± 4.75‰, and the isotope values of all T. ramosissima samples are lower than those of P. australis. The mean values of δ18O and δ2H are −10.16 ± 1.08‰ and −83.01 ± 5.91‰ for T. ramosissima, and −10.62 ± 0.60‰ and −84.95 ± 4.28‰ for P. australis in July. The hydrogen and oxygen isotope values of P. australis from S2 to S4 in July are higher than those in June, but the opposite results are found for T. ramosissima. The S4 sample site was located in the river’s lower reaches and was not charged by the river during the sampling period. The isotopic compositions of T. ramosissima and P. australis were close to the groundwater and deep soil water, and the stable isotopic values of hydrogen and oxygen of T. ramosissima were consistently lower than those of P. australis, indicating that T. ramosissima mainly used groundwater.
The slope and intercept of the PWL at the four sample sites display little difference from those of the SWL (Figure 5). The slope and intercept of the PWL of the S1 to S4 gradually decrease, indicating that the downstream sample sites are more susceptible to the influence of precipitation and evaporation. The PW-excess values of all samples at different periods were not equal to 0, indicating that plant water in all sample sites showed hydrogen isotope deviation from the potential water source. Meanwhile, the δ2H values of the plant xylem were corrected according to the PW-excess. The results showed that the δ2H values of most plant xylem samples were more depleted than those of the potential water source, and only P. australis samples from sample site S1 were more enriched than those of the potential water source (Figure 6).

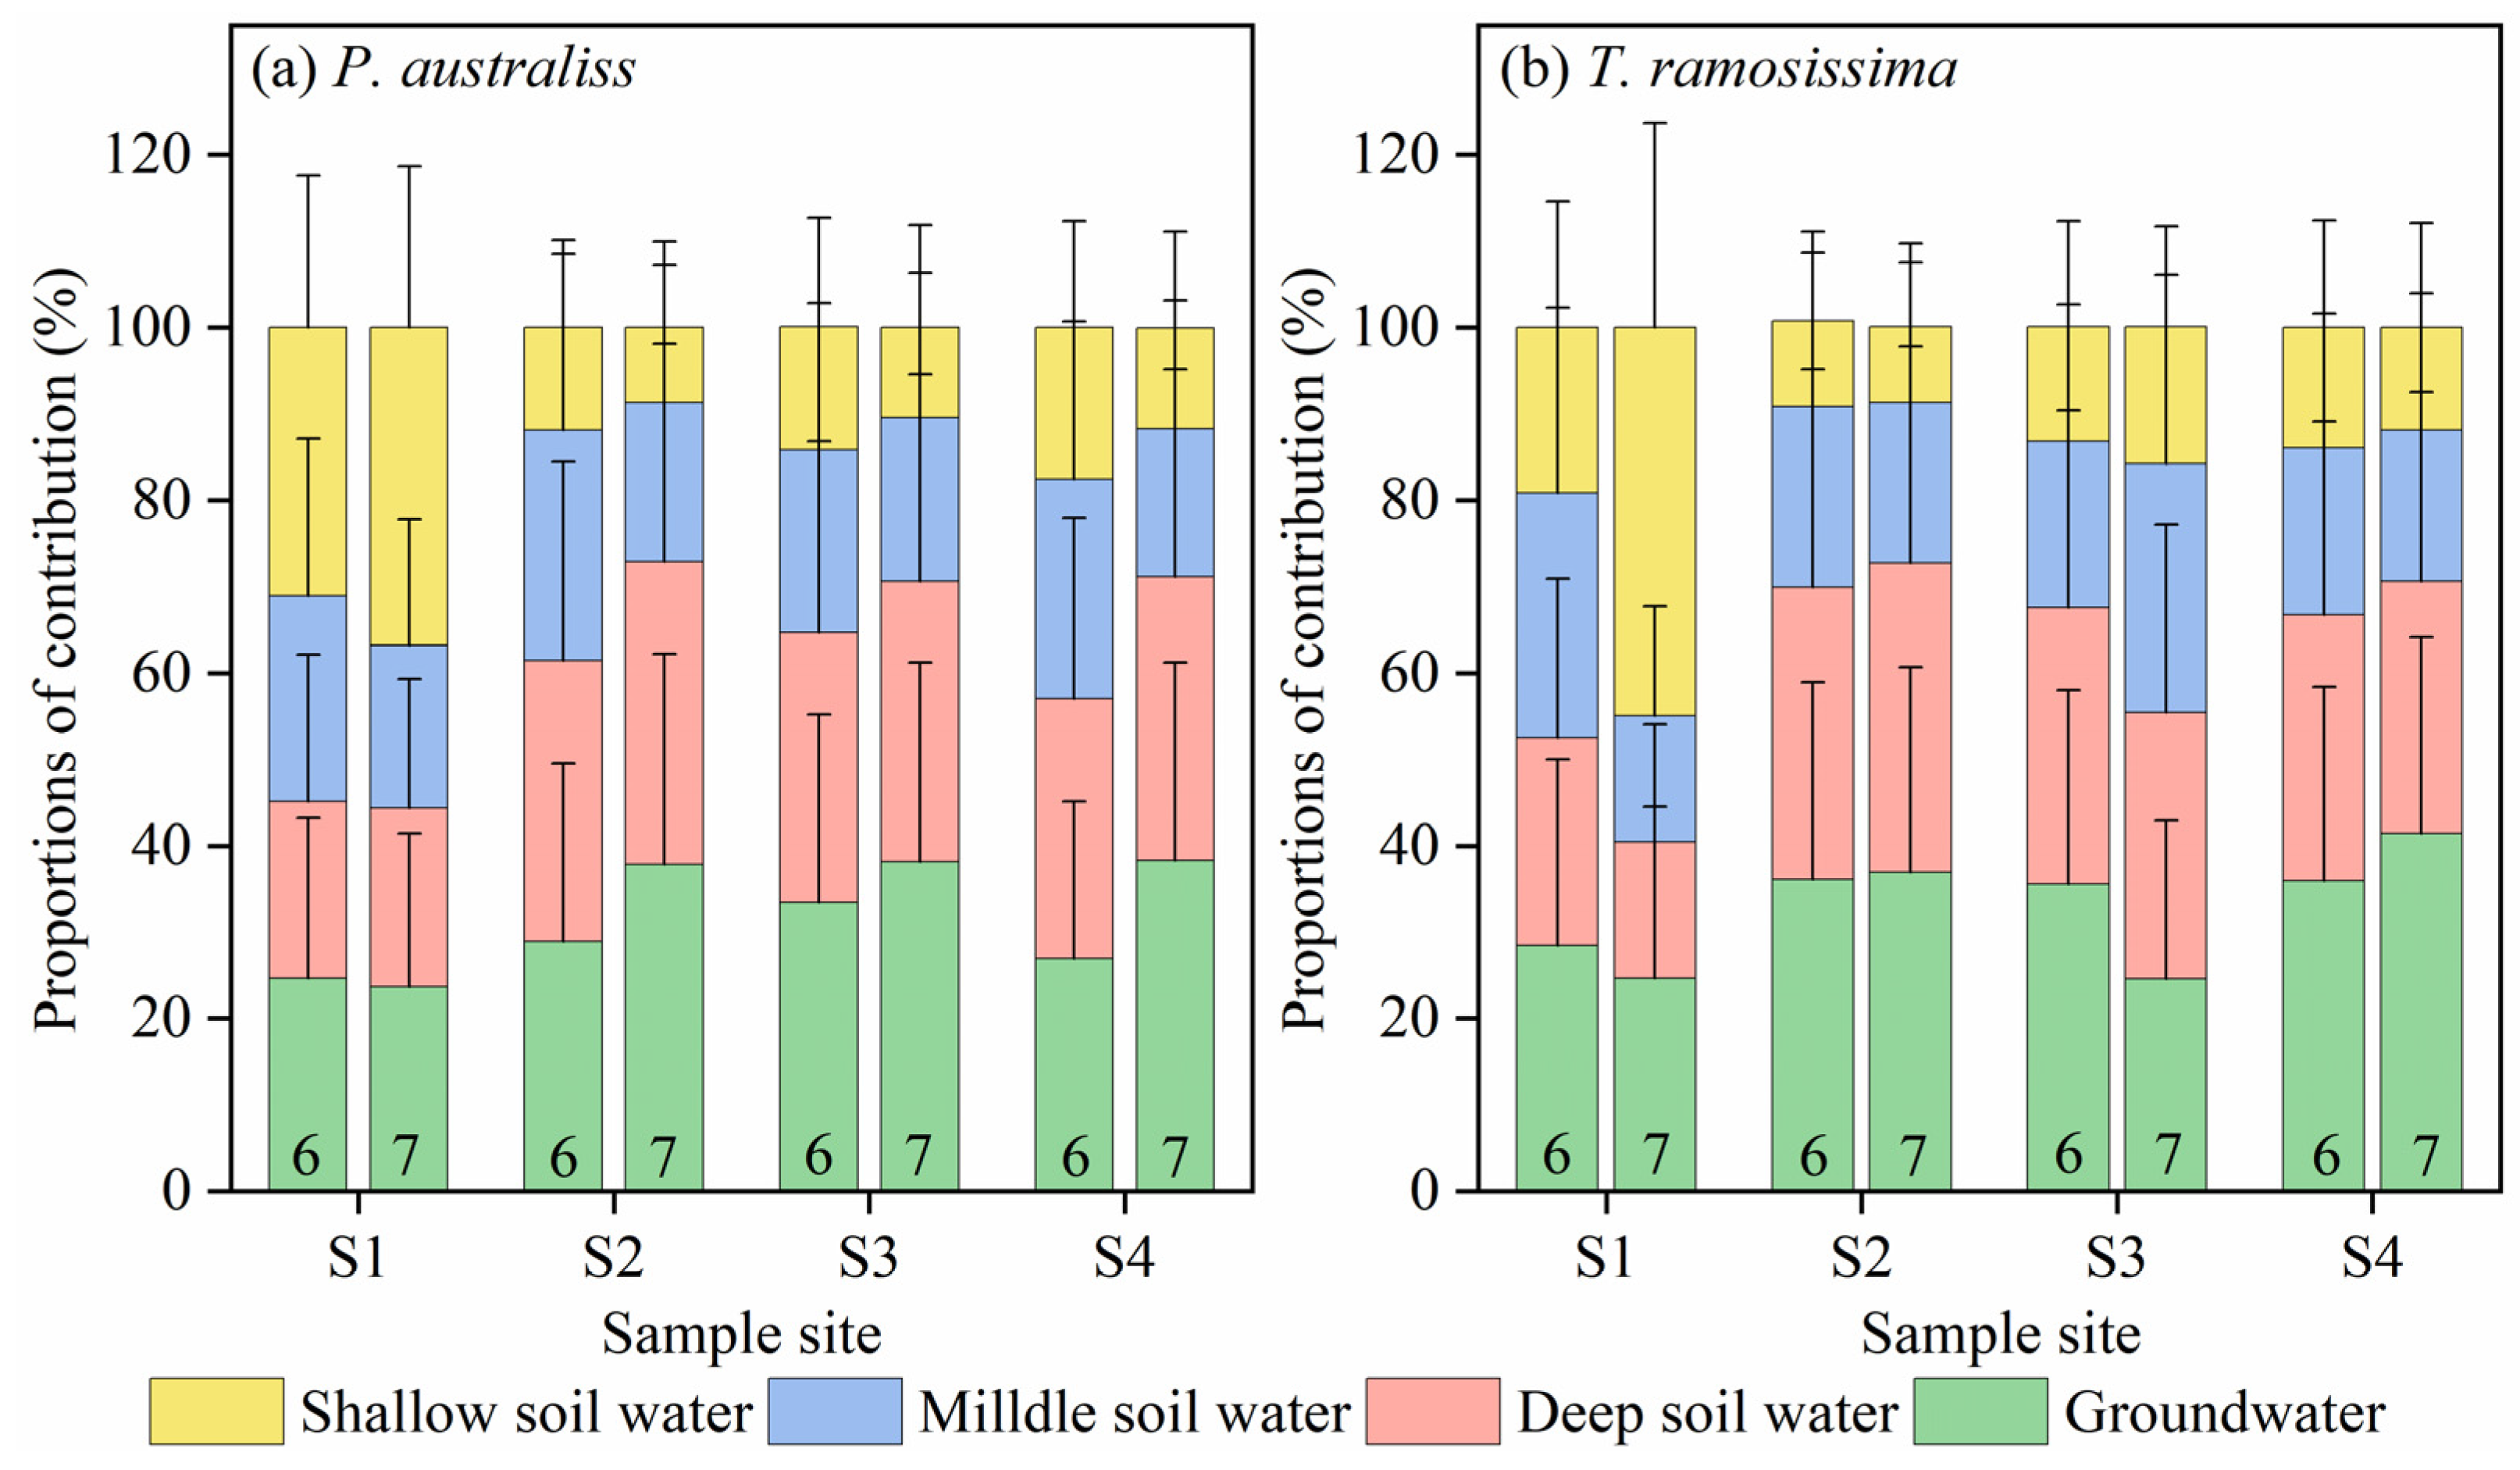
3.3. Contribution Percentages of Potential Water Sources to Plant Water

In our study, δ18O and corrected δ2H were used to calculate the contribution percentages of potential water sources to plant water. Based on the results of MixSIAR model calculations, the potential water contributions of sites S1–S4 are shown in Figure 7. The plants at sample sites S2–S4 mainly used groundwater and deep soil water, with mean values of 34.5 ± 5.1% and 32.2 ± 1.9% utilization, respectively. However, the least used was shallow soil water, with a mean value of only 12.4 ± 2.8%. Chen et al. [56] found that riparian plants under intermittent ecological water conveyance in the Tarim and Black Rivers hardly absorbed shallow soil water (0-20 cm) and mainly used deep soil water (over 80 cm) and groundwater. In contrast, in riparian habitats with adequate water conditions, plants mainly used shallow soil water [23]. The plants at sample site S1 used mainly shallow soil water, with an average utilization rate of 30.7 ± 12.6%.
In June, T. ramosissima and P. australis in the S1 used the potential water source evenly, and T. ramosissima and P. australis at sample sites S2–S4 mainly used groundwater and deep soil water, with mean values of 32.8 ± 4.0% and 31.7 ± 1.3%, respectively. Plants show different adaptive adjustments of water sources in response to habitat changes, which reflect the synergistic evolution of plants and their environment [16]. The depth of groundwater buried within 30 m on both sides of the Manas Riverbank under ecological water conveyance fluctuates around 3 m, and the maximum depth of the central root system of T. ramosissima in different habitats ranges from 1.0 to 10.0 m [32,57]; its root system can absorb and use groundwater and deep soil water to meet the water demand of T. ramosissima during its growth period. This is consistent with the results of the water use strategy of riparian T. ramosissima in the lower Tarim River basin [58]. The choice of water source for P. australis is related to the type of water source, soil water content, and root distribution [59]. The SWC in the shallow soil at S1 was greater than that of the other sample sites, so P. australis mainly used the shallow soil water at S1, which met the plant’s water requirements.
In July, due to the decrease in the soil moisture content in each layer of sample sites S2–S4, both plants increased the utilization of groundwater and deep soil water, with an average of 36.2 ± 5.9% and 32.7 ± 2.5%, respectively. At sample site S1 with better water conditions, T. ramosissima and P. australis changed from uniform use of potential water sources to mainly shallow soil water, with utilization rates of 45.0% and 36.8%, respectively. Drought stress may change the rooting pattern of plants and increase the importance of deep roots to obtain water [60]. T. ramosissima sprouted many lateral roots at all levels near the water table to meet water requirements for growth and development [61,62], and T. ramosissima at the sample sites S2 and S4 utilized groundwater more than other water sources and at a higher rate than in June. However, T. ramosissima at S3 reduced the utilization of groundwater. In addition, 30 m away from the sample site S3, a large amount of cotton was planted, and July was the peak of cotton irrigation. A large amount of irrigation and cotton transpiration formed a local microclimate, which increased the habitat humidity and decreased the temperature; thus this habitat change may be the main reason for the change in the water absorption pattern of T. ramosissima [63,64]. The SWC at S1 under long-term ecological water conveyance recharge was increasing, and the primary water source utilized by T. ramosissima shifted from deep soil water and groundwater to shallow soil water. This shift reduced the energy consumed for water uptake and met the water demand for plant growth [65]. Su et al. [66] also found that the primary water source of T. ramosissima on the banks of the Yellow River is shallow soil water, but in the hillside area where there is less water, T. ramosissima mainly uses deep soil water. The change in the primary water source used by T. ramosissima indicates the adaptability of T. ramosissima to different water conditions [67]. In July, the SWC in the middle and lower reaches of the Manas River sample sites (S2–S4) was lower than the SWC in June. As the shallow and middle soil water could not sustain the normal growth of plants in July, the main water source used by P. australis at this time might be from groundwater and deep soil water with a sufficient and stable water supply. Furthermore, the contribution of groundwater was higher than that of deep soil water. Chen et al. [68] also found that desert riparian forests mainly uptake groundwater under long-term water stress. Therefore, the main water sources used by plants at sample sites S2 and S3 were identical to those at sample site S4, indicating that both plant uptake patterns were less responsive to intermittent ecological water conveyance.

3.4. Competition for Water between T. ramosissima and P. australis

Water competition was prevalent among different plants [69]. The PSI values of all sites were greater than 0.7, and the mean PSI in June was greater than that in July (Table 2), indicating that there was water competition between T. ramosissima and P. australis. According to the habitat SWC variations, water competition among plants is weaker when the water supply is adequate, while drought stress aggravates the competition of plants for water. Wu et al. [25] concluded that the degree of water competition between acacia and buckthorn was significantly greater in the dry season than in the wet season in the Loess Hills. There were also differences in the PSI between the sample sites, and the mean PSI at S1 was smaller than that of other sample sites because plants chose different primary sources of water use under symbiotic conditions. The long-term ecological water conveyance effectively reduced the water competition between plants. Similarly, the PSI at S3 in July was lower than that of sites S2 and S4, suggesting that habitat changes influenced plant water competition. The PSI at S4 without ecological water conveyance was not the highest, which indicated that plants adapted to the long-term drought and reduced water competition by adjusting the water source. The long-term ecological water conveyance alleviates the competition for water among different plants and has a positive effect on maintaining riparian stability.
Under the long-term ecological water conveyance, the main water sources used by the riparian plants changed, and the water competition among the plants was relaxed. Therefore, to protect and restore the riparian ecosystem of the Manas River, it is suggested the long-term ecological water conveyance method is applied to the whole river. However, further studies are needed to determine the applicability of these findings to other sites. It is recommended to investigate the responses of riparian plants to different types of ecological water conveyance more thoroughly to clarify the water use patterns of riparian plants and provide data support for determining proper environmental flow.

4. Conclusions

(1)
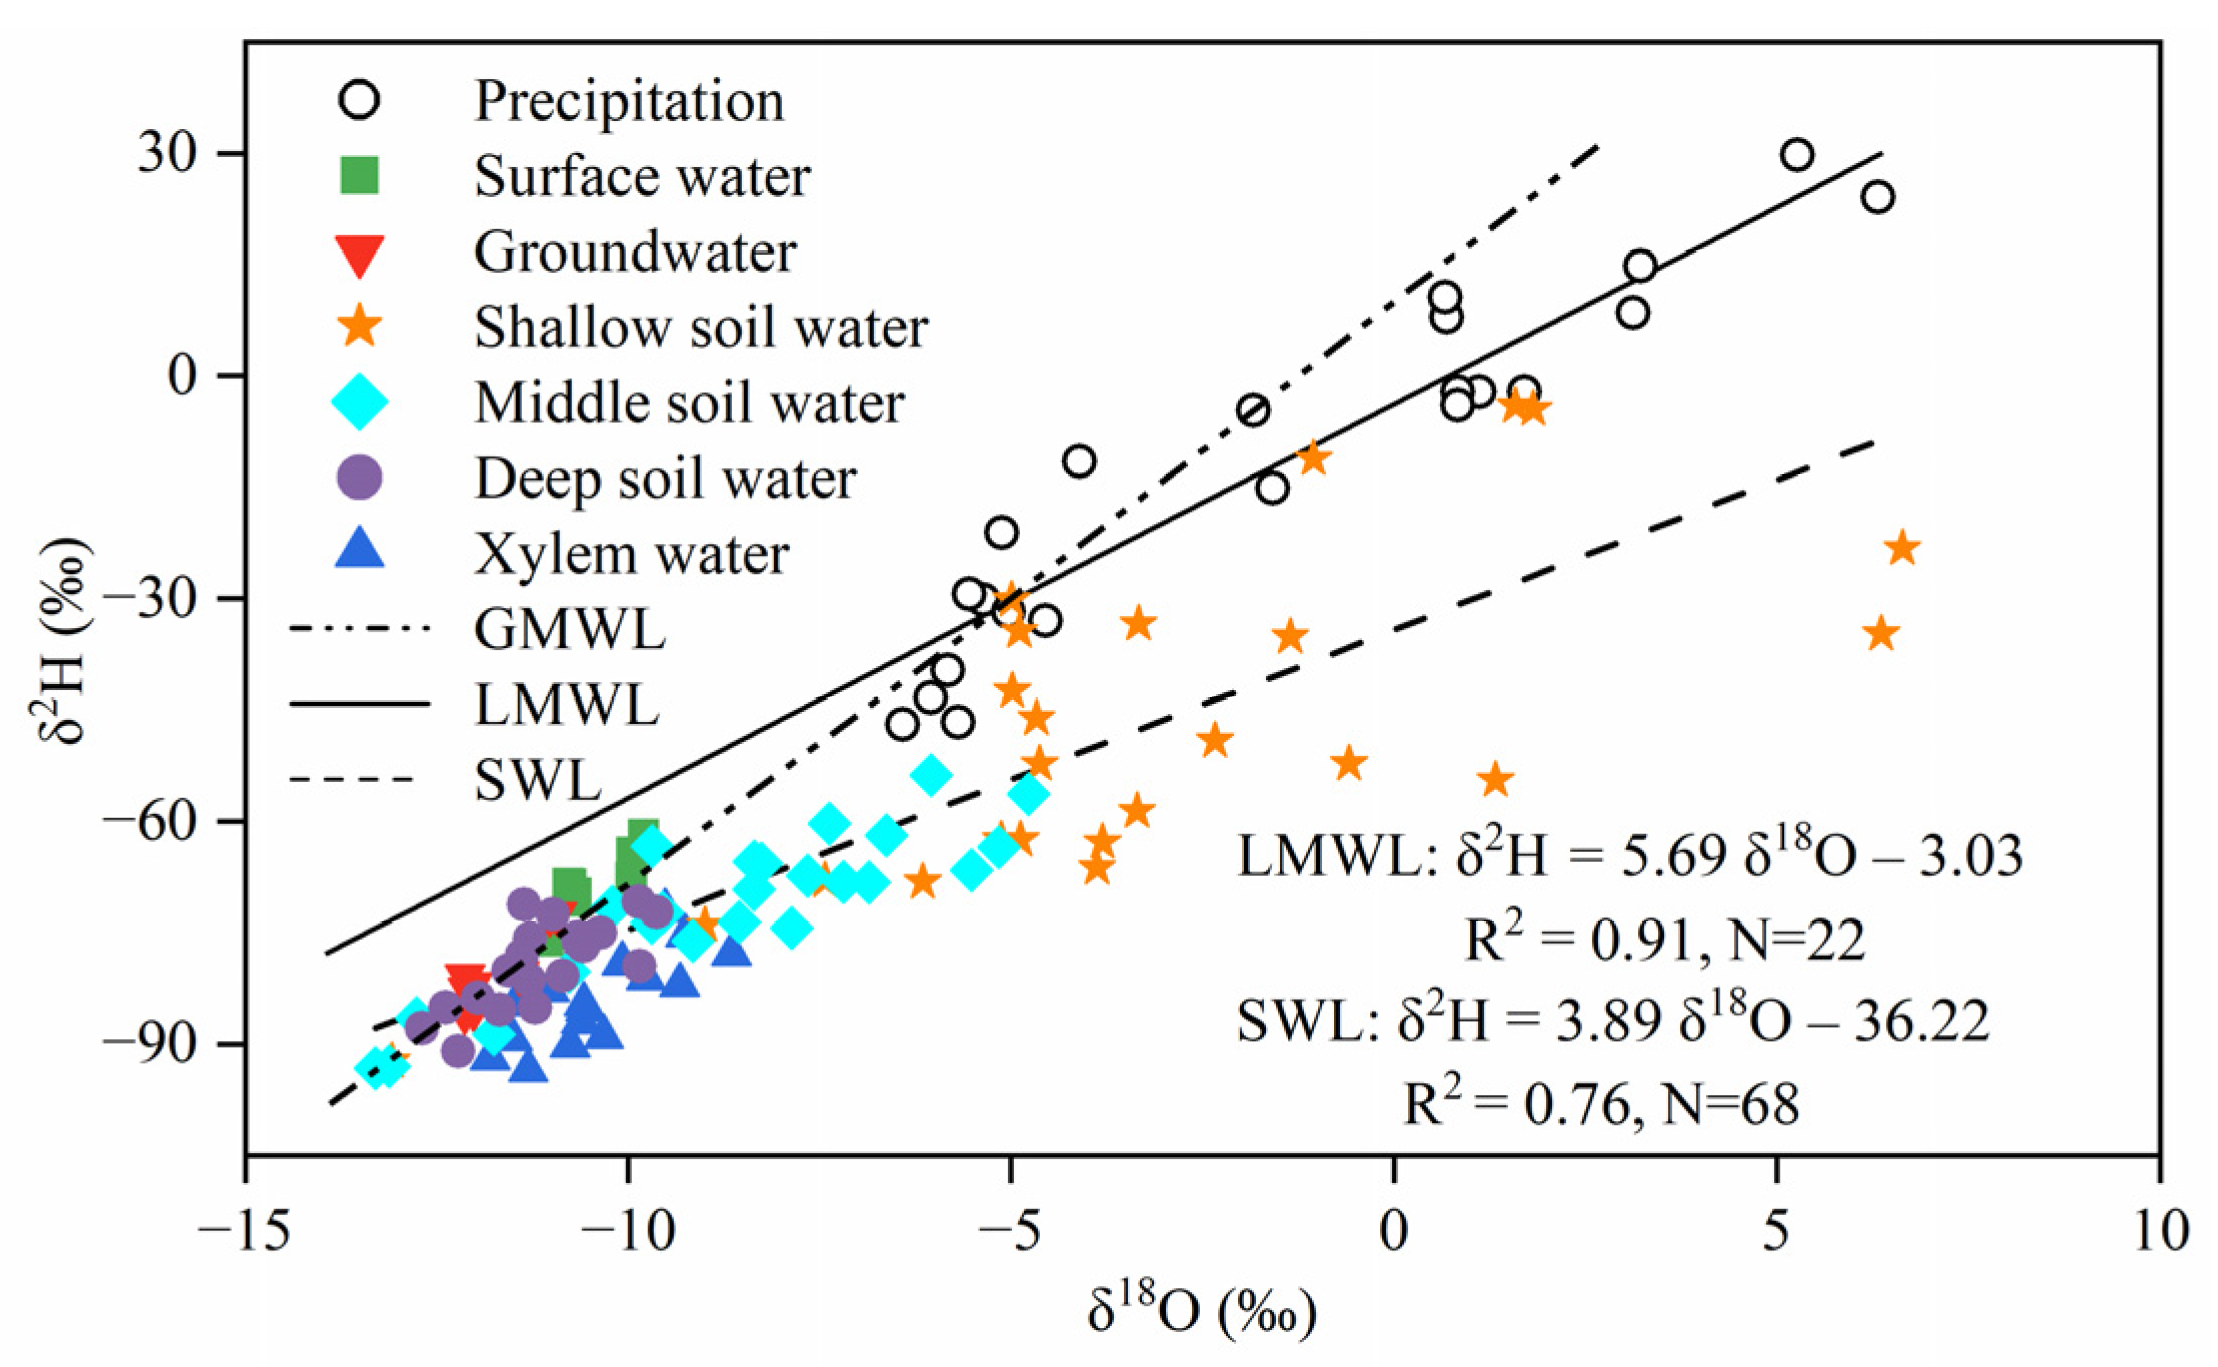
The slope and intercept of the LMWL were smaller compared with the GMWL, indicating that the climate in the study area is dry and subject to strong evaporation. The interconversion of surface water and groundwater occurred mainly in the upper reaches of rivers. Furthermore, the PW-excess values for both T. ramosissima and P. australis are not equal to 0, indicating that hydrogen isotope fractionation occurs during plant water uptake.
(2)
The water uptake patterns of T. ramosissima and P. australis in long-term ecological water conveyance samples are to evenly utilize or mainly utilize shallow soil water, and the utilization rate of shallow soil water reaches 30.7 ± 12.6%. In contrast, T. ramosissima and P. australis in intermittent ecological water conveyance samples and non-ecological water conveyance samples mainly absorb and utilize groundwater and deep soil water, with mean values of 34.5 ± 5.1% and 32.2 ± 1.9%, respectively. Therefore, plants can adjust their water uptake patterns to different habitats.
(3)
The PSI under all three ecological water conveyance conditions is more than 0.7. The water competition among plants was more intense at sample sites S2-S4, and the long-term ecological water conveyance effectively reduced the water competition among plants.

Author Contributions

Conceptualization, G.Y., X.L. and L.T.; methodology, M.R.; software, M.R. and H.T.; validation, Y.L.; formal analysis, M.R.; investigation, C.K.; resources, P.L.; data curation, B.L.; writing—original draft preparation, M.R. and H.T.; writing—review and editing, G.Y., L.T. and X.L.; supervision, L.X. and Y.G.; project administration, F.L. All authors have read and agreed to the published version of the manuscript.

Funding

This research was supported by the National Natural Science Foundation of China (Grant Nos. 52269006, U1803244, and 42106228); Xinjiang Production and Construction Corps (Grant Nos. 2021AB021, 2022BC001 and 2022DB023); The Third Xinjiang Scientific Expedition Program (Grant No. 2021xjkk0804); and Shihezi University (Grant Nos. CXRC201801 and RCZK2018C22).

Data Availability Statement

The datasets generated and/or analyzed during the current study are not publicly available.

Conflicts of Interest

The authors declare no conflict of interest.

References

  1. Bothwell, H.M.; Cushman, S.A.; Woolbright, S.A.; Hersch-Green, E.I.; Evans, L.M.; Whitham, T.G.; Allan, G.J. Conserving threatened riparian ecosystems in the American West: Precipitation gradients and river networks drive genetic connectivity and diversity in a foundation riparian tree (Populus angustifolia). Mol. Ecol. 2017, 26, 5114–5132. [Google Scholar] [CrossRef] [PubMed]
  2. Stromberg, J.C.; Beauchamp, V.B.; Dixon, M.D.; Lite, S.J.; Paradzick, C. Importance of low-flow and high-flow characteristics to restoration of riparian vegetation along rivers in arid south-western United States. Freshw. Biol. 2007, 52, 651–679. [Google Scholar] [CrossRef]
  3. Garcia, C.; Amengual, A.; Homar, V.; Zamora, A. Losing water in temporary streams on a Mediterranean island: Effects of climate and land-cover changes. Glob. Planet. Change 2017, 148, 139–152. [Google Scholar] [CrossRef]
  4. Stromberg, S.C.; Merritt, D.M. Riparian plant guilds of ephemeral, intermittent and perennial rivers. Freshw. Biol. 2016, 61, 1259–1275. [Google Scholar] [CrossRef]
  5. Pang, Z.; Huang, T.; Chen, Y. Diminished groundwater recharge and circulation relative to degrading riparian vegetation in the middle Tarim River, Xinjiang Uygur, Western China. Hydrol. Process. 2010, 24, 147–159. [Google Scholar] [CrossRef]
  6. Sun, W.; Song, X.; Mu, X.; Gao, P.; Wang, F.; Zhao, G. Spatiotemporal vegetation cover variations associated with climate change and ecological restoration in the Loess Plateau. Agric. For. Meteorol. 2015, 209, 87–99. [Google Scholar] [CrossRef]
  7. Huan, L.; Shaorong, Y.; Xiaoming, W. Research Progress on Ecological Restoration Technology Based on River Ecosystem Health. J. Hydro. 2019, 40, 1–6. [Google Scholar]
  8. Hao, X.; Li, W. Impacts of ecological water conveyance on groundwater dynamics and vegetation recovery in the lower reaches of the Tarim River in northwest China. Environ. Monit. Assess 2014, 186, 7605–7616. [Google Scholar] [CrossRef]
  9. Zhao, X.; Xu, H. Study on vegetation change of Taitemar Lake during ecological water transfer. Environ. Monit. Assess 2019, 191, 613. [Google Scholar] [CrossRef]
  10. Costelloe, J.F.; Payne, E.; Woodrow, I.E.; Irvine, E.C.; Western, A.W.; Leaney, F.W. Water sources accessed by arid zone riparian trees in highly saline environments, Australia. Oecologia 2008, 156, 43–52. [Google Scholar] [CrossRef]
  11. Chen, Y.N.; Li, W.H.; Zhou, H.H.; Chen, Y.P.; Hao, X.M.; Fu, A.H.; Ma, J.X. Analysis of water use strategies of the desert riparian forest plant community in inland rivers of two arid regions in northwestern China. Biogeosci. Discuss. 2014, 11, 14819–14856. [Google Scholar]
  12. Li, Y.; Ma, Y.; Song, X.; Wang, L.; Yang, L.; Li, X.; Li, B. Contrasting water use characteristics of riparian trees under different water tables along a losing river. J. Hydrol. 2022, 611, 128017. [Google Scholar] [CrossRef]
  13. Wang, P.; Liu, W.; Zhang, J.; Yang, B.; Singh, A.K.; Wu, J.; Jiang, X.J.E. Seasonal and spatial variations of water use among riparian vegetation in tropical monsoon region of SW China. Ecohydrology 2019, 12, e2085. [Google Scholar] [CrossRef]
  14. Ellsworth, P.Z.; Williams, D.G. Hydrogen isotope fractionation during water uptake by woody xerophytes. Plant Soil 2007, 291, 93–107. [Google Scholar] [CrossRef]
  15. Zimmermann, U.; Münnich, K.; Roether, W.; Kreutz, W.; Schubach, K.; Siegel, O. Tracers determine movement of soil moisture and evapotranspiration. Science 1966, 152, 346–347. [Google Scholar] [CrossRef]
  16. Rothfuss, Y.; Javaux, M. Reviews and syntheses: Isotopic approaches to quantify root water uptake: A review and comparison of methods. Biogeosciences 2017, 14, 2199–2224. [Google Scholar] [CrossRef] [Green Version]
  17. Hao, S.; Li, F. Water sources of the typical desert vegetation in Ebinur Lake basin. Acta Geogr. Sin. 2021, 76, 1649–1661. [Google Scholar] [CrossRef]
  18. Miguez-Macho, G.; Fan, Y. Spatiotemporal origin of soil water taken up by vegetation. Nature 2021, 598, 624–628. [Google Scholar] [CrossRef]
  19. Dawson, T.E.; Ehleringer, J.R. Streamside trees that do not use stream water. Nature 1991, 350, 335–337. [Google Scholar] [CrossRef]
  20. Holland, K.L.; Charles, A.H.; Jolly, I.D.; Overton, I.C.; Gehrig, S.; Simmons, C.T. Effectiveness of artificial watering of a semi-arid saline wetland for managing riparian vegetation health. Hydrol. Process. 2009, 23, 3474–3484. [Google Scholar] [CrossRef]
  21. Si, J.; Feng, Q.; Cao, S.; Yu, T.; Zhao, C. Water use sources of desert riparian Populus euphratica forests. Environ. Monit. Assess. 2014, 186, 5469–5477. [Google Scholar] [CrossRef] [PubMed]
  22. Rao, W.; Chen, X.; Meredith, K.T.; Tan, H.; Gao, M.; Liu, J. Water uptake of riparian plants in the lower Lhasa River Basin, South Tibetan Plateau using stable water isotopes. Hydrol. Process. 2020, 34, 3492–3505. [Google Scholar] [CrossRef]
  23. Wu, H.; Zhao, G.; Li, X.-Y.; Wang, Y.; He, B.; Jiang, Z.; Zhang, S.; Sun, W. Identifying water sources used by alpine riparian plants in a restoration zone on the Qinghai-Tibet Plateau: Evidence from stable isotopes. Sci. Total Environ. 2019, 697, 134092. [Google Scholar] [CrossRef] [PubMed]
  24. O’Grady, A.; Cook, P.; Eamus, D.; Duguid, A.; Wischusen, J.; Fass, T.; Worldege, D. Convergence of tree water use within an arid-zone woodland. Oecologia 2009, 160, 643–655. [Google Scholar] [CrossRef] [PubMed]
  25. Wu, X.; Niu, Y.B.; Xun, M.Y.; Jin, J.Y. Responses of water source to seasonal drought of dominant afforestation tree species in the loess hilly region of China. Acta Ecol. Sin. 2022, 42, 4101–4112. [Google Scholar]
  26. Smith, S.D.; Wellington, A.B.; Nachlinger, J.L.; Fox, C.A. Functional responses of riparian vegetation to streamflow diversion in the eastern Sierra Nevada. Ecol. Appl. 1991, 1, 89–97. [Google Scholar] [CrossRef]
  27. Wang, J.; Fu, B.; Lu, N.; Zhang, L. Seasonal variation in water uptake patterns of three plant species based on stable isotopes in the semi-arid Loess Plateau. Sci. Total Environ. 2017, 609, 27–37. [Google Scholar] [CrossRef]
  28. Stromberg, J.C.; Bagstad, K.J.; Leenhouts, J.M.; Lite, S.J.; Makings, E. Effects of stream flow intermittency on riparian vegetation of a semiarid region river (San Pedro River, Arizona). River Res. Appl. 2005, 21, 925–938. [Google Scholar] [CrossRef]
  29. Wuchao, Y.; Fengmei, J.; Yajun, S.; Zhi, L. Runoff change controlled by combined effects of multiple environmental factors in a headwater catchment with cold and arid climate in northwest China. Sci. Total Environ. 2021, 756, 143995. [Google Scholar]
  30. Yang, G.; Xue, L.; He, X.; Wang, C.; Long, A.H. Change in land use and evapotranspiration in the Manas River Basin, China with long-term water-saving measures. Sci. Rep. 2017, 7, 1–10. [Google Scholar] [CrossRef] [Green Version]
  31. Yang, G.; Chen, D.; He, X.; Long, A.; Yang, M.; Li, X. Land use change characteristics affected by water saving practices in Manas River Basin, China using Landsat satellite images. Int. J. Agric. Biol. Eng. 2017, 10, 123–133. [Google Scholar]
  32. Wang, Z.; Wang, W.; Zhang, Z.; Hou, X.; Ma, Z.; Chen, B.J.G.E. River-groundwater interaction affected species composition and diversity perpendicular to a regulated river in an arid riparian zone. Glob. Ecol. Conserv. 2021, 27, e01595. [Google Scholar] [CrossRef]
  33. Liu, J.; Yan, P.; Zhai, W.; Jiang, J. Floristic characteristics of seed plants in low mountain deserts in the upper and middle reaches of the Manas River in Xinjiang. Pratac. Sci. 2019, 36, 83–92. [Google Scholar]
  34. Wang, Z.; Wang, W.; Zhang, Z.; Hou, X.; Duan, L.; Yao, D. Assessment of the effect of water-table depth on riparian vegetation along the middle and lower reaches of the Manasi River, Northwest China. Hydrol. J. 2021, 29, 579–589. [Google Scholar] [CrossRef]
  35. Wang, J.; Liang, X.; Liu, Y.; Jin, M.; Knappett, P.S.; Liu, Y. Hydrogeochemical evolution along groundwater flow paths in the Manas River Basin, Northwest China. Groundwater 2019, 57, 575–589. [Google Scholar] [CrossRef]
  36. Wang, Z. The Effect of River-Groundwater Interaction on Riparianplants Ecology in Manasi River Baisn; Chang’an University: Xi’an, China, 2021. [Google Scholar]
  37. De la Casa, J.; Barbeta, A.; Rodríguez-Uña, A.; Wingate, L.; Ogée, J.; Gimeno, T. Isotopic offsets between bulk plant water and its sources are larger in cool and wet environments. Hydrol. Earth Syst. Sci. 2022, 26, 4125–4146. [Google Scholar] [CrossRef]
  38. Li, Y.; Ma, Y.; Song, X.; Wang, L.; Han, D. A δ2H offset correction method for quantifying root water uptake of riparian trees. J. Hydrol. 2021, 593, 125811. [Google Scholar] [CrossRef]
  39. Stock, B.C.; Jackson, A.L.; Ward, E.J.; Parnell, A.C.; Phillips, D.L.; Semmens, B.X. Analyzing mixing systems using a new generation of Bayesian tracer mixing models. PeerJ 2018, 6, e5096. [Google Scholar] [CrossRef]
  40. Colwell, R.K.; Futuyma, D.J. On the measurement of niche breadth and overlap. Ecol. Lett. 1971, 52, 567–576. [Google Scholar] [CrossRef]
  41. Wang, S.; Zhang, M.; Hughes, C.E.; Zhu, X.; Dong, L.; Ren, Z.; Chen, F. Factors controlling stable isotope composition of precipitation in arid conditions: An observation network in the Tianshan Mountains, central Asia. Tellus B Chem. Phys. Meteorol. 2016, 68, 26206. [Google Scholar] [CrossRef] [Green Version]
  42. Liu, X.; Rao, Z.; Zhang, X.; Huang, W.; Chen, J.; Chen, F. Variations in the oxygen isotopic composition of precipitation in the Tianshan Mountains region and their significance for the Westerly circulation. J. Geogr. Sci. 2015, 25, 801–816. [Google Scholar] [CrossRef]
  43. Li, X.F.; Zhang, M.J.; Li, Y.J.; Wang, S.J.; Huang, X.Y.; Ma, Q.; Ma, X.N. Characteristics of δ18O in Precipitation and Moisture Transports over the Arid Region in Northwest China. Environ. Sci. 2012, 33, 711–719. [Google Scholar]
  44. Chen, X.; Wang, G.; Wang, F. Classification of Stable Isotopes and Identification of Water Replenishment in the Naqu River Basin, Qinghai-Tibet Plateau. Water 2019, 11, 46. [Google Scholar] [CrossRef] [Green Version]
  45. Zhu, S.D.; Zhang, F.; Zhang, Z.U.; Kung, H.T.; Yushanjiang, A. Hydrogen and Oxygen Isotope Composition and Water Quality Evaluation for Different Water Bodies in the Ebinur Lake Watershed, Northwestern China. Water 2019, 11, 2067. [Google Scholar] [CrossRef] [Green Version]
  46. Bailing, F.; Dong, Z.; Zhenghua, T.; Zhiqi, Z. Compositions of hydrogen and oxygen isotope values of Yellow River water and the response to climate change. Chin. Environ. Sci. 2017, 37, 9. [Google Scholar]
  47. Freitas, J.G.; Furquim, S.A.C.; Aravena, R.; Cardoso, E.L. Interaction between lakes’ surface water and groundwater in the Pantanal wetland, Brazil. Environ. Earth Sci. 2019, 78, 139. [Google Scholar] [CrossRef]
  48. Darling, W.G.; Bath, A.H.; Talbot, J.C. The O and H stable isotope composition of freshwaters in the British Isles. 2. Surface waters and groundwater. Hydrol. Earth Syst. Sci. 2003, 7, 183–195. [Google Scholar] [CrossRef] [Green Version]
  49. Ma, B.; Jin, M.; Liang, X.; Li, J. Groundwater mixing and mineralization processes in a mountain–oasis–desert basin, northwest China: Hydrogeochemistry and environmental tracer indicators. Hydrol. J. 2018, 26, 233–250. [Google Scholar] [CrossRef]
  50. Wang, J.; Liang, X.; Ma, B.; Liu, Y.; Jin, M.; Knappett, P.S.K.; Liu, Y. Using isotopes and hydrogeochemistry to characterize groundwater flow systems within intensively pumped aquifers in an arid inland basin, Northwest China. J. Hydrol. 2021, 595, 126048. [Google Scholar] [CrossRef]
  51. Canham, C.A.; Duvert, C.; Beesley, L.S.; Douglas, M.M.; Setterfield, S.A.; Freestone, F.L.; Clohessy, S.; Loomes, R.C. The use of regional and alluvial groundwater by riparian trees in the wet-dry tropics of northern Australia. Hydrol. Process. 2021, 35, e14180. [Google Scholar] [CrossRef]
  52. Qing, X.; Ting, W.; Deqiang, G. Application of Carbon, Hydrogen and Oxygen Stable Isotope on Hydrologic Cycle of Grassland Ecosystem: A Review. For. Res. 2019, 32, 130–136. [Google Scholar]
  53. Li, Y.F.; Yu, J.J.; Kai, L.; Wang, P. Water sources of Populus euphratica and Tamarix ramosissima in Ejina Delta, the lower reaches of the Heihe River, China. Chin. J. Plant Ecol. 2017, 41, 519–528. [Google Scholar]
  54. Gazis, C.; Feng, X.H. A stable isotope study of soil water: Evidence for mixing and preferential flow paths. Geoderma 2004, 119, 97–111. [Google Scholar] [CrossRef]
  55. Landgraf, J.; Tetzlaff, D.; Dubbert, M.; Dubbert, D.; Smith, A.; Soulsby, C. Xylem water in riparian willow trees (Salix alba) reveals shallow sources of root water uptake by in situ monitoring of stable water isotopes. Hydrol. Earth Syst. Sci. 2022, 26, 2073–2092. [Google Scholar] [CrossRef]
  56. Chen, Y.N.; Li, W.H.; Chen, Y.P.; Zhou, H.H.; Hao, X.M.; Zhu, C.G. Water Use Process of Constructive Plants in Desert Riparian Forest. Arid Zone Res. 2018, 35, 130–136. [Google Scholar]
  57. Wang, Y.; Chen, M.; Yan, L.; Yang, G.; Ma, J.; Deng, W. Quantifying Threshold Water Tables for Ecological Restoration in Arid Northwestern China. Groundwater 2020, 58, 132–142. [Google Scholar] [CrossRef]
  58. Yong, W.; Chengyi, Z.; Dandan, W.; Sihua, F. Water Use Strategies of Populus euphratica and Tamarix ramosissima at Different Ages in Tarim River Basin. J. Soiland Water Conserv. 2017, 31, 157–163. [Google Scholar]
  59. Song, T.H.; Ge, M.J.; Yang, J.M.; Zhang, D.; Li, Y.Z.; Liu, J.T.; Yu, J.B.; Guan, B. Stable isotope analysis of water use sources of Phrag·matis australis in heterogeneous water-salt habitats in the Yellow River Delta. Chin. J. Ecol. 2022, 41, 10. [Google Scholar]
  60. Qi, J.; Markewitz, D.; Radcliffe, D. Modelling the effect of changing precipitation inputs on deep soil water utilization. Hydrol. Process. 2018, 32, 672–686. [Google Scholar] [CrossRef]
  61. Jiang, L.X.; Li, Y. Comparison on Architecture Characteristics of Root Systems and Leaf Traits for Three Desert Shrubs Adapted to Arid Habitat. Acta Ecol. Sin. 2008, 28, 130–137. [Google Scholar]
  62. Xu, G.Q.; Yan, L. Roots distribution of three desert shrubs and their response to precipitation under co-occurri ng conditions. Acta Ecol. Sin. 2009, 29, 130–137. [Google Scholar]
  63. Sun, K.; Niu, J.; Wang, C.; Fu, Q.; Yang, G.; Liang, F.; Wang, Y. Effects of Different Irrigation Modes on the Growth, Physiology, Farmland Microclimate Characteristics, and Yield of Cotton in an Oasis. Water 2022, 14, 1579. [Google Scholar] [CrossRef]
  64. Liu, H.J.; Kang, Y.H. Effect of sprinkler irrigation on microclimate in the winter wheat field in the North China Plain. Agric. Water Manag. 2006, 84, 3–19. [Google Scholar] [CrossRef]
  65. Duan, D.Y.; Ouyang, H. Application of stable hydrogen and oxygen isotope in analyzing plant water use sources. Ecol. Environ. 2007, 16, 655–660. [Google Scholar]
  66. Su, P.; Zhang, M.; Qu, D.; Wang, J.; Zhang, Y.; Yao, X.; Xiao, H. Contrasting water use strategies of Tamarix ramosissima in different habitats in the Northwest of Loess Plateau, China. Water 2020, 12, 2791. [Google Scholar] [CrossRef]
  67. Wu, G.L.; Jiang, S.W.; Zhou, T.H.; Wang, D.D.; Li, J. Water Use Strategies of Seedlings of Populus euphratica and Tamarix ramosissima under Different Groundwater Depths. Arid Zone Res. 2016, 33, 8. [Google Scholar]
  68. Chen, Y.; Li, W.; Zhou, H.; Chen, Y.; Hao, X.; Fu, A.; Ma, J. Experimental study on water transport observations of desert riparian forests in the lower reaches of the Tarim River in China. Int. J. Biometeorol. 2017, 61, 1055–1062. [Google Scholar] [CrossRef]
  69. Zhang, Y.; Shen, Y.; Bai, S.; Wang, Z. Effects of the mixed on root growth and distribution of fraxinus mandshurica and larix gmelinii. Sci. Silv. Sin. 2001, 37, 16–23. [Google Scholar]
Figure 1. Locations of the sampling sites in the Manas River Basin.
Water 15 00927 g001
Figure 2. Changes of (a) daily precipitation and temperature in the study area, (b) isotope compositions in precipitation during the observation period from April to July 2022.
Water 15 00927 g002
Figure 3. Cross plots of δ18O vs. δ2H for the precipitation, soil water, surface water, groundwater, and plant water samples. The regression lines of soil water (SWLs) and precipitation (LMWLs) and their relationship with the global meteoric water line (GMWL) are also shown in the plots.
Water 15 00927 g003
Figure 4. Distribution characteristics of the δ18O and δ2H values in soil water during June 2022 (a,c) and July 2022 (b,d).
Water 15 00927 g004
Figure 5. The isotope compositions (δ2H and δ18O) of potential water sources (soil water in different layers and groundwater) at four sample sites (S1, S2, S3, and S4) during June 2022 (a) and July 2022 (b). The PWL for site S1 was fitted from 8 water sources (7 soil water data and 1 groundwater data), and the PWL for sites S2 to S4 were fitted from 10 water sources (9 soil water data and 1 groundwater data).
Water 15 00927 g005
Figure 6. δ2H values of plant xylem after PW-excess corrections. δ2Ho represents the original δ2H value measured experimentally, and δ2Hm represents the δ2H value corrected by PW-excess.
Water 15 00927 g006
Figure 7. Contribution percentages of potential water sources to T. ramosissima (a) and P. australis (b). The numbers in the bar chart represent time (months).
Water 15 00927 g007
Table 1. The soil water content of sample sites at different periods.
Sample SiteShallow SoilMiddle SoilDeep Soil
JuneJulyJuneJulyJuneJuly
S16.50%10.94%7.84%19.56%7.91%21.58%
S25.65%3.94%3.85%5.07%12.99%7.14%
S36.25%4.29%7.91%6.03%11.95%7.70%
S44.26%2.30%5.16%2.55%6.77%2.90%
Table 2. Proportional similarity index of plants in different periods.
MonthProportional Similarity Index
S1S2S3S4
June0.8820.8850.9400.859
July0.7050.9690.8790.945
Disclaimer/Publisher’s Note: The statements, opinions and data contained in all publications are solely those of the individual author(s) and contributor(s) and not of MDPI and/or the editor(s). MDPI and/or the editor(s) disclaim responsibility for any injury to people or property resulting from any ideas, methods, instructions or products referred to in the content.

