

Impacts of Climate Change on Natural Runoff in the Yellow River Basin of China during 1961–2020

1
School of Water Conservancy Engineering, Zhengzhou University, Zhengzhou 450001, China
2
Hydrology Bureau, Yellow River Conservancy Commission, Zhengzhou 450004, China
3
Henan International Joint Laboratory of Water Cycle Simulation and Environmental Protection, Zhengzhou 450001, China
*
Author to whom correspondence should be addressed.
Water 2023, 15(5), 929; https://doi.org/10.3390/w15050929
Submission received: 10 January 2023
/
Revised: 20 February 2023
/
Accepted: 26 February 2023
/
Published: 28 February 2023
(This article belongs to the Special Issue Yellow River Basin Management under Pressure: Present State, Restoration and Protection II)
Abstract
:The change in natural runoff is highly relevant to total river flow dispatch and water resource utilization in the Yellow River Basin (YRB). Based on the annual mean temperature and total precipitation records from 70 meteorological stations from 1961–2020, the impact of climate change on the natural runoff of the YRB is investigated using the Mann-Kendall (M-K) test and Bivariate Wavelet analysis methods. Results show that the annual mean temperature over the YRB increased by 0.33 °C decade−1 during 1961–2020, with a warming rate of more than 0.40 °C decade−1 observed in its northern part. The annual total precipitation increases by 10–20 mm decade−1 in the northwest YRB, while it decreases by 20–30 mm decade−1 in the southeast YRB. The result of the M-K test shows abrupt variations in temperature and natural runoff, especially in the 1980s and 1990s. The decrease in natural runoff is closely tied to the increase (decrease) in temperature (precipitation), especially for the period 1993–2020. The bivariate wavelet coherence analysis further suggests that the decrease in the natural runoff, which has persisted over the past 60 years, is primarily driven by precipitation reduction rather than regional warming. In the stage of rapid warming, the inter-decadal influence of precipitation on natural runoff gradually changes to the influence of inter-annual fluctuation. The finding contributes to providing an important scientific basis for evaluating the optimal allocation of water resources in arid and semi-arid areas against the background of climate change.
1. Introduction
Specifically, climate change, mainly characterized by temperature rising and precipitation change, has significantly affected the water cycle process, such as the spatial-temporal distribution and the sustainable utilization of water resources [1,2,3]. In recent years, the study of water cycle change in the Yellow River Basin (YRB), characterized by the sharp decrease in river runoff, has become the focus of intense attention. The YRB is located in the central and northern parts of China and is dominated by a continental monsoon climate. It is worth emphasizing that the YRB is an important ecological barrier area and economic development area [4]. As the YRB is composed of arid, semi-arid, semi-humid, and humid geographical regions, the natural runoff varies greatly from year to year under the combined effects of land use/cover (LULC) and climate change [5]. Meanwhile, the annual runoff distribution is concentrated in summer, and the continuous drought period lasts from October to May [6,7]. The basic characteristics of the YRB result in the sensitivity and vulnerability of the water resources system to regional climate change [8,9,10]. For instance, an increase in seasonal variability of precipitation inevitably disrupts the continuous atmospheric water supply, which will directly lead to prolonged dry periods in regions with unimodal precipitation distribution [11,12]. The driving factors of runoff changes can be divided into natural and human factors. Natural factors, including precipitation reduction, temperature rise, and evapo-transpiration increase, can directly cause runoff reduction [13,14]. Under the strong interference of human activities, the characteristics of the underlying surface in the YRB dramatically changed the hydrological cycle [15,16,17], while reservoir regulation, storage, and water withdrawal directly disturbed the original runoff [1,18]. Therefore, it is of great significance for ecological protection and high-quality development of the YRB to study and understand the impacts and differences of climate change on the water cycle of the Yellow River, especially on the runoff.
Considering the particularity and importance of the YRB, more and more scholars and government decision-makers are concerned about the impact of climate change on the water resources system [19,20,21]. Studies on the impact of climate change on runoff mainly focus on the changes in temperature, precipitation, and evaporation (dispersion) in the basin caused by the global climate change system [22]. The YRB has been warming significantly since the mid-1980s, especially in the 21st century [23,24]. The sensitivity of runoff to precipitation was higher than to air temperature [20]. Some existing studies concluded that the precipitation in the YRB showed a decreasing trend after the 1980s, and the runoff decreased significantly [2,25]. Several researchers have pointed out that precipitation was the main contributing factor. The temporal and spatial changes of precipitation and its volume can significantly influence the runoff-generated process and seasonal runoff distributions [26,27,28]. Alpine runoff, as well as glacier melt water and snow melt water, sensitively responded to global warming [29,30].
To objectively understand the characteristics of climate change, we must understand the regularity of the long-term change process. Meanwhile, there are still some urgent questions about the effects of climate change and human activities on the water cycle in the YRB. Some existing studies focus on the single evolution changes of temperature, precipitation, and actual runoff, such as tendency, mutability, and periodicity [20,31,32]. In fact, human factors and natural factors cross together, and their impacts are intricate. Therefore, it is impossible to accurately determine the extent of the impact of human activities on runoff [33]. Given the significant spatial differences in climate and runoff, and considering the high degree of development and utilization of water resources, the natural runoff in our study is calculated with measured runoff plus the restored water [7]. We mainly evaluate the impact of climate change on natural runoff from the perspective of the change of water resources in the whole basin and do not discuss the classification of different hydrological cycle processes in each region.
The Mann-Kendall mutation test has been widely used to analyze the spatiotemporal variation of climate and hydrology [34]. To eliminate the statistical error caused by the in-homogeneity of the spatial distribution of stations, the area weight of a single station in the YRB was generated using the Thiessen polygon method. Meanwhile, this study tried to comprehensively analyze the climate variation and natural runoff at different periods using the bivariate wavelet coherence (BWC) analysis. Similar methods have been used to study the influence of multiple factors on extreme climatic events under climate change conditions [32]. We expect our research will provide technical support for the YRB’s water resources assessment and provide an important scientific basis for evaluating the optimal allocation of water resources in arid and semi-arid regions under climate change.
2. Materials and Methods
2.1. Study Area
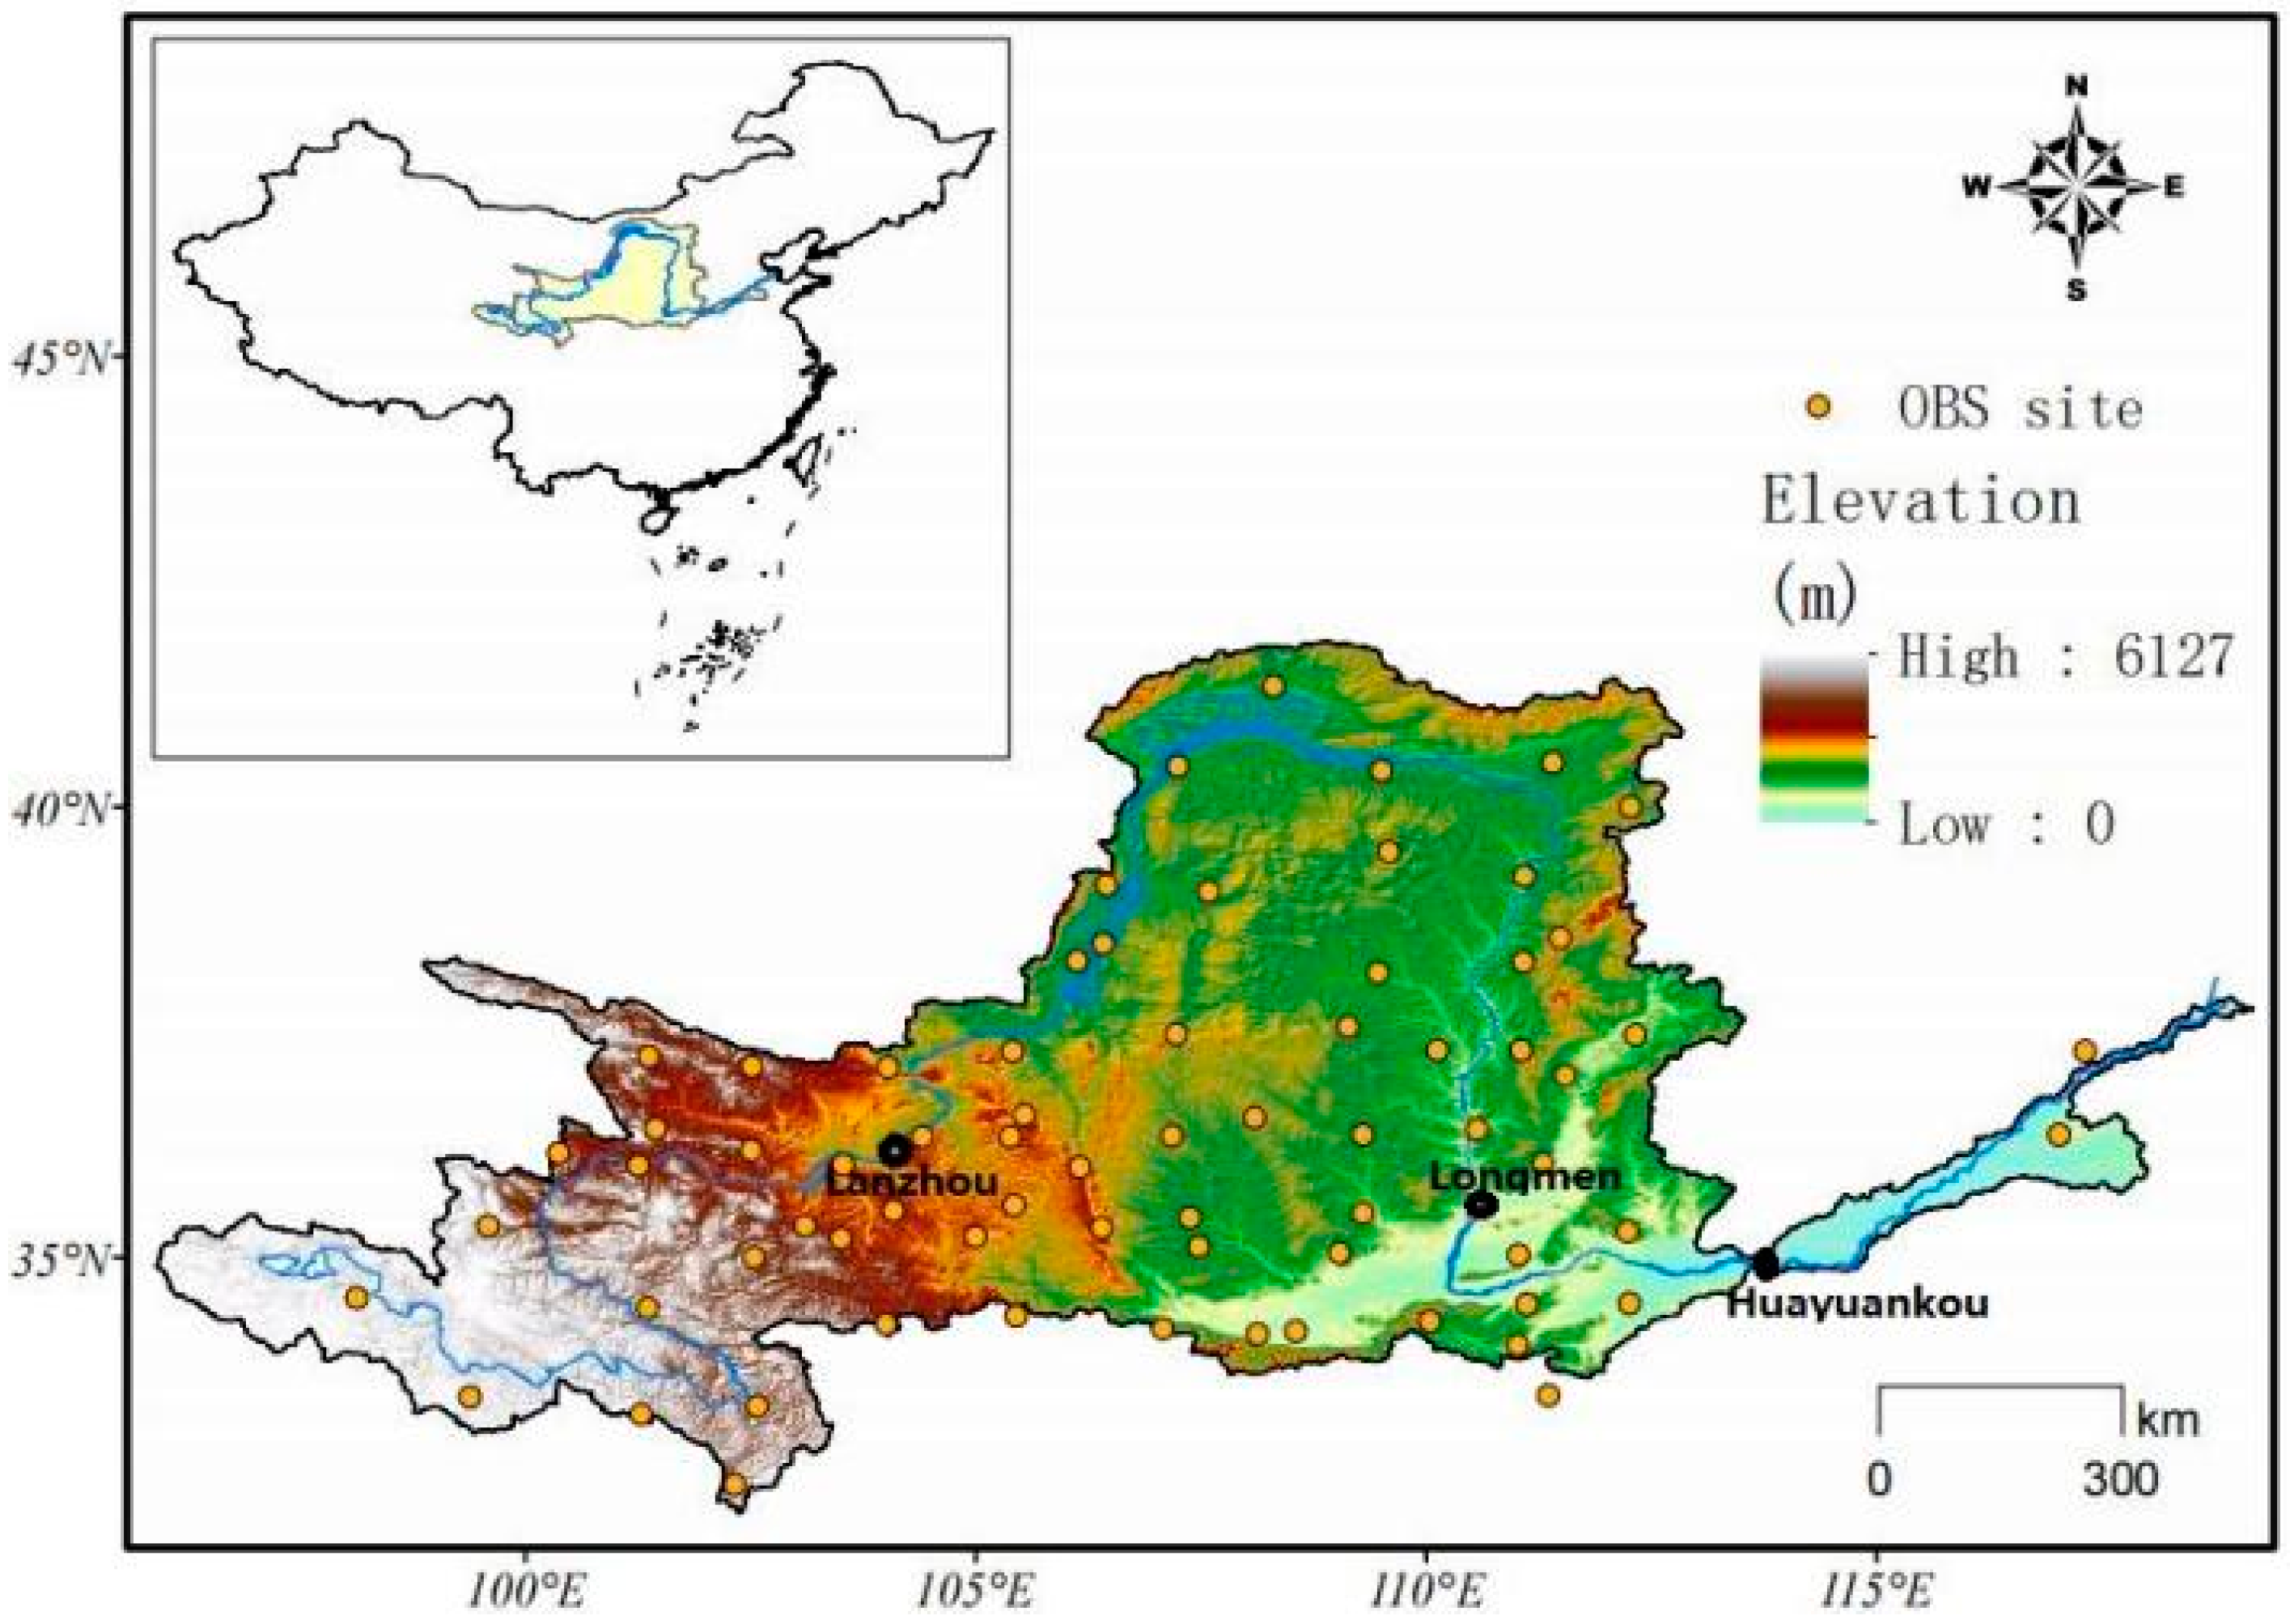
As the second longest river in China, the Yellow River originates from the Bayan Har Mountains. It flows through nine provinces and regions, with a basin area of 79.5 × 10⁴ km2, including 4.2 × 10⁴ km2 of inner flow area (Figure 1). According to the outline of the plan for ecological protection and high-quality development in the YRB issued on 8 October 2021, the population of the basin was about 160 million at the end of 2019. Therefore, the importance of water resources to the social and economic development of the basin is self-evident.
The YRB spans the three steps of China’s terrain, and the climate is different in each water resource area. Above Lanzhou, the main flow-producing area of the Yellow River is located in the humid, semi-humid, and semi-arid areas of the Qinghai-Tibet Plateau, mainly supplied by melting water of snow and ice and precipitation. The runoff section from Lanzhou to the Longmen Hydrology Station is small because of the large evaporation and small precipitation. From Longmen to the Huayuankou Hydrology Station is the sub-humid area with abundant precipitation recharge, large yield, and discharge.
2.2. Data
The annual mean temperature and total precipitation data of 86 meteorological stations in the YRB were collected and sorted out. The observation data were obtained from the National Meteorological Information Center. The stations with short observation series and many missing data were excluded. The series of 70 stations, from 1961 to 2020, were retained after strict quality control (Figure 1).
Huayuankou is an important hydrological station in the YRB. It plays a very important role in flood control dispatching, unified management of water resources, river treatment, and experimental research on the Yellow River. The natural runoff data of Huayuankou was chosen from the YRB Water Resources Bulletin. Considering the high degree of development and utilization of water resources, the natural runoff is the sum of measured runoff at Huayuankou station and the restored water above Huayuankou station. It includes the water consumption of surface water and the water storage of reservoirs to exclude the influence of human activities. The natural runoff of Huayuankou Station accounts for 99% of the whole river, and the river channels below it are basically overhanging rivers with small runoff-producing and confluence areas. Therefore, the variation of the natural runoff of Huayuankou station can represent the whole runoff of the YRB [7].
2.3. Thiessen Polygon Method
Primarily, the missing data of individual stations are interpolated using the same trend change method of adjacent stations. The formula is as follows:
where is the increment of annual precipitation (anomaly percentage) and temperature (°C) data of unmeasured stations, and n is the number of stations participating in calculation; ,, …, is the increment of precipitation and temperature data of each station participating in the calculation during the same period.
To eliminate the statistical error caused by the in-homogeneity of the spatial distribution of stations, the area weight of a single station in the YRB was generated using the Thiessen polygon method, and the area weight of a single station was used to construct the watershed time series. According to the network of stations in the computation area, each station is connected to several non-nested triangles, and the triangles formed are acute as far as possible. Find the center of gravity (the intersection of the perpendicular bisectors of the three sides of a triangle) for each triangle. Using the center of gravity of these triangles, the computing area can be divided into several computing units, ensuring that there is a station near the center of each computing unit. It is assumed that the precipitation/temperature distribution of the resulting cell is uniform and can be represented by the measured values of the stations. The calculation formula of the Thiessen polygon is:
where ai is the area of the ith Thiessen polygon, namely the ith computing unit; pi is the precipitation or temperature of the ith Thiessen polygon, namely the ith computing unit. n is the number of Thiessen polygons in the region, and A is the area. The calculation of Thiessen polygons is achieved through the ArcGIS Toolbox.
Furthermore, the linear tendency estimation method is used to analyze the linear trend of temperature and precipitation, and Kriging interpolation is used for spatial distribution analysis.
2.4. Mann-Kendall Method
The Mann-Kendall mutation detection method is a non-parametric test recommended by the WMO and is widely used in trend analysis of hydro-meteorological events [34,35]. The Mann-Kendall test does not require samples to follow a certain distribution, nor is it disturbed by a few outliers. It is suitable for data with non-normal distribution, such as hydrology and meteorology. In this paper, the Mann-Kendall method is used to analyze the trend and abrupt characteristics of annual mean temperature, annual total precipitation, and annual natural runoff time series.
For the time series X with n sample sizes, an order column is constructed as follows:
The order column Sk is the cumulative count of the number of values at time i greater than at time j. When k = 1, S1 = 0. Under the assumption of random independence of time series, the statistics are defined as follows:
where UF1 = 0, E(Sk) and Var(Sk) are the mean and variance of the accumulated count Sk. X1, X2 …, Xn are independent of each other and have the same continuous distribution; they can be calculated by the following formula:
UF is the standard normal distribution, according to the time series X1, X2, …, Xn computed sequence of statistics. In reverse order Xn, Xn−1, …, X1, repeat the above process to construct the reverse sequence UB. A UF value greater than 0 indicates an upward trend, while UF value less than 0 indicates a downward trend. When they exceed the critical confidence level line (test confidence level α = 0.05, the confidence level line is ±1.96), indicating a significant upward or downward trend, the range beyond the critical line is determined as the time region where the sudden change occurred. If the UF and UB curves intersect and the intersection point is between the critical line, then the time corresponding to the intersection point is when the mutation starts.
2.5. Bivariate Wavelet Coherence Method
Bivariate Wavelet Coherence (BWC) is a new multi-scale analysis technique developed based on traditional wavelet analysis [36,37]. It can not only analyze the correlation degree between two time series effectively but also reflect the phase structure and detail characteristics in the time and frequency scale.
Assume a response variable Y and one predictor variable X, the multiple wavelet coherence at scale s and time series t, ρ2(s,t), can be written as:
where , , are the matrix of the smoothed cross wavelet power spectra between response variable Y and predictor variable X, the matrix of the smoothed auto and cross wavelet power spectra between predictor variable X, and the smoothed wavelet power spectrum of response variable Y, respectively.
where lm and Re denote the imaginary and real parts of , respectively. In this paper, BWC is applied to the correlation analysis of natural runoff with temperature and precipitation, and the correlation and phase change between hydrological series at different scales are discussed. The BWC at a 95% significance level is calculated using the Monte Carlo method [37].
3. Results and Discussion
3.1. Spatial Distribution Characteristic of Temperature
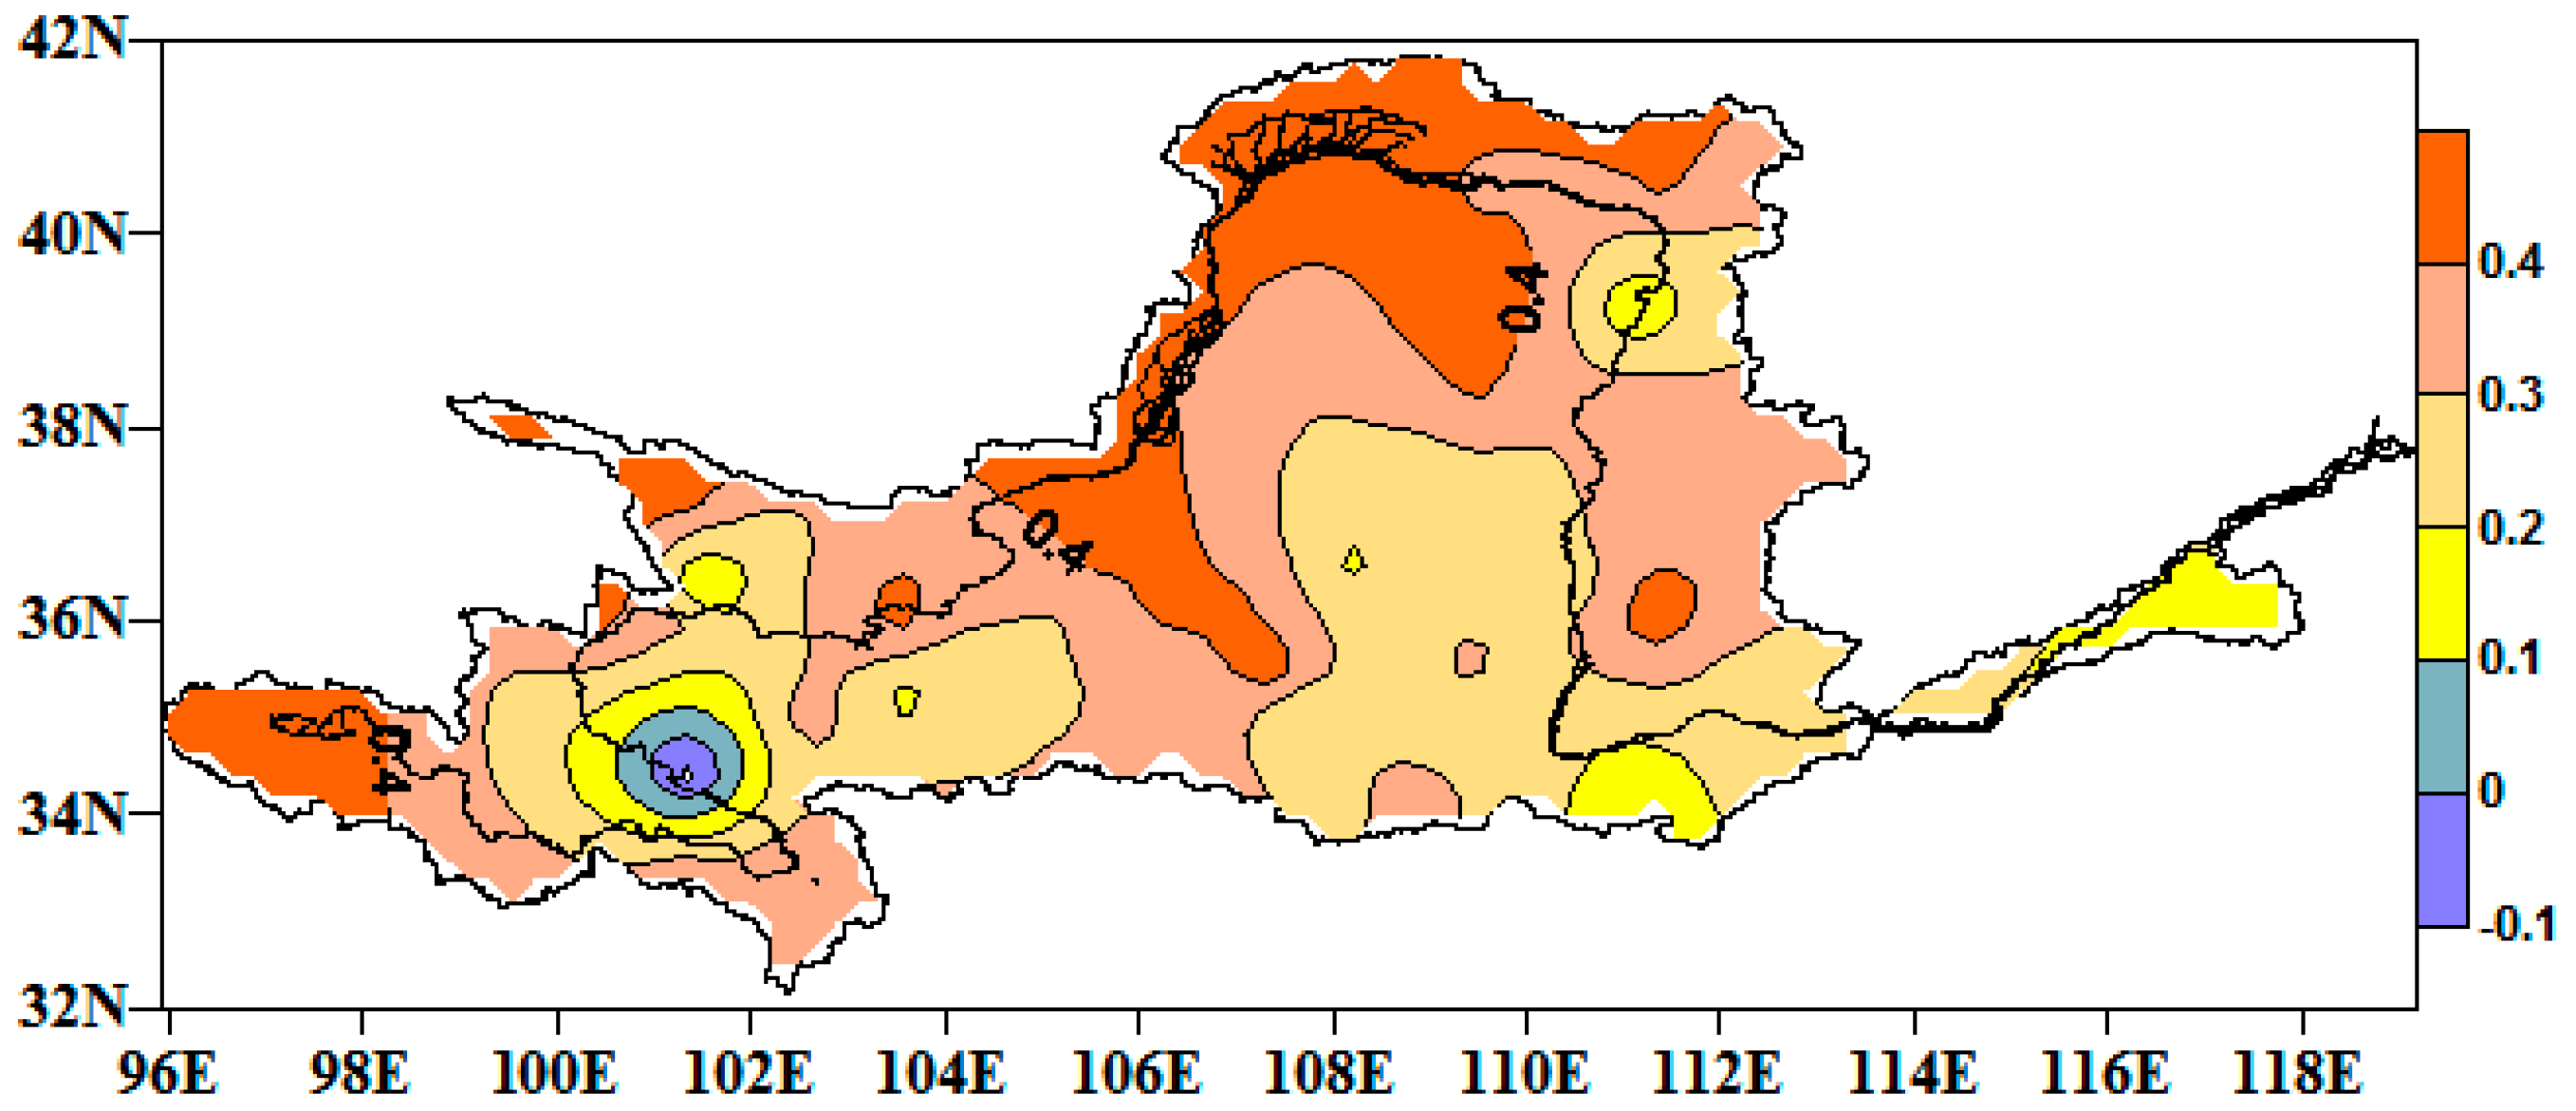
Based on the observation data of stations, Kriging interpolation technology was applied to make clear the spatial distribution of temperature, as shown in Figure 2. From the spatial scale, most areas of the YRB showed a warming trend of 0.33 °C decade−1 during 1961–2020. The temperature variation is consistent with the basic trend of global warming [38]. It is worth emphasizing that the warming trend above Lanzhou primarily shows a weak positive warming trend and a negative trend in some areas. Climate warming directly causes a decrease in the freezer area and consequently increases sensible heat [39]. Whereas, with a high flow year in the source region, the warming trend in some areas is delayed or negative. The warming trend in Ningxia and Inner Mongolia is significant. Most areas are more than 0.40 °C decade−1, or even 0.52 °C decade−1. This is mainly because these regions are the inner flow areas of the YRB, located in arid and semi-arid desert regions, and the annual total precipitation is deficient. Most areas below Longmen Hydrological Station are monsoon areas with abundant precipitation, leading to a small temperature increase.
3.2. Spatial Distribution Characteristic of Precipitation
Figure 3 shows the spatial distribution of the decadal trend coefficient of annual total precipitation in the YRB. The change in precipitation mainly showed an increasing trend in the upstream region and a decreasing trend in the middle and lower reaches. As the main water source, the precipitation in the area above Lanzhou showed an increasing trend with a rate of 0–20 mm decade−1. There is an increasing trend with a rate of 0–10 mm decade−1 of precipitation over the northern YRB. Meanwhile, these areas are also the region with the most significant warming, called warm, humid zones [40,41]. In fact, studies have suggested that the temperature increase is much more complicated than precipitation. Rehfeld et al. [42] argue that temperature and precipitation have different response relationships on different time scales, with warm-dry matching on inter-annual and chronological scales, and possibly warm-wet matching on longer time scales. However, the decrease in regional surface water resources caused by the increase in temperature is much greater than the increase in surface water resources caused by increased precipitation [43]. Moreover, this area is the inner flow area of the YRB and is the main source of sand. If not for the heavy precipitation process, not much flow is generated throughout the year.
Precipitation decreases most seriously from the Longmen Hydrological Station to the Huayuankou Hydrological Station, with a decreasing rate of 10–30 mm decade−1. This implies that an obvious decrease in precipitation has a significant impact on regional runoff, and even the flow of some tributaries can be frequently cut off during flood season. As global warming increases, the likelihood of complex extreme events in these regions will increase (high reliability) [44]. In particular, composite heat and drought events may become more frequent. The above results can provide data support for regional development planning in light of the spatial differences and avoiding various kinds of climate risk.
3.3. Temporal Variation
From the time scale perspective, the annual mean temperature of the YRB was 7.21 °C during 1961–2020. The lowest annual mean temperature of 5.88 °C occurred in 1967, and the highest annual mean temperature is 8.38 °C occurred in 2006. The annual mean temperature of the YRB shows a significant rising trend, with a warming rate of 0.33 °C/decade (Figure 2). The annual mean temperature of the YRB has shown a warming trend since the 1960s, and the warming trend is most obvious in the 1990s, with an increment of 0.59 °C compared with that in the 1980s (Table 1). It is worth mentioning that the temperature showed an upward trend during the whole period and passed the 95% significance test. The study also shows that the warming period since the 1990s has been the longest and steepest in nearly a century, masking natural fluctuations in temperature [45].
The average annual total precipitation in the YRB is 452.1 mm, which shows a decreasing trend during the study period, and the lowest precipitation of the YRB, 418.0 mm, occurred in the 1990s. Precipitation in the YRB reverted to an increase at the beginning of this century but has not recovered to the average levels of the early 1980s. According to the regression analysis of annual mean temperature and total precipitation, the annual mean temperature increased by 1 °C, and the annual total precipitation decreased by 4.8 mm. Ljungqvist et al. [46] believe that the matching relationship between temperature and precipitation is related to geography, and some areas in the same period are warm and dry matching, while others may be warm and wet matching. As northwest China spans the northern edge line of the East Asian summer wind, and the weather is affected by the East Asian summer wind, westerly wind, and plateau system, the influence mechanism of precipitation will be more complex [47], which can not be summarized by a simple temperature and humidity matching relationship. Many problems need more in-depth scientific discussion.
As the development and utilization of water resources in the YRB have developed rapidly, the contradiction between supply and demand has become increasingly prominent since the 1970s [44,48]. According to our statistics, there were 22 years of dry flow in the lower reaches of the YRB during 1972–1999. Especially in the 1990s, the precipitation of the Yellow River was significantly less, directly leading to the lowest natural runoff. There was 17.7 billion m3 less than in the 1980s, largely due to the rapid increase in temperature and the significant decrease in precipitation during this period, as we analyzed above. The results also show that under the influence of the variation of the East Asian summer monsoon precipitation in northern China has shown a significant decreasing trend since the 1980s [49]. The declining trend of average natural net discharge in the region accelerated twice in the 1970s and 1990s, corresponding to the construction of large-scale soil and water conservation measures and the implementation of the ecological management project of returning farmland to forest and grassland in 1999 [50]. From 2011 to 2020, the precipitation of the YRB was 484.7 mm, the largest of all years and 11.5 mm more than that of the 1960s, but the natural runoff was 11.42 billion m3 less than that of the 1960s.
3.4. Mutation Test Results
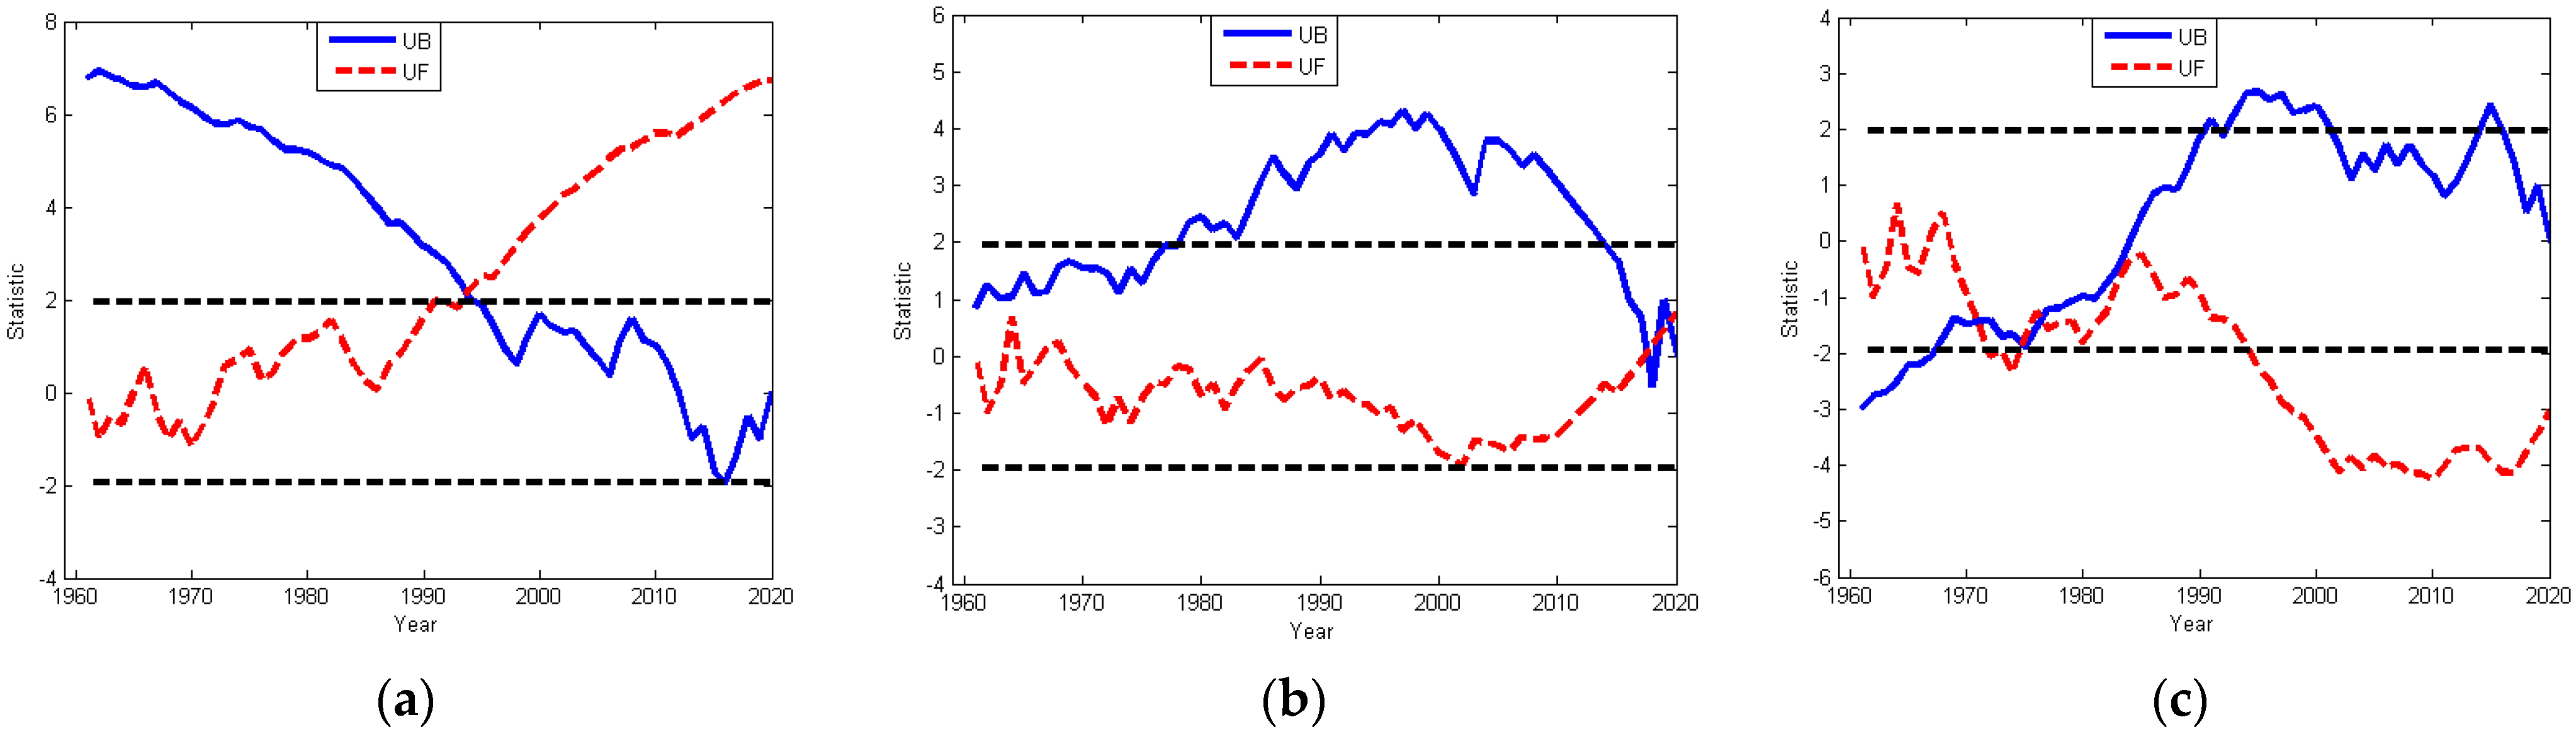
The mutation characteristic of climate elements and natural runoff can be found in Figure 4. The two black dotted lines represent a given level of significance (α = 0.05), and the confidence level line is ±1.96.
Overall, the annual mean temperature of the YRB showed an upward trend before 1965 that continued to increase from 1974 to 1987. The temperature increased significantly during 1988–2020, and an abrupt change occurred in 1991 without mutation.
The phenomenon of annual total precipitation is quite different from that of annual mean temperature. The UF curve of annual total precipitation shows three stages and fluctuates mainly around the zero line. The annual total precipitation of the YRB increased slightly before 1968 and decreased significantly from 1969 to 2018, with an abrupt change occurring in 2018. However, the annual total precipitation did not pass the significance test during 1961–2020.
The UF and UB curves in natural runoff have more intersections compared with temperature and precipitation, which are all located between the two critical lines. The natural runoff of the YRB increased before 1968, consistent with precipitation changes. The abrupt change of the natural runoff took place 3 times, in 1971, 1975, and 1977. This was mainly affected by the obvious rise in temperature and continuous decrease in precipitation. From 1995 to 2002, the natural runoff decreased significantly, and it passed the significance test of 0.05. During this period, the annual mean temperature increased significantly (α = 0.05), and the precipitation decreased more obviously than that in the 1970s. According to our statistics, there were 22 years of dry flow in the lower reaches of the YRB during 1972–1999. It also could be determined that the natural runoff decreased significantly from 2003 to 2017 and slightly increased after 2018, mainly affected by the increment of precipitation during 2018–2020. To a large extent, the decrease in precipitation was the main cause of the water resource shortage.
3.5. Bivariate Wavelet Coherence Analysis Results
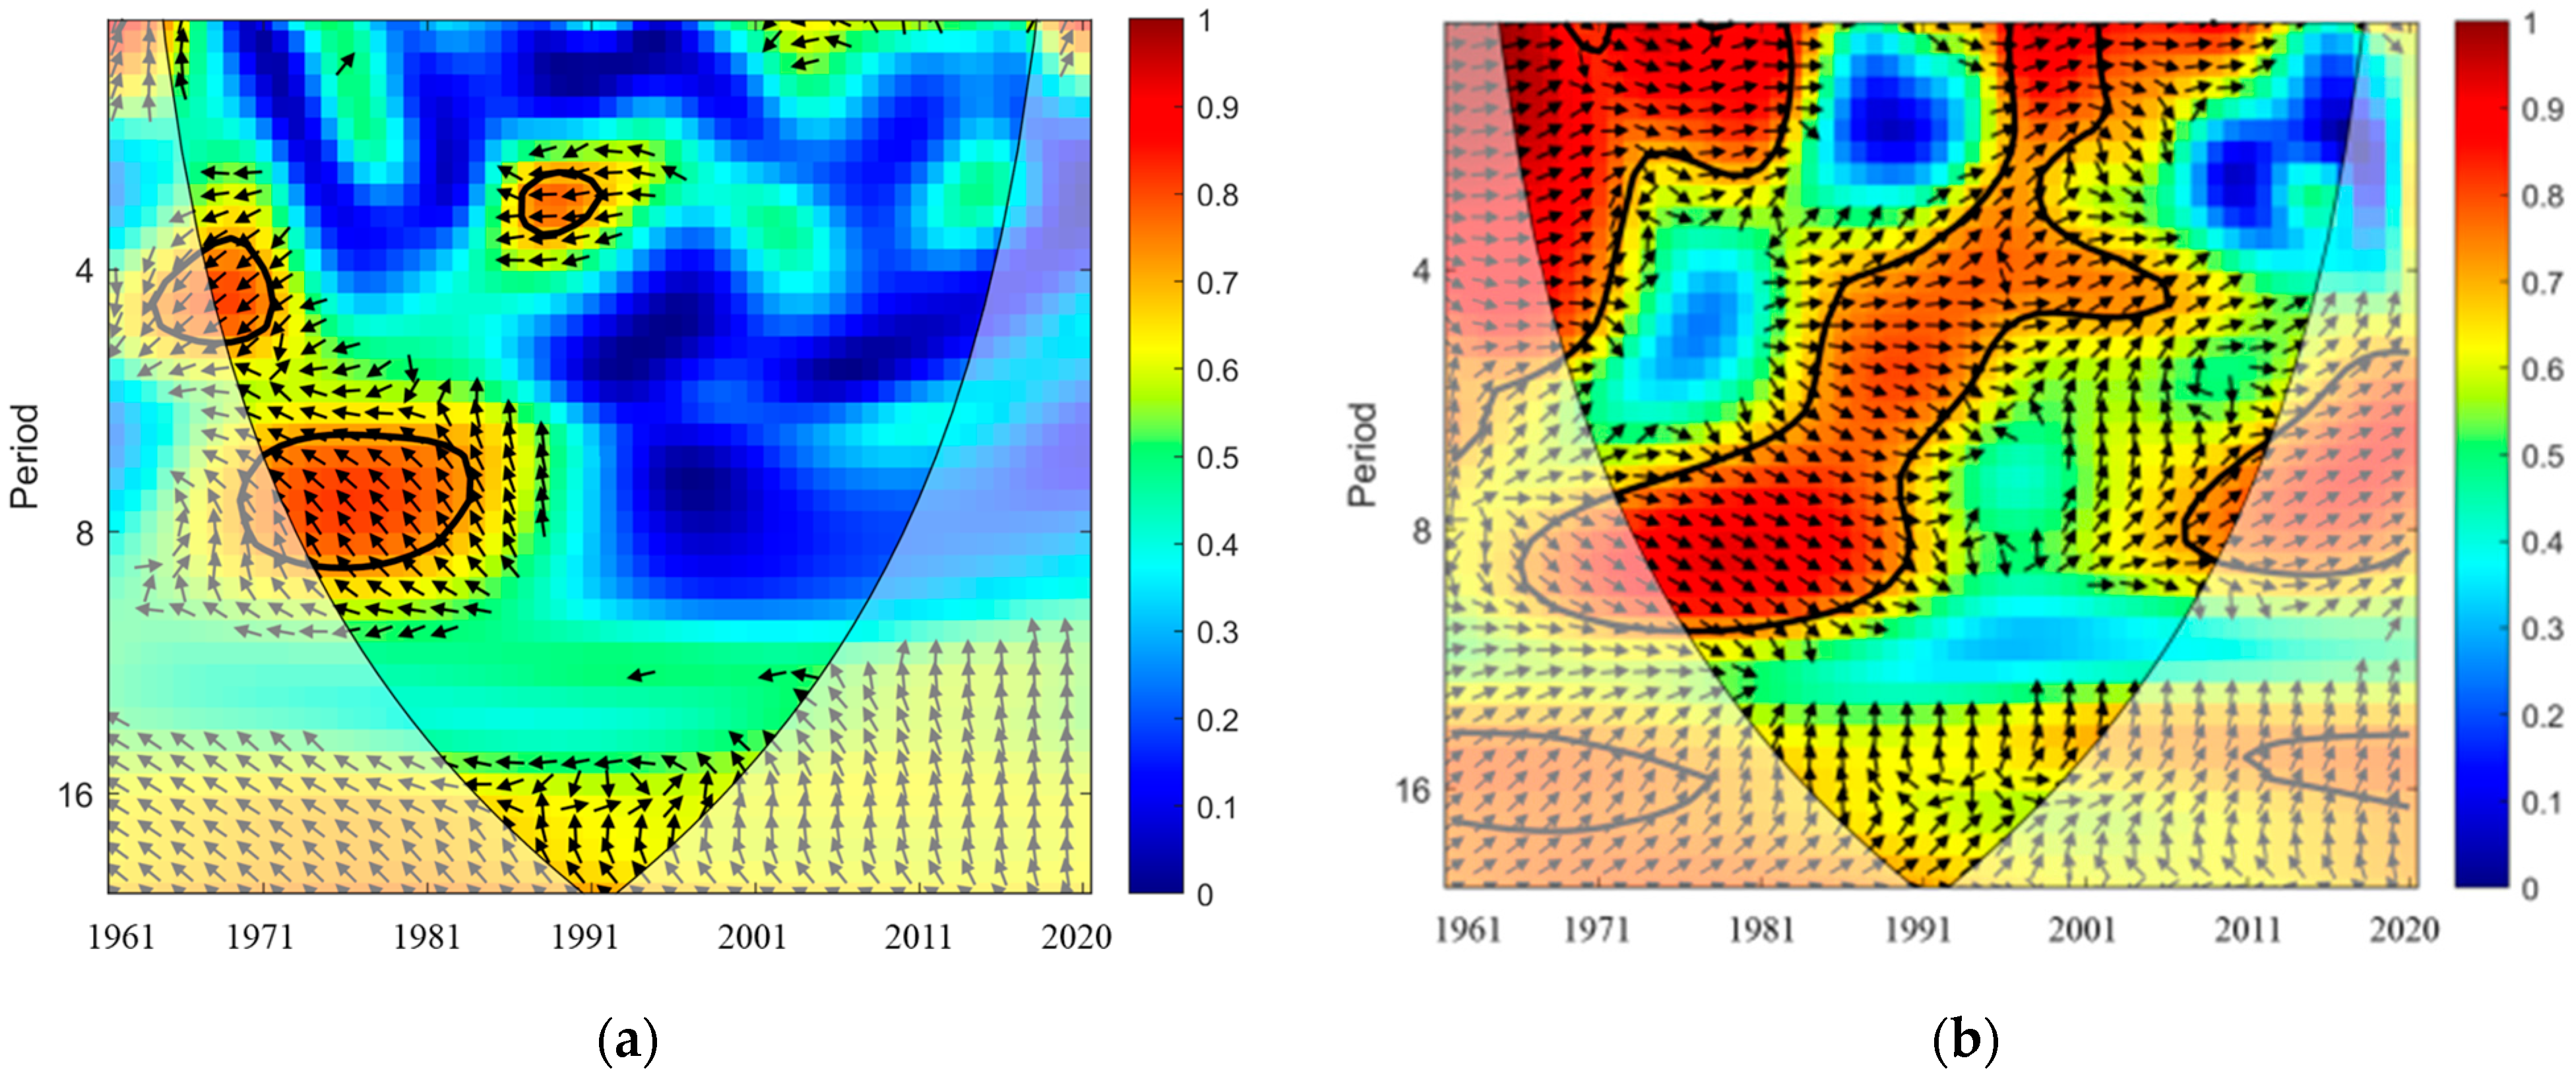
The bivariate wavelet coherence (BWC) synthesis reflects the dependence of correlation on time and frequency. The BWC condensation spectrum of selected driving forces and the natural runoff is shown in Figure 5. The area with a thick solid line represents the test of the standard spectrum of red noise, past the significance level α = 0.05. The red areas indicate that the correlation between the two aspects is strong, and its intensity varies with the shade of color, while the blue areas are the opposite. The arrow represents the phase relationship between the two factors. "→" represents the in-phase relationship between the impact factor and natural runoff, and "←” denotes the inverse phase. To avoid boundary effect and wavelet high-frequency false information, the area within the influence cone of the wavelet (arc line in the figure) is the effective spectral value.
Overall, there is a certain correlation between annual natural runoff and mean temperature at different time scales (Figure 5a). For the annual mean temperature, the significant negative correlation with natural runoff shows in the resonance period of 4–8 years. The correlation oscillation of 4–7 years in the time domain mainly occurs in 1961–1985. According to the regression analysis of annual mean temperature and runoff, the annual mean temperature increases by 1 °C, and the natural runoff decreases by 9.63 billion m3. Therefore, to a large extent, the temperature increase is the necessary condition for runoff reduction. The annual mean temperature has no significant effect on natural runoff since 1985. The annual mean temperature has only large conjugated periods with natural runoff, and the correlation is almost absent in brief periods during 1990–2020.
Compared to the temperature, it can be seen that the annual total precipitation has more conjugated periods with the annual natural runoff. During 1961–1990, the annual total precipitation has a significant positive correlation between the 0–4a period and the 8–10a period. As shows in Table 1. the changes of temperature and precipitation in the YRB during this period are insignificant. The change of natural runoff is mainly affected by the combination of temperature and precipitation. Interestingly, during 1988–2005, there is a significant positive correlation between annual precipitation and natural runoff, with a period of 6–10 years turning to 0–4 years. As shown in Table 1, the YRB shows the most significant warming during this period. However, according to the above bivariate wavelet coherence analysis of temperature and runoff, the relationship between natural runoff and temperature is insignificant. It shows that precipitation has more significant impact on natural runoff, and the resonance intensity and time domains of the annual total precipitation pass the significant test at different time series. Meanwhile, in the rapid warming stage, the inter-decadal influence of precipitation on natural runoff gradually changes to the influence of inter-annual fluctuation. After 2006, there is almost no correlation between precipitation and natural runoff on the small period scale, but a strong correlation exists on the large period scale, and the time domain of the primary resonance period is longer. The annual total precipitation has a new significant positive correlation in the 6–10a period. Although the correlation between temperature and natural runoff is insignificant, the trend of temperature increase in the YRB during this period is not obvious (Table 1). This clearly demonstrates that the impact of annual total precipitation on the annual natural runoff has good continuity, and the decrease in precipitation is a sufficient condition of natural runoff reduction as in the period from 1961–1985.
4. Conclusions
In this paper, the trend and mutation of hydro-meteorological elements in the YRB from 1961 to 2020 are analyzed using the Mann-Kendall test. The contribution of climate change to natural runoff is identified by the bivariate wavelet coherency method. The main findings are as follows:
- The natural runoff decreases significantly from 2003 to 2017 and slightly increases after 2018, mainly affected by increased precipitation as an abrupt change occurred in 2018. Compared with annual mean temperature, the positive correlation of high condensation between natural runoff and annual total precipitation is more significant, indicating that precipitation plays a leading role in the change of natural runoff.
- Through our study, we find that in the 1960s and 1970s, the natural runoff of the YRB is jointly affected by annual mean temperature and annual total precipitation when the warming effect is not obvious. When the annual mean temperature increases rapidly from the 1980s to the early 21st century, the change in natural runoff is directly affected by the amount of precipitation, and the influence of precipitation on natural runoff also shifts from the inter-decadal to the inter-annual. To some extent, this proves that with the warming of the climate, the variability of natural runoff in the YRB will become more and more frequent. This calls for higher requirements for flood control and drought relief in the YRB, as well as more specific requirements for medium and long-term precipitation forecasts. It also provides research ideas for climate change under different scenarios at a later period;
- However, the current work does not account for the direct effects of human activities on the actual runoff except regarding the restored water above Huayuankou Station, including the water consumption of surface water and the water storage of reservoirs. In summary, the natural runoff of the YRB will increase in the future, which requires a more comprehensive assessment of climate change and human activities. We will pay more attention to this in our following work.
Author Contributions
Conceptualization, C.W.; methodology, validation, Q.Z.; investigation, writing—original draft preparation, Z.H.; writing—review and editing, R.G. All authors have read and agreed to the published version of the manuscript.
Funding
This research was funded by the Yellow River Water Scientific Research Project of the National Natural Science Foundation of China, NO. U2243203.
Data Availability Statement
Not applicable.
Acknowledgments
We thank Guangxuan Yan for his help with the calculation scheme, Zhijin Ma for aggregating the nature runoff data, and Wei Zhang for his helpful comments on an earlier version of the manuscript. This research was supported by the the Yellow River Water Scientific Research Project of the National Natural Science Foundation of China (NO. U2243203). The leading innovative team of Hydrology Bureau of Yellow River Water Conservancy Commission, namely the Climate Change Impact Research Team, has given great help to the research. The authers are grateful to the editors and anonymous reviewers for their insightful comments and suggestions.
Conflicts of Interest
The authors declare no conflict of interest.
References
- Bao, Z.X.; Zhang, J.Y.; Wang, G.Q.; Fu, G.B.; He, R.M.; Yan, X.L.; Jin, J.L. Attribution for decreasing stream flow of the Haihe River basin in northern China: Climate variability or human activities? J. Hydrol. 2012, 460, 117–129. [Google Scholar] [CrossRef]
- Wang, S.; Fu, B.J.; Piao SLLu, Y.H.; Ciais, P.; Feng, X.M.; Wang, Y.F. Reduced sediment transport in the Yellow River due to anthropogenic changes. Nat. Geosci. 2015, 9, 38–42. [Google Scholar] [CrossRef]
- Zhang, J.Y.; Wang, G.Q. Climate change and sustainable utilization of water resources in China. Hydro-Sci. Eng. 2009, 4, 17–21. (In Chinese) [Google Scholar]
- Wan, F.; Zhang, F.; Zheng, X.K.; Xiao, L.F. Study on ecological water demand and ecological water supplement in wuliangsuhai lake. Water 2022, 14, 1262. [Google Scholar] [CrossRef]
- Sun, D.Z.; Liang, Y.J.; Peng, S.Z. Scenario simulation of water retention services under land use/cover and climate changes: A case study of the Loess Plateau, China. J. Arid Land 2022, 14, 390–410. [Google Scholar] [CrossRef]
- Wang, F.; Wang, Z.M.; Yang, H.B.; Zhao, Y. Study of the temporal and spatial patterns of drought in the Yellow River basin based on SPEI. Sci. China Earth Sci. 2018, 61, 1098–1111. [Google Scholar] [CrossRef]
- Li, X.Y.; Li, Z.; Yuan, H.; Qian, Y.P. Study on natural runoff forecasting of the Yellow River under future climate change scenarios. Yellow River 2012, 34, 27–33. (In Chinese) [Google Scholar]
- Lv, X.Z.; Zuo, Z.G.; Ni, Y.X.; Sun, J.; Wang, H.N. The effects of climate and catchment characteristic change on streamflow in a typical tributary of the Yellow River. Sci. Rep. 2019, 9, 14535. [Google Scholar] [CrossRef] [Green Version]
- Li, Y.; Xie, Z.X.; Qin, Y.C.; Xia, H.M.; Zheng, Z.C.; Zhang, L.J.; Pan, Z.W.; Liu, Z.Z. Drought Under Global Warming and Climate Change: An Empirical Study of the Loess Plateau. Sustainability 2019, 11, 1281. [Google Scholar] [CrossRef] [Green Version]
- Wang, Y.P.; Wang, S.; Zhao, W.W.; Liu, Y.X. The increasing contribution of potential evapotranspiration to severe droughts in the Yellow River basin. J. Hydrol. 2022, 605, 127310. [Google Scholar] [CrossRef]
- Pascale, S.; Lucarini, V.; Feng, X.; Porporato, A.; Hasson, S. Analysis of rainfall seasonality from observations and climate models. Clim. Dyn. 2015, 44, 3281–3301. [Google Scholar] [CrossRef] [Green Version]
- Pascale, S.; Lucarini, V.; Feng, X.; Porporato, A.; Hasson, S. Projected changes of rainfall seasonality and dry spells in a high greenhouse gas emissions scenario. Clim. Dyn. 2016, 46, 1331–1350. [Google Scholar] [CrossRef] [Green Version]
- Kong, D.X.; Miao, C.Y.; Wu, J.W.; Duan, Q.Y. Impact assessment of climate change and human activities on net runoff in the Yellow River Basin from 1951 to 2012. Ecol. Eng. 2016, 91, 566–573. [Google Scholar] [CrossRef]
- Hu, C.H.; Zhang, L.; Wu, Q.; Soomro, S.; Jian, S.Q. Response of LUCC on runoff generation process in Middle Yellow River Basin: The Gushuanchuan Basin. Water 2020, 12, 1237. [Google Scholar] [CrossRef]
- Wu, J.W.; Miao, C.Y.; Wang, Y.M.; Duan, Q.Y.; Zhang, X.M. Contribution analysis of the long-term changes in seasonal runoff on the Loess Plateau, China, using eight Budyko-based methods. J. Hydrol. 2017, 545, 263–275. [Google Scholar] [CrossRef]
- Han, Z.M.; Huang, S.Z.; Huang, Q.; Bai, Q.J.; Leng, G.Y.; Wang, H.; Zhang, J.; Wei, X.T.; Zheng, X.D. Effects of vegetation restoration on groundwater drought in the Loess Plateau, China. J. Hydrol. 2020, 591, 125566. [Google Scholar] [CrossRef]
- Wang, H.; Qin, D.Y.; Wang, J.H. Progress in multi-scales regional hydrological cycle and dual model of hydrological cycle. In Evolving Law and Maintaining of Renewable Capacity of Water Resources in the Yellow River Basin; Liu, C.M., Chen, X.G., Eds.; Huanghe Water Conservancy Press: Zhengzhou, China, 2001; pp. 34–42. (In Chinese) [Google Scholar]
- Chang, J.X.; Wei, J.; Wang, Y.M.; Yuan, M.; Guo, J.C. Precipitation and runoff variations in the Yellow River Basin of China. J. Hydroinf. 2017, 19, 138–155. [Google Scholar] [CrossRef]
- Wang, G.Q.; Wang, Y.Z.; Shi, Z.H.; Kang, L.L.; Li, H.B. Analysis on water resources variation tendency in the Yellow River. Entia. Geogr. Sin. 2001, 21, 396–400. (In Chinese) [Google Scholar]
- Hu, C.H.; Wang, J.J.; Chai, X.L.; Guan, J.X. Research advances of impact of climate change on runoff of the Yellow River Basin. Meteorol. Environ. Sci. 2013, 36, 57–65. (In Chinese) [Google Scholar]
- Liu, L.L.; Liu, Z.F.; Xu, Z.X. Trends of climate change for the upper-middle reaches of the Yellow River in the 21st Century. Adv. Clim. Chang. Res. 2008, 4, 167–172. (In Chinese) [Google Scholar]
- Shen, D.J.; Liu, C.M. Hydrological and water resources responses to climatic change-a review. Geograph. Res. 1998, 17, 435–442. (In Chinese) [Google Scholar]
- Xia, J.; Peng, S.M.; Wang, C.; Hong, S.; Chen, J.X.; Luo, X.P. Impact of climate change on water resources and adaptive management in the Yellow River Basin. Yellow River 2014, 36, 1–4. (In Chinese) [Google Scholar]
- Liu, J.F.; Xu, Z.S.; Wang, L.; Sun, Y.B. Features of climate and water resources evolution in the Yellow River Basin. China Water Resour. 2009, 13, 23–25. (In Chinese) [Google Scholar]
- Li, C.H.; Yang, Z.F. Natural runoff changes in the Yellow River Basin. J. Geograph. Sci. 2004, 4, 427–436. [Google Scholar]
- Xu, Z.X.; He, W.L. Analysis on the long-term trend of pan evaporation in the Yellow River Basin over the past 40 years. Hydrol. 2005, 25, 6–11. (In Chinese) [Google Scholar]
- Wang, S.J.; Yan, Y.X.; Yan, M.; Zhao, X.K. Quantitative estimation of the impact of precipitation and human activities on runoff change of the Huangfuchuan River Basin. J. Geograph. Sci. 2012, 22, 906–918. [Google Scholar] [CrossRef]
- Tian, P.; Mu, X.M.; Zhao, G.J.; Hu, J.F.; Gao, P.; Sun, W.Y. Variations of natural runoff in the Yellow River since 1470. J. Soil Water Conserv. 2020, 34, 65–69. (In Chinese) [Google Scholar]
- Zhang, Z.H.; Deng, S.F.; Zhao, Q.D.; Zhang, S.Q.; Zhang, X.W. Projected glacier meltwater and river runoff changes in the upper reach of the Shule River Basin, northeasternedge of the Tibetan Plateau. Hydrol. Process. 2019, 33, 1059–1074. [Google Scholar] [CrossRef]
- Zhao, Q.D.; Ding, Y.J.; Wang, J.; Gao, H.K.; Zhang, S.Q.; Zhao, C.C.; Xu, J.L.; Han, H.D.; ShangGuan, D.H. Projecting climate change impacts on hydrological processes on the Tibetan Plateau with model calibration against the glacier inventory data and observed streamflow. J. Hydrol. 2019, 573, 60–81. [Google Scholar] [CrossRef]
- Jin, H.Y.; Chen, X.H.; Wu, P.; Song, C.; Xia, W.J. Evaluation of spatial-temporal distribution of precipitation in mainland China by statistic and clustering methods. Atmos. Res. 2021, 262, 105772. [Google Scholar] [CrossRef]
- Wu, Q.S.; Zuo, Q.T.; Han, C.H.; Ma, J.X. Integrated assessment of variation characteristics and driving forces in precipitation and temperature under climate change: A case study of Upper Yellow River basin, China. Atmos. Res. 2022, 272, 106156. [Google Scholar] [CrossRef]
- Druzkowsi, M. The influence of natural and human-related factors on the water circulation in the Carpathian foothills (southern Poland). Water Resour. Manag. 2001, 15, 93–108. [Google Scholar] [CrossRef]
- Zhao, P.; He, Z.B. Temperature change characteristic in Gansu province of China. Atmosphere 2022, 13, 728. [Google Scholar] [CrossRef]
- Kendall, M.G. Rank correlation methods. Br. J. Psychol. 1990, 25, 86–91. [Google Scholar] [CrossRef]
- Grinsted, A.; Moore, J.C.; Jevrejeva, S. Application of the cross wavelet transform and wavelet coherence to geophysical time series. Nonlinear Process. Geophys. 2014, 11, 561–566. [Google Scholar] [CrossRef]
- Hu, W.; Si, B.C.; Biswas, A.; Chau, H.W. Temporally stable patterns but seasonal dependent controls of soil water content: Evidence from wavelet analyses. Hydrol. Process. 2017, 31, 3697–3707. [Google Scholar] [CrossRef]
- Yan, Z.W.; Ding, Y.H.; Zhai, P.M.; Song, L.C.; Cao, L.J.; Li, Z. Re-Assessing Climatic Warming in China since 1900. J. Meteorol. Res. 2020, 34, 243–251. [Google Scholar] [CrossRef]
- Wang, M.R.; Zhou, S.W.; Duan, A.M. Trend in the atmospheric heat source over the central and eastern Tibetan Plateau during recent decades: Comparison of observations and reanalysis data. Chin. Sci. Bull. 2012, 57, 548–557. [Google Scholar] [CrossRef] [Green Version]
- Zhang, C.J.; Gao, X.J. Impact of global warming on autumn precipitation in Northwest China. J. Glaciol. Geocryol. 2003, 25, 157–168. (In Chinese) [Google Scholar]
- Song, L.C.; Zhang, C.J. Changing features of precipitation over Northwest China during the 20th century. J. Glaciol. Geocryol. 2003, 25, 143–148. (In Chinese) [Google Scholar]
- Rehfeld, K.; Laepple, T. Warmer and wetter or warmer and dryer? Observed versus simulated covariability of Holocene temperature and rainfall in Asia. Earth Planet Sci. Lett. 2016, 436, 1–9. [Google Scholar] [CrossRef] [Green Version]
- Liu, J.F.; Cheng, Y.H.; Liu, K.; Chen, D.L. Winter temperature features and its influences on ice regime in the Ningxia-Inner Mongolia section of the Yellow River. China Flood Drought Manag. 2018, 28, 47–52. (In Chinese) [Google Scholar]
- Zhai, P.M.; Zhou, B.Q.; Chen, Y.; Yu, R. Several new understanding in the climate change science. Clim. Chang. Res. 2021, 17, 629–635. (In Chinese) [Google Scholar]
- Zhang, Q.; Zhu, B.; Yang, J.H.; Ma, P.L.; Liu, X.Y.; Lu, G.X.; Wang, Y.H.; Yu, H.P.; Liu, W.P.; Wang, D.W. New characteristics about the climate humidification trend in Northwest China. Chin. Sci. Bull. 2021, 66, 3757–3771. (In Chinese) [Google Scholar] [CrossRef]
- Ljungqvist, F.C.; Seim, A.; Krusic, P.J.; González-Rouco, J.F.; Werner, J.P.; Cook, E.R.; Zorita, E.; Luterbacher, J.; Gagen, E.X.; Destouni, G.; et al. European warm-season temperature and hydroclimate since 850 CE. Environ. Res. Lett. 2019, 14, 084015. [Google Scholar] [CrossRef]
- Zhang, Q.; Lin, J.J.; Liu, W.C.; Han, L.Y. Study on the seesaw change phenomenon and formation mechanism of the precipitation in the east and west of Northwest China during the flood season. Sci. China Earth Sci. 2019, 62, 2083–2098. (In Chinese) [Google Scholar] [CrossRef]
- Wang, S.J.; Li, L.; Yan, M. The contributions of climate change and human activities to the runoff yield changes in the middle Yellow River Basin. Geogr. Res. 2013, 32, 395–402. (In Chinese) [Google Scholar]
- Ding, Y.H.; Wang, Z.Y.; Sun, Y. Inter-decadal variation of the summer precipitation in East China and its association with decreasing Asian summer monsoon. Part I: Observation evidences. Int. J. Climatol. 2007, 28, 1139–1161. [Google Scholar] [CrossRef]
- Feng, X.M.; Fu, B.J.; Piao, S.L.; Wang, S.; Ciais, P.; Zeng, Z.Z.; Lv, Y.H.; Zeng, Y.; Li, Y.; Jiang, X.H.; et al. Revegetation in China’s Loess Plateau is approaching sustainable water resource limits. Nat. Clim. Chang. 2017, 6, 1019–2014. [Google Scholar] [CrossRef]
Figure 1.
The geographical location and the distribution map of 70 meteorological stations in the YRB.
Figure 1.
The geographical location and the distribution map of 70 meteorological stations in the YRB.

Figure 2.
Spatial distribution of temperature change over the YRB (unit: °C decade−1).

Figure 3.
Spatial distribution of annual precipitation over the YRB (the red line is the dividing line between increase and decrease; unit: mm decade−1).
Figure 3.
Spatial distribution of annual precipitation over the YRB (the red line is the dividing line between increase and decrease; unit: mm decade−1).

Figure 4.
M-K statistical curves of annual mean temperature: (a) annual total precipitation, (b) annual natural runoff, and (c) (the black dotted line is the critiacl level of significant α = 0.05).
Figure 4.
M-K statistical curves of annual mean temperature: (a) annual total precipitation, (b) annual natural runoff, and (c) (the black dotted line is the critiacl level of significant α = 0.05).

Figure 5.
Bivariate Wavelet Coherency between Huayuankou natural runoff and annual mean temperature (a) and annual total precipitation (b). The horizontal axis is the time series from 1961–2020. Arrows show the phase angles of the wavelet spectra. Thin solid lines demarcate the cones of influence, and thick solid lines show the 95% confidence levels.


Table 1.
Statistics of annual mean temperature, annual total precipitation, and natural runoff from 1961–2020.
Table 1.
Statistics of annual mean temperature, annual total precipitation, and natural runoff from 1961–2020.
| 1961–1970 | 1971–1980 | 1981–1990 | 1991–2000 | 2001–2010 | 2011–2020 | |
|---|---|---|---|---|---|---|
| Temperature (°C) | 6.53 | 6.74 | 6.81 | 7.40 | 7.86 | 7.99 |
| Precipitation (mm) | 473.2 | 445.1 | 450.9 | 418.0 | 440.7 | 484.7 |
| Natural runoff (108 m3) | 658.0 | 542.6 | 612.9 | 435.9 | 436.5 | 543.8 |
Disclaimer/Publisher’s Note: The statements, opinions and data contained in all publications are solely those of the individual author(s) and contributor(s) and not of MDPI and/or the editor(s). MDPI and/or the editor(s) disclaim responsibility for any injury to people or property resulting from any ideas, methods, instructions or products referred to in the content. |
© 2023 by the authors. Licensee MDPI, Basel, Switzerland. This article is an open access article distributed under the terms and conditions of the Creative Commons Attribution (CC BY) license (https://creativecommons.org/licenses/by/4.0/).
Share and Cite
MDPI and ACS Style
Han, Z.; Zuo, Q.; Wang, C.; Gan, R. Impacts of Climate Change on Natural Runoff in the Yellow River Basin of China during 1961–2020. Water 2023, 15, 929. https://doi.org/10.3390/w15050929
AMA Style
Han Z, Zuo Q, Wang C, Gan R. Impacts of Climate Change on Natural Runoff in the Yellow River Basin of China during 1961–2020. Water. 2023; 15(5):929. https://doi.org/10.3390/w15050929
Chicago/Turabian StyleHan, Zuoqiang, Qiting Zuo, Chunqing Wang, and Rong Gan. 2023. "Impacts of Climate Change on Natural Runoff in the Yellow River Basin of China during 1961–2020" Water 15, no. 5: 929. https://doi.org/10.3390/w15050929
Note that from the first issue of 2016, this journal uses article numbers instead of page numbers. See further details here.