

Quantification of the Synthetic Phenolic Antioxidant Cyanox 1790 in Bottled Water with SPE-HPLC/MS/MS and Determination of the Impact of the Use of Recycled Packaging on Its Generation


Abstract
:1. Introduction
2. Materials and Methods
2.1. Reagents
2.2. Calibration Curve
2.3. Sampling
2.3.1. Solid-Phase Extraction (SPE) for Bottled Water Samples
Conditioning of the Stationary Phase of the SPE
Pretreatment
Preconcentration and Cleaning
2.4. Liquid Chromatography with Diode Array Detector and Mass Spectrometry (HPLC-DAD/MS/MS)
2.5. Fourier Transform Infrared Spectroscopy (FTIR)
2.6. Differential Scanning Calorimeter (DSC)
2.7. Data Analysis
3. Analysis and Results
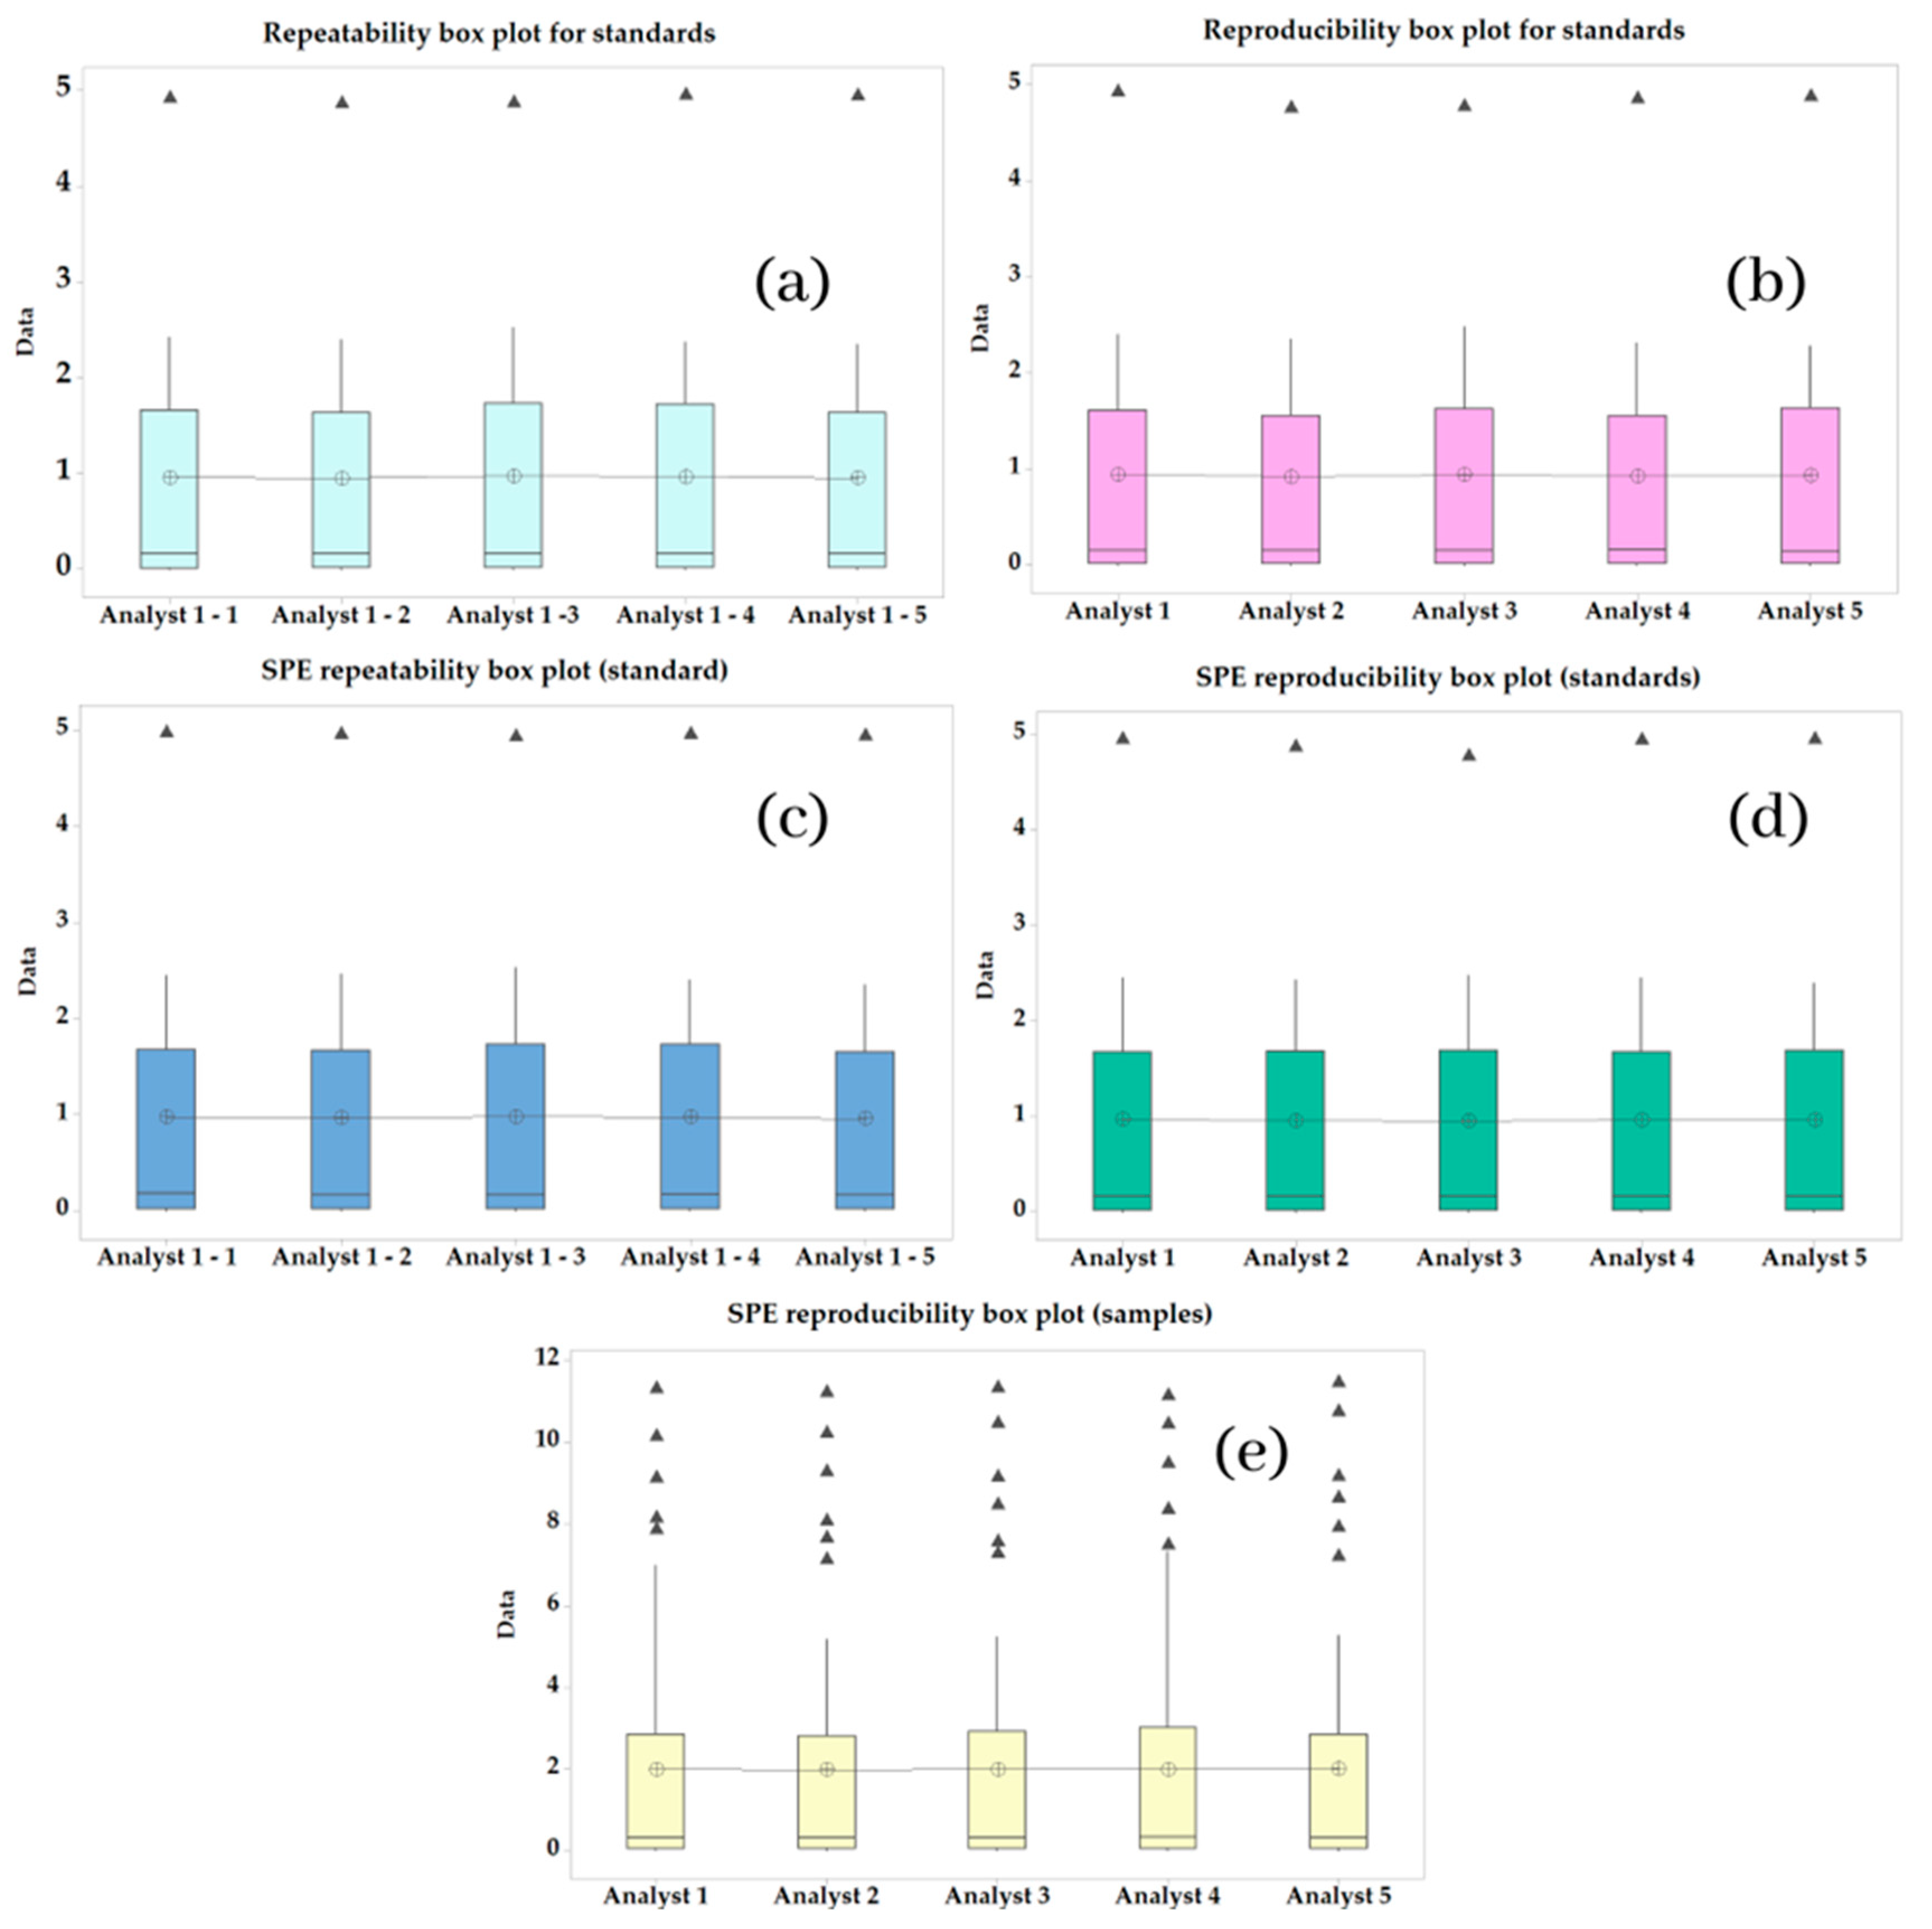
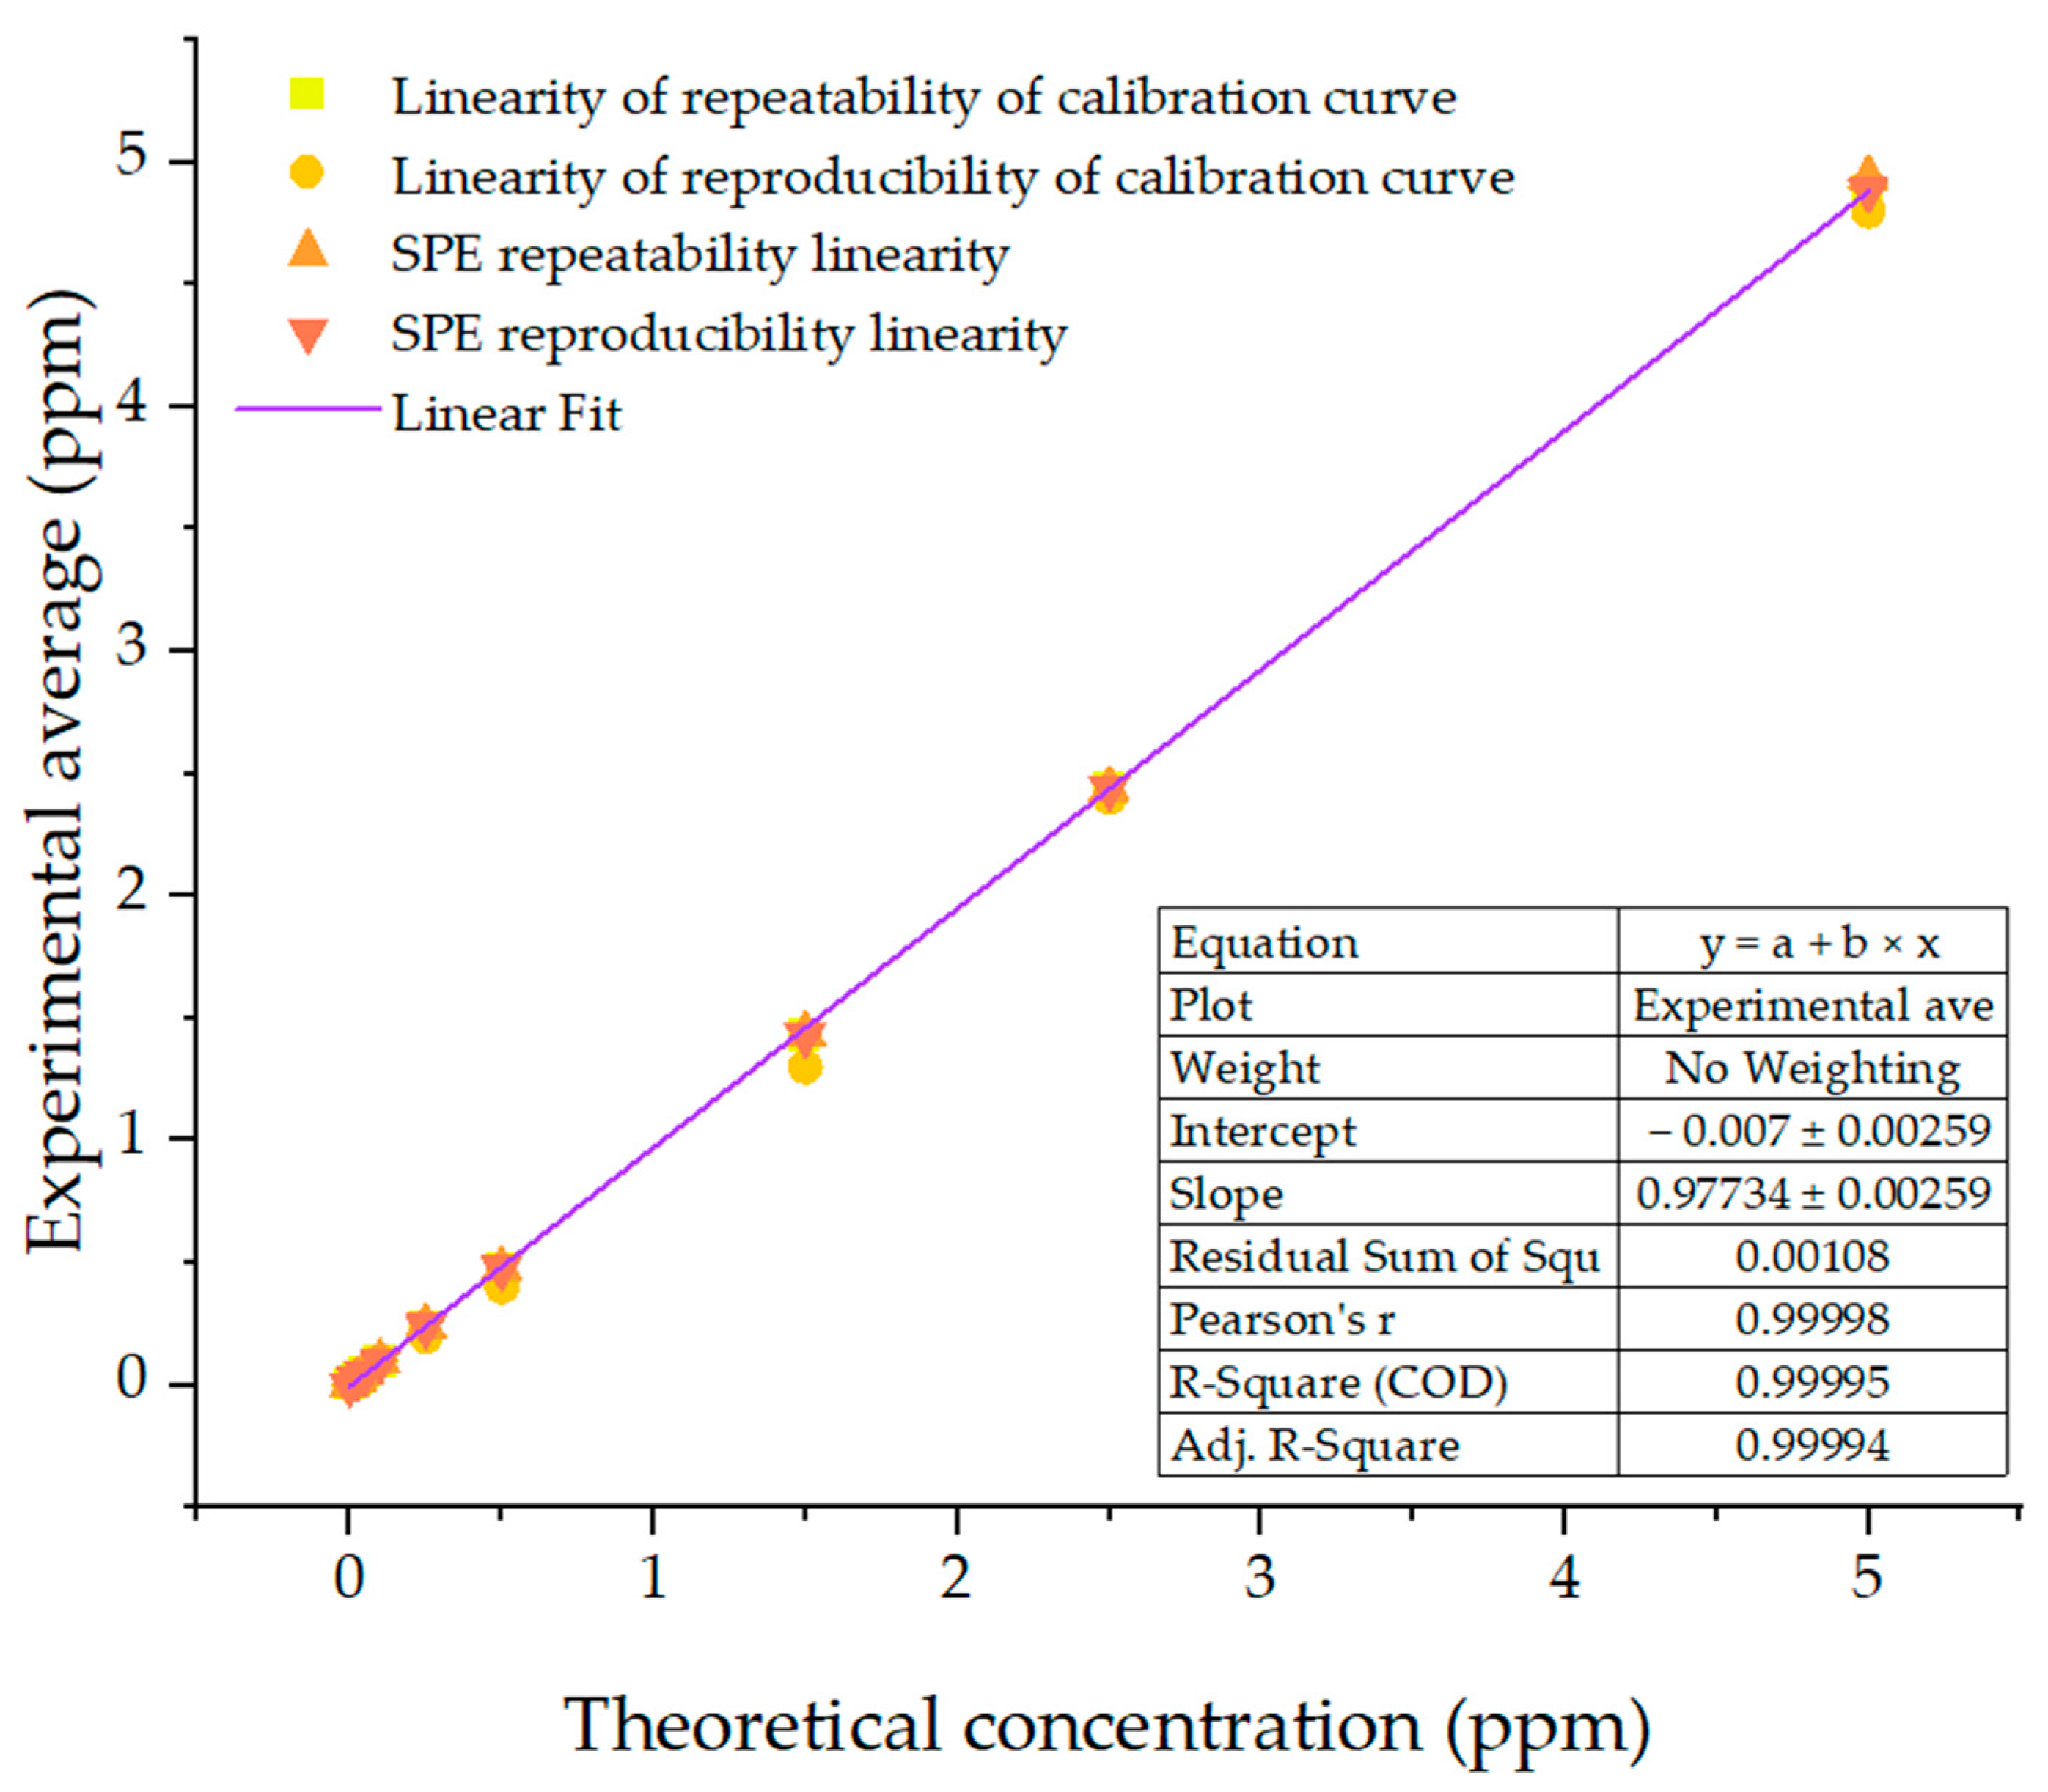
3.1. Validation of Standards
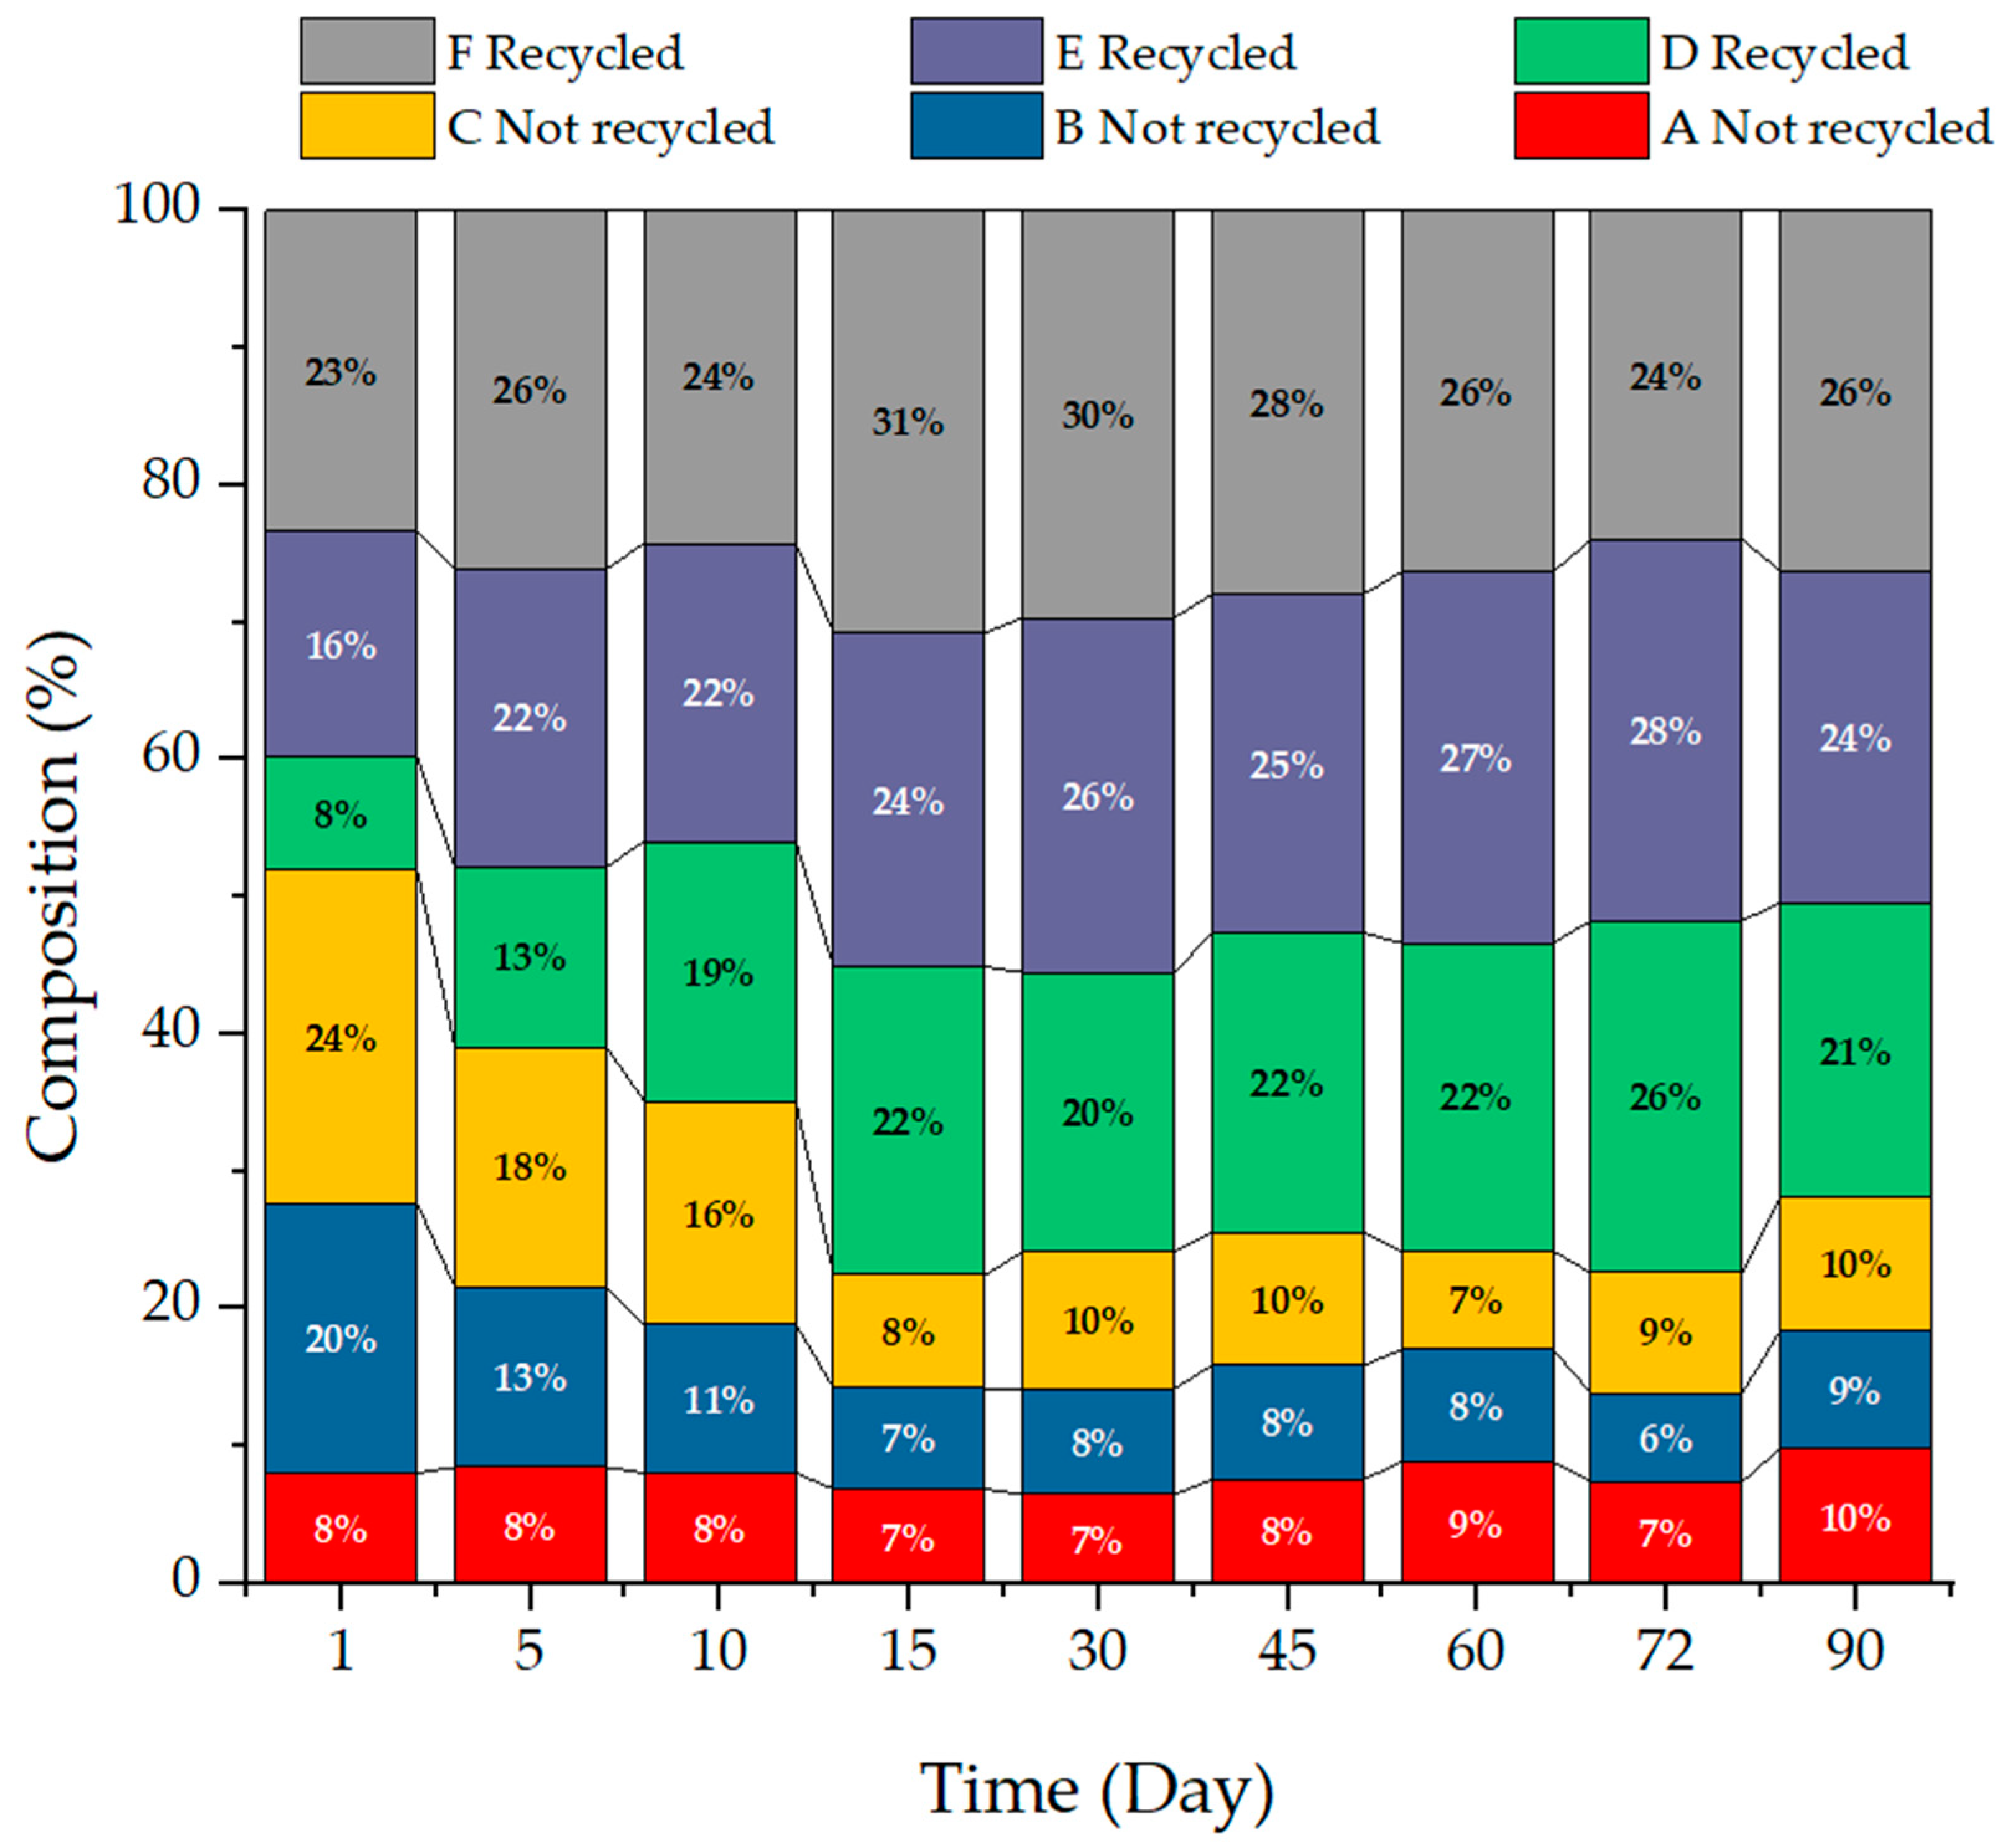
3.2. Analysis of Cyanox 1790 in Bottled Water Samples
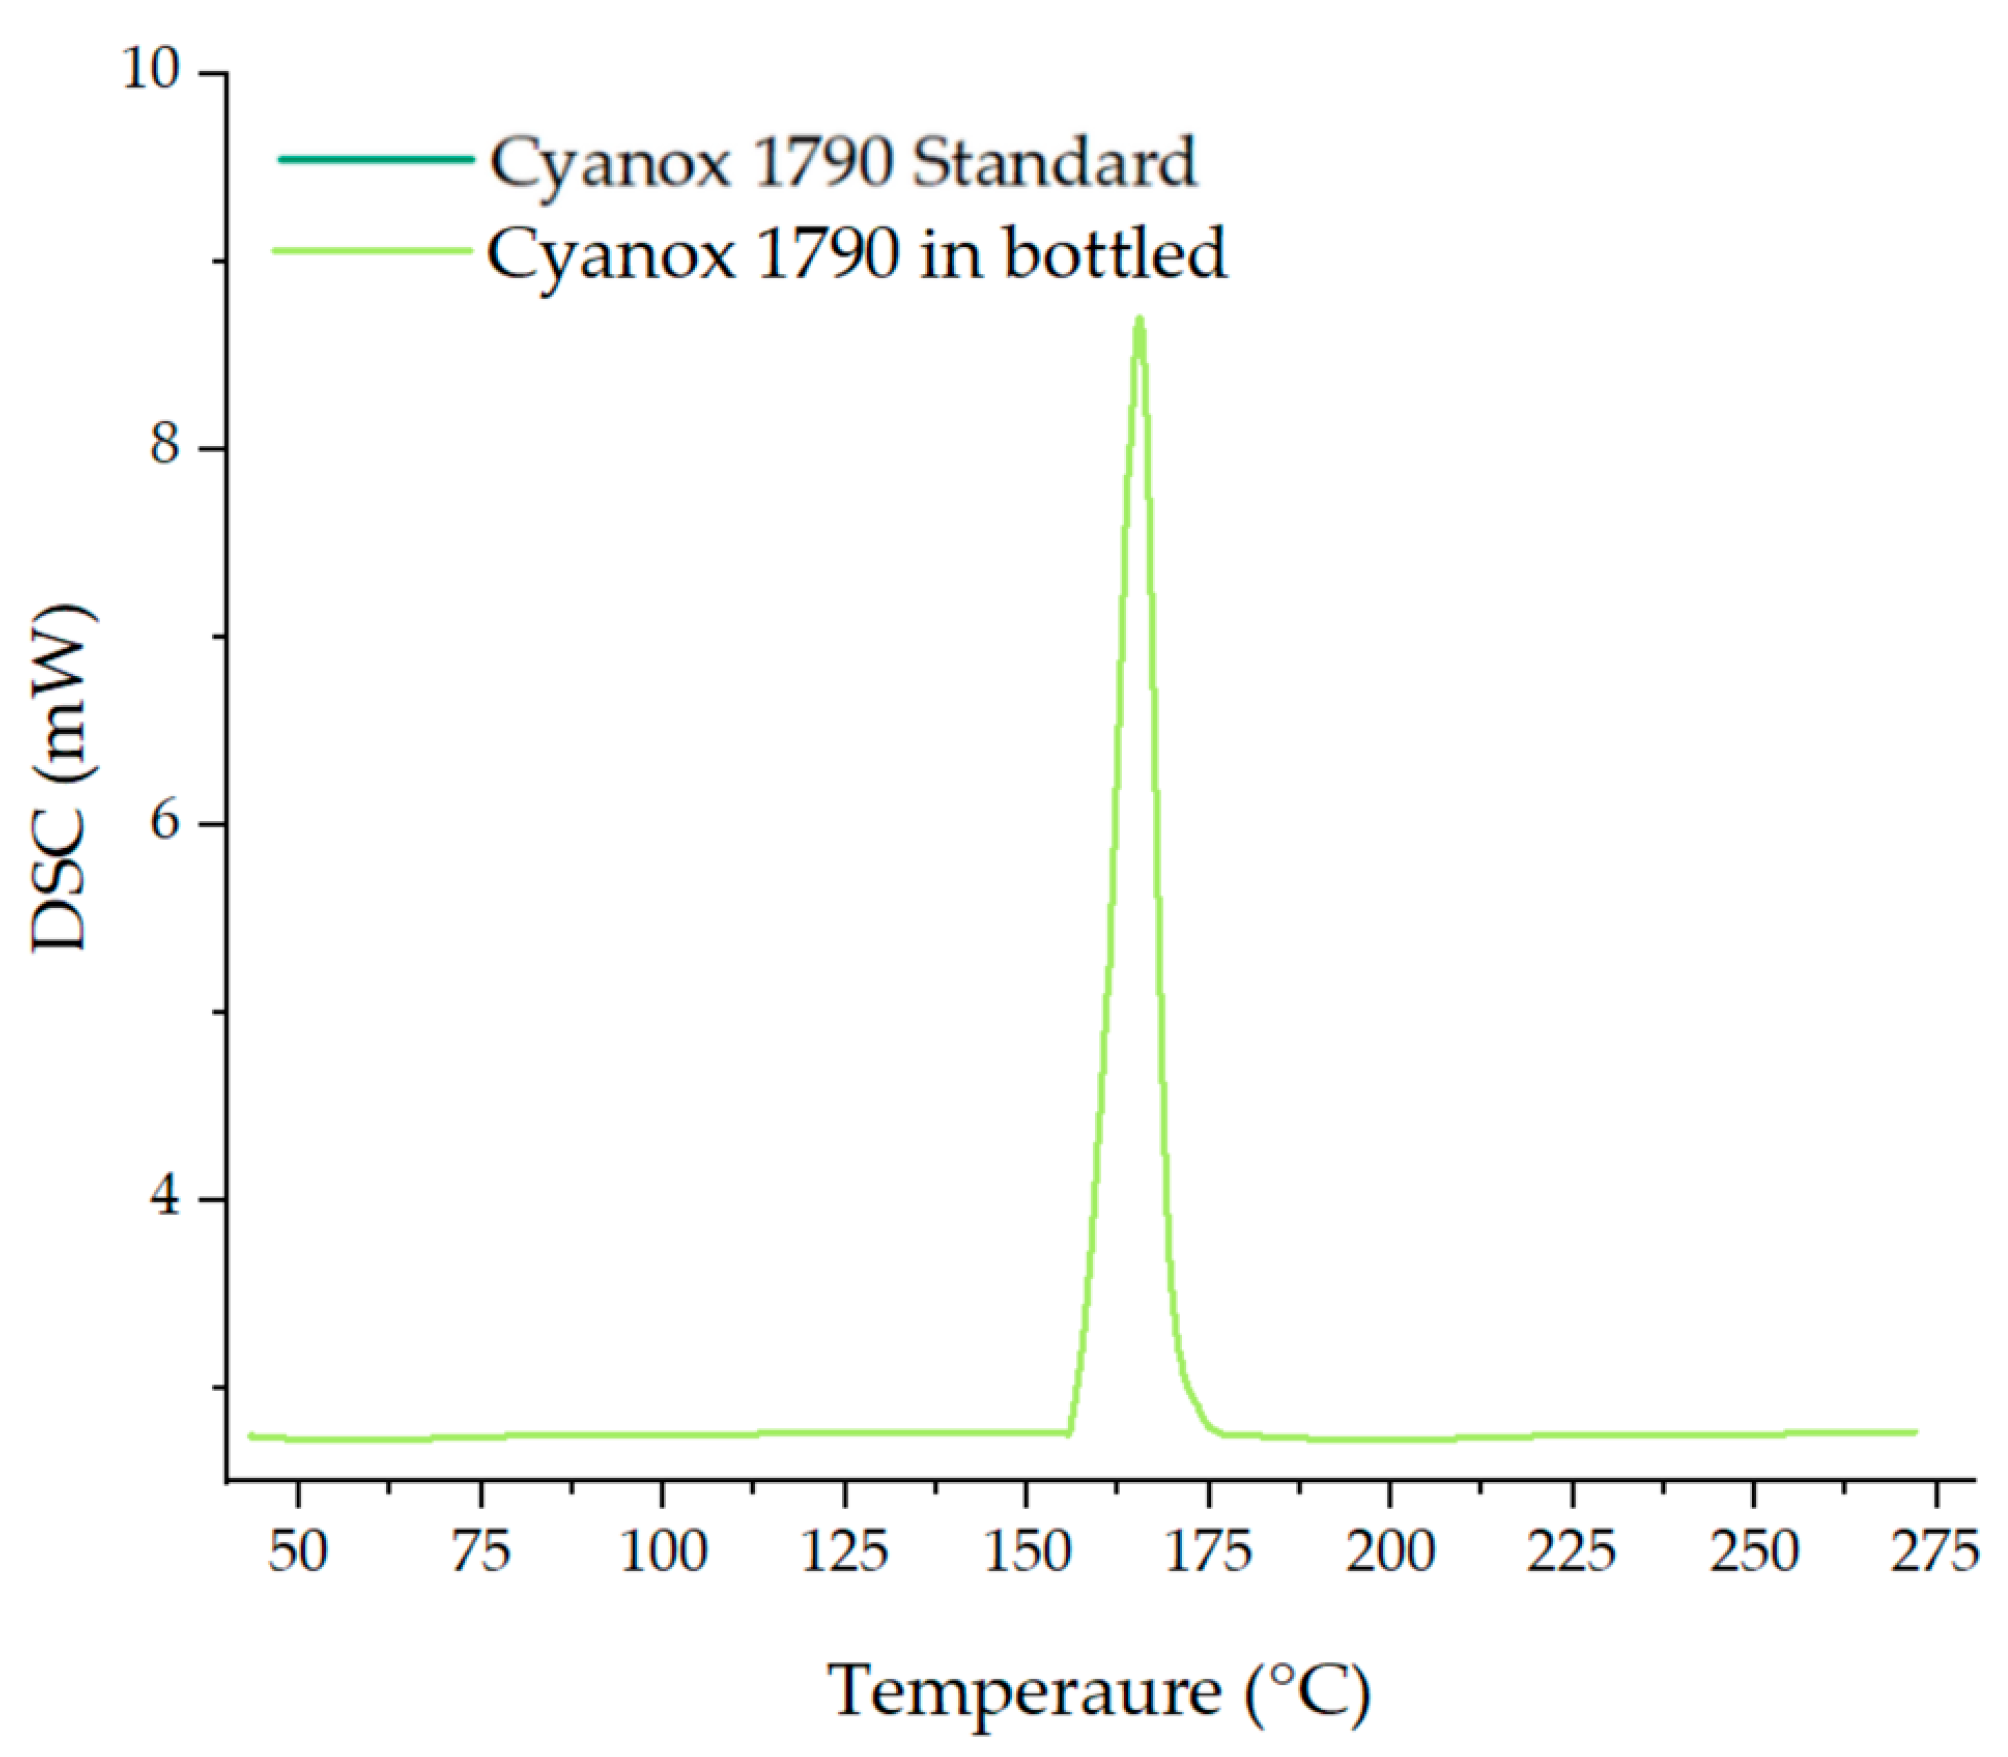
3.3. Complementary Analysis of Cyanox 1790 in Bottled Water Samples
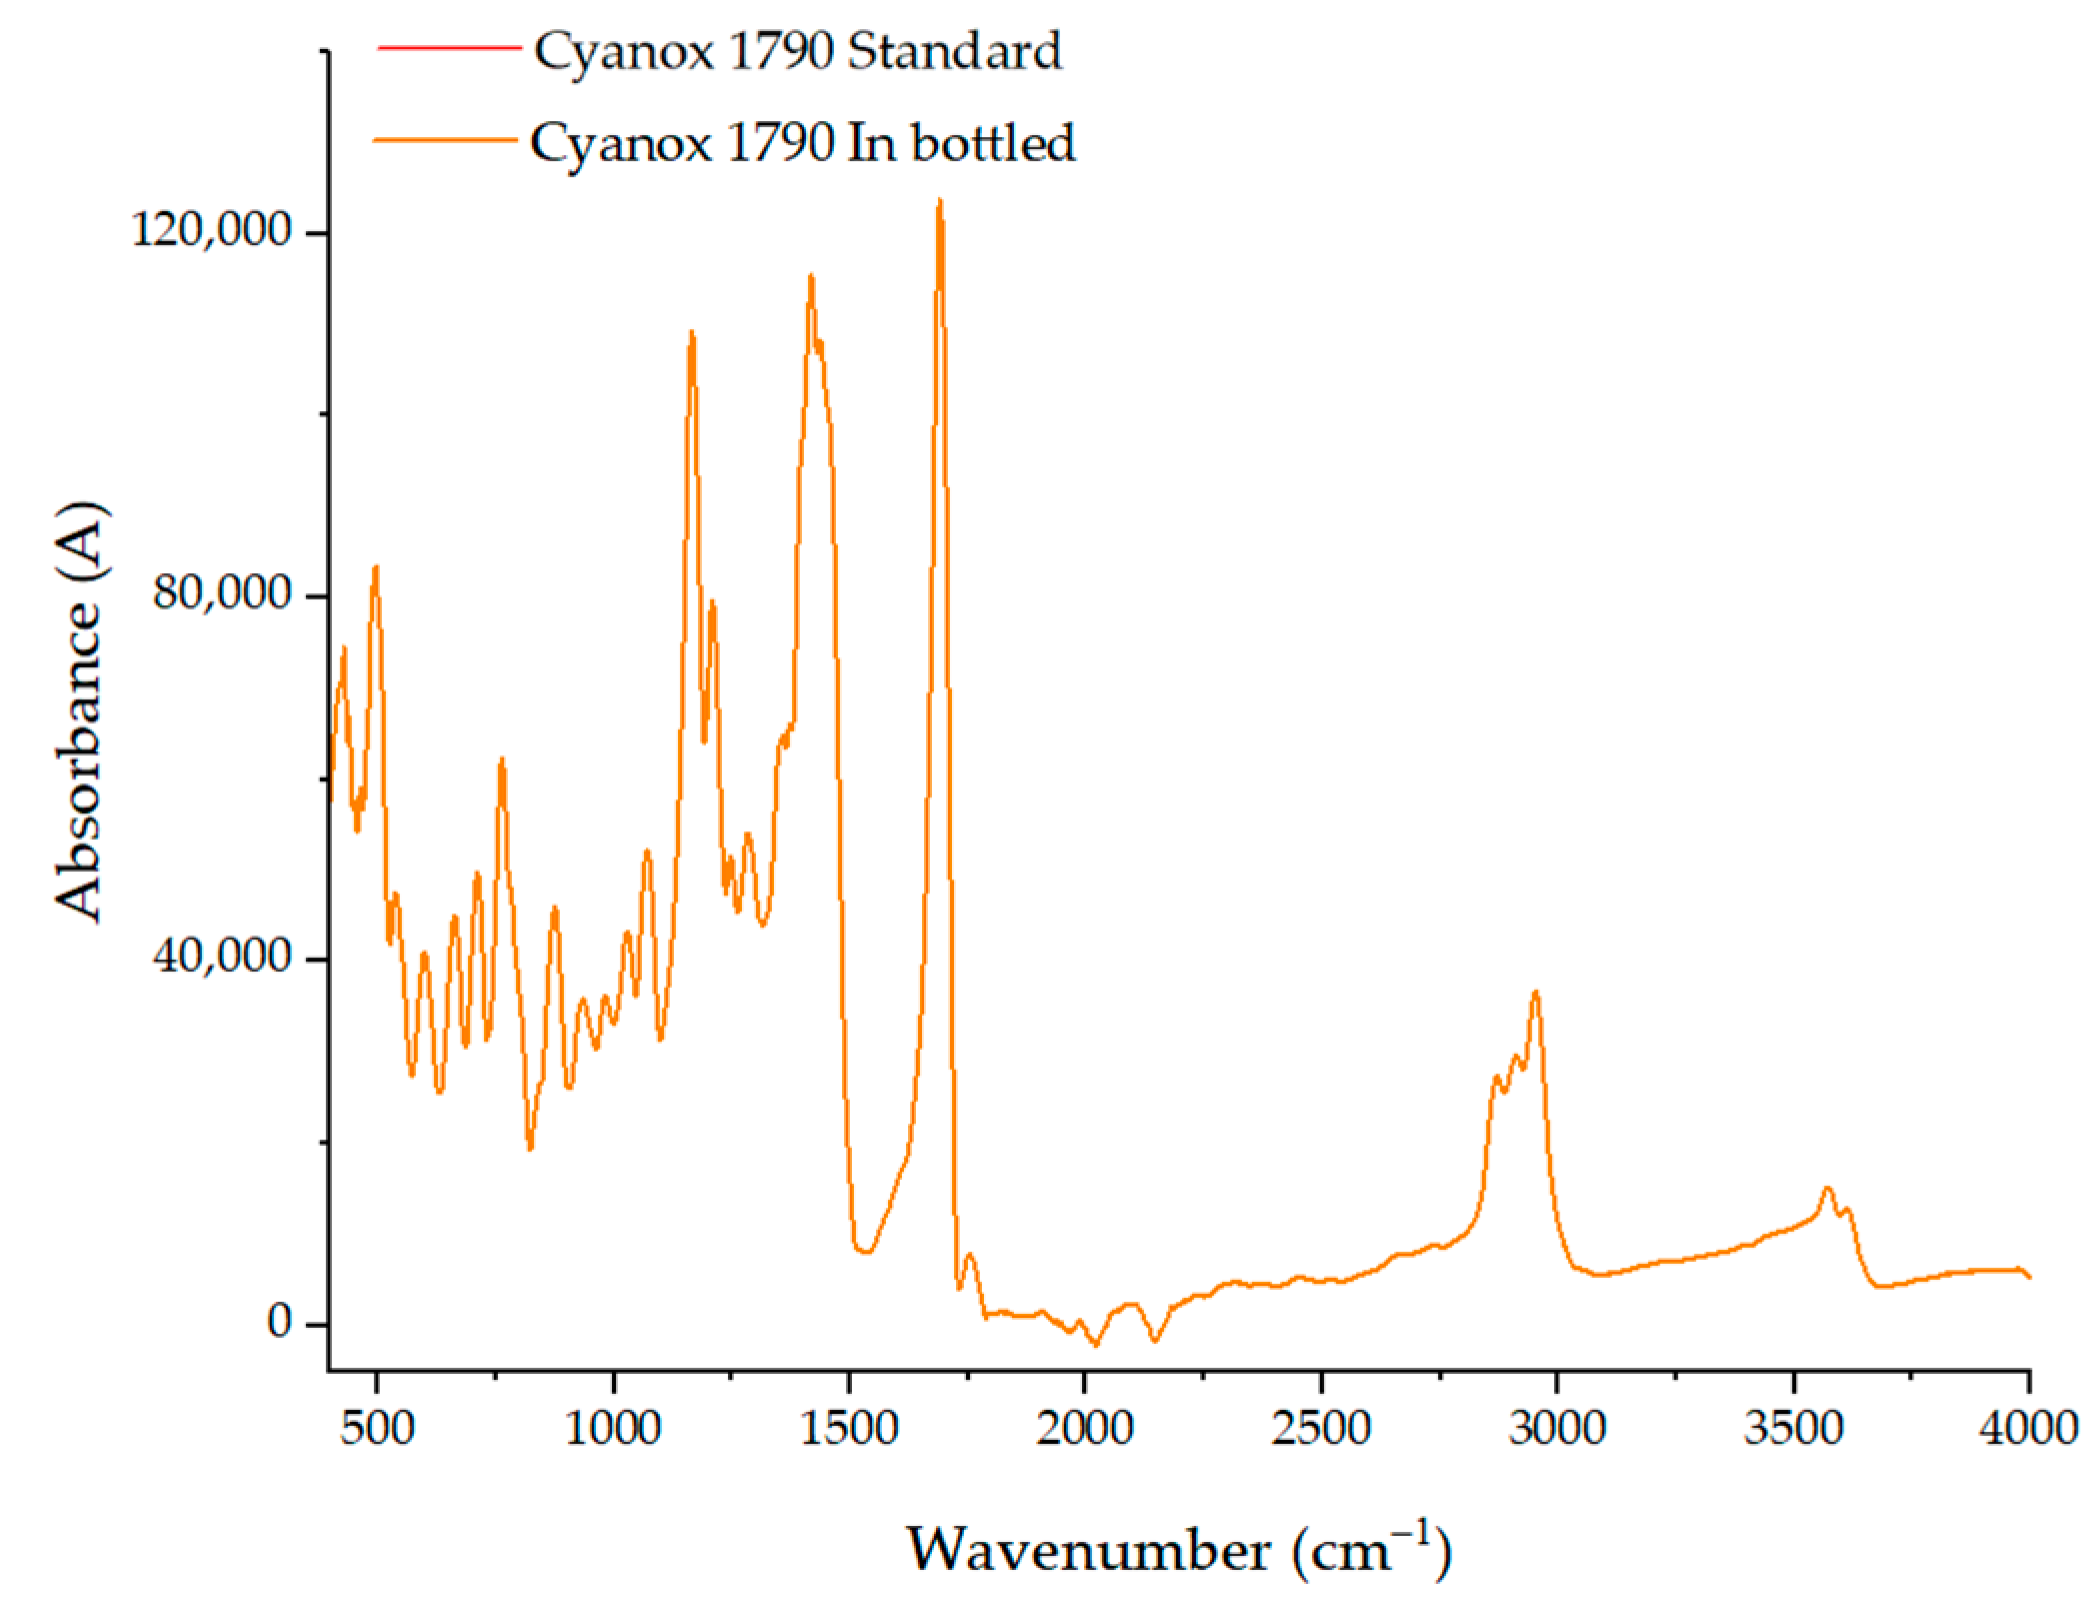
Pure Standard FTIR Analysis and Recovered Dust
4. Conclusions
Author Contributions
Funding
Data Availability Statement
Conflicts of Interest
References
- Fortune Business Insights. The Global Antioxidants Market Is Expected to Grow from $4.13 Billion in 2021 to $6.05 Billion in 2028 at a CAGR of 5.61% in the Forecast Period, 2021–2028. 2021. Available online: https://www.fortunebusinessinsights.com/industry-reports/food-antioxidants-market-100789 (accessed on 24 January 2023).
- Hernández-Fernández, J.; Lopez-Martinez, J.; Barceló, D. Quantification and elimination of substituted synthetic phenols and volatile organic compounds in the wastewater treatment plant during the production of industrial scale polypropylene. Chemosphere 2021, 263, 128027. [Google Scholar] [CrossRef]
- Hernández-Fernandez, J.; Rodríguez, E. Determination of phenolic antioxidants additives in industrial wastewater from polypropylene production using solid phase extraction with high-performance liquid chromatography. J. Chromatogr. A 2019, 1607, 460442. [Google Scholar] [CrossRef]
- Hernández-Fernández, J. Quantification of oxygenates, sulphides, thiols and permanent gases in propylene. A multiple linear regression model to predict the loss of efficiency in polypropylene production on an industrial scale. J. Chromatogr. A 2020, 1628, 461478. [Google Scholar] [CrossRef]
- Wiles, D.M.; Scott, G. Polyolefins with controlled environmental degradability. Polym. Degrad. Stab. 2006, 91, 1581–1592. [Google Scholar] [CrossRef]
- Al-Malaika, S. Perspectives in stabilisation of polyolefins. Adv. Polym. Sci. 2004, 169, 121–150. [Google Scholar] [CrossRef]
- Pospíšil, J. Mechanistic Action of Phenolic Antioxidants in Polymers—A Review. Polym. Degrad. Stab. 1988, 20, 181–202. [Google Scholar] [CrossRef]
- Coreño-Alonso, J.; Méndez-Bautista, M.T. Relación estructura-propiedades de polímeros. Educ. Quím. 2010, 21, 291–299. [Google Scholar] [CrossRef]
- Liu, R.; Ruan, T.; Song, S.; Lin, Y.; Jiang, G. Determination of synthetic phenolic antioxidants and relative metabolites in sewage treatment plant and recipient river by high performance liquid chromatography–electrospray tandem mass spectrometry. J. Chromatogr. A 2015, 1381, 13–21. [Google Scholar] [CrossRef]
- Liu, R.; Song, S.; Lin, Y.; Ruan, T.; Jiang, G. Occurrence of synthetic phenolic antioxidants and major metabolites in municipal sewage sludge in China. Environ. Sci. Technol. 2015, 49, 2073–2080. [Google Scholar] [CrossRef]
- Wang, W.; Xiong, P.; Zhang, H.; Zhu, Q.; Liao, C.; Jiang, G. Analysis, occurrence, toxicity and environmental health risks of synthetic phenolic antioxidants: A review. Environ. Res. 2021, 201, 111531. [Google Scholar] [CrossRef]
- Wang, J.; Wang, J.; Liu, J.; Li, J.; Zhou, L.; Zhang, H.; Sun, J.; Zhuang, S. The evaluation of endocrine disrupting effects of tert-butylphenols towards estrogenic receptor α, androgen receptor and thyroid hormone receptor β and aquatic toxicities towards freshwater organisms. Environ. Pollut. 2018, 240, 396–402. [Google Scholar] [CrossRef]
- Wang, W.; Kannan, K. Inventory, loading and discharge of synthetic phenolic antioxidants and their metabolites in wastewater treatment plants. Water Res. 2018, 129, 413–418. [Google Scholar] [CrossRef]
- Tang, J.; Tang, L.; Zhang, C.; Zeng, G.; Deng, Y.; Dong, H.; Wang, J.; Wu, Y. Different senescent HDPE pipe-risk: Brief field investigation from source water to tap water in China (Changsha City). Environ. Sci. Pollut. Res. 2015, 22, 16210–16214. [Google Scholar] [CrossRef]
- Shao-Yang, H. Toxicity effects of the environmental hormone 4-tert-octylphenol in zebrafish (Danio rerio). Int. J. Mar. Sci. 2016, 6, 4–5. [Google Scholar] [CrossRef]
- Honda, M.; Kannan, K. Biomonitoring of chlorophenols in human urine from several Asian countries, Greece and the United States. Environ. Pollut. 2018, 232, 487–493. [Google Scholar] [CrossRef]
- Wang, W.; Kannan, K. Quantitative identification of and exposure to synthetic phenolic antioxidants, including butylated hydroxytoluene, in urine. Environ. Int. 2019, 128, 24–29. [Google Scholar] [CrossRef]
- Liu, R.; Mabury, S.A. Synthetic Phenolic Antioxidants: A Review of Environmental Occurrence, Fate, Human Exposure, and Toxicity. Environ. Sci. Technol. 2020, 54, 11706–11719. [Google Scholar] [CrossRef]
- Dương, T.-B.; Dwivedi, R.; Bain, L.J. 2,4-di-tert-butylphenol exposure impairs osteogenic differentiation. Toxicol. Appl. Pharmacol. 2023, 461, 116386. [Google Scholar] [CrossRef]
- Liu, R.; Mabury, S.A. Synthetic phenolic antioxidants and transformation products in dust from different indoor environments in Toronto, Canada. Sci. Total Environ. 2019, 672, 23–29. [Google Scholar] [CrossRef]
- Makahleh, A.; Saad, B.; Bari, M.F. Synthetic phenolics as antioxidants for food preservation. In Handbook of Antioxidants for Food Preservation; Elsevier Inc.: Amsterdam, The Netherlands, 2015; pp. 51–78. [Google Scholar] [CrossRef]
- Gonçalves-Filho, D.; De Souza, D. Detection of Synthetic Antioxidants: What Factors Affect the Efficiency in the Chromatographic Analysis and in the Electrochemical Analysis? Molecules 2022, 27, 7137. [Google Scholar] [CrossRef]
- Chen, Y.; Chen, Q.; Zhang, Q.; Zuo, C.; Shi, H. An Overview of Chemical Additives on (Micro)Plastic Fibers: Occurrence, Release, and Health Risks. Rev. Environ. Contam. Toxicol. 2022, 260, 22. [Google Scholar] [CrossRef]
- Wang, W.; Asimakopoulos, A.G.; Abualnaja, K.O.; Covaci, A.; Gevao, B.; Johnson-Restrepo, B.; Kumosani, T.A.; Malarvannan, G.; Minh, T.B.; Moon, H.-B.; et al. Synthetic Phenolic Antioxidants and Their Metabolites in Indoor Dust from Homes and Microenvironments. Environ. Sci. Technol. 2015, 50, 428–434. [Google Scholar] [CrossRef] [PubMed]
- Xu, X.; Liu, A.; Hu, S.; Ares, I.; Martínez-Larrañaga, M.-R.; Wang, X.; Martínez, M.; Anadón, A.; Martínez, M.-A. Synthetic phenolic antioxidants: Metabolism, hazards and mechanism of action. Food Chem. 2021, 353, 129488. [Google Scholar] [CrossRef]
- Hernández-Fernández, J.; Ortega-Toro, R.; López-Martinez, J. A New Route of Valorization of Petrochemical Wastewater: Recovery of 1,3,5-Tris (4-tert-butyl-3-hydroxy-2,6-dimethyl benzyl)–1,3,5-triazine-2,4,6-(1H,3H,5H)-trione (Cyanox 1790) and Its Subsequent Application in a PP Matrix to Improve Its Thermal Stability. Molecules 2003, 28, 2003. [Google Scholar] [CrossRef]
- Pavon, C.; Aldas, M.; López-Martínez, J.; Hernández-Fernández, J.; Arrieta, M.P. Films based on thermoplastic starch blended with pine resin derivatives for food packaging. Foods 2021, 10, 1171. [Google Scholar] [CrossRef] [PubMed]
- Hernández-Fernández, J.; Puello-Polo, E.; Castro-Suarez, J.R. Characterization of the Morphological and Chemical Profile of Different Families of Microplastics in Samples of Breathable Air. Molecules 2023, 28, 1042. [Google Scholar] [CrossRef]
- Pavón, C.; Aldas, M.; Hernández-Fernández, J.; López-Martínez, J. Comparative characterization of gum rosins for their use as sustainable additives in polymeric matrices. J. Appl. Polym. Sci. 2021, 139, 51734. [Google Scholar] [CrossRef]
- Bonachela, S.; López, J.; Granados, M.; Magán, J.; Hernández, J.; Baille, A. Effects of gravel mulch on surface energy balance and soil thermal regime in an unheated plastic greenhouse. Biosyst. Eng. 2020, 192, 1–13. [Google Scholar] [CrossRef]
- Hernández Fernández, J.; Cano, H.; Guerra, Y.; Puello Polo, E.; Ríos-Rojas, J.F.; Vivas-Reyes, R.; Oviedo, J. Identification and Quantification of Microplastics in Effluents of Wastewater Treatment Plant by Differential Scanning Calorimetry (DSC). Sustainability (Switzerland) 2022, 14, 4920. [Google Scholar] [CrossRef]
- Hernández-Fernández, J.; Guerra, Y.; Espinosa, E. Development and Application of a Principal Component Analysis Model to Quantify the Green Ethylene Content in Virgin Impact Copolymer Resins During Their Synthesis on an Industrial Scale. J. Polym. Environ. 2022, 30, 4800–4808. [Google Scholar] [CrossRef]
- European Parliament and Council Directive No 95/2/EC. 1995. Available online: https://eur-lex.europa.eu/eli/dir/1995/2/oj (accessed on 14 December 2022).
- Nurerk, P.; Bunkoed, O.; Jullakan, S.; Khongkla, S.; Llompart, M.; Poorahong, S. A dumbbell-shaped stir bar made from poly(3,4-ethylenedioxythiophene)-coated porous cryogel incorporating metal organic frameworks for the extraction of synthetic phenolic antioxidants in foodstuffs. J. Chromatogr. A 2021, 1655, 462497. [Google Scholar] [CrossRef] [PubMed]
- Wang, W.; Wang, X.; Zhu, Q.; Zhou, Q.; Wang, Y.; Liao, C.; Jiang, G. Occurrence of synthetic phenolic antioxidants in foodstuffs from ten provinces in China and its implications for human dietary exposure. Food Chem. Toxicol. 2022, 165, 113134. [Google Scholar] [CrossRef]
- Ham, J.; Lim, W.; Park, S.; Bae, H.; You, S.; Song, G. Synthetic phenolic antioxidant propyl gallate induces male infertility through disruption of calcium homeostasis and mitochondrial function. Environ. Pollut. 2019, 248, 845–856. [Google Scholar] [CrossRef] [PubMed]
- Ham, J.; Lim, W.; You, S.; Song, G. Butylated hydroxyanisole induces testicular dysfunction in mouse testis cells by dysregulating calcium homeostasis and stimulating endoplasmic reticulum stress. Sci. Total Environ. 2019, 702, 134775. [Google Scholar] [CrossRef] [PubMed]
- Scientific Opinion on the re-evaluation of butylated hydroxyanisole—BHA (E 320) as a food additive. EFSA J. 2011, 9, 2392. [CrossRef]
- Scientific Opinion on the re-evaluation of butylated hydroxytoluene BHT (E 321) as a food additive. EFSA J. 2012, 10, 2588. [CrossRef]
- Statement on the refined exposure assessment of tertiary-butyl hydroquinone (E 319). EFSA J. 2016, 14, 4363. [CrossRef] [Green Version]
- Scientific Opinion on the re-evaluation of propyl gallate (E 310) as a food additive. EFSA J. 2014, 12, 3642. [CrossRef]
- Hernández-Fernández, J.; Guerra, Y.; Puello-Polo, E.; Marquez, E. Effects of Different Concentrations of Arsine on the Synthesis and Final Properties of Polypropylene. Polymers 2022, 14, 3123. [Google Scholar] [CrossRef]
- Joaquin, H.-F.; Juan, L.-M. Autocatalytic influence of different levels of arsine on the thermal stability and pyrolysis of polypropylene. J. Anal. Appl. Pyrolysis 2021, 161, 105385. [Google Scholar] [CrossRef]
- Hernández-Fernández, J.; Cano, H.; Aldas, M. Impact of Traces of Hydrogen Sulfide on the Efficiency of Ziegler–Natta Catalyst on the Final Properties of Polypropylene. Polymers 2022, 14, 3910. [Google Scholar] [CrossRef]
- Hernández-Fernández, J.; Vivas-Reyes, R.; Toloza, C.A.T. Experimental Study of the Impact of Trace Amounts of Acetylene and Methylacetylene on the Synthesis, Mechanical and Thermal Properties of Polypropylene. Int. J. Mol. Sci. 2022, 23, 12148. [Google Scholar] [CrossRef] [PubMed]
- Hernández-Fernández, J.; Cano-Cuadro, H.; Puello-Polo, E. Emission of Bisphenol A and Four New Analogs from Industrial Wastewater Treatment Plants in the Production Processes of Polypropylene and Polyethylene Terephthalate in South America. Sustainability 2022, 14, 10919. [Google Scholar] [CrossRef]
- Hernández-Fernández, J.; Castro-Suarez, J.R.; Toloza, C.A.T. Iron Oxide Powder as Responsible for the Generation of Industrial Polypropylene Waste and as a Co-Catalyst for the Pyrolysis of Non-Additive Resins. Int. J. Mol. Sci. 2022, 23, 11708. [Google Scholar] [CrossRef]
- CYTEC. Cyanox 1790 Material Safety Data Sheet. 2019. Available online: https://www.echemi.com/sds/tris4-tert-butyl-3-hydroxy-26-dimethylbenzylisocyanurate-pid_Seven42940.html (accessed on 27 October 2022).
- Altaf, M.; Najam, T.; Jabeen, S.; Wattoo, M.; Bashair, M.; Ahmad, S.; Rehman, A. Facile synthesis of Tri-metallic layered double hydroxides (NiZnAl-LDHs): Adsorption of Rhodamine-B and methyl orange from water. Inorg. Chem. Commun. 2022, 145, 110008. [Google Scholar] [CrossRef]
- Altaf, M.; Najam, T.; Jabeen, S.; Wattoo, M.; Bashair, M.; Ahmad, S.; Rehman, A. Heterointerface engineering of water stable ZIF-8@ZIF-67: Adsorption of rhodamine B from water. Surf. Interfaces 2022, 34, 102324. [Google Scholar] [CrossRef]
- da Silva Costa, R.; Fernandes, T.S.M.; Almeida, E.D.S.; Oliveira, J.T.; Guedes, J.A.C.; Zocolo, G.J.; de Sousa, F.W.; Nascimento, R.F.D. Potential risk of BPA and phthalates in commercial water bottles: A mini review. J. Water Health 2021, 19, 411–435. [Google Scholar] [CrossRef]
- Parto, M.; Aazami, J.; Shamsi, Z.; Zamani, A.; Savabieasfahani, M. Determination of bisphenol-A in plastic bottled water in markets of Zanjan, Iran. Int. J. Environ. Sci. Technol. 2021, 19, 3337–3344. [Google Scholar] [CrossRef]
- Ghanem, A.; Maalouly, J.; Saad, R.A.; Salameh, D.; Saliba, C.O. Safety of Lebanese Bottled Waters: VOCs Analysis and Migration Studies. Am. J. Anal. Chem. 2013, 4, 176–189. [Google Scholar] [CrossRef] [Green Version]
- Al-Mudhaf, H.F.; Alsharifi, F.A.; Abu-Shady, A.-S.I. A survey of organic contaminants in household and bottled drinking waters in Kuwait. Sci. Total Environ. 2009, 407, 1658–1668. [Google Scholar] [CrossRef]
- Gambino, I.; Bagordo, F.; Grassi, T.; Panico, A.; De Donno, A. Occurrence of Microplastics in Tap and Bottled Water: Current Knowledge. Int. J. Environ. Res. Public Health 2022, 19, 5283. [Google Scholar] [CrossRef]
- Welle, F.; Franz, R. Microplastic in bottled natural mineral water—Literature review and considerations on exposure and risk assessment. Food Addit. Contam. Part A 2018, 35, 2482–2492. [Google Scholar] [CrossRef]
- Maxwell, O.; Olusegun, O.A.; Emmanuel, S.J.; Sociis, T.O.; Efemena, A.O.; Akinwumi, A.; Theophilus, E.A. Potential Health Risks of Heavy Metal Contents in Bottled Water from Lagos State and Its Environs, Nigeria. IOP Conf. Ser. Earth Environ. Sci. 2018, 173, 012021. [Google Scholar] [CrossRef]
- Nazir, M.A.; Yasar, A.; Bashir, M.A.; Siyal, S.H.; Najam, T.; Javed, M.S.; Ahmad, K.; Hussain, S.; Anjum, S.; Hussain, E.; et al. Quality assessment of the noncarbonated-bottled drinking water: Comparison of their treatment techniques. Int. J. Environ. Anal. Chem. 2020, 102, 8195–8206. [Google Scholar] [CrossRef]
- Leavey-Roback, S. Heavy Metals in Bottled Natural Spring Water Article. 2011. Available online: https://www.researchgate.net/publication/51213966 (accessed on 3 January 2023).
- Ding, J.; Shen, X.; Liu, W.; Covaci, A.; Yang, F. Occurrence and risk assessment of organophosphate esters in drinking water from Eastern China. Sci. Total Environ. 2015, 538, 959–965. [Google Scholar] [CrossRef]
- Josyula, A.B.; McClellen, H.; Hysong, T.A.; Kurzius-Spencer, M.; Poplin, G.S.; Stürup, S.; Burgess, J.L. Reduction in Urinary Arsenic with Bottled-water Intervention. J. Health Popul. Nutr. 2006, 24, 298–304. [Google Scholar]
- Mostafa, M.G.; Cherry, N. Arsenic in Drinking Water, Transition Cell Cancer and Chronic Cystitis in Rural Bangladesh. Int. J. Environ. Res. Public Health 2015, 12, 13739–13749. [Google Scholar] [CrossRef] [Green Version]
- Ward, M.H.; Jones, R.R.; Brender, J.D.; De Kok, T.M.; Weyer, P.J.; Nolan, B.T.; Villanueva, C.M.; Van Breda, S.G. Drinking Water Nitrate and Human Health: An Updated Review. Int. J. Environ. Res. Public Health 2018, 15, 1557. [Google Scholar] [CrossRef] [Green Version]
- Hafeman, D.; Factor-Litvak, P.; Cheng, Z.; Van Geen, A.; Ahsan, H. Association between Manganese Exposure through Drinking Water and Infant Mortality in Bangladesh. Environ. Health Perspect. 2007, 115, 1107–1112. [Google Scholar] [CrossRef] [Green Version]
- Carvalho, S.M.; Santos, D. Consumo de agua embotellada en envases plásticos y sus consecuencias para la salud familiar y comunitaria. 2020. Available online: https://repositorio.unbosque.edu.co/bitstream/handle/20.500.12495/4410/Carvalho_DosSantos_Sandra_Mar%25C3%25ADa_2020.pdf?sequence=1&isAllowed=y (accessed on 12 January 2023).
- Aslani, H.; Pashmtab, P.; Shaghaghi, A.; Mohammadpoorasl, A.; Taghipour, H.; Zarei, M. Tendencies towards bottled drinking water consumption: Challenges ahead of polyethylene terephthalate (PET) waste management. Health Promot. Perspect. 2021, 11, 60–68. [Google Scholar] [CrossRef]
- Díez, J.R.; Antigüedad, I.; Agirre, E.; Rico, A. Perceptions and Consumption of Bottled Water at the University of the Basque Country: Showcasing Tap Water as the Real Alternative towards a Water-Sustainable University. Sustainability 2018, 10, 3431. [Google Scholar] [CrossRef] [Green Version]
- Jain; Singh, A.K.; Susan, M.A.B.H. The World around Bottled Water. Bottled Packaged Water 2019, 4, 39–61. [Google Scholar] [CrossRef]
- Hernández-Fernández, J.; Puello-Polo, E.; Trilleras, J. Characterization of Microplastics in Total Atmospheric Deposition Sampling from Areas Surrounding Industrial Complexes in Northwestern Colombia. Sustainability 2022, 14, 13613. [Google Scholar] [CrossRef]
- Farzadkia, M.; Shahamat, Y.D.; Nasseri, S.; Mahvi, A.H.; Gholami, M.; Shahryari, A. Catalytic Ozonation of Phenolic Wastewater: Identification and Toxicity of Intermediates. J. Eng. 2014, 2014, 520929. [Google Scholar] [CrossRef] [Green Version]
- Guo, L.; Hu, Y.; Lei, Y.; Wu, H.; Yang, G.; Wang, Y.; Wei, G. Vitrification of petrochemical sludge for rapid, facile, and sustainable fixation of heavy metals. J. Environ. Chem. Eng. 2022, 10, 108812. [Google Scholar] [CrossRef]
- Wang, S.; Kalkhajeh, Y.K.; Qin, Z.; Jiao, W. Spatial distribution and assessment of the human health risks of heavy metals in a retired petrochemical industrial area, south China. Environ. Res. 2020, 188, 109661. [Google Scholar] [CrossRef]
- Kanu, I.; Achi, O. Industrial Effluents and Their Impact on Water Quality of Receiving Rivers in Nigeria Medical Microbiology View Project Fermented Food Development View Project. 2011. Available online: https://www.researchgate.net/publication/287104597 (accessed on 13 January 2023).
- Radelyuk, I.; Tussupova, K.; Klemeš, J.J.; Persson, K.M. Oil refinery and water pollution in the context of sustainable development: Developing and developed countries. J. Clean. Prod. 2021, 302, 126987. [Google Scholar] [CrossRef]
- Rodil, R.; Quintana, J.B.; Basaglia, G.; Pietrogrande, M.C.; Cela, R. Determination of synthetic phenolic antioxidants and their metabolites in water samples by downscaled solid-phase extraction, silylation and gas chromatography–mass spectrometry. J. Chromatogr. A 2010, 1217, 6428–6435. [Google Scholar] [CrossRef]
- Spectrabase. Cyanox 1790-FTIR-Spectrum-SpectraBase, 22 August 2022. Cyanox 1790 Antioxidant. Available online: https://spectrabase.com/spectrum/I3g5xqi3f4q (accessed on 18 January 2023).
- Casagrande, M.; Kulsing, C.; Althakafy, J.T.; Piatnicki, C.M.S.; Marriott, P.J. Direct Analysis of Synthetic Phenolic Antioxidants, and Fatty Acid Methyl Ester Stability in Biodiesel by Liquid Chromatography and High-Resolution Mass Spectrometry. Chromatographia 2018, 82, 271–278. [Google Scholar] [CrossRef]
- Alladio, E.; Amante, E.; Bozzolino, C.; Seganti, F.; Salomone, A.; Vincenti, M.; Desharnais, B. Effective validation of chromatographic analytical methods: The illustrative case of androgenic steroids. Talanta 2020, 215, 120867. [Google Scholar] [CrossRef] [PubMed]
- Fernández, J.H.; Rincón, D.; López-Martínez, J. Development and validation of a prototype for the on-line simultaneous analysis of quality caprolactam synthesized on an industrial scale. Methodsx 2022, 10, 101952. [Google Scholar] [CrossRef] [PubMed]
- McMurry, J.E. Synthetic Polymers. In Organic Chemistry; ACS Publications: Washington, DC, USA, 2011; p. 1242. Available online: https://www.aspu.edu.sy/laravel-filemanager/files/31/McMurry%20Organic%20Chemistry%208th%20txtbk_compressed.pdf (accessed on 4 January 2023).


| Bottled Water Sample Collection Information | |||||||
|---|---|---|---|---|---|---|---|
| Beverage Brand | Sampling Frequency (days) | Container Recycling | Analyst 1 | Analyst 2 | Analyst 3 | Analyst 4 | Analyst 5 |
| A | 1/5/10/15/ 30/45/60/72/90 | No | x | x | x | x | x |
| B | 1/5/10/15/ 30/45/60/72/90 | No | x | x | x | x | x |
| C | 1/5/10/15/ 30/45/60/72/90 | No | x | x | x | x | x |
| D | 1/5/10/15/ 30/45/60/72/90 | Yes | x | x | x | x | x |
| E | 1/5/10/15/ 30/45/60/72/90 | Yes | x | x | x | x | x |
| F | 1/5/10/15/ 30/45/60/72/90 | Yes | x | x | x | x | x |
| Repeatability of standards with CH2Cl2 | Reproducibility of standards with CH2Cl2 | |||||||||
|---|---|---|---|---|---|---|---|---|---|---|
| Factor | N | Average | Grouping | Factor | N | Average | Grouping | |||
| Analyst 1–3 | 10 | 0.973 | A | Analyst 1 | 10 | 0.946 | A | |||
| Analyst 1–4 | 10 | 0.965 | A | Analyst 3 | 10 | 0.939 | A | |||
| Analyst 1–1 | 10 | 0.959 | A | Analyst 5 | 10 | 0.933 | A | |||
| Analyst 1–5 | 10 | 0.954 | A | Analyst 4 | 10 | 0.928 | A | |||
| Analyst 1–2 | 10 | 0.949 | A | Analyst 2 | 10 | 0.921 | A | |||
| Repeatability of standards with CH2CN in SPE | Reproducibility of standards with CH2CN in SPE | |||||||||
| Factor | N | Average | Grouping | Factor | N | Average | Grouping | |||
| Analyst 1–3 | 10 | 0.979 | A | Analyst 1 | 10 | 0.971 | A | |||
| Analyst 1–4 | 10 | 0.976 | A | Analyst 5 | 10 | 0.967 | A | |||
| Analyst 1–1 | 10 | 0.973 | A | Analyst 4 | 10 | 0.967 | A | |||
| Analyst 1–2 | 10 | 0.968 | A | Analyst 2 | 10 | 0.959 | A | |||
| Analyst 1–5 | 10 | 0.957 | A | Analyst 3 | 10 | 0.955 | A | |||
| Reproducibility of samples with CH2CN on SPE | ||||||||||
| Factor | N | Average | Grouping | |||||||
| Analyst 1 | 40 | 1718 | A | |||||||
| Analyst 4 | 40 | 1710 | A | |||||||
| Analyst 5 | 40 | 1699 | A | |||||||
| Analyst 2 | 40 | 1696 | A | |||||||
| Analyst 3 | 40 | 1695 | A | |||||||
| SPE with Acetonitrile (HPLC-MS Results) | |||||||||||
|---|---|---|---|---|---|---|---|---|---|---|---|
| Interday Test (Different Days) Samples | |||||||||||
| Sample | Brand | Storage Time | Recycled Material | Analyst 1 | Analyst 2 | Analyst 3 | Analyst 4 | Analyst 5 | Average | Deviation | RSD |
| 1 | A | 1 | NO | 0.010 | 0.010 | 0.010 | 0.010 | 0.011 | 0.01 | 0.0 | 4.4 |
| 2 | B | 1 | 0.230 | 0.250 | 0.250 | 0.260 | 0.250 | 0.25 | 0.0 | 4.4 | |
| 3 | C | 1 | 0.310 | 0.300 | 0.320 | 0.310 | 0.300 | 0.31 | 0.0 | 2.7 | |
| 4 | D | 1 | YES | 0.100 | 0.110 | 0.110 | 0.100 | 0.100 | 0.10 | 0.0 | 5.3 |
| 5 | E | 1 | 0.210 | 0.220 | 0.200 | 0.210 | 0.200 | 0.21 | 0.0 | 4.0 | |
| 6 | F | 1 | 0.300 | 0.310 | 0.280 | 0.300 | 0.290 | 0.30 | 0.0 | 3.9 | |
| 7 | A | 5 | NO | 0.020 | 0.019 | 0.021 | 0.020 | 0.019 | 0.02 | 0.0 | 4.2 |
| 8 | B | 5 | 0.030 | 0.031 | 0.032 | 0.030 | 0.029 | 0.03 | 0.0 | 3.8 | |
| 9 | C | 5 | 0.042 | 0.040 | 0.039 | 0.041 | 0.042 | 0.04 | 0.0 | 3.2 | |
| 10 | D | 5 | YES | 0.030 | 0.031 | 0.032 | 0.030 | 0.030 | 0.03 | 0.0 | 2.9 |
| 11 | E | 5 | 0.050 | 0.051 | 0.052 | 0.050 | 0.050 | 0.05 | 0.0 | 1.8 | |
| 12 | F | 5 | 0.060 | 0.061 | 0.063 | 0.060 | 0.060 | 0.06 | 0.0 | 2.1 | |
| 13 | A | 10 | NO | 0.030 | 0.031 | 0.032 | 0.030 | 0.030 | 0.03 | 0.0 | 2.9 |
| 14 | B | 10 | 0.040 | 0.042 | 0.040 | 0.042 | 0.041 | 0.04 | 0.0 | 2.4 | |
| 15 | C | 10 | 0.060 | 0.062 | 0.061 | 0.062 | 0.063 | 0.06 | 0.0 | 1.9 | |
| 16 | D | 10 | YES | 0.070 | 0.072 | 0.073 | 0.072 | 0.072 | 0.07 | 0.0 | 1.5 |
| 17 | E | 10 | 0.080 | 0.081 | 0.083 | 0.084 | 0.084 | 0.08 | 0.0 | 2.2 | |
| 18 | F | 10 | 0.090 | 0.093 | 0.092 | 0.093 | 0.092 | 0.09 | 0.0 | 1.3 | |
| 19 | A | 15 | NO | 0.050 | 0.053 | 0.052 | 0.051 | 0.052 | 0.05 | 0.0 | 2.2 |
| 20 | B | 15 | 0.050 | 0.056 | 0.057 | 0.056 | 0.055 | 0.05 | 0.0 | 5.1 | |
| 21 | C | 15 | 0.060 | 0.062 | 0.063 | 0.062 | 0.061 | 0.06 | 0.0 | 1.9 | |
| 22 | D | 15 | YES | 0.170 | 0.160 | 0.170 | 0.170 | 0.170 | 0.17 | 0.0 | 2.7 |
| 23 | E | 15 | 0.180 | 0.190 | 0.170 | 0.180 | 0.190 | 0.18 | 0.0 | 4.6 | |
| 24 | F | 15 | 0.240 | 0.220 | 0.230 | 0.240 | 0.220 | 0.23 | 0.0 | 4.3 | |
| 25 | A | 30 | NO | 0.110 | 0.120 | 0.120 | 0.110 | 0.120 | 0.12 | 0.0 | 4.7 |
| 26 | B | 30 | 0.140 | 0.130 | 0.140 | 0.130 | 0.140 | 0.14 | 0.0 | 4.0 | |
| 27 | C | 30 | 0.180 | 0.190 | 0.180 | 0.170 | 0.170 | 0.18 | 0.0 | 4.7 | |
| 28 | D | 30 | YES | 0.350 | 0.370 | 0.360 | 0.380 | 0.350 | 0.36 | 0.0 | 3.6 |
| 29 | E | 30 | 0.440 | 0.450 | 0.470 | 0.460 | 0.480 | 0.46 | 0.0 | 3.4 | |
| 30 | F | 30 | 0.500 | 0.530 | 0.520 | 0.540 | 0.550 | 0.53 | 0.0 | 3.6 | |
| 31 | A | 45 | NO | 0.860 | 0.890 | 0.870 | 0.850 | 0.840 | 0.86 | 0.0 | 2.2 |
| 32 | B | 45 | 0.940 | 0.930 | 0.910 | 0.970 | 0.950 | 0.94 | 0.0 | 2.4 | |
| 33 | C | 45 | 1.120 | 1.120 | 1.100 | 1.110 | 1.000 | 1.09 | 0.1 | 4.7 | |
| 34 | D | 45 | YES | 2.620 | 2.500 | 2.390 | 2.450 | 2.430 | 2.48 | 0.1 | 3.6 |
| 35 | E | 45 | 2.710 | 2.730 | 2.860 | 2.940 | 2.760 | 2.80 | 0.1 | 3.5 | |
| 36 | F | 45 | 3.240 | 3.090 | 3.160 | 3.240 | 3.100 | 3.17 | 0.1 | 2.3 | |
| 37 | A | 60 | NO | 1.710 | 1.630 | 1.840 | 1.730 | 1.700 | 1.72 | 0.1 | 4.4 |
| 38 | B | 60 | 1.500 | 1.630 | 1.570 | 1.670 | 1.590 | 1.59 | 0.1 | 4.0 | |
| 39 | C | 60 | 1.490 | 1.370 | 1.350 | 1.420 | 1.330 | 1.39 | 0.1 | 4.6 | |
| 40 | D | 60 | YES | 4.490 | 4.520 | 4.430 | 4.090 | 4.330 | 4.37 | 0.2 | 4.0 |
| 41 | E | 60 | 5.330 | 5.190 | 5.240 | 5.310 | 5.270 | 5.27 | 0.1 | 1.1 | |
| 42 | F | 60 | 5.160 | 5.090 | 5.200 | 4.990 | 5.190 | 5.13 | 0.1 | 1.7 | |
| 43 | A | 72 | NO | 2.270 | 2.190 | 2.240 | 2.340 | 2.110 | 2.23 | 0.1 | 3.9 |
| 44 | B | 72 | 1.980 | 1.950 | 2.010 | 1.890 | 1.830 | 1.93 | 0.1 | 3.7 | |
| 45 | C | 72 | 2.520 | 2.640 | 2.780 | 2.660 | 2.450 | 2.61 | 0.1 | 4.9 | |
| 46 | D | 72 | YES | 7.850 | 7.640 | 7.550 | 7.460 | 7.910 | 7.68 | 0.2 | 2.5 |
| 47 | E | 72 | 8.120 | 8.060 | 8.450 | 8.330 | 8.610 | 8.31 | 0.2 | 2.7 | |
| 48 | F | 72 | 6.990 | 7.120 | 7.260 | 7.330 | 7.190 | 7.18 | 0.1 | 1.8 | |
| 49 | A | 90 | NO | 4.510 | 4.260 | 4.010 | 4.110 | 4.260 | 4.23 | 0.2 | 4.5 |
| 50 | B | 90 | 3.850 | 3.760 | 3.460 | 3.520 | 3.740 | 3.67 | 0.2 | 4.6 | |
| 51 | C | 90 | 4.110 | 4.130 | 3.990 | 4.180 | 4.370 | 4.16 | 0.1 | 3.3 | |
| 52 | D | 90 | YES | 9.110 | 9.250 | 9.130 | 9.470 | 9.150 | 9.22 | 0.1 | 1.6 |
| 53 | E | 90 | 10.120 | 10.190 | 10.450 | 10.420 | 10.720 | 10.38 | 0.2 | 2.3 | |
| 54 | F | 90 | 11.280 | 11.190 | 11.310 | 11.120 | 11.430 | 11.27 | 0.1 | 1.1 | |
Disclaimer/Publisher’s Note: The statements, opinions and data contained in all publications are solely those of the individual author(s) and contributor(s) and not of MDPI and/or the editor(s). MDPI and/or the editor(s) disclaim responsibility for any injury to people or property resulting from any ideas, methods, instructions or products referred to in the content. |
© 2023 by the authors. Licensee MDPI, Basel, Switzerland. This article is an open access article distributed under the terms and conditions of the Creative Commons Attribution (CC BY) license (https://creativecommons.org/licenses/by/4.0/).
Share and Cite
Hernández-Fernández, J.; Ortega-Toro, R.; Castro-Suarez, J.R. Quantification of the Synthetic Phenolic Antioxidant Cyanox 1790 in Bottled Water with SPE-HPLC/MS/MS and Determination of the Impact of the Use of Recycled Packaging on Its Generation. Water 2023, 15, 933. https://doi.org/10.3390/w15050933
Hernández-Fernández J, Ortega-Toro R, Castro-Suarez JR. Quantification of the Synthetic Phenolic Antioxidant Cyanox 1790 in Bottled Water with SPE-HPLC/MS/MS and Determination of the Impact of the Use of Recycled Packaging on Its Generation. Water. 2023; 15(5):933. https://doi.org/10.3390/w15050933
Chicago/Turabian StyleHernández-Fernández, Joaquín, Rodrigo Ortega-Toro, and John R. Castro-Suarez. 2023. "Quantification of the Synthetic Phenolic Antioxidant Cyanox 1790 in Bottled Water with SPE-HPLC/MS/MS and Determination of the Impact of the Use of Recycled Packaging on Its Generation" Water 15, no. 5: 933. https://doi.org/10.3390/w15050933