
Study on the Occurrence of Artificial Sweeteners, Parabens, and Other Emerging Contaminants in Hospital Wastewater Using LC-QToF-MS Target Screening Approach
 ,
,  ,
, 
Abstract
:1. Introduction
2. Materials and Methods
2.1. Standards and Chemicals
2.2. Study Site and Sample Collection
2.3. Conventional Physico-Chemical Analyses
2.4. Extraction and Analysis of Contaminants
2.5. Data Treatment and Statistical Analysis
3. Results and Discussion
3.1. Conventional Physico-Chemical Parameters
3.2. Occurrence and Concentrations of Contaminants in Hospital Wastewater
3.3. Comparison with Literature Data Originated from Greek Municipal Wastewater
4. Conclusions
Supplementary Materials
Author Contributions
Funding
Data Availability Statement
Acknowledgments
Conflicts of Interest
References
- Health Statistics at Regional Level. Available online: https://ec.europa.eu/eurostat/statistics-explained/index.php?title=Health_statistics_at_regional_level (accessed on 6 February 2023).
- Zhang, X.; Yan, S.; Chen, J.; Tyagi, R.D.; Li, J. Physical, chemical, and biological impact (hazard) of hospital wastewater on environment: Presence of pharmaceuticals, pathogens, and antibiotic-resistance genes. In Current Developments in Biotechnology and Bioengineering; Elsevier: Amsterdam, The Netherlands, 2020; pp. 79–102. [Google Scholar] [CrossRef]
- Ajala, O.J.; Tijani, J.O.; Salau, R.B.; Abdulkareem, A.S.; Aremu, O.S. A review of emerging micro-pollutants in hospital wastewater: Environmental fate and remediation options. Results Eng. 2022, 16, 100671. [Google Scholar] [CrossRef]
- Arvaniti, O.S.; Arvaniti, E.S.; Gyparakis, S.; Sabathianakis, I.; Karagiannis, E.; Pettas, E.; Gkotsis, G.; Nika, M.C.; Thomaidis, N.S.; Manios, T.; et al. Occurrence of pharmaceuticals in the wastewater of a Greek hospital: Combining consumption data collection and LC-QTOF-MS analysis. Sci. Total Environ. 2023, 858, 160153. [Google Scholar] [CrossRef]
- Kaliakatsos, A.; Gounaki, I.; Dokianakis, S.; Maragkaki, E.; Stasinakis, A.S.; Gyparakis, S.; Katsarakis, N.; Manios, T.; Fountoulakis, M.S.; Venieri, D. Treatment of hospital wastewater: Emphasis on ecotoxicity and antibiotic resistance genes. J. Chem. Technol. Biotechnol. 2023, in press. [Google Scholar] [CrossRef]
- Khan, N.A.; Ahmed, S.; Farooqi, I.H.; Ali, I.; Vambol, V.; Changani, F.; Yousefi, M.; Vambol, S.; Khan, A.H. Occurrence, sources and conventional treatment techniques for various antibiotics present in hospital wastewaters: A critical review. TrAC Trends Anal. Chem. 2020, 129, 115921. [Google Scholar] [CrossRef]
- Kosma, C.I.; Kapsi, M.G.; Konstas, P.S.G.; Trantopoulos, E.P.; Boti, V.I.; Konstantinou, I.K.; Albanis, T.A. Assessment of multiclass pharmaceutical active compounds (PhACs) in hospital WWTP influent and effluent samples by UHPLC-Orbitrap MS: Temporal variation, removals and environmental risk assessment. Environ. Res. 2020, 191, 110152. [Google Scholar] [CrossRef]
- Majumder, A.; Gupta, A.K.; Ghosal, P.S.; Varma, M. A review on hospital wastewater treatment: A special emphasis on occurrence and removal of pharmaceutically active compounds, resistant microorganisms, and SARS-CoV-2. J. Environ. Chem. Eng. 2021, 9, 104812. [Google Scholar] [CrossRef]
- Serna-Galvis, E.A.; Botero-Coy, A.M.; Rosero-Moreano, M.; Lee, J.; Hernández, F.; Torres-Palma, R.A. An initial approach to the presence of pharmaceuticals in wastewater from hospitals in Colombia and their environmental risk. Water 2022, 14, 950. [Google Scholar] [CrossRef]
- Balbani, A.P.S.; Stelzer, L.B.; Montovani, J.C. Pharmaceutical excipients and the information on drug labels. Rev. Bras. Otorrinolaringol. 2006, 72, 400–406. [Google Scholar] [CrossRef]
- Ursino, M.G.; Poluzzi, E.; Caramella, C.; De Ponti, F. Excipients in medicinal products used in gastroenterology as a possible cause of side effects. Regul. Toxicol. Pharmacol. 2011, 60, 93–105. [Google Scholar] [CrossRef]
- Saito, J.; Nadatani, N.; Setoguchi, M.; Nakao, M.; Kimura, H.; Sameshima, M.; Kobayashi, K.; Matsumoto, H.; Yoshikawa, N.; Yokoyama, T.; et al. Potentially harmful excipients in neonatal medications: A multicenter nationwide observational study in Japan. J. Pharm. Health Care Sci. 2021, 7, 23. [Google Scholar] [CrossRef]
- Haman, C.; Dauchy, X.; Rosin, C.; Munoz, J.F. Occurrence, fate and behavior of parabens in aquatic environments: A review. Water Res. 2015, 68, 1–11. [Google Scholar] [CrossRef] [PubMed]
- Belton, K.; Schaefer, E.; Guiney, P.D. A review of the environmental fate and effects of acesulfame-potassium. Integr. Environ. Assess. Manag. 2020, 16, 421–437. [Google Scholar] [CrossRef] [Green Version]
- Drugs Database. Available online: https://www.drugs.com/inactive/triethyl-citrate-114.html#ref1 (accessed on 6 February 2023).
- DRUGBANK Database. Available online: https://go.drugbank.com/ (accessed on 6 February 2023).
- Mazioti, A.A.; Stasinakis, A.S.; Psoma, A.K.; Thomaidis, N.S.; Andersen, H.R. Hybrid Moving Bed Biofilm Reactor for the biodegradation of benzotriazoles and hydroxy-benzothiazole in wastewater. J. Hazard. Mater. 2017, 323, 299–310. [Google Scholar] [CrossRef] [Green Version]
- Gönder, Z.B.; Kara, E.M.; Celik, B.O.; Vergili, I.; Kaya, Y.; Altinkum, S.M.; Bagdatli, Y.; Yilmaz, G. Detailed characterization, antibiotic resistance and seasonal variation of hospital wastewater. Environ. Sci. Pollut. Res. 2021, 28, 16380–16393. [Google Scholar] [CrossRef]
- Stasinakis, A.S.; Thomaidis, N.S.; Arvaniti, O.S.; Asimakopoulos, A.G.; Samaras, V.G.; Ajibola, A.; Mamais, D.; Lekkas, T.D. Contribution of primary and secondary treatment on the removal of benzothiazoles, benzotriazoles, endocrine disruptors, pharmaceuticals and perfluorinated compounds in a sewage treatment plant. Sci. Total Environ. 2013, 463, 1067–1075. [Google Scholar] [CrossRef]
- Ekpeghere, K.I.; Sim, W.J.; Lee, H.J.; Oh, J.E. Occurrence and distribution of carbamazepine, nicotine, estrogenic compounds, and their transformation products in wastewater from various treatment plants and the aquatic environment. Sci. Total Environ. 2018, 640, 1015–1023. [Google Scholar] [CrossRef] [PubMed]
- Gago-Ferrero, P.; Bletsou, A.A.; Damalas, D.E.; Aalizadeh, R.; Alygizakis, N.A.; Singer, H.P.; Hollender, J.; Thomaidis, N.S. Wide-scope target screening of >2000 emerging contaminants in wastewater samples with UPLC-Q-ToF-HRMS/MS and smart evaluation of its performance through the validation of 195 selected representative analytes. J. Hazard. Mater. 2020, 387, 121712. [Google Scholar] [CrossRef]
- Beretsou, V.G.; Nika, M.C.; Manoli, K.; Michael, C.; Sui, Q.; Lundy, L.; Revitt, D.M.; Thomaidis, N.S.; Fatta-Kassinos, D. Multiclass target analysis of contaminants of emerging concern including transformation products, soil bioavailability assessment and retrospective screening as tools to evaluate risks associated with reclaimed water reuse. Sci. Total Environ. 2022, 852, 158391. [Google Scholar] [CrossRef] [PubMed]
- Thomaidis, N.; Aalizadeh, R.; Alygizakis, N.; Bletsou, A.; Beretsou, V.; Damalas, D.; Diamanti, K.; Gago-Ferrero, P.; Galani, A.; Gkotsis, G.; et al. NORMAN Suspect List Exchange (SusDat). 2022. Available online: https://zenodo.org/record/6012778#.Y1DPpnZByUl (accessed on 6 February 2023).
- Rodil, R.; Villaverde-de-Sáa, E.; Cobas, J.; Quintana, J.B.; Cela, R.; Carro, N. Legacy and emerging pollutants in marine bivalves from the Galician coast (NW Spain). Environ. Int. 2019, 129, 364–375. [Google Scholar] [CrossRef]
- Hites, R.A. Correcting for censored environmental measurements. Environ. Sci. Technol. 2022, 53, 11059–11060. [Google Scholar] [CrossRef] [Green Version]
- European Commission. Directive 2009/90/EC of the European Parliament and of the Council of 31 July 2009 on Technical Specifications for Chemical Analysis and Monitoring of Water Status. Available online: https://eur-lex.europa.eu/legal-content/EN/TXT/?uri=CELEX%3A32009L0090 (accessed on 15 December 2022).
- Stasinakis, A.S.; Gatidou, G.; Mamais, D.; Thomaidis, N.S.; Lekkas, T.D. Occurrence and fate of endocrine disrupters in Greek sewage treatment plants. Water Res. 2008, 42, 1796–1804. [Google Scholar] [CrossRef]
- Badry, A.; Treu, G.; Gkotsis, G.; Nika, M.C.; Alygizakis, N.; Thomaidis, N.S.; Voigt, C.C.; Krone, O. Ecological and spatial variations of legacy and emerging contaminants in white-tailed sea eagles from Germany: Implications for prioritisation and future risk management. Environ. Int. 2022, 158, 106934. [Google Scholar] [CrossRef]
- Daouk, S.; Chèvre, N.; Vernaz, N.; Widmer, C.; Daali, Y.; Fleury-Souverain, S. Dynamics of active pharmaceutical ingredients loads in a Swiss university hospital wastewaters and prediction of the related environmental risk for the aquatic ecosystems. Sci. Total Environ. 2016, 547, 244–253. [Google Scholar] [CrossRef]
- Verlicchi, P. Hospital Wastewaters: Characteristics, Management, Treatment and Environmental Risks. In The Handbook of Environmental Chemistry; Springer: Cham, Switzerland, 2018. [Google Scholar] [CrossRef]
- Arfaeinia, H.; Asadgol, Z.; Ramavandi, B.; Dobaradaran, S.; Kalantari, R.R.; Poureshgh, Y.; Behroozi, M.; Asgari, E.; Asl, F.B.; Sahebi, S. Monitoring and eco-toxicity effect of paraben-based pollutants in sediments/seawater, north of the Persian Gulf. Environ. Geochem. Health 2022, 44, 4499–4521. [Google Scholar] [CrossRef]
- Papageorgiou, M.; Zioris, I.; Danis, T.; Bikiaris, D.; Lambropoulou, D. Comprehensive investigation of a wide range of pharmaceuticals and personal care products in urban and hospital wastewaters in Greece. Sci. Total Environ. 2019, 694, 133565. [Google Scholar] [CrossRef]
- Vaudreuil, M.A.; Duy, S.V.; Munoz, G.; Sauvé, S. Pharmaceutical pollution of hospital effluents and municipal wastewaters of Eastern Canada. Sci. Total Environ. 2022, 846, 157353. [Google Scholar] [CrossRef]
- Yildiz, D. Nicotine, its metabolism and an overview of its biological effects. Toxicon 2004, 43, 619–632. [Google Scholar] [CrossRef]
- Kokotou, M.G.; Thomaidis, N.S. Determination of eight artificial sweeteners in wastewater by hydrophilic interaction liquid chromatography-tandem mass spectrometry. Anal. Methods 2013, 5, 3825–3833. [Google Scholar] [CrossRef]
- Kosma, C.I.; Lambropoulou, D.A.; Albanis, T.A. Investigation of PPCPs in wastewater treatment plants in Greece: Occurrence, removal and environmental risk assessment. Sci. Total Environ. 2014, 466, 421–438. [Google Scholar] [CrossRef] [PubMed]
- Ofrydopoulou, A.; Nannou, C.; Evgenidou, E.; Christodoulou, A.; Lambropoulou, D. Assessment of a wide array of organic micropollutants of emerging concern in wastewater treatment plants in Greece: Occurrence, removals, mass loading and potential risks. Sci. Total Environ. 2022, 802, 149860. [Google Scholar] [CrossRef] [PubMed]
- Stamatis, N.K.; Konstantinou, I.K. Occurrence and removal of emerging pharmaceutical, personal care compounds and caffeine tracer in municipal sewage treatment plant in Western Greece. J. Environ. Sci. Health 2013, 48 Pt B, 800–813. [Google Scholar] [CrossRef]
- Papageorgiou, M.; Kosma, C.; Lambropoulou, D. Seasonal occurrence, removal, mass loading and environmental risk assessment of 55 pharmaceuticals and personal care products in a municipal wastewater treatment plant in Central Greece. Sci. Total Environ. 2016, 543, 547–569. [Google Scholar] [CrossRef]
- Buerge, I.J.; Buser, H.R.; Kahle, M.; Muller, M.D.; Poiger, T. Ubiquitous occurrence of the artificial sweetener acesulfame in the aquatic environment: An ideal chemical marker of domestic wastewater in groundwater. Environ. Sci. Technol. 2009, 43, 4381–4385. [Google Scholar] [CrossRef]
- Scheurer, M.; Brauch, H.J.; Lange, F.T. Analysis and occurrence of seven artificial sweeteners in German wastewater and surface water and in soil aquifer treatment (SAT). Anal. Bioanal. Chem. 2009, 394, 1585–1594. [Google Scholar] [CrossRef] [PubMed]
- Reemtsma, T.; Miehe, U.; Duennbier, U.; Jekel, M. Polar pollutants in municipal wastewater and the water cycle: Occurrence and removal of benzotriazoles. Water Res. 2010, 44, 596–604. [Google Scholar] [CrossRef] [PubMed]
- Song, S.; Ruan, T.; Wang, T.; Liu, R.; Jiang, G. Occurrence and removal of benzotriazole ultraviolet stabilizers in a wastewater treatment plant in China. Environ. Sci. Process. Impacts 2014, 16, 1076–1082. [Google Scholar] [CrossRef] [PubMed]
- Voutsa, D.; Hartmann, P.; Schaffner, C.; Giger, W. Benzotriazoles, alkylphenols and bisphenol A in municipal wastewaters and in the Glatt River, Switzerland. Environ. Sci. Pollut. Res. 2006, 13, 333–341. [Google Scholar] [CrossRef] [Green Version]
- Ebrahimzadeh, G.; Nodehi, R.N.; Alimohammadi, M.; Kahkah, M.R.R.; Mahvi, A.H. Monitoring of caffeine concentration in infused tea, human urine, domestic wastewater and different water resources in southeast of Iran-caffeine an alternative indicator for contamination of human origin. J. Environ. Manag. 2021, 283, 111971. [Google Scholar] [CrossRef]
- Golovko, O.; Örn, S.; Sörengård, M.; Frieberg, K.; Nassazzi, W.; Lai, F.Y.; Ahrens, L. Occurrence and removal of chemicals of emerging concern in wastewater treatment plants and their impact on receiving water systems. Sci. Total Environ. 2021, 754, 142122. [Google Scholar] [CrossRef]


| Parameters | Period 1 | Period 2 | ||||||||||||||
|---|---|---|---|---|---|---|---|---|---|---|---|---|---|---|---|---|
| Point A | Point B | Point A | Point B | |||||||||||||
| Min | Median | Mean | Max | Min | Median | Mean | Max | Min | Median | Mean | Max | Min | Median | Mean | Max | |
| pH (Consort C932) | 8.6 | 8.7 | 8.7 * | 8.8 | 7.4 | 8.0 | 7.9 * | 8.0 | 8.3 | 9.0 | 8.8 * | 9.0 | 7.7 | 7.8 | 7.8 * | 7.9 |
| BOD5 (mg/L) (AQUALITIC sensor system) | 220 | 240 | 276 | 360 | 280 | 330 | 330 | 380 | 290 | 300 | 316 | 370 | 250 | 330 | 338 | 410 |
| COD (mg/L) (APHA (2005) 5220—D) | 677 | 804 | 770 | 823 | 656 | 669 | 760 | 1042 | 490 | 535 | 585 | 731 | 379 | 494 | 487 | 640 |
| TSS (mg/L) (APHA (2005) 2540—D) | 48 | 57 | 81 | 163 | 73 | 90 | 132 | 288 | 83 | 120 | 131 | 200 | 107 | 120 | 127 | 150 |
| TN (mg/L) (LCK 238) | 211 | 228 | 235 | 289 | 178 | 198 | 197 | 218 | 134 | 157 | 173 * | 222 | 69 | 91 | 89 * | 110 |
| TP (mg/L) (APHA (2005) 4500-P-B, Ε) | 8.5 | 10.7 | 10.9 | 13.4 | 9.0 | 10.7 | 10.4 | 11.5 | 6.0 | 8.2 | 9.1 * | 13.2 | 4.8 | 5.6 | 6.0 * | 7.9 |
| Compounds | Period 1 | Period 2 | ||||||||||
|---|---|---|---|---|---|---|---|---|---|---|---|---|
| Point A | Point B | Point A | Point B | |||||||||
| Min | Max | Average | Min | Max | Average | Min | Max | Average | Min | Max | Average | |
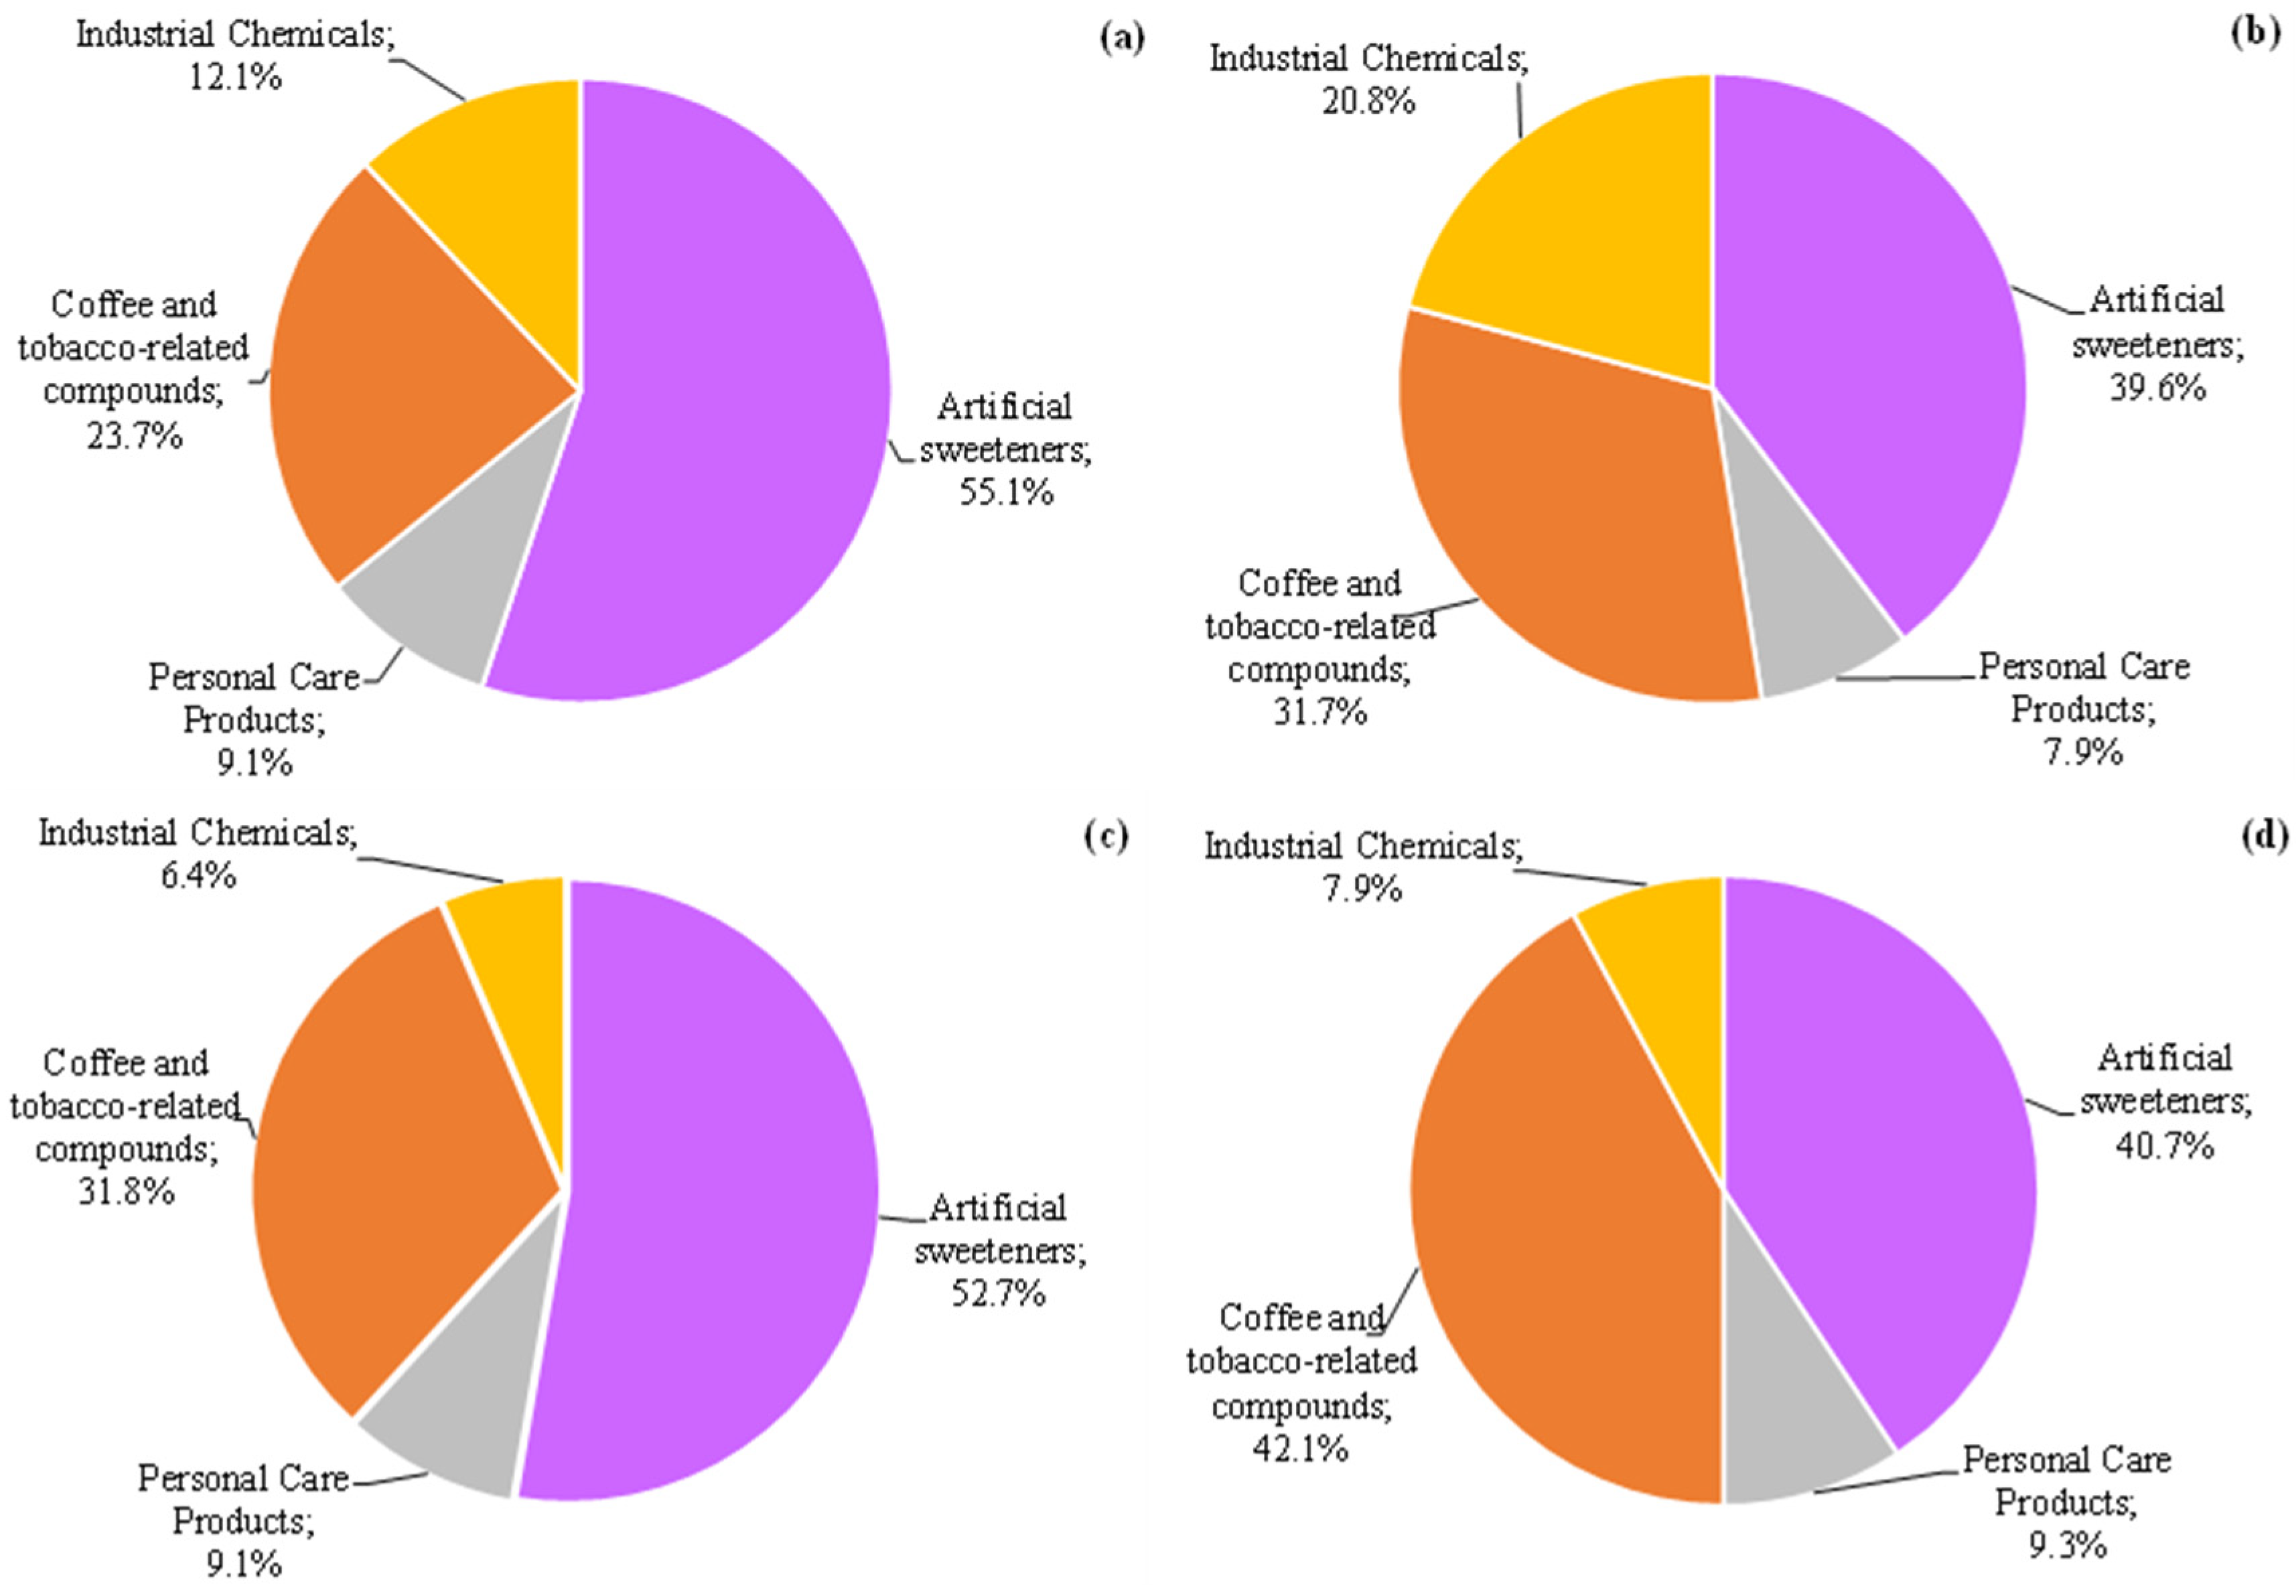
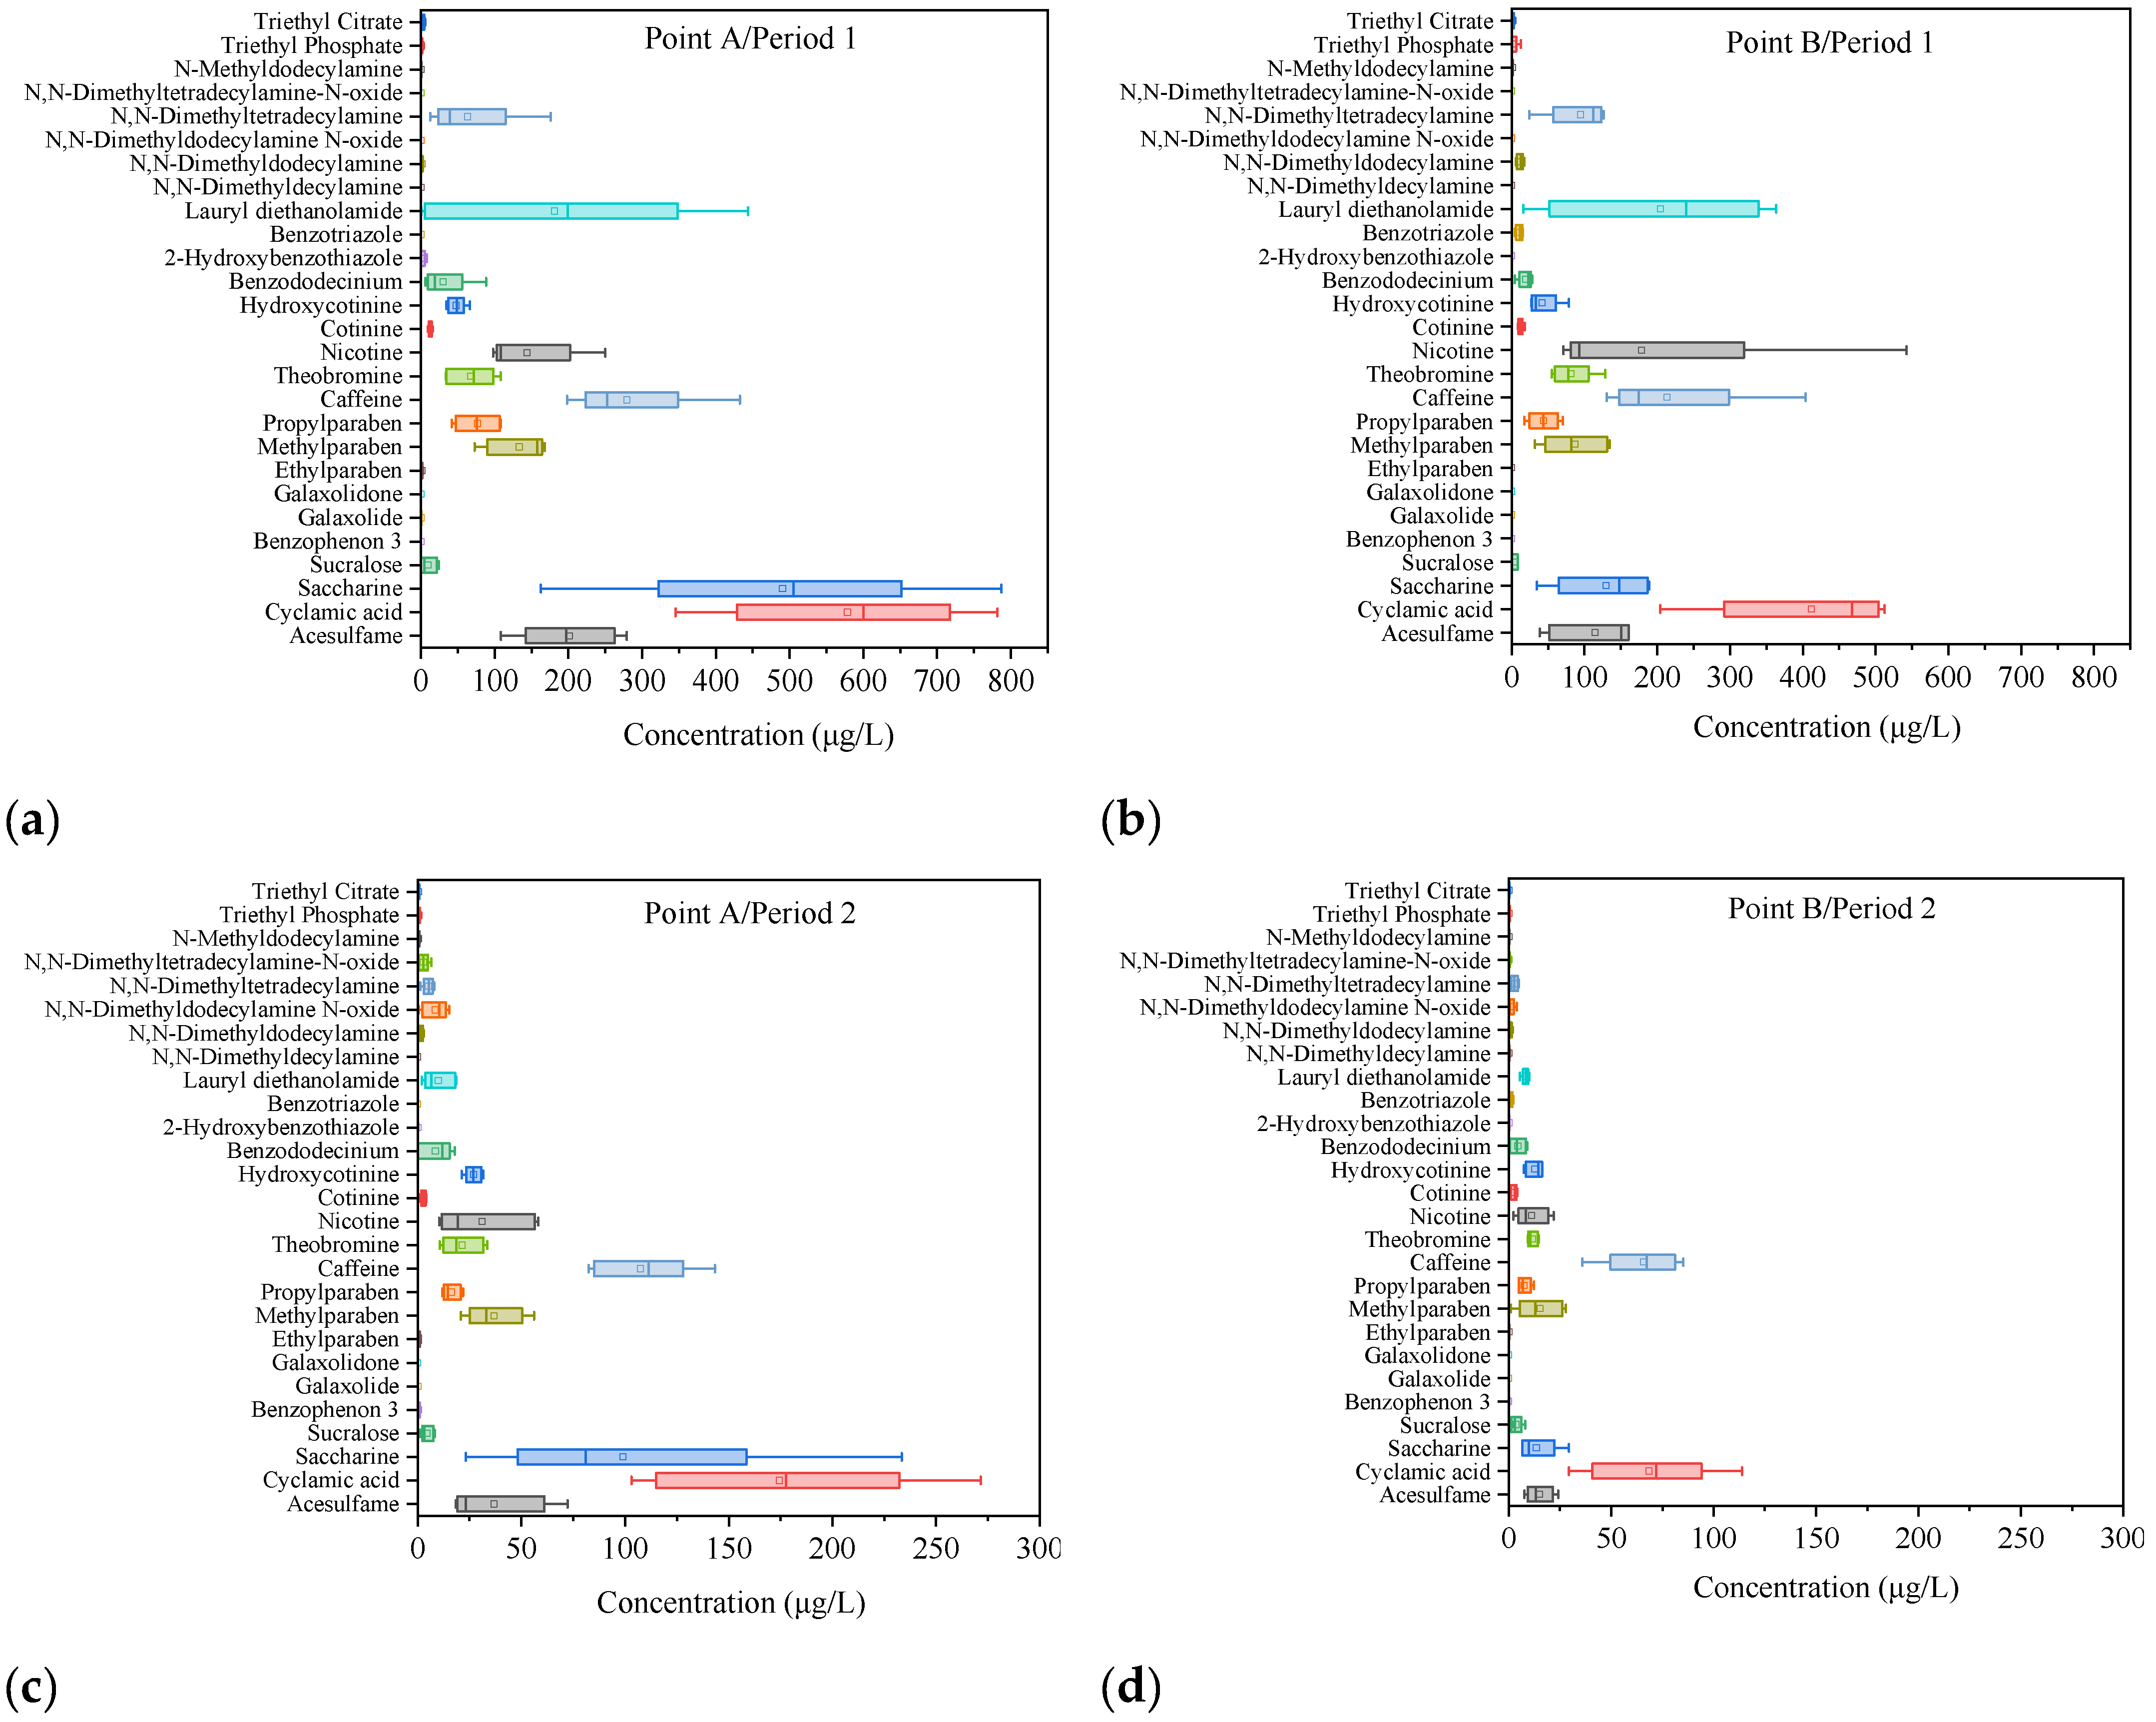
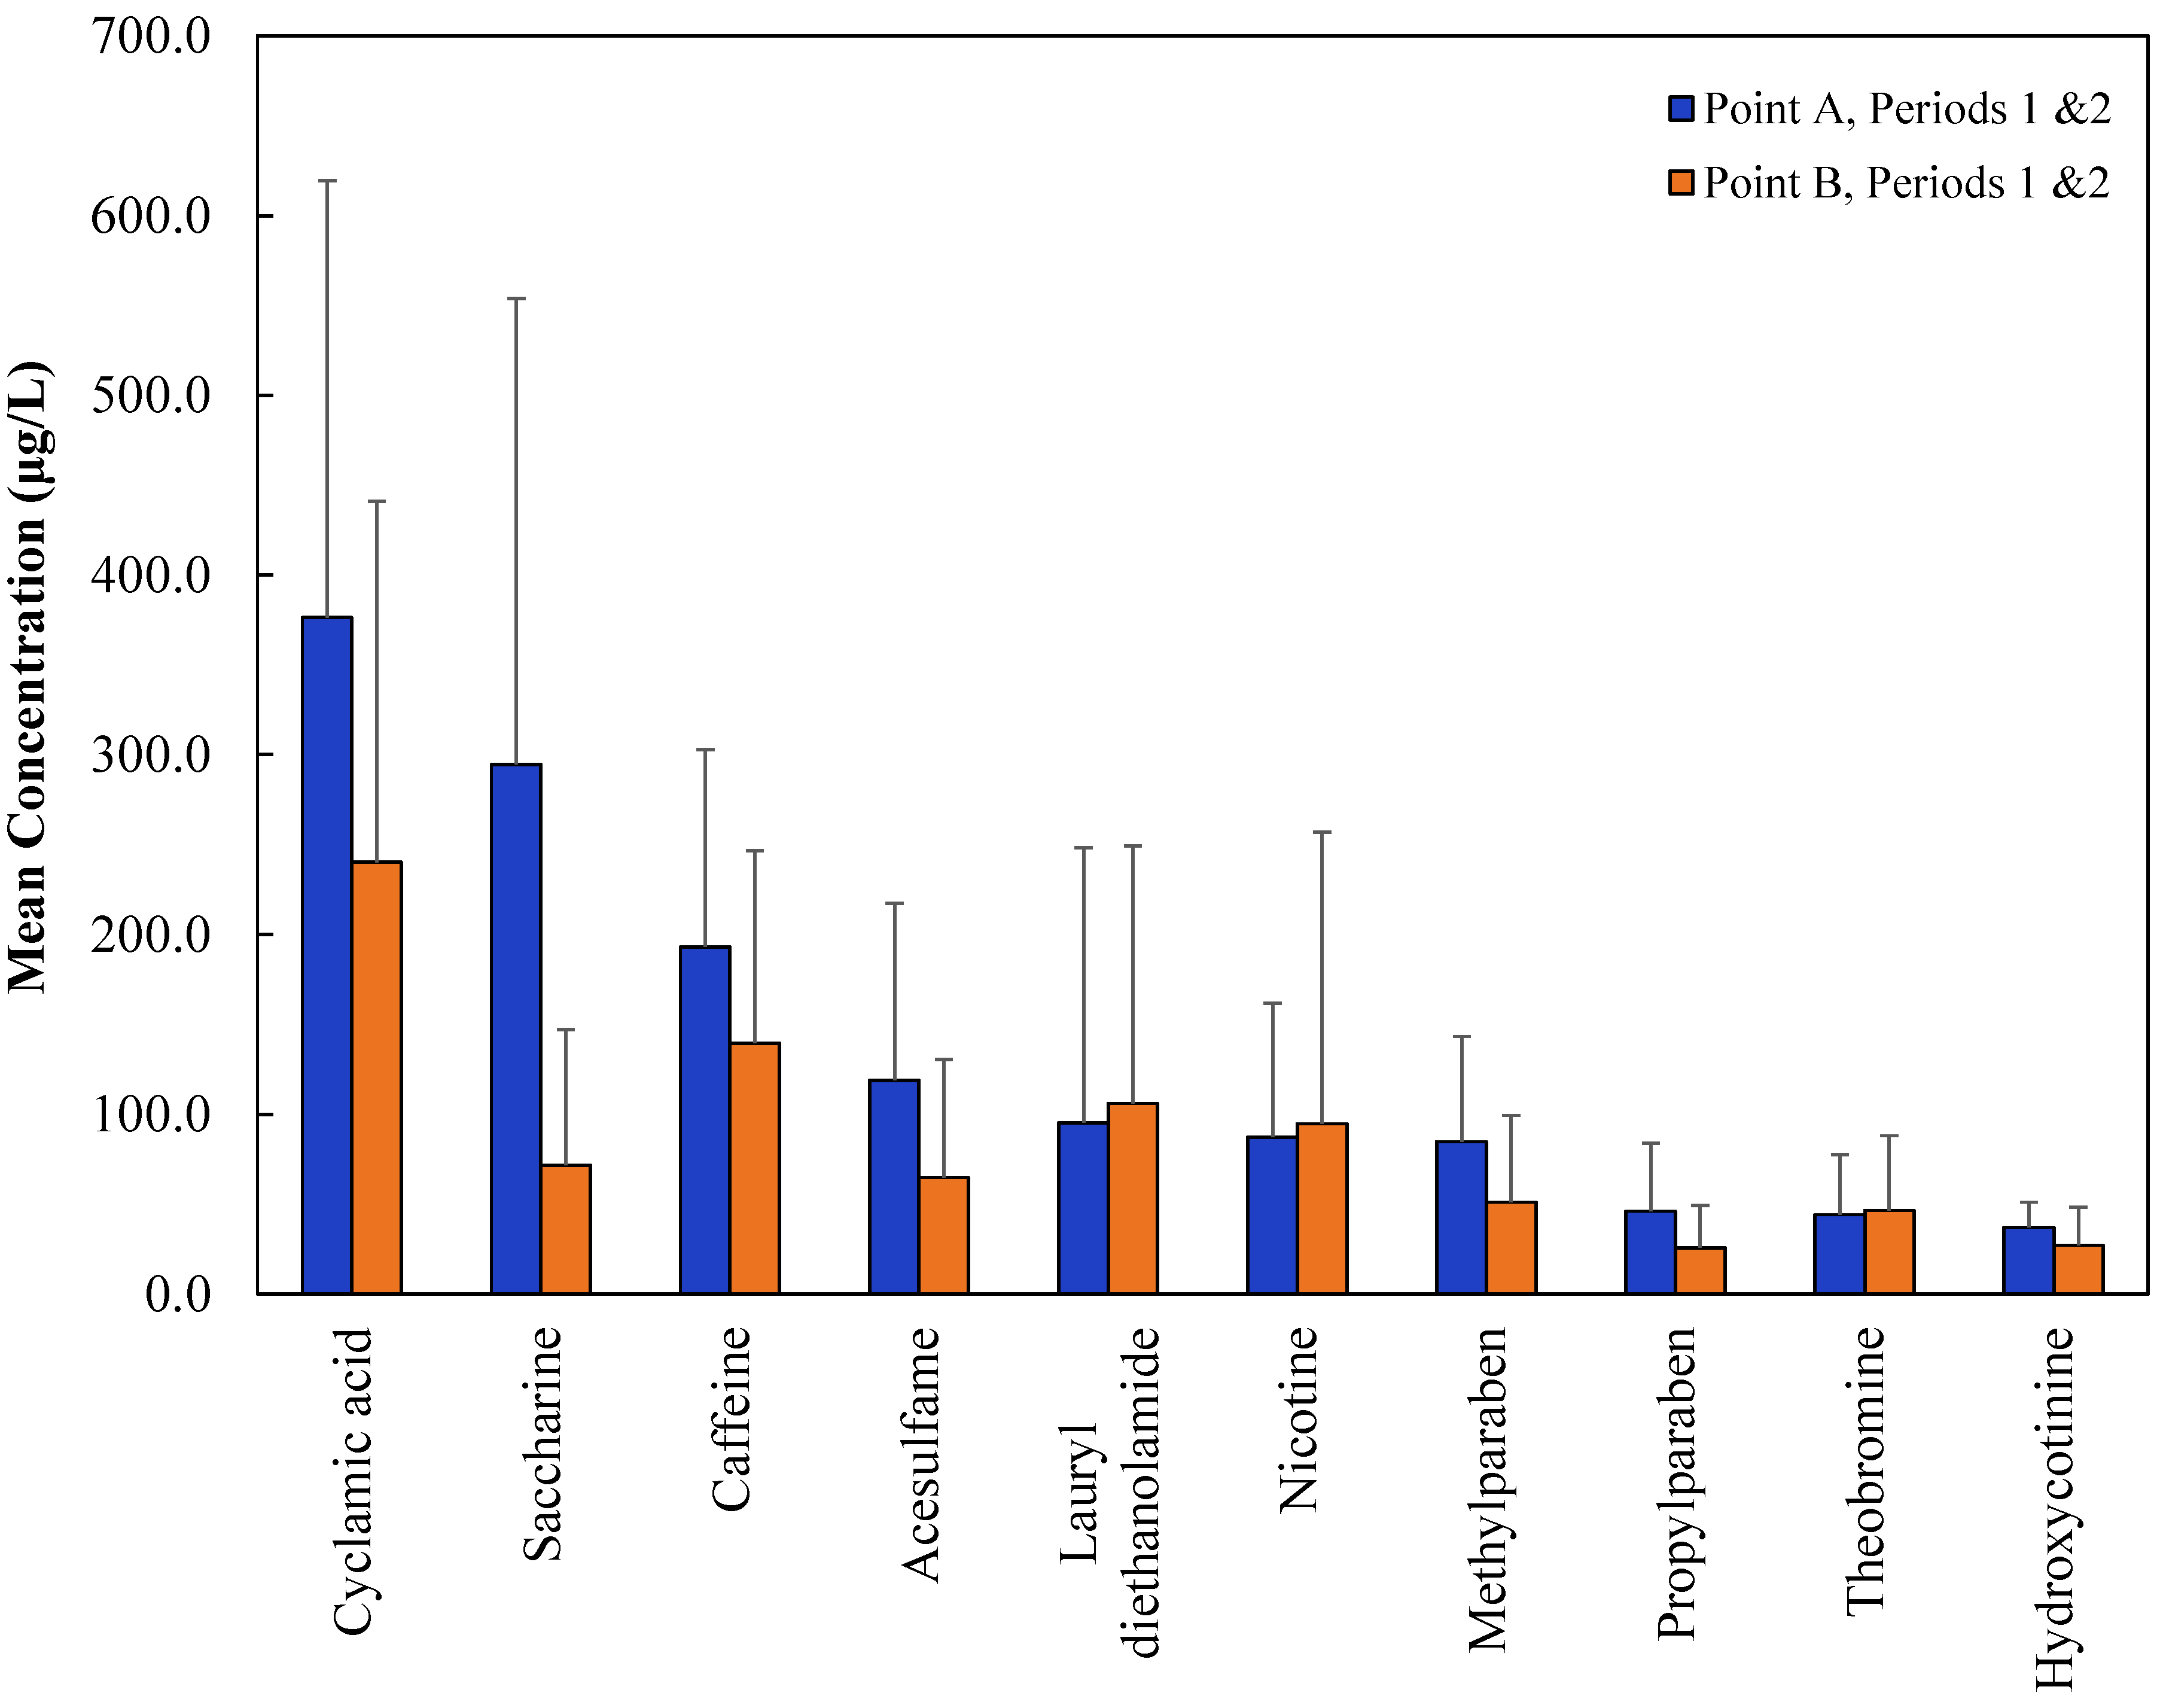
| Artificial sweeteners | ||||||||||||
| Acesulfame | 108 | 279 | 201 | 38.7 | 161 | 115 | 18.3 | 72.2 | 36.7 | 7.69 | 24.1 | 14.9 |
| Cyclamic acid | 346 | 782 | 579 | 204 | 512 | 412 | 103 | 271 | 174 | 29.3 | 114 | 68.4 |
| Saccharine | 163 | 787 | 491 | 34.5 | 189 | 130 | 23.2 | 233 | 98.9 | 6.53 | 29.4 | 13.5 |
| Sucralose | <LOD | 24.2 | 9.38 | <LOD | 8.16 | 3.24 | 1.21 | 8.23 | 4.56 | 1.21 | 7.97 | 3.57 |
| Personal care products | ||||||||||||
| Benzophenon 3 | <LOD | <LOD | <LOD | <LOD | <LOD | <LOD | <LOD | 0.978 | 0.481 | <LOD | 0.142 | 0.0284 |
| Galaxolide | <LOD | 0.209 | 0.0759 | <LOD | <LOD | <LOD | <LOD | 0.0915 | 0.0540 | 0.0170 | 0.0170 | 0.0170 |
| Galaxolidone | <LOD | <LOD | <LOD | <LOD | <LOD | <LOD | <LOD | <LOD | <LOD | <LOD | <LOD | <LOD |
| Ethylparaben | 0.472 | 2.13 | 1.16 | <LOD | <LOD | <LOD | 0.095 | 1.61 | 0.560 | 0.0397 | 0.158 | 0.0986 |
| Methylparaben | 72.7 | 168 | 133 | 32.2 | 135 | 87.2 | 20.8 | 56.2 | 36.8 | 1.05 | 27.8 | 15.2 |
| Propylparaben | 41.6 | 108 | 76.6 | 17.5 | 70.6 | 43.9 | 11.8 | 21.9 | 16.2 | 4.82 | 12.3 | 7.57 |
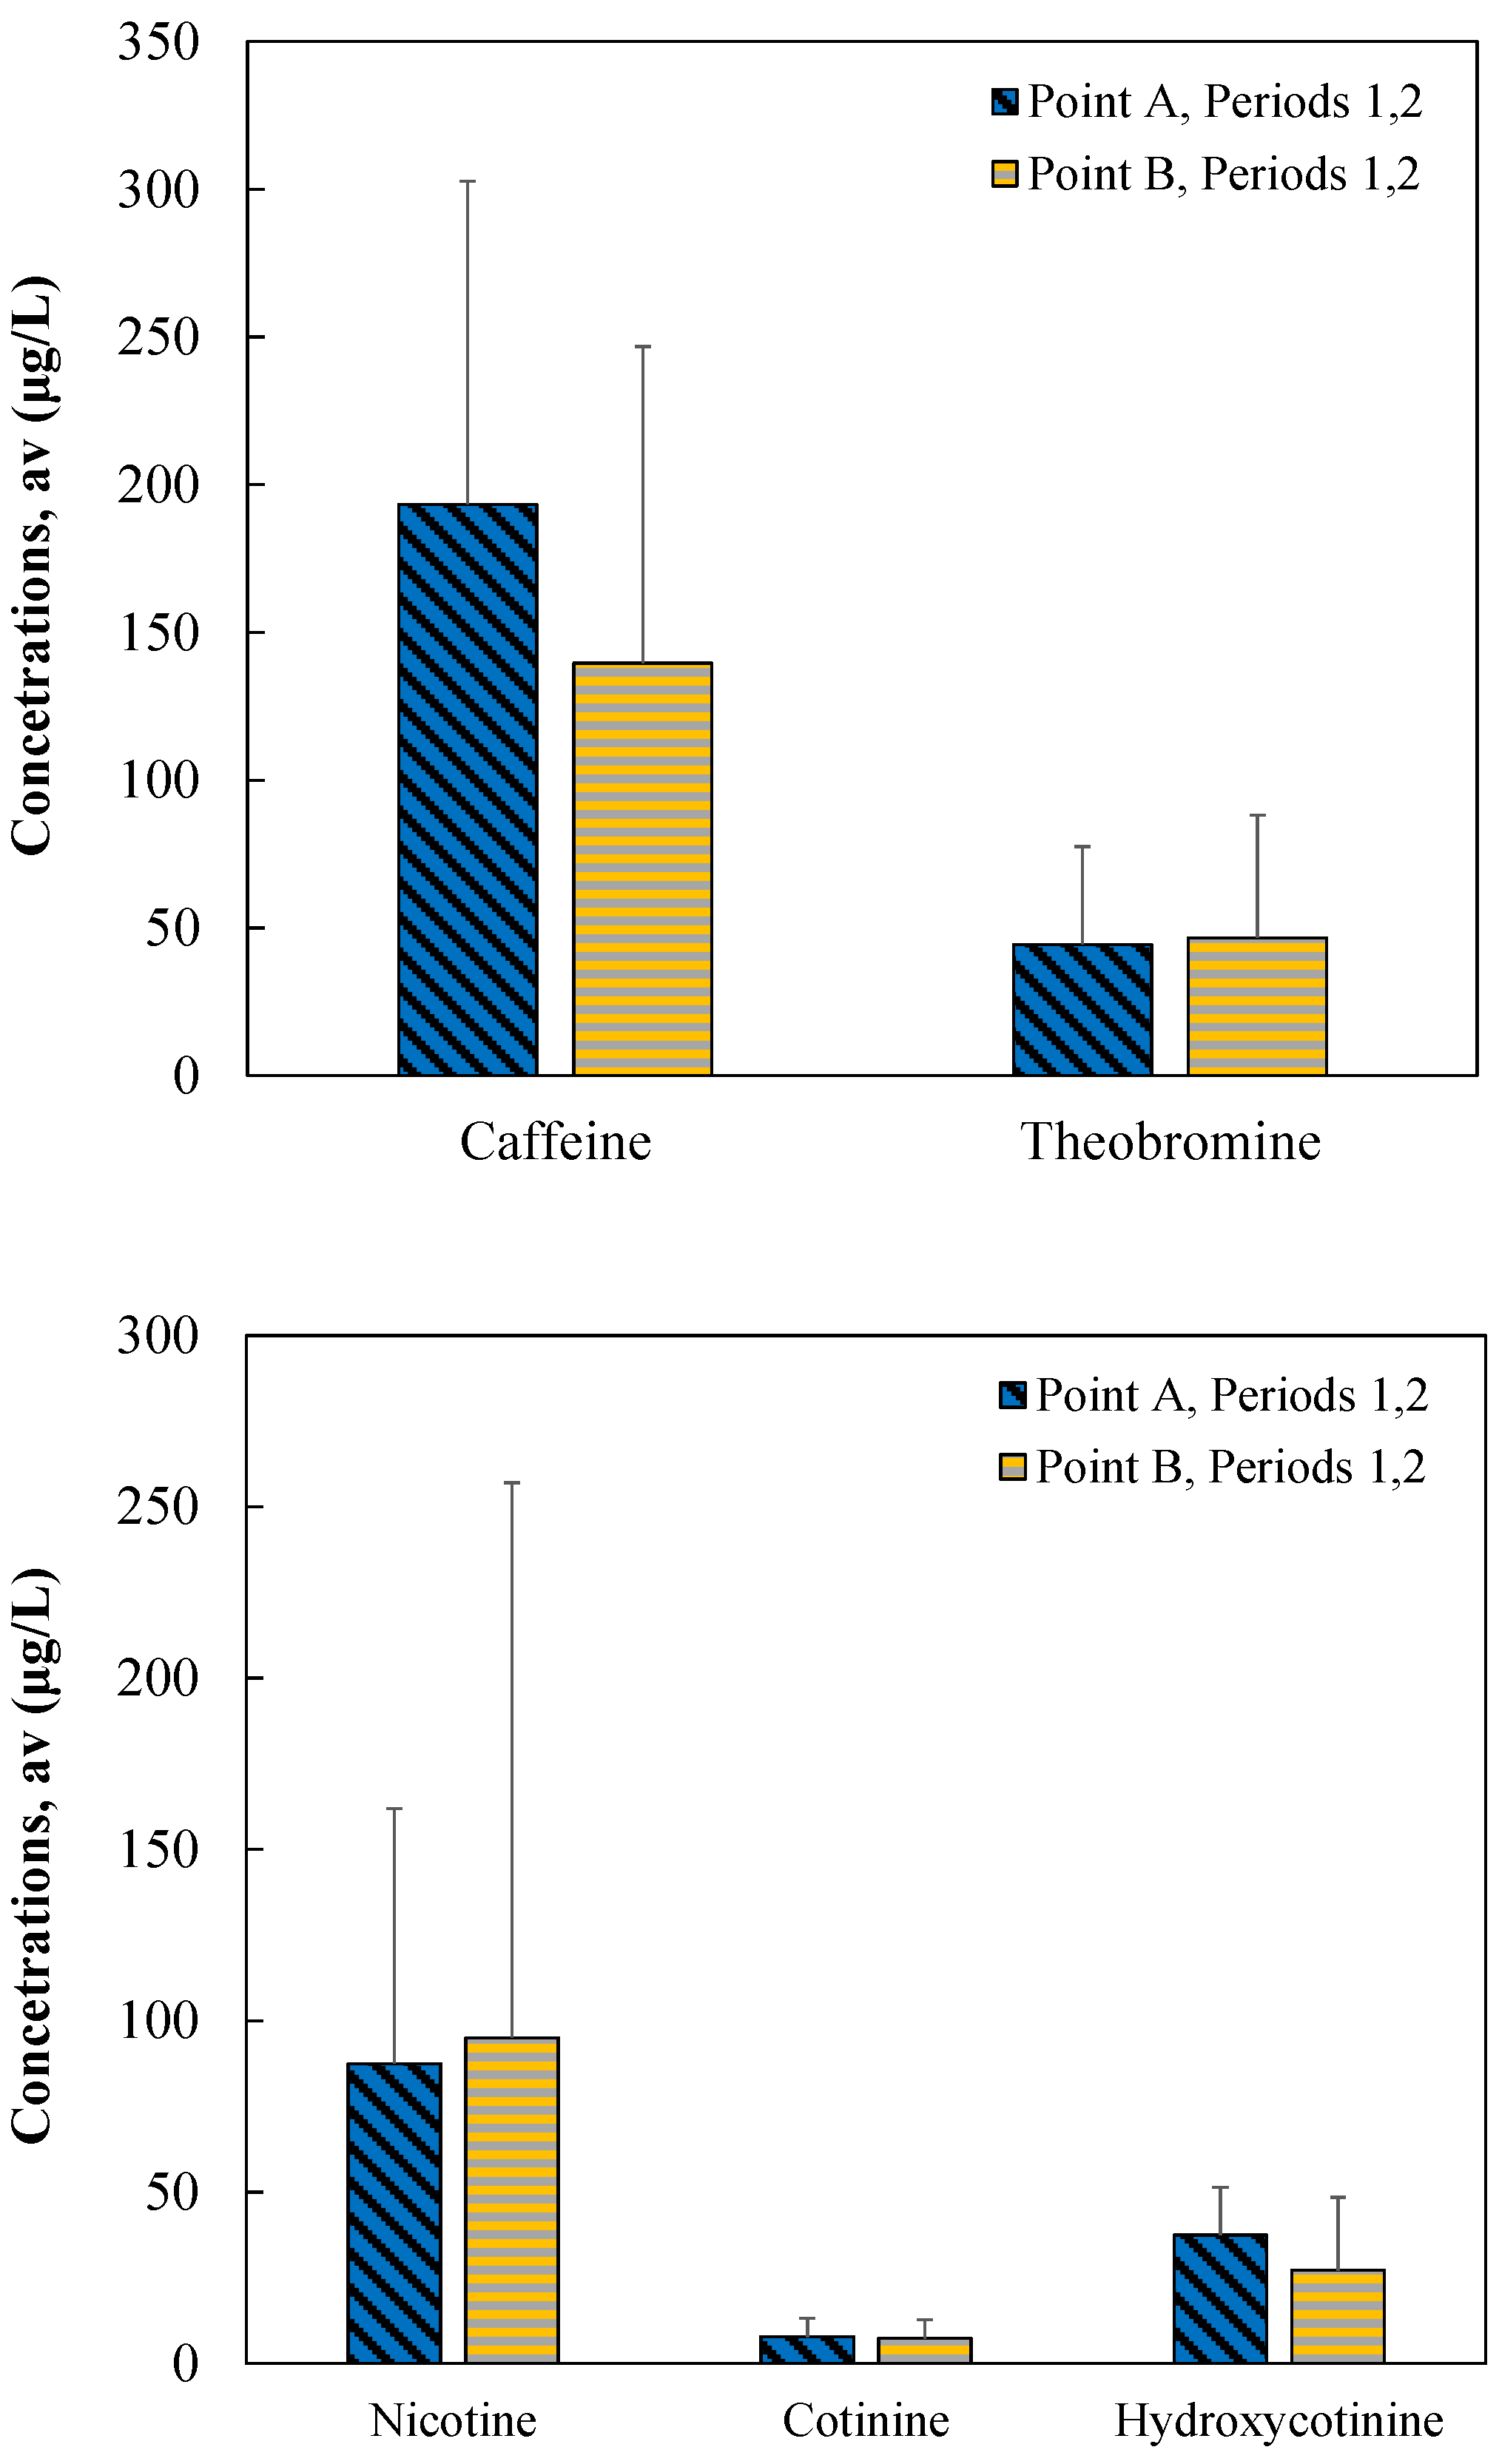
| Coffee and tobacco-related compounds | ||||||||||||
| Caffeine | 198 | 433 | 279 | 130 | 404 | 213 | 82.4 | 143 | 108 | 36.0 | 85.1 | 65.7 |
| Theobromine | 33.8 | 108 | 67.2 | 55.1 | 129 | 81.6 | 10.6 | 33.6 | 21.4 | 9.29 | 14.6 | 11.5 |
| Nicotine | 97.9 | 250 | 144 | 71.2 | 543 | 179 | 10.4 | 58.2 | 31.1 | 2.32 | 21.9 | 11.2 |
| Cotinine | 10.6 | 14.8 | 12.7 | 8.75 | 17.8 | 11.9 | 0.600 | 4.20 | 2.84 | 0.782 | 4.05 | 2.52 |
| Hydroxycotinine | 34.3 | 66.3 | 47.8 | 27.3 | 78.7 | 41.8 | 21.2 | 31.7 | 27.0 | 7.34 | 16.3 | 12.7 |
| Industrial chemicals | ||||||||||||
| Benzododecinium | 5.88 | 88.3 | 29.8 | 4.24 | 28.0 | 19.5 | <LOD | 17.9 | 8.51 | <LOD | 9.05 | 4.39 |
| 2-Hydroxybenzothiazole (2-OH-BTH) | <LOD | 7.71 | 2.02 | <LOD | <LOD | <LOD | <LOD | 0.259 | 0.0517 | <LOD | 0.259 | 0.155 |
| Benzotriazole (BTR) | <LOD | <LOD | <LOD | 4.46 | 15.6 | 10.4 | <LOD | <LOD | <LOD | 0.0881 | 2.20 | 0.885 |
| Lauryl diethanolamide (Lauryl-DEA) | 0.668 | 444 | 181 | 15.7 | 364 | 204 | 1.87 | 18.6 | 9.99 | 5.52 | 9.88 | 8.20 |
| N,N-Dimethyldecylamine (N,N-diMe-DA) | <LOD | <LOD | <LOD | 0.0473 | 0.095 | 0.0735 | <LOD | 0.0443 | 0.0133 | 0.0111 | 0.37 | 0.153 |
| N,N-Dimethyldodecylamine (N,N-diMe-DDA) | 0.275 | 2.56 | 1.09 | 5.98 | 17.7 | 11.5 | 0.738 | 2.76 | 1.89 | 0.609 | 1.41 | 0.986 |
| N,N-Dimethyldodecylamine N-oxide (N,N-diMe-DDA-N-oxide) | <LOD | <LOD | <LOD | <LOD | <LOD | <LOD | 0.493 | 15.2 | 8.42 | 0.0596 | 3.94 | 1.10 |
| N,N-Dimethyltetradecylamine (N,N-diMe-TDA) | 12.3 | 176 | 63.0 | 24.0 | 126 | 94.6 | 1.40 | 7.96 | 5.18 | 0.987 | 4.93 | 2.80 |
| N,N-Dimethyltetradecylamine-N-oxide (N,N-diMe-TDA-N-oxide) | <LOD | <LOD | <LOD | <LOD | <LOD | <LOD | <LOD | 6.65 | 2.70 | <LOD | 0.765 | 0.219 |
| N-Methyldodecylamine (N-Me-DDA) | 0.0907 | 0.652 | 0.315 | 0.655 | 1.86 | 1.35 | 0.100 | 1.01 | 0.541 | 0.0511 | 0.326 | 0.124 |
| Triethylphosphate | <LOD | 3.04 | 0.607 | <LOD | 12.7 | 2.54 | 0.0480 | 1.29 | 0.706 | 0.00 | 0.533 | 0.250 |
| Triethylcitrate | 1.05 | 5.07 | 2.83 | 0.976 | 3.39 | 2.22 | 0.0804 | 0.847 | 0.423 | 0.173 | 0.392 | 0.258 |
| Compounds | Concentrations (μg/L) | References |
|---|---|---|
| Artificial Sweeteners | ||
| Acesulfame | 18.3–279 | This study |
| 11.9–25.3 | Kokotou et al. [35] | |
| Cyclamic acid | 29.3–782 | This study |
| 6.04–57.8 | Kokotou et al. [35] | |
| Saccharine | 6.53–787 | This study |
| 15.0–46.0 | Kokotou et al. [35] | |
| Sucralose | n.d.–24.2 | This study |
| 6.25–25.4 | Kokotou et al. [35] | |
| Coffee and tobacco-related compounds | ||
| Caffeine | 36.0–433 | This study |
| n.d.–96.6 | Kosma et al. [36] | |
| 45.9–92.0 | Ofrydopoulou et al. [37] | |
| 0.860–6.68 | Stamatis et al. [38] | |
| 0.100–5.40 | Papageorgiou et al. [39] | |
| n.d.–222 | Papageorgiou et al. [32] | |
| Industrial Chemicals | ||
| 2-Hydroxybenzothiazole (2-OH-BTH) | n.d.–7.71 | This study |
| 0.256–0.958 | Stasinakis et al. [19] | |
| Benzotriazole (BTR) | n.d.–15.6 | This study |
| 0.516–2.63 | Stasinakis et al. [19] | |
Disclaimer/Publisher’s Note: The statements, opinions and data contained in all publications are solely those of the individual author(s) and contributor(s) and not of MDPI and/or the editor(s). MDPI and/or the editor(s) disclaim responsibility for any injury to people or property resulting from any ideas, methods, instructions or products referred to in the content. |
© 2023 by the authors. Licensee MDPI, Basel, Switzerland. This article is an open access article distributed under the terms and conditions of the Creative Commons Attribution (CC BY) license (https://creativecommons.org/licenses/by/4.0/).
Share and Cite
Arvaniti, O.S.; Gkotsis, G.; Nika, M.-C.; Gyparakis, S.; Manios, T.; Thomaidis, N.S.; Fountoulakis, M.S.; Stasinakis, A.S. Study on the Occurrence of Artificial Sweeteners, Parabens, and Other Emerging Contaminants in Hospital Wastewater Using LC-QToF-MS Target Screening Approach. Water 2023, 15, 936. https://doi.org/10.3390/w15050936
Arvaniti OS, Gkotsis G, Nika M-C, Gyparakis S, Manios T, Thomaidis NS, Fountoulakis MS, Stasinakis AS. Study on the Occurrence of Artificial Sweeteners, Parabens, and Other Emerging Contaminants in Hospital Wastewater Using LC-QToF-MS Target Screening Approach. Water. 2023; 15(5):936. https://doi.org/10.3390/w15050936
Chicago/Turabian StyleArvaniti, Olga S., Georgios Gkotsis, Maria-Christina Nika, Stelios Gyparakis, Thrassyvoulos Manios, Nikolaos S. Thomaidis, Michalis S. Fountoulakis, and Athanasios S. Stasinakis. 2023. "Study on the Occurrence of Artificial Sweeteners, Parabens, and Other Emerging Contaminants in Hospital Wastewater Using LC-QToF-MS Target Screening Approach" Water 15, no. 5: 936. https://doi.org/10.3390/w15050936