Article

Historical Loss of Groundwater-Dependent Terrestrial Ecosystems in Undrained and Artificially Drained Landscapes in Denmark

1
Department of Agroecology, Aarhus University, 8830 Tjele, Denmark
2
Department of Hydrology, Geological Survey of Denmark and Greenland (GEUS), 1350 Copenhagen, Denmark
*
Author to whom correspondence should be addressed.
Water 2023, 15(5), 946; https://doi.org/10.3390/w15050946
Submission received: 9 January 2023 / Revised: 21 February 2023 / Accepted: 23 February 2023 / Published: 1 March 2023
(This article belongs to the Special Issue Wetland Processes, Monitoring and Modeling for Design and Management)

Abstract

:
Groundwater-dependent terrestrial ecosystems (GWDTE) have been increasingly under threat due to groundwater depletion globally. Over the past 200 years, there has been severe artificial drainage of low-lying areas in Denmark, leading to a gradual loss of GWDTE nature habitat areas. This study explores the spatial-temporal loss of Danish GWDTE using historical topographic maps. We carry out geographic information systems (GIS) overlap analysis between different historical topographic maps with signatures of GWDTE starting from the 19th century up to a present-day river valley bottom map. We then examine the changes in two protected GWDTE habitat types in different periods and hydrologic spatial locations. Results reveal a decrease in the area of GWDTE over the last 200 years. We attribute this to different human interventions, e.g., drainage, that have impacted the low-lying landscape since the early Middle Ages. We further conclude that downstream parts of the river network have been exposed to less GWDTE habitat loss than upstream ones. This indicates that upstream river valleys are more vulnerable to GWDTE decline. Therefore, as a management measure, caution should be exercised when designing these areas for agriculture activities using artificial drainage and groundwater abstraction, since this may lead to further decline. In contrast, there is a higher potential for establishing constructed wetlands or rewetting peatlands to restore balance.

1. Introduction

Many wetlands and lakes in low-lying European areas have been artificially drained and lost by land reclamation for agriculture and other anthropogenic activities as far back as 1000 years [1,2,3]. This means that groundwater-dependent terrestrial ecosystems (GWDTE) have been increasingly threatened globally by anthropogenic impacts [4,5,6]. For example, there has been a loss of peatland from 250,000 ha to 70,000 ha in Denmark in the past 200 years [7]. Consequently, the GWDTE habitat species are particularly vulnerable to groundwater depletion, causing major water table lowering in lowland soils [8,9,10]. At present, groundwater abstraction, climate change, and urbanization are recognized as prominent threatening processes [11,12,13,14]. Furthermore, groundwater is inextricably linked to surface water bodies [15,16,17]. Therefore, a significant lowering of the groundwater may markedly influence the GWDTE’s capability to provide its ecosystem services. Additionally, aquifer water outflow supports and maintains river flows, springs, and wetlands in some areas, particularly during dry seasons and droughts [16]. Thus, excessive groundwater extraction for irrigation can result in wetlands drying out, leading to the collapse of the entire ecosystem, a rise in salinity, and/or deterioration of ecosystems [18]. It could also lead to a rise in CO2 emissions [19,20] or the leaching of acid-sulfate soils in Denmark [21].
In the past, severe artificial drainage of the landscape in Denmark by ditching and tile drainage of logged lowland soils was carried out to increase cultivated land area [3,22]. Today, it is challenging to meet the conservation goal at sites with GWDTE habitat types according to the European Union Water Framework and Habitat Directives [23]. In Denmark, national monitoring of European Union-protected Natura 2000 areas indicates that areas with habitat types such as forests, fens, bogs, and salt marshes have a worsened conservation status to the state of the ecosystem. In 2013, 90% of the monitored quality of habitat types declined; in 2019, the figure was 95% [24]. The drained low-lying areas have attracted extensive attention among climate and biodiversity scientists and nature cultivators. The focus has been on increasing the resilience of a wide variety of terrestrial and freshwater degraded ecosystems by rewetting drained peatlands and wetlands for decreasing greenhouse gas emissions to the atmosphere and revitalizing natural areas hosting GWDTE habitat types in wetlands, lakes, and river valleys [25,26]. To effectively manage groundwater resources in the future, special consideration must be given to groundwater-dependent ecosystems (GDEs) [27]. Future evaluations of the ecological status of these GDEs must consider the relationship between groundwater and the ecosystem [28]. In order to determine the best management options for future groundwater use, it is necessary to identify the different functions of ecosystems [18].
This study evaluates the trend and causes of the loss of GWDTE habitat types from a historical perspective. Furthermore, it examines what relevant, negative influences existing habitat types of GWDTE have been exposed to during the last two centuries. The overall objective is to use historical topographical maps to validate the geographic information systems (GIS)-based delineation method of lowland areas [29]. The specific objective includes comparing the loss of Danish GWDTE in space and time from the 19th century to the present day.

2. Materials and Methods
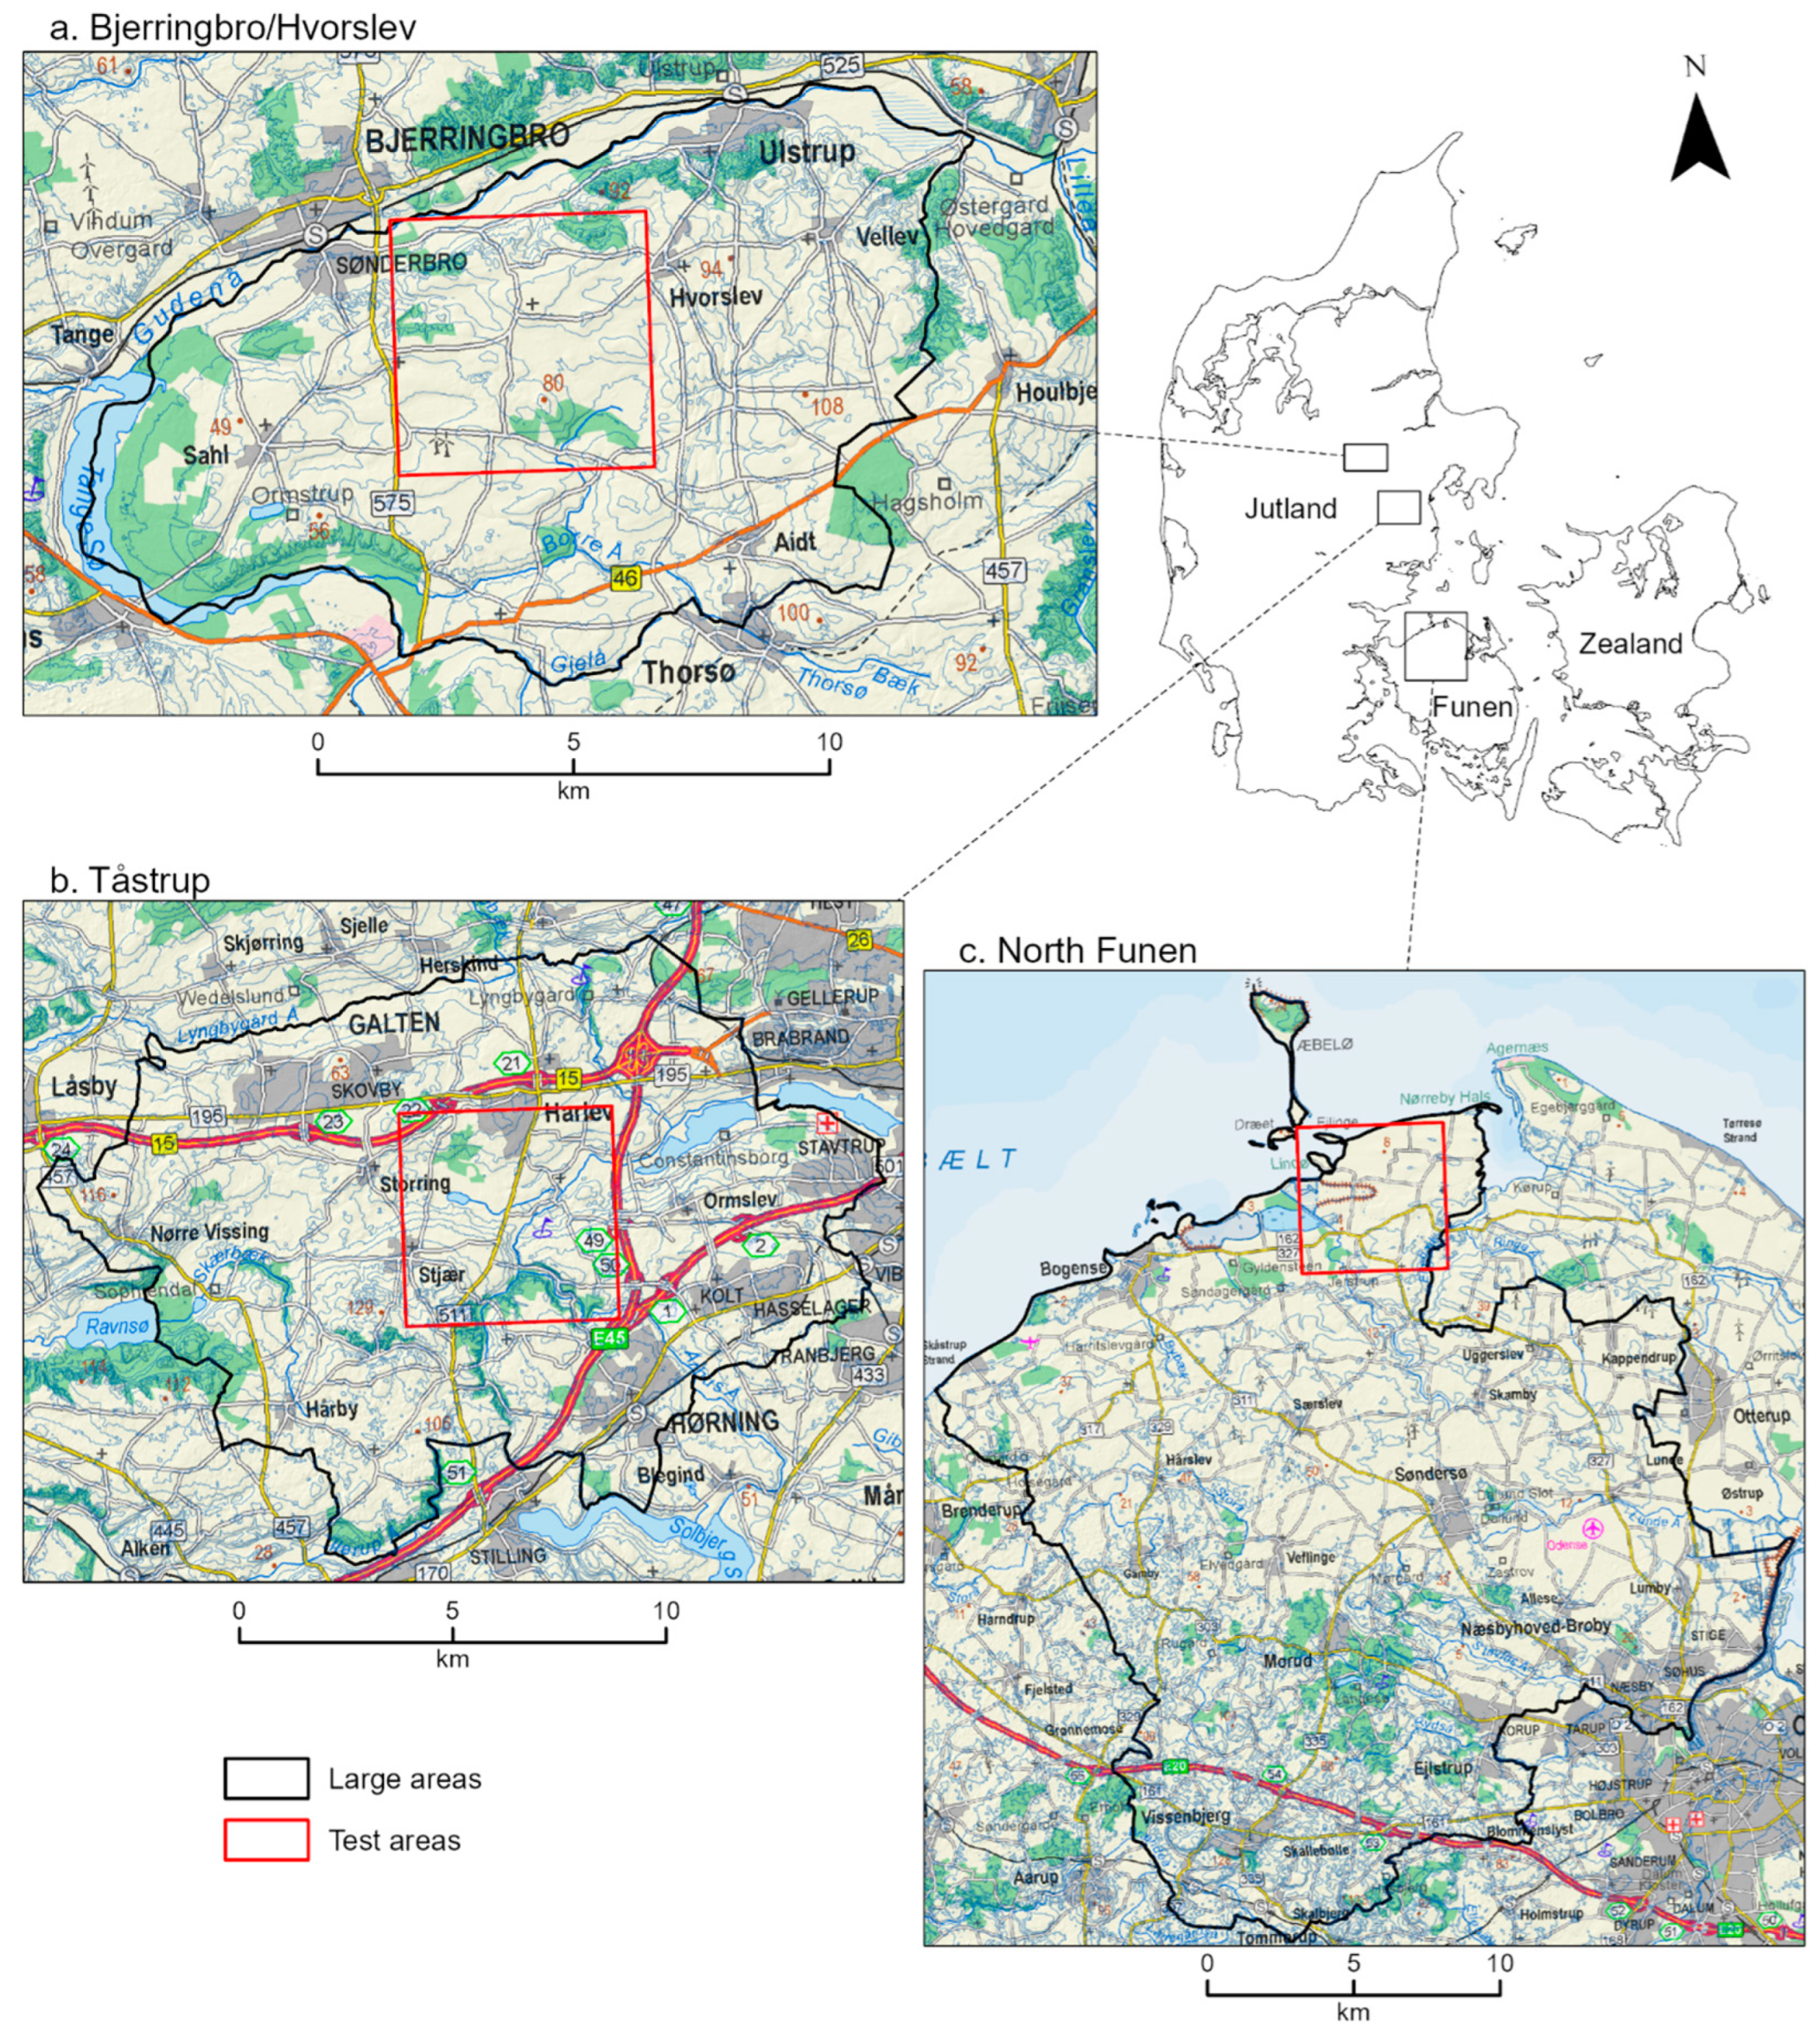
2.1. Study Area

We analyzed three areas selected based on data availability from a previous study that looked at Danish GWDTE area changes over time [30]. The present study designates these as ‘large’ areas, which assess temporal changes of GWDTE areas occurring in smaller places within a large area (129–451 km2) during the last 200 years. The study also delineates 5 × 5 km2 areas within each large area [30], naming them as ‘test’ areas to assess temporal changes within a smaller area. We use the same terminology throughout this study, i.e., ‘large’ and ‘test’ areas. Table 1 presents land use distribution within these areas. Denmark’s predominant land use is agriculture covering about 59% of the land [31].
The Bjerringbro/Hvorslev area (129 km2) is located in Central Denmark (Figure 1a). The large Gudenå river valley and Tange Lake delimit the region towards the north and west. There is a large plantation in the area east of Tange Lake. Along the sides of the Gudenå are several small forests, scrubby vegetation, and residual regions that have not been cultivated due to slopes or high groundwater levels. Within areas that are not too steep, the land is cultivated or used for grazing resulting in a diverse agricultural landscape. There are also heathlands on less favorable soils. There are several smaller, partially regulated streams and smaller lakes, meadows, and peat areas in lowland terrain [32]. Tåstrup area (170 km2) is located just south of the town of Harlev in a hilly moraine landscape (Figure 1b). Aarhus river valley cuts through the area. North Funen (451 km2) is located in the northern part of Denmark’s third-largest island, Funen, and includes a coastal area (Figure 1c). To the south, the area consists of a young moraine landscape that rises to an elevation of more than 35 m. Two river valleys cut through the area draining into the Kattegat Sea to the north.

2.2. Historical Maps

Based on four publicly available nationwide maps at www.gst.dk (accessed on 17 February 2020) (three historical maps and one recent map), the study areas mapped as meadow and bog/fens are delimited.
The ‘Original 1’ (O1) map consists of cadastral maps produced at a scale of 1:4000 (outside cities, pages 78–83 [33]), and 1:800 (in the city, pages 84–85 [33]), which covered the surveying of properties in the countryside in the years from about 1770–1822, continuing for smaller areas until 1867, covering about 50% of the land area. The O1 cadastral maps probably most closely resemble the “naturally” drained landscape in the early 1800s, knowing that extensive drainage by ditching long before took place by hard-working farmworkers and monks dating back to the early Middle Ages in the years 1100–1200 [3]. The O1 maps depict the undrained landscape in many parts of Denmark, which refers to a landscape that portrays a hydrological condition before the establishment of tile drain pipes and more extensive groundwater abstraction, but where ditches were mostly dug on lowland soils [30].
The ‘Høje målbordsblade’ (HM) are topographical maps at a scale of 1:20,000, measured between 1842 and 1899, supplemented by maps in Southern Jutland between 1921 and 1930 [33]. Funen was surveyed between 1862–1867, and Jutland from south to north between 1867–1887. The maps have been prepared in a period of drainage history where significant parts of the loamy soils in Zealand and the islands and East Jutland were piped with tile drains [34]. As the survey of the HM maps started in Zealand and Lolland-Falster, it is not very likely that the drainage of the wetlands in eastern Denmark was registered in these maps. As large parts of Jutland were first mapped towards the end of the period for mapping the HM, tile drainage is expected to have left its mark on the distribution of meadow and bog/fen areas in western Denmark in this map. Drainage has been primarily performed in the past 25 years using backactors or trencher drainage machines. Trenchless drainage machines were introduced in Denmark in 1971 and have been used for around 10–15% of annual drainage work since then [35]. There has been progress in drainage due to the introduction of new materials and machinery. The use of clay and concrete pipes dominated in the 1960s, while PVC-drain pipes were introduced in the 1970s. Corrugated PVC-pipes have become the dominant drain pipe material since the late 1970s. Different materials, including fibrous peat, sawdust, and synthetic materials, have been used for drain envelopes, but a combination of thin synthetic sheet and voluminous material, such as sawdust or gravel, is often chosen now. Prewrapped corrugated PVC-pipes with synthetic sheet materials are also used [35]. Around the year 1850, the water supply to the largest Danish cities changed from using surface water to pumping groundwater for drinking water purposes. Around the year 1900, there were around 30 cities with waterworks [36]. It must be limited how much these new waterworks have drained wetlands into the low-lying soils close to the city resulting in loss of meadow and bog/fen areas. As a response to poor drainage conditions affecting crop yields, farmers turned to installing subsurface drain pipes (tile drains) within the soil. The first tile drainage took place around the year 1850 on the most water-logged clayey soils in Zealand, the islands, and East Jutland. The tile drainage intensified in the period 1860–1880 [34]. Therefore, the exact time at which parts of the country were tile drained when the HM map was prepared in the different parts around 1875 ± 10–20 years is uncertain. However, we believe it is fair to assume that the HM maps represent the tile drained landscape for the most part in Zeeland, the islands, and lesser extent in East Jutland [34].
The ‘Lave målbordsblade’ (LM) are topographical maps recorded on a scale of 1:20,000, measured between 1928 and 1945. These maps most likely show widespread effects on the drained landscape after tile drainage for most parts of East Jutland, Zealand, and the islands [33,34]. On the other hand, the artificial drainage of lowland soils in Jutland from 1930 to 1960, due to significant land reclamation efforts such as damming fjords and emptying lakes, is unlikely to be seen in the predominance of wet habitats LM maps [37]. Groundwater abstraction developed rapidly until the 1920s when municipal waterworks increased to 70 and 1200 plants in the cities and countryside, respectively, often owned by private partnerships. By the beginning of the 1970s, the number had risen to almost 6000 waterworks, which added approximately 200,000 single supplies in the countryside. The extent of this groundwater abstraction is expected to have drained meadow and bog/fen areas to significant amounts. Therefore, the LM maps represent groundwater abstraction in most parts of Denmark.
The meadow and bog/fen areas of the ‘Paragraf 3’ (P3) maps have been chosen here as the common areas for the current distribution of the GWDTE habitat types (ca. 1950 to present). Counties and municipalities have mapped the Nature Conservation Act-protected nature areas several times. The P3 maps are composed of several data sources, most of which originate from publicly available data (https://arealinformation.miljoeportal.dk/ (accessed on 17 February 2020)). However, areas are also taken from operational plans of the Danish Nature Agency and the Armed Forces. In the area inventory of the P3 maps, evident changes are expected in the meadow and bog/fen areas due to groundwater abstraction, artificial drainage of lowland soils, intensification of agricultural areas, or the spread of suburban buildings into the recreational lowland areas. The P3 maps reflect the current drained landscape in Denmark, including the effect of groundwater lowering on lowland soils by water abstraction to larger cities.
To summarize, the past 200 years of human intervention have led to the drainage of low-lying areas, whereby there has been thorough artificial drainage of riparian lowland soils in Denmark. This happened due to human intervention in the water cycle, including drainage by ditching, tile drainage, groundwater abstraction, and urbanization (Table 2). The combination of different types of drainage has caused a considerable impact on habitat areas that have previously appeared as meadows and bog/fens in historical maps back from around 1800, which in this study are used as reference periods of the undrained landscape in Denmark. Therefore, the historical maps after 1800 represent Denmark’s gradually increasing cultivation of low-lying areas.

2.3. Data

We used six different datasets. First, four scanned Danish historical topographical maps that the Department of Agroecology, Aarhus University, vectorized into various habitat nature types using GIS digitization. These maps are O1, HM, LM, and P3 (presented in Section 2.2 and summarized in Table 3). They represent Denmark’s different topographical mapping campaigns and were previously only available as scans. Nilsson et al. [30] studied vectorized nature types for all these maps within the 5 × 5 km2 test areas. However, for the large areas, they only vectorized O1 and P3 (Table 3).
O1 maps are available in a scanned but not georeferenced or vectorized version for the entire country. The HM maps have been scanned and georeferenced but are not vectorized. The LM maps are scanned, georeferenced, and partially vectorized to group wet ecosystems. Finally, P3 maps are available in a vectorized format (polygons), and the data is collected from several sources, mainly the Danish Environmental Portal (www.miljoeportal.dk (accessed on 17 February 2020)). Some other sources include the Danish Nature Agency and operational plans from the Armed Forces.
The other two supplementary data include a river network layer from the Danish Centre for Environment and Energy and a recently developed river valley bottom map [29] available at the Agroecology Department of Aarhus University. Sechu et al. [29] developed a GIS-based tool to delineate the river valley bottom across drainage basins and validate this methodology. The study calculated an overlap between the delineated river valley bottom and meadow and bog/fen signatures from historical maps resulting in significant overlaps. Note that areas with bogs/fens and meadows outside the delineated river valley bottom are not included in this study comparison. This is because we needed a basis for comparison, and the river valley bottom data from the previous study served as a baseline for this purpose. We use the same data to conduct a more in-depth analysis of the loss of GWDTE areas. We quantify the spatial loss of GWDTE areas through time and examine the loss in different parts of the river network.

3. Methodology

Several factors may have contributed to inconsistent results, such as the lack of an expected trend in GWDTE loss. For one, the accuracy of topographical mapping during the various historical periods may have been impacted by various factors, such as differences in observer biases leading to variations in the delineation of meadow and bog/fen areas. Additionally, the difference in scale for the input maps could explain the previously mentioned lack of trend. Furthermore, changes in perceptions, including definitions of land use, could have also played a role over time.
We used the vectorized areas mapped with the signature meadow and bog/fen adjacent to or into river valleys as indicators of areas covering the GWDTE habitat from the historical maps. We used the river network feature layer and spatial analysis tools in ArcGIS Pro [38] to extract signatures of GWDTE beside the river system for all maps (i.e., O1, HM, LM, and P3). For each historical map, we then calculated the area of GWDTE within the test areas that overlapped with the current valley bottom map. The signatures used for meadow and bog/fen in the historical maps have been more or less the same in the O1, HM, and LM maps. However, the modern map (P3) differentiates the meadow and bog/fen areas into areas with habitat types classified according to Annex I to Directive 92/43/EEC. The meadow signature covers the following GWDTE habitat types mapped in Denmark with the habitat type codes 4010, 6410, and 7230. The bog/fen signature covers the habitat type codes 7110, 7120, 7140, 7150, and 7220 [30]. We calculated these areas and presented them as percentages of the river valley bottom area. We then conducted the same analysis for the large areas using the O1 and P3 maps. We undertook this because HM and LM maps were not vectorized for the large areas. Figure 2a illustrates the methodology by showing the GWDTE before overlap with the river valley bottom. Figure 2b shows the result of the overlap between the GWDTE and the river valley bottom.
We then assessed the spatial-temporal loss of GWDTE. We undertook this by calculating the area change in GWDTE for different locations of the river network. We defined different sections using the Strahler stream order [39]. The general research question we try to answer here is whether there is a spatial component to the loss of GWDTE.

4. Results

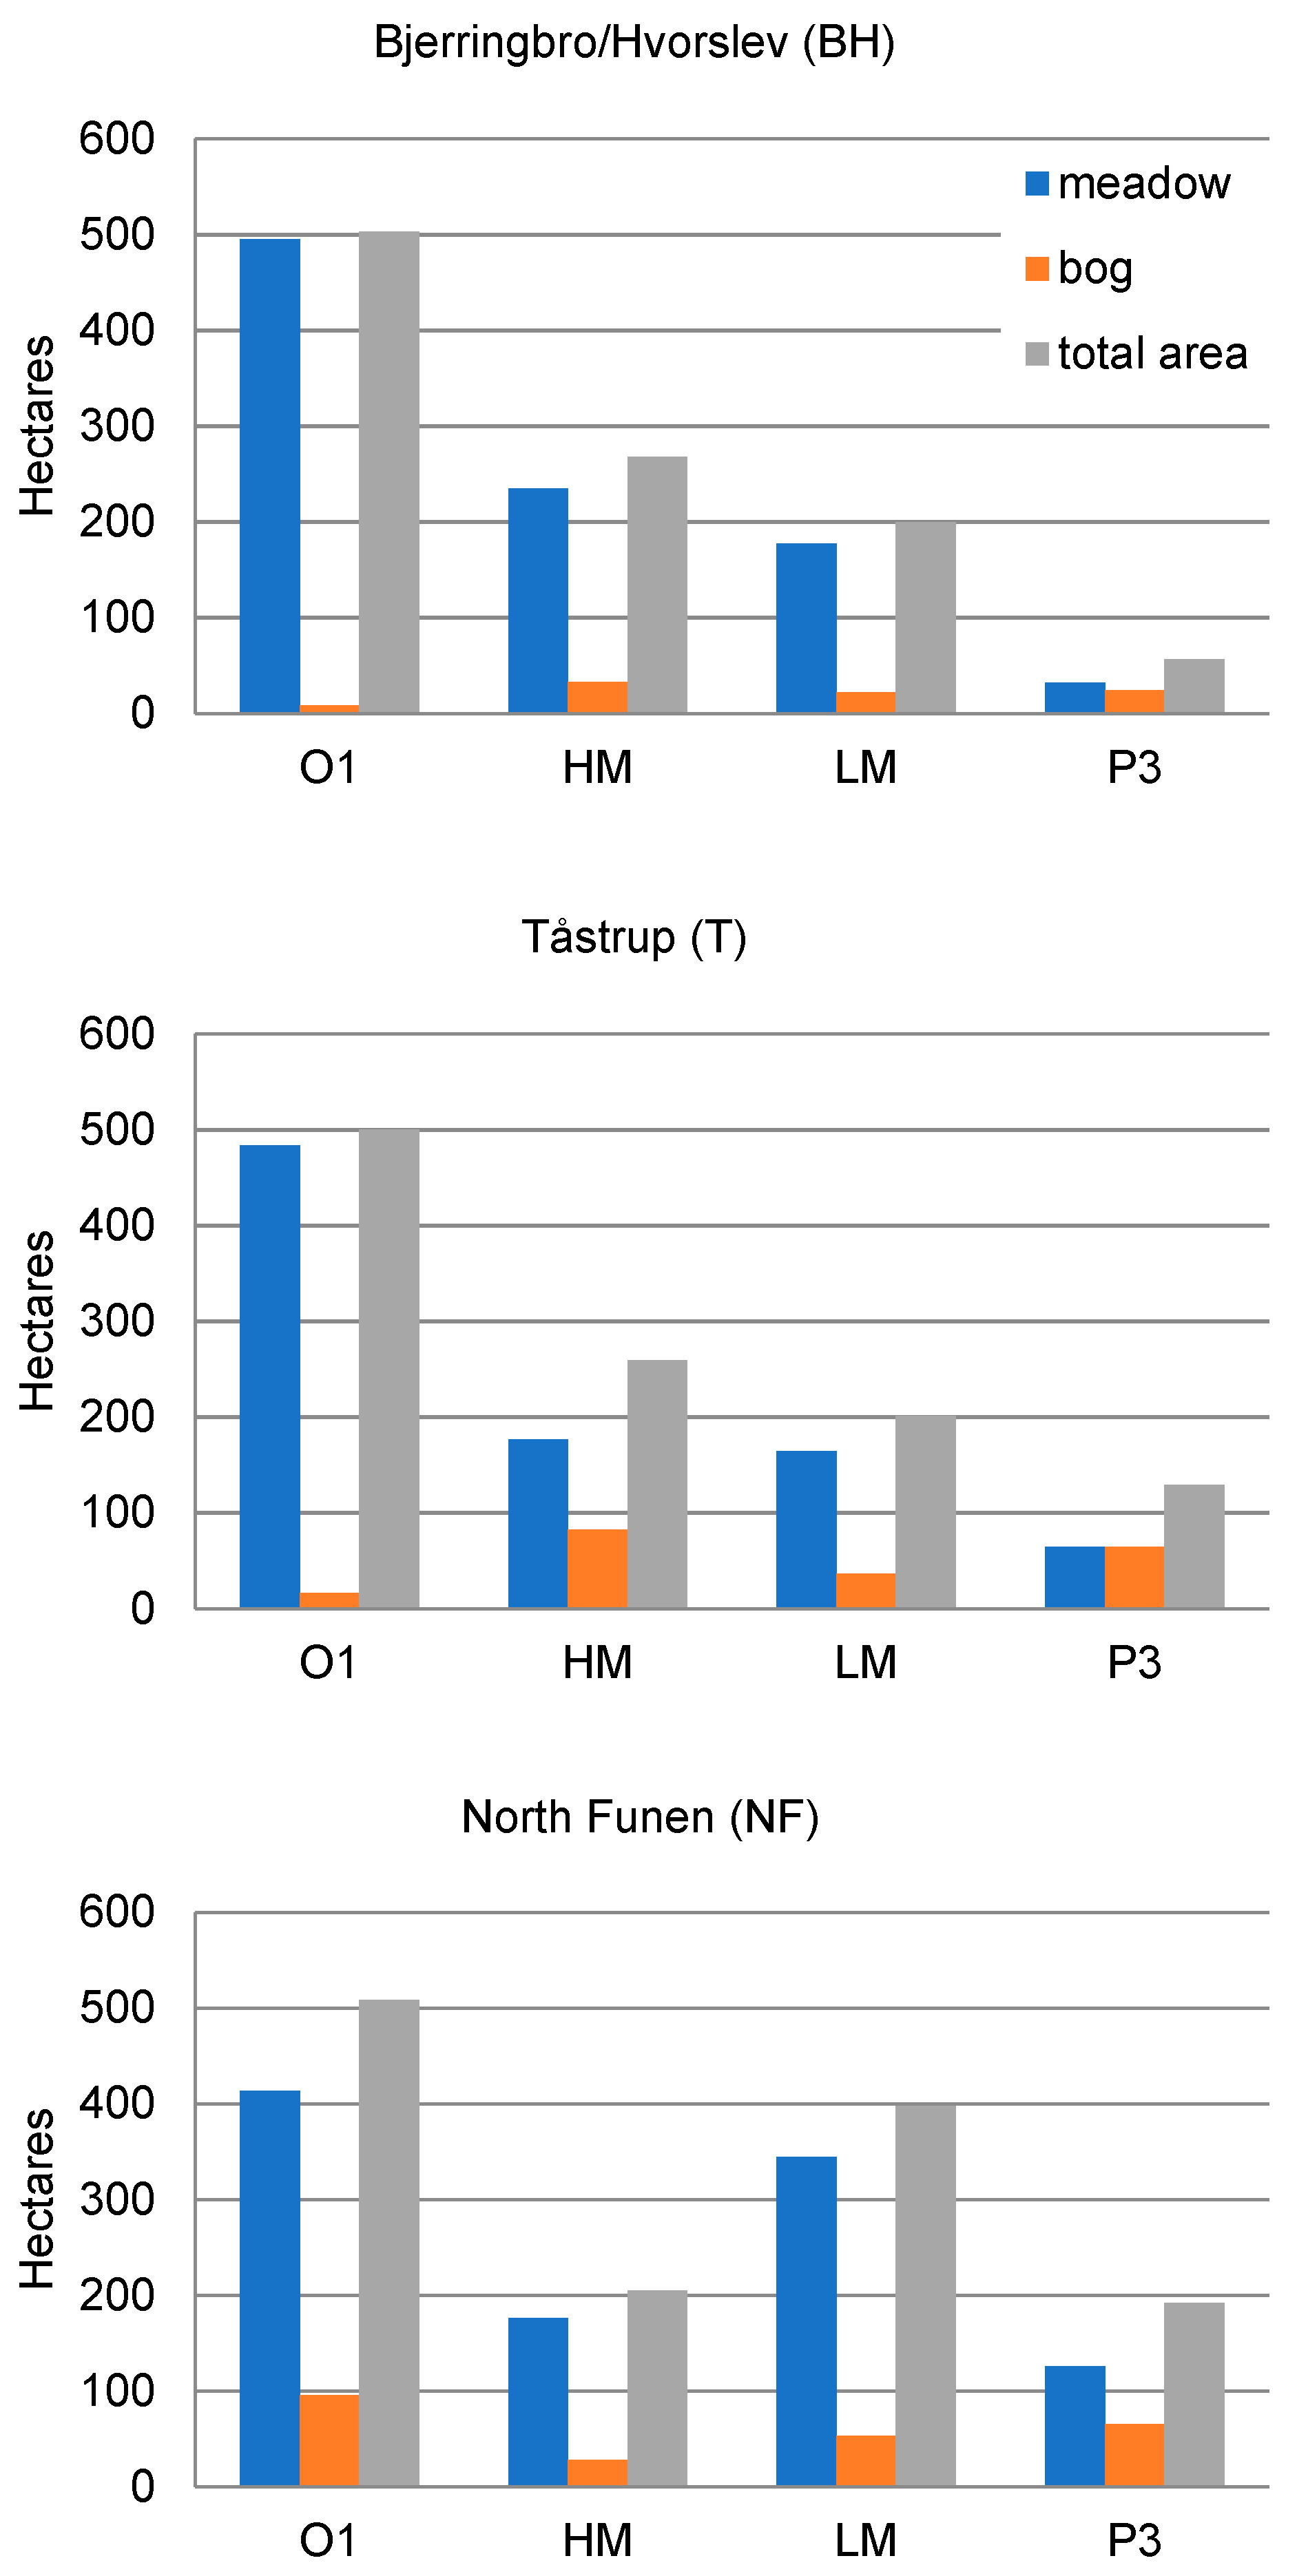
4.1. Historical Loss in Meadow and Bog/Fen Areas

For the three 5 × 5 km2 test areas in Bjerringbro/Hvorslev, Tåstrup, and North Funen, we calculated the areas of meadow and bog/fen (in hectares) for each of the historical maps (Figure 3). A pronounced reduction in the total area of meadow and bog/fen can be seen in all three test areas except for North Funen. However, the historical development of bog/fen habitat areas does not show a reduction in area. The technological development in lowering the water table in bogs/fens and small lakes during the preparation of the HM and LM maps may not have been as advanced. However, the difference in the delineation of meadow and bog/fen areas could also be influenced by more complex definitions of bog/fen, which are open to different interpretations. Protection of the bogs/fens in recent times has likely contributed to the fact that the most recent map also does not show a reduction in the bog/fen areas.

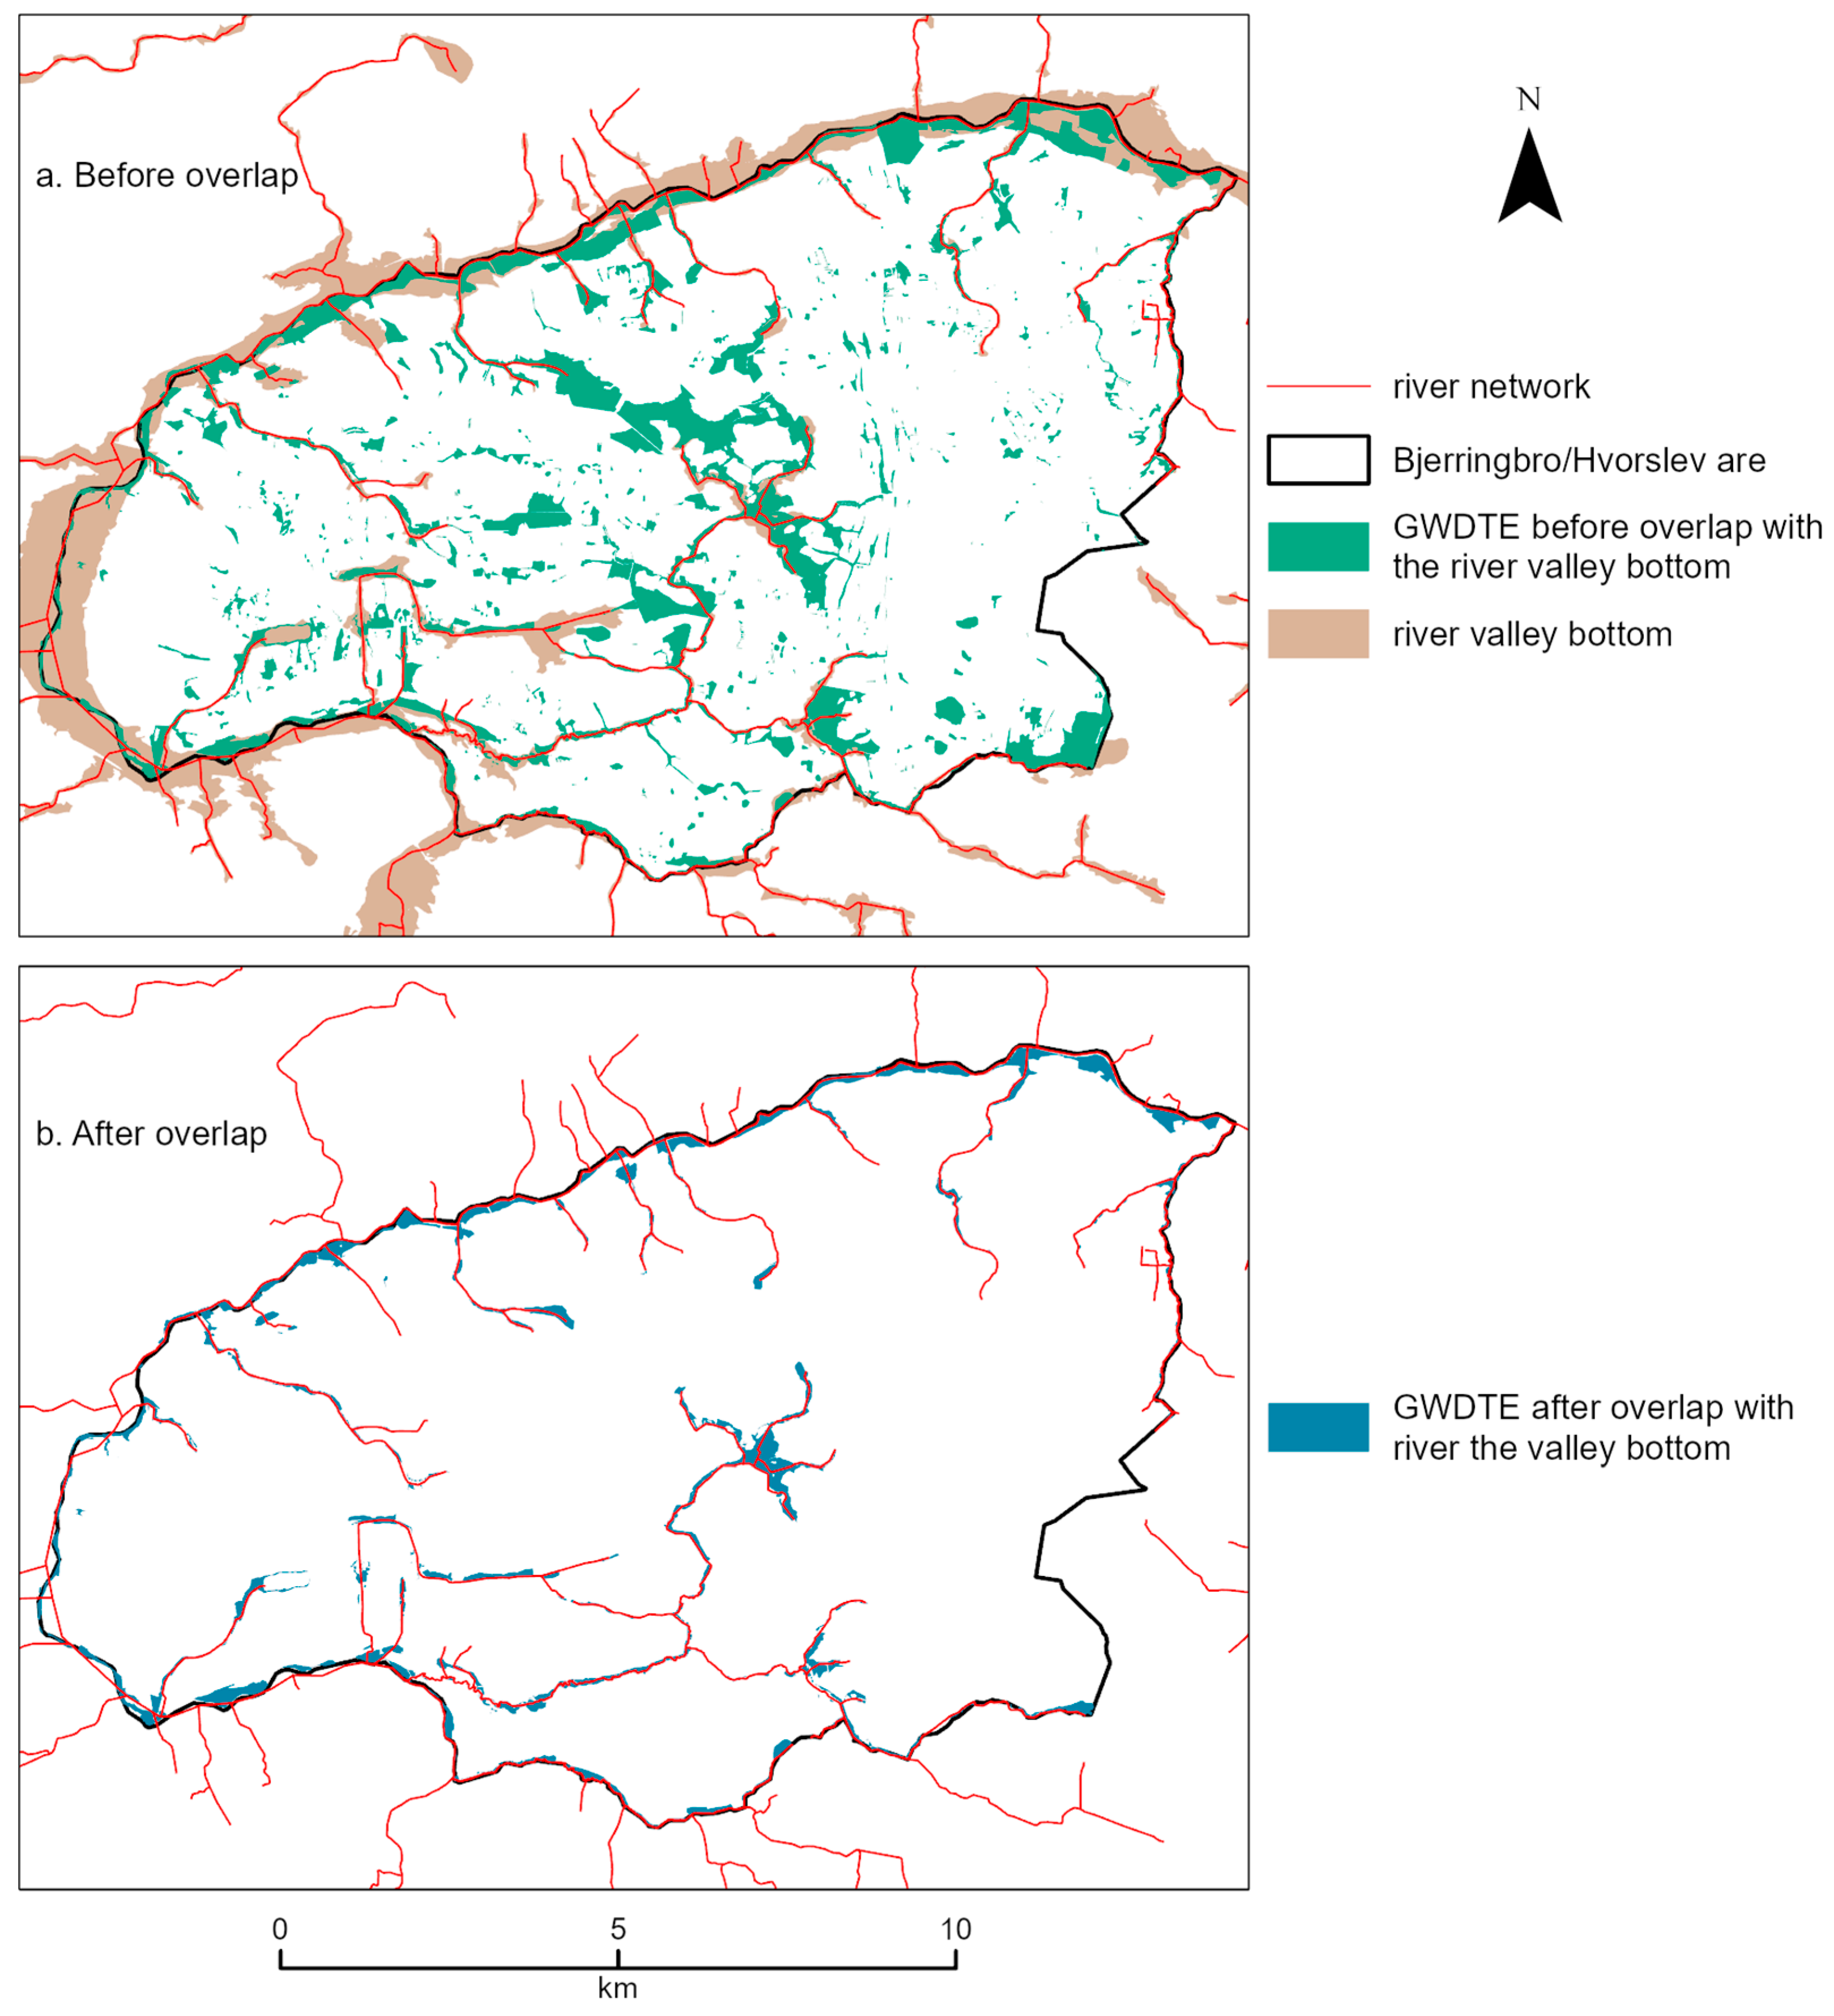
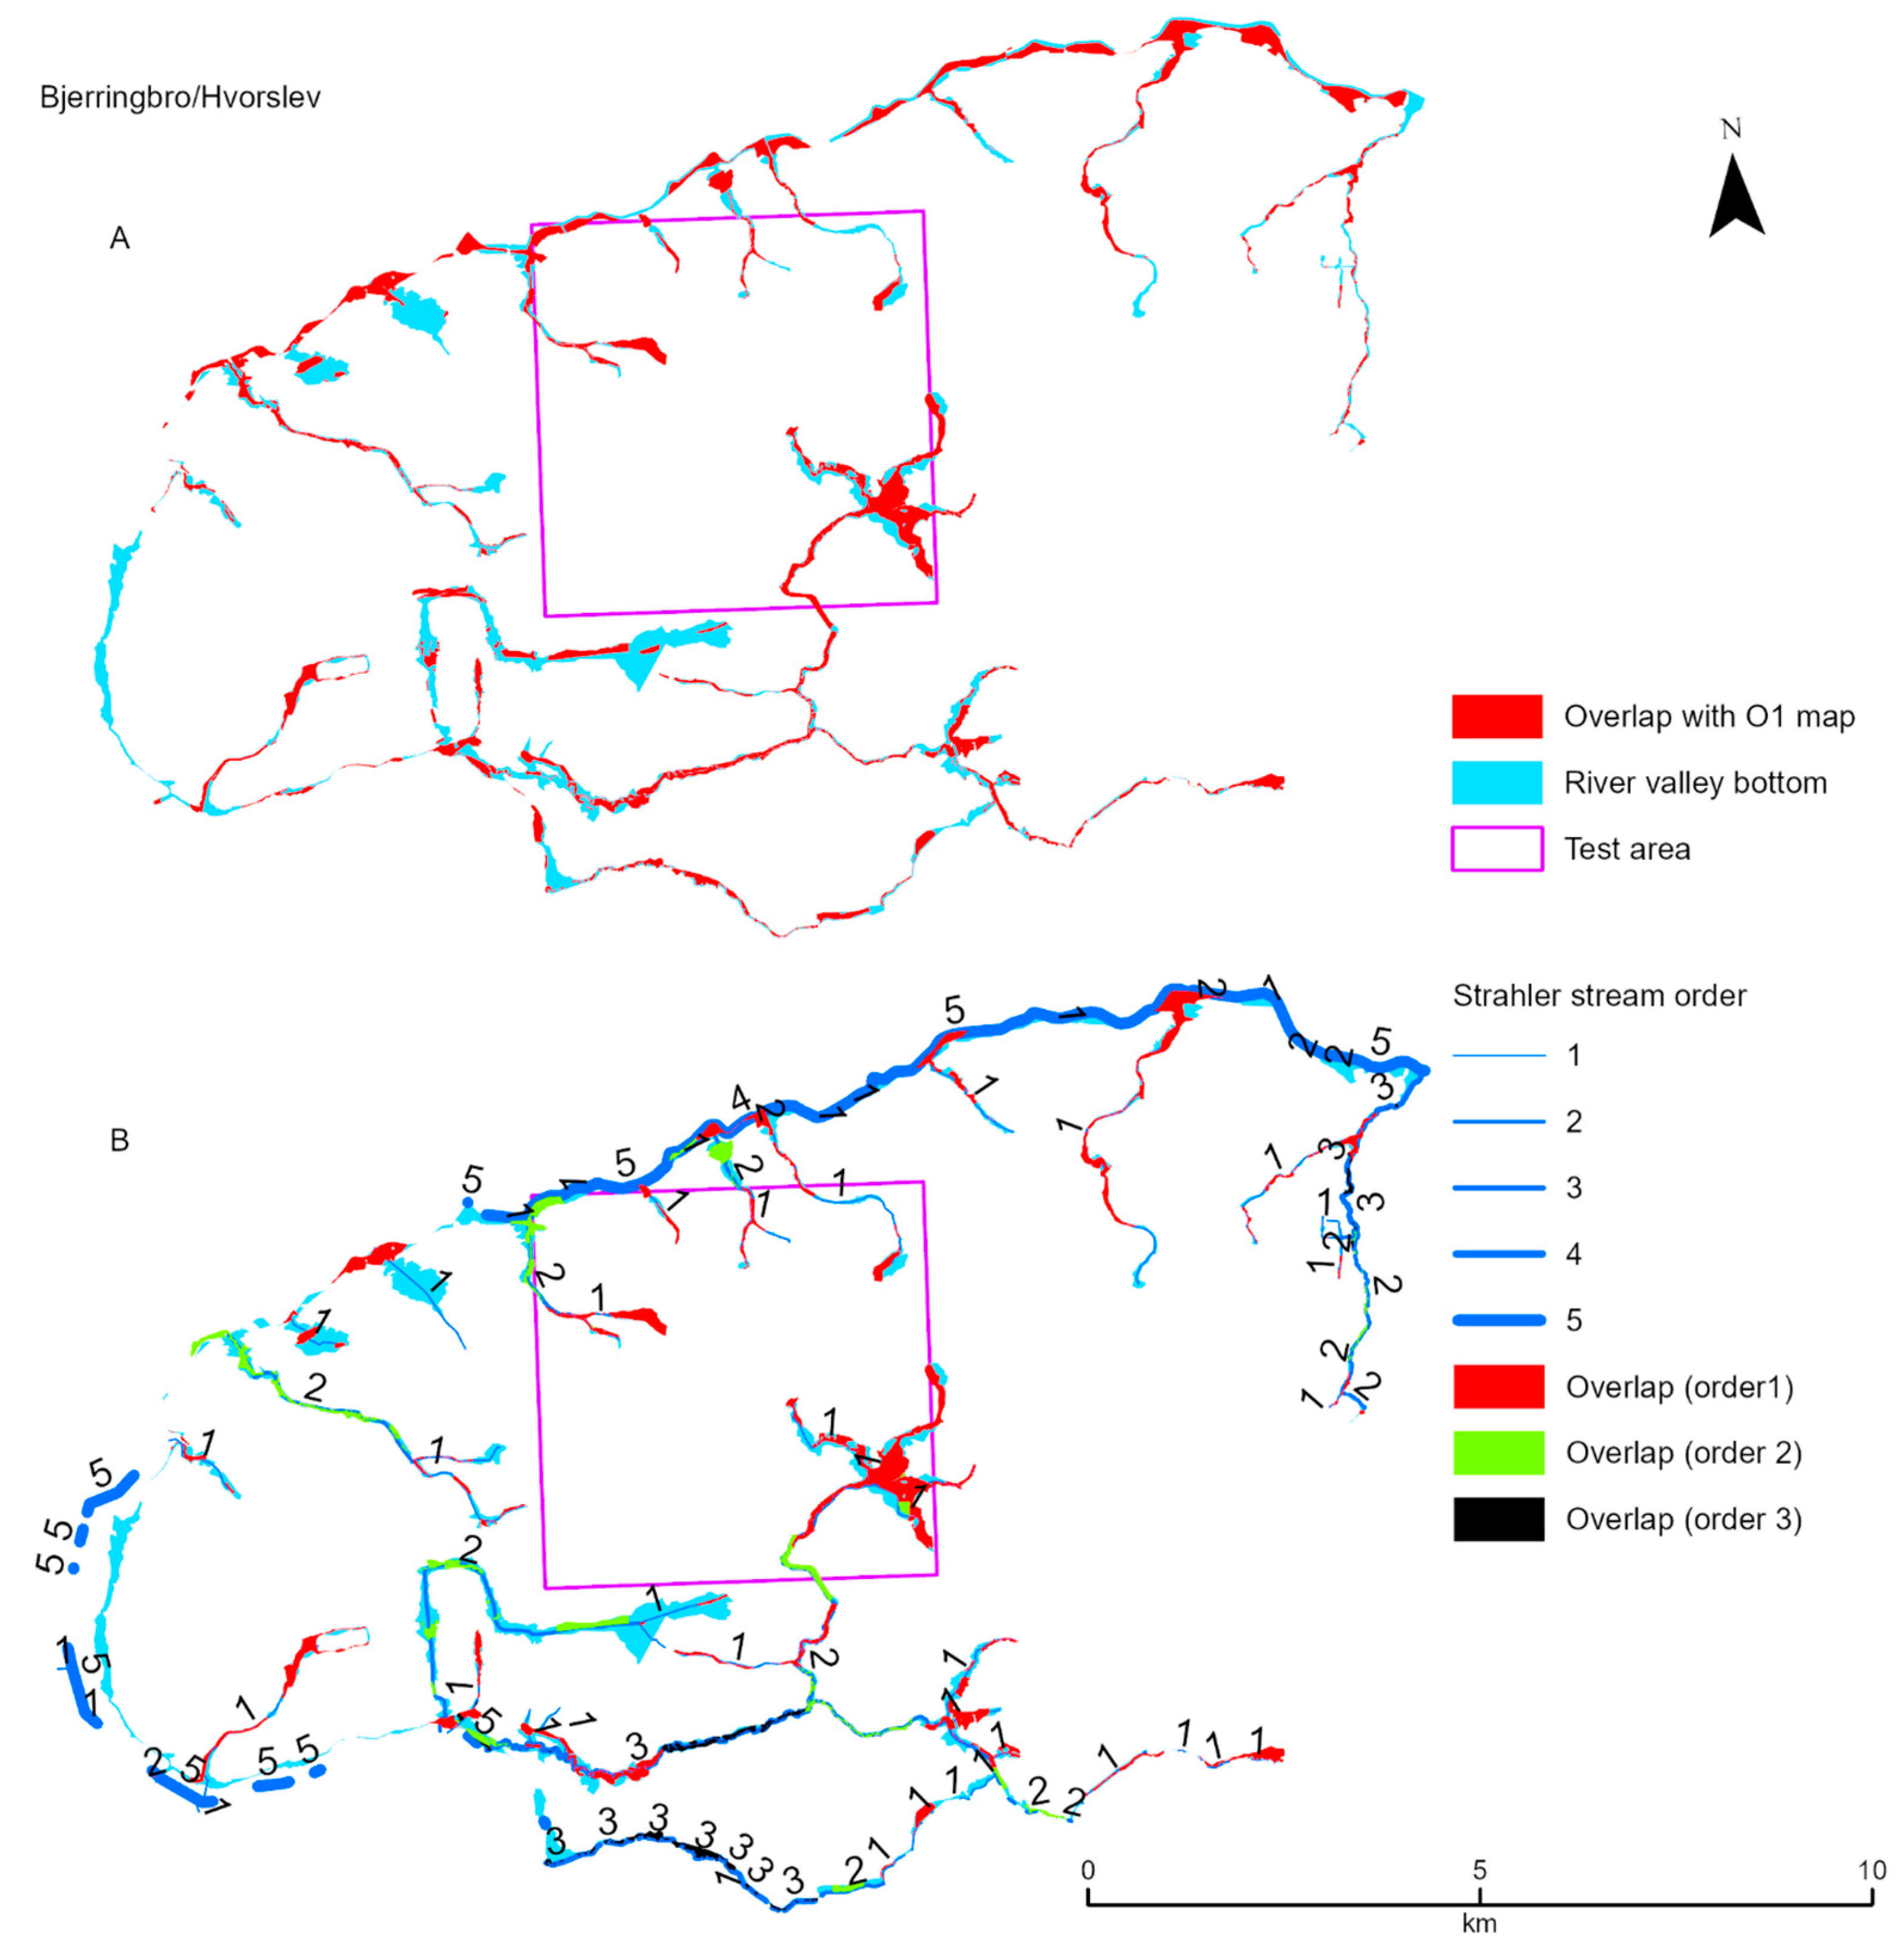
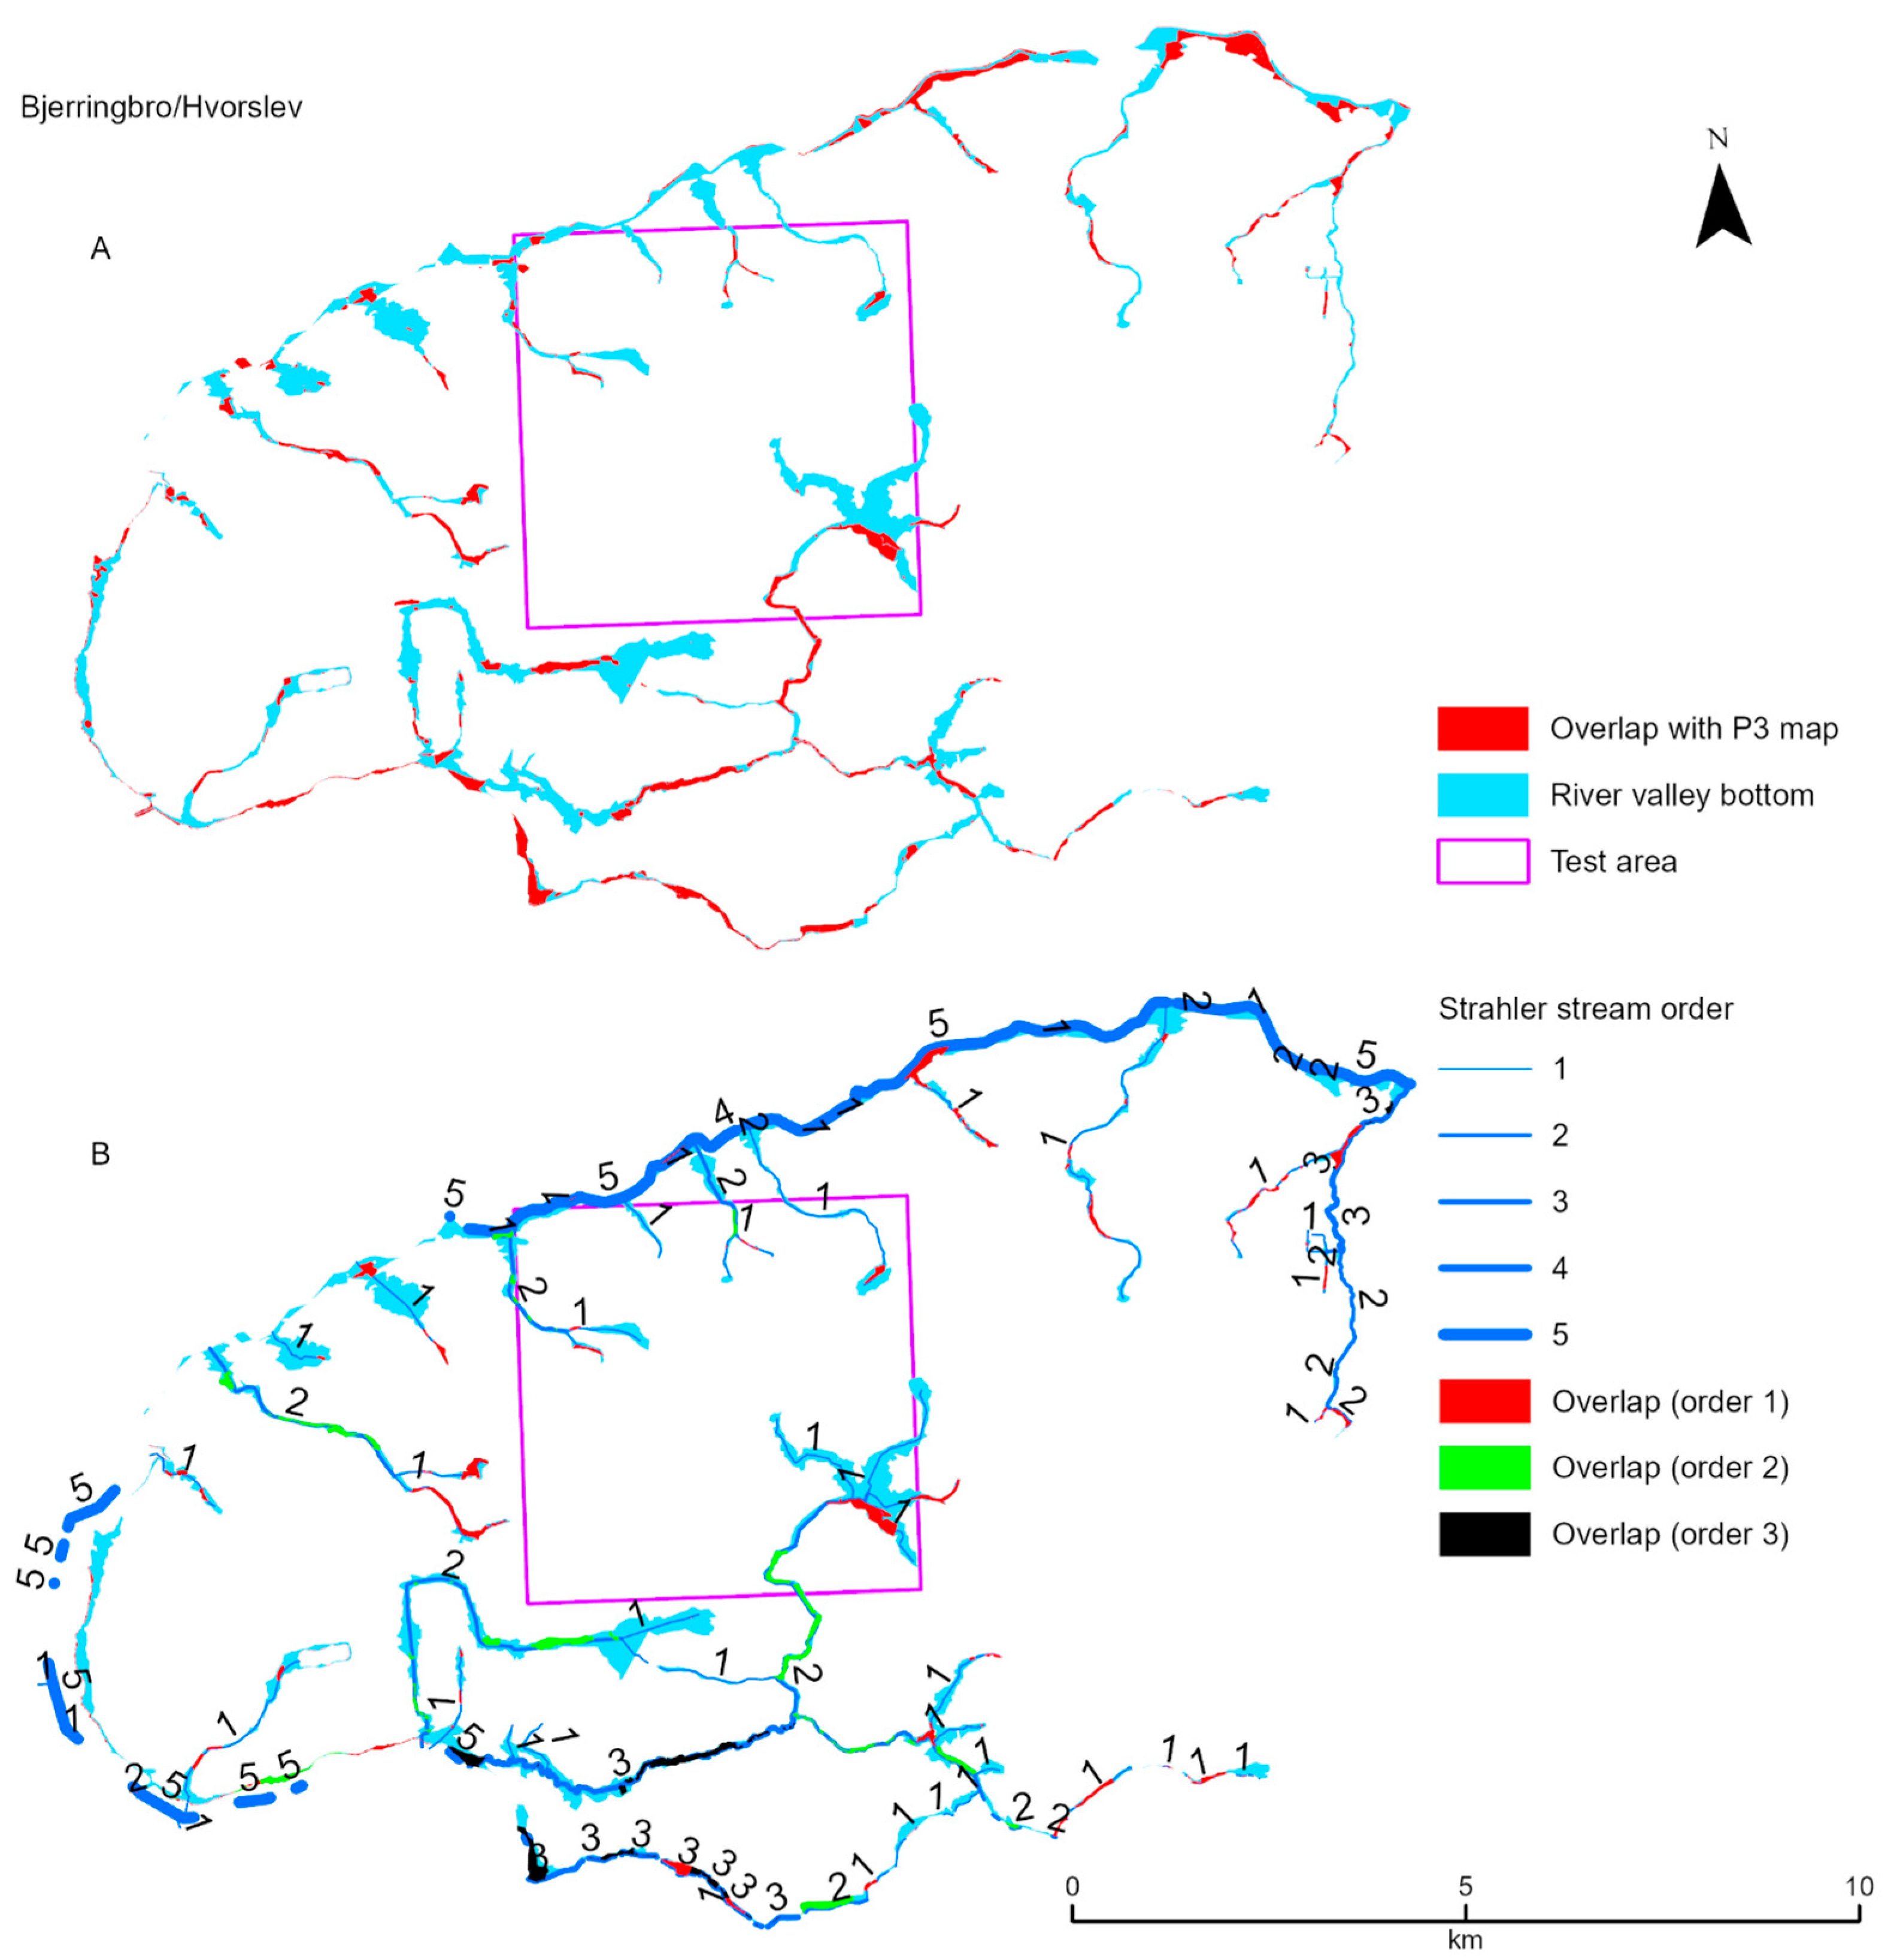
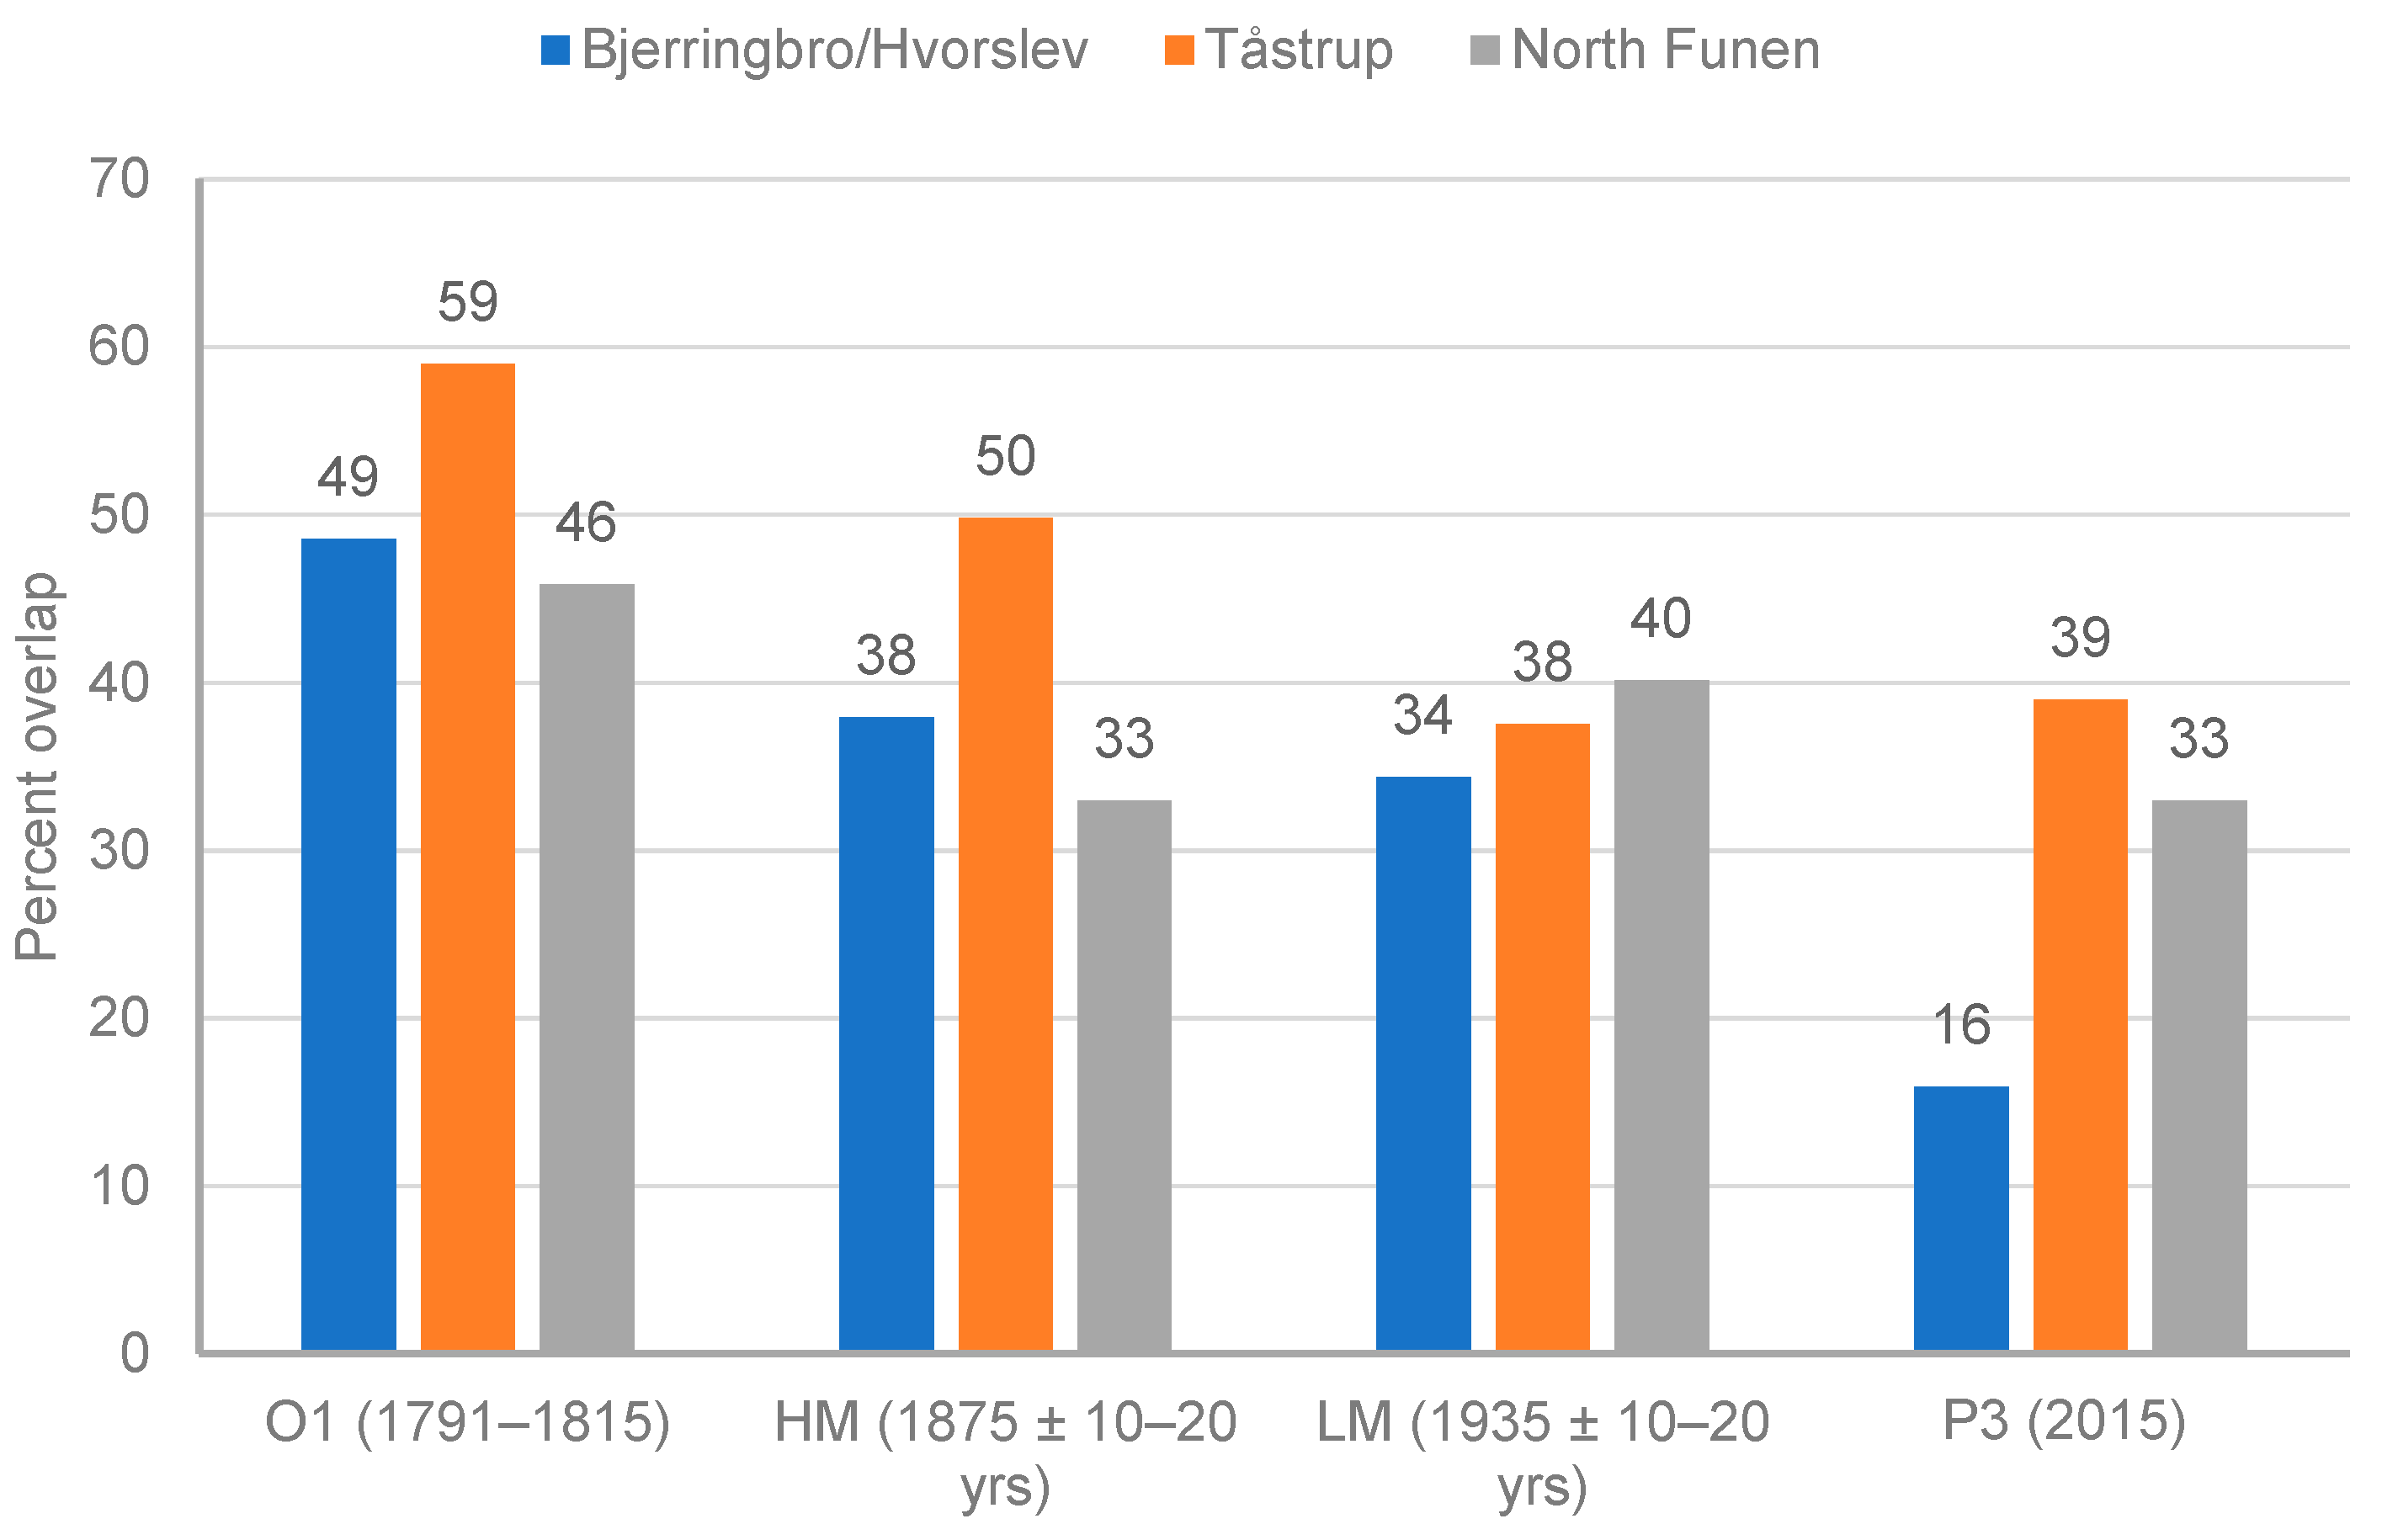
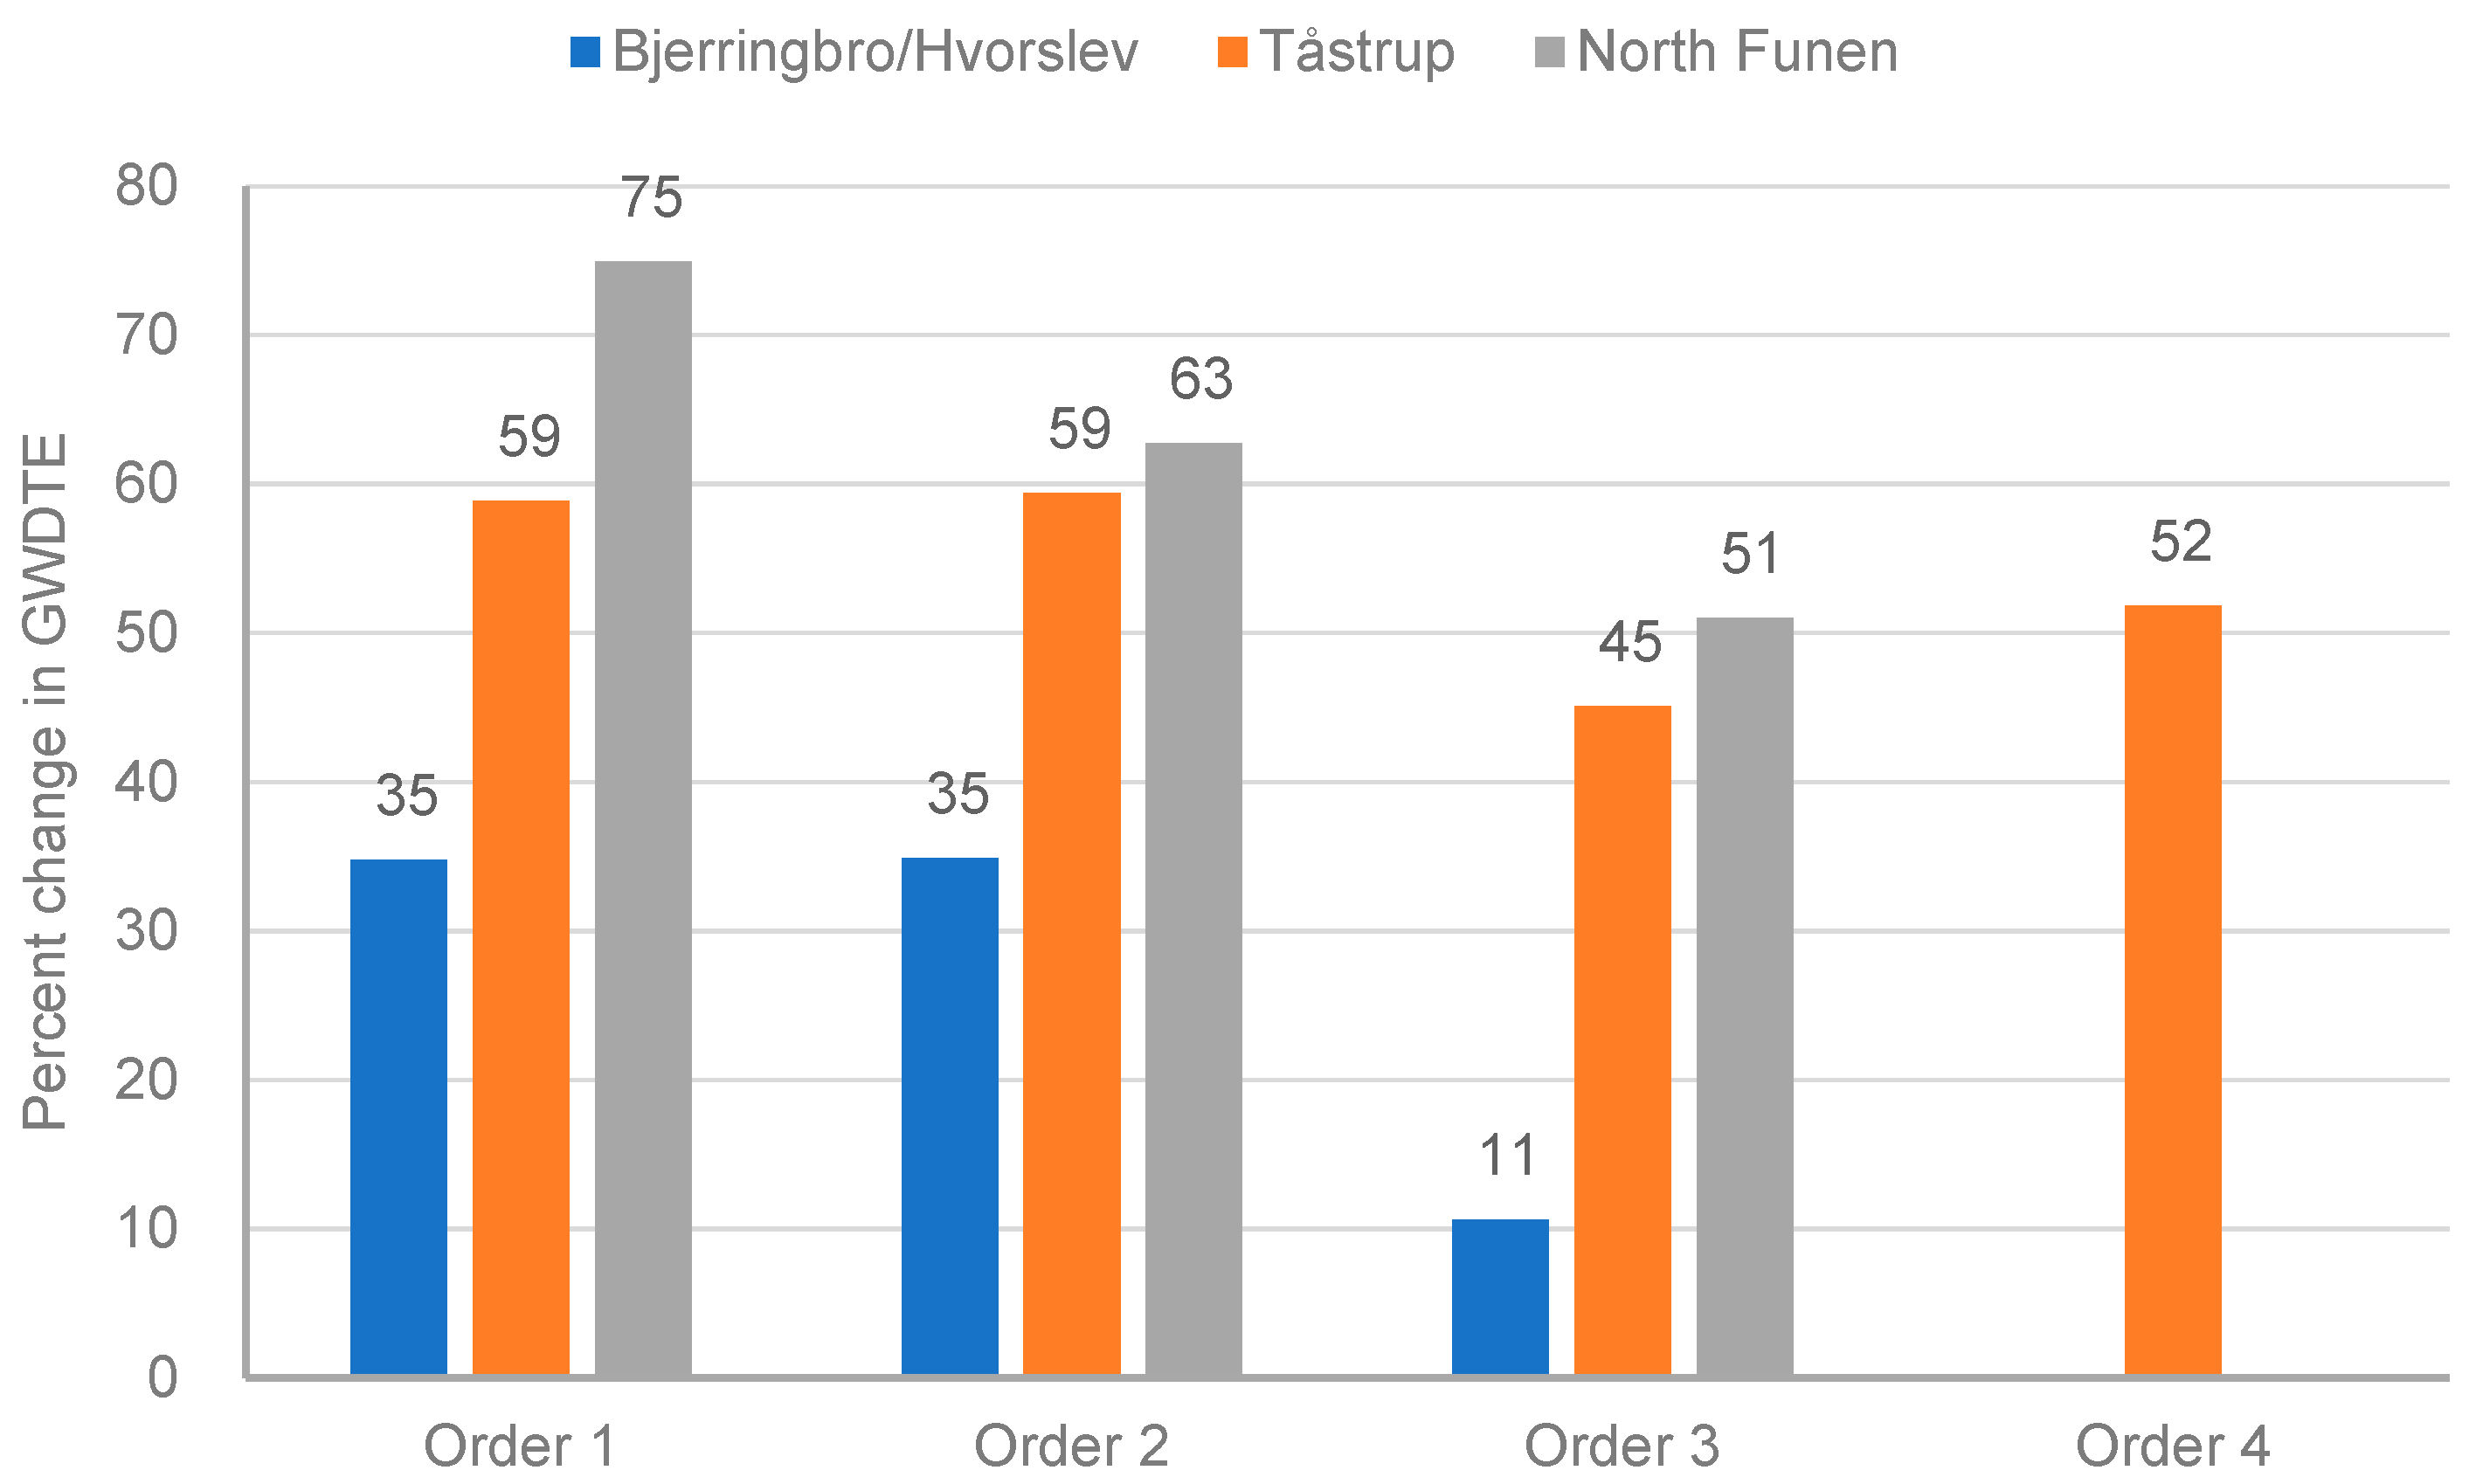
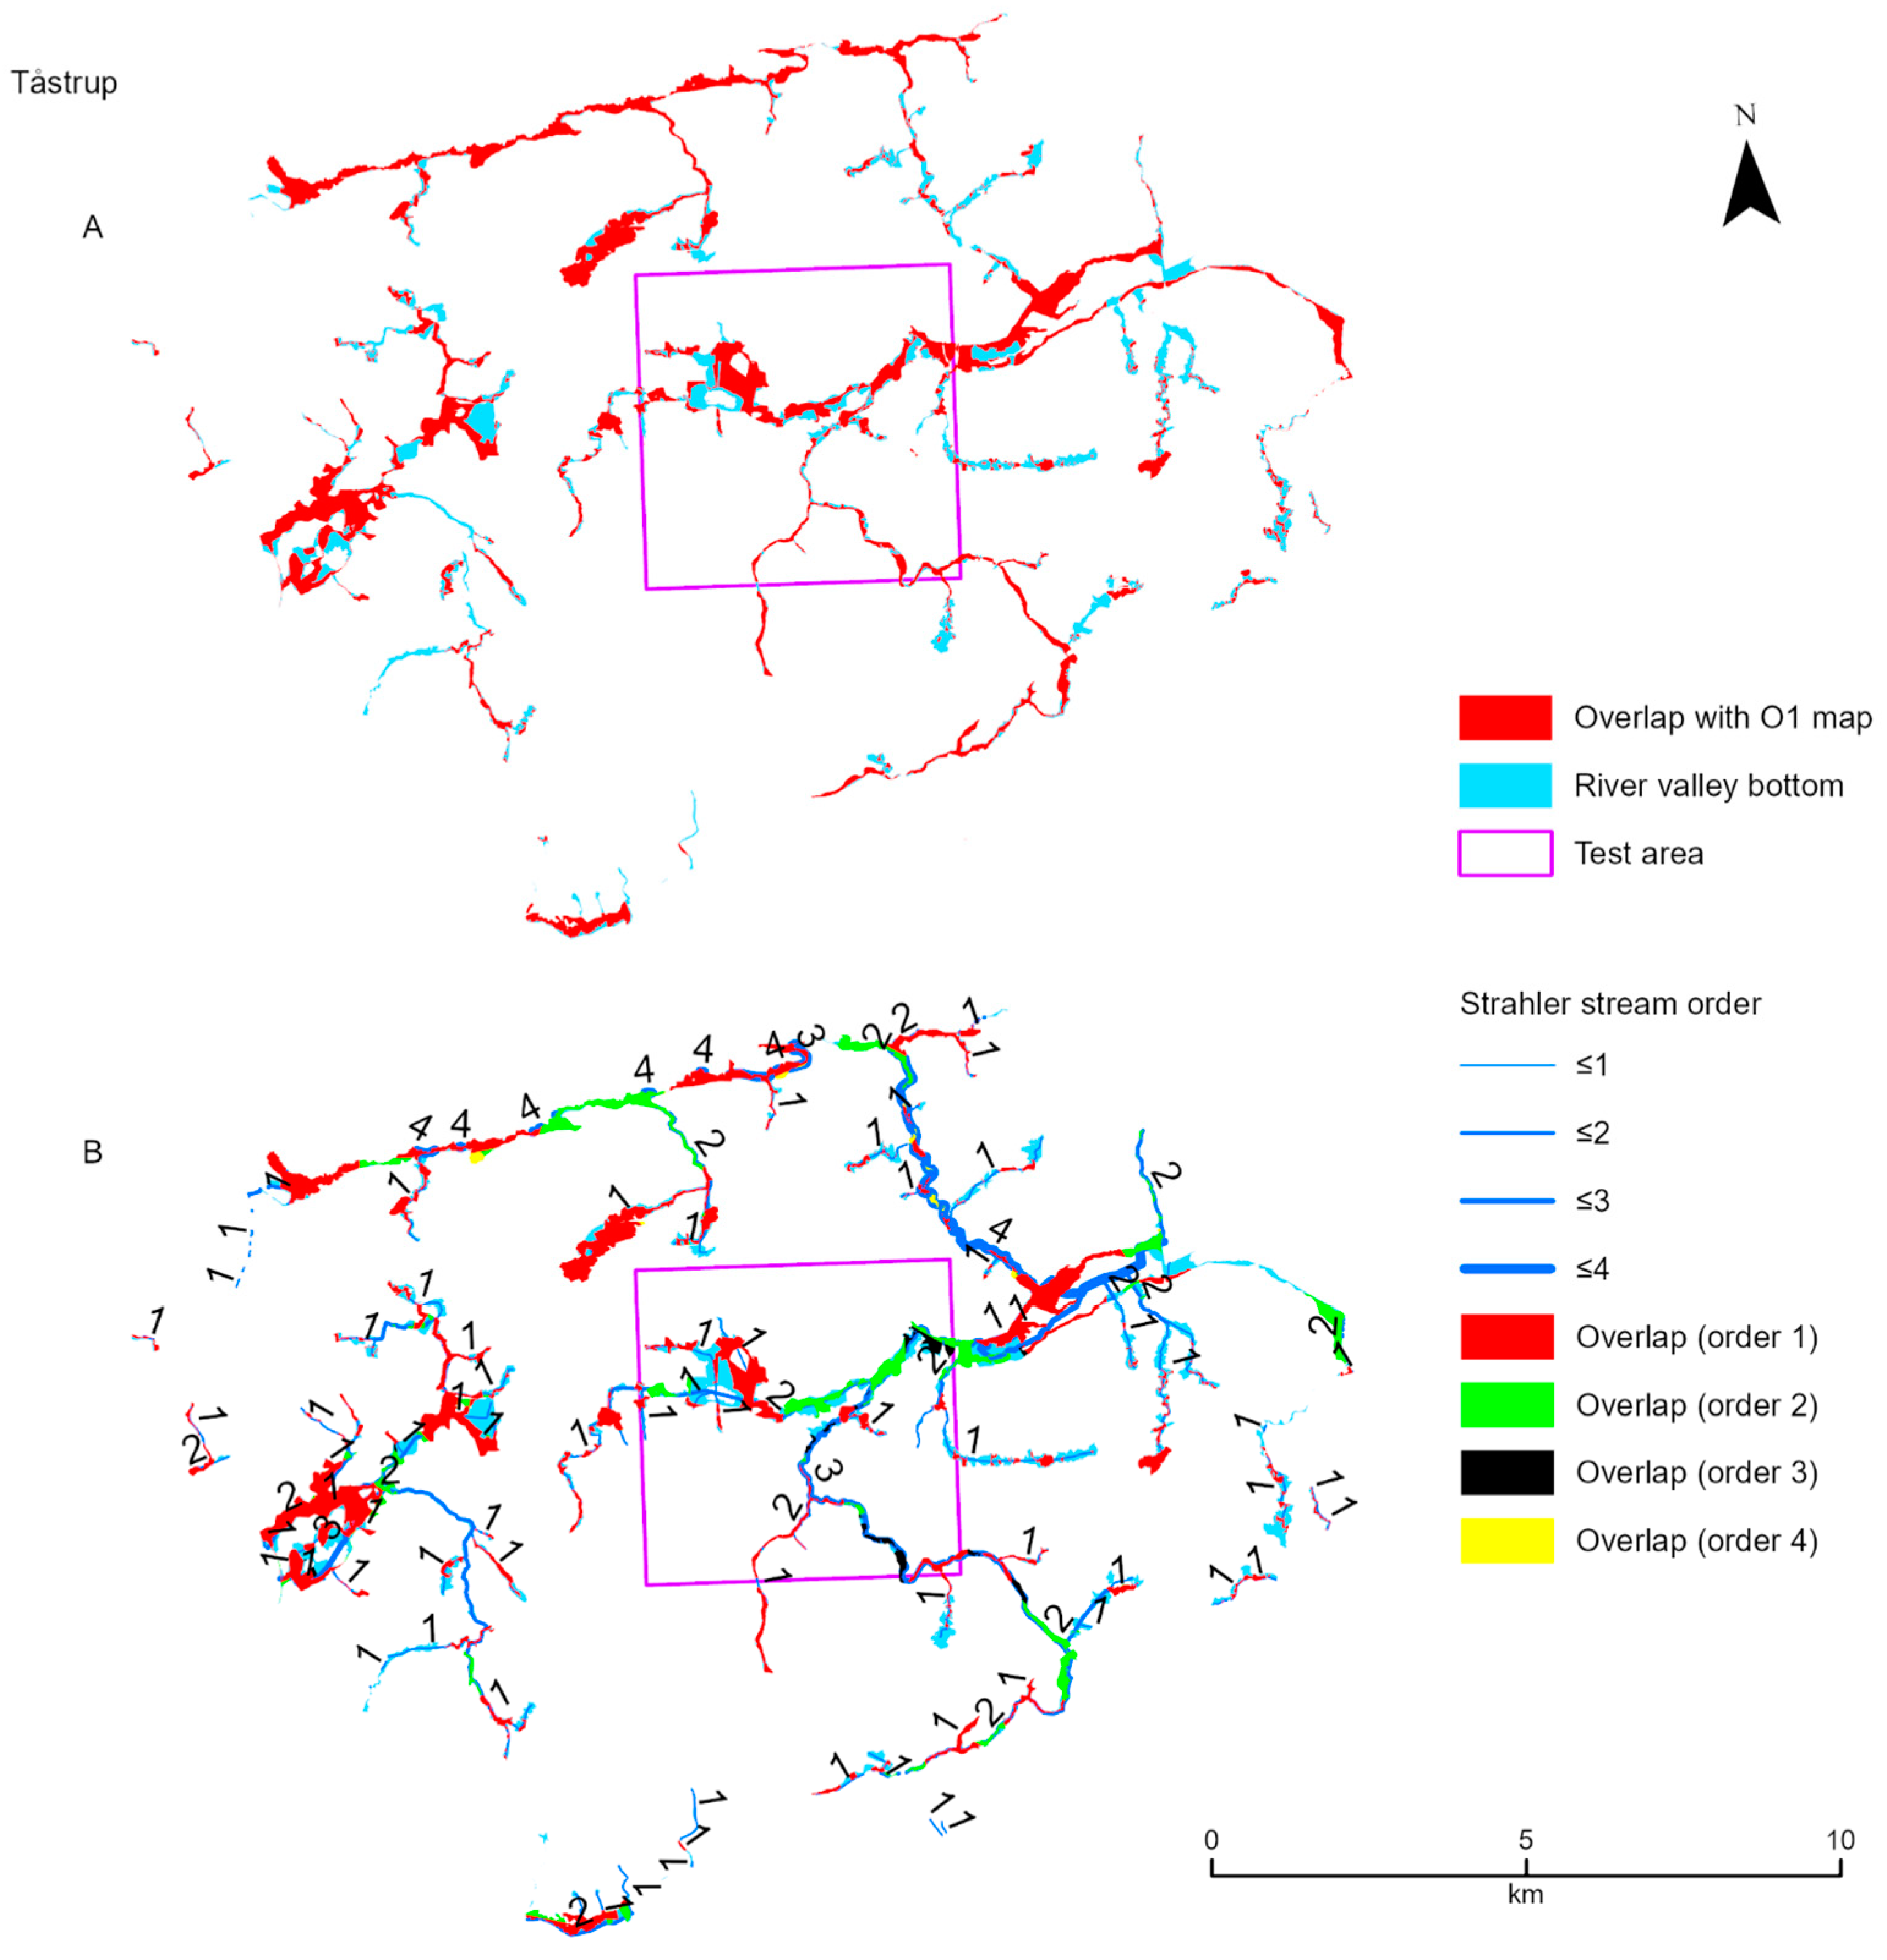
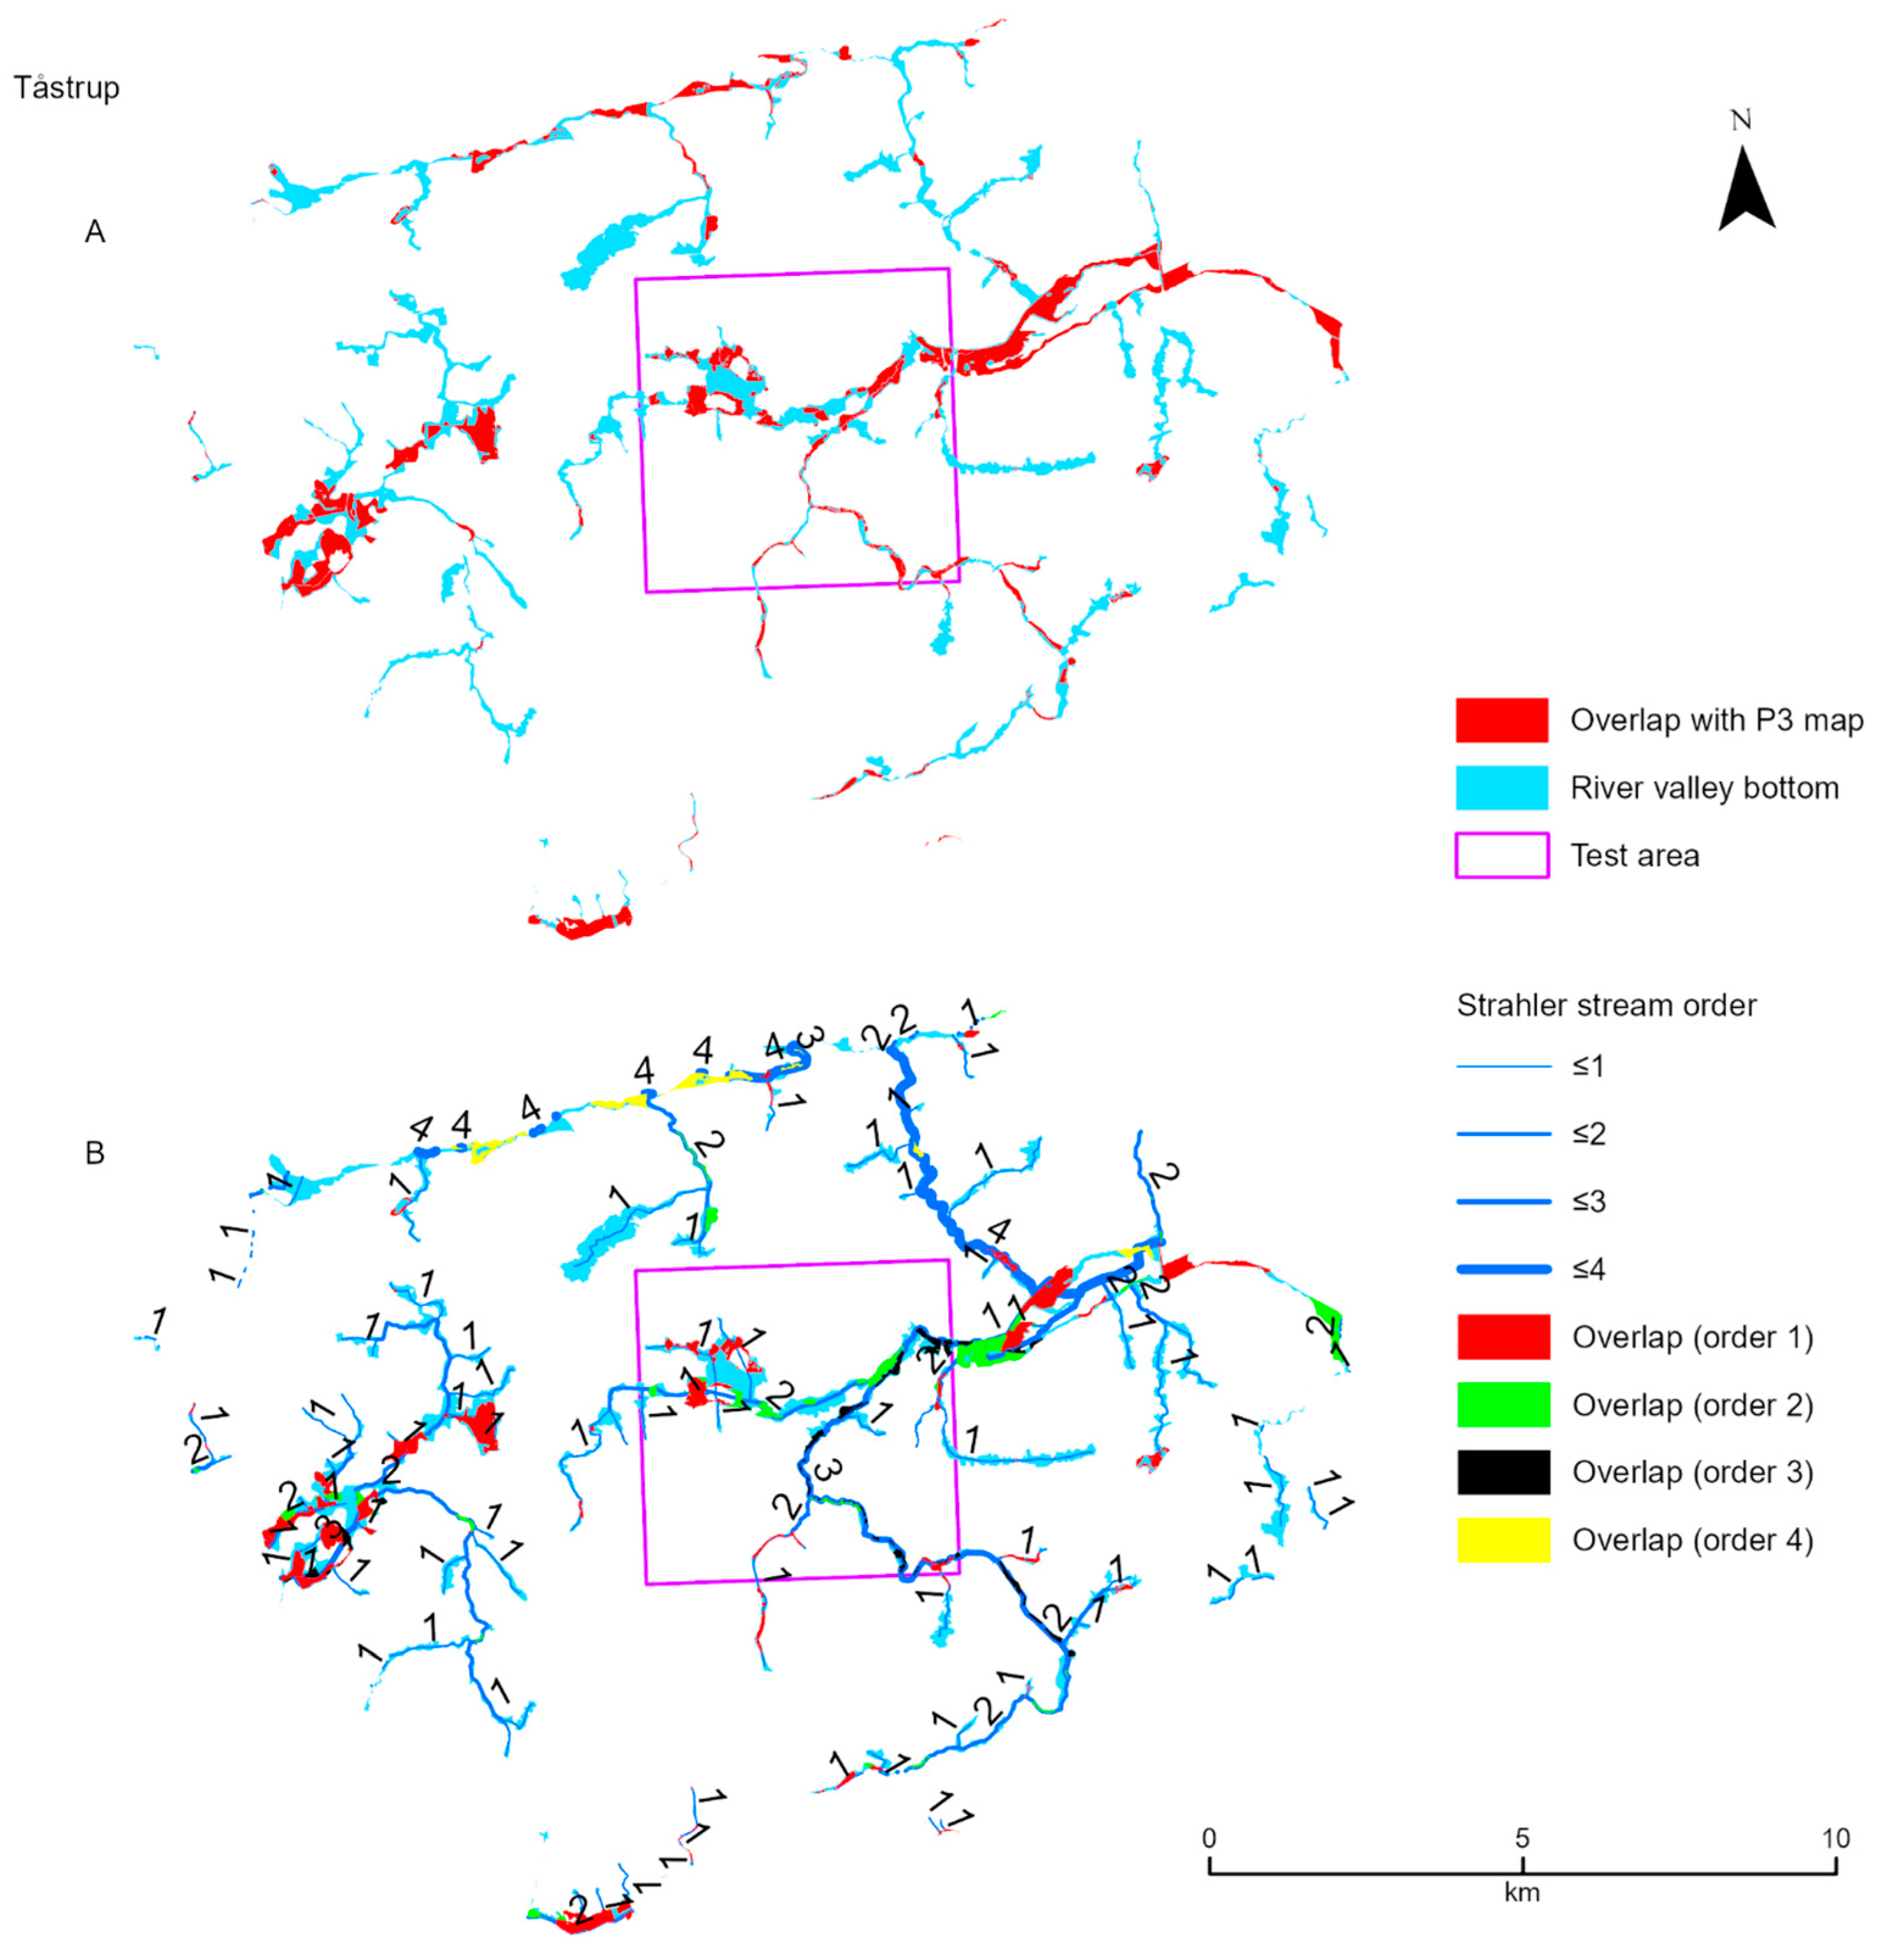
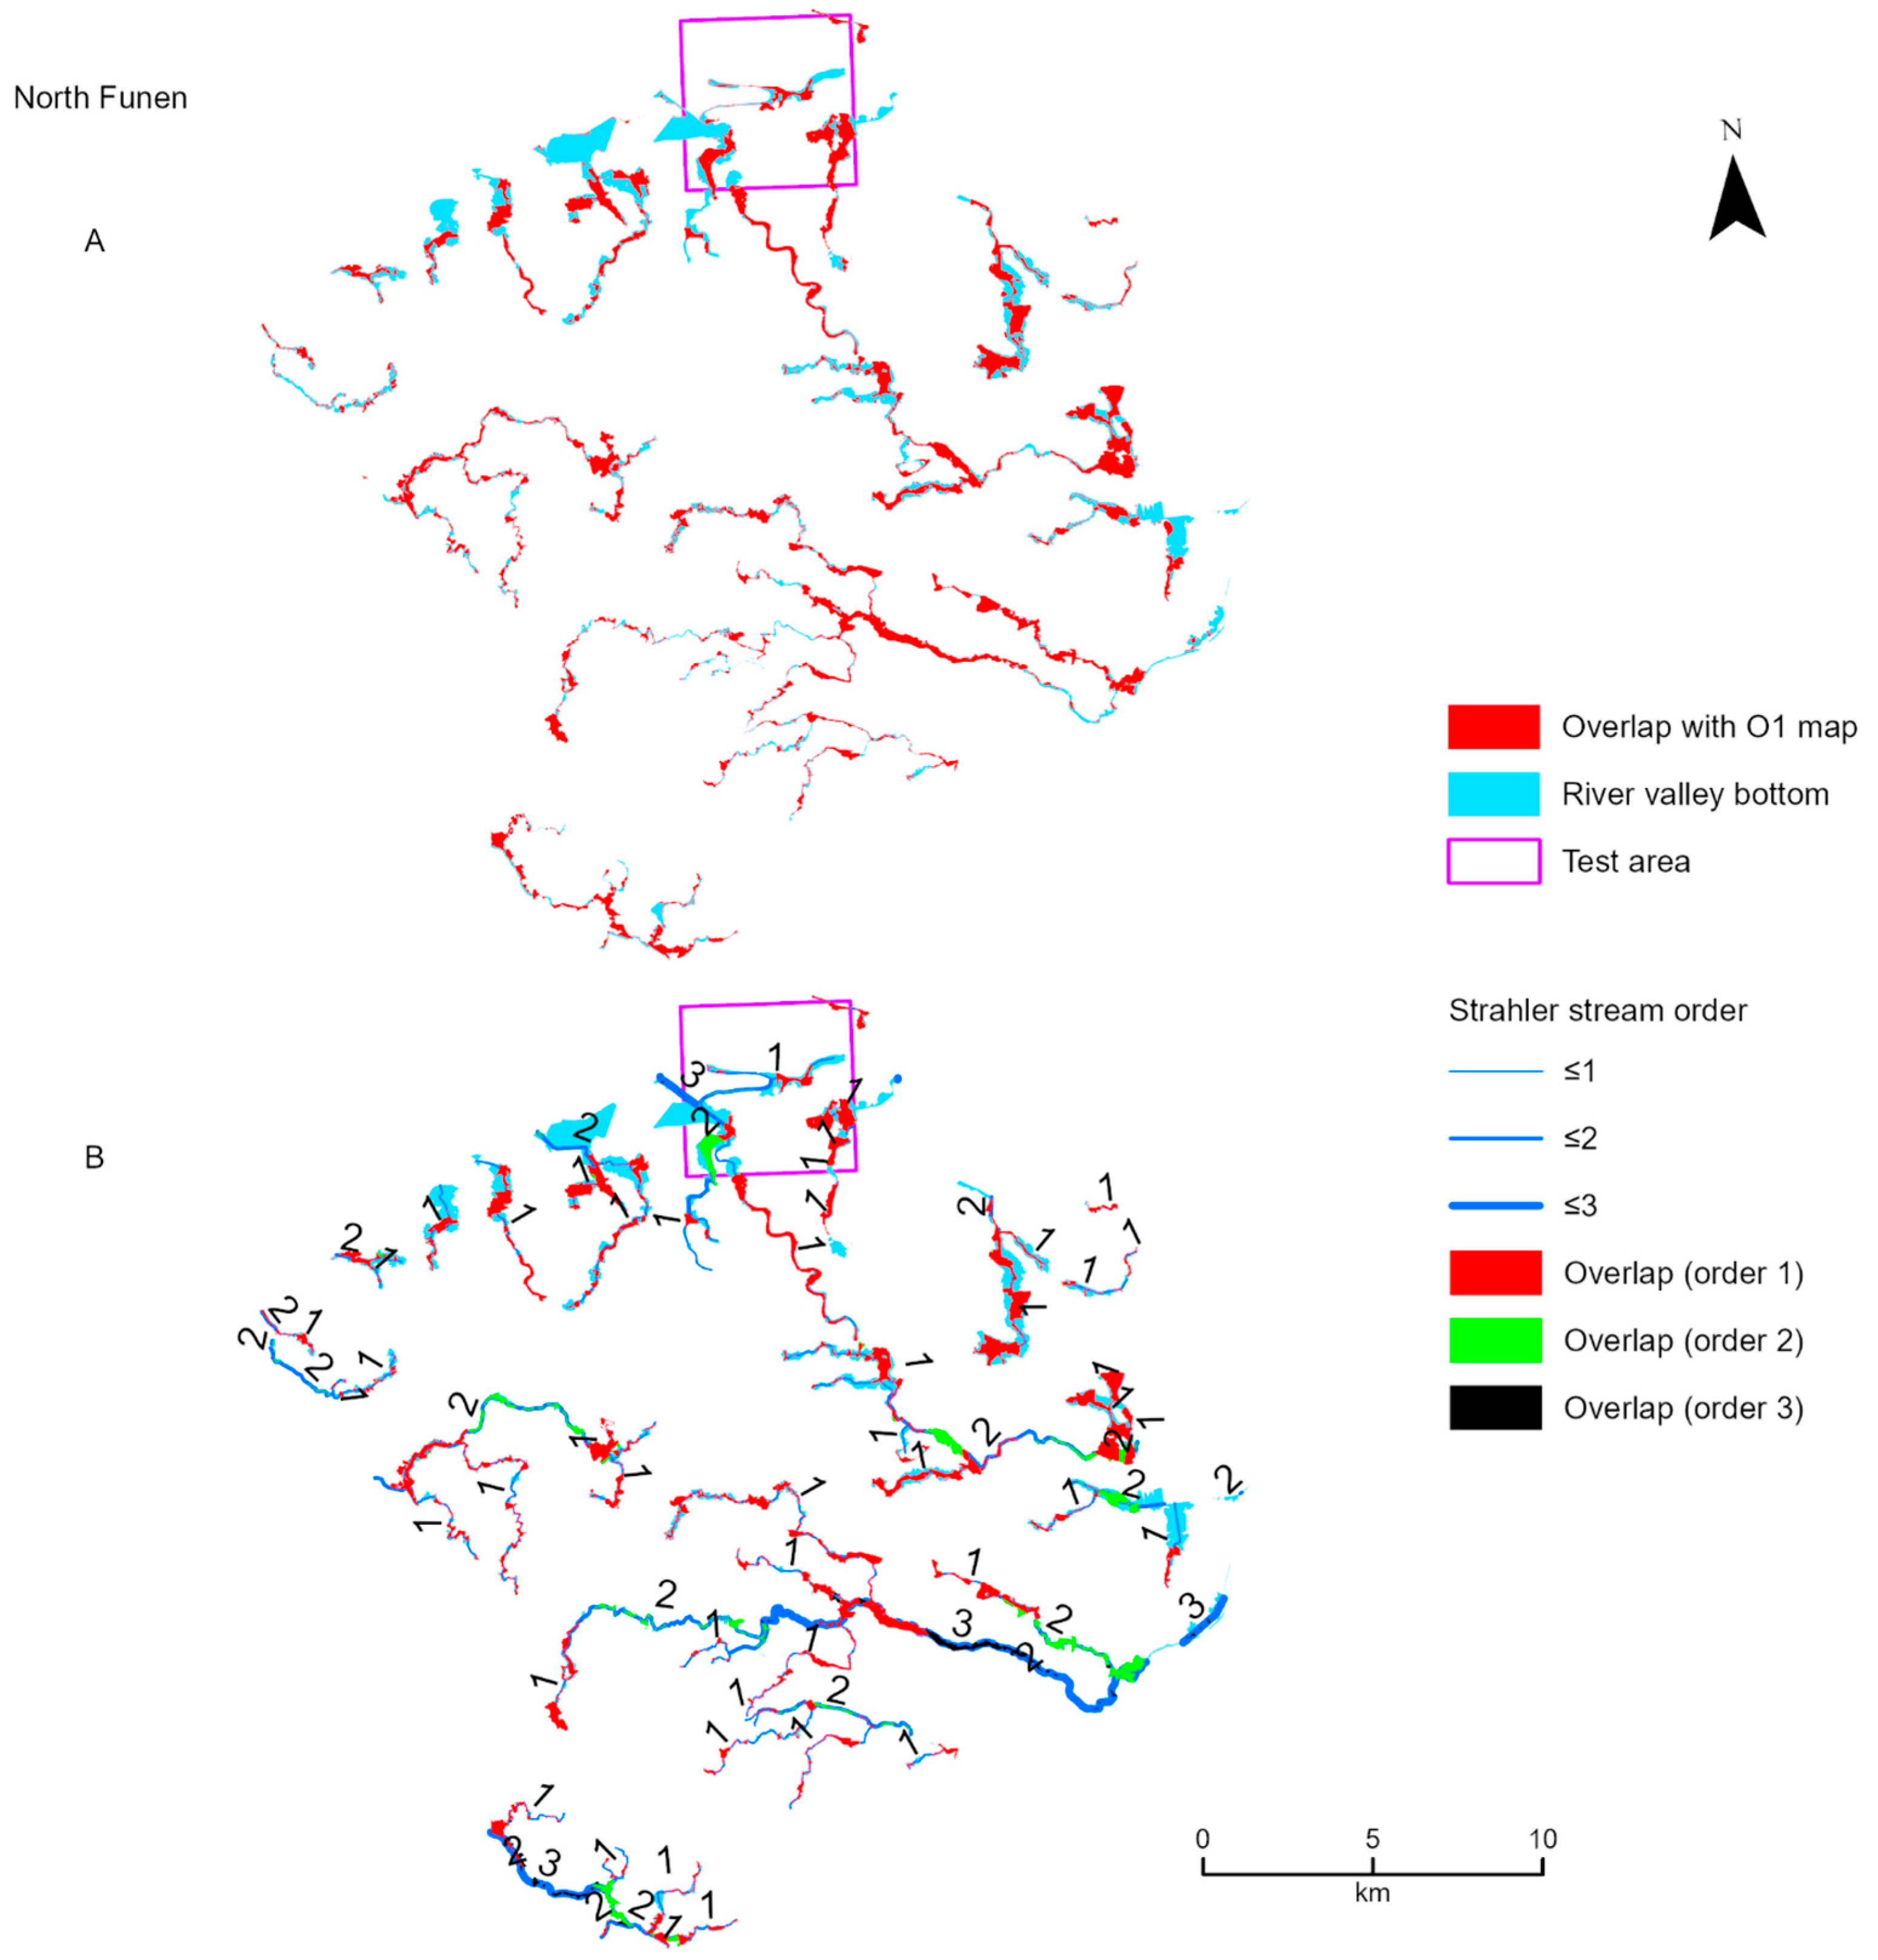
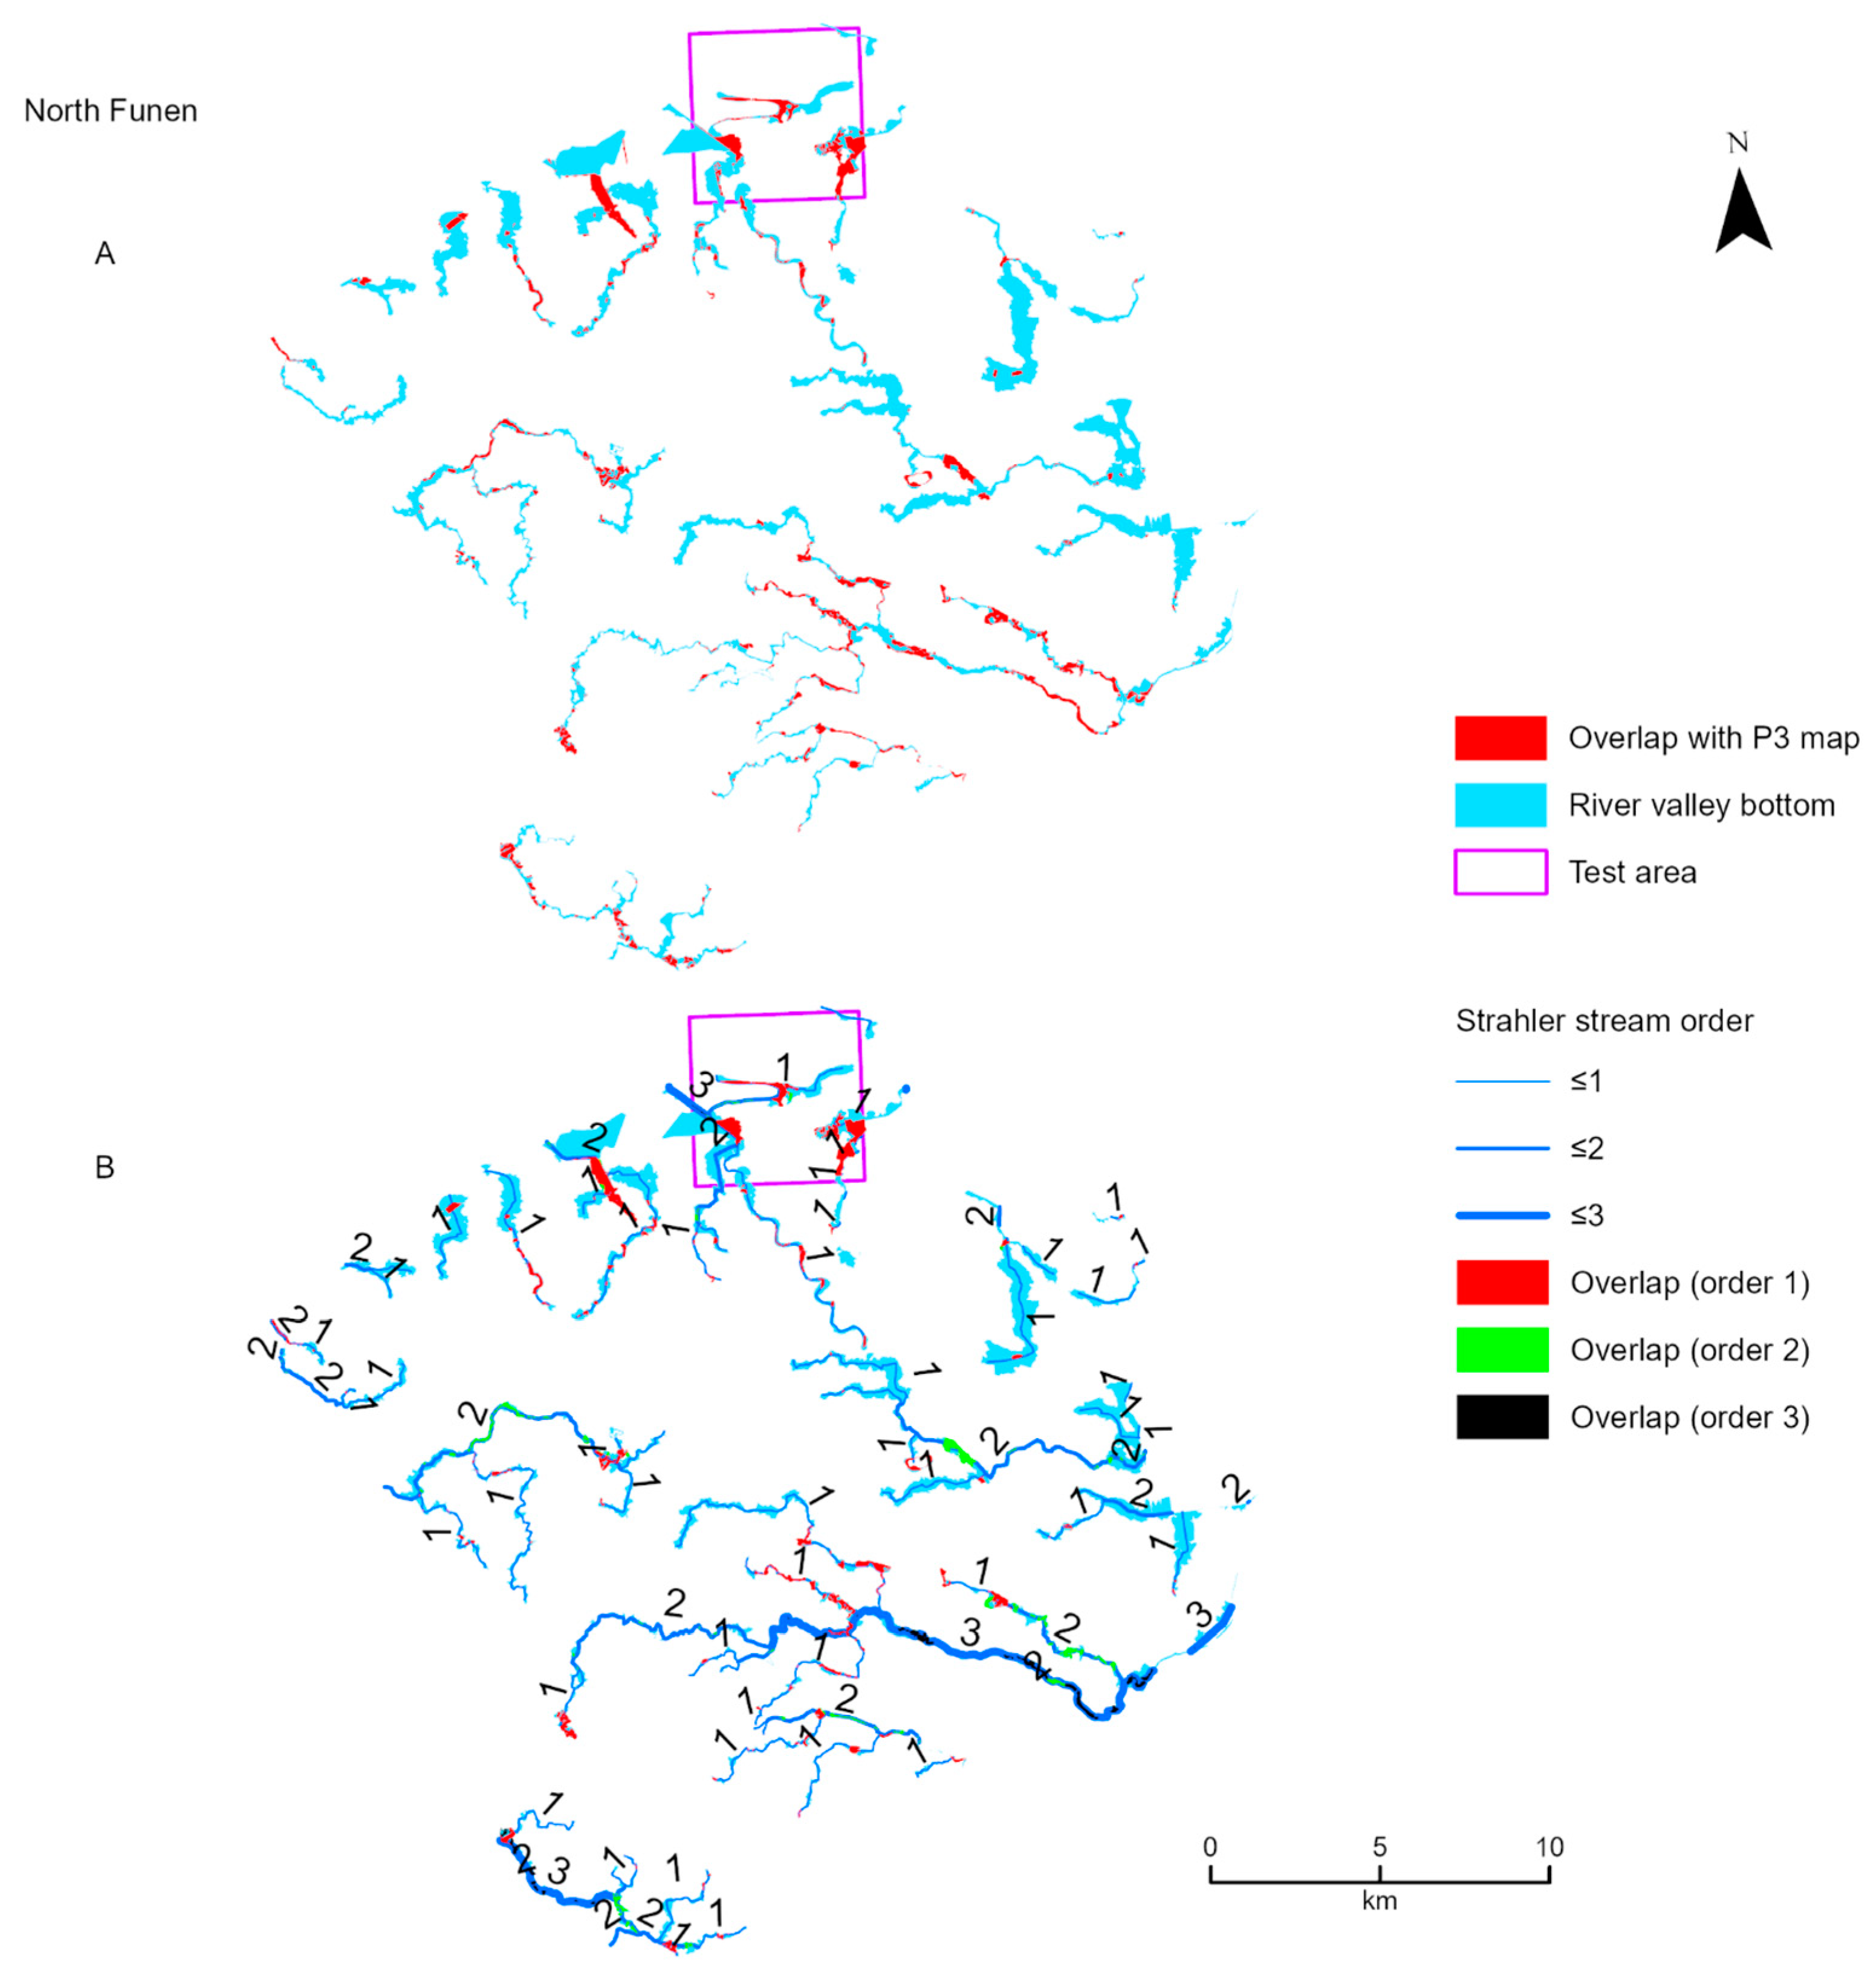
4.2. Overlap Analysis

Figure 4A presents visual results from the overlap analysis between the GWDTE signatures from the O1 map and the river valley bottom within the test and large areas of the Bjerringbro/Hvorslev study area. Figure 4B presents the same results classified according to rivers of the same Strahler stream order. Within the Bjerringbro/Hvorslev area, only order 1 to 3 streams had an overlap between the GWDTE and the river valley bottom. Figure 5A,B presents similar results as Figure 4A,B using the P3 maps, which are more recent mapping campaigns. Similar maps of the Tåstrup and North Funen areas are provided in the Appendix A.
Figure 6 presents graphs showing the gradual historical changes in GWDTE areas expressed as percent overlap between the signatures of GWDTE (i.e., meadow and bog/fen, and the river valley bottom for the test areas for all historical maps). There is a general decreasing trend of GWDTE areas within the test areas for the different mapping periods except for North Funen. However, a decrease is observed compared with the newest map (P3). Figure 7 presents results from the percent change in GWDTE areas moving from the 19th century (O1 map) to the current time and classified according to the Strahler stream order associated with the rivers within those areas. We calculate this for the initial GWDTE area, thereby expressing the quantified percentage loss in the GWDTE area for each river order stream moving from the O1 to P3 mapping periods. We observe a lower change in GWDTE loss as we move higher up in stream order, clearly defined within the Bjerringbro/Hrorslev and North Funen areas. The Tåstrup area also shows a lower change in the loss of the GWDTE area as stream orders go up, except for a deviation with the order 3 streams.

5. Discussion

The meadow and bog/fen areas accounted for about 500 ha, equivalent to 20% of the total test area at the beginning of the 1800s (O1 map) (Figure 3). This area was reduced to approximately half in the second half of the 19th century when the HM maps were drawn for the three test areas. A study from southeast Denmark at Lolland shows a similar area distribution in 1809 (O1 map) with approximately 50% arable land, approximately 20% bog/fen, marsh, meadow, or common land, and approximately 30% forest. In the 1830s, when the HM maps were drawn for Lolland, the same distribution can be calculated at 75% cultivated land and 15% forest, while the bog/fen, marsh, and meadow areas are reduced to approximately 10% [40]. The land use distribution from Lolland and the three test areas of this study are strikingly similar.
From approximately 1810 onwards, the period is characterized by extensive drainage by ditching, as the incentive for individual farmers increases sharply with fundamental changes in land ownership. The significant increase in the cultivated area resulted in a large increase in cereal production. The period from 1830 to 1860 is determined by five decisive factors: (i) cultivation of hitherto unused lands; (ii) marling, which was considered one of the main factors; (iii) removal of flooding water; and, consequently, (iv) drying and plowing of meadow areas; and, finally, (v) a more careful and deeper plowing treatment of the field [40]. Two key factors explain the significant reduction in the wet meadow areas from the preparation of the O1 maps (the early 1800s) to the HM mapping period (the second half of the 1800s). Bog/fen areas did not show the same reduction, likely due to a lack of technology to lower the water table in the bog/fen areas. These are the introduction of the tile drains at approximately 1850 and the introduction of the Act of 1858, where it became legally possible to drain water across another man’s (neighbor’s) field. The total area of meadows and bog/fen did not change significantly between the second half of the 19th century and 1928–1945 (LM maps). However, there is a further reduction from 1928–1945 to 2000, corresponding to a total meadow and bog/fen area reduction of 65–90% compared to the beginning of the 19th century. The meadow areas have dominated significantly over the last 200 years, more than the bog/fen areas, and are thus correspondingly reduced the most. There are two test areas in Jutland where there has been a slight increase in the bog/fen area from the O1 maps to the HM maps. This can be explained by uncertainty in interpreting the O1 map’s legend, divided into many wet habitat mixtures. It should also be noted that meadow areas increase significantly between the mapping of HM and LM on North Funen. We also observe the same decreasing trend in the area of GWDTEs over time expressed as percent overlap with the current river valley bottom map (Figure 4A, Figure 5A and Figure 6). Another significant change in urban areas’ land use, which can explain the reduction in GWDTE habitat areas, is an evident increase in urban and sealed areas from less than 3% of the total land area in 1881 to 10% in the year 2000. This is primarily due to urbanization and infrastructure expansion [41].
Furthermore, we observe a decrease in the area of GWDTE from the 19th century to current times within different river orders for the large areas (Figure 4B and Figure 5B). We see a trend when the results are expressed as a percent change in the GWDTE area between the O1 and P3 mapping periods (Figure 7). The trend shows that rivers with low-order streams (1 and 2) lost their GWDTE at higher rates than higher-order stream rivers. This means that upstream river valleys are more prone to GWDTE loss. Additionally, the most loss is perceived as tile drainage resulting from agriculture and groundwater abstraction (Table 2). Therefore, care should be taken when upstream areas are utilized for these purposes.
The observed trend of decreased GWDTE area within different river orders and the higher rate of loss in rivers with low-order streams highlights the importance of considering the position and connectivity of GWDTEs in river systems. As the study has shown, upstream river valleys are more prone to GWDTE loss, which can have significant impacts on the structure and function of these ecosystems further downstream. Therefore, it is important to consider the impacts of land use and management practices in upstream areas on the health and viability of GWDTEs throughout the river network.
Lastly, the high rate of loss associated with tile drainage resulting from agriculture and groundwater abstraction underscores the importance of more sustainable land use practices that limit the impacts of these activities on GWDTEs. This may involve adopting more sustainable agricultural practices, such as reduced tillage and the use of cover crops, as well as measures to restore degraded ecosystems and reduce the demand for groundwater. Additionally, given the critical role of GWDTEs in supporting a range of ecosystem services, such as water supply, biodiversity, and carbon sequestration, it is important to consider the broader socio-economic and ecological implications of GWDTE loss in management and decision-making processes.

6. Conclusions

In conclusion, this study has uncovered a substantial decline in Denmark’s groundwater-dependent terrestrial ecosystems (GWDTE) over the past two centuries. The decrease has been attributed to human interventions, such as artificial drainage and groundwater abstraction. Additionally, the results suggest that upstream portions of the river network are more susceptible to GWDTE decline compared to downstream portions. Therefore, caution should be exercised in designing these areas for agricultural activities and artificial drainage as a measure of management. Instead, there is potential to restore the balance of GWDTE by establishing constructed wetlands or rewetting peatlands.
One limitation of the study is the reliance on historical maps for assessing changes in the extent of GWDTEs over time. Although historical maps are a valuable tool for understanding long-term trends, it can be helpful also to use a range of additional data sources and methods to further validate the results and provide a more comprehensive understanding of the changes in GWDTEs over time. For example, incorporating field-based surveys and remote sensing techniques can provide more detailed and accurate information on the extent and condition of GWDTEs, which can help to validate the results obtained from historical maps and provide a more complete picture of the changes in these ecosystems over time.

Author Contributions

G.L.S., M.H.G., B.V.I. and B.N. conceptualized the project. G.L.S. performed the analysis and wrote the first draft. G.L.S., M.H.G., B.V.I. and B.N. discussed the results. G.L.S., M.H.G., B.V.I., B.N. and M.B.G. reviewed and edited the paper. M.H.G., B.V.I. and B.N. supervised the project. All authors have read and agreed to the published version of the manuscript.

Funding

This work was funded by the Graduate School of Science and Technology, Aarhus University.

Data Availability Statement

Data are available and can be requested from the respective sources reported under the Data subsection of Materials and Methods.

Conflicts of Interest

The authors declare that they have no conflict of interest.

Appendix A

Figure A1. (A) Area overlap between GWDTE signatures derived from the O1 historical map and the current map of river valley bottom for Tåstrup. (B) The same area overlaps classified according to rivers of the same Strahler stream order.
Water 15 00946 g0a1
Figure A2. (A) Area overlap between GWDTE signatures derived from the P3 historical map and the current map of river valley bottom for Tåstrup. (B) The same area overlaps classified according to rivers of the same Strahler stream order.
Water 15 00946 g0a2
Figure A3. (A) Area overlap between GWDTE signatures derived from the O1 historical map and the current map of river valley bottom for North Funen. (B) The same area overlaps classified according to rivers of the same Strahler stream order.
Water 15 00946 g0a3
Figure A4. (A) Area overlap between GWDTE signatures derived from the P3 historical map and the current map of river valley bottom for North Funen. (B) The same area overlaps classified according to rivers of the same Strahler stream order.
Water 15 00946 g0a4

References

  1. Spiers, A. Review of International/Continental Wetland Resources; Environmental Research Institute of the Supervising Scientist: Jabiru, Australia, 1999; pp. 63–104. [Google Scholar]
  2. Verhoeven, J.T.A. Wetlands in Europe: Perspectives for restoration of a lost paradise. Ecol. Eng. 2014, 66, 6–9. [Google Scholar] [CrossRef]
  3. Breuning-Madsen, H. Drænrørets Indførelse og Betydning i et Landbrugs-og Miljømæssigt Perspektiv; The Royal Danish Academy of Sciences and Letters (Danish: Det Kongelige Danske Videnskabernes Selskab): Copenhagen, Denmark, 2010. [Google Scholar]
  4. Baird, I.R.C.; Burgin, S. Conservation of a groundwater-dependent mire-dwelling dragonfly: Implications of multiple threatening processes. J. Insect. Conserv. 2016, 20, 165–178. [Google Scholar] [CrossRef]
  5. Boulton, A.J. Chances and challenges in the conservation of groundwaters and their dependent ecosystems. Aquat. Conserv. 2005, 15, 319–323. [Google Scholar] [CrossRef]
  6. Box, J.B.; Leiper, I.; Nano, C.; Stokeld, D.; Jobson, P.; Tomlinson, A.; Cobban, D.; Bond, T.; Randall, D.; Box, P. Mapping terrestrial groundwater-dependent ecosystems in arid Australia using Landsat-8 time-series data and singular value decomposition. Remote Sens. Ecol. Con. 2022, 8, 464–476. [Google Scholar] [CrossRef]
  7. Regina, K.; Budiman, A.; Greve, M.H.; Grønlund, A.; Kasimir, Å.; Lehtonen, H.; Petersen, S.O.; Smith, P.; Wösten, H. GHG mitigation of agricultural peatlands requires coherent policies. Clim. Policy 2016, 16, 522–541. [Google Scholar] [CrossRef] [Green Version]
  8. Malson, K.; Rydin, H. The regeneration capabilities of bryophytes for rich fen restoration. Biol. Conserv. 2007, 135, 435–442. [Google Scholar] [CrossRef]
  9. Ilomets, M.; Truus, L.; Pajula, R.; Sepp, K. Species composition and structure of vascular plants and bryophytes on the water level gradient within a calcareous fen in North Estonia. Est. J. Ecol. 2010, 59, 19–38. [Google Scholar] [CrossRef] [Green Version]
  10. Johansen, O.M.; Andersen, D.K.; Ejrnaes, R.; Pedersen, M.L. Relations between vegetation and water level in groundwater dependent terrestrial ecosystems (GWDTEs). Limnologica 2018, 68, 130–141. [Google Scholar] [CrossRef] [Green Version]
  11. Johansen, O.M.; Pedersen, M.L.; Jensen, J.B. Effect of groundwater abstraction on fen ecosystems. J. Hydrol. 2011, 402, 357–366. [Google Scholar] [CrossRef]
  12. Johansen, O.M.; Jensen, J.B.; Pedersen, M.L. From groundwater abstraction to vegetative response in fen ecosystems. Hydrol. Process. 2014, 28, 2396–2410. [Google Scholar] [CrossRef]
  13. Klove, B.; Ala-Aho, P.; Bertrand, G.; Gurdak, J.J.; Kupfersberger, H.; Kvaerner, J.; Muotka, T.; Mykra, H.; Preda, E.; Rossi, P.; et al. Climate change impacts on groundwater and dependent ecosystems. J. Hydrol. 2014, 518, 250–266. [Google Scholar] [CrossRef]
  14. Naik, P.K.; Tambe, J.A.; Dehury, B.N.; Tiwari, A.N. Impact of urbanization on the groundwater regime in a fast growing city in central India. Environ. Monit. Assess 2008, 146, 339–373. [Google Scholar] [CrossRef] [PubMed]
  15. Sechu, G.L.; Nilsson, B.; Iversen, B.V.; Møller, A.B.; Greve, M.B.; Troldborg, L.; Greve, M.H. Mapping groundwater-surface water interactions on a national scale for the stream network in Denmark. J. Hydrol. Reg. Stud. 2022, 40, 101015. [Google Scholar] [CrossRef]
  16. Winter, T.; Harvey, J.; Franke, O.; Alley, W. Ground Water and Surface Water a Single Resource; U.S. Geological Survey Circular; U.S. Geological Survey: Menlo Park, CA, USA, 1998; Volume 1139. [Google Scholar]
  17. Dahl, M.; Nilsson, B.; Langhoff, J.H.; Refsgaard, J.C. Review of classification systems and new multi-scale typology of groundwater–surface water interaction. J. Hydrol. 2007, 344, 1–16. [Google Scholar] [CrossRef]
  18. Kløve, B.; Allan, A.; Bertrand, G.; Druzynska, E.; Ertürk, A.; Goldscheider, N.; Henry, S.; Karakaya, N.; Karjalainen, T.P.; Koundouri, P.; et al. Groundwater dependent ecosystems. Part II. Ecosystem services and management in Europe under risk of climate change and land use intensification. Environ. Sci. Policy 2011, 14, 782–793. [Google Scholar] [CrossRef] [Green Version]
  19. Mishra, V.; Asoka, A.; Vatta, K.; Lall, U. Groundwater Depletion and Associated CO2 Emissions in India. Earth’s Future 2018, 6, 1672–1681. [Google Scholar] [CrossRef]
  20. Wood, W.W.; Hyndman, D.W. Groundwater Depletion: A Significant Unreported Source of Atmospheric Carbon Dioxide. Earth’s Future 2017, 5, 1133–1135. [Google Scholar] [CrossRef]
  21. Beucher, A.; Adhikari, K.; Breuning-Madsen, H.; Greve, M.B.; Österholm, P.; Fröjdö, S.; Jensen, N.H.; Greve, M.H. Mapping potential acid sulfate soils in Denmark using legacy data and LiDAR-based derivatives. Geoderma 2017, 308, 363–372. [Google Scholar] [CrossRef]
  22. Greve, M.H.; Christensen, O.F.; Greve, M.B.; Kheir, R.B. Change in Peat Coverage in Danish Cultivated Soils during the Past 35 Years. Soil Sci. 2014, 179, 250–257. [Google Scholar] [CrossRef]
  23. Araujo, M.B.; Alagador, D.; Cabeza, M.; Nogues-Bravo, D.; Thuiller, W. Climate change threatens European conservation areas. Ecol. Lett. 2011, 14, 484–492. [Google Scholar] [CrossRef] [Green Version]
  24. Fredshavn, J.; Søgaard, B.; Nygaard, B.; Johansson, L.S.; Wiberg-Larsen, P.; Dahl, K.; Sveegaard, S.; Galatius, A.; Teilmann, J. Bevaringsstatus for Naturtyper Og Arter. Oversigt over Danmarks Artikel 17-Rapportering til Habitatdirektivet 2019; DCE—Danish Centre for Environment And Energy: Roskilde, Denmark, 2019. [Google Scholar]
  25. Emsens, W.-J.; van Diggelen, R.; Aggenbach, C.J.S.; Cajthaml, T.; Frouz, J.; Klimkowska, A.; Kotowski, W.; Kozub, L.; Liczner, Y.; Seeber, E.; et al. Recovery of fen peatland microbiomes and predicted functional profiles after rewetting. ISME J. 2020, 14, 1701–1712. [Google Scholar] [CrossRef] [PubMed]
  26. Maes, J.; Teller, A.; Erhard, M.; Conde, S.; Vallecillo Rodriguez, S.; Barredo Cano, J.I.; Paracchini, M.; Abdul Malak, D.; Trombetti, M.; Vigiak, O.; et al. Mapping and Assessment of Ecosystems and Their Services: An EU Ecosystem Assessment; Publications Office of the European Union: Luxembourg, 2020; ISBN 978-92-76-17833-0. [Google Scholar]
  27. Kvaerner, J.; Klove, B. Tracing sources of summer streamflow in boreal headwaters using isotopic signatures and water geochemical components. J. Hydrol. 2006, 331, 186–204. [Google Scholar] [CrossRef]
  28. Eamus, D.; Froend, R.; Loomes, R.; Hose, G.; Murray, B. A functional methodology for determining the groundwater regime needed to maintain the health of groundwater-dependent vegetation. Aust. J. Bot. 2006, 54, 97–114. [Google Scholar] [CrossRef] [Green Version]
  29. Sechu, G.L.; Nilsson, B.; Iversen, B.V.; Greve, M.B.; Børgesen, C.D.; Greve, M.H. A Stepwise GIS Approach for the Delineation of River Valley Bottom within Drainage Basins Using a Cost Distance Accumulation Analysis. Water 2021, 13, 827. [Google Scholar] [CrossRef]
  30. Nilsson, B.; Wiese, M.B.; Tougaard, L.; Tind, S.L.; Greve, M.H.; Greve, M.B. Våde naturtyper i det udrænede og drænede landskab. Vand Jord 2015, 22, 56–59. [Google Scholar]
  31. Statistics Denmark. Arealopgørelser. Available online: https://www.dst.dk/da/Statistik/emner/miljoe-og-energi/areal/arealopgoerelser (accessed on 28 February 2023).
  32. Hansen, J. Land Use and Landscape Development. Perspectives for Nature, Agriculture, Environment and Land Management; 1397-9884; DCA—Danish Centre for Food and Agriculture: Tjele, Denmark, 2004. [Google Scholar]
  33. Korsgaard, P. Kort Som Kilde: En Håndbog Om Historiske Kort Og Deres Anvendelse; Dansk Historisk Fællesråd Copenhagen: Copenhagen, Denmark, 2006. [Google Scholar]
  34. Olesen, S.E. Kortlægning af Potentielt Dræningsbehov på Landbrugsarealer Opdelt Efter Landskabselement, Geologi, Jordklasse, Geologisk Region Samt Høj/Lavbund; Aarhus Universitet, Det Jordbrugsvidenskabelige Fakultet: Tjele, Denmark, 2009. [Google Scholar]
  35. Mortensen, J. Drainage in Denmark Developments and prospects for the future. In Proceedings of the Symposium of the 25th International Course on Land Drainage: Twenty-Five Years of Drainage Experience, Wageningen, The Netherlands, 24–28 November 1986; pp. 24–28. [Google Scholar]
  36. Jorgensen, L.F.; Villholth, K.G.; Refsgaard, J.C. Groundwater management and protection in Denmark: A review of pre-conditions, advances and challenges. Int. J. Water Resour. D 2017, 33, 868–889. [Google Scholar] [CrossRef]
  37. Hansen, K. People and Tales of the Lost Land; Narayana Press: Odder, Denmark, 2014. [Google Scholar]
  38. Desktop ESRI ArcGIS. ArcGIS Pro; Environmental Systems Research Institute: Redlands, CA, USA, 2019. [Google Scholar]
  39. Strahler, A.N. Quantitative analysis of watershed geomorphology. Eos Trans. Am. Geophys. Union 1957, 38, 913–920. [Google Scholar] [CrossRef] [Green Version]
  40. Bjørn, C. 1810-60 i Claus Bjørn Med Flere (Red). Det Danske Landbrugs Historie III; Landbohistorisk Selskab: København, Denmark, 1988; pp. 7–192. [Google Scholar]
  41. Levin, G.; Normander, B. Arealanvendelse i Danmark Siden Slutningen af 1800-Tallet; Aarhus Universitet: Roskilde, Denmark, 2008; p. 46. [Google Scholar]
Figure 1. The three study areas located in Denmark: (a) Bjerringbro/Hvorslev, (b) Tåstrup, and (c) North Funen, designated as large areas. We also present the 5 × 5 km2 test areas (red squares) within their respective large areas.
Water 15 00946 g001
Figure 2. Demonstration of the methodology using the Bjerringbro/Hvorslev area, showing (a) the extent of the river valley bottom and the GWDTE and (b) extraction of the overlap between the two.
Water 15 00946 g002
Figure 3. Historical development of the two habitat types, meadow, and bog/fen, from the beginning of the 19th century to today within the three 5 × 5 km2 test areas.Timeline: O1 (1791–1815), HM (1875 ± 10–20 yrs), LM (1935 ± 10–20 yrs), P3 (2015).
Water 15 00946 g003
Figure 4. (A) Area overlap between GWDTE signatures derived from the O1 historical map and the current map of river valley bottom for Bjerringbro/Hvorslev. (B) The same area overlaps classified according to rivers of the same Strahler stream order.
Water 15 00946 g004
Figure 5. (A) Area overlap between GWDTE signatures derived from the P3 historical map and the current map of river valley bottom for Bjerringbro/Hvorslev. (B) The same area overlaps classified according to rivers of the same Strahler stream order.
Water 15 00946 g005
Figure 6. Historical changes of GWDTE areas expressed as percent overlap with the river valley bottom map, from the beginning of the 19th century to date within the 5 × 5 km2 test areas.
Water 15 00946 g006
Figure 7. Percent change in the area of GWDTE moving from the 19th century (O1 map) to the present day, classified according to the Strahler stream order associated with the rivers within those areas. Results are from the large areas.
Water 15 00946 g007
Table 1. Land use for the study area denoting the percentage coverage within the large and test areas.
Bjerringbro/Hvorslev (%)Tåstrup (%)North Funen (%)
LargeTestLargeTestLargeTest
Water201114
Forest2115121896
Grassland415522
Agriculture678165677784
Urban Area63179114
Table 2. Different human interventions that have led to the dewatering of the low-lying areas in Denmark [30].
O1HMLMP3
Drainage by ditching++++++
Tile drainage-+++++++++
Groundwater abstraction-+++++
Urbanization---+
Key: - no impact; + possible minor impact; ++ some impact; +++ large impact
Table 3. A summary of the historical topographical maps we use in this study and their availability.
Map NameMapping Year(s)Availability in
the Test Area
Availability in
the Large Area
Original 1 (O1)Bjerringbro/Hvorslev: 1815
Tåstrup: 1791–1793
North Funen: 1805
VectorizedVectorized
Høje målbordsblade (HM)1875 ± 10–20 yrsVectorizedNot vectorized
Lave målbordsblade (LM)1935 ± 10–20 yrsVectorizedNot vectorized
Paragraf 3 (P3)2015VectorizedVectorized
Disclaimer/Publisher’s Note: The statements, opinions and data contained in all publications are solely those of the individual author(s) and contributor(s) and not of MDPI and/or the editor(s). MDPI and/or the editor(s) disclaim responsibility for any injury to people or property resulting from any ideas, methods, instructions or products referred to in the content.

