
Design of a Spherical Ga2O3/ZnO Composite with a Snakeberry-like Structure for Methyl Orange Degradation
1
School of Materials Science and Engineering, Liaoning Technical University, 47 Zhonghua Road, Fuxin 123000, China
2
Key Laboratory of Mineral High Value Conversion and Energy Storage Materials of Liaoning Province, Fuxin 123000, China
*
Author to whom correspondence should be addressed.
Water 2023, 15(5), 952; https://doi.org/10.3390/w15050952
Submission received: 21 December 2022
/
Revised: 6 February 2023
/
Accepted: 27 February 2023
/
Published: 1 March 2023
(This article belongs to the Section Wastewater Treatment and Reuse)
Abstract
:This study aims to explore a preparation method based on a combination of melting and ultrasound to produce a Ga2O3/ZnO (GZ) spherical composite with a snake raspberry structure for the degradation of methyl orange at room temperature in dark. The catalyst exists in the form of a (GZ) composite and an anhydrous ethanol mixture after the ultrasonic treatment of premelted GaZn liquid metal alloy in anhydrous ethanol. The degradation activity of the catalyst was evaluated according to the amount of catalyst, alloy extraction temperature, acid–base environment, and inorganic salt ions. A transmission electron microscope (TEM) was used to confirm that the material was Ga2O3 coated with ZnO, with a structure similar to that of snakeberry. The electron paramagnetic resonance (EPR) and a series of free radical inhibition experiments demonstrated that ·O2− is produced during the ultrasonic preparation of the catalyst and plays an important role in the degradation process after adding MO. The removal rate of MO reached 99.75% at 3 min. Three possible degradation pathways were proposed based on the intermediates produced during the degradation process, which were identified by liquid chromatography–mass spectrometry (LC–MS). The results of this study may provide a new choice for the degradation of organic pollutants.

1. Introduction
With rapid economic development, the continuous discharge of industrial dye wastewater has caused ecological and environmental destruction; thus, it is important to degrade organic pollutants [1,2,3,4,5,6,7,8]. In addition to their excellent degradation effect and high degradation efficiency with pollutants [9], Zn and ZnO are also nontoxic and inexpensive [10]. Therefore, approximately 70–80% of the reported studies in the field of catalytic degradation have used ZnO mixed with other metal oxides as photocatalysts for wastewater treatment [4].
Researchers are very interested in using ZnGa2O4 for the photocatalytic degradation of dyes. ZnGa2O4 is a kind of spinel ternary metal oxide with a wide bandgap [11]. Therefore, it has a high conduction band level, which is conducive to the production of hydroxyl radicals or superoxide anions for photodegradation, which makes it widely studied in the field of photocatalysis [12,13,14]. It is found that ZnGa2O4 can photodecompose many kinds of dyes such as methyl blue (MB) and methyl orange (MO). In order to improve the photocatalytic performance of ZnGa2O4, the synthesis method is mostly used to change the morphology. For example, Liu et al. prepared ZnGa2O4 powders and thin films by the sol–gel method and studied their photocatalytic degradation of MB [15]. Liu et al. prepared ZnGa2O4 powder by hydrothermal reaction. The photocatalytic oxidation of RhB on the material was studied [16]. To improve the photocatalytic activity of ZnGa2O4, Liu et al. prepared octahedral single crystals using the chemical vapor transport method [17]. Yuan et al. prepared uniform nanoparticles using microwave hydrothermal reactions and degraded the dye [18]. However, the common methods for the catalysts containing Zn include hydrothermal synthesis [19,20,21] and sintering [22], which have several shortcomings, such as complicated operation, poor safety, and high energy consumption. However, at present, there are many studies on the salts of ZnGa2O4, but there are few studies on the composites composed of the two elements Ga and Zn. Recently, Oloye et al. used a Ga-based liquid metal aided by ultrasonic waves to rapidly degrade dyes into nontoxic solid carbon particles [23], indicating that Ga has considerable potential for dye degradation. Gao et al. utilized the classic GRR to conveniently synthesize uniform Ga nanodroplets, achieved by the convenient redox replacement between sacrificial seeds (zinc) and gallium ions (Ga3+). It has also been found that the material can degrade dyes. Therefore, it is of great significance to explore a simple synthesis method of composites containing Ga and Zn and to study their performance in the degradation of organic pollutants [24].
In this study, spherical nanocomposite Ga2O3/ZnO was prepared by melting and ultrasonic treatment. First, the GaZn alloy was prepared by melting with gold, and then the Ga2O3/ZnO composite was prepared by ultrasonic dispersion treatment using anhydrous ethanol as the dispersant. Second, the catalytic activity was evaluated by investigating the degradation efficiency of the catalyst using MO at 27 °C in the dark. Third, the degradation mechanism of MO and the path of methyl orange solution degradation by catalyst were proposed.
2. Experiment
2.1. Synthesis Method
The synthesis process of the composites is illustrated in Figure 1. A quartz crucible with measured quantities of metallic Ga and Zn was placed in a tube furnace and maintained at 450 °C for 30 min under an argon and hydrogen atmosphere. The obtained GaZn alloy was stored in a centrifuge tube for subsequent use. After storing the GaZn alloy at 80 °C for 30 min, an appropriate amount of the alloy was measured and placed in a beaker, followed by mixing with anhydrous ethanol (20 mL). Subsequently, the mixture was sonicated for 1 h to yield the metal catalyst composite Ga2O3/ZnO (GZ) [25,26].
2.2. Degradation Experiment
Before the degradation experiment, both the MO and synthesized GZ catalyst solutions were kept warm in a water bath for 1 h to ensure that all the experiments were performed at 27 °C. Before use, the GZ metal catalyst solution was sonicated to obtain a uniform black state at a water temperature of 27 °C. The degradation of MO took place in an aqueous solution in dark conditions. In all experiments, 3 mL of catalyst was added to 50 mL of MO solution, and 3 mL equal samples were taken every 1 min and centrifuged to remove the particles. The absorbance of the filtrate was recorded on an ultraviolet spectrophotometer and the absorbance of MO was recorded at λ = 462 nm. Finally, the filtrate was analyzed. According to the relationship between the absorbance and concentration, the concentration of MO was calculated according to the Beer–Lambert Law, and the removal rate (RR) was calculated as follows:
where C0 is the initial concentration of MO/PNP in water in mg/L, and Ct is the mass concentration of MO/PNP in water when the reaction time is t (min) in mg/L.
RR = (C0 − Ct)/C0 × 100%
2.3. Characterization of Microstructure
The phase composition and crystal structure of the samples were analyzed using X-ray diffraction (XRD; D/Max–2400). The surface morphology and grain size of the samples were characterized by thermal field-emission scanning electron microscopy (FESEM; JSM–3500). The surface morphology, grain size, internal structure, and elemental distribution of the samples were characterized using transmission electron microscopy (TEM; SmartLab–SE). Using UV–vis spectrophotometry (T6 New century, UV–2450), the intrinsic absorption spectrum and unique absorption wavelengths of the samples were qualitatively analyzed, and the absorbance values at the maximum absorption peaks were quantitatively analyzed. The degradation intermediates were analyzed by LC–MS (1290 UHPLC and 6550 Q–TOF, Agilent, Beijing, China) to evaluate the degradation process. The detection conditions were as follows: mobile phase A, 10 mmol ammonium acetate–1% acetic acid aqueous solution; mobile phase B, acetonitrile solution; flow rate, 0.3 mL/min, injection volume, 5 μL; column, Waters BEH C18 2.1 × 50 mm × 1.7 μm; scanning range of the mass spectrum, first-level 50–2000 m/z; sheath gas temperature, 350 °C; sheath gas flow rate, 12 L/min; ESI+ mode with a voltage of 4000 V. The elemental binding energies were analyzed using XPS (Axis Ultra DLD, KRATOS). The change in the total organic carbon (TOC) content before and after MO degradation was analyzed using the nonpurgeable organic carbon (NPOC) method using a total organic carbon analyzer (ShimaduTOC–L). The specific surface area and pore structure of GZ were analyzed by nitrogen isothermal adsorption and desorption using a multistation expanded pore diameter analyzer and pore diameter tester (ASAP 2460, Micro Active, Rajkot, India).
3. Results and Discussion
3.1. XRD
From the XRD spectra of the Ga2O3/ZnO samples shown in Figure 2a–d, the detected diffraction peaks in 30–40°, 43–43.4°, and 76.5–77.4° were in the shape of humps, which are similar to those of amorphous Ga2O3 reported by Cui et al. [27]. Therefore, the Ga-based liquid metal composite Ga2O3/ZnO synthesized in this study is considered amorphous. The reason why there is a crystal diffraction peak above the steamed bread peak may be related to the respective oxide films formed on the surface of Zn and Ga and also because the liquid metal Ga is amorphous. After melting and ultrasonic treatment, Zn and Ga form a multiphase liquid metal that appears to be a liquid phase but actually contains a solid core of a nanometer–micron size [28]. As shown in Figure 2a, two diffraction peaks were observed at 36.243° and 76.934°, which were attributed to the (−110) and (−220) crystal planes of Ga2O3, respectively, based on the standard diffraction peak card for Ga2O3 (PDF#85–0988). According to the standard diffraction peak card for ZnO (PDF#79–0206), the two peaks observed at 36.252° and 76.956° were indexed to the (101) and (202) crystal planes of ZnO, respectively. The (101) and (202) crystal planes of ZnO, corresponding to the two peaks at 36.181° and 76.784°, respectively, are consistent with the standard diffraction peak card for ZnO (PDF#79–0207). Based on the standard diffraction peak card for Zn (PDF#87–0713), the peaks at 36.289°, 43.22°, and 77.046° were assigned to the (002), (101), and (004) crystal planes of Zn, respectively. The four peaks observed at 43.186°, 36.138°, 77.329°, and 76.680° were attributed to the (510), (112), (840), and (224) crystal planes of Ga (PDF#71–0549), respectively. After the smelting and ultrasonic dispersion of the GaZn alloy, strong diffraction peaks of Ga2O3, ZnO, Zn, and Ga were observed. From the above results, the prepared catalyst was found to be a liquid metal Ga surface coated by Ga2O3, while Zn is attached to the Ga2O3 surface in the state of ZnO, which further confirmed the formation of the Ga2O3/ZnO composite.
The XRD peaks for the sample after use, as shown in Figure 2e, are consistent with those of Ga2O3 (PDF#74–1610) and ZnO (PDF#79–0206). Compared with the diffraction peak of the catalyst before degradation, the position of the diffraction peak does not change, which indicates that there is no phase transition in the catalyst composite. According to the Scherrer formula, the intensity of the diffraction peak of the used catalyst becomes weaker and the diffraction peak becomes wider, which indicates that the crystal size of the catalyst is reduced; the diffraction peaks shown in Figure 2f are consistent with those of ZnGa2O4 (PDF#86–0413). Based on these results, the composition of the catalyst before and after use was essentially the same, except that the ZnGa2O4 phase was formed on the catalyst surface. The results show that the material structure of the catalyst is stable after use.
3.2. SEM and TEM
The morphology of the GZ composite was characterized by SEM. The composite had a nanosphere structure (Figure 3a,b), which is well-dispersed and regular in shape. This is because Ga can form a spherical structure after ultrasonic treatment with anhydrous ethanol as the dispersant. Zhang et al. prepared submicron liquid metal microspheres by the ultrasonic mixing and dispersion of liquid metal Ga, In, and Sn. The energy dispersive X-ray spectroscopy (EDS) results shown in Figure 3c,d indicate that the dispersion of Ga and Zn in the composite was relatively uniform. Visio software was used to analyze the particle sizes of the samples based on the SEM images. The average particle size of the GZ nanoparticles was approximately 640.36 nm. Notably, a few particles with larger particle sizes were not included in the average particle size calculation. The particle size distribution of the nanospheres was similar to that of the droplets in the emulsion state of the oil/water phase, which indicates that the dispersion of the GZ composite in anhydrous ethanol satisfies the dispersion law for two incompatible solutions. After dispersion, the particle size of the material decreased, whereas the specific surface area increased, which is more beneficial for the degradation reaction [4].
TEM was conducted to further evaluate the structure and composition of the GZ composite metal catalyst. TEM images (Figure 4a,b) show that the GZ composite has a coated sphere structure in which the outer layer of Ga is encapsulated by a Ga2O3 layer with a large amount of ZnO adhered to it. Based on the EDS elemental mapping results shown in Figure 4c–e, the distributions of Zn, Ga, and O are consistent with the overall GZ structure. The relative contents of Ga and Zn were 96% and 4%, respectively, which are consistent with the initial metal composition, further indicating the successful synthesis of the GZ composite material. The structural distribution of the material was also confirmed as a coating state by scanning transmission electron microscopy (STEM) in a more 3D and direct manner (Figure 4f).
3.3. XPS
The element composition and chemical state of Ga2O3/ZnO composites were further characterized by X-ray photoelectron spectroscopy (XPS). The X-ray photoelectron spectra of Ga2O3/ZnO samples are shown in Figure 5a–f. Based on the XPS full spectrum of the GZ composite (Figure 5a), the diffraction peaks of XPS confirm the existence of each element in the Ga2O3/ZnO nanospheres composites. The high-resolution XPS spectra of Zn2p, Ga3d, N1s, C1s, and O1s are shown in Figure 5b–f. Two characteristic peaks were observed at binding energies of 1021.78 and 1044.75 eV in the high-resolution XPS spectrum of Zn2p (Figure 5b), which correspond to the characteristic peaks of Zn2p3/2 and Zn2p1/2, respectively. The energy gap between the two peaks was 22.97 eV, which indicates that Zn exists as ZnO with a +2 oxidation state [29,30]. The high-resolution XPS spectrum of Ga3d exhibited a characteristic peak at 20.4 eV (Figure 5c), demonstrating the existence of Ga–O bonds in the GZ composite, which indicates the Ga3+ oxidation state of Ga2O3 [31,32]. Furthermore, another characteristic peak was observed at 18.7 eV, which was assigned to zero-valent pure metallic Ga. The broad and weak hump at 23.35 eV was caused by the O2s state [33]. The asymmetric satellite peak at 19.45 eV was indexed to the hybridization of the Ga3d and O2s states near the valence band (VB) [29,34]. From the results of the XPS spectra, it can be seen that both Zn and Ga exist in oxidized states. However, In the GZ composite, the characteristic peaks of zero-valent Ga and iron oxide were observed simultaneously, and the peak of the latter was stronger than that of the former, which is attributed to the violent oxidation of the composite during synthesis [30]. Figure 5d shows the high-resolution XPS spectrum of N1s in which a characteristic peak was observed at the binding energy of 397.5 eV, which is related to nitrides in the air. Figure 5e shows the high-resolution XPS spectrum of C1s. The characteristic peaks of 287.1 eV, 288.6 eV, 286.8 eV, and 284.8 eV may correspond to carbon-containing oxides, including C–OH, C=O [35] O–C=O, C–O–C, and Cmurc bonds. Furthermore, the binding energies of these bonds matched those of the chemical bonds in ethanol, indicating that ethanol did not react with the GaZn alloy, only functioning as a dispersing agent during the synthesis process. Figure 5f shows the high-resolution XPS spectrum of O1s. The O1s peak at a binding energy of 531.3 eV was in a symmetric state and was attributed to the O–Ga bond [29]. These XPS results further confirmed the successful synthesis of the GZ composite.
3.4. Brunauer–Emmett–Teller (BET)
To compare the structural changes in the GaZn alloy and Ga after ultrasonic dispersion in anhydrous ethanol, the N2 adsorption–desorption isotherm and Barrett–Joyner–Halenda (BJH) model were used to evaluate the specific surface areas and pore size distributions of the materials. The N2 adsorption–desorption isotherm of the GZ composite shown in Figure 6a exhibited a hysteresis loop at 0–1.0 P/P0, and the adsorption curve was higher than the desorption curve; thus, a completely closed curve was formed. The presence of mesoporous structures in the GZ composite was confirmed by the type of curves, which were not completely reversible [36]. These results were consistent with those of the pore size distributions obtained using the BJH model (Figure 6b). Table 1 shows that after ultrasonic dispersion in anhydrous ethanol, the specific surface area of Ga is 0.462 m2g−1 and the pore volume is 0.002 cm3g−1, while the specific surface area of liquid GaZn alloy is 0.868 m2g−1 and the pore volume is 0.003 mL/g, and its pore diameter is reduced from the original 30.987 nm to 29.197 nm. The specific surface area of liquid GaZn alloy after ultrasonic dispersion in anhydrous ethanol is nearly twice as large as that of Ga, which is due to the loading of a small amount of ZnO nanospheres on Ga2O3 microspheres. This is consistent with the structure of the GZ composite observed by TEM. The increase in the specific surface area of GZ is conducive to the adsorption of organic pollutants onto the catalyst surface, which may improve the degradation performance of the composite material [36].
4. Catalytic Performance of the Ga–Based Liquid Metal
4.1. Degradation Performance
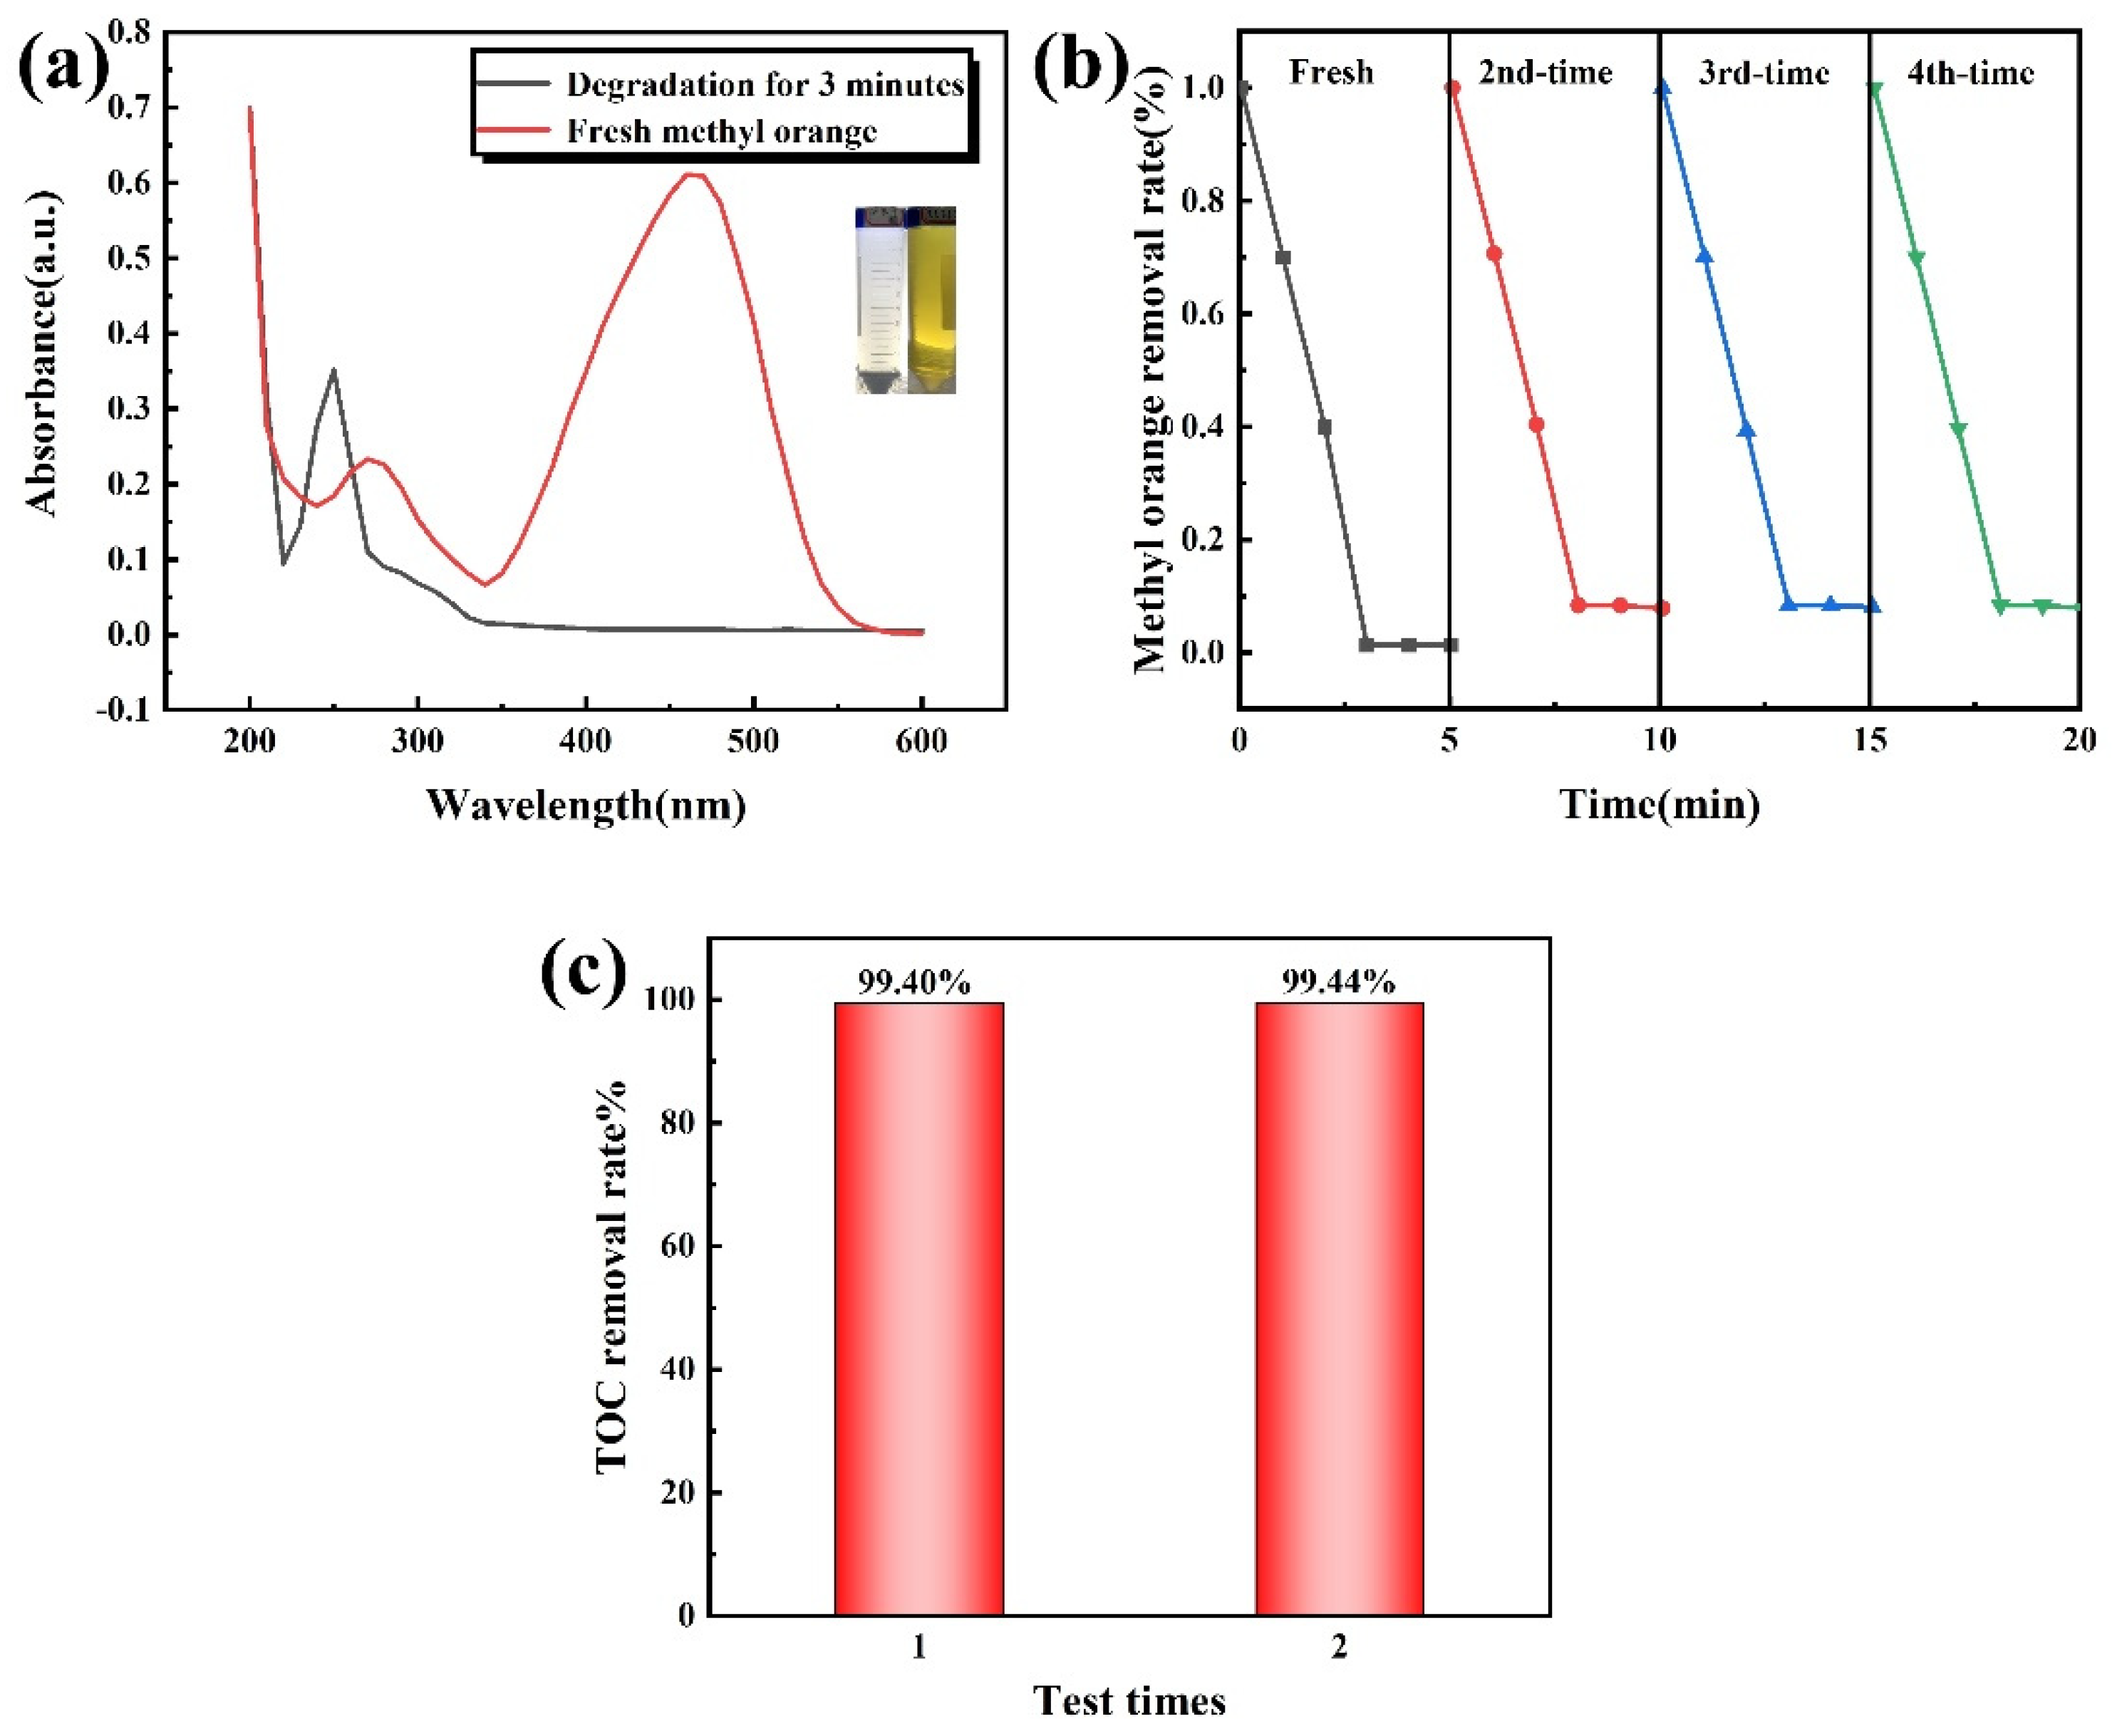
To evaluate the degradation performance of the GZ composite material, the methyl orange solution with a dye concentration of 10 mgL−1 was used as the target pollutant. The degradation condition includes the addition of 3 mL of catalyst and the dye concentration is detected regularly under dark conditions at 27 °C. The characteristic absorption peak of MO appears at 462 nm, as shown in Figure 7a. The change in peak intensity reflects the change in MO concentration. The disappearance of peak intensity indicates that the MO dye had completely degraded. Before degradation, two characteristic peaks of MO were observed at 274 and 462 nm, which were attributed to the chromophoric benzene ring and azo bond (N=N), respectively. Based on the absorbance changes of the two peaks before and after MO degradation, the degradation rates were 47.21% and 99.75%, respectively. Furthermore, the characteristic peak in the UV–vis spectrum after degradation at 248 nm was attributed to benzene sulfonic acid [37]. The Ga2O3/ZnO composite prepared in this paper can improve the removal efficiency of MO in 3min under dark conditions by 3.3 times compared with the removal efficiency of ZnGa2O4 prepared by Nathiya et al. on MO in 100 min under UV light. [38]. After the ultrasonic dispersion of GaZn liquid alloy in anhydrous ethanol, a large number of ZnO coated Ga2O3 nanocomposites were formed, which greatly increased the specific surface area of GaZn liquid alloy. A large number of electrons, holes, and active free radicals are produced on the surface of GZ composites during the ultrasound, which is the main reason for the degradation of the methyl orange solution. Under the test conditions of 27 °C, dark, and without a catalyst, the methyl orange solution did not degrade. Compared to the GZ catalyst performance, the degradation efficiency of the commercial photocatalyst P25 and the original ZnGa2O4 [16] photocatalyst is lower than that of the GZ catalyst. During the ultrasonic treatment of Ga2O3/ZnO composites in anhydrous ethanol, electrons move from the low-energy valence band to the high-energy conduction band, and carriers such as electrons and holes show reduction and oxidation properties in the conduction band and valence band, respectively, which is described in detail later, as part of the degradation mechanism.
To evaluate the reusability of Ga2O3/ZnO composites after ultrasonic treatment in anhydrous ethanol, the old catalyst treated using the ultrasonic wave was subsequently used to degrade MO four times. The experimental results are shown in Figure 7b. It is obvious that the degradation efficiency of MO decreases with increasing numbers of cycles; however, as can be seen from Figure 7b, the degradation efficiency of the catalyst for the degradation of MO remains above 90% when used for the fourth time. The changes in element content before and after catalyst degradation were analyzed by EDS using a scanning electron microscope: (Zn:Ga changed from 3.5:96.5 to 3.19:96.81). The results show that the element content of Zn decreases during the degradation process, and the experimental data are shown in Table 2. In addition, the results of the XRD analysis of the degraded catalyst are shown in Figure 2e. Compared with Figure 2a, the diffraction peak position of the material has not changed, indicating that the material structure of the composite has not changed. However, the amorphous bread peak disappears into a wide diffraction peak, which indicates that crystallization occurs on the surface of the catalyst and the particle size is smaller after degradation. The results show that the decrease in Zn content in the catalyst and the crystallization changes may be the main reasons for the deactivation of the catalyst. In addition, the adsorption of the intermediates formed in the degradation process may cover the active sites of the catalyst, which may reduce the performance of the catalyst to a certain extent [39]. The degradation effect of the recycled catalyst after repeated cleaning was effective for up to four reuse cycles, indicating that the GZ metal catalyst exhibited excellent cyclic degradation performance.
The TOC test results for the MO solutions before and after degradation are shown in Figure 7c. The TOC contents of MO measured twice before degradation were 36,796 and 36,895, respectively, whereas the values decreased to 219.3 and 208, respectively, after MO degradation for 3 min. Therefore, the TOC removal rates were as high as 99.40% and 99.44%, respectively, achieving an average removal rate of 99.42%. Furthermore, the mineralization of organic matter may occur in the process of degradation of MO, which leads to the complete oxidation of organic molecules to H2O, CO2, and inorganic salt ions, such as SO42−, NO3−, and so on. The rapid decrease in the TOC value of methyl orange solution indicates that the methyl orange molecules in this process have been completely degraded [40]. Therefore, it is concluded that MO removal by this catalyst involves the degradation of MO.
4.2. Influencing Factors
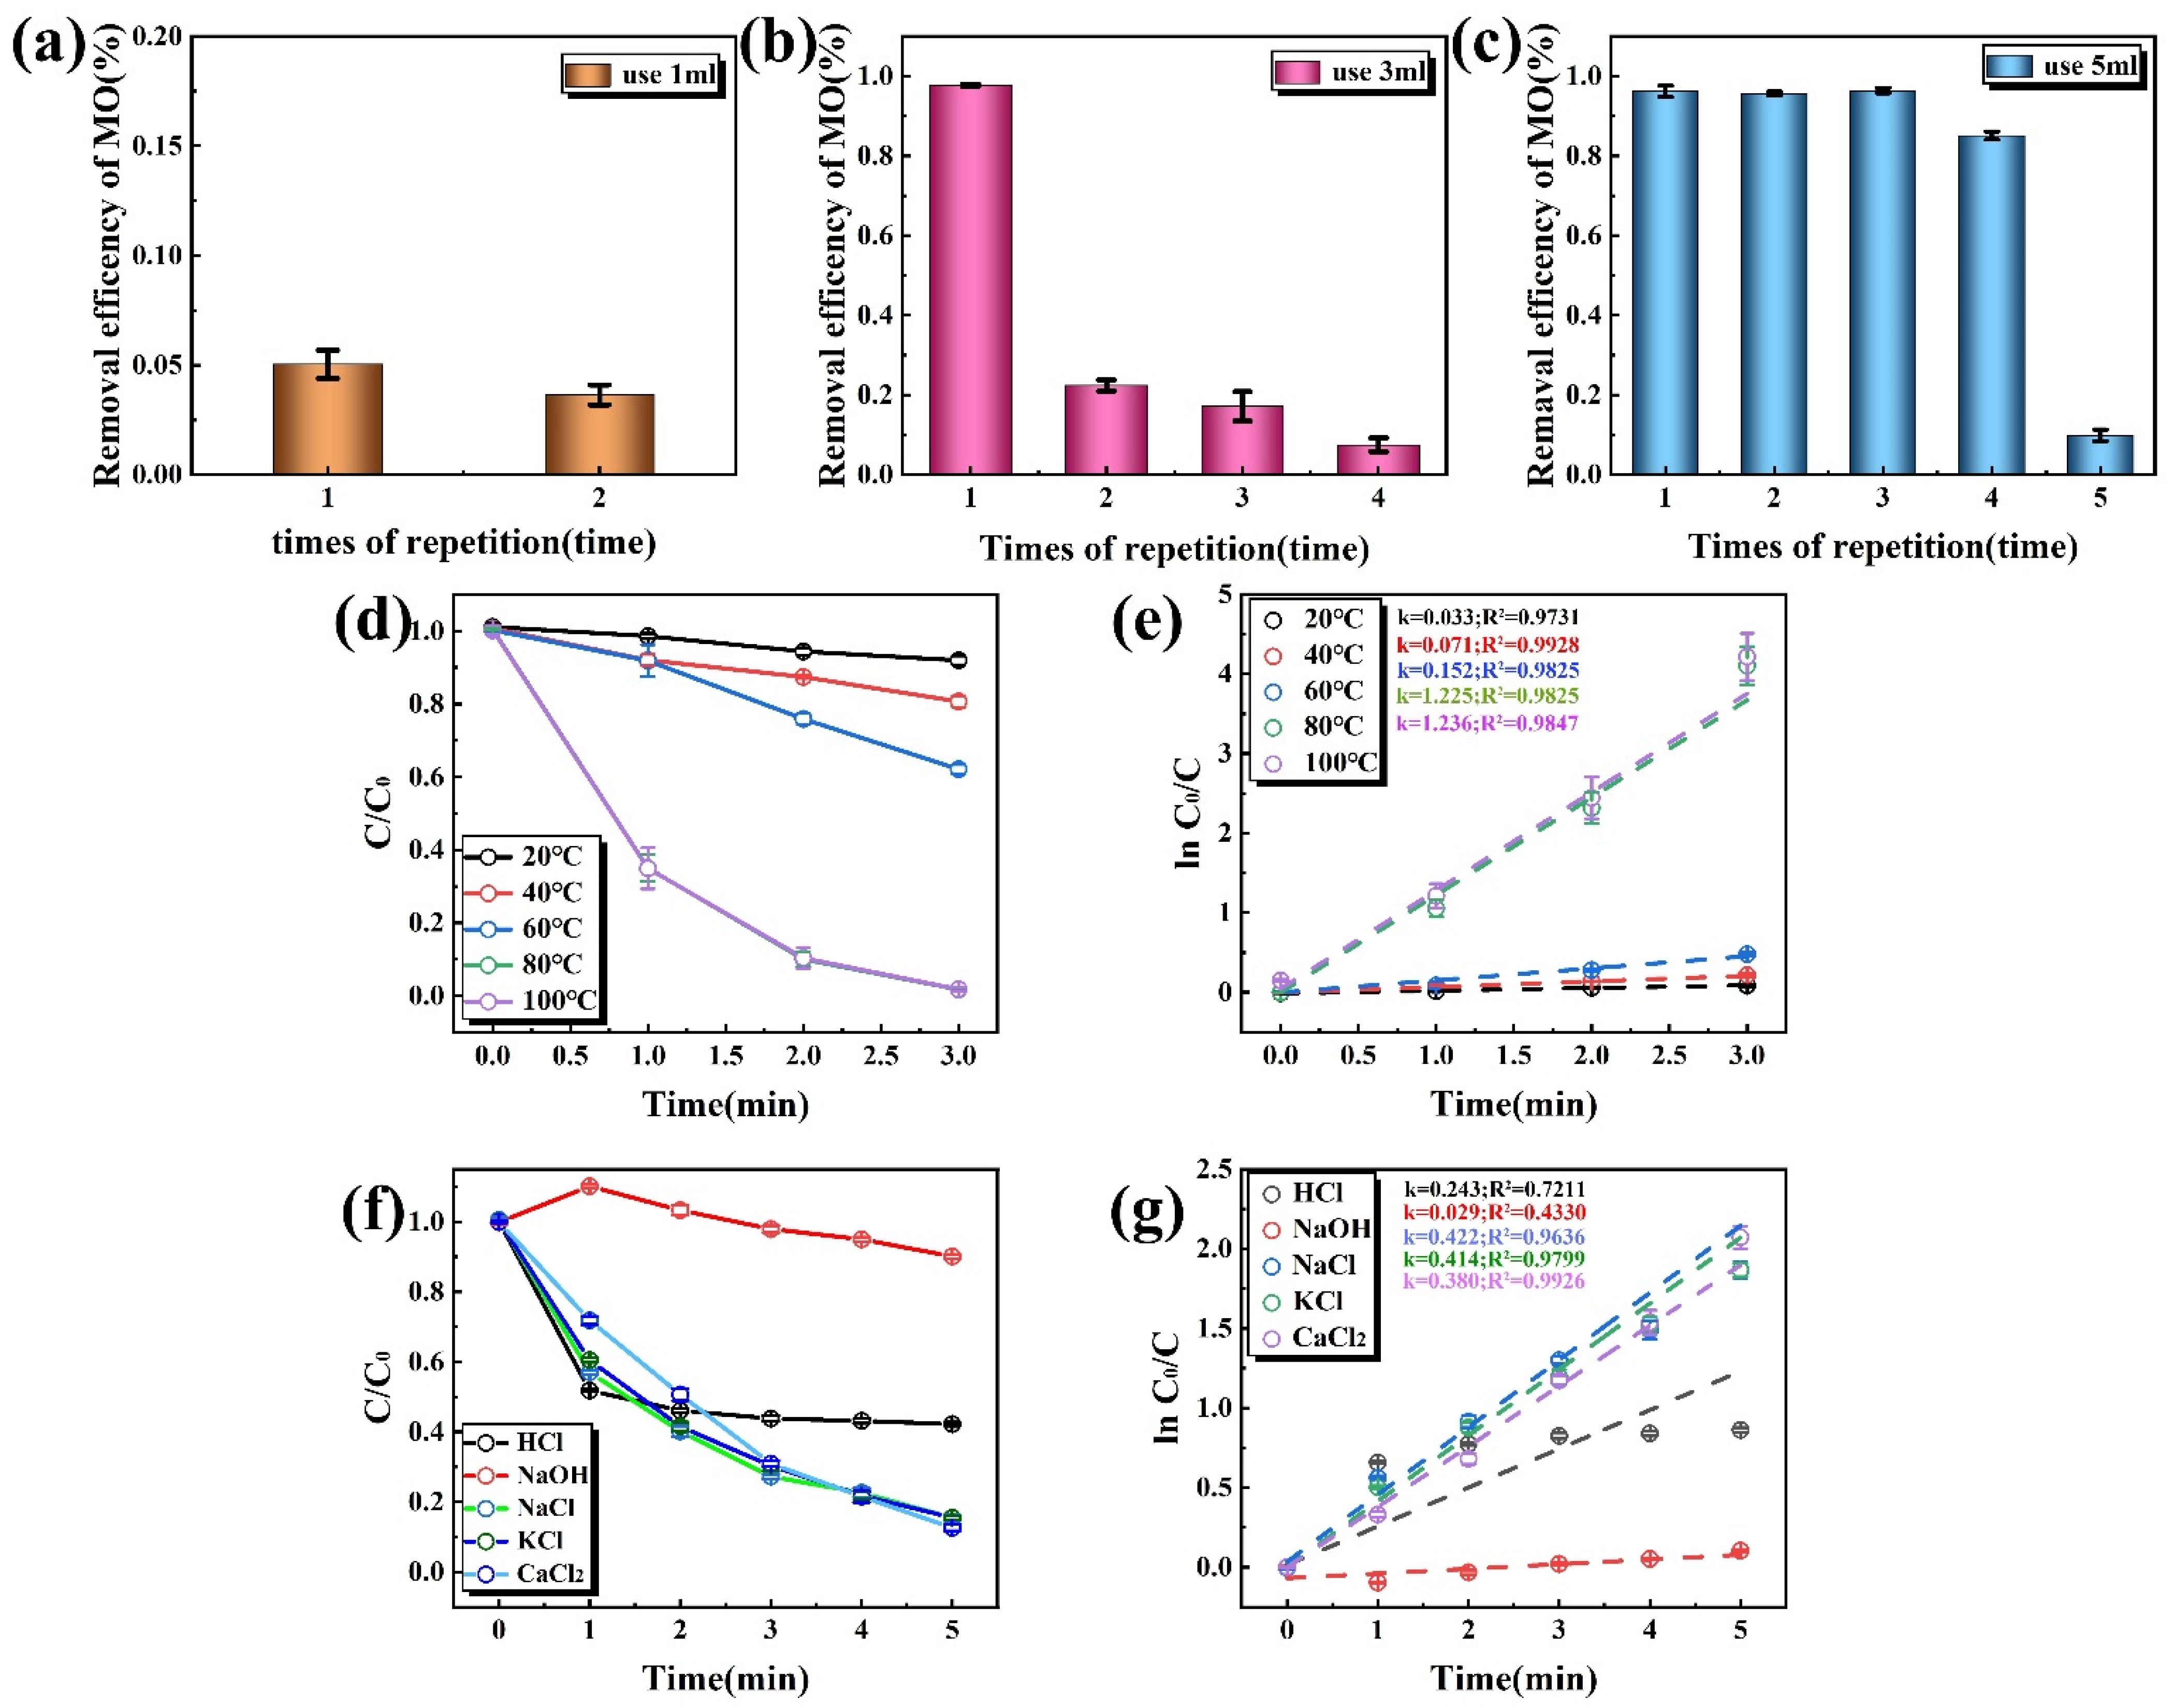
The effect of metal catalyst dosage on MO degradation was investigated by adding 1, 3, and 5 mL of the catalyst solution to the MO solution and monitoring the degradation process. After extracting the supernatant for each degradation experiment, the catalyst in the centrifuge tube was reused to degrade the same amount of MO dye. UV absorbance was measured at fixed wavelengths to calculate the degradation efficiency. The repeated degradation times of MO dye using catalysts with different dosages were recorded. The above experiments were repeated three times, and the results are shown in Figure 8a–c [5]. The results of the MO removal efficiencies refer to MO degradation after 3 min. When the catalyst dosage was 1 mL, the removal rates of MO were 5.63% and 3.20%, as shown in Figure 8a. When the catalyst dosage was 3 mL, the removal rates for the first four cycles were 97.73%, 23.04%, 17.74%, and 6.13%, respectively (Figure 8b). When the catalyst dosage was 5 mL, the first four MO removal rates were 94.7%, 96.22%, 95.71%, 84.10%, and 10.67%, respectively (Figure 8c). The results obtained show that the increasing amounts of catalyst were able to degrade higher amounts of MO in the solution. This can be explained by the increasing number of active free radicals from the increasing amounts of catalyst used in the degradation of MO [41]. Based on the results of this study, the optimal catalyst dosage used in this experiment was found to be 3 mL.
Additionally, to improve the degradation effect, the extraction process of GZ alloy was optimized. Increasing the temperature of extracting liquid GaZn alloy can accelerate the diffusion efficiency of atoms in the alloy, increasing the uniformity of the alloy composition [42]. The GZ alloy was extracted at different temperatures of 20, 40, 60, 80, and 100 °C to evaluate the effect of temperature on the MO degradation efficiency. It can be seen from Figure 8d that the degradation efficiency of the catalyst increases with increasing extraction temperature. Based on the first-order kinetic equation ln (C0/C) = kt, the slope k reflects the degradation rate constants of different extraction temperatures [43,44]. A large k value indicates a high catalytic activity of the catalyst. The curve fitting of ln (C0/C) and time (t) is shown in Figure 8f, and corresponding fitting results are shown in Figure 8d. The descending order of the degradation rate constant (k) is 100 °C > 80 °C > 60 °C > 40 °C > 20 °C. When the temperature of alloy extraction is 80 °C, the maximum k value of the catalyst is 1.225 min−1, indicating the maximum degradation activity for MO. Therefore, 80 °C was selected as the extraction temperature for subsequent experiments.
Subsequently, the effect of common inorganic salt ions in water on the degradation performance was investigated. The relationship between C/C0 and time was given in Figure 8f. The addition of 1 mL of 1 mol/L KCl, CaCl2, and NaCl solution inhibited the degradation of MO to some extent. The curve fitting result from the first-order kinetic equation is shown in Figure 8g. Figure 8g shows that the degradation rate constants (k) in descending order are CaCl2 > KCl > NaCl. The main reason for the decrease in MO degradation activity may be that KCl, CaCl2, and NaCl solutions have good electrical conductivity and increase the recombination efficiency of electrons and holes in GZ composites [45]. The relationship between time and C/C0 of HCl and NaOH solution added to the MO solution is shown in Figure 8f. The removal rate of MO can reach 54.08% and 0.01%, respectively, at 3 min. This is basically the same as the absorbance of HCl and NaOH after their addition to the MO solution. Therefore, HCl and NaOH play an inhibitory role in the degradation of MO by the GZ catalyst. The reason may be that HCl and NaOH can remove Ga2O3 from GZ composites, thus destroying the composite structure of GZ metal catalysts [46]. The destruction of the structure of the catalyst inhibited the production of active free radicals which play a role in the degradation, resulting in a significant decrease in the degradation effect.
5. Analysis of the Degradation Principle
5.1. Free Radical Capture Experiment
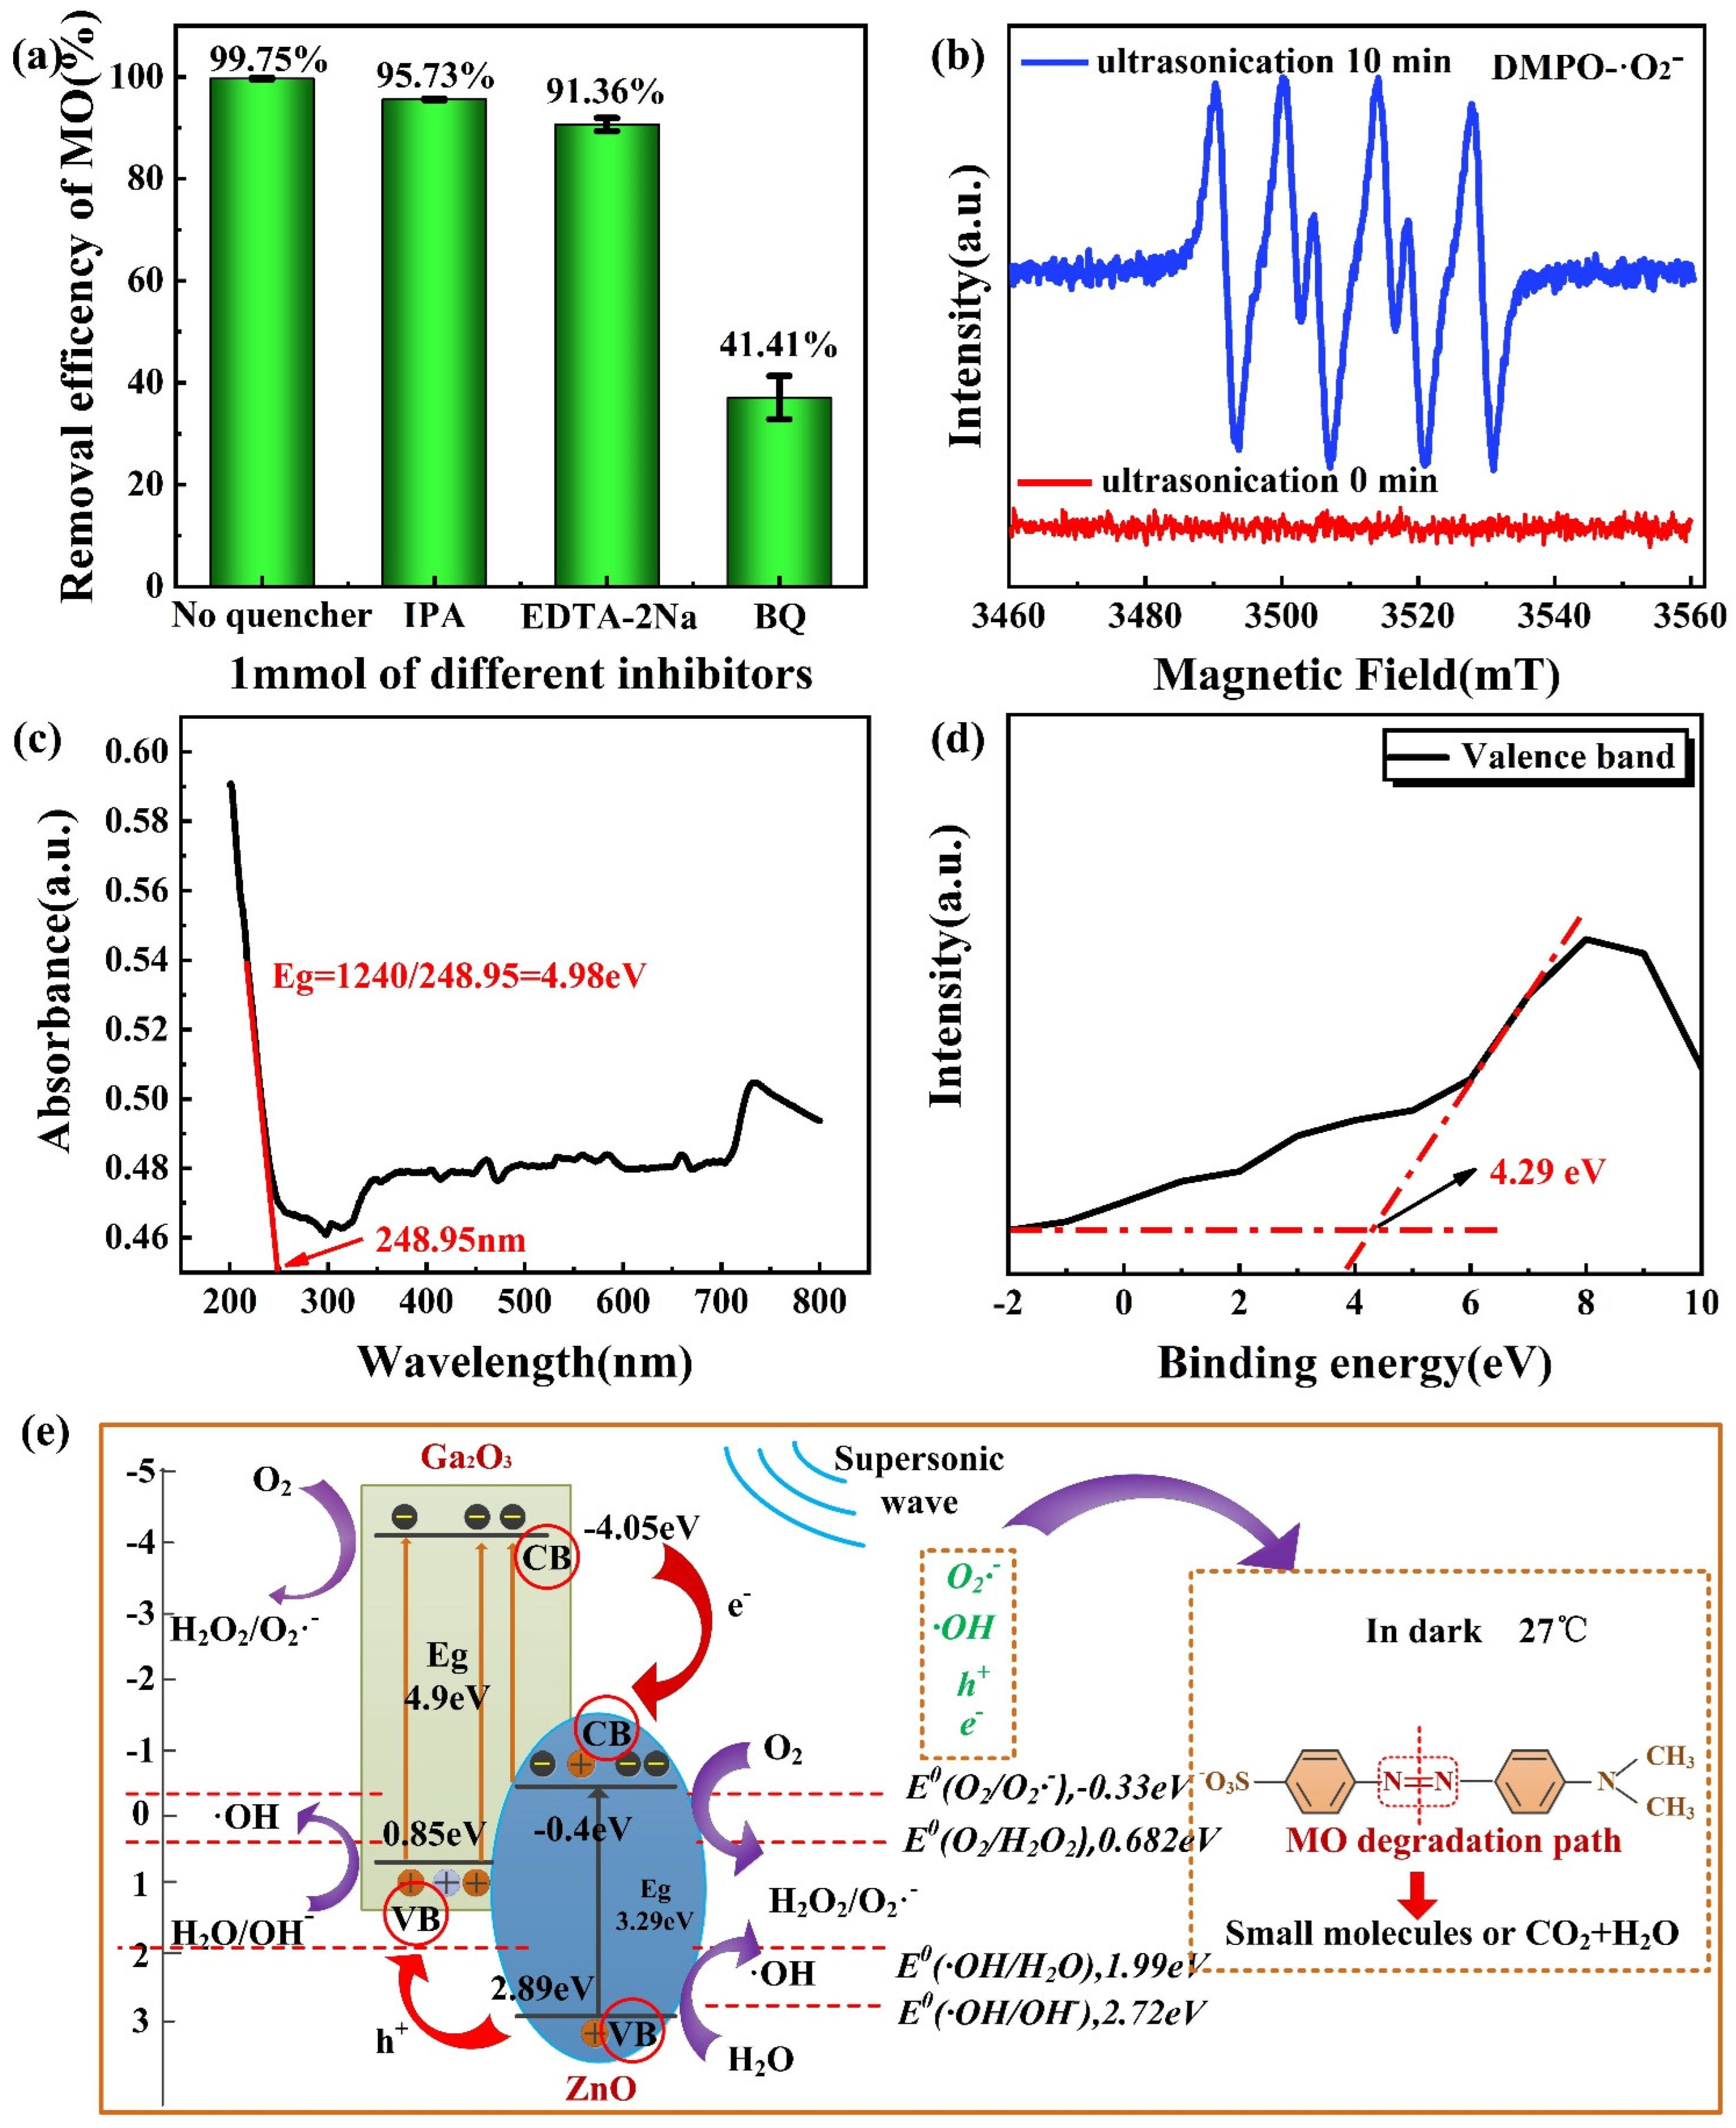
To evaluate the active substances that play a role in the degradation process, benzoquinone (BQ), isopropyl alcohol (IPA), and disodium ethylenediaminetetraacetic acid (EDTA-2Na) were used to inactivate the free radical species that may exist in the system. BQ, IPA, and EDTA-2Na can capture ·O2−, hydroxyl radical (·OH), and holes (h+) [47,48], respectively; thus, 1 mmol of each inhibitor was added to the degradation system to investigate which inhibitor had the greatest impact on MO degradation. Figure 9a shows the experimental results of free radical quenching during the degradation of MO. The MO removal rate by the GZ metal catalyst reached 99.75% within 3 min, but after the addition of EDTA-2Na, IPA, and BQ, the removal rates decreased to 91.36%, 95.73%, and 41.41%, respectively. Therefore, in the MO degradation process, ·O2− was the most important active species, h+ was the second most important active species, while the third was OH. However, the effects of the latter two on MO degradation were minimal, as shown in Figure 9a. Based on these results, it is clear that h+ and ·OH played a minor role in the degradation process, whereas ·O2− played a major role.
To elucidate the generation pathway of the free radical ·O2−, electron paramagnetic resonance (EPR) experiments were performed on the GZ catalyst solution after ultrasonic treatment in anhydrous ethanol for 0 and 10 min. The ·O2− species in anhydrous ethanol were detected using DMPO as a spin-capture agent. As shown in Figure 9b, no signals were observed without sonication, whereas the signal of the four peaks of 1-1-1-1 to ·O2− were detected after 10 min of ultrasound, which indicates that O2 was reduced to ·O2− under sonication [49]. Therefore, it can be inferred that ·O2− is produced by the ultrasonic irradiation of composite Ga2O3/ZnO in anhydrous ethanol. The mechanism for this may be that under the action of ultrasonic waves, the composite Ga2O3/ZnO produces cavitation in the anhydrous ethanol, and the severe redox reaction [30] results in the reduction of O2 to ·O2−. In order to explore the principle of free radical production and the reason why the catalyst can degrade MO, this study has made the following explorations:
Based on the above discussion, the possible pathway for producing free radicals and the catalytic degradation mechanism of MO was proposed. UV–vis was developed to determine the bandgap of the prepared catalysts (Figure 9c) according to Equation (2):
where h is the Planck constant (4.13566743 × 10⁻¹⁵ eV·s), c is the light velocity (3 × 10⁸ m/s), and λg is on behalf of the absorption edge of the semiconductor (λg = 248.95). The bandgap energy of the catalyst can be calculated according to Equation (2) [50] (Eg = 4.98 eV).
Eg = hc/λg = 1240/λg
The high-resolution XPS profile of Ga2O3/ZnO is shown in Figure 9d. The VB of the GZ composite material was 4.29 eV (Figure 9d), and the conduction band (CB) of GZ was calculated according to Equation (3):
where Eg is the bandgap of the semiconductor. As shown in Figure 5c, the bandgap of GZ was 4.98 eV. Thus, the conduction potential of GZ was −0.69 eV [51].
ECB = EVB − Eg,
The transfer and recombination processes of electrons and holes and the generation pathway of free radicals in the GZ composite under ultrasonic excitation are shown in Figure 9e. The ECB/EVB values of Ga2O3 and ZnO were −4.05/0.85 eV and −0.4/2.89 eV, respectively. According to the Fermi level, Ga2O3 and ZnO can produce e− and h+ under ultrasonic conditions and can migrate between heterojunctions, as shown in (Equations (4) and (5)). Thus, under ultrasonic excitation, electrons are transferred from the ECB of Ga2O3 to the ECB of ZnO, while h+ are transferred from the EVB of ZnO to the ECB of Ga2O3. The electrons excited by ultrasound in this process accumulate on the CB of ZnO [52], and the holes of Ga2O3 are thus induced to undergo ultrasonic redox reactions. Furthermore, during the degradation process, the electrons of the ECB in the ZnO particles generated by ultrasonic excitation not only inhibit the rapid recombination of the electrons and holes of Ga2O3 but also suppress the rapid recombination of electrons and holes produced by their own excitation. Thus, effective electron–hole separation was achieved in the semiconductor GZ composite material [53]. Notably, the electrons and holes generated by Ga2O3 and ZnO exhibited a good degree of match at the band edge, which facilitates the irreversible transfer of carriers from one semiconductor to another. Thus, the formation of ·OH was promoted owing to the effective inhibition of recombination and the increase in the carrier lifetime [54]. Additionally, compared to ZnO with an EVB of 2.89 eV, which is lower than the standard redox potentials of E0 (·OH/OH−, 2.72 eV) [55] and E0(·OH/H2O, 1.99 eV) [56], the EVB of Ga2O3 (0.85 eV) was higher than these standard redox potentials. This indicates that the holes generated in the EVB of Ga2O3 oxidize the captured water molecules or hydroxyl groups (OH−) into ·OH [57] (Equation (6)), and subsequently participate in the oxidation degradation reaction. The ECB edge potentials of ZnO and Ga2O3 were −0.4 and −4.25 eV, respectively, which is lower than the standard redox potentials of E0 (O2/·O2−, −0.33 eV) [58] and E0 (O2/HO2, −0.046 eV) [59], confirming that the ECB electrons of ZnO and Ga2O3 reduce O2 to ·O2− (Equation (7)) and the hydroxyl peroxide radical (HO2·) (Equation (9)). Meanwhile, accumulated electrons on ZnO are transferred to O2 by adsorption onto the GZ composite surface. Because the ECB potential level of ZnO is more positive than that of E0 (O2/H2O2, 0.682 eV), H2O2 is easily generated, which can react with electrons [55] or the ·O2− (Equation (10)) excited by ultrasound, resulting in an active free radical ·OH (Equation (11)). In addition to the migration of electrons and holes, highly oxidized OH- and O-containing active free radicals are also generated on the catalyst surface, and the MO dye molecules are completely mineralized and oxidized into pollution-free CO2 and H2O [54] (Equations (12)–(14)). The experimentally obtained bandgap, CB, and VB of the GZ catalyst confirmed the catalytic degradation mechanism proposed in Figure 5e, and the generation of free radicals occurs according to Equations (4)–(14).
5.2. Analysis of the Degradation Process
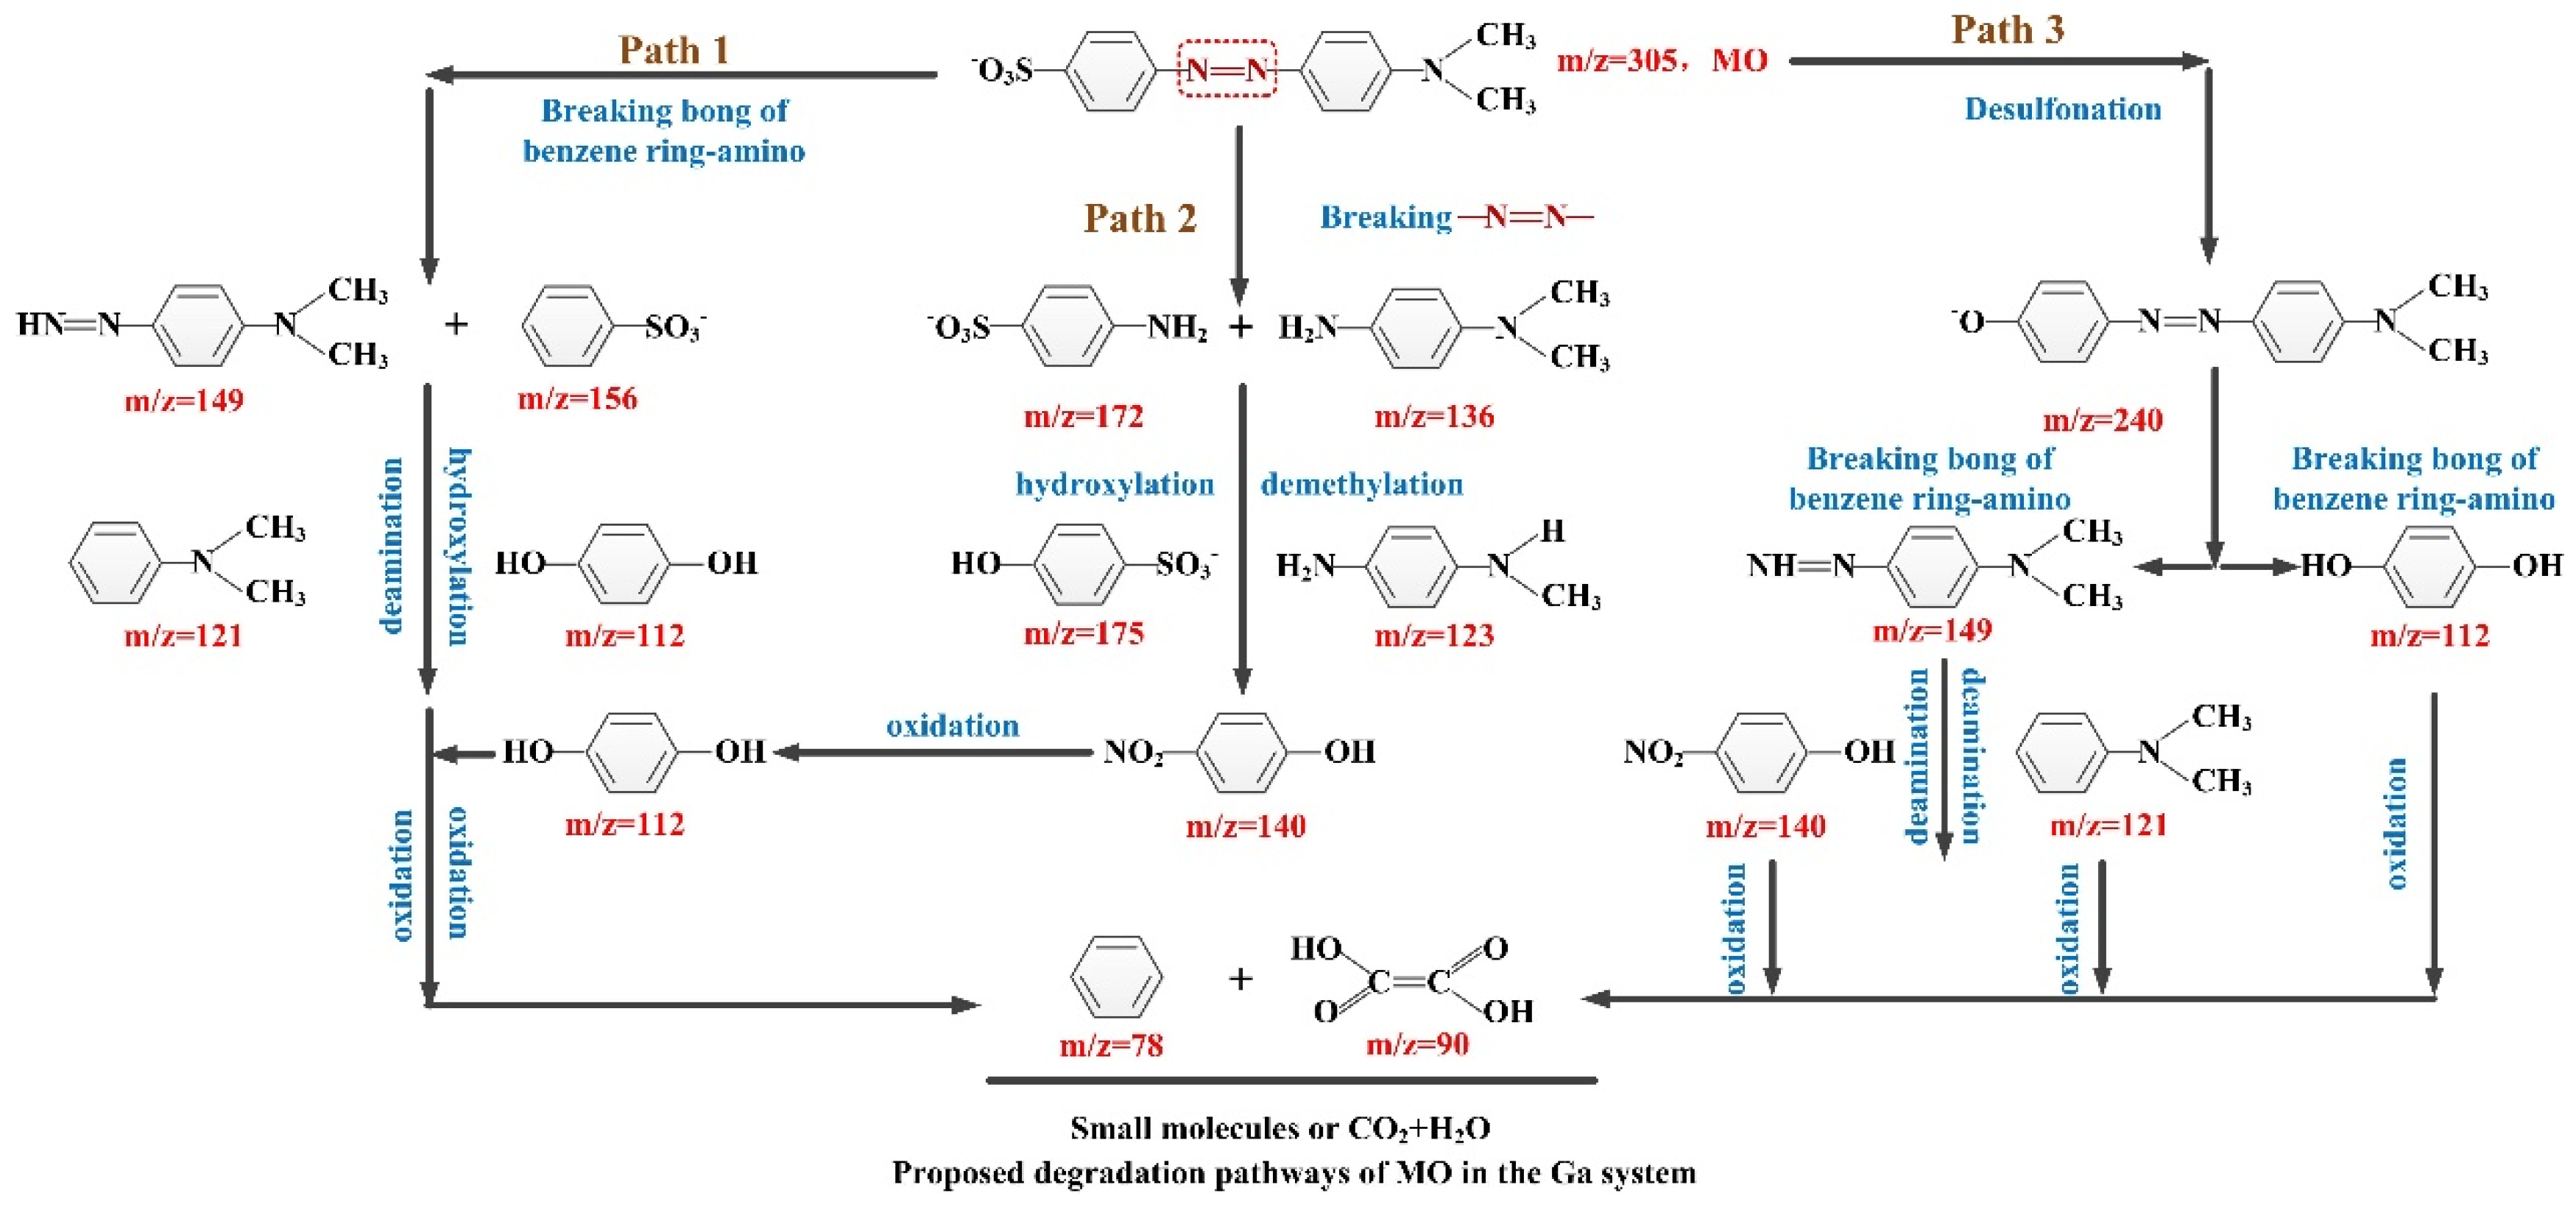
LC–MS was used to analyze the reaction intermediates formed in the GZ system after MO degradation for 3 min, and the degradation products were analyzed by measuring the mass/charge (m/z) ratio at different times. The predicted degradation flowchart of MO by the GZ metal composite is shown in Figure 10, and three degradation pathways were deduced. During the degradation process, the GaZn alloy and anhydrous ethanol played a major role in the ultrasonic production of ·O2−. The first degradation pathway is as follows: the parent MO molecule is decomposed into 4–diazo–N,N–dimethylaniline (m/z = 149), and benzenesulfonic acid (m/z = 156). Subsequently, the former is deaminated to produce N,N–dimethylaniline (m/z = 121), whereas the latter is hydroxylated to produce hydroquinone (m/z = 112). The second pathway involves breaking the −N=N− bond of the MO molecule to generate 4–amino–N,N–dimethylaniline (m/z = 136), and sulfanilic acid (m/z = 172). Meanwhile, the MO solution color became lighter [37], and 4-amino–N, N–dimethylaniline is demethylated to yield N–methylbenzene–1,4–diamine (m/z = 123), followed by hydroxylation to afford 4–aminophenol [60]. The NH2− group is oxidized to NO2−, and 4–nitrophenol (m/z = 140) and hydroquinone (m/z = 112) is obtained. In the third degradation pathway, an MO solution with a mass spectrum peak of (m/z = 305) is obtained after the loss of Na+, and the intermediate (m/z = 240) is produced by desulfurization. As the amino bond of the benzene ring breaks, intermediates 4–diazo–N, N–dimethylaniline (m/z = 149) and hydroquinone (m/z = 112) are formed. The further oxidation of hydroquinone causes the aromatic ring to open, forming short-chain fatty carboxylic acids, such as oxalate (m/z = 90), which are eventually converted into CO2 and H2O. These results are consistent with those obtained from the TOC test results, which demonstrated that the TOC in the solution was significantly reduced.
6. Conclusions and Prospect
In this paper, a composite with a snake-berry-like spherical structure of ZnO coated Ga2O3 was prepared by melting and ultrasonic methods. The preparation method is simple, the raw materials used in the preparation are easy to obtain, the price is low, and the whole preparation process is relatively environmentally friendly. According to the test results of SEM, TEM, and XPS, the formation of Ga2O3/ZnO composites was confirmed. The optimized experimental conditions include an alloy extraction temperature of 80 °C, a neutral methyl orange solution environment, and an optimal catalyst amount of 3 mL. A removal efficiency of 99.75% was achieved at the highest degradation rate of 10 mg/L methyl orange in 3 min, under dark conditions at 27 °C. The results of electron paramagnetic resonance (EPR) and a series of free radical inhibition experiments showed that (·O2−) was produced in the ultrasonic preparation of the catalyst and played an important role in the degradation process after adding methyl orange solution. Based on the by-products produced in the degradation process, as identified by LC–MS, three possible degradation pathways were proposed.
Although the catalyst prepared in this work had a good recycling performance, the main challenge was that before each cycle, Ga2O3/ZnO composites needed to be mixed with anhydrous ethanol for ultrasonic treatment, so that the catalyst can degrade MO solution more efficiently. Another challenge was that the research into the degradation mechanism of the catalyst is insufficient. The above two challenges need to be further explored and improved in future research.
Author Contributions
Conceptualization, H.X. and G.L.; methodology, H.X. and G.L.; software, H.X.; validation, H.X.; formal analysis, H.X. and Z.C.; investigation, Z.C. and X.X.; resources, H.X.; data curation, H.X. and Z.C.; writing—original draft preparation, H.X.; writing—review and editing, G.L and H.X.; visualization, X.X. and C.W.; supervision, G.L. and H.X.; project administration, H.X. and G.L.; funding acquisition, G.L. and H.X. All authors have read and agreed to the published version of the manuscript.
Funding
This research received no external funding.
Data Availability Statement
The data presented in this study are available on request from the corresponding author.
Conflicts of Interest
The authors declare no conflict of interest.
References
- Chen, Y.; Shi, R.; Luo, H.; Zhang, R.; Hu, Y.; Xie, H.; Zhu, N.-M. Alkali-catalyzed hydrothermal oxidation treatment of triclosan in soil: Mechanism, degradation pathway and toxicity evaluation. Sci. Total Environ. 2023, 856, 159187. [Google Scholar] [CrossRef] [PubMed]
- Zong, Y.; Shao, Y.; Ji, W.; Zeng, Y.; Xu, J.; Liu, W.; Xu, L.; Wu, D. Trace Mn (II)-catalyzed periodate oxidation of organic contaminants not relying on any transient reactive species: The substrate-dependent dual roles of in-situ formed colloidal MnO2. Chem. Eng. J. 2023, 451, 139106. [Google Scholar] [CrossRef]
- Abdallah, A.E.M. Recent green synthesis of pyridines and their fused systems catalyzed by nanocatalysts. In Recent Developments in the Synthesis and Applications of Pyridines; Elsevier: Amsterdam, The Netherlands, 2023; pp. 331–375. [Google Scholar]
- Dihom, H.R.; Al-Shaibani, M.M.; Mohamed, R.M.S.R.; Al-Gheethi, A.A.; Sharma, A.; Khamidun, M.H.B. Photocatalytic degradation of disperse azo dyes in textile wastewater using green zinc oxide nanoparticles synthesized in plant extract: A critical review. J. Water Process Eng. 2022, 47, 102705. [Google Scholar] [CrossRef]
- Tu, Y.; Shao, G.; Zhang, W.; Chen, J.; Qu, Y.; Zhang, F.; Tian, S.; Zhou, Z.; Ren, Z. The degradation of printing and dyeing wastewater by manganese-based catalysts. Sci. Total Environ. 2022, 828, 154390. [Google Scholar] [CrossRef]
- Singh, B.; Singh, P.; Siddiqui, S.; Singh, D.; Gupta, M. Wastewater treatment using Fe-doped perovskite manganites by photocatalytic degradation of methyl orange, crystal violet and indigo carmine dyes in tungsten bulb/sunlight. J. Rare Earths 2022, in press. [CrossRef]
- Sobhanardakani, S.; Zandipak, R.; Khoshsafar, H. Removal of cationic dyes from aqueous solutions using NiFe2O4 nanoparticles. J. Water Supply Res. Technol. AQUA 2016, 65, 64–74. [Google Scholar]
- Mahmoodi, N.M.; Taghizadeh, A.; Taghizadeh, M.; Baglou, M.A.S. Surface modified montmorillonite with cationic surfactants: Preparation, characterization, and dye adsorption from aqueous solution. J. Environ. Chem. Eng. 2019, 7, 103243. [Google Scholar] [CrossRef]
- Yu, S.; Zhou, J.; Ren, Y.; Yang, Z.; Zhong, M.; Feng, X.; Su, B.; Lei, Z. Excellent adsorptive-photocatalytic performance of zinc oxide and biomass derived N, O-contained biochar nanocomposites for dyes and antibiotic removal. Chem. Eng. J. 2023, 451, 138959. [Google Scholar] [CrossRef]
- Sun, H.; Lee, S.-Y.; Park, S.-J. Bimetallic CuPd alloy nanoparticles decorated ZnO nanosheets with enhanced photocatalytic degradation of methyl orange dye. J. Colloid Interface Sci. 2023, 629, 87–96. [Google Scholar] [CrossRef]
- Chi, Z.; Tarntair, F.-G.; Frégnaux, M.; Wu, W.-Y.; Sartel, C.; Madaci, I.; Chapon, P.; Sallet, V.; Dumont, Y.; Pérez-Tomás, A.; et al. Bipolar self-doping in ultra-wide bandgap spinel ZnGa2O4. Mater. Today Phys. 2021, 20, 100466. [Google Scholar] [CrossRef]
- Liang, J.; Chai, Y.; Li, L.; Li, D.; Shen, J.; Zhang, Y.; Wang, X. Germanium and iron double-substituted ZnGa2O4 solid-solution photocatalysts with modulated band structure for boosting photocatalytic CO2 reduction with H2O. Appl. Catal. B Environ. 2020, 265, 118551. [Google Scholar] [CrossRef]
- Zhang, X.; Huang, J.; Ding, K.; Hou, Y.; Wang, X.; Fu, X. Photocatalytic decomposition of benzene by porous nanocrystalline ZnGa2O4 with a high surface area. Environ. Sci. Technol. 2009, 43, 5947–5951. [Google Scholar] [CrossRef] [PubMed]
- Zhang, W.; Zhang, J.; Chen, Z.; Wang, T. Photocatalytic degradation of methylene blue by ZnGa2O4 thin films. Catal. Commun. 2009, 10, 1781–1785. [Google Scholar] [CrossRef]
- Liu, L.; Huang, J.; Cao, L.; Wu, J.; Fei, J.; Ouyang, H.; Ma, F.; Zhou, C. Synthesis of ZnGa2O4 octahedral crystallite by hydrothermal method with the aid of CTAB and its photocatalytic activity. Mater. Lett. 2013, 95, 160–163. [Google Scholar] [CrossRef]
- Liu, J.; Lu, W.; Wu, H.; Jin, L.; Hu, B.; Li, L.; Wang, Z. In situ synthesis of rice-like ZnGa2O4 for the photocatalytic removal of organic and inorganic pollutants. Mater. Sci. Semicond. Process. 2016, 56, 251–259. [Google Scholar] [CrossRef]
- Liu, L.L.; Cao, L.-Y.; Huang, J.-H.; Zhang, X.-W. Preparation and Photocatalytic Properties of the Octahedral ZnGa2O4 Crystallites. Chin. J. Inorg. Chem. 2012, 28, 2091–2096. [Google Scholar]
- Yuan, Y.; Huang, J.; Tu, W.; Huang, S. Synthesis of uniform ZnGa2O4 nanoparticles with high photocatalytic activity. J. Alloys Compd. 2014, 616, 461–467. [Google Scholar] [CrossRef]
- Negrete-Durán, S.; Villabona-Leal, E.; Alanis, J.; Rodríguez-Aranda, M.; Ojeda-Galván, H.J.; Hernández-Arteaga, A.; Ovando, V.; Cardoso, P.; Quintana, M.; Ocampo-Pérez, R.; et al. Thermal evolution of Zn3(OH)2V2O7·2H2O to Zn-VO family (Zn2(OH)(VO4), Zn3(VO4)2-α, ZnO and Zn3(VO4)2-β): A structural, optical and visible light photocatalytic study. J. Alloys Compd. 2023, 932, 167493. [Google Scholar] [CrossRef]
- Zhang, Y.; Zheng, J.; Nan, J.; Gai, C.; Shao, Q.; Murugadoss, V.; Maganti, S.; Naik, N.; Algadi, H.; Huang, M.; et al. Influence of mass ratio and calcination temperature on physical and photoelectrochemical properties of ZnFe-layered double oxide/cobalt oxide heterojunction semiconductor for dye degradation applications. Particuology 2023, 74, 141–155. [Google Scholar] [CrossRef]
- Sampath, S.; Dharmar, S.; Chinnasamy, K.; Bangaru, G.; Sankar, M.; Gedi, S.; Shkir, M.; Manthrammel, M.A. Improved ethanol sensing and photocatalytic Rhodamine B dye degradation of Ni-SnO2 nanoparticles. Mater. Sci. Eng. B 2023, 287, 116091. [Google Scholar] [CrossRef]
- Ren, Z.; Yang, X.; Zhang, W.; Zhao, Z. Preparation, characterization and performance of a novel magnetic Fe-Zn activated carbon for efficient removal of dyes from wastewater. J. Mol. Struct. 2023, 1274, 134407. [Google Scholar] [CrossRef]
- Oloye, O.; Riches, J.D.; O’Mullane, A.P. Liquid metal assisted sonocatalytic degradation of organic azo dyes to solid carbon particles. Chem. Commun. 2021, 57, 9296–9299. [Google Scholar] [CrossRef]
- Yang, J.; Sun, X.; Yang, W.; Zhu, M.; Shi, J. The improvement of coralline-like ZnGa2O4 by cocatalysts for the photocatalytic degradation of rhodamine B. Catalysts 2020, 10, 221. [Google Scholar] [CrossRef] [Green Version]
- Hohman, J.N.; Kim, M.; Wadsworth, G.A.; Bednar, H.R.; Jiang, J.; LeThai, M.A.; Weiss, P.S. Directing substrate morphology via self-assembly: Ligand-mediated scission of gallium–indium microspheres to the nanoscale. Nano Lett. 2011, 11, 5104–5110. [Google Scholar] [CrossRef]
- Hu, L.; Yuan, B.; Liu, J. Liquid metal amoeba with spontaneous pseudopodia formation and motion capability. Sci. Rep. 2017, 7, 7256. [Google Scholar] [CrossRef] [Green Version]
- Cui, S.; Li, J.; Zhang, L.; Jiang, Y.; Wang, Z.; Zhang, L.; Yuan, C.; Shen, Z.; Zeng, H. Effect of Ga2O3-doping on Properties and Structure of ZBLAN Glass. J. Wuhan Univ. Technol.-Mater. Sci. Ed. 2022, 37, 564–569. [Google Scholar] [CrossRef]
- Lin, Y.; Liu, Y.; Genzer, J.; Dickey, M.D. Shape-transformable liquid metal nanoparticles in aqueous solution. Chem. Sci. 2017, 8, 3832–3837. [Google Scholar] [CrossRef] [PubMed] [Green Version]
- Chen, X.; Chen, Y.; Ren, F.-F.; Gu, S.L.; Tan, H.H.; Jagadish, C.; Ye, J.D. Band alignment and band bending at α-Ga2O3/ZnO nn isotype hetero-interface. Appl. Phys. Lett. 2019, 115, 202101. [Google Scholar] [CrossRef]
- Parida, K.; Martha, S.; Das, D.; Biswal, N. Facile fabrication of hierarchical N-doped GaZn mixed oxides for water splitting reactions. J. Mater. Chem. 2010, 20, 7144–7149. [Google Scholar] [CrossRef]
- Chen, Y.; Ning, H.; Kuang, Y.; Yu, X.-X.; Gong, H.-H.; Chen, X.; Ren, F.-F.; Gu, S.; Zhang, R.; Zheng, Y.; et al. Band alignment and polarization engineering in κ-Ga2O3/GaN ferroelectric heterojunction. Sci. China Phys. Mech. Astron. 2022, 65, 277311. [Google Scholar] [CrossRef]
- Gong, H.; Chen, X.; Xu, Y.; Chen, Y.; Ren, F.-F.; Liu, B.; Gu, S.; Zhang, R.; Ye, J. Band alignment and interface recombination in NiO/β-Ga2O3 Type-II pn heterojunctions. IEEE Trans. Electron Devices 2020, 67, 3341–3347. [Google Scholar] [CrossRef]
- Navarro-Quezada, A.; Galazka, Z.; Alamé, S.; Skuridina, D.; Vogt, P.; Esser, N. Surface properties of annealed semiconducting β-Ga2O3 (100) single crystals for epitaxy. Appl. Surf. Sci. 2015, 349, 368–373. [Google Scholar] [CrossRef]
- Di Valentin, C.; Pacchioni, G.; Selloni, A.; Livraghi, S.; Giamello, E. Characterization of paramagnetic species in N-doped TiO2 powders by EPR spectroscopy and DFT calculations. J. Phys. Chem. B 2005, 109, 11414–11419. [Google Scholar] [CrossRef]
- Shah, M.S.A.S.; Zhang, K.; Park, A.R.; Kim, K.S.; Park, N.-G.; Parkab, J.H.; Yoo, P.J. Single-step solvothermal synthesis of mesoporous Ag–TiO2–reduced graphene oxide ternary composites with enhanced photocatalytic activity. Nanoscale 2013, 5, 5093–50101. [Google Scholar] [CrossRef] [Green Version]
- Hong, X.; Li, Y.; Wang, X.; Long, J.; Liang, B. Carbon nanosheet/MnO2/BiOCl ternary composite for degradation of organic pollutants. J. Alloys Compd. 2022, 891, 162090. [Google Scholar] [CrossRef]
- Yuan, D.; Zhang, C.; Tang, S.; Li, X.; Tang, J.; Rao, Y.; Wang, Z.; Zhang, Q. Enhancing CaO2 fenton-like process by Fe (II)-oxalic acid complexation for organic wastewater treatment. Water Res. 2019, 163, 114861. [Google Scholar] [CrossRef] [PubMed]
- Nathiya, D.; Alhaji, N.; Jahangir, A.M.; Fathima, M.I.; Gatasheh, M.K.; Hatamleh, A.A.; Zehra, S.; Ayeshamariam, A. Synthesis and characterization of ZnGa2O4 composites and its photocatalytic properties for energy applications. Environ. Res. 2022, 204, 112073. [Google Scholar] [CrossRef]
- Lu, H.-S.; Zhang, H.; Liu, R.; Zhang, X.; Zhao, H.; Wang, G. Macroscale cobalt-MOFs derived metallic Co nanoparticles embedded in N-doped porous carbon layers as efficient oxygen electrocatalysts. Appl. Surf. Sci. 2017, 392, 402–409. [Google Scholar] [CrossRef] [Green Version]
- Zhang, H.; Duan, L.; Zhang, D. Decolorization of methyl orange by ozonation in combination with ultrasonic irradiation. J. Hazard. Mater. 2006, 138, 53–59. [Google Scholar] [CrossRef]
- Wang, Y.; Yang, C.; Liu, Y.; Fan, Y.; Dang, F.; Qiu, Y.; Zhou, H.; Wang, W.; Liu, Y. Solvothermal Synthesis of ZnO Nanoparticles for Photocatalytic Degradation of Methyl Orange and p-Nitrophenol. Water 2021, 13, 3224. [Google Scholar] [CrossRef]
- Wang, C.; Qin, H.; Cao, L.; Wang, D.; Zhang, J.; Zhang, B.; Ou, X. Engineered single-crystal metal-selenide for rapid K-ion diffusion and polyselenide convention. Chem. Eng. J. 2022, 427, 131963. [Google Scholar] [CrossRef]
- Hong, X.; Wang, R.; Li, S.; Fu, J.; Chen, L.; Wang, X. Hydrophilic macroporous SnO2/rGO composite prepared by melamine template for high efficient photocatalyst. J. Alloys Compd. 2020, 816, 152550. [Google Scholar] [CrossRef]
- Chen, W.; Sun, F.; Zhu, Z.; Min, Z.; Li, W. Nanoporous SnO2 prepared by a photochemical strategy: Controlling of specific surface area and photocatalytic activity in degradation of dye pollutants. Microporous Mesoporous Mater. 2014, 186, 65–72. [Google Scholar] [CrossRef]
- Shang, J.; Chen, T.; Wang, X.; Sun, L.; Su, Q. Facile fabrication and enhanced photocatalytic performance: From BiOCl to element-doped BiOCl. Chem. Phys. Lett. 2018, 706, 483–487. [Google Scholar] [CrossRef]
- Mohammed, M.G.; Dickey, M.D. Strain-controlled diffraction of light from stretchable liquid metal micro-components. Sens. Actuators A Phys. 2013, 193, 246–250. [Google Scholar] [CrossRef]
- Liang, C.; Su, H.-W. Identification of sulfate and hydroxyl radicals in thermally activated persulfate. Ind. Eng. Chem. Res. 2009, 48, 5558–5562. [Google Scholar] [CrossRef]
- Liu, J.; Dong, Y.; Zhang, L.; Liu, W.; Zhang, C.; Shi, Y.; Lin, H. Regulating superoxide radicals and light absorption ability for enhancing photocatalytic performance of MoS2@ Z by CeO2 rich in adsorbed oxygen. J. Clean. Prod. 2021, 322, 129059. [Google Scholar] [CrossRef]
- Liu, Z.; Cui, Y.; Li, Q.; Zhang, Q.; Zhang, B. Fabrication of folded MXene/MoS2 composite microspheres with optimal composition and their microwave absorbing properties. J. Colloid Interface Sci. 2022, 607, 633–644. [Google Scholar] [CrossRef]
- Chen, S.; Feng, W.; Wang, H.; Wu, Z. Synergistic degradation of NO and ethyl acetate by plasma activated “pseudo photocatalysis” on Ce/ZnGa2O4/NH2-UiO-66 catalyst: Restrictive relation and reaction pathways exploration. Chem. Eng. J. 2021, 421, 129725. [Google Scholar] [CrossRef]
- Jiang, H.; Li, Y.; Wang, X.; Hong, X. Construction of a hydrangea-like Bi2WO6/BiOCl composite as a high-performance photocatalyst. New J. Chem. 2022, 46, 2627–2634. [Google Scholar] [CrossRef]
- Hunge, Y.; Mahadik, M.; Moholkar, A.; Bhosale, C.H. Photoelectrocatalytic degradation of phthalic acid using spray deposited stratified WO3/ZnO thin films under sunlight illumination. Appl. Surf. Sci. 2017, 420, 764–772. [Google Scholar] [CrossRef]
- Méndez-Díaz, J.D.; Rivera-Utrilla, J.; Sánchez-Polo, M.; Bautista-Toledo, I. Adsorption/bioadsorption of phthalic acid, an organic micropollutant present in landfill leachates, on activated carbons. J. Colloid Interface Sci. 2012, 369, 358–365. [Google Scholar] [CrossRef]
- Mageshwari, K.; Nataraj, D.; Pal, T.; Sathyamoorthy, R.; Park, J. Improved photocatalytic activity of ZnO coupled CuO nanocomposites synthesized by reflux condensation method. J. Alloys Compd. 2015, 625, 362–370. [Google Scholar] [CrossRef]
- Liu, W.; Wang, M.; Xu, C.; Chen, S.; Fu, X. Ag3PO4/ZnO: An efficient visible-light-sensitized composite with its application in photocatalytic degradation of Rhodamine B. Mater. Res. Bull. 2013, 48, 106–113. [Google Scholar] [CrossRef]
- Liu, W.; Wang, M.; Xu, C.; Chen, S.; Fu, X. Significantly enhanced visible-light photocatalytic activity of g-C3N4 via ZnO modification and the mechanism study. J. Mol. Catal. A Chem. 2013, 368, 9–15. [Google Scholar] [CrossRef]
- Zhang, N.; Liu, S.; Fu, X.; Xu, Y.J. Synthesis of M@TiO2(M= Au, Pd, Pt) core–shell nanocomposites with tunable photoreactivity. J. Phys. Chem. C 2011, 115, 9136–9145. [Google Scholar] [CrossRef]
- Katsumata, H.; Oda, Y.; Kaneco, S.; Suzuki, T. Photocatalytic activity of Ag/CuO/WO3 under visible-light irradiation. RSC Adv. 2013, 3, 5028–5035. [Google Scholar] [CrossRef]
- Abe, R.; Takami, H.; Murakami, N.; Otani, B. Pristine simple oxides as visible light driven photocatalysts: Highly efficient decomposition of organic compounds over platinum-loaded tungsten oxide. J. Am. Chem. Soc. 2008, 130, 7780–7781. [Google Scholar] [CrossRef] [PubMed]
- Li, X.; Li, X.; Yang, W.; Chen, X.; Li, W.; Luo, B.; Wang, K. Preparation of 3D PbO2 nanospheres@ SnO2 nanowires/Ti electrode and its application in methyl orange degradation. Electrochim. Acta 2014, 146, 15–22. [Google Scholar] [CrossRef]
Figure 1.
Synthesis schematic of the Ga2O3/ZnO composite.

Figure 2.
XRD patterns of prepared catalyst (a) Full XRD patterns of Ga2O3/ZnO, (b) XRD patterns between 76.2 and 77.6°, (c) XRD patterns between 35.8 and 36.5°, (d) XRD patterns between 42.7 and 43.8°, and (e,f) XRD patterns of the catalyst after use.
Figure 2.
XRD patterns of prepared catalyst (a) Full XRD patterns of Ga2O3/ZnO, (b) XRD patterns between 76.2 and 77.6°, (c) XRD patterns between 35.8 and 36.5°, (d) XRD patterns between 42.7 and 43.8°, and (e,f) XRD patterns of the catalyst after use.

Figure 3.
(a) SEM morphology of the Ga2O3/ZnO, (b) SEM morphology of the Ga2O3/ZnO at greater magnification, (c) the elemental mapping of Zn, and (d) the elemental mapping of Ga.
Figure 3.
(a) SEM morphology of the Ga2O3/ZnO, (b) SEM morphology of the Ga2O3/ZnO at greater magnification, (c) the elemental mapping of Zn, and (d) the elemental mapping of Ga.

Figure 4.
(a,b) TEM morphology of the Ga2O3/ZnO at different magnifications, and the elemental mapping of (c) Ga, (d) Zn, (e) O, and (f) the stem microstructure of Ga2O3/ZnO.
Figure 4.
(a,b) TEM morphology of the Ga2O3/ZnO at different magnifications, and the elemental mapping of (c) Ga, (d) Zn, (e) O, and (f) the stem microstructure of Ga2O3/ZnO.

Figure 5.
The XPS general spectra of (a) Ga2O3/ZnO, (b) the magnified Zn, (c) Ga, (d) N, (e) C, and (f) O spectra.
Figure 5.
The XPS general spectra of (a) Ga2O3/ZnO, (b) the magnified Zn, (c) Ga, (d) N, (e) C, and (f) O spectra.

Figure 6.
N2 adsorption–desorption isotherms (a) and pore size distribution of Ga2O3/ZnO (b).

Figure 7.
(a) UV–vis absorption curves of the MO solution, (b) the cycling degradation performance for the degradation of MO using the Ga2O3/ZnO composite, and (c) change of total organic carbon content in MO solution.
Figure 7.
(a) UV–vis absorption curves of the MO solution, (b) the cycling degradation performance for the degradation of MO using the Ga2O3/ZnO composite, and (c) change of total organic carbon content in MO solution.

Figure 8.
The influence of reuse on removal rates at different catalyst volumes: (a) 1 mL, (b) 3 mL, and (c) 5 mL. (d) The effect of different alloy extraction temperatures on the concentration curves for the degradation of MO and (e) ln C/C0. (f) The relationship between C/C0 and time for the degradation of MO with K+, Ca2+, Na+, HCl, and NaOH, and (g) corresponding linear fitting curves of ln (C0/C) versus time.

Figure 9.
(a) The influence of removal rates of MO with 1 mmol BQ, IPA, EDTA–2Na and no quencher, (b) the high-resolution XPS spectrum for the sample of Ga2O3/ZnO corresponding valence band edge, (c) UV–Vis diffuse reflectance spectra of Ga2O3/ZnO and corresponding bandgap, (d) the ESR spectra of Ga2O3/ZnO composite for detecting DMPO–·O2−, and (e) Ga2O3/ZnO composite transfer mechanism during degradation.

Figure 10.
Proposed degradation pathways of MO in the Ga2O3/ZnO system.


Table 1.
The sample–specific surface area, pore diameter, and pore volume.
| Sample | Specific Surface Area/(m2/g) | Average Aperture /(nm) | Pore Volume /(mL/g) |
|---|---|---|---|
| Ga | 0.462 | 30.987 | 0.003 |
| Ga2O3/ZnO | 0.868 | 29.197 | 0.002 |
Table 2.
Atomic weight ratio before and after catalyst degradation is obtained by EDS of SEM.
| Element | Fresh Weight Ratio | Element | Used Weight Ratio |
|---|---|---|---|
| Zn | 3.5 | Zn | 3.19 |
| Ga | 96.5 | Ga | 96.81 |
| total | 100 | 100 |
Disclaimer/Publisher’s Note: The statements, opinions and data contained in all publications are solely those of the individual author(s) and contributor(s) and not of MDPI and/or the editor(s). MDPI and/or the editor(s) disclaim responsibility for any injury to people or property resulting from any ideas, methods, instructions or products referred to in the content. |
© 2023 by the authors. Licensee MDPI, Basel, Switzerland. This article is an open access article distributed under the terms and conditions of the Creative Commons Attribution (CC BY) license (https://creativecommons.org/licenses/by/4.0/).
Share and Cite
MDPI and ACS Style
Xie, H.; Liu, G.; Chen, Z.; Xu, X.; Wei, C. Design of a Spherical Ga2O3/ZnO Composite with a Snakeberry-like Structure for Methyl Orange Degradation. Water 2023, 15, 952. https://doi.org/10.3390/w15050952
AMA Style
Xie H, Liu G, Chen Z, Xu X, Wei C. Design of a Spherical Ga2O3/ZnO Composite with a Snakeberry-like Structure for Methyl Orange Degradation. Water. 2023; 15(5):952. https://doi.org/10.3390/w15050952
Chicago/Turabian StyleXie, Hongyu, Guangzhu Liu, Zelin Chen, Xintong Xu, and Chong Wei. 2023. "Design of a Spherical Ga2O3/ZnO Composite with a Snakeberry-like Structure for Methyl Orange Degradation" Water 15, no. 5: 952. https://doi.org/10.3390/w15050952
Note that from the first issue of 2016, this journal uses article numbers instead of page numbers. See further details here.