
Impact of Artificial Islands and Reefs on Water Quality in Jinmeng Bay, China
by
 ,
,
Jiadong Fan
1,
Cuiping Kuang
1,*,
Huixin Liu
2,*,
Dan Wang
1,
Jiantao Liu
2,
Gang Wang
2 and
Qingping Zou
3,* 1
College of Civil Engineering, Tongji University, Shanghai 200092, China
2
The Eighth Geological Brigade, Hebei Geological Prospecting Bureau, Qinhuangdao 066001, China
3
The Lyell Centre for Earth and Marine Science and Technology, Institute for Infrastructure and Environment, Heriot-Watt University, Edinburgh EH14 4AS, UK
*
Authors to whom correspondence should be addressed.
Water 2023, 15(5), 959; https://doi.org/10.3390/w15050959
Submission received: 9 February 2023
/
Revised: 28 February 2023
/
Accepted: 1 March 2023
/
Published: 2 March 2023
(This article belongs to the Section Water Quality and Contamination)
Abstract
:Recurrent green tide has been widely studied due to its severe damage to coastal ecosystem. Jinmeng Bay, a popular resort in northeastern China, has suffered from green tide events since 2015, after the constructions of artificial islands and submerged reefs. To investigate the potential impacts of artificial islands and reefs on the water quality in Jinmeng Bay, a MIKE 21 numerical model was established by coupling a hydrodynamic model with a transport model of Chemical Oxygen Demand (COD) and nitrate ion (NO3−). The changes in the water quality in Jinmeng Bay by the initial, first-stage and current construction conditions of artificial islands and submerged reefs were simulated. The model results indicated that: (1) The artificial islands and reefs in Jinmeng Bay hinder the tidal currents and weaken the tidal actions. (2) The weakened tidal actions at the estuary lead to the accretion of COD and NO3−. The neap tides generate a littoral zone with the high concentration of COD and NO3−, and the spring tides maintain the zone at the estuary. (3) NO3− is more sensitive than COD to the variation of hydrodynamic conditions. The NO3− concentration in the north of Conch artificial island is altered significantly, where the construction of the artificial structures decrease the concentration by ~30%, while the demolition of the connection road increases the concentration beyond its initial values by 16~21%. (4) Under the current construction conditions, the rising concentrations of COD (up to 2%) and NO3− (up to 40%) increase the frequency and scale of green tides in Jinmeng Bay considerably. Therefore, continuous monitoring of water quality is required for this region.
1. Introduction
Over the past decades, climate changes and anthropogenic emissions have led to the recurrences of green tides in the Yellow Sea and the Bohai Sea, China. The green tide incidence deters tourists and incurs excessive expense for rehabilitation [1,2,3,4]. Moreover, the blooming algae alter the local nutrient levels and the initial community structures further [4,5,6,7]. The regional variations of environmental factors may also increase the risk of green tides [8,9,10,11,12]. Han et al. [13,14,15] investigated the mechanisms that trigger green tides based on the tempo-spatial distributions of Ulva prolifera (a typical green algae in China) and pointed out that temperature, substrates and nutrients had the dominant effects on the physiological levels. Song [16] applied remote sensing to study hydrodynamic and environmental factors for algae outbreaks. It was found that the nutrient emissions for aquaculture resulted in the blooming biomass, and wind-induced currents controlled the algae drift trajectory. During their investigations of the green tide events under normal and storm conditions, Sun et al. [17] and Li et al. [18] also highlighted the importance of wind and current contributions to the algae drift. Geng [19] utilized 28-isofucosterol as a biomarker to track the deposition area of Ulva prolifera and revealed that the distribution of the biomarker is correlated with that of nitrogen nutrients. In fact, nitrogen nutrients play a significant role in the growth of green algae [20,21,22]. Recently, Zhang et al. [23,24] focused on the influences of nitrogen nutrients on a typical green tide event in 2018. On the one hand, the distributions of nitrogen nutrients were mainly affected by the upstream input and the nearshore transport. On the other hand, the rich dissolved inorganic nitrogen (DIN), especially the nitrate ion (NO3−), contributed to the rapid reproduction of the green algae. Therefore, after the hydrodynamics changes, the nutrients would redistribute, and the reproduction rate of green tides in turn would change accordingly.
Nowadays, coastal engineering structures have been widely applied, not only for coastal developments, but also for coastal protections and restorations. These structures alter the local hydrodynamics until they reach a new equilibrium. For instance, Nanhaimingzhu artificial island in the Haikou Bay reduces the cross-section of the flow channel and accelerated the currents, but it attenuated the waves entering the bay [25]. In Riyue Bay, the connection road between the land and the artificial island obstructed the flow channel and caused excessive accretions and coastal progradation towards the artificial island, thereby causing a tombolo formation in the long term. Meanwhile, the artificial island suffered from seaward erosion due to the intensive currents and waves [26,27]. Apart from large-scale coastal engineering structures, restoration measures could also change the local hydrodynamic conditions [28,29]. Ma et al. [30] and Kuang et al. [31,32] both found that artificial submerged sandbars and reefs could damp the incident wave energy and maintain the littoral current direction. Although artificial reefs have limited influences on the surrounding flow field, they can alter the seawater physicochemical properties [33,34] and shift the ecological dynamics [35,36,37].
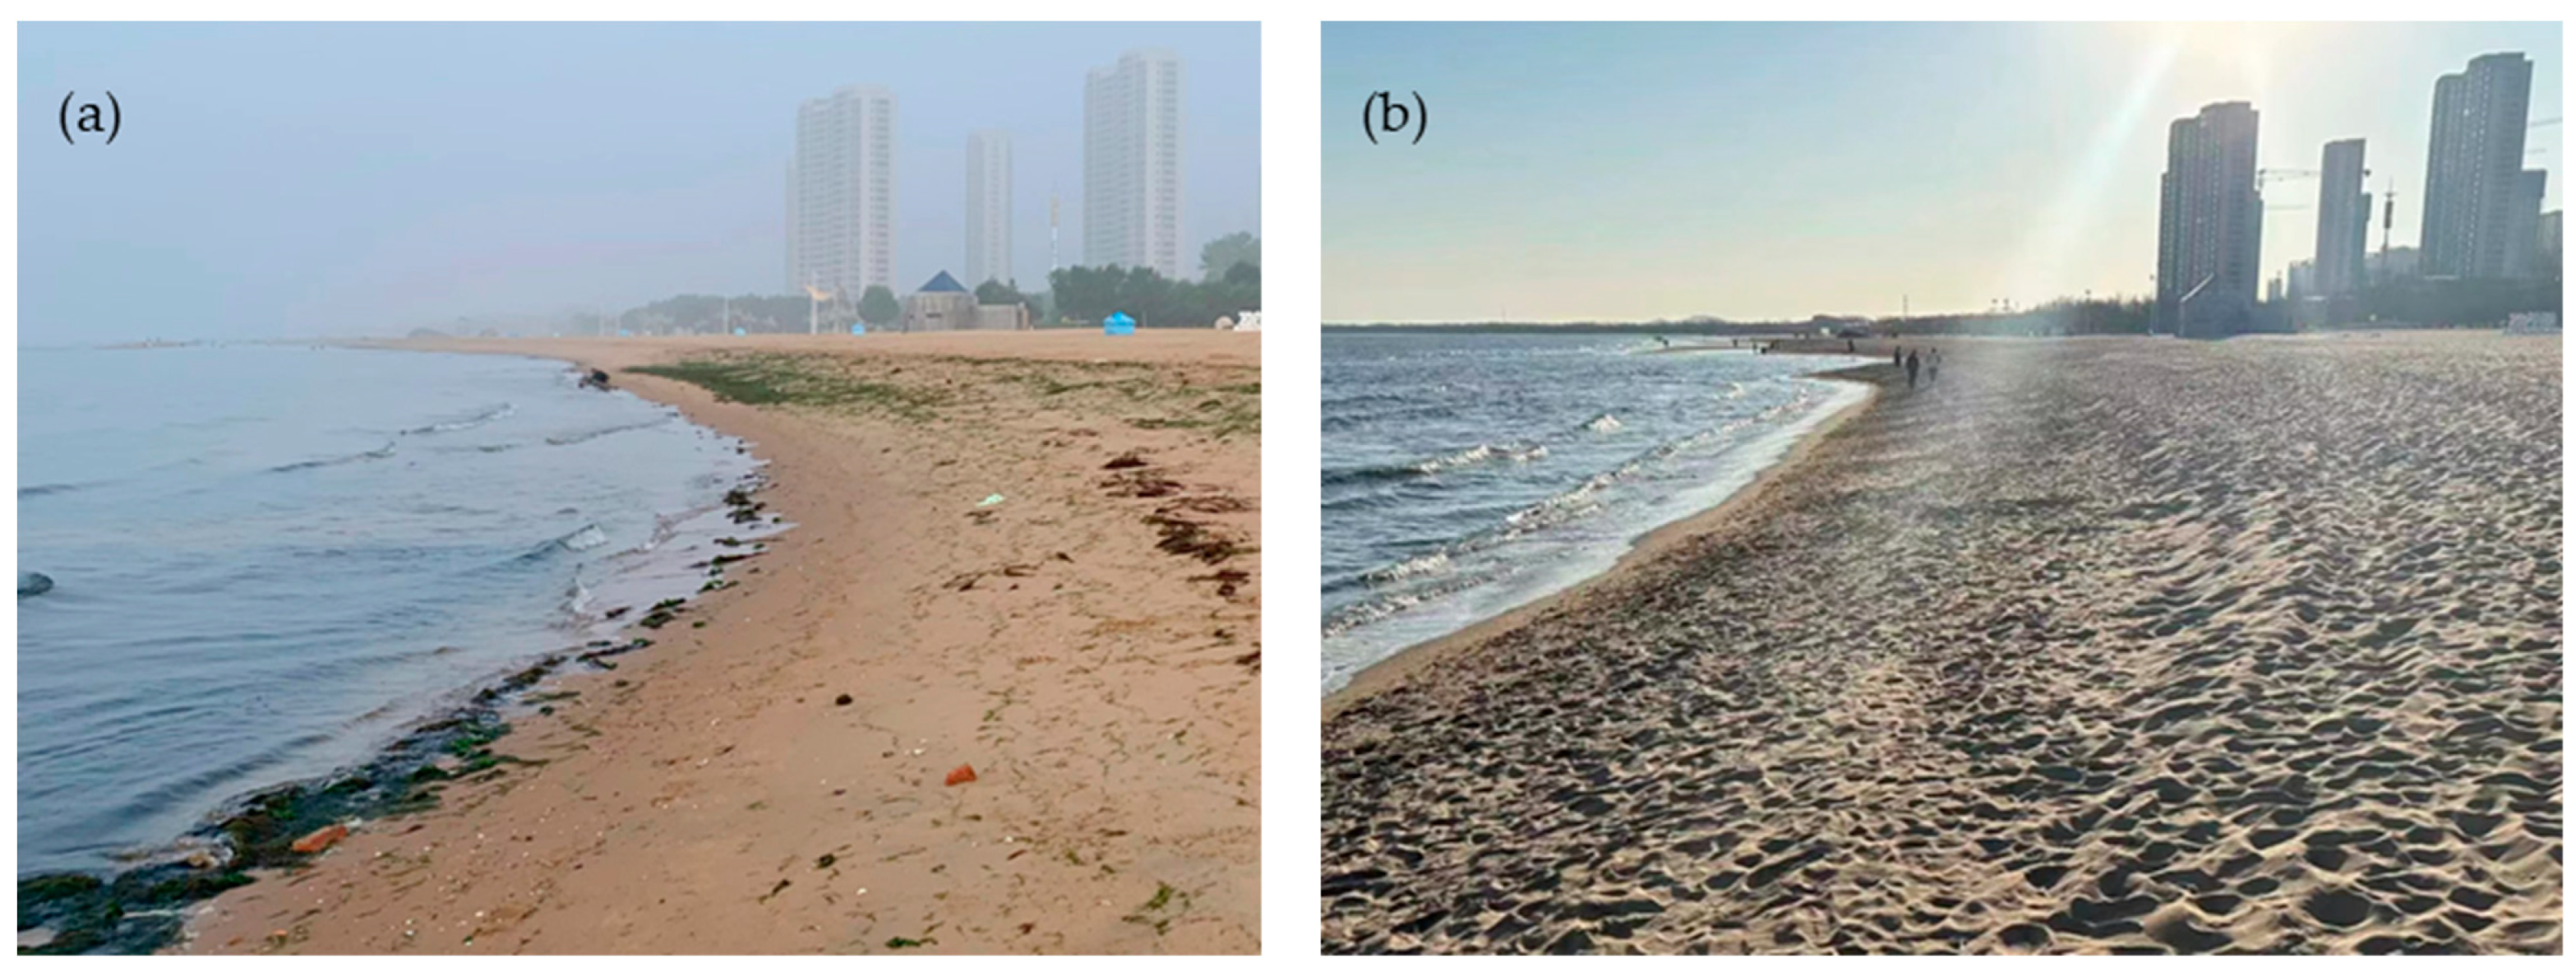
As one of the most popular coastal resorts, Jinmeng Bay experienced a rapid development before 2015, when two artificial islands, Lotus Island and Conch Island, were constructed. Moreover, Jinmeng Beach was restored by artificial submerged reefs simultaneously. Xu et al. [38] and Zhang et al. [39] simulated the hydrodynamic and morphodynamic processes after the construction of Lotus Island. Their numerical results indicated that Lotus Island maintained the main flow direction for its separated flow branches, but the coastal progradation was visible in the wave shadow zones. Therefore, Lotus Island decreased the tidal currents and waves along the coast. Different from Lotus Island, Conch Island is a monolithic artificial island at Tanghe Estuary. It hindered the tides and waves into the estuary and formed a wave shadow zone. In addition, it separated the flood flow from Tanghe River into a littoral branch and an offshore branch [40]. However, the road connecting the coast and Conch Island obstructed the littoral currents [41]. Wang [42] investigated the interactions between Lotus Island and Conch Island. His numerical results indicated that both artificial islands reduced the flow in the main flow direction, but the currents between the islands were accelerated. Different from artificial islands, artificial reefs tend to maintain the flow characteristics and attenuate the waves effectively at the same time [43,44]. The change in wave radiation stress by the wave attenuation across a low crest structure such as natural and artificial reef, breakwater, sand bar and vegetation canopy may lead to a strong current jet at the top of the structure and therefore wave induced circulation pattern around the structure [45,46]. After the rapid constructions of artificial islands and reefs, Jinmeng Bay experienced a tourism boom, but it soon suffered from recurrent green tides [47]. In Figure 1a, massive amounts of green algae accumulate on Jinmeng Beach, and the coastal resort is gloomy from the green tide event on 7 July 2021. The beach is good for coastal tourism under normal clean situations on 24 March 2023 (Figure 1b).
To investigate the responses of the green tides to the coastal engineering projects in Jinmeng Bay, we have examined the influences of the projects on the local hydrodynamic variations, the green tides migration and the water exchange capacity. Although the artificial islands and reefs protected Jinmeng Beach from erosion, these structures weakened the tidal currents in nearshore areas [48,49]. It follows that the water exchange capacity was weakened, and the green algae amplified in Jinmeng Bay [50,51]. Therefore, the weakened tidal actions could alter local water quality and create an appropriate habitat for prevailing green algae. Under this circumstance, it is essential to investigate the distributions of significant nutrients to green algae under current construction conditions. Moreover, their high concentration zones should be marked as the potential sources of green tide events. NO3− is a representative component of DIN for green algae reproduction [23,24], and COD is an integrative indicator of organic matters for green algae generation [52,53]. In the present study, a hydrodynamic-transport coupled model is established for numerical simulations on NO3− and COD to indicate the change of local water quality caused by artificial structures. Two more construction conditions are included for comparison, where further discussion is anchored in quantitative analysis. Furthermore, we aim to provide some suggestions for long-term management.
2. Materials and Methods
2.1. Study Area
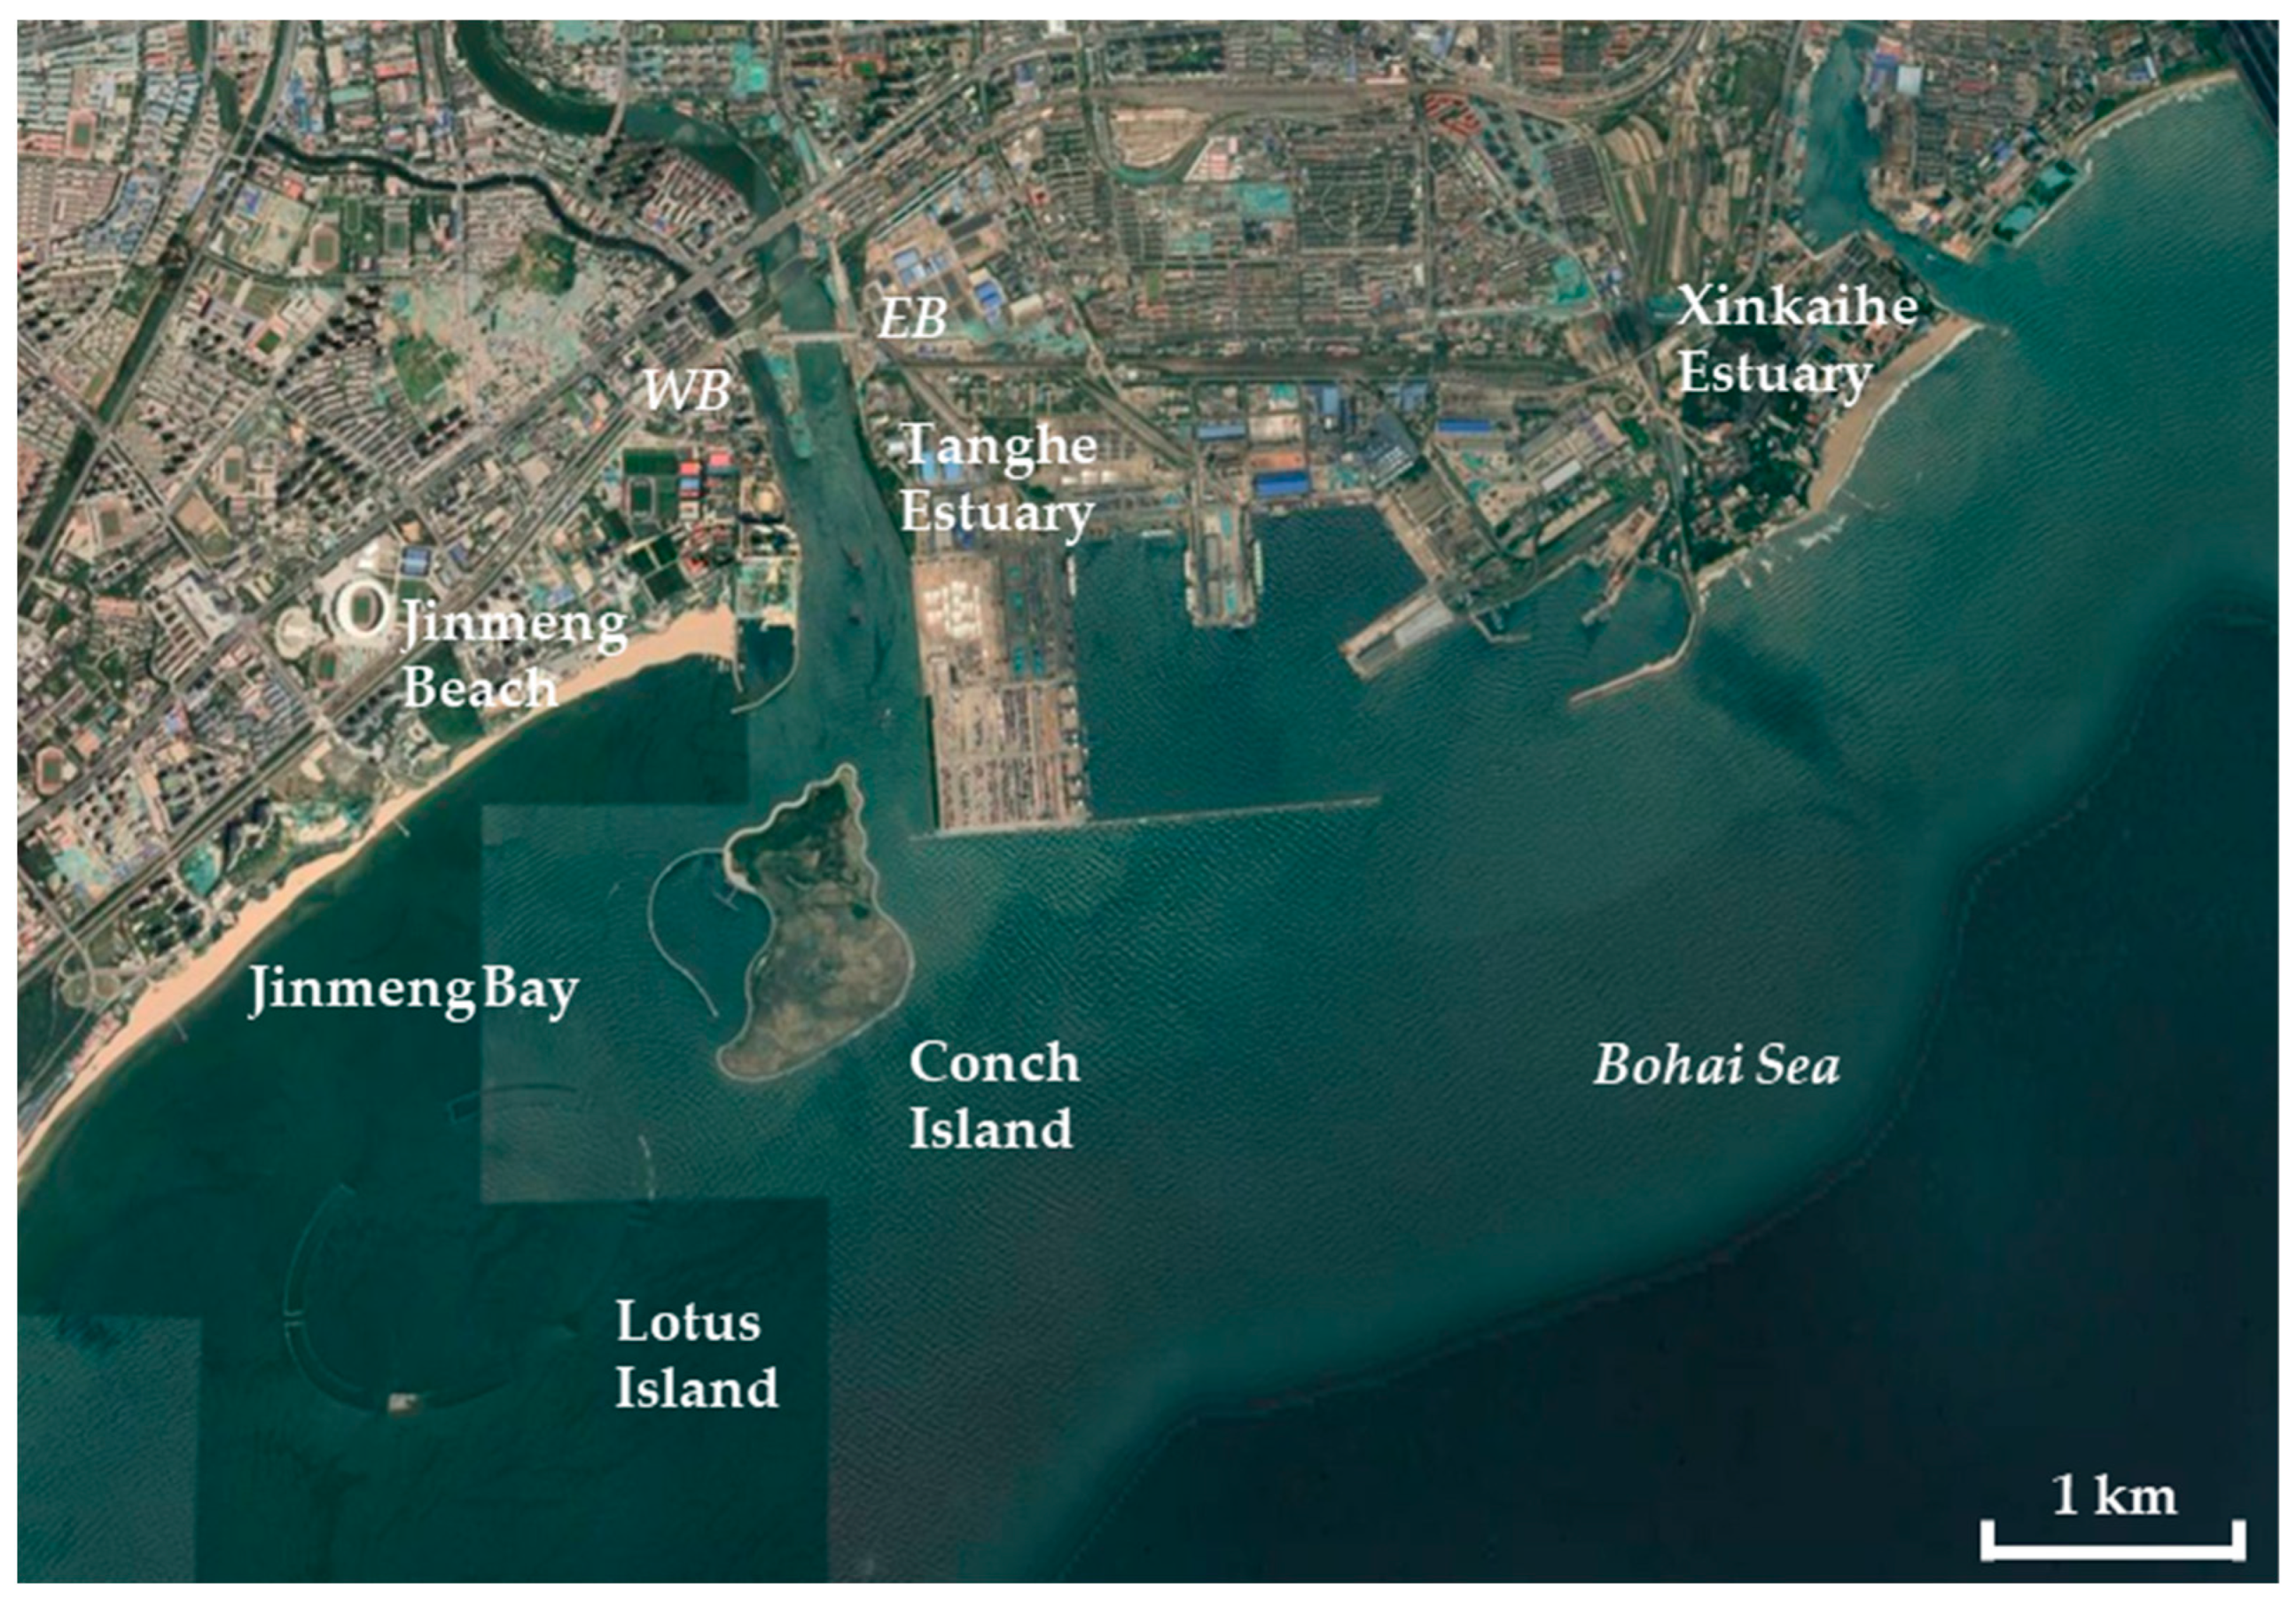
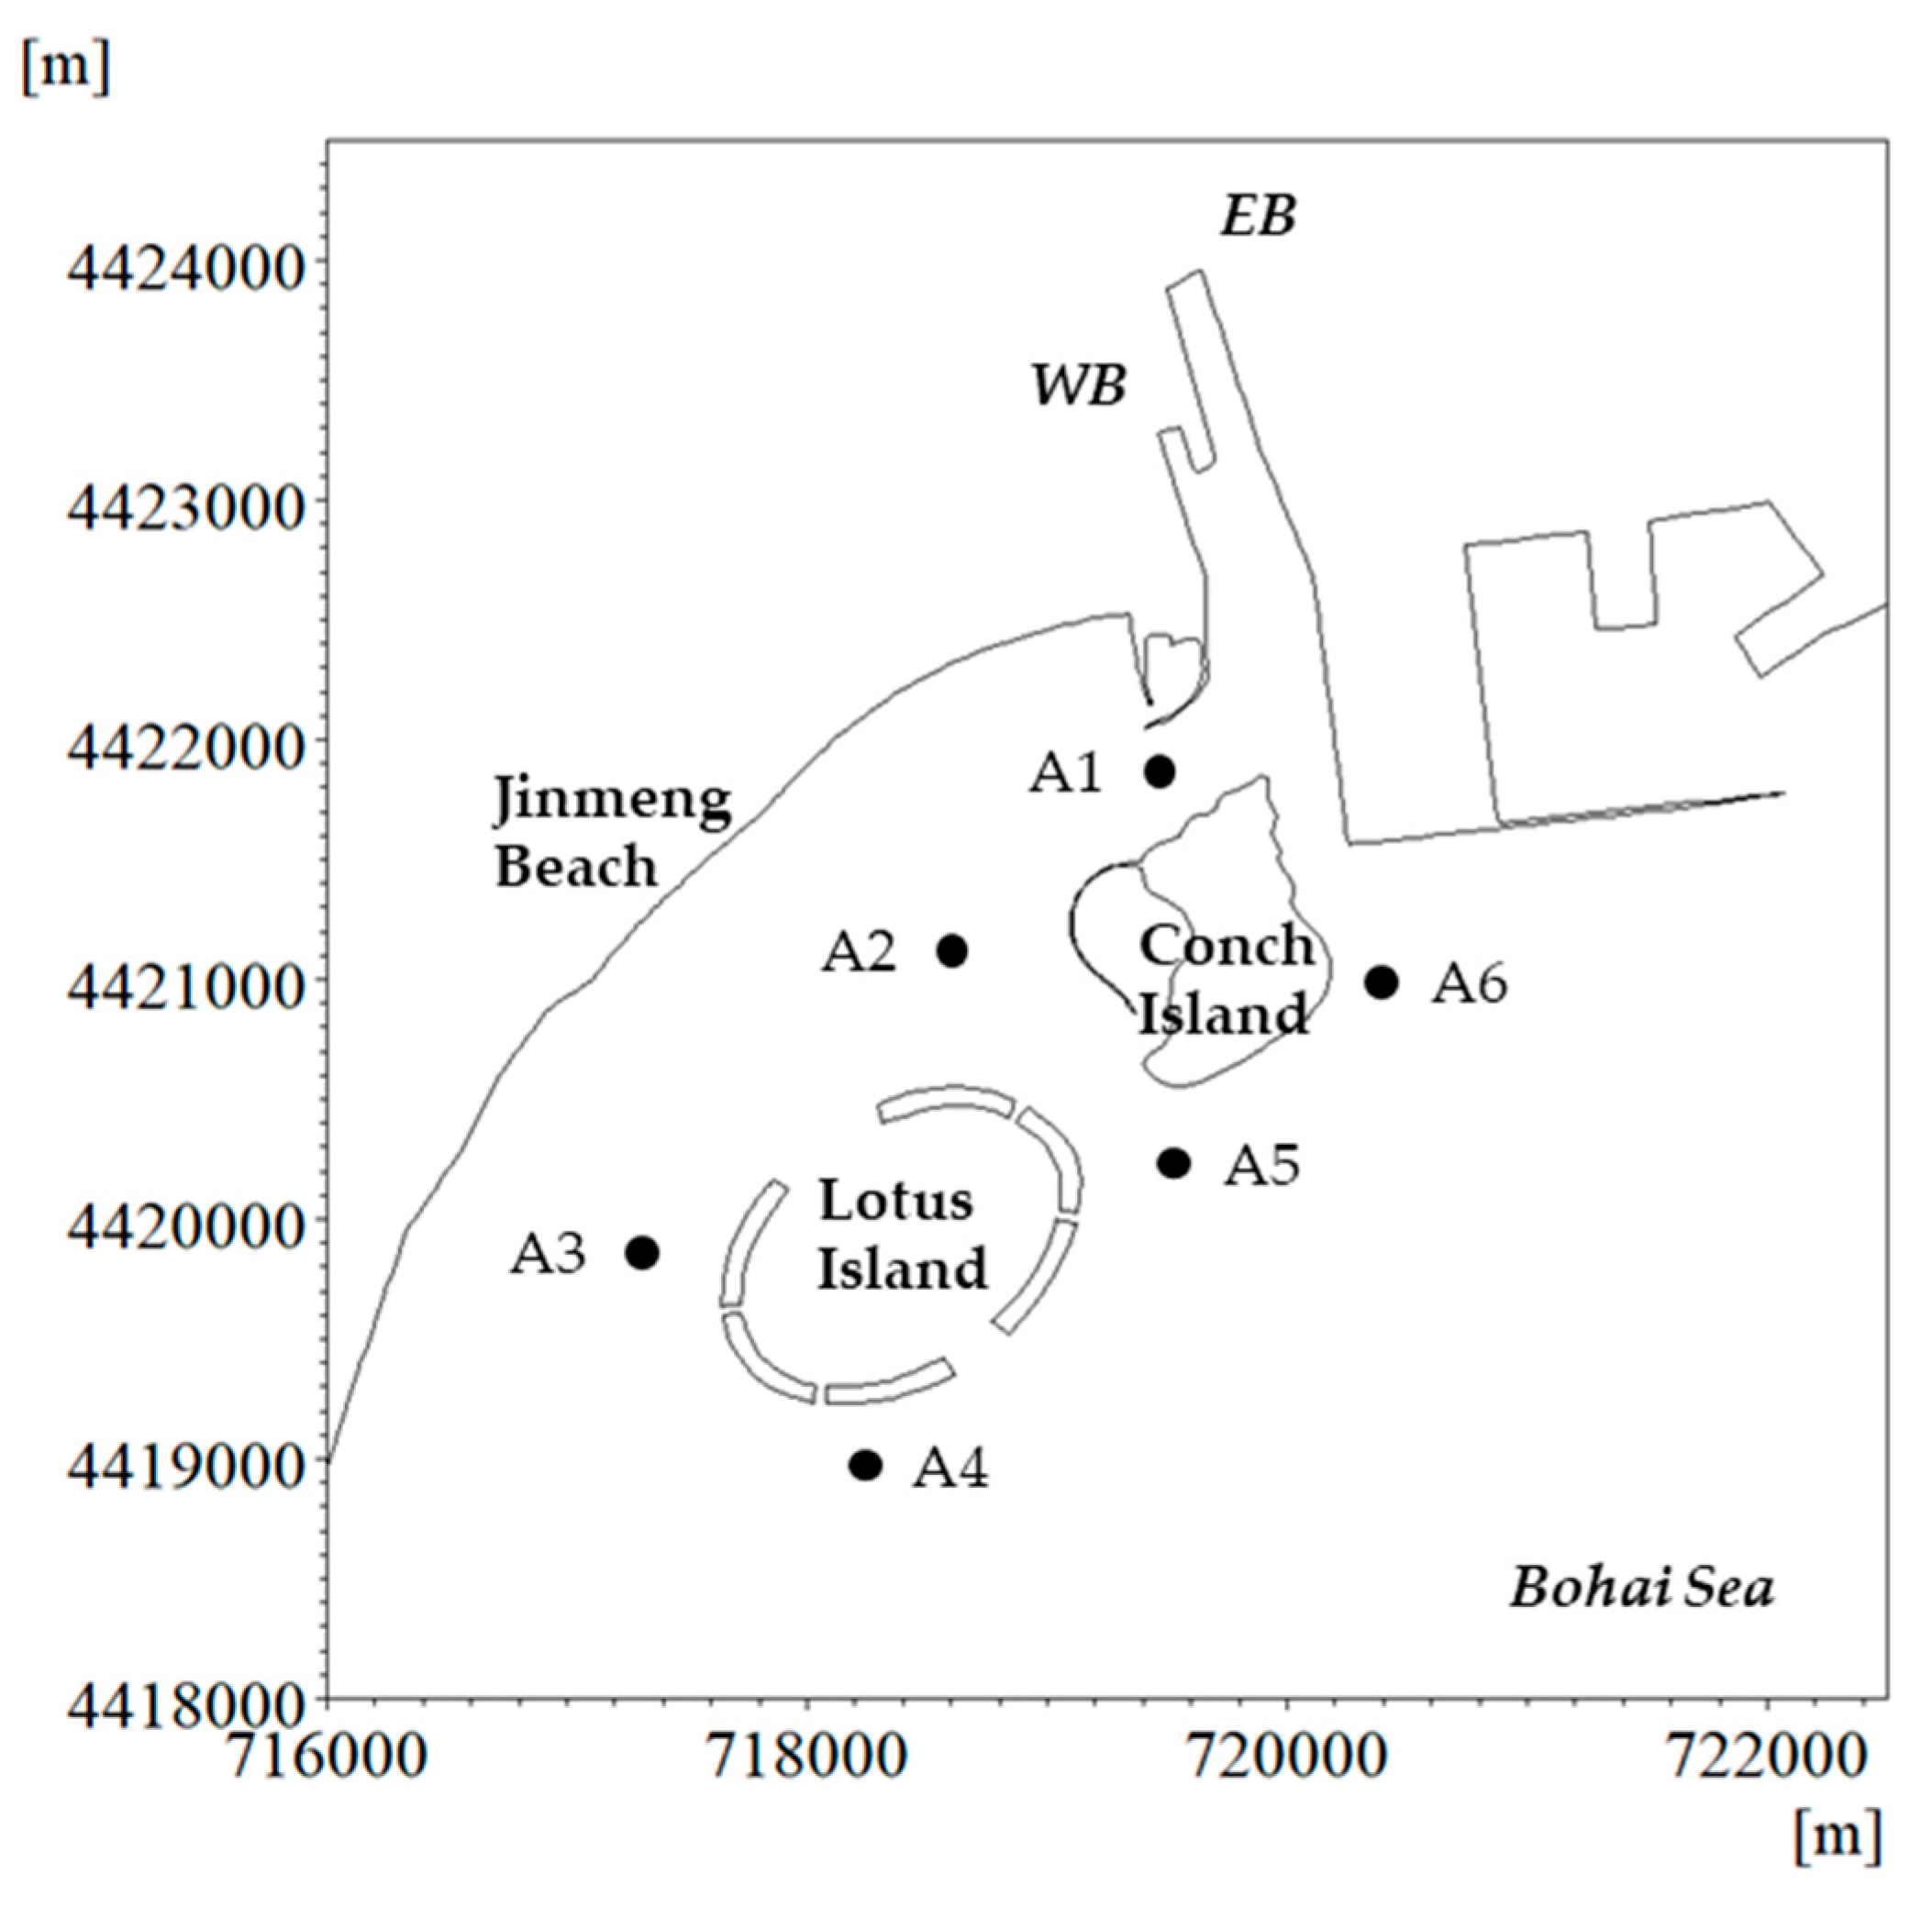
Jinmeng Bay is located on the west coast of the Bohai Sea. As shown in Figure 2, the main coastal engineering projects in the bay include artificial Lotus Island, Conch Island and three submerged reefs along Jinmeng Beach. The Tanghe Estuary and the Xinkaihe Estuary in the research area are ~5 km apart. There are two branches of the Tanghe River, with a total length of 28.5 km. The west branch (WB) is smaller than the east branch (EB).
2.2. Numerical Model
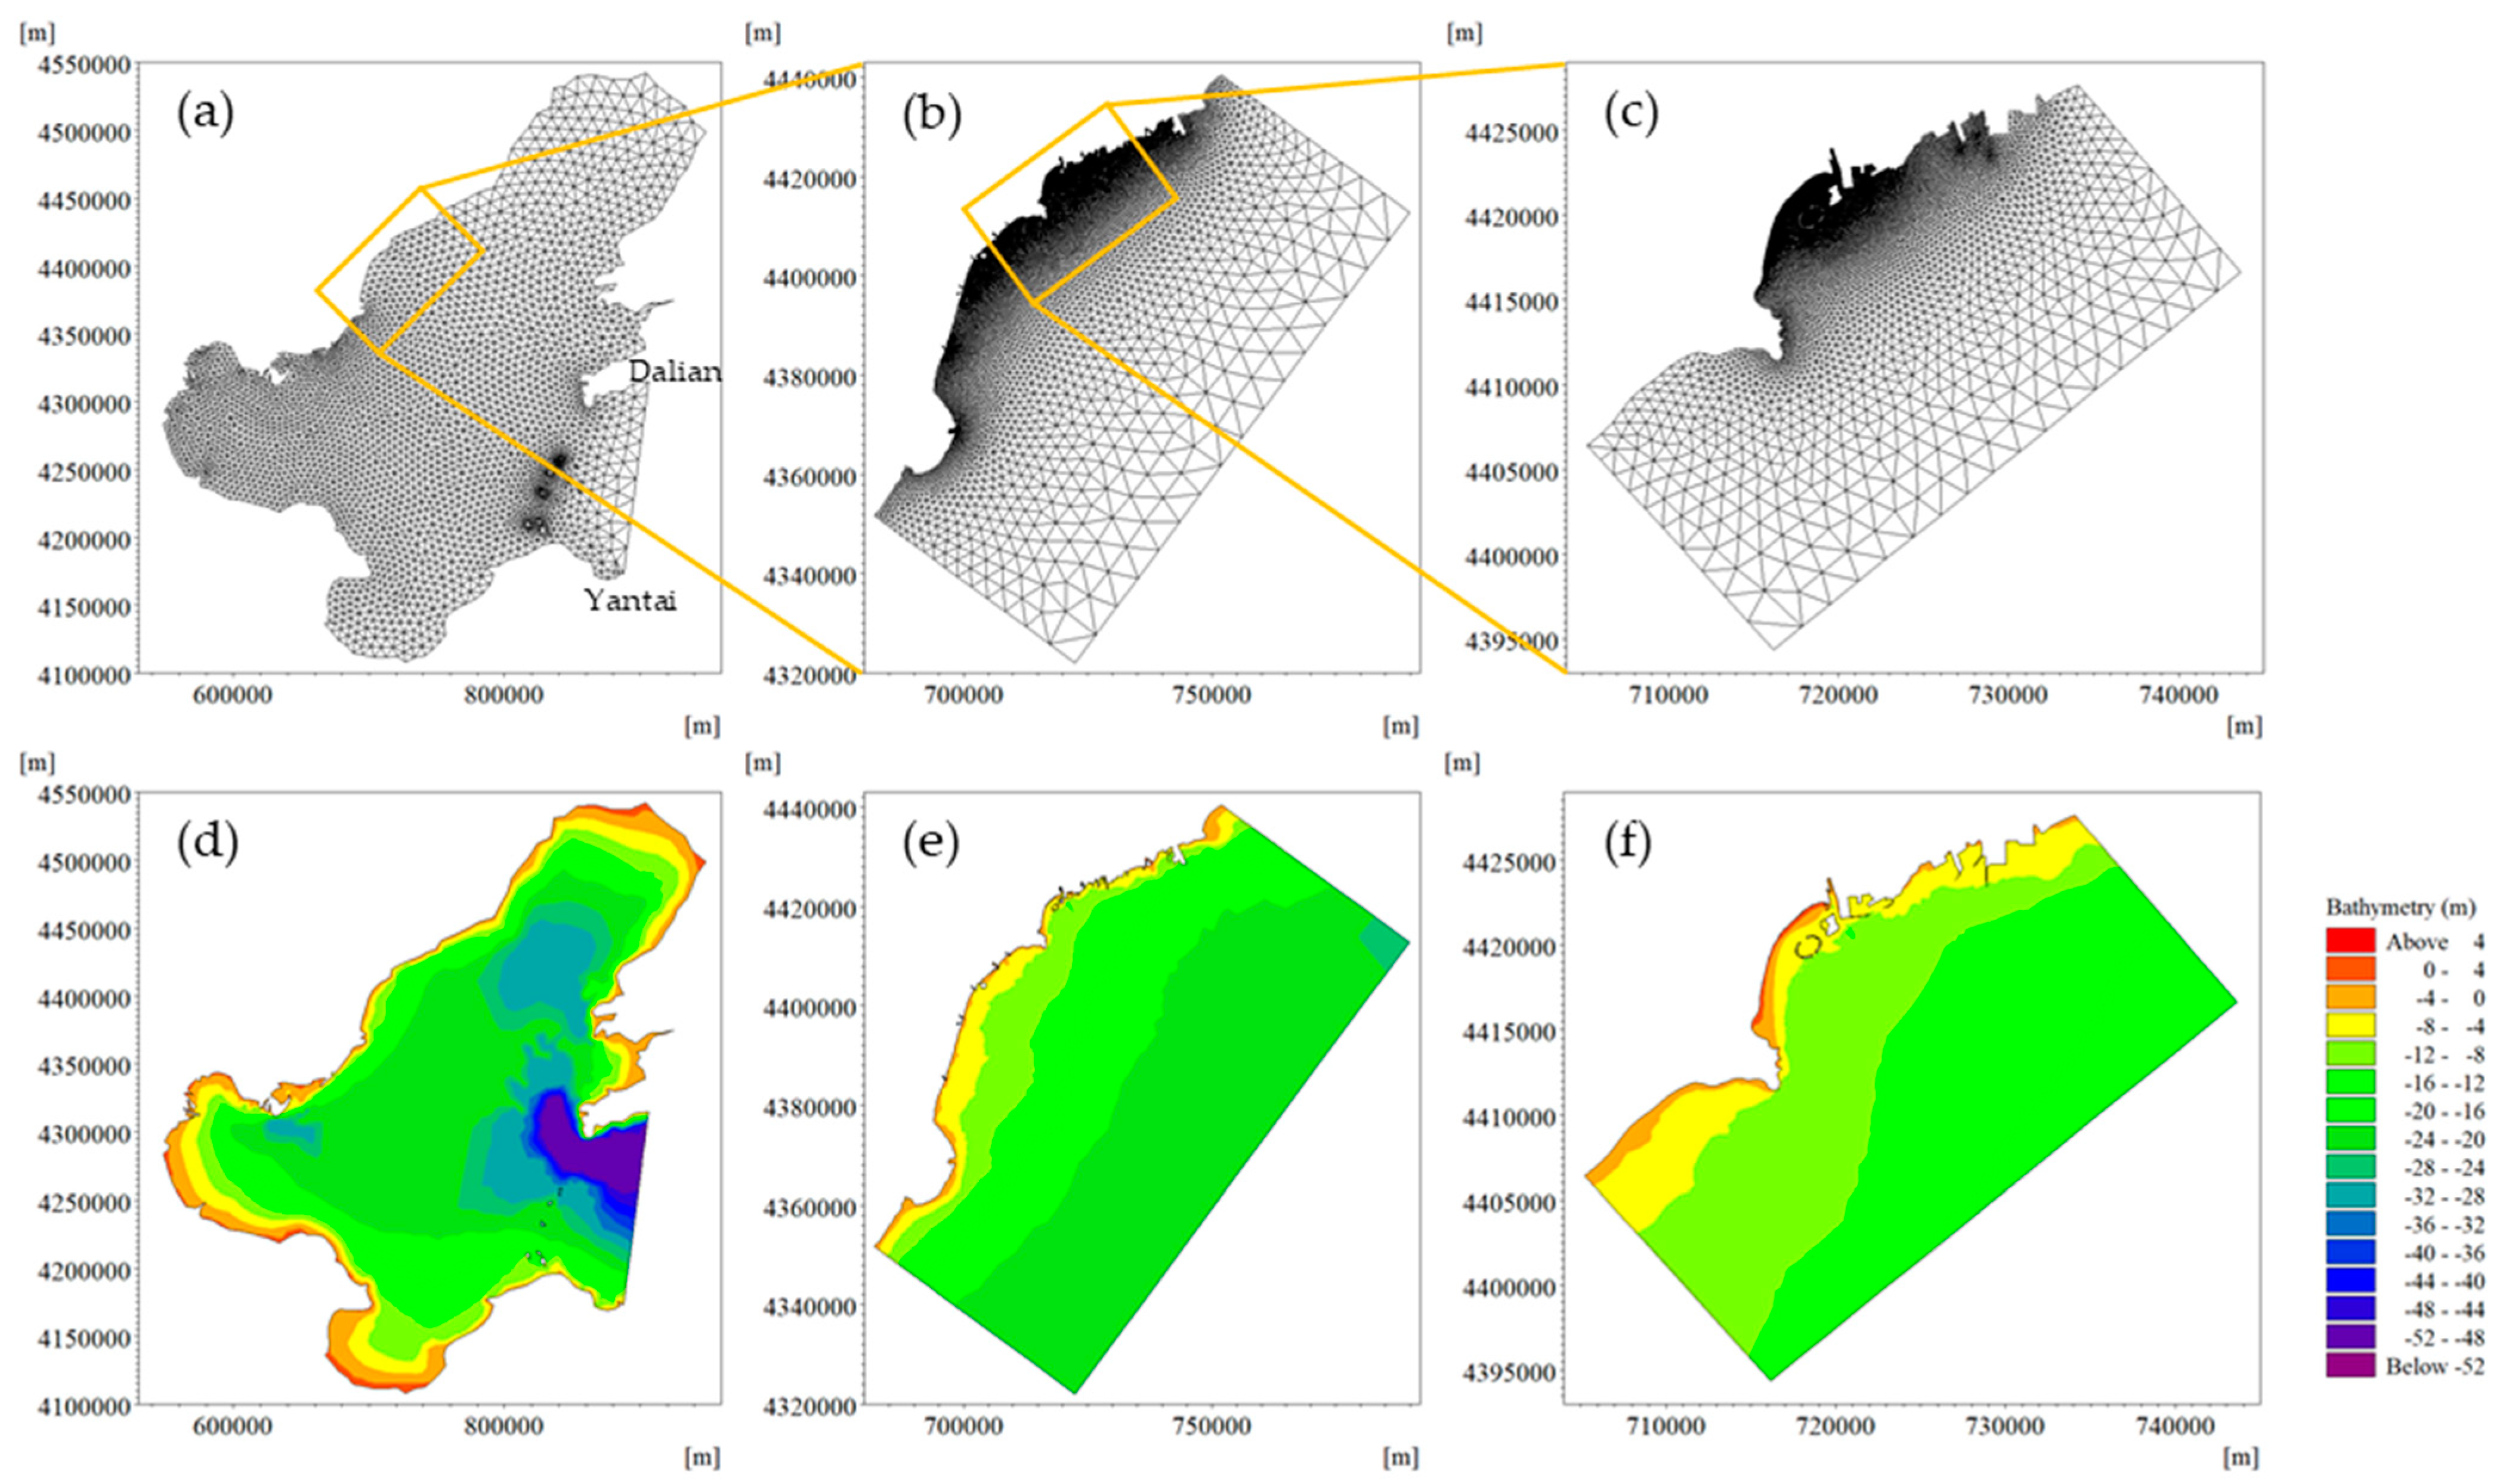
A triple-level scheme of meshes was utilized, including the Bohai Model (Figure 3a), the Qinhuangdao Model (Figure 3b) and the Jinmeng Bay Model (Figure 3c), respectively [51]. The Qinhuangdao Model covered part of the west coast in the Bohai Model, and the Jinmeng Bay Model refined the meshes in the north-west of the Qinhuangdao Model. The models were discretized by triangular unstructured meshes and based on the Gauss–Kruger projection coordinates of the Beijing 54 Coordinate System, with a central meridian of 117E. Table 1 shows details of the models. As the first-level model, the Bohai Model was driven by hourly tidal levels at Dalian and Yantai from the tidal table of the National Marine Data and Information Service of China. The boundaries of the Qinhuangdao Model (the second-level) and the Jinmeng Bay Model (the third-level) were driven by the Flather conditions, where water level, current speed and direction were extracted from the numerical results of the higher-level model with coarser meshes.
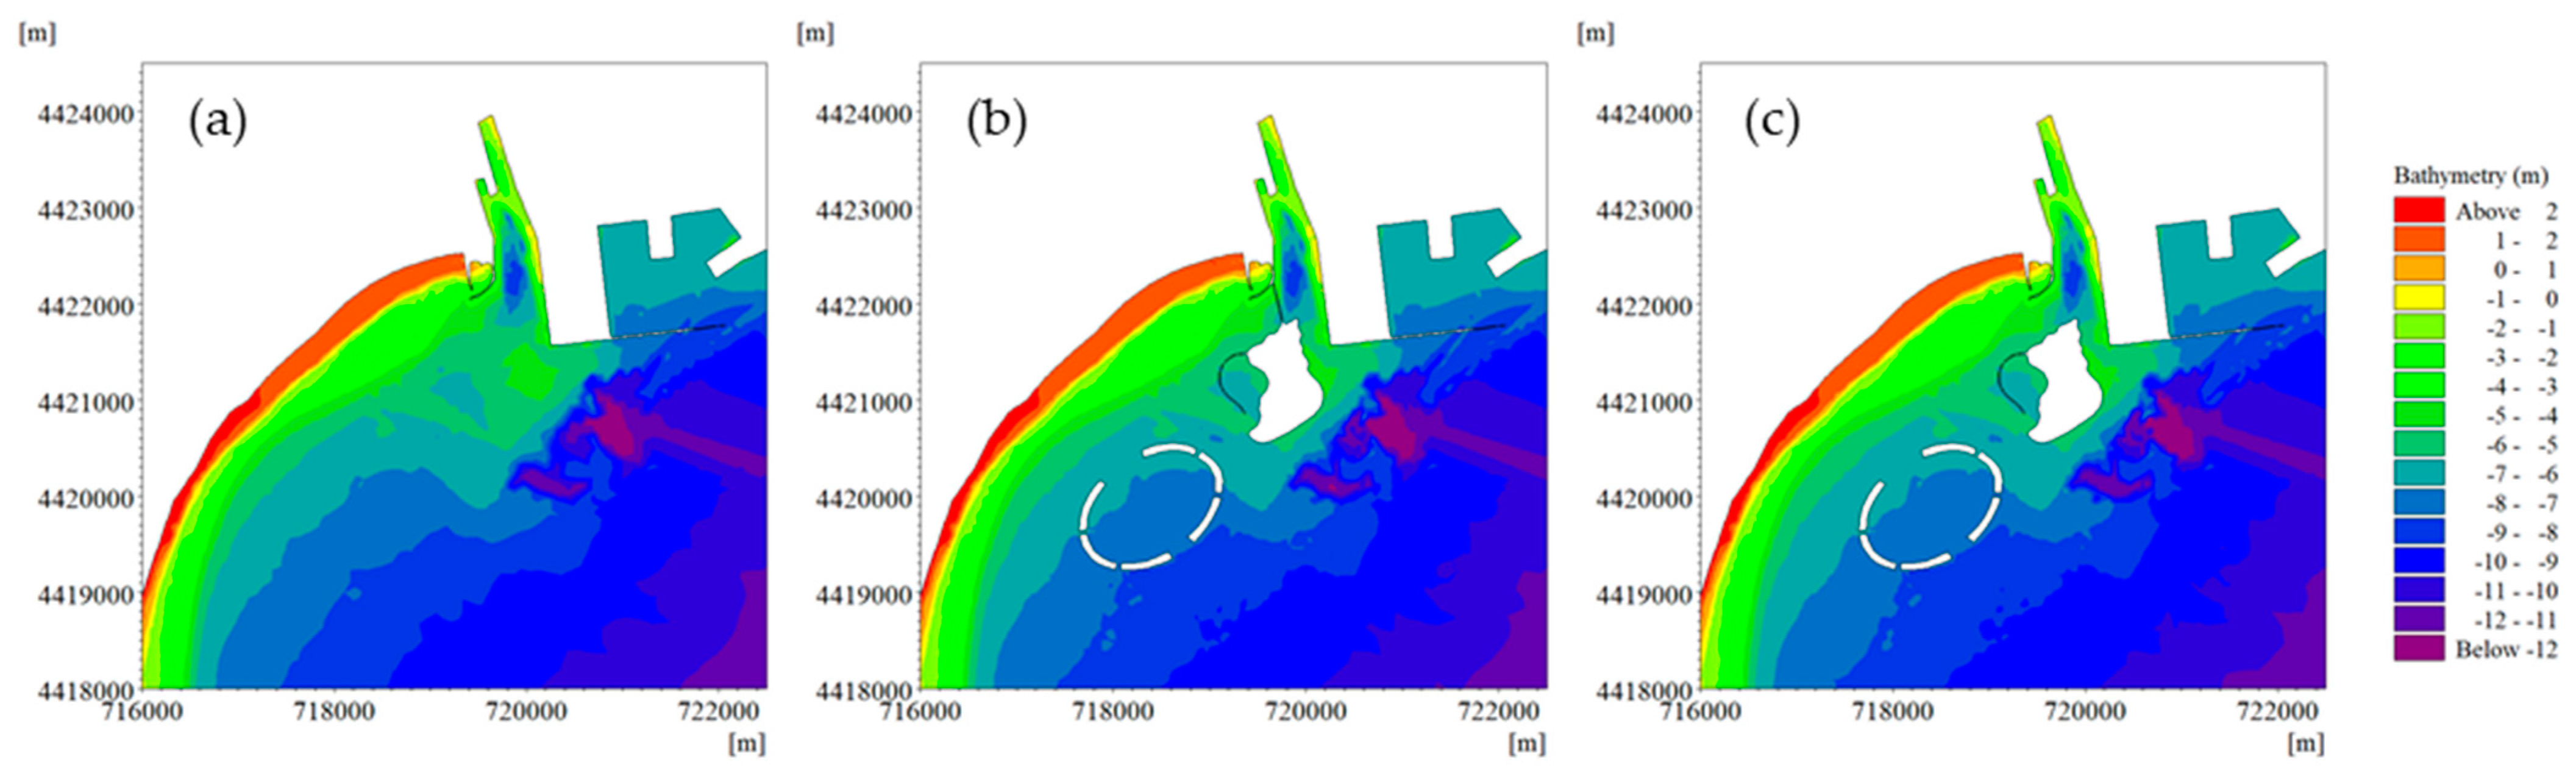
The water quality in Jinmeng Bay is simulated based on the current construction conditions, then the impacts on the water quality of the construction conditions in different periods can be further discussed. Figure 4 shows details of the different stage of construction conditions. The initial construction conditions represented the situations in April 2013 when Jinmeng Bay was an open coast without artificial islands and reefs until 2015. The first-stage construction conditions represent the completed constructions of Lotus Island and Conch Island, and the connection road between the islands and the coast and artificial reefs in October 2015. After 2018, the connection road of Conch Island was dismantled, leading to the current construction conditions as of December 2020.
The MIKE 21 Flow Model (developed by Danish Hydraulic Institute, DHI) was utilized to investigate the hydrodynamics at different stage of the aforementioned coastal engineering project. The governing equations and the validations of the present hydrodynamic model can be found in our previous papers [51]. The transport model of water quality properties was based on advection–dispersion equation as follows:
where is the total water depth, and are the depth-averaged velocity components in the and direction, is the depth average concentration, is the horizontal diffusion term, is the linear decay rate, is the concentration at the source and is the magnitude of the source. The horizontal diffusion term (), also known as eddy dispersion or turbulent diffusion, is related to Equation (2).
where is the horizontal dispersion coefficient, which depends on the horizontal eddy viscosity, .
where is Prandlt number. Dispersion coefficient formulation was selected for the following simulations, where was set as a constant, 0.02 m2/s.
2.3. Model Set-Up
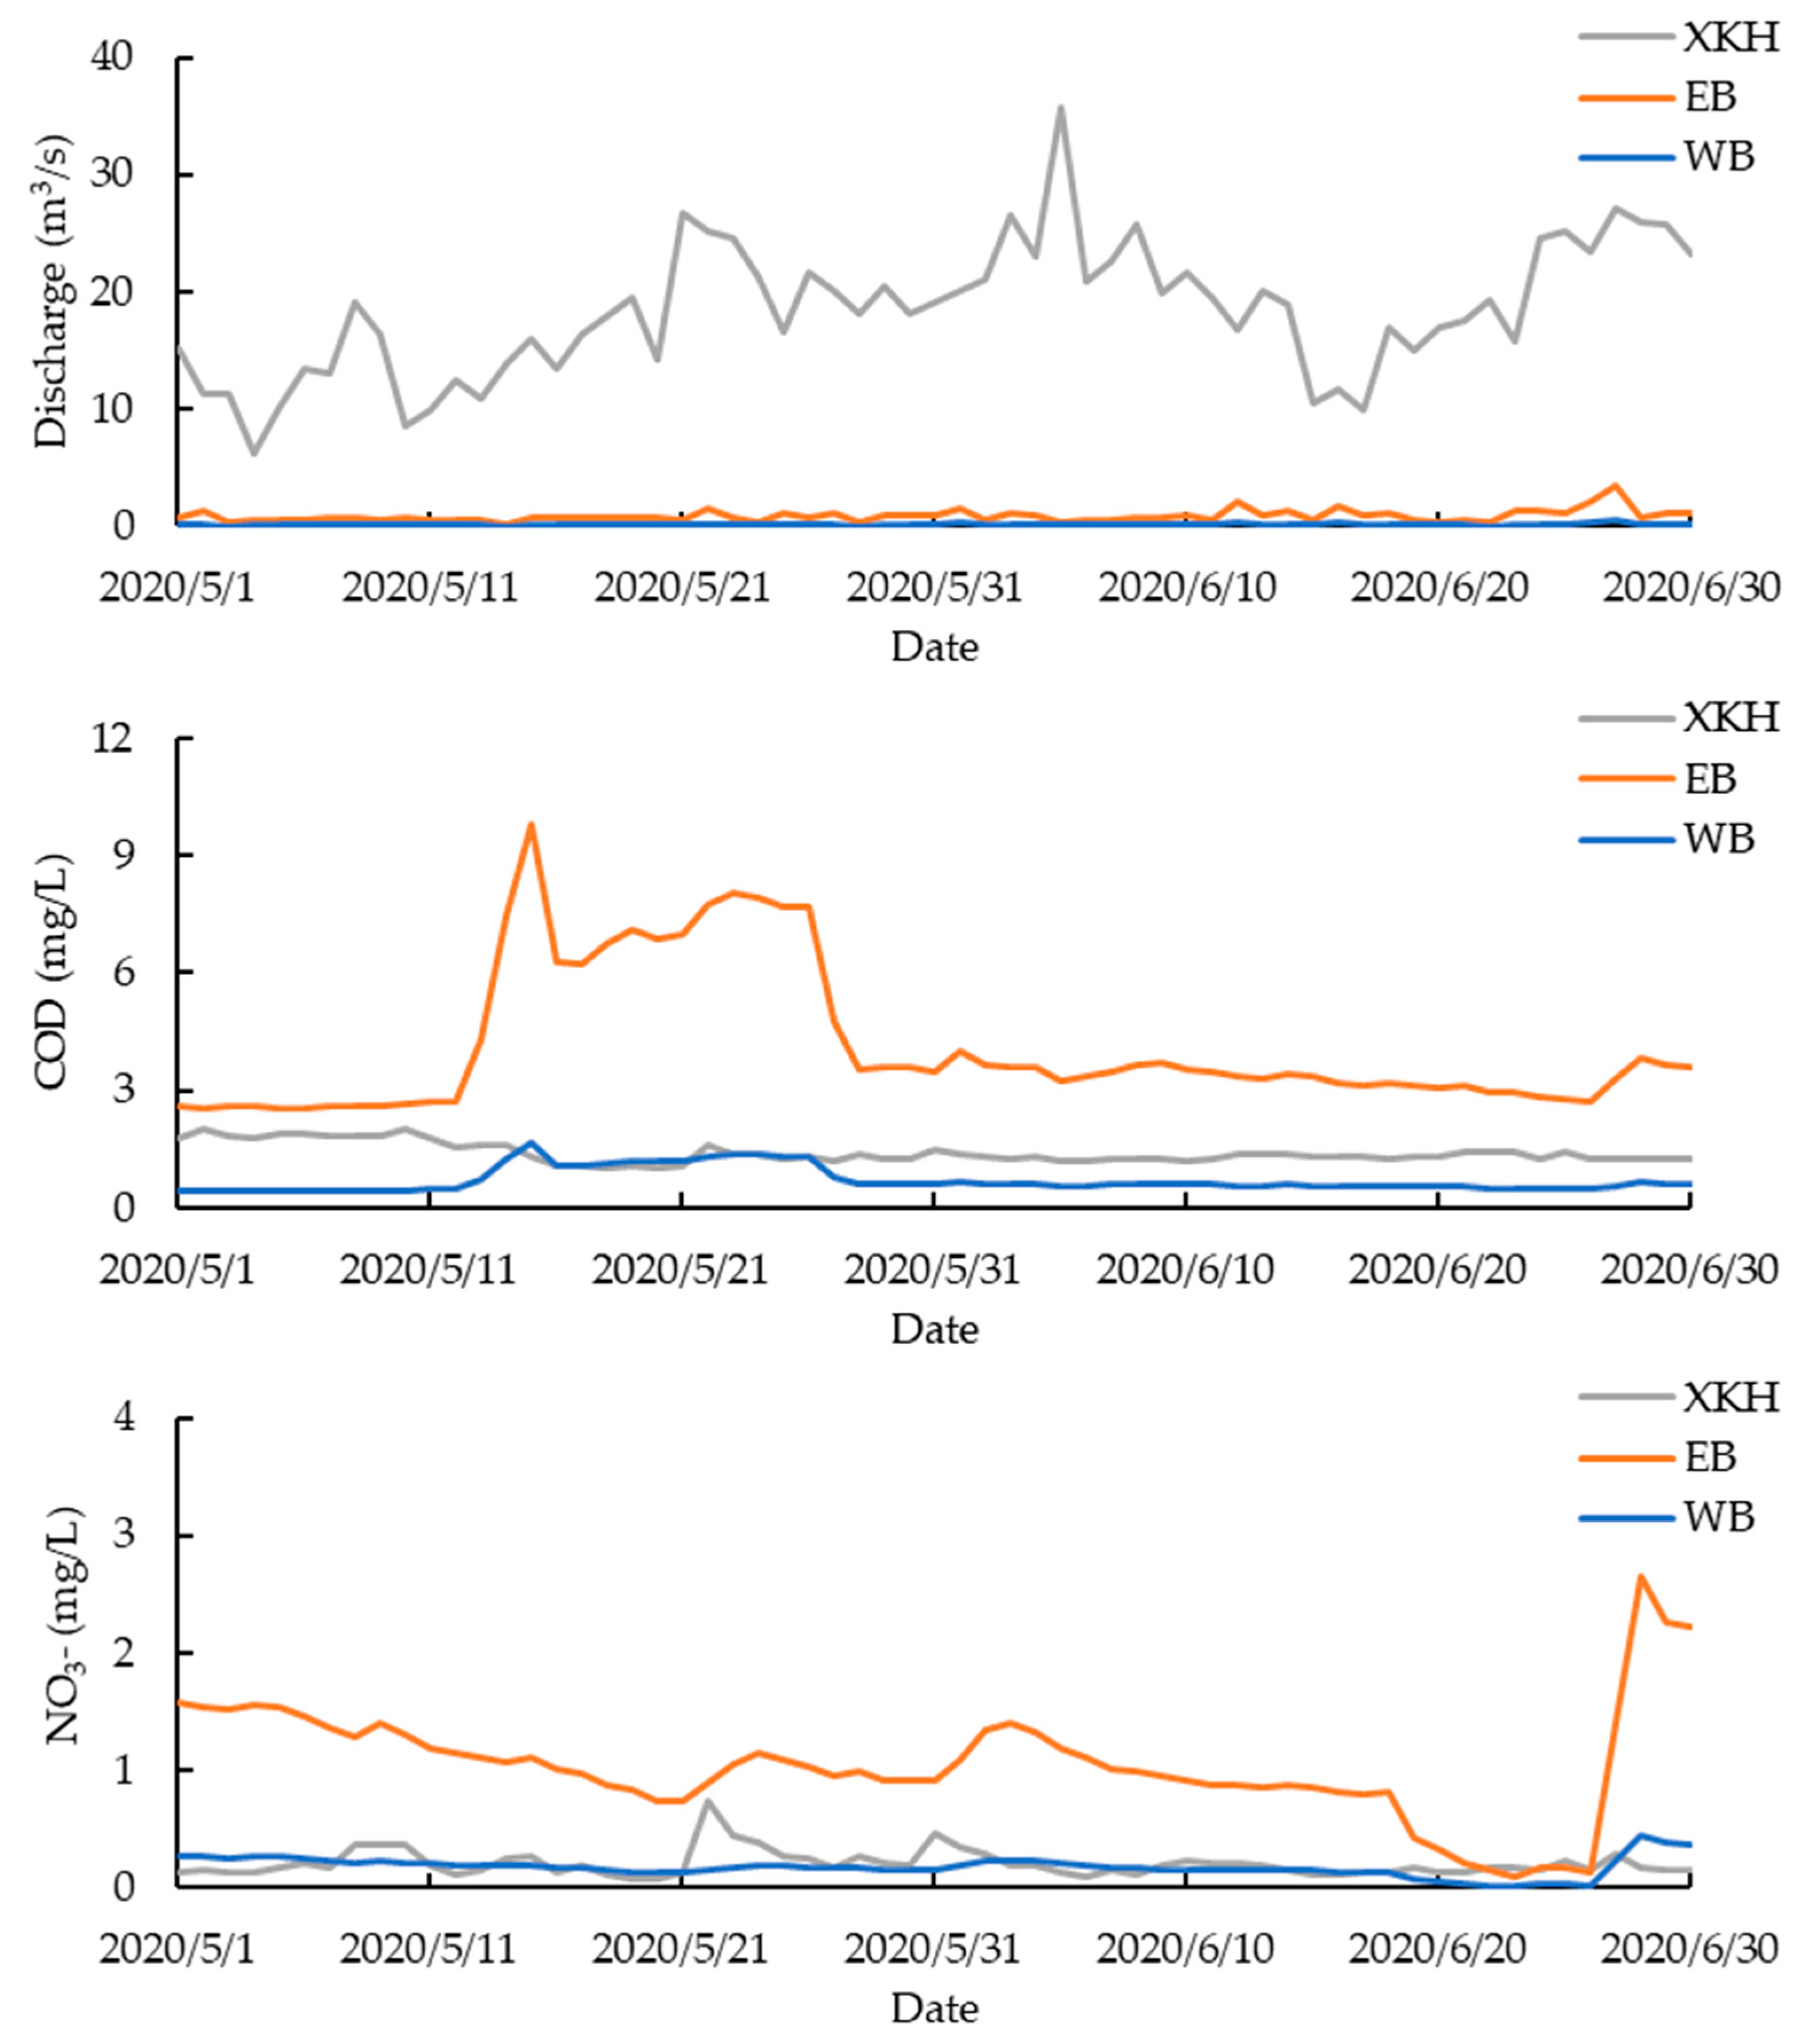
The wind data at 10-metre height above mean sea level was collected from the ERA5 database by the European Centre for Medium-Range Weather Forecasts (https://cds.climate.copernicus.eu/cdsapp#!/home (accessed on 27 February 2023)). For the hydrodynamic model, the flooding and drying fronts were used for model solution, where dry depth, flood depth and wet depth were set as 0.005 m, 0.05 m and 0.1 m, respectively. The Smagorinsky coefficient for horizontal eddy viscosity was 0.28. The Manning number was set as 74 m1/3/s. The Coriolis force was included in the governing equation. The river boundaries were driven by mean monthly discharge collected in 2013, where the discharge data of WB, EB and the Xinkaihe River were updated by observations in 2020. Figure 5 shows the daily discharge data of the discharges, and the influx of COD and NO3− from WB, EB and Xinkaihe River. The initial concentrations of COD and NO3− were set as 1.2 mg/L and 0.05 mg/L, respectively.
2.4. Validation
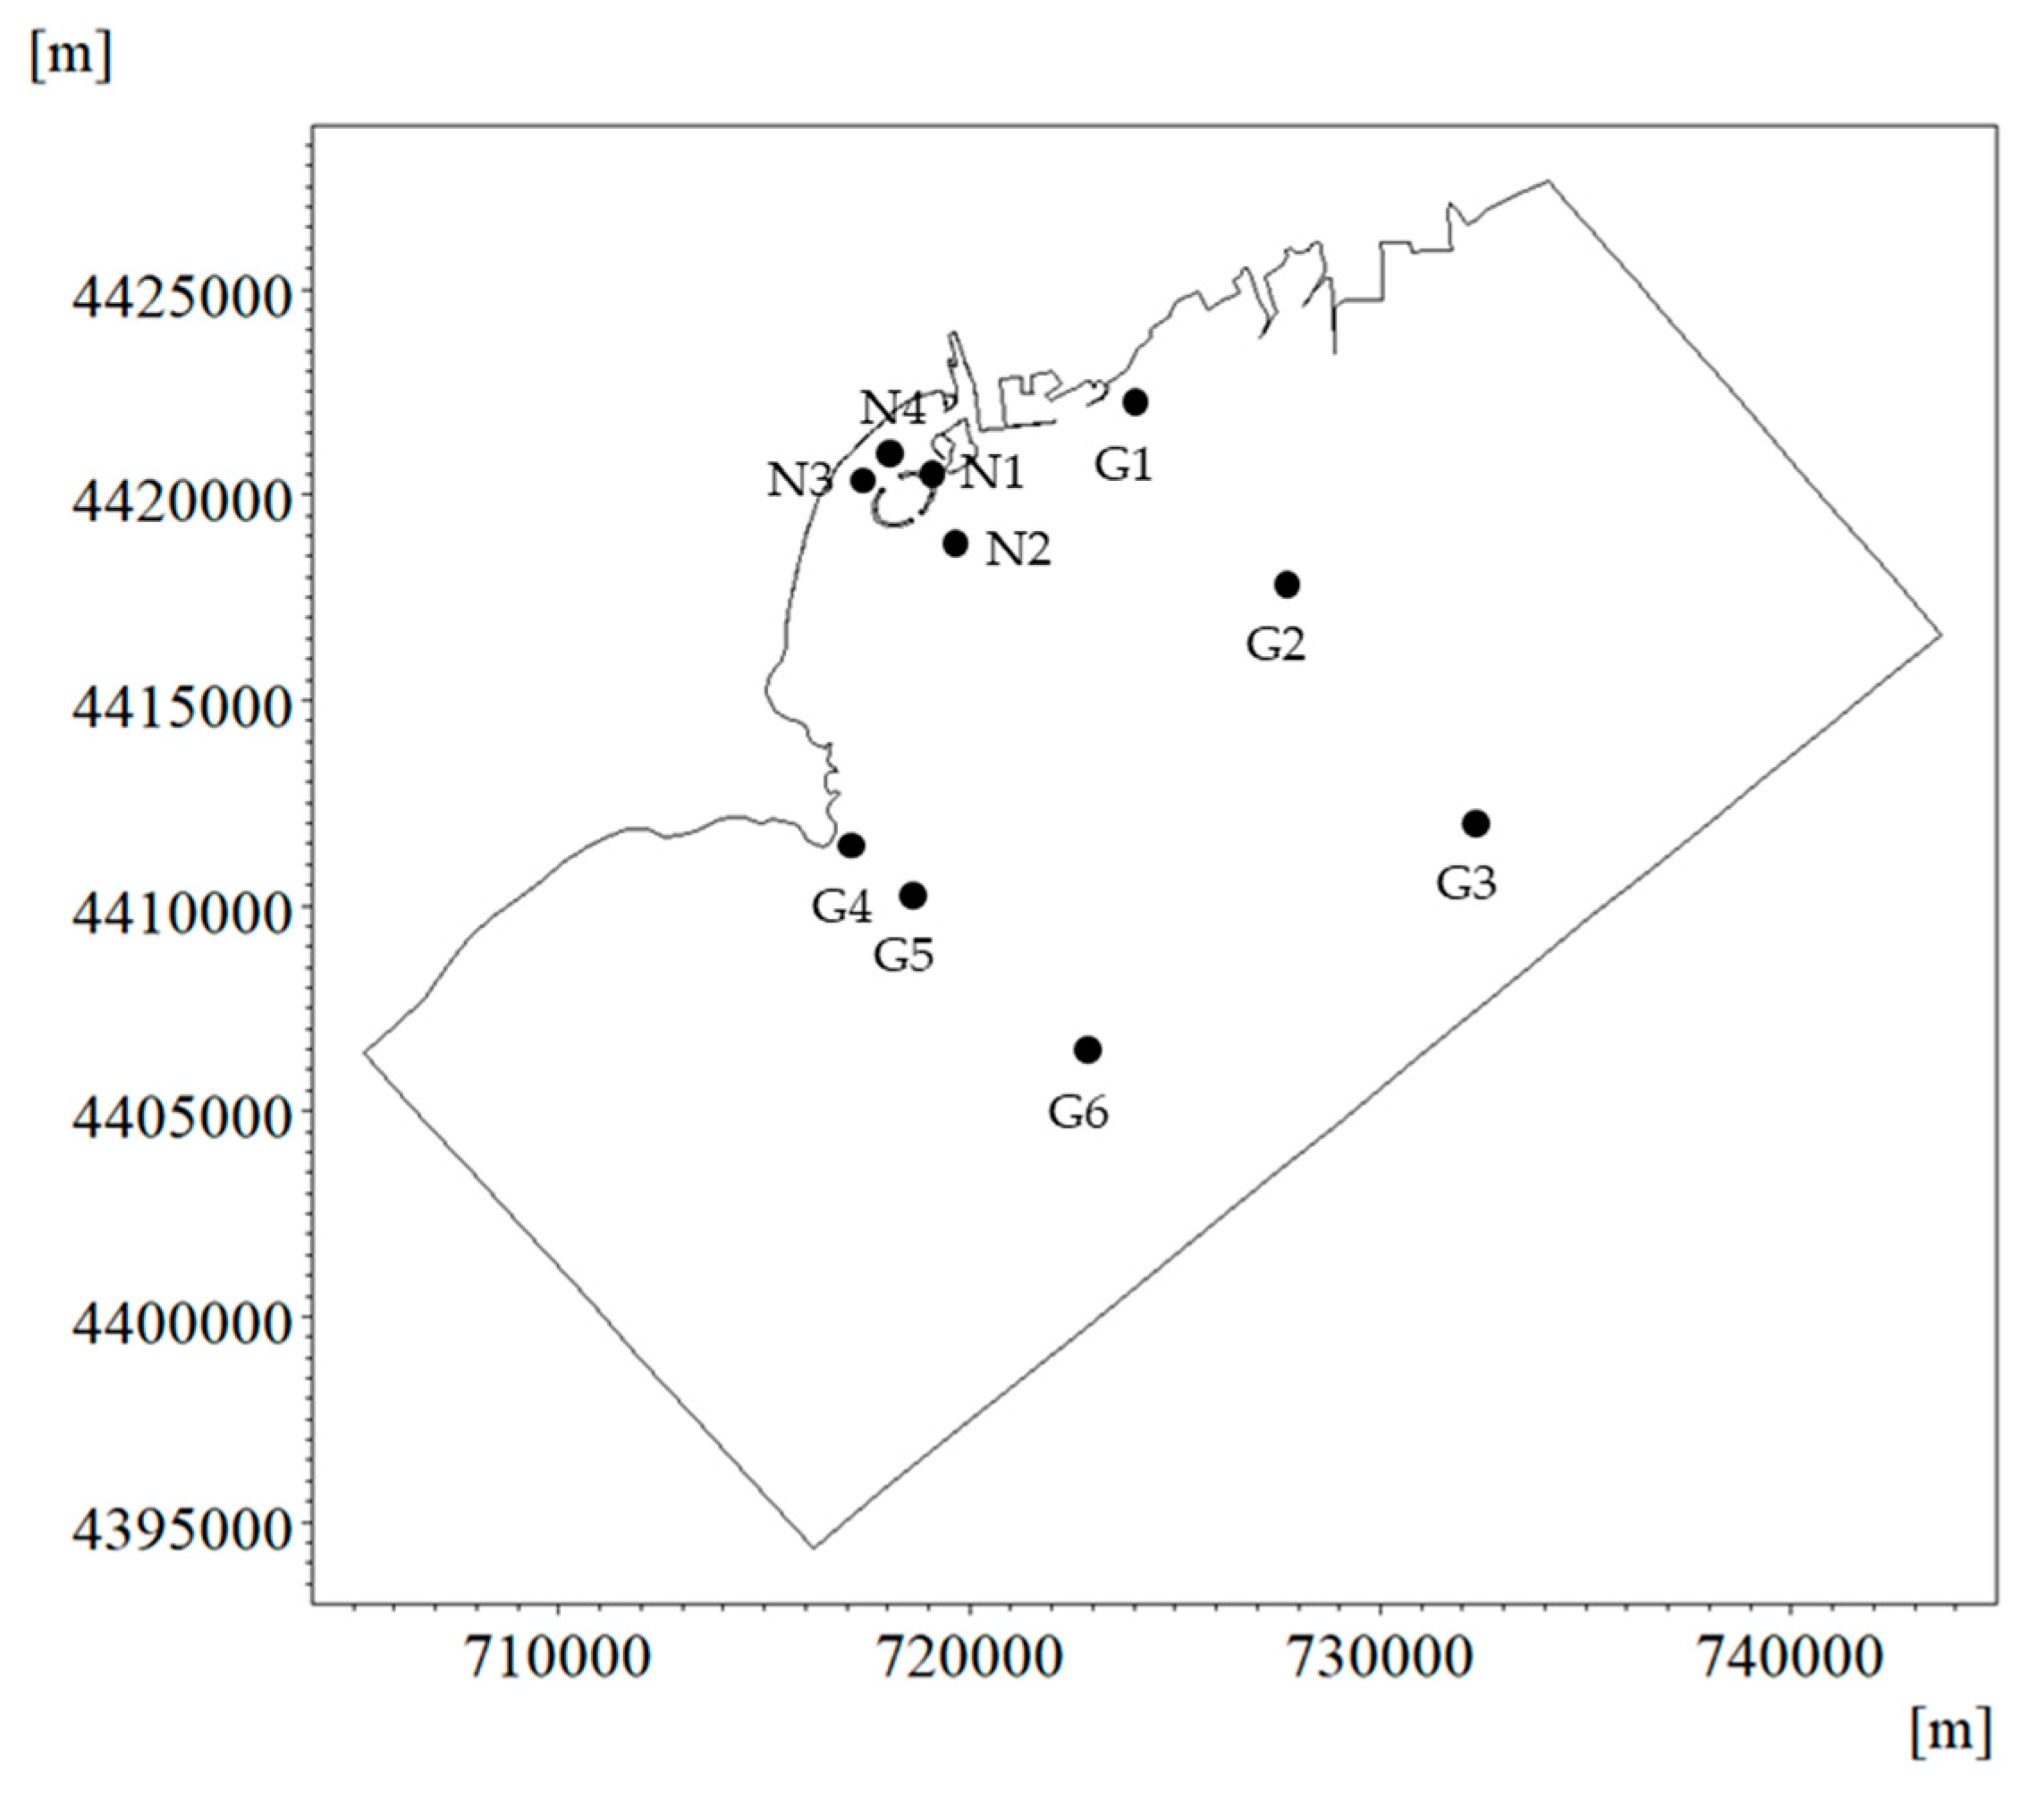
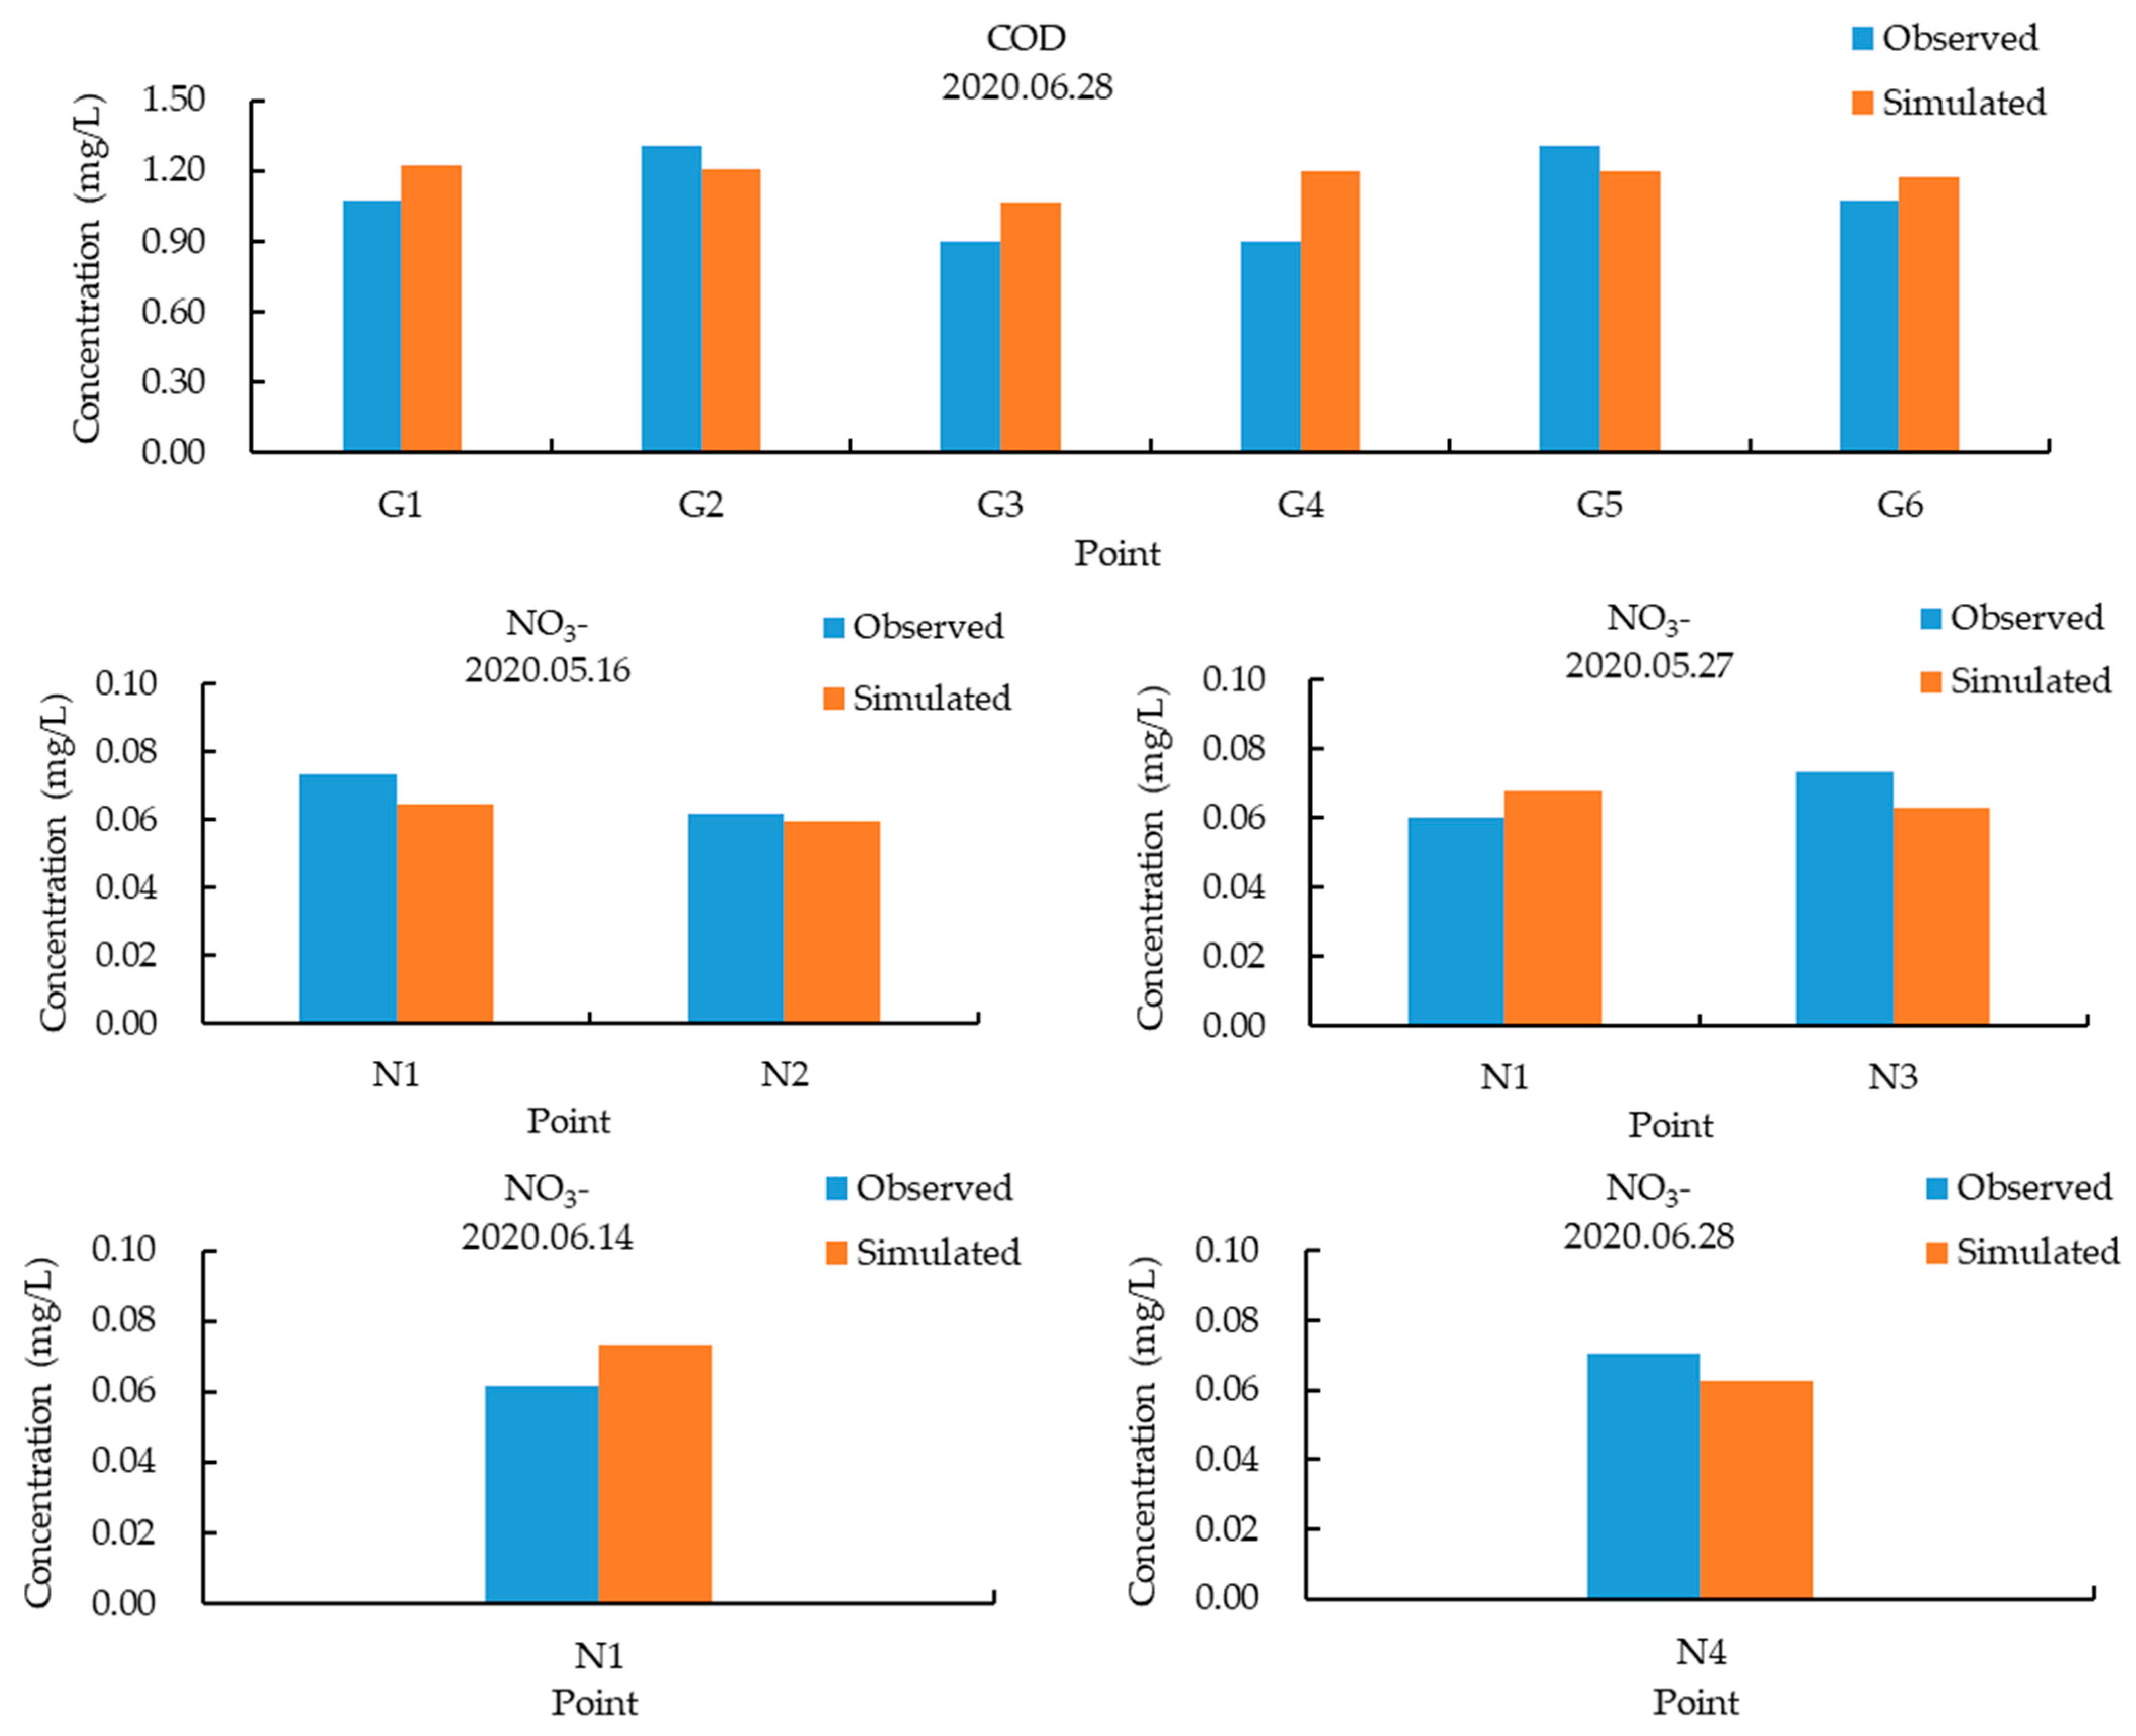
The predicted concentrations of COD and NO3− were validated by observations in 2020. Figure 6 shows the field observation sites G1~G6 for COD and N1~N4 for NO3−. The observation sites of NO3− were around Lotus Island, while the sites of COD were in the offshore zones. As shown in Figure 7, the simulated results are consistent with the trends of the observations. The observations were collected once a day, while the simulated results were averaged values in a day, which causes part of the model-data discrepancy. According to Table 2, the relative errors at G4 were up to 33.5%. G4 was close to the coast, where the hydrodynamic conditions were more variable, so the averaged value of the simulated result was lower than that on the other sites. Apart from G4, the relative model errors at the other observation sites were below 20%, where the transport model is expected to predict the distribution characteristics of COD and NO3− reasonably well.
3. Results
3.1. Hydrodynamic Characteristics
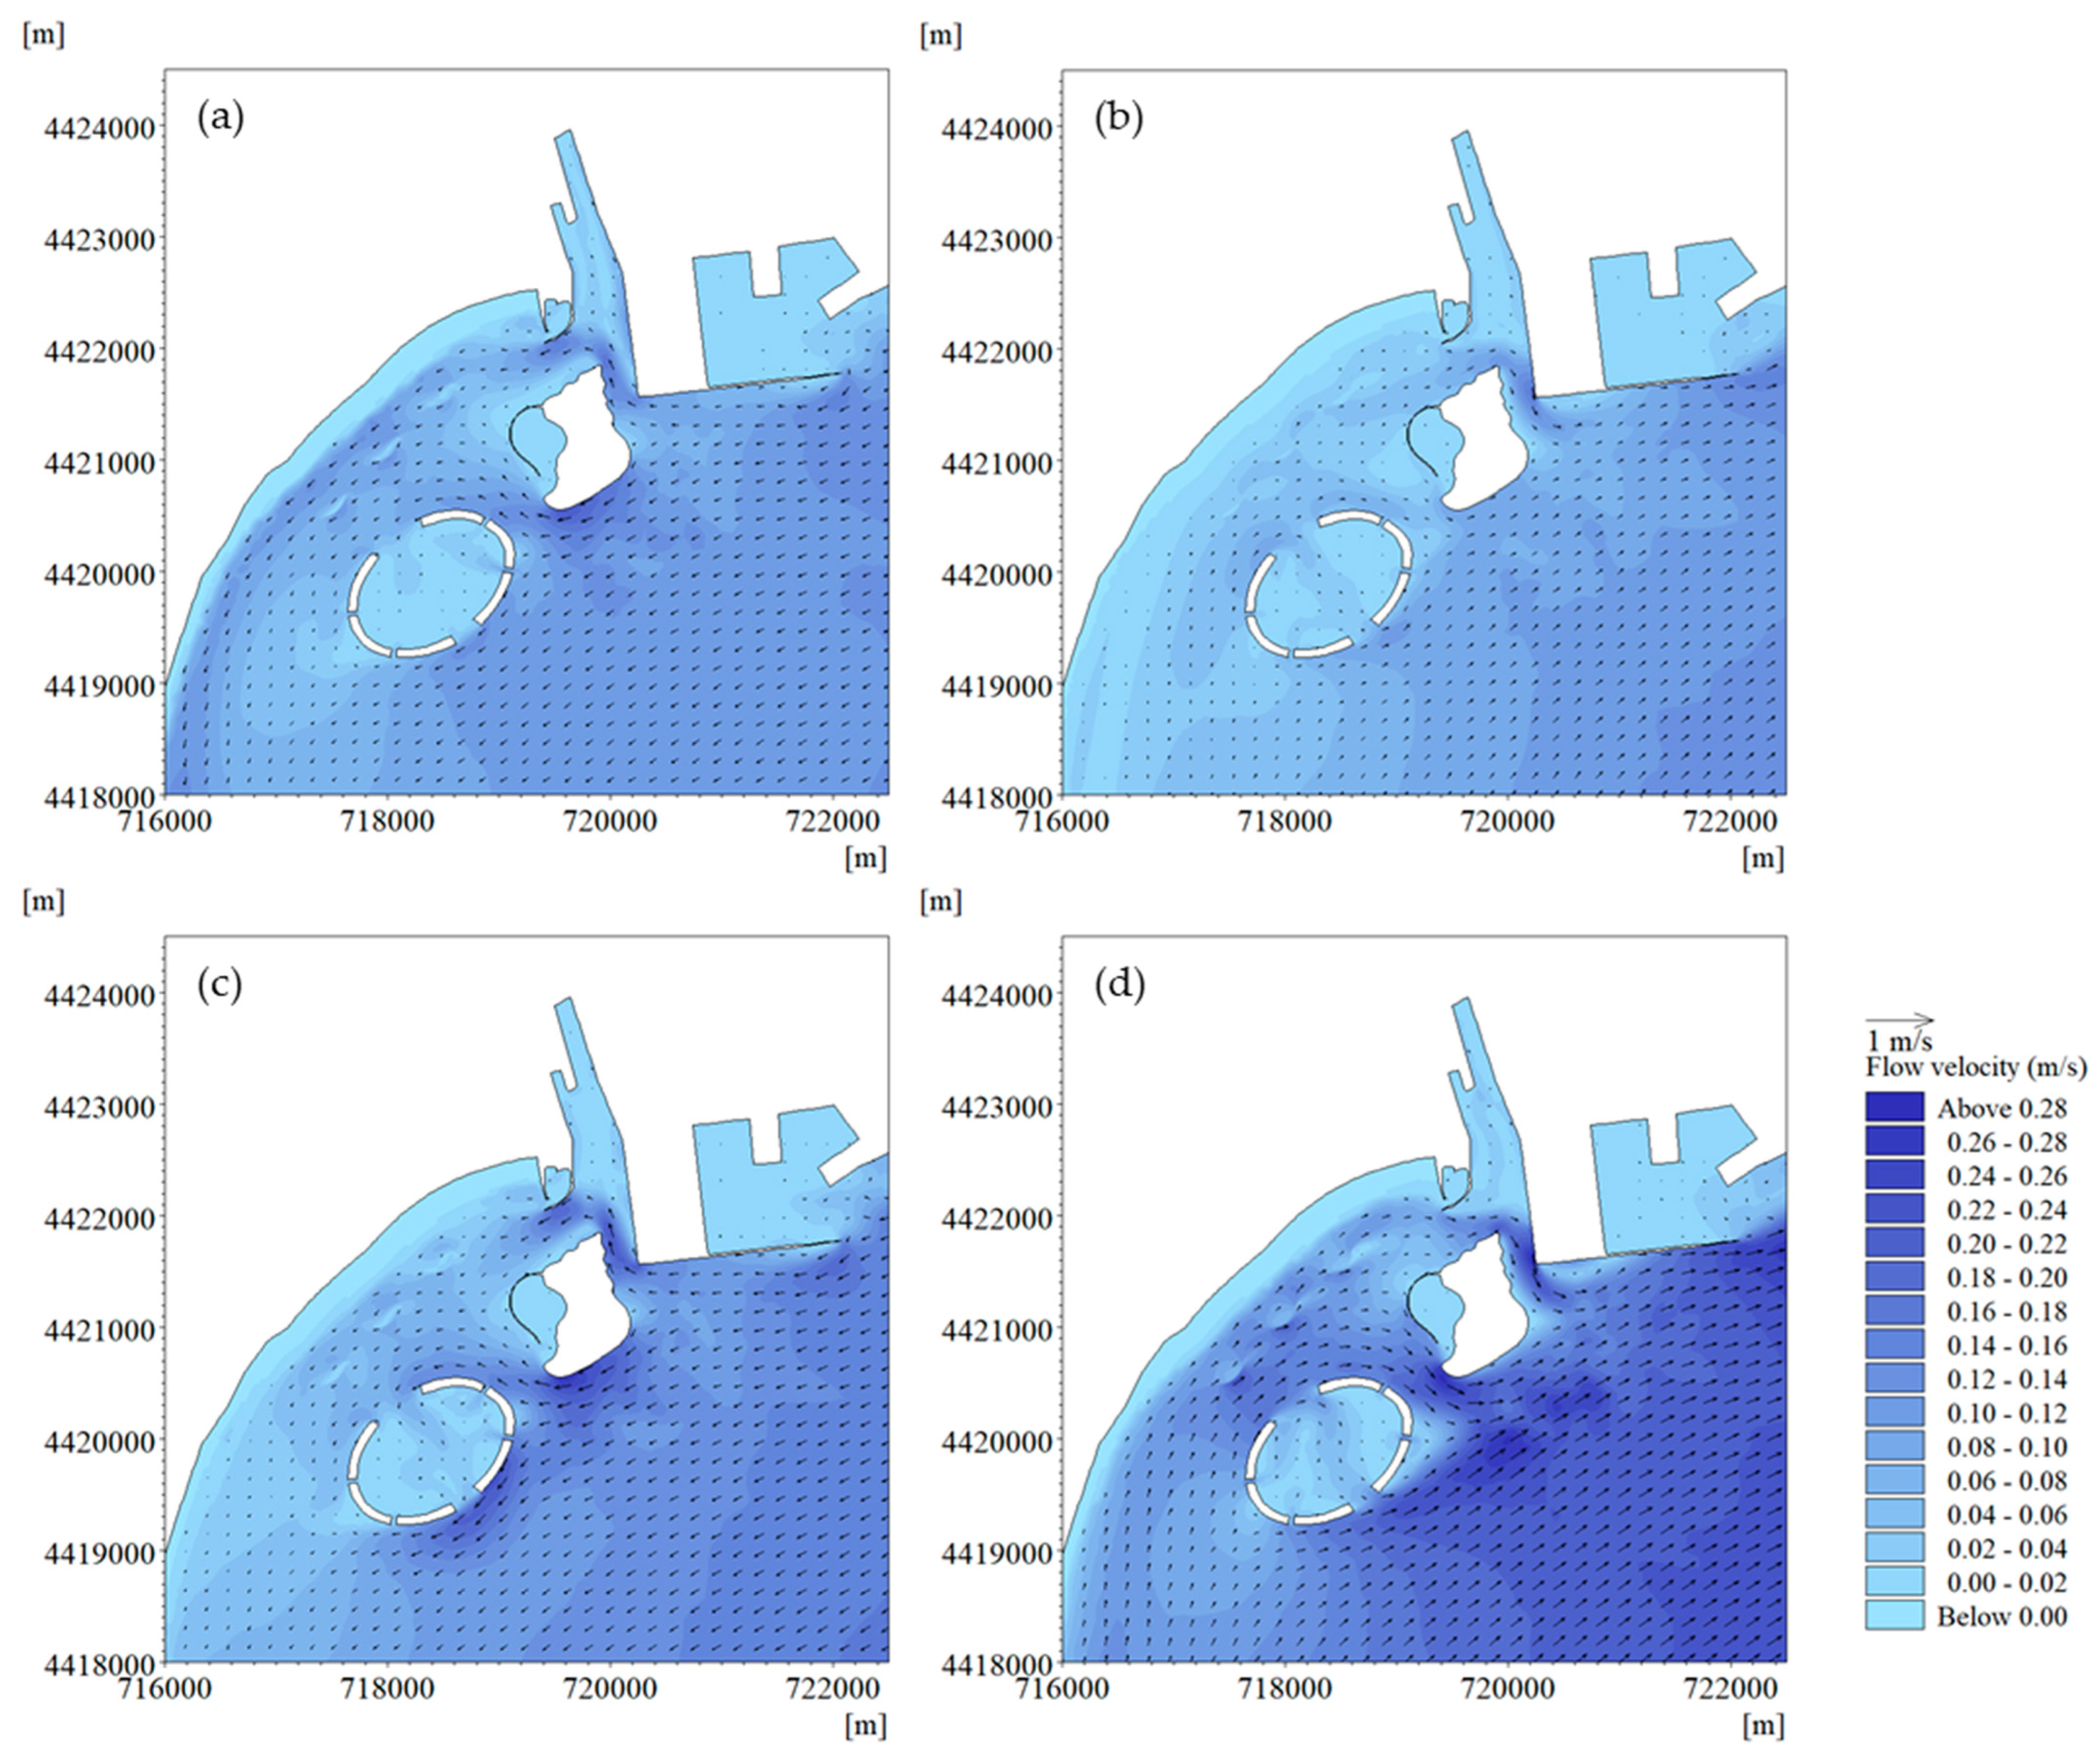
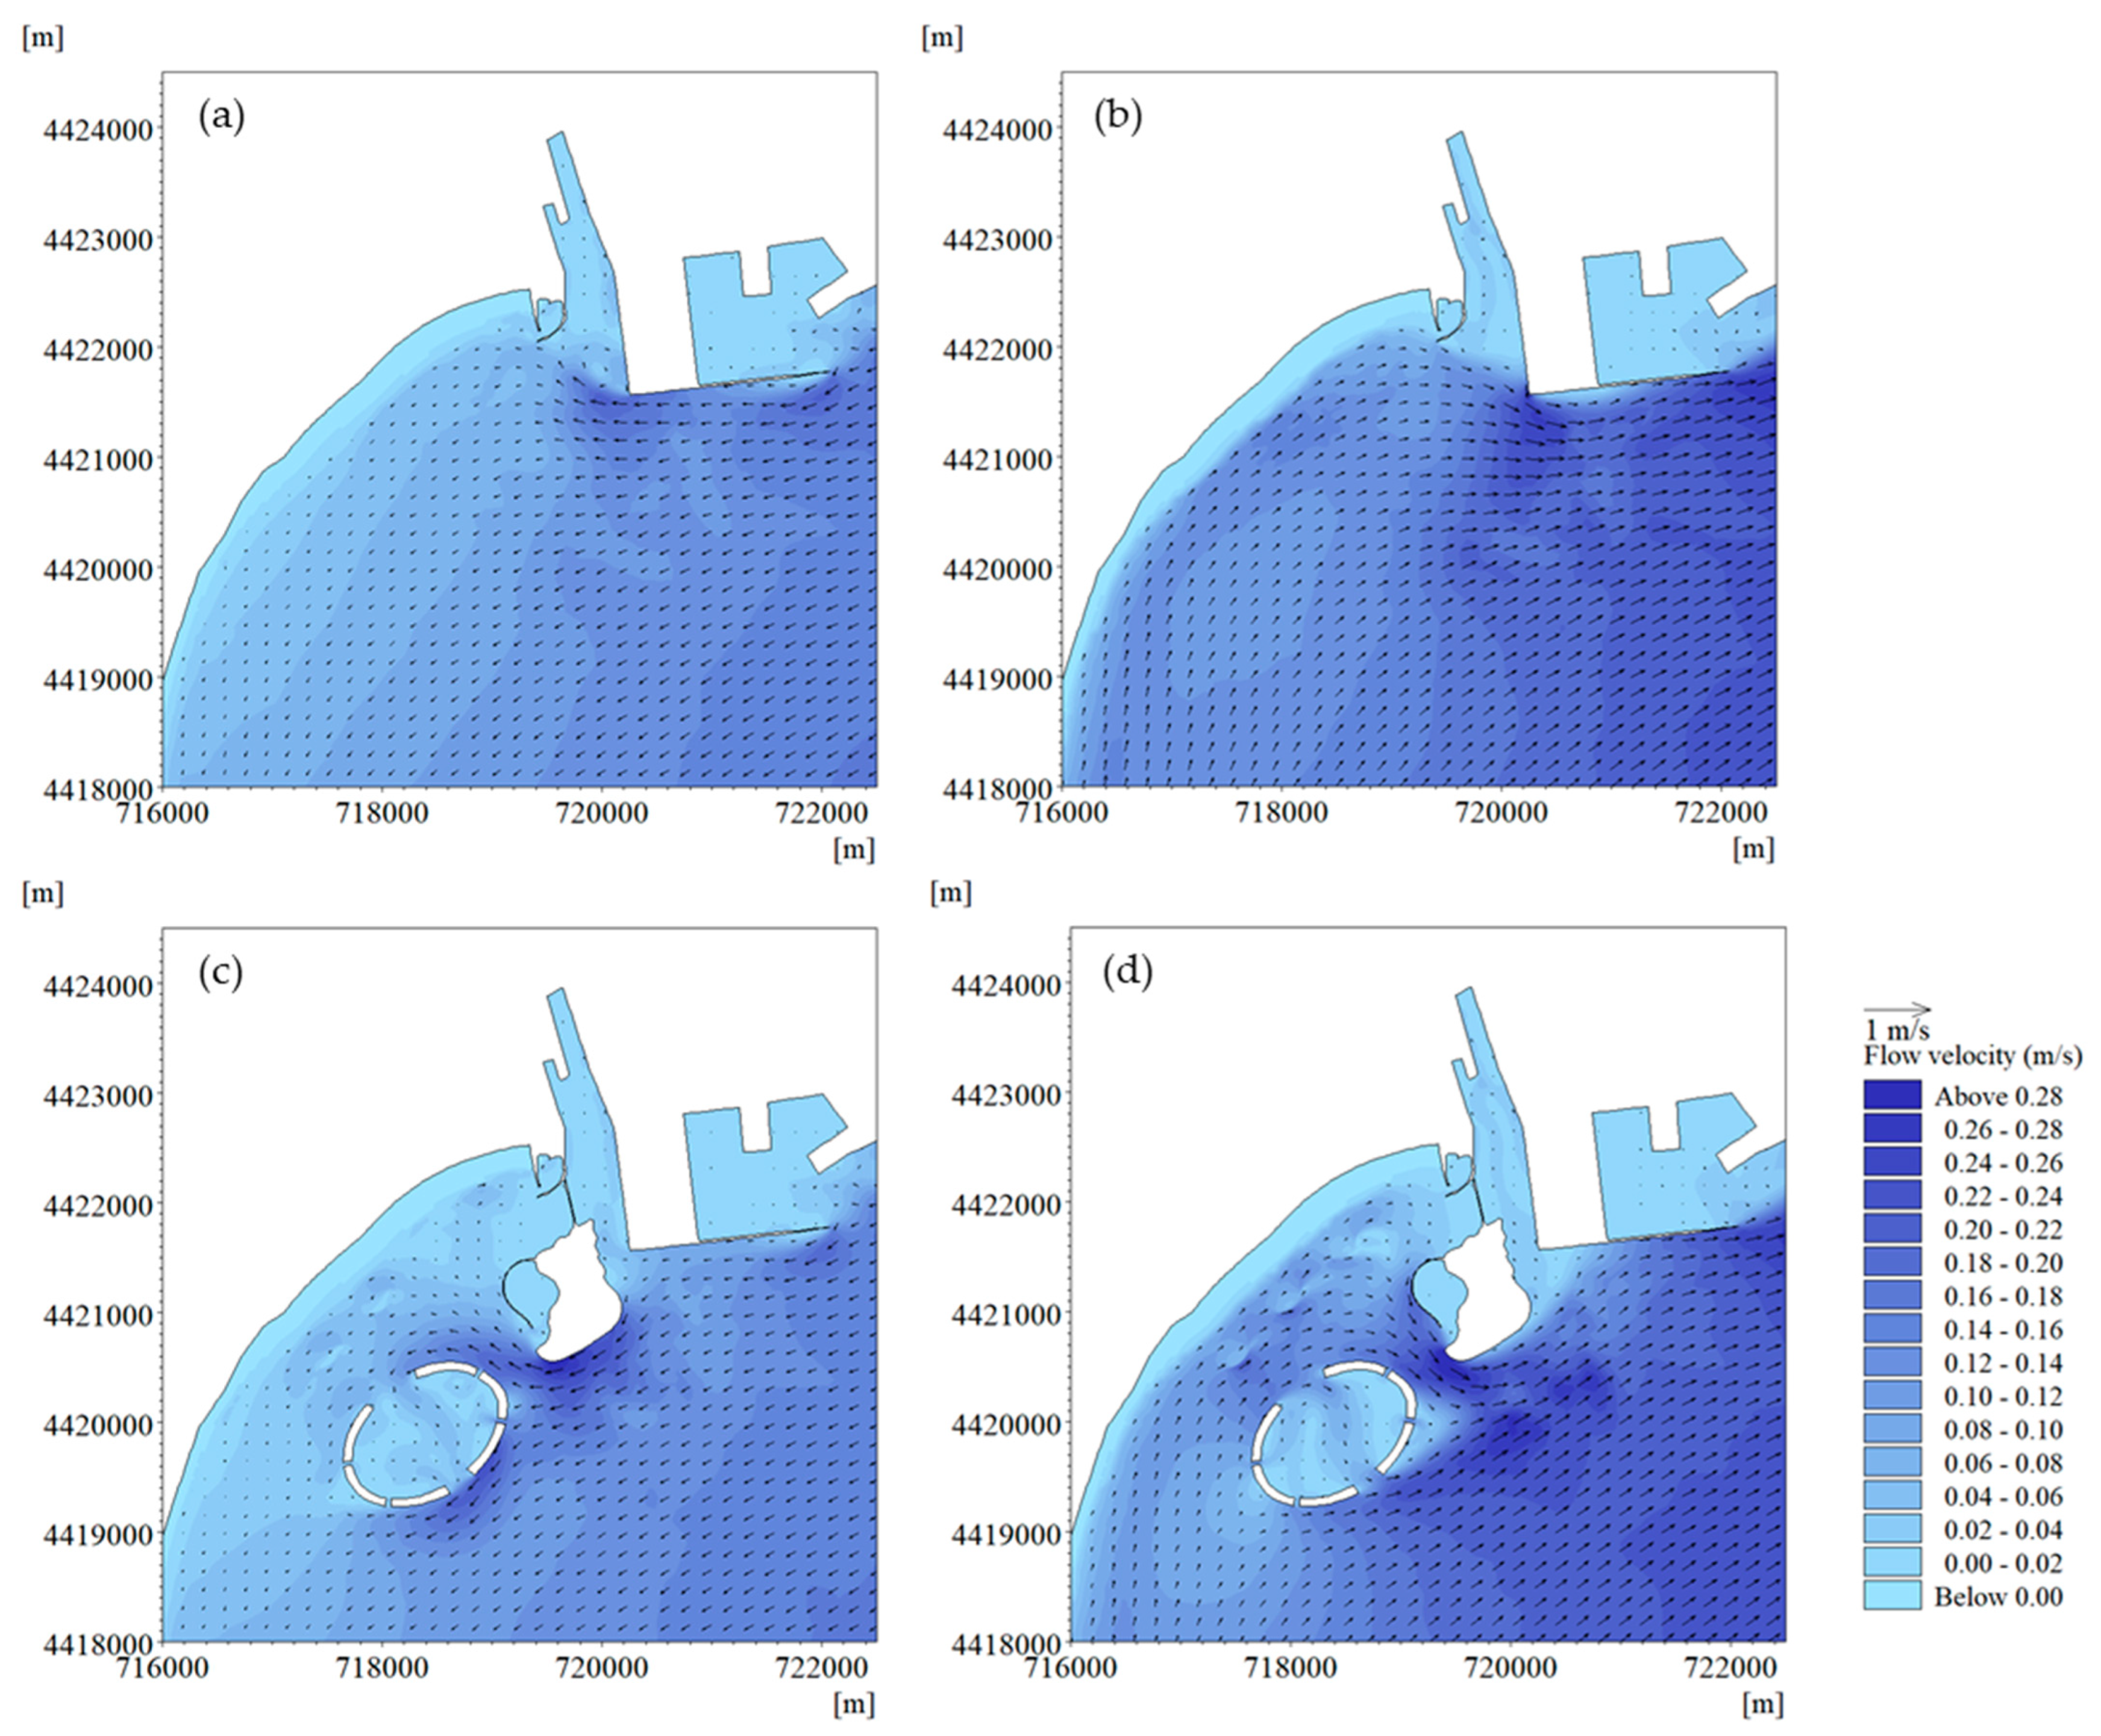
A two-month hydrodynamic process was simulated by the triple-level scheme models under the current construction conditions in 2020. The flow fields at the peak flood and the peak ebb during a typical spring and neap tidal period are shown in Figure 8. The neap tidal period was from 14:00 18 May to 15:00 19 May, and the spring tidal period was from 07:00, 8 June to 08:00, 9 June.
As shown in Figure 8, the flow velocity at the Tanghe Estuary was relatively low due to the limited discharges from east and west branches of the Tanghe River. In addition, Conch Island hindered the tidal currents, so that the tidal action was also weak at the estuary. At the peak flood (Figure 8a,c), Conch Island separated the littoral currents into two branches. A branch went along the north shore of Conch Island and through the flow channel between the coast and the island. The other branch kept the littoral trend along the south shore of Conch Island. Once this branch reached Lotus Island, a subbranch was generated, which headed towards Jinmeng Beach through the channel between the artificial islands. The branches were then confluent along Jinmeng Beach. The artificial reefs along the beach slowed down the currents (below 0.02 m/s) of these branches but maintained the littoral trend. At the peak ebb (Figure 8b,d), Lotus Island had little effect on the tidal currents because of its separated structure, while Conch Island caused a higher flow velocity at its north and south corners due to the decreased cross-sections of flow channels. During the spring tidal period, the peak velocity at the south corner of Conch Island was over 0.24 m/s at the peak ebb (Figure 8d).
3.2. Water Quality
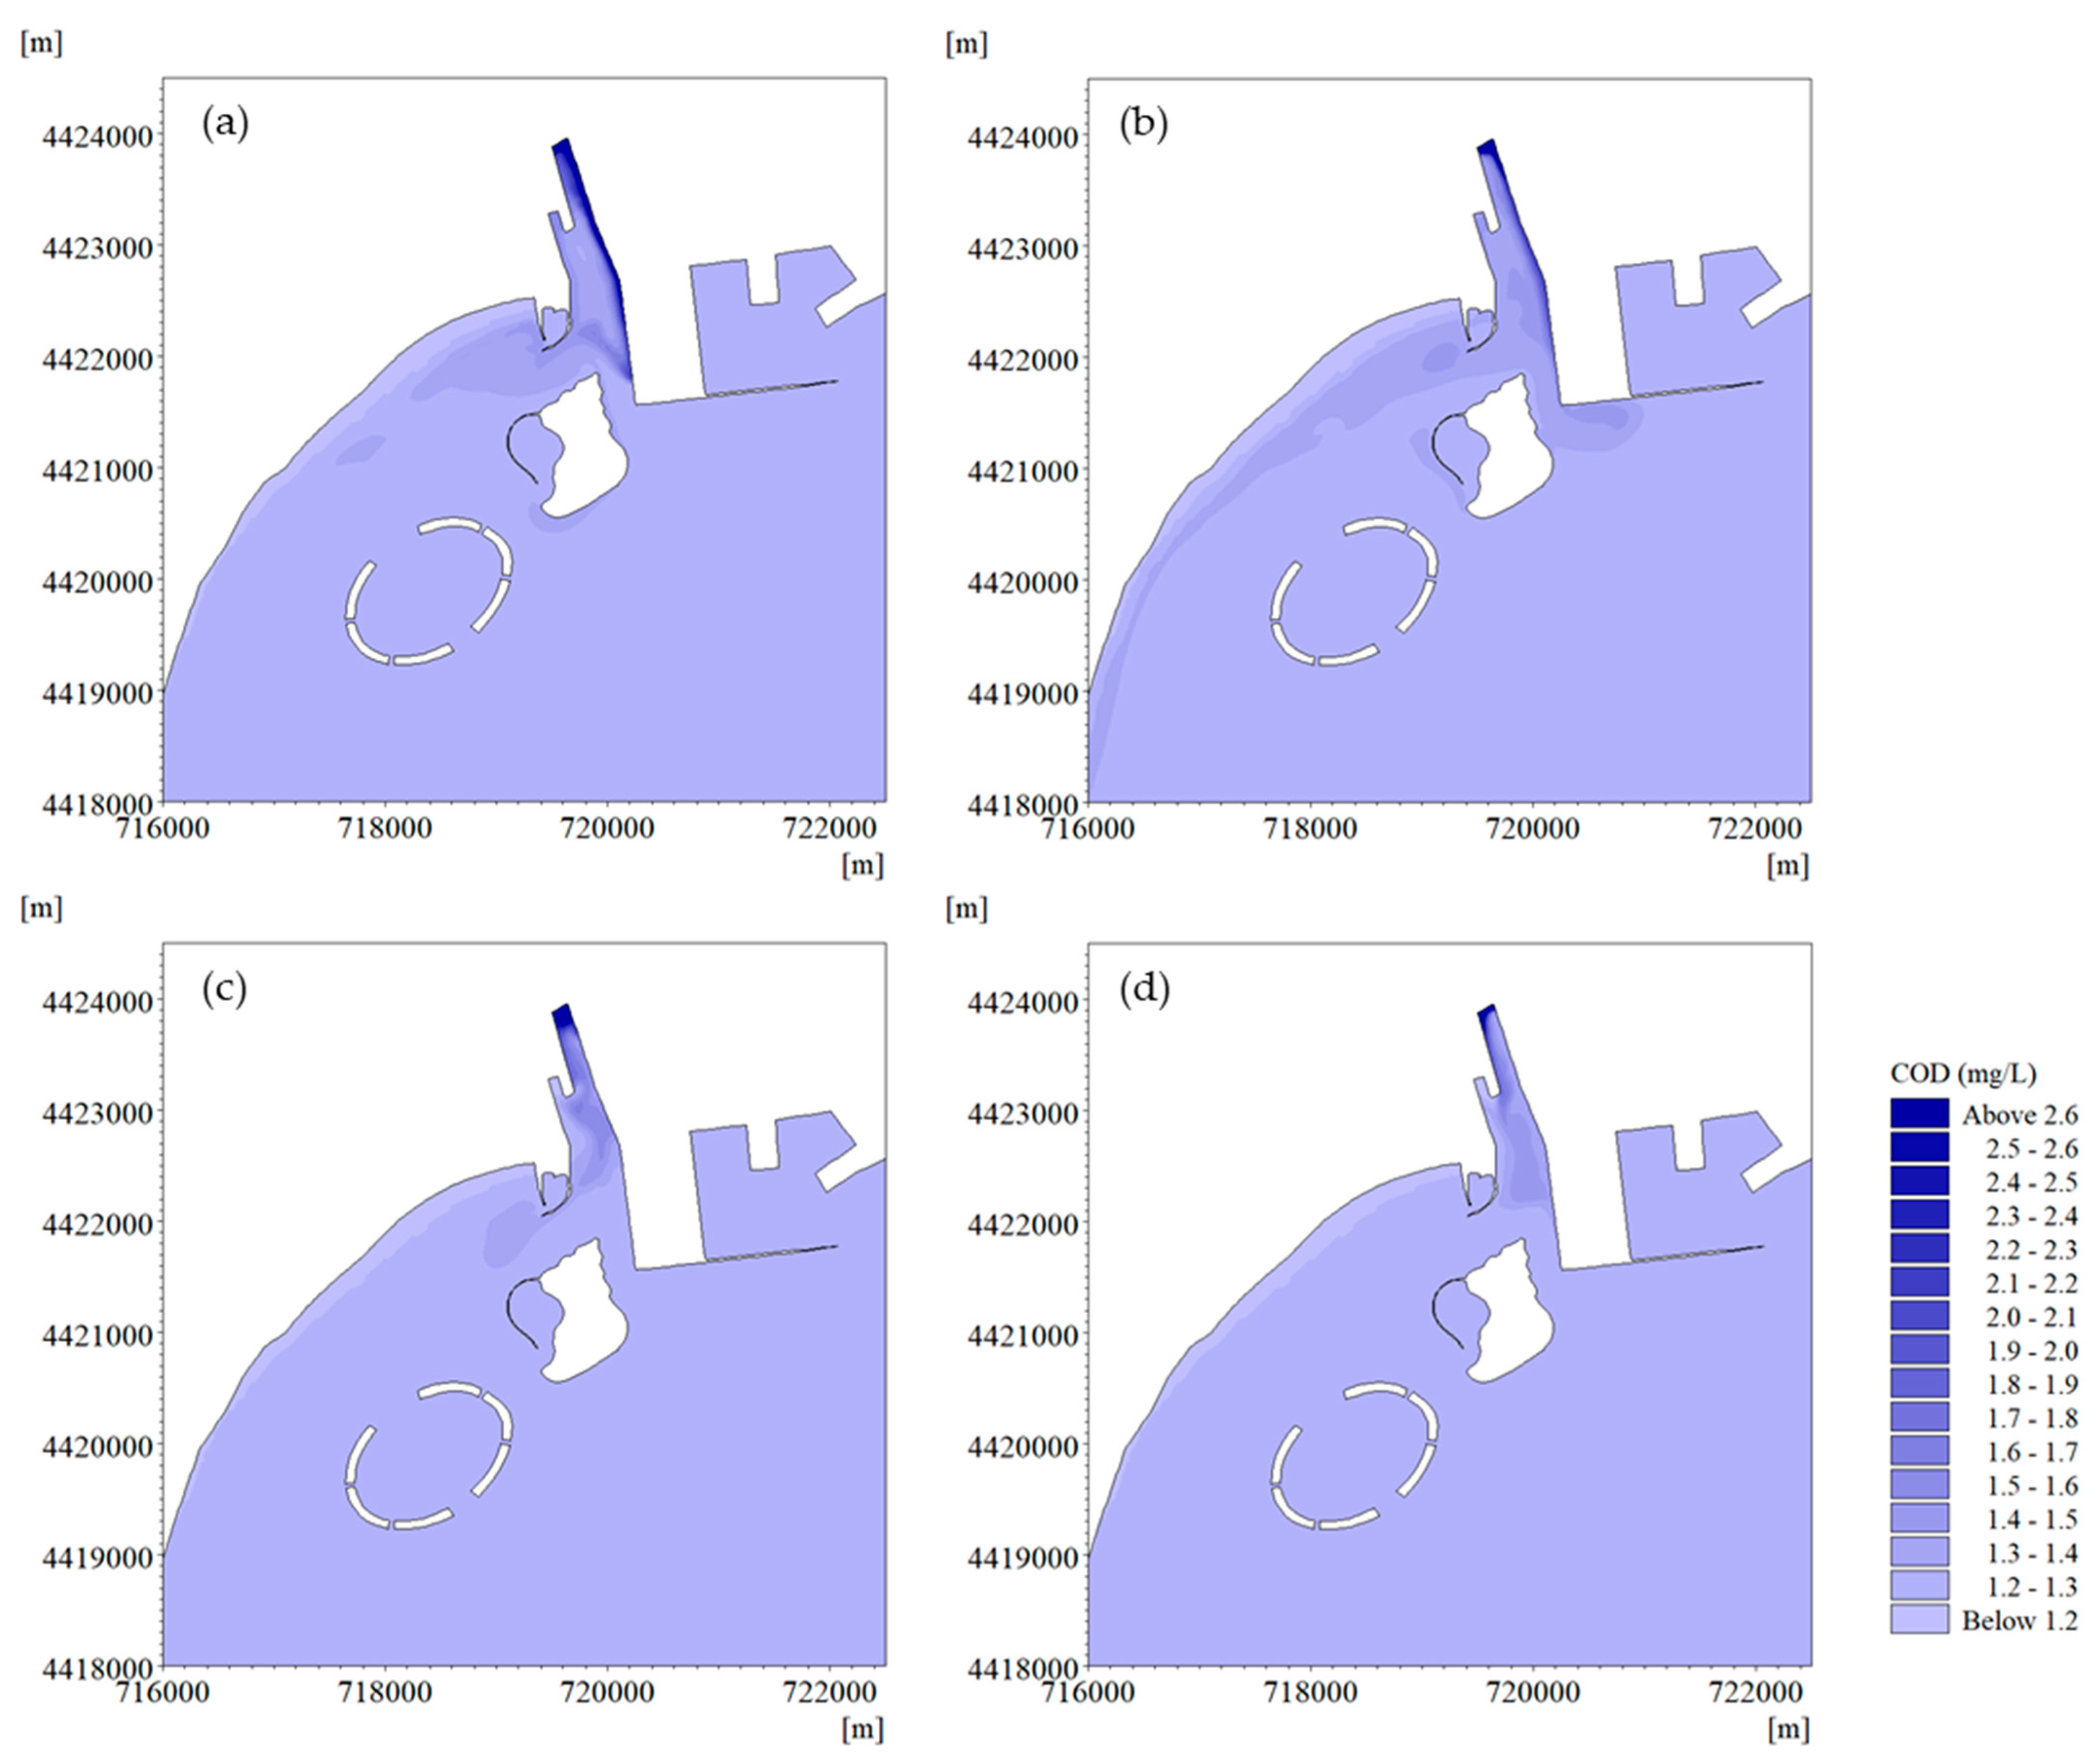
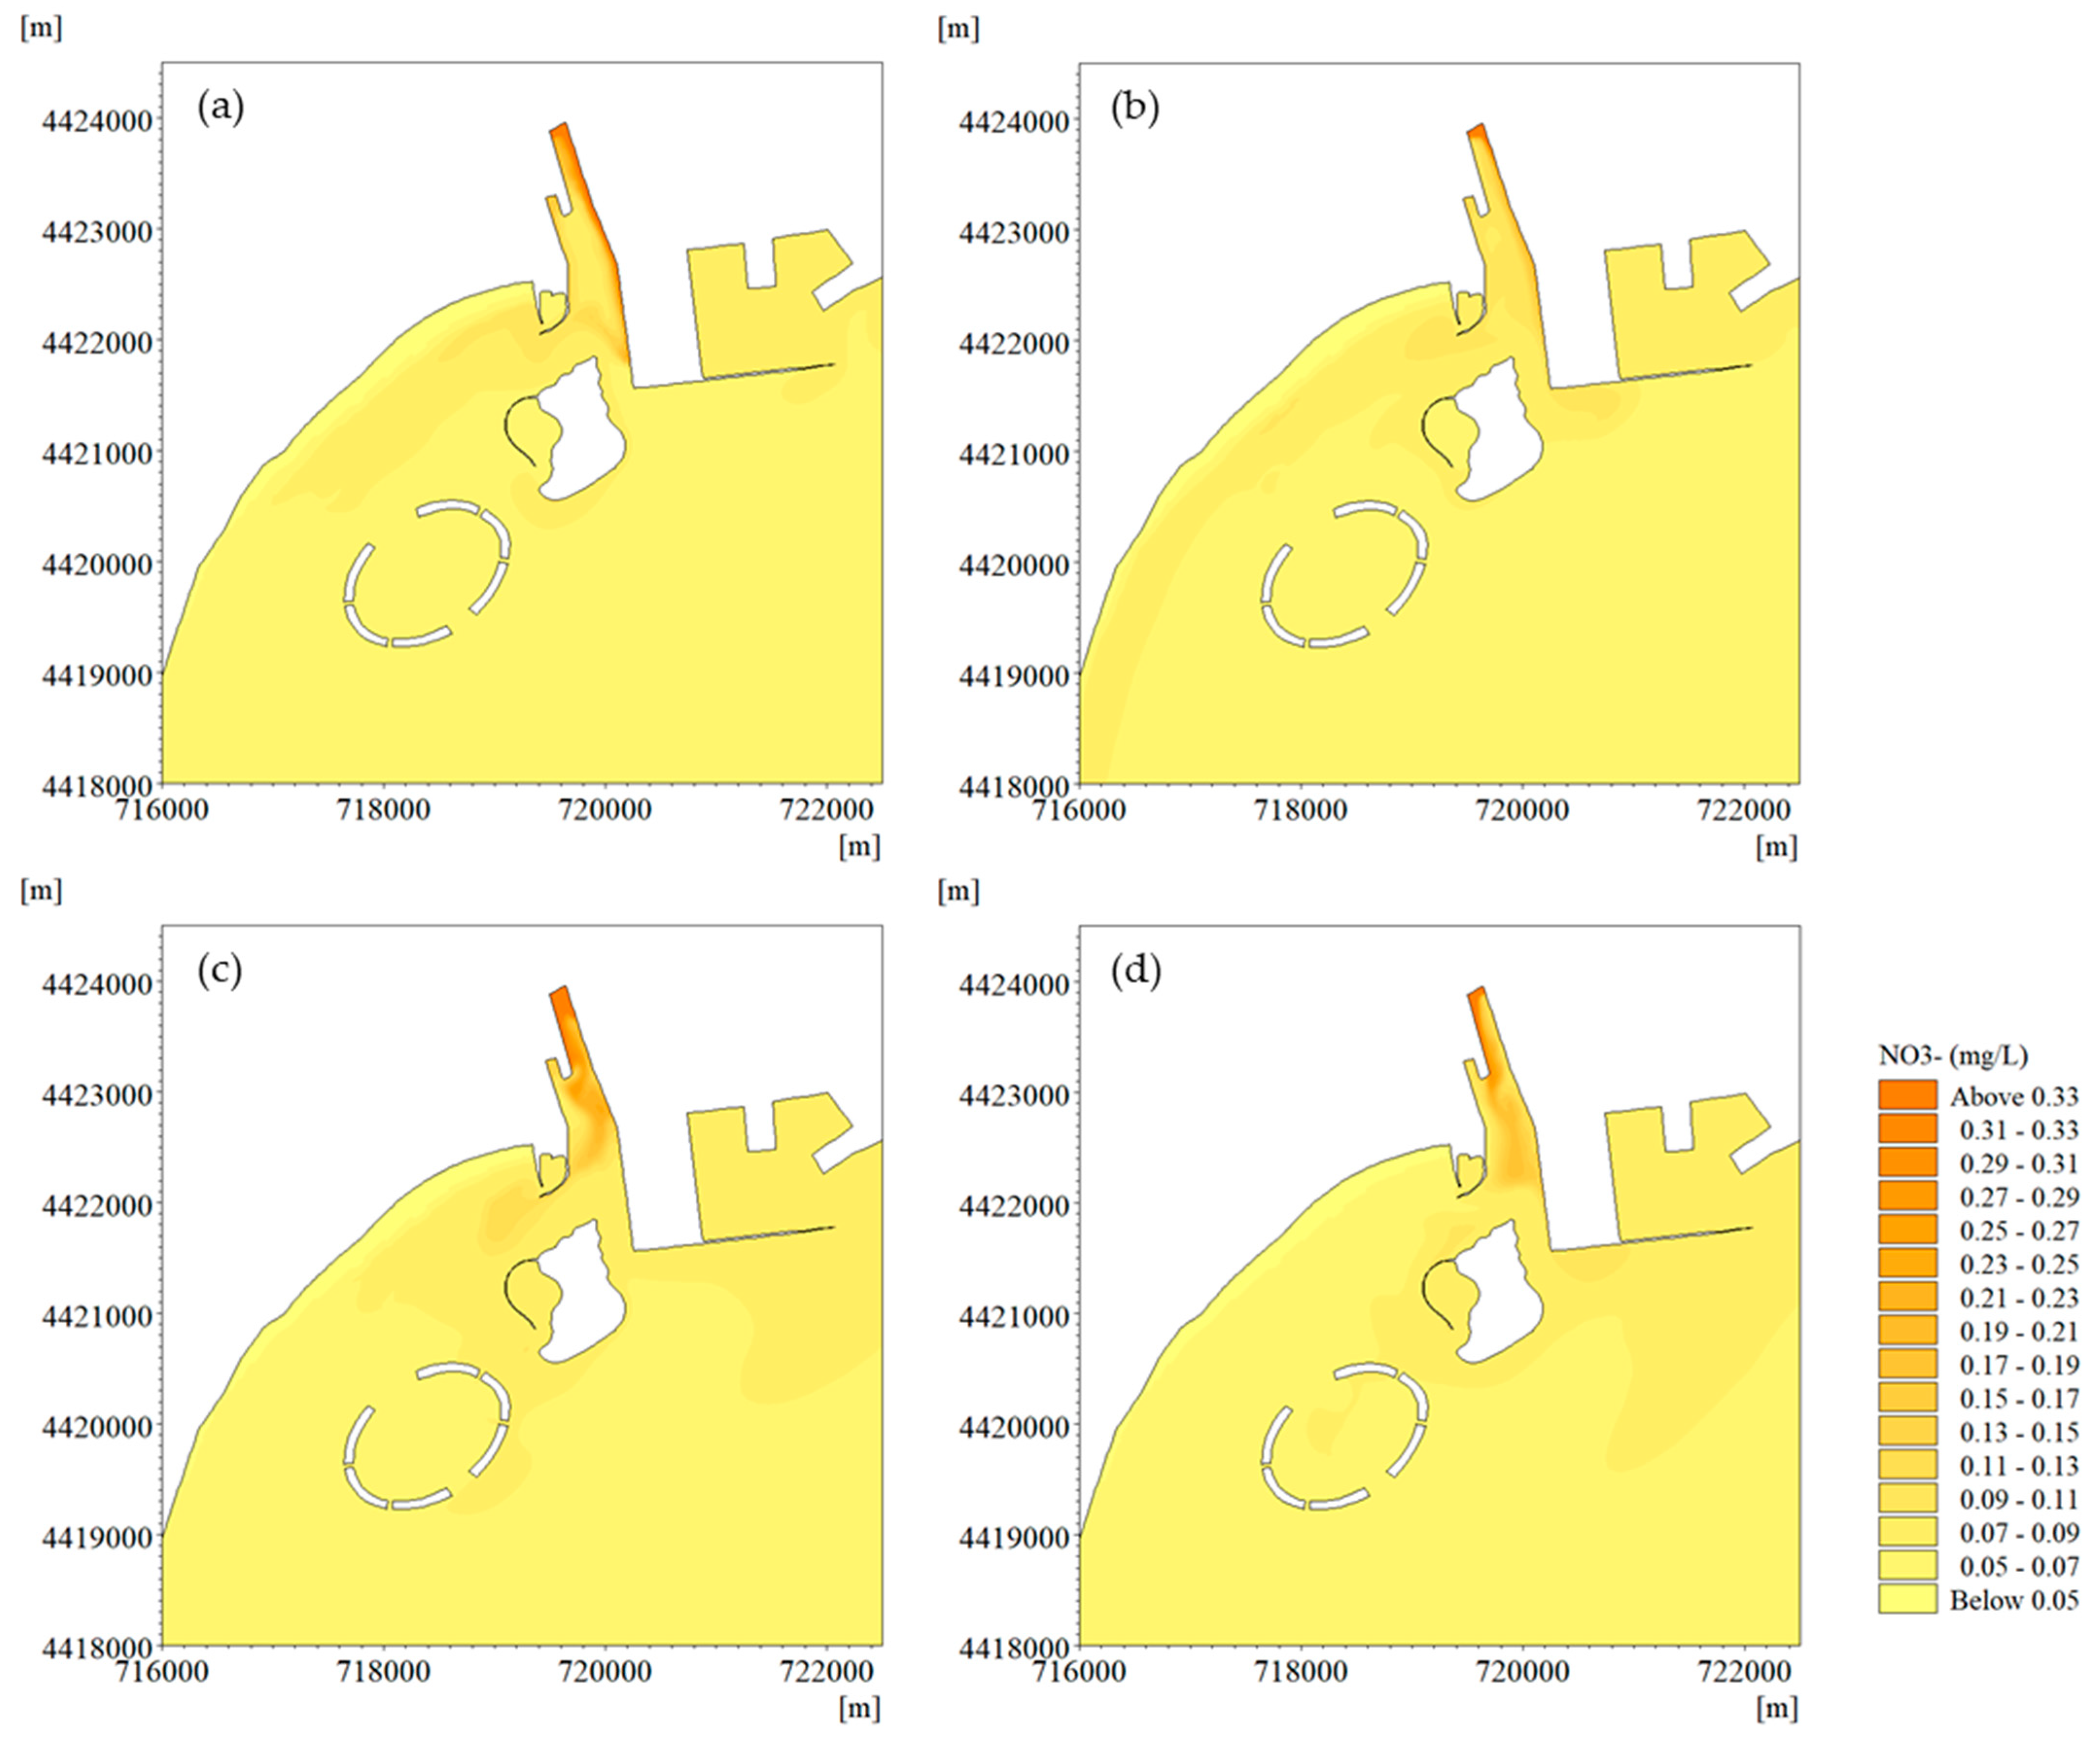
The coupled hydrodynamic-transport model was used to investigate the variations of COD and NO3− under the current construction conditions. The distributions of COD and NO3− at the peak flood and ebb tide are shown in Figure 9 and Figure 10, corresponding to the flow fields in Figure 8.
The concentration of COD declined from the estuary to the open sea. The low discharges and weak tidal actions contributed to the accretion of COD at the estuary. During the neap tide period (Figure 9a,b), the flood tide dominated the influx of COD from the estuary to Jinmeng Beach. The ebb tide then maintained a zone with relatively high concentration of COD (over 1.3 mg/L) along the beach, and contributed to the output of COD through the east channel of Conch Island. In the spring tidal period (Figure 9c,d), the increased tidal prism diluted the concentration of COD at the estuary. Thus, both flood tide and ebb tide could hardly generate a zone with relatively high COD concentration.
The distribution of NO3− was more sensitive to the hydrodynamic conditions. In the neap tidal period (Figure 10a,b), the zone with high concentrations of NO3− (over 0.07 mg/L) occurred along Jinmeng Beach. The neap tide, with weak tidal actions, could hardly restrain the littoral transport of NO3− from the Tanghe Estuary. At the peak ebb, the zone of high NO3− concentration was extended farther. However, during the spring tidal period (Figure 10c,d), a zone with high concentrations of NO3− (over 0.07 mg/L) was generated around Conch Island. The intensive ebb tidal currents restrained the trend of littoral transport and maintained the zone with the high concentration of NO3− at the estuary. In addition, the intensive tidal actions connected the zones with high NO3− concentration from the Tanghe Estuary and the Xinkaihe Estuary.
4. Discussion
4.1. Impacts of Construction Conditions on Flow Field
To investigate the responses of the water quality to the presence of artificial islands and reefs, the initial and the first-stage construction conditions are investigated. Figure 11 shows the flow fields at peak flood and peak ebb during a typical spring tidal period (from 07:00, 8 June 2020 to 08:00, 9 June 2020). Under the initial construction conditions (Figure 11a,b), the flow velocity decreased towards the shoreline and the tidal actions were weak at the estuary. The high flow velocity occurred at the east coast of the estuary due to the sudden change of the coastline. Under the first-stage construction conditions (Figure 11c,d), the connection road between Conch Island and the mainland blocked the currents north of the island. On the one hand, the road turned the east channel of Conch Island into an extended part of the estuary, and then more areas were under low tidal conditions. On the other hand, the road hindered the littoral currents and slowed down the flow velocity along Jinmeng Beach. The high velocity occurred at the south corner of Conch Island, which was the separation point for the flood tidal currents and the confluence point for the ebb tidal currents. Furthermore, the artificial reefs slowed down the local currents, but the impacts were relatively small for weak currents.
4.2. Impacts of Construction Conditions on Water Quality
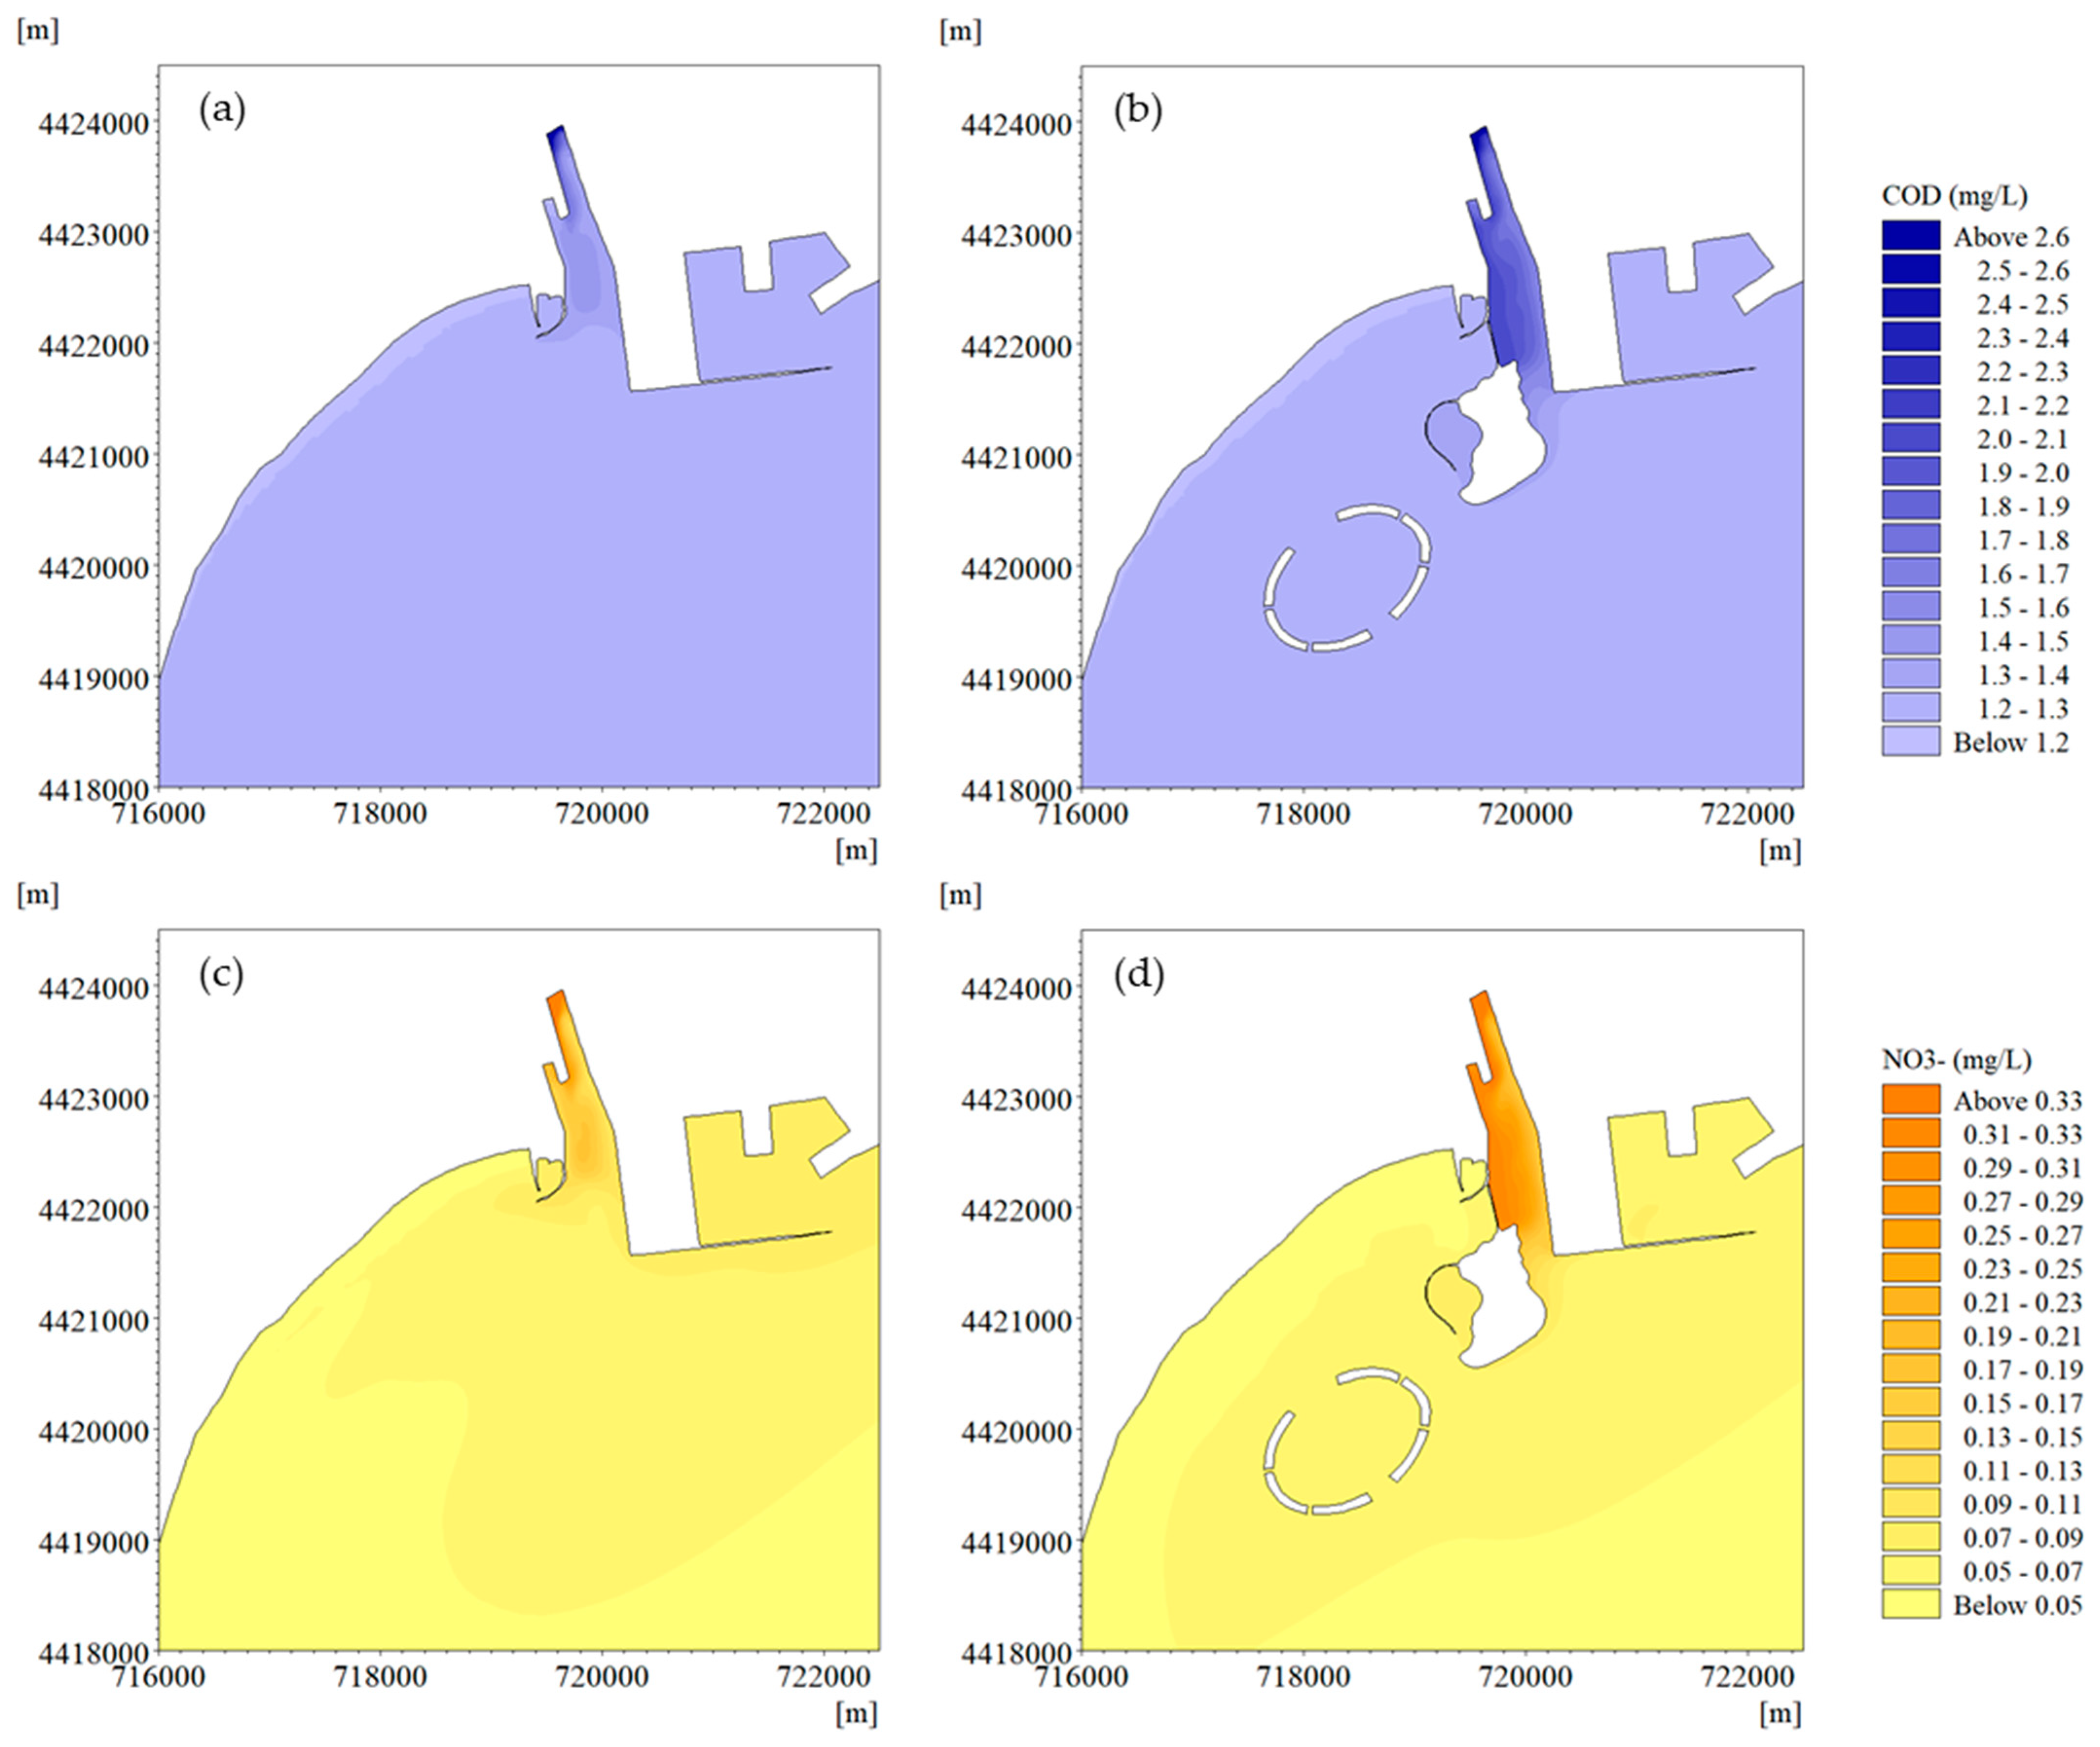
The average concentration of COD and NO3− during the spring tidal period under different construction conditions are compared in Figure 12. As shown in Figure 12a,b, although Conch Island and the connection road caused significant accretions of COD in the estuary, the COD concentrations along Jinmeng Beach is maintained at ~0.2 mg/L under all construction conditions. As shown in Figure 12c,d, NO3− accumulated in the estuary the same as COD but had different offshore distributions from COD. Under the initial construction conditions, the zone with high concentrations of NO3− extended along the coast and diffused homogeneously. Under the first-stage construction conditions, the zone with high NO3− concentrations extended further offshore and covered mainly Lotus Island and Conch Island. The NO3− concentration along Jinmeng Beach was maintained at a low level due to weakened littoral currents by the connection road. In other words, NO3− was more sensitive to the coastal engineering structures than COD.
4.3. Quantitative Analysis of the Impacts on Water Quality of Different Construction Conditions
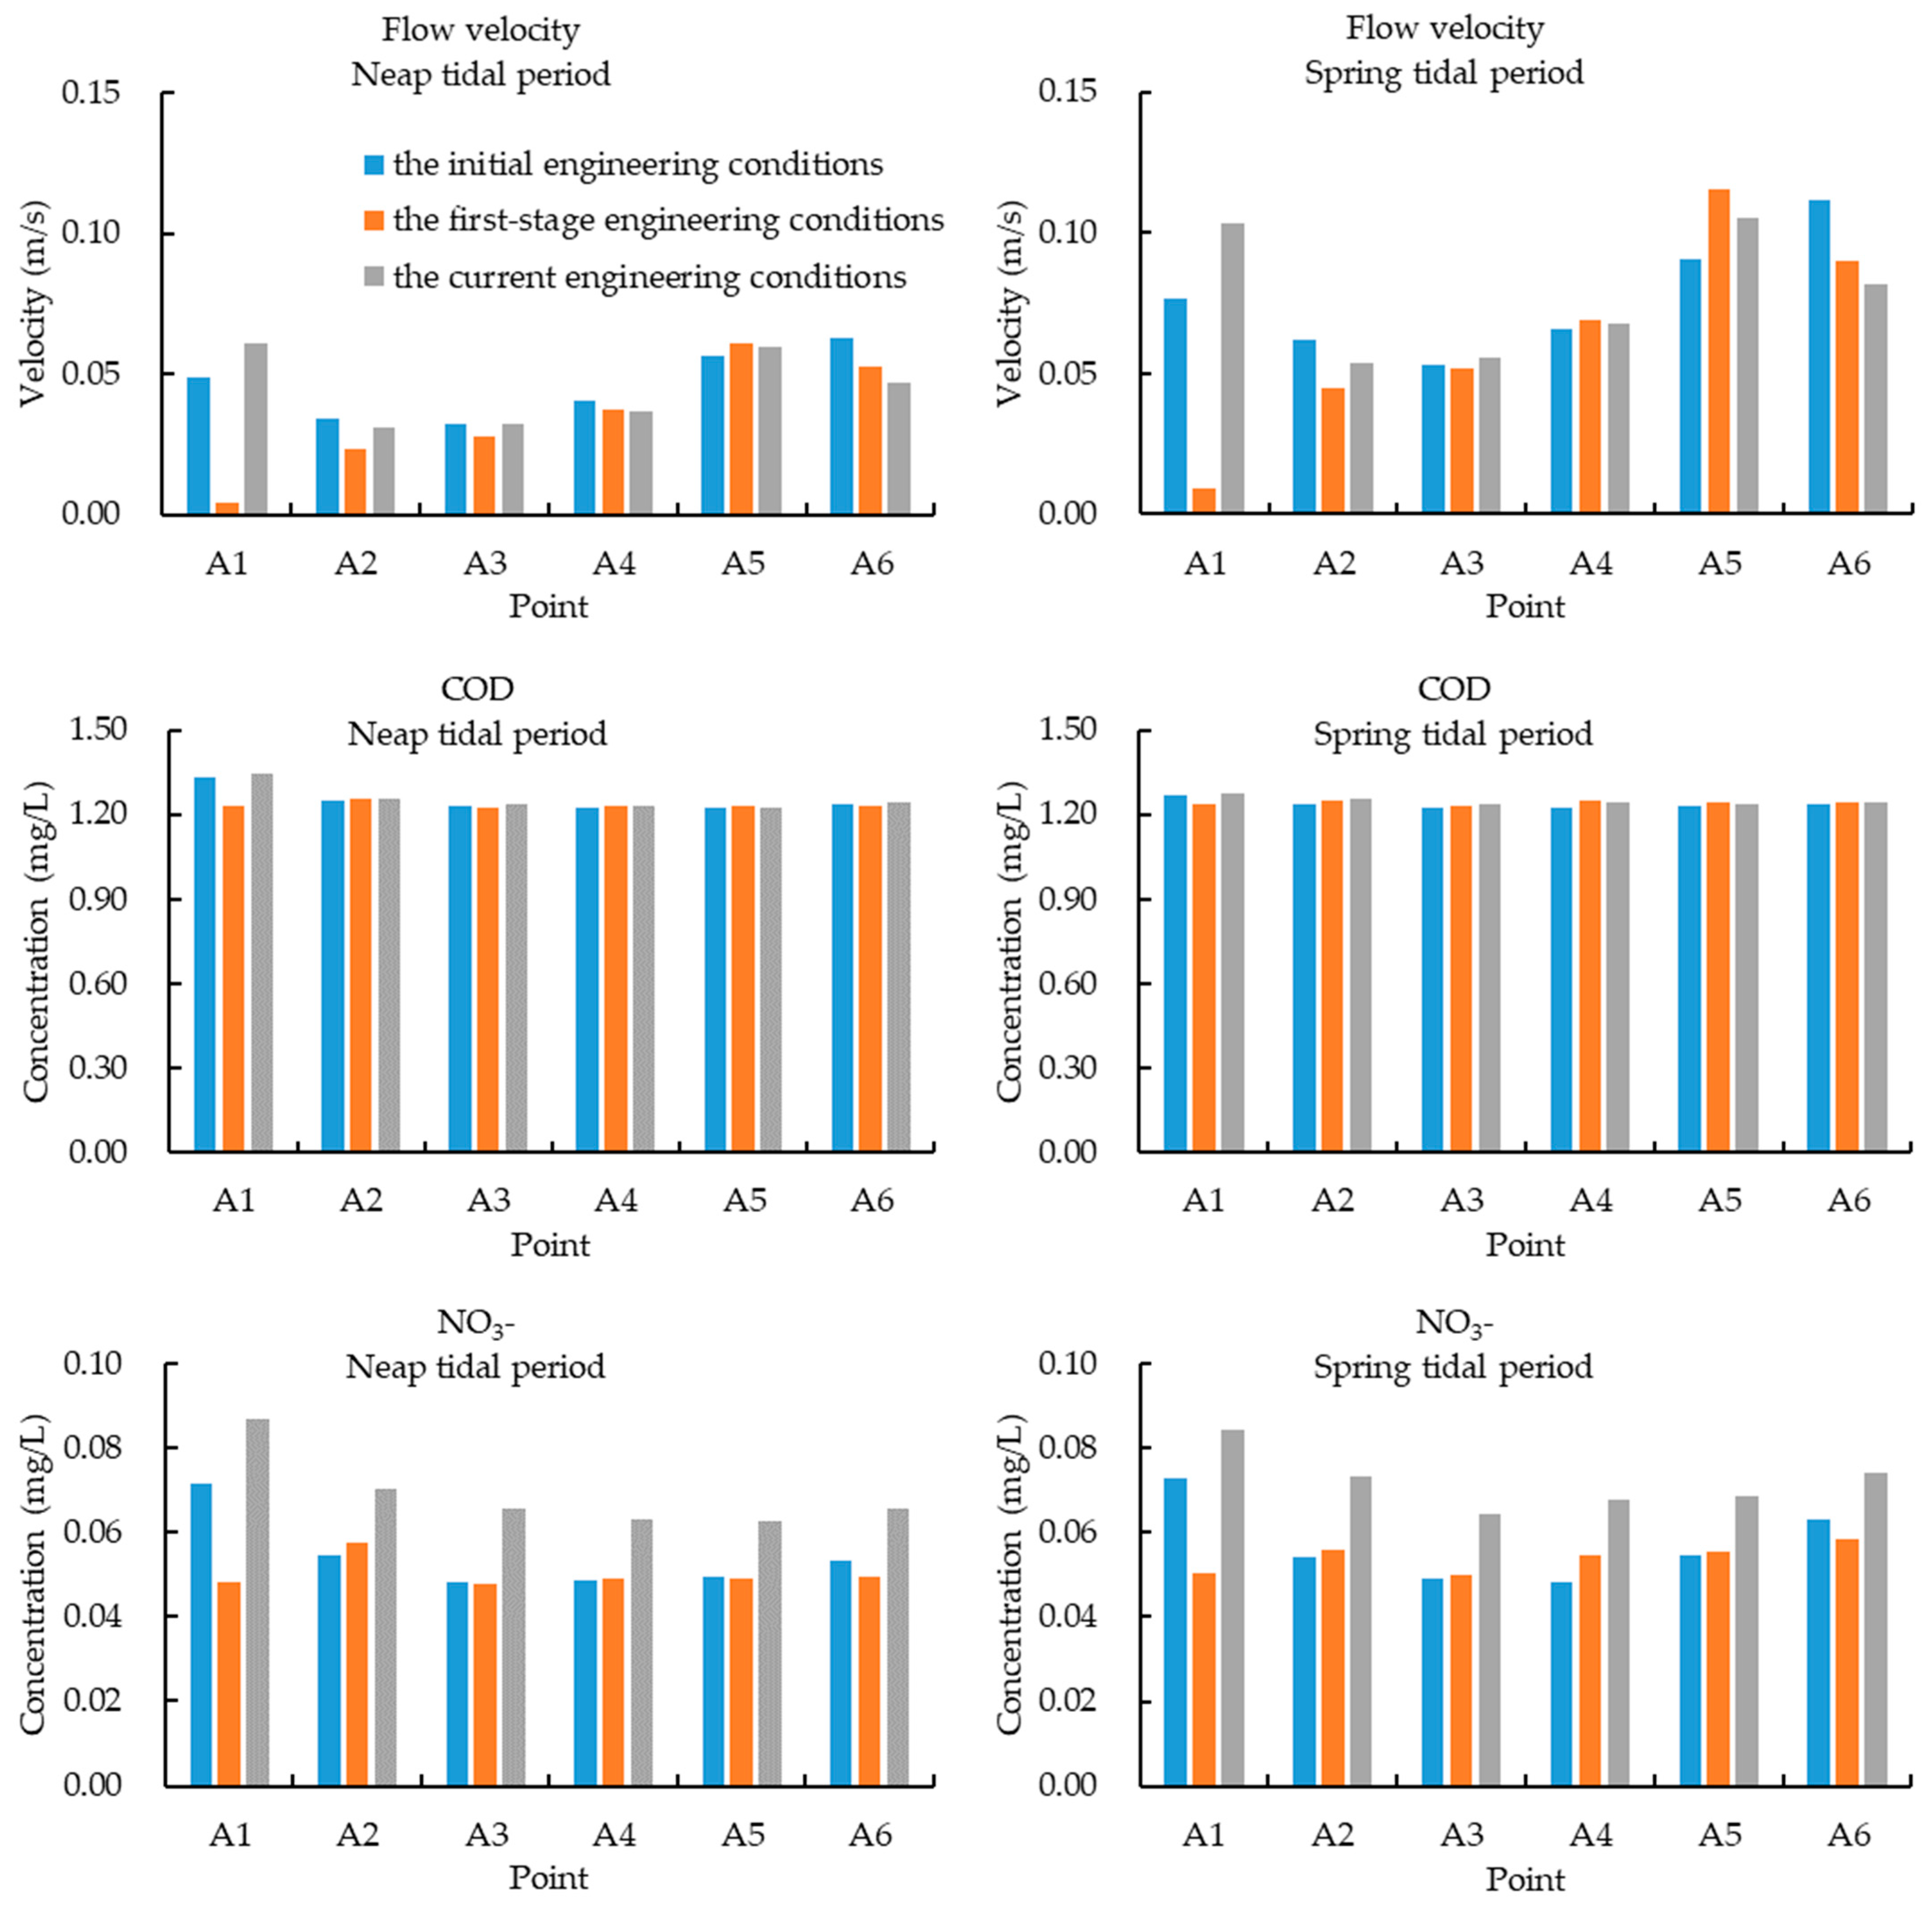
Six representative sites were selected for more quantitative analysis (Figure 13). The average flow velocity and the average concentrations of COD and NO3− during a typical spring or neap tidal period at the six sites were calculated for quantitative analysis. In Figure 14, the first-stage coastal engineering structures led to a ~90% decrease in the flow velocity at A1, and the flow velocity increases by ~30% compared to the initial value after the demolition of the connection road. The connection road dominated the restraint on the hydrodynamic conditions north of Conch Island. At sites A2~A4, the impacts of first-stage coastal engineering structures on the flow of artificial islands and reefs were below 30%. At site A5, the flow velocity increased by 6~8% under the first-stage construction conditions and further increased by 16~27% under the current construction conditions. The current in the channel between the artificial islands was accelerated, especially when the north of Conch Island was blocked. After the demolition of the connection road, the flow velocity at site A6 was weakened further to ~80% of the initial value. According to the comparison between the flow velocities at sites A1 and A6 under the current conditions, the Conch Island enhanced the littoral currents north of the island and hindered the tidal currents east of the island.
The average concentration of COD showed a different trend to the average flow velocity. The ~90% decrease in flow velocity under the first-stage construction conditions resulted in a minor decrease (below 8%) in the concentration of COD at site A1. Under the current construction conditions, the concentrations of COD recovered to the initial values. In addition, the variations of COD concentration at sites A2~A6 were below 2% under different construction conditions. Thus, the main impacts on the concentrations of COD came from the connection road. However, the regional increase in COD concentration (below 2%) under the current construction conditions could still raise the potential risks of green tides [52,53].
Different from COD, the averaged concentration of NO3− at A1 declined by ~30% for the decrease (~90%) of flow velocity under the first-stage construction conditions. During the neap tidal period, the variations of NO3− concentration at sites A2~A6 were below 7%, while the spring tide saw more variations (below 13%). Under the current construction conditions, the average concentration during a tidal period could reach 17%~40% higher than the initial values. As a significant nutrient for green algae [54,55], the rising concentration of NO3− under the current construction conditions should be continuously monitored for sustainable managements of green tides. Furthermore, restorations are necessary to improve the regional hydrodynamic and environment conditions.
5. Conclusions
Since 2015, recurrent green tides have deteriorated the regional environment in Jinmeng Bay and hindered local economic development. Massive constructions, including Conch Island, Lotus Island and artificial submerged reefs, may have had a significant contribution to the recurrence of green tides. In this paper, the responses of the water quality to the artificial islands and reefs in Jinmeng Bay were investigated with special attention on COD and NO3−. A coupled hydrodynamic-transport model was established for this study based on MIKE 21. The water quality change by the initial, first-stage and current construction conditions of the artificial islands and submerged reefs were simulated. The conclusions are as follows.
- The artificial islands and reefs in Jinmeng Bay hinder the tidal currents. In addition, the connection road between Conch Island and the mainland not only blocks the littoral currents, but also extends the estuary in length and weakens the local tidal actions.
- The weakened tidal actions at the estuary lead to the accretion of COD and NO3−. The neap tides generate a littoral zone with a high concentration of COD and NO3− along Jinmeng Beach, while the spring tides maintain the high concentration zone in the estuary.
- The impacts of the coastal engineering structures on COD concentration are less than those on NO3−. Even though the flow velocity north of Conch Island decreased by 90% after the construction of the connection road, the COD concentration declined by 8% only. With the demolition of the connection road, the COD concentrations rose to their initial values.
- NO3− is more sensitive to the variation of hydrodynamic conditions. Under the first-stage construction conditions, the decrease in NO3− concentration was up to 30%. With the demolition of the connection road, the NO3− concentrations increased by 17~40% above the initial values.
- Under the current construction conditions, the predicted and measured increase in the concentrations of COD and NO3− implies the potential risks of green tides in Jinmeng Bay. Thus, the continuous monitoring of water quality is essential for the long-term management.
In this paper, two key water quality parameters were considered. In the near future, we will concentrate more on the interactions between the biomass of green algae and the water quality properties and establish an improved water quality forecast model for warning and mitigation of green tides.
Author Contributions
Conceptualization, J.F. and C.K.; methodology, J.F., C.K. and H.L.; software, J.F. and D.W.; validation, D.W., J.L. and G.W.; formal analysis, J.F.; investigation, H.L. and D.W.; resources, H.L., J.L. and G.W.; data curation, D.W.; writing—original draft preparation, J.F. and Q.Z.; writing—review and editing, C.K. and Q.Z.; supervision, C.K. and Q.Z.; funding acquisition, C.K. All authors have read and agreed to the published version of the manuscript.
Funding
This research was funded by the National Key Research and Development Project of China, under contract nos. 2022YFC3106205 and 2019YFC1407902, and the National Natural Science Foundation of China, under contract no. 41976159.
Data Availability Statement
The data presented in this study are available on request from the corresponding author. The data are not publicly available for national security.
Acknowledgments
We are sincerely grateful to Key Laboratory of Marine Eco-Environmental Science and Technology, First Institute of Oceanography, Ministry of Natural Resources of the People’s Republic of China for supporting the fieldwork and measured data for the model validation. The last author has been supported by the UK NERC grant NE/V006088/1.
Conflicts of Interest
The funders had no role in the design of the study; in the collection, analyses or interpretation of data; in the writing of the manuscript or in the decision to publish the results.
References
- Song, M.; Yan, T.; Kong, F.; Wang, Y.; Zhou, M. Increased diversity and environmental threat of harmful algal blooms in the Southern Yellow Sea, China. J. Oceanol. Limnol. 2022, 40, 2107–2119. [Google Scholar] [CrossRef]
- Lv, X.; Xu, H.; Zhao, S.; Kong, F.; Yan, T.; Jiang, P. The green tide in Yingkou, China in summer 2021 was caused by a subtropical alga-Ulva meridionalis (Ulvophyceae, Chlorophyta). J. Oceanol. Limnol. 2022, 40, 2354–2363. [Google Scholar]
- Zhao, J.; Kong, F.; Liu, Q.; Li, F.; Wei, X.; Yan, T.; Jiang, P. Tempo-spatial distribution of Ulva spp. micro-propagules in the Yellow Sea during and after green tide in 2019. J. Oceanol. Limnol. 2022, 40, 2462–2472. [Google Scholar] [CrossRef]
- Jiang, X.; Zhou, X.; Lin, J.; Kang, Z.; Liu, Q. Research progress in the ecological consequences of Ulva prolifera green tides in the Yellow Sea. Mar. Environ. Sci. 2021, 40, 647–652. [Google Scholar]
- Qu, T.; Hou, C.; Yu, Z.; Wang, Y.; Tang, X. Ecological effects of Ulva prolifera green tide on zoobenthos in Qingdao intertidal area. Period. Ocean Univ. China 2020, 50, 59–69. [Google Scholar]
- Zhang, Y.; He, P.; Li, H.; Li, G.; Liu, J.; Jiao, F.; Zhang, J.; Huo, Y.; Shi, X.; Su, R.; et al. Ulva prolifera green-tide outbreaks and their environmental impact in the Yellow Sea, China. Natl. Sci. Rev. 2019, 6, 825–838. [Google Scholar] [CrossRef] [Green Version]
- Feng, L.; Zhang, H.; Sun, Y.; Li, X.; Su, R.; Shi, X. On nutrient releases from the decomposition of Ulva prolifera green tide and their impacts on nearshore seawaters in the southern Yellow Sea. Haiyang Xuebao 2020, 42, 59–68. [Google Scholar]
- Kim, J.; Zhao, Z.; Kim, Y. Variation in germling growth in the green tide-forming alga Ulva intestinalis (Chlorophyta) in response to gradients in salinity, temperature, light, and nutrients. J. Appl. Phycol. 2021, 33, 3951–3962. [Google Scholar] [CrossRef]
- Ji, L.; Ge, Q.; Li, Y.; Gao, Y.; Xie, S. A comparative study of the growth and nutrient removal effects of five green microalgae in simulated domestic sewage. Water 2021, 13, 3613. [Google Scholar] [CrossRef]
- Zhang, H.; Wang, G.; Zhang, C.; Su, R.; Shi, X.; Wang, X. Characterization of the development stages and roles of nutrients and other environmental factors in green tides in the Southern Yellow Sea, China. Harmful Algae 2020, 98, 101893. [Google Scholar] [CrossRef] [PubMed]
- Zhang, H.; Su, R.; Shi, X.; Zhang, C.; Yin, H.; Zhou, Y.; Wang, G. Role of nutrients in the development of floating green tides in the Southern Yellow Sea, China, in 2017. Mar. Pollut. Bull. 2020, 156, 111197. [Google Scholar] [CrossRef]
- Wang, C.; Jiao, X.; Zhang, Y.; Zhang, L.; Xu, H. A light-limited growth model considering the nutrient effect for improved understanding and prevention of macroalgae bloom. Environ. Sci. Pollut. Res. 2020, 27, 12405–12413. [Google Scholar] [CrossRef] [PubMed]
- Han, H.; Song, W.; Wang, Z.; Ding, D.; Yuan, C.; Zhang, X.; Li, Y. Distribution of green algae micro-propagules and their function in the formation of the green tides in the coast of Qinhuangdao, the Bohai Sea, China. Acta Oceanol. Sin. 2019, 38, 72–77. [Google Scholar] [CrossRef]
- Han, H.; Fan, S.; Song, W.; Li, Y.; Xiao, J.; Wang, Z.; Zhang, X.; Ding, D. The contribution of attached Ulva prolifera on Pyropia aquaculture rafts to green tides in the Yellow Sea. Acta Oceanol. Sin. 2020, 39, 101–106. [Google Scholar] [CrossRef]
- Han, H.; Li, Y.; Ma, X.; Song, W.; Wang, Z.; Fu, M.; Zhang, X. Population differentiation in the dominant species (Ulva prolifera) of green tide in coastal waters of China. Acta Oceanol. Sin. 2022, 41, 108–114. [Google Scholar] [CrossRef]
- Song, D. Temporal-Spatial Distribution and Countermeasures Study of Algae Disaster in the Bohai and Yellow Sea Based on Multi-Source Data. Ph.D. Thesis, Yantai Institute of Coastal Zone Research, Chinese Academy of Sciences, Yantai, China, 2019. [Google Scholar]
- Sun, X.; Wu, M.; He, F.; Zhang, A.; Zhao, D.; Li, B. Temporal and spatial distribution of Ulva. prolifera in the Yellow Sea and influence of typhoon “CHAN-HOM” in 2015. Remote Sens. Technol. Appl. 2017, 32, 921–930. [Google Scholar]
- Li, Y.; Pan, L.; Xiao, W.; Hu, S.; Yang, H. Effect of wind on the drifting of green macroalgae in the Yellow Sea. Mar. Environ. Sci. 2014, 33, 772–776. [Google Scholar]
- Geng, H. Attachment Characteristics and Deposition Region of Bloom-Forming Ulva prolifera in the Yellow Sea. Ph.D. Thesis, Institute of Oceanology, Chinese Academy of Sciences, Qingdao, China, 2017. [Google Scholar]
- Bermejo, R.; Golden, N.; Schrofner, E.; Knöller, K.; Fenton, O.; Serrão, E.; Morrison, L. Biomass and nutrient dynamics of major green tides in Ireland: Implications for biomonitoring. Mar. Pollut. Bull. 2022, 175, 113318. [Google Scholar] [CrossRef]
- Mukherjee, P.; Gorain, P.C.; Paul, I.; Bose, R.; Bhadoria, P.B.S.; Pal, R. Investigation on the effects of nitrate and salinity stress on the antioxidant properties of green algae with special reference to the use of processed biomass as potent fish feed ingredient. Aquacult. Int. J. Eur. Aquacult. Soc. 2020, 28, 211–234. [Google Scholar] [CrossRef]
- Lavajoo, F.; Thaherizade, M.; Dehghani, M. The absorption of nitrate and phosphate from urban sewage by blue-green algae (Spirolina Platensis) (an alternative medium) as application for removing the pollution. J. Appl. Sci. Environ. Manag. 2015, 19, 353–356. [Google Scholar] [CrossRef] [Green Version]
- Zhang, H.; Liu, K.; Su, R.; Shi, X.; Pei, S.; Wang, X.; Wang, G.; Wang, S. Study on the coupling relationship between the development of Ulva prolifera green tide and nutrients in the southern Yellow Sea in 2018. Haiyang Xuebao 2020, 42, 30–39. [Google Scholar]
- Zhang, H.; Wang, S.; Yin, H.; Sha, Z.; Shi, X.; Su, R.; Pei, S.; Wang, G.; Ma, Y. The development of Ulva prolifera green tide and the roles of nitrogen nutrients in it in the southern Yellow Sea in 2018. Haiyang Xuebao 2020, 42, 40–49. [Google Scholar]
- Xiao, Z.; Qi, H.; Cai, F.; Liu, G.; Zhao, S.; Zhu, J.; Lei, G.; Yin, H. The impact of artificial island construction on sedimentary characteristics and sediment transport in the Haikou Bay. Haiyang Xuebao 2022, 44, 137–146. [Google Scholar]
- Zhang, D.; Shi, L.; Gong, Z.; Guo, J. Evolution characteristics of beach erosion and accretion at the Riyue Bay under the combined impacts of winter waves and artificial island. J. Trop. Oceanogr. 2022, 41, 71–81. [Google Scholar]
- Li, H.; Zhang, H.; Wang, X.; Yu, H.; Xu, Y.; Liu, X.; Zhang, Y. Influence on the sandy coast evolution of the ocean engineering: A case study of artificial Riyue island, Wanning city, Hainan Island. Mar. Environ. Sci. 2019, 38, 575–581. [Google Scholar]
- Tang, Y.; Yang, W.; Sun, L.; Zhao, F.; Long, X.; Wang, G. Studies on factors influencing hydrodynamic characteristics of plates used in artificial reefs. J. Ocean Univ. China 2019, 18, 193–202. [Google Scholar] [CrossRef]
- Tang, Y.; Wei, S.; Yang, M.; Wang, X.; Zhao, F. Experimental investigation of local scour around artificial reefs in steady currents. J. Ocean Univ. China 2022, 21, 445–456. [Google Scholar] [CrossRef]
- Ma, Y.; Kuang, C.; Han, X.; Niu, H.; Zheng, Y.; Shen, C. Experimental study on the influence of an artificial reef on cross-shore morphodynamic processes of a wave-dominated beach. Water 2020, 12, 2947. [Google Scholar] [CrossRef]
- Kuang, C.; Ma, Y.; Han, X.; Pan, S.; Zhu, L. Experimental observation on beach evolution process with presence of artificial submerged sand bar and reef. J. Mar. Sci. Eng. 2020, 8, 1019. [Google Scholar] [CrossRef]
- Kuang, C.; Mao, X.; Gu, J.; Niu, H.; Ma, Y.; Yang, Y.; Qiu, R.; Zhang, J. Morphological processes of two artificial submerged shore-parallel sandbars for beach nourishment in a nearshore zone. Ocean Coastal Manag. 2019, 179, 104870. [Google Scholar] [CrossRef]
- Chen, Q.; Chen, P. Changes in the heavy metals and petroleum hydrocarbon contents in seawater and surface sediment in the year following artificial reef construction in the Pearl River Estuary, China. Environ. Sci. Pollut. Res. 2020, 27, 6009–6021. [Google Scholar] [CrossRef] [PubMed]
- Yu, H.; Yang, W.; Liu, C.; Tang, Y.; Song, X.; Fang, G. Relationships between community structure and environmental factors in Xixiakou artificial reef area. J. Ocean Univ. China 2020, 19, 883–894. [Google Scholar] [CrossRef]
- Liu, Y.; Paula, N. Ecosystem service value of artificial reef area in Qingdao Luhaifeng Sea ranching: A meta-analysis and benefit transfer valuation. Ecol. Econ. 2022, 18, 261–273. [Google Scholar]
- Chen, Q.; Jian, S.; Chen, P. Changes in the functional feeding groups of macrobenthos following artificial reef construction in Daya Bay, China. Global Ecol. Conserv. 2022, 33, e01978. [Google Scholar] [CrossRef]
- Layman, C.A.; Allgeier, J.E. An ecosystem ecology perspective on artificial reef production. J. Appl. Ecol. 2020, 57, 2139–2148. [Google Scholar] [CrossRef]
- Xu, T.; Yan, B.; Han, Z.; Qiao, Y. Numerical simulation research on tide and sediment in Lotus Island project in Qinhuangdao. J. Waterw. Harbor 2015, 36, 502–509. [Google Scholar]
- Zhang, Q.; Yan, B.; Li, W. Scheme comparison of Lotus Island in Qianhuangdao. Water Conservancy Sci. Technol. Econ. 2015, 21, 40–42. [Google Scholar]
- Zhang, Y. Numerical Simulation Research on the Impacts of Man-Made Island on Flood Propagation and Erosion-Deposition of Estuary. Master’s Thesis, Tianjin University, Tianjin, China, 2014. [Google Scholar]
- Sheng, T. Numerical Modelling Research on the Influence of Sea-Crossing Bridge engineering to River Course Flood Propagation. Master’s Thesis, Tianjin University, Tianjin, China, 2016. [Google Scholar]
- Wang, Z. Study on Water and Sediment Environment Changes Affected by Artificial Island (Group): Taking Conch Island and Lotus Island Project in Qinhuangdao as Examples. Master’s Thesis, Dalian University of Technology, Dalian, China, 2018. [Google Scholar]
- Xie, Y.; Liu, S.; Liu, J.; Pei, J. Ecological restoration design of Jinmeng Bay Beach in Qinhuangdao. Mar. Geol. Front. 2013, 29, 79–86. [Google Scholar]
- Yang, Y.; Zhang, J.; Liu, S. What we have learnt from the beach nourishment project in Qinhuangdao. Mar. Geol. Front. 2014, 30, 1–15. [Google Scholar]
- Chen, H.; Zou, Q. Eulerian-Lagrangian flow-vegetation interaction model using immersed boundary method and OpenFOAM. Adv. Water Resour. 2019, 126, 176–192. [Google Scholar] [CrossRef]
- Chen, H.; Liu, X.; Zou, Q. Wave-driven flow induced by suspended and submerged canopies. Adv. Water Resour. 2019, 123, 160–172. [Google Scholar] [CrossRef]
- Zeng, B.; Sun, Y.; Song, W.; Wang, Z.; Zhang, X. Recurrence of the green tide in the Bohai Sea, China: A green tide caused by coastal reclamation projects. J. Sea Res. 2023, 191, 102333. [Google Scholar] [CrossRef]
- Kuang, C.; Yu, L.; Gu, J.; Dong, Z.; Song, H.; Zhu, L. Influences of artificial island on water exchange of Jinmeng Bay. China Environ. Sci. 2019, 39, 757–767. [Google Scholar]
- Kuang, C.; Zhao, F.; Song, H.; Gu, J. Analysis of superposition influence effect of artificial island group on coastal dynamics in a weak tidal zone. J. Tongji Univ. (Nat. Sci.) 2020, 48, 296–304. [Google Scholar]
- Wang, D.; Kuang, C.; Gu, J.; Dong, Z.; Yu, L. Impacts of Artificial Islands on the Hydrodynamics and Migration of Green Algae of Jinmeng Bay in Summer; The Fourteenth ISOPE Pacific/Asia Offshore Mechanics Symposium: Dalian, China, 2020. [Google Scholar]
- Han, X.; Kuang, C.; Li, Y.; Song, W.; Qin, R.; Wang, D. Numerical modeling of a green tide migration process with multiple artificial structures in the western Bohai Sea, China. Appl. Sci. 2022, 12, 3017. [Google Scholar] [CrossRef]
- Jiang, W.; Wang, S.; Yu, L.; Wang, L.; Wang, D. Relationship between the migration of Enteromorpha prolifera green tide and the changes of seawater environmental factors in the Yellow Sea area of southern Yantai in 2021. J. Ludong Univ. (Nat. Sci.) 2022, 38, 105–113. [Google Scholar]
- Zhu, D.; Chen, B.; Ya, H.; Dong, D. Study on numerical simulation of pollutant transport in Guangxi coastal waters. Guangxi Sci. 2019, 26, 669–675. [Google Scholar]
- Han, H.; Li, Y.; Ma, X.; Song, W.; Wang, Z.; Zhang, X. Factors influencing the spatial and temporal distributions of green algae micro-propagules in the coastal waters of Jinmenghaiwan, Qinhuangdao, China. Mar. Pollut. Bull. 2022, 175, 113328. [Google Scholar] [CrossRef]
- Pan, J.; Yu, F.; Wei, C.; Ren, Q.; Sun, S.; Li, J. Relationship between green tide outbreak and nitrate and hydrological environmental factors in the South Yellow Sea. Oceanol. Limnol. Sin. 2018, 49, 1031–1037. [Google Scholar]
Figure 1.
A view of Jinmeng Beach on (a) 7 July 2021; (b) 24 March 2023.

Figure 2.
Site map of the study area in Jinmeng Bay.

Figure 3.
The triple-level scheme of meshes. Grids of (a) Bohai Model, (b) Qinhuangdao Model, (c) Jinmeng Bay Model. Bathymetries of (d) Bohai Model, (e) Qinhuangdao Model, (f) Jinmeng Bay Model. The yellow squares show the refined areas in the lower level meshes.
Figure 3.
The triple-level scheme of meshes. Grids of (a) Bohai Model, (b) Qinhuangdao Model, (c) Jinmeng Bay Model. Bathymetries of (d) Bohai Model, (e) Qinhuangdao Model, (f) Jinmeng Bay Model. The yellow squares show the refined areas in the lower level meshes.

Figure 4.
The bathymetries of (a) the initial construction conditions, (b) the first-stage construction conditions, (c) the current construction conditions.
Figure 4.
The bathymetries of (a) the initial construction conditions, (b) the first-stage construction conditions, (c) the current construction conditions.

Figure 5.
Discharges and inputs of COD and NO3− from the west branch (WB) and the east branch (EB) of the Tanghe River and Xinkaihe River.
Figure 5.
Discharges and inputs of COD and NO3− from the west branch (WB) and the east branch (EB) of the Tanghe River and Xinkaihe River.

Figure 6.
Field observation sites of COD (G1~6) and NO3− (N1~4).

Figure 7.
Validations of COD and NO3− based on the observed data in 2020.

Figure 8.
Flow fields at (a) the peak flood, (b) the peak ebb during a typical neap tidal period and (c) the peak flood, (d) the peak ebb during a typical spring tidal period, under the current construction conditions.
Figure 8.
Flow fields at (a) the peak flood, (b) the peak ebb during a typical neap tidal period and (c) the peak flood, (d) the peak ebb during a typical spring tidal period, under the current construction conditions.

Figure 9.
Distributions of COD at (a) the peak flood, (b) the peak ebb during a typical neap tidal period and (c) the peak flood, (d) the peak ebb during a typical spring tidal period, under the current construction conditions.
Figure 9.
Distributions of COD at (a) the peak flood, (b) the peak ebb during a typical neap tidal period and (c) the peak flood, (d) the peak ebb during a typical spring tidal period, under the current construction conditions.

Figure 10.
Distributions of NO3− at (a) the peak flood, (b) the peak ebb during a typical neap tidal period and (c) the peak flood, (d) the peak ebb during a typical spring tidal period, under the current construction conditions.
Figure 10.
Distributions of NO3− at (a) the peak flood, (b) the peak ebb during a typical neap tidal period and (c) the peak flood, (d) the peak ebb during a typical spring tidal period, under the current construction conditions.

Figure 11.
Flow fields at (a) the peak flood, (b) the peak ebb during a typical spring tidal period under the initial construction conditions and (c) the peak flood, (d) the peak ebb during a typical spring tidal period, under the first-stage construction conditions.
Figure 11.
Flow fields at (a) the peak flood, (b) the peak ebb during a typical spring tidal period under the initial construction conditions and (c) the peak flood, (d) the peak ebb during a typical spring tidal period, under the first-stage construction conditions.

Figure 12.
Average concentration of COD during a spring tidal period under (a) the initial construction conditions, (b) the first-stage construction conditions and averaged concentration of NO3− during a spring tidal period under (c) the initial construction conditions, (d) the first-stage construction conditions.

Figure 13.
Locations of representative six sites.

Figure 14.
The average flow velocity and the average concentrations of COD and NO3− during a spring or neap tidal period at sites of A1 to A6.
Figure 14.
The average flow velocity and the average concentrations of COD and NO3− during a spring or neap tidal period at sites of A1 to A6.


Table 1.
Details of the triple-level scheme of meshes.
| Model | Level | Number of Elements | Maximum Resolution |
|---|---|---|---|
| Bohai Model | first | 6403 | 1200 m |
| Qinhuangdao Model | second | 34,071 | 10 m |
| Jinmeng Bay Model | third | 25,503 | 4 m |
Table 2.
Relative errors between the observed data and the simulated results.
| Site | Component | Date | Relative Error |
|---|---|---|---|
| G1 | COD | 28 June 2020 | 14.3% |
| G2 | COD | 28 June 2020 | 8.2% |
| G3 | COD | 28 June 2020 | 18.7% |
| G4 | COD | 28 June 2020 | 33.5% |
| G5 | COD | 28 June 2020 | 8.5% |
| G6 | COD | 28 June 2020 | 9.6% |
| N1 | NO3− | 16 May 2020 | 12.1% |
| N1 | NO3− | 27 May 2020 | 12.9% |
| N1 | NO3− | 14 June 2020 | 19.7% |
| N2 | NO3− | 16 May 2020 | 3.5% |
| N3 | NO3− | 27 May 2020 | 14.5% |
| N4 | NO3− | 28 June 2020 | 11.4% |
Disclaimer/Publisher’s Note: The statements, opinions and data contained in all publications are solely those of the individual author(s) and contributor(s) and not of MDPI and/or the editor(s). MDPI and/or the editor(s) disclaim responsibility for any injury to people or property resulting from any ideas, methods, instructions or products referred to in the content. |
© 2023 by the authors. Licensee MDPI, Basel, Switzerland. This article is an open access article distributed under the terms and conditions of the Creative Commons Attribution (CC BY) license (https://creativecommons.org/licenses/by/4.0/).
Share and Cite
MDPI and ACS Style
Fan, J.; Kuang, C.; Liu, H.; Wang, D.; Liu, J.; Wang, G.; Zou, Q. Impact of Artificial Islands and Reefs on Water Quality in Jinmeng Bay, China. Water 2023, 15, 959. https://doi.org/10.3390/w15050959
AMA Style
Fan J, Kuang C, Liu H, Wang D, Liu J, Wang G, Zou Q. Impact of Artificial Islands and Reefs on Water Quality in Jinmeng Bay, China. Water. 2023; 15(5):959. https://doi.org/10.3390/w15050959
Chicago/Turabian StyleFan, Jiadong, Cuiping Kuang, Huixin Liu, Dan Wang, Jiantao Liu, Gang Wang, and Qingping Zou. 2023. "Impact of Artificial Islands and Reefs on Water Quality in Jinmeng Bay, China" Water 15, no. 5: 959. https://doi.org/10.3390/w15050959
Note that from the first issue of 2016, this journal uses article numbers instead of page numbers. See further details here.