
Beyond the Black Box of Life Cycle Assessment in Wastewater Treatment Plants: Which Help from Bioassays?
 , , , ,
Abstract
:1. Introduction
2. Materials and Methods
2.1. Wastewater Treatment Plants (WWTPs)
2.2. Sampling Procedures
2.3. PEF/OEF Procedures
- : Impact Score for the considered impact category
- : Characterization Factor of the substance emitted to compartment
- : the emitted ass of substance to compartment
3. Results and Discussion
3.1. Standard Approach: Open Issues Intrinsic to the Methodology
- The characterization factor’s inherent variability.
- ♦
- The expression of the limit of quantification (LOQ) in the chemical analyses.
- ∗
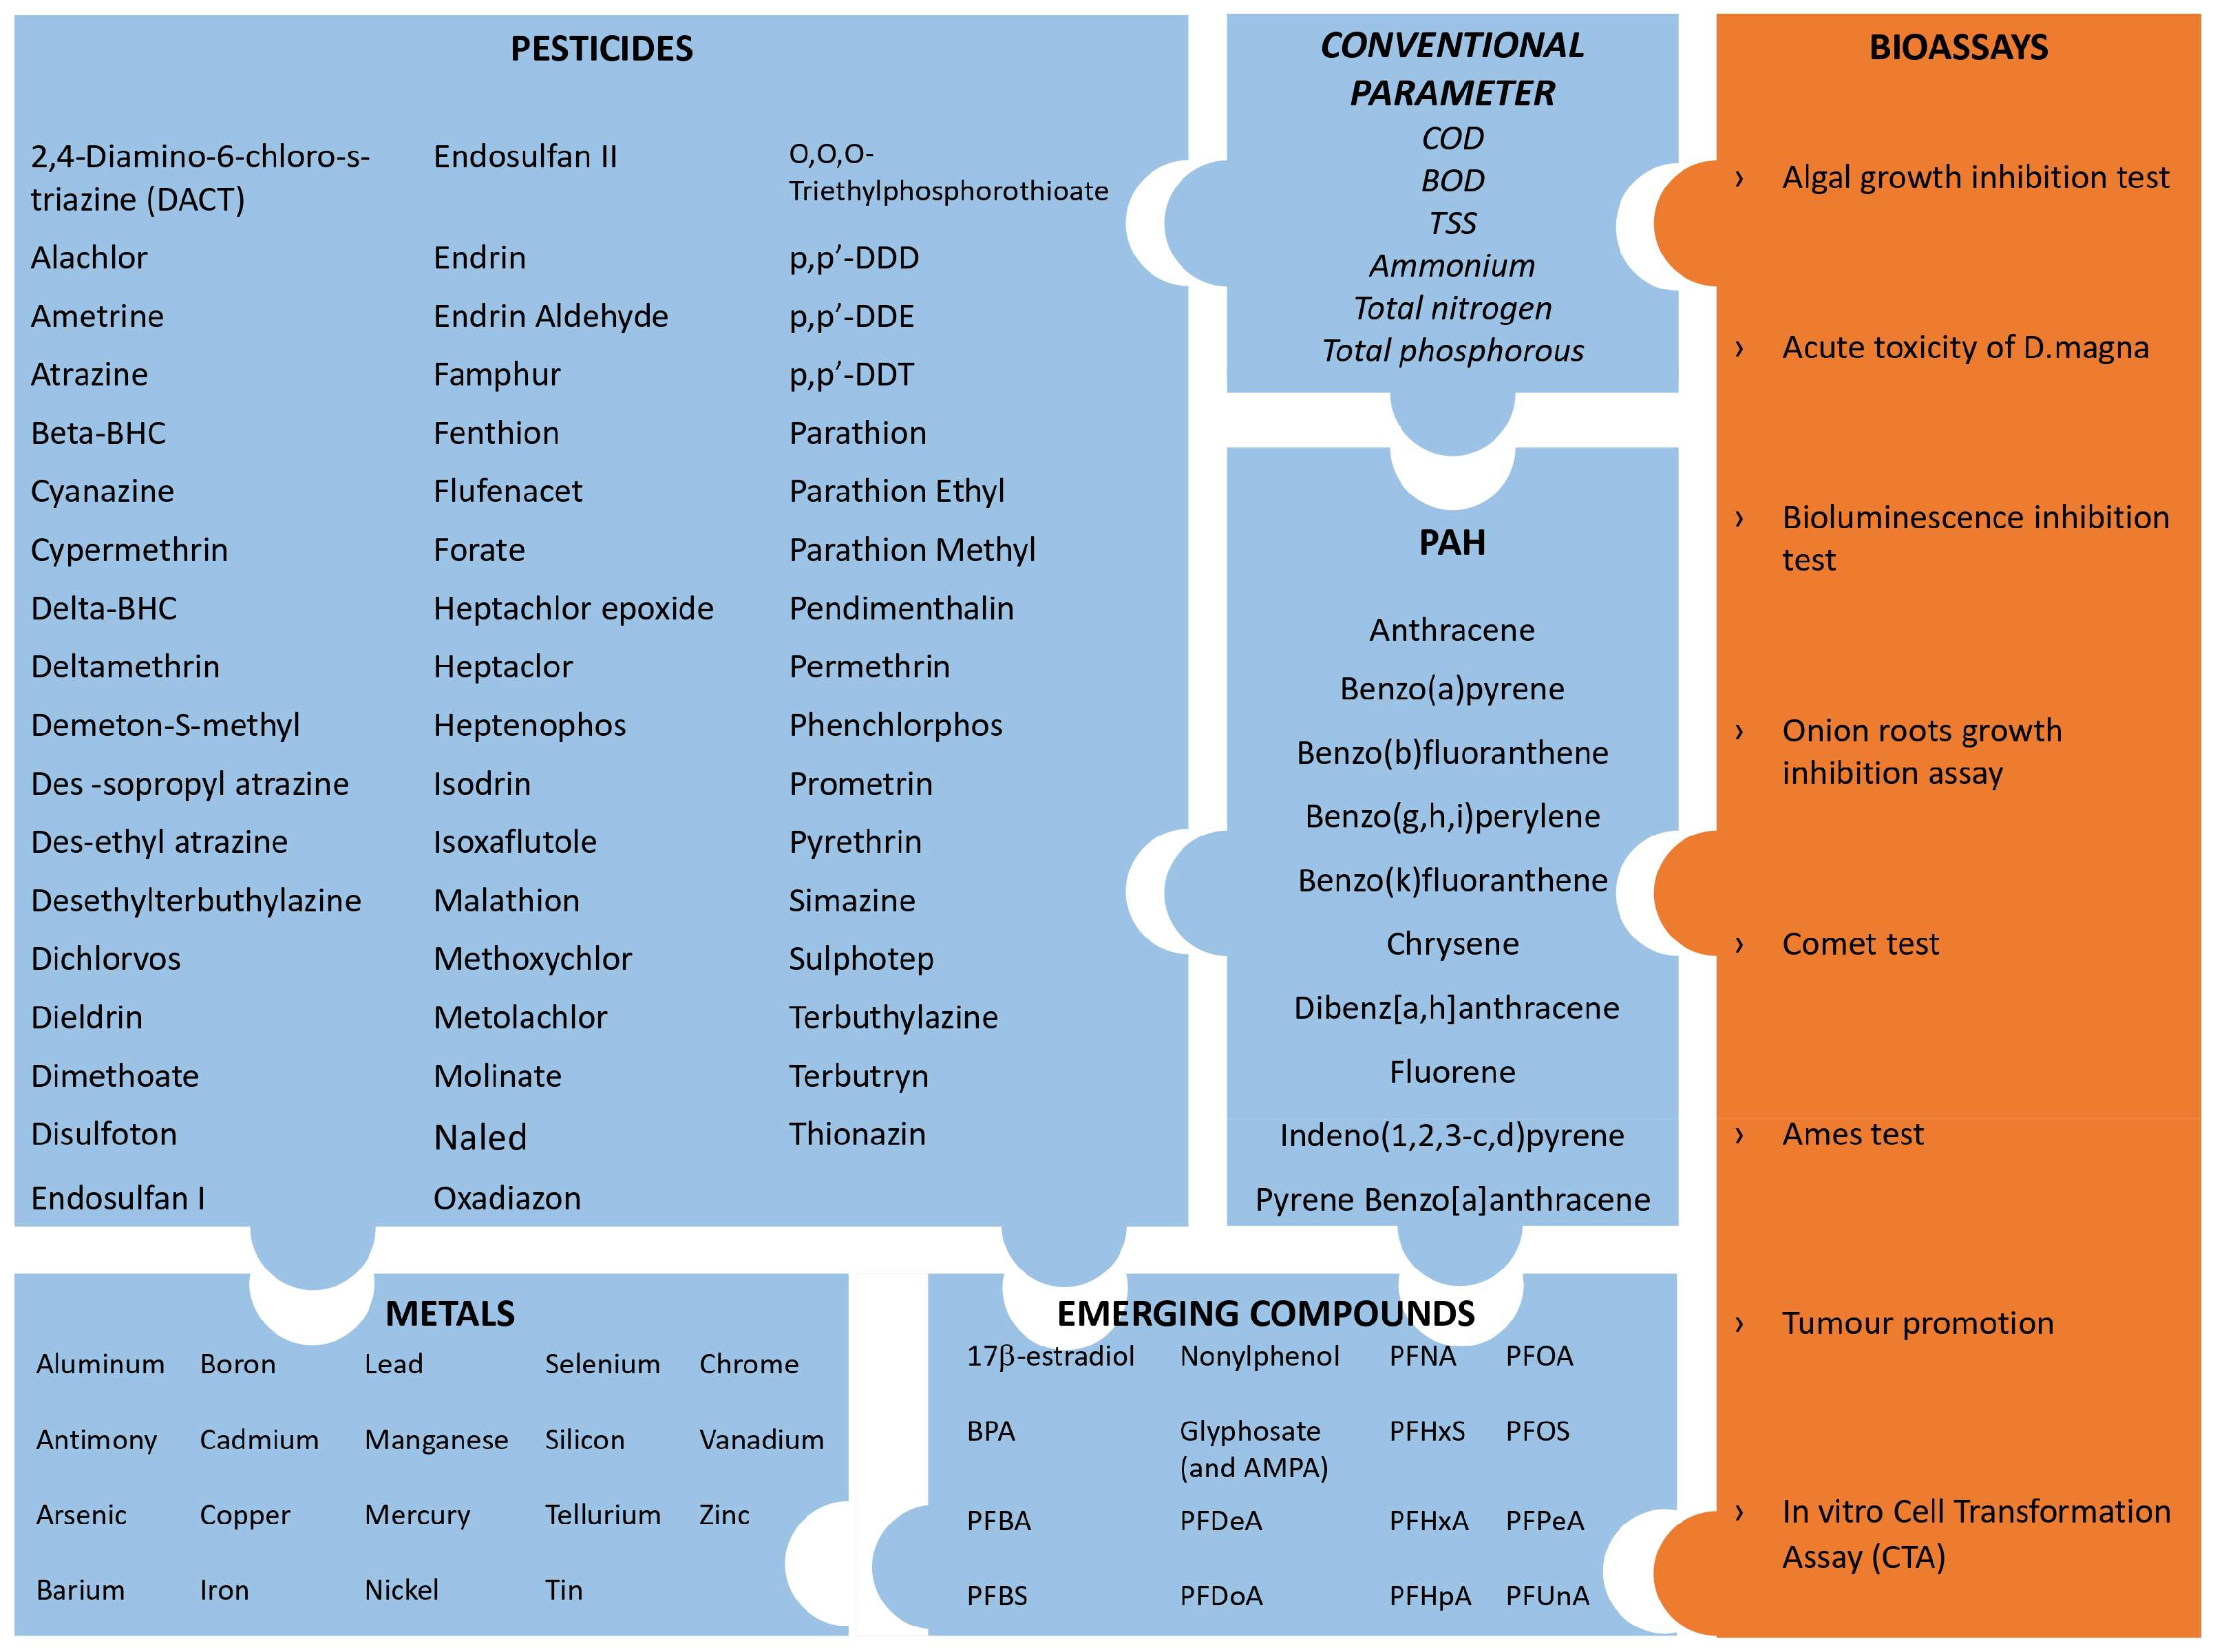
- Regulated, known, and unknown chemicals.
- ~
- Mixture effect.
3.2. Alternative Approach: A Step towards Overcoming Weak Points
- ♦
- The expression of the limit of quantification (LOQ) in the chemical analyses.
- ∗
- Regulated, known, and unknown chemicals.
- ~
- Mixture effect.
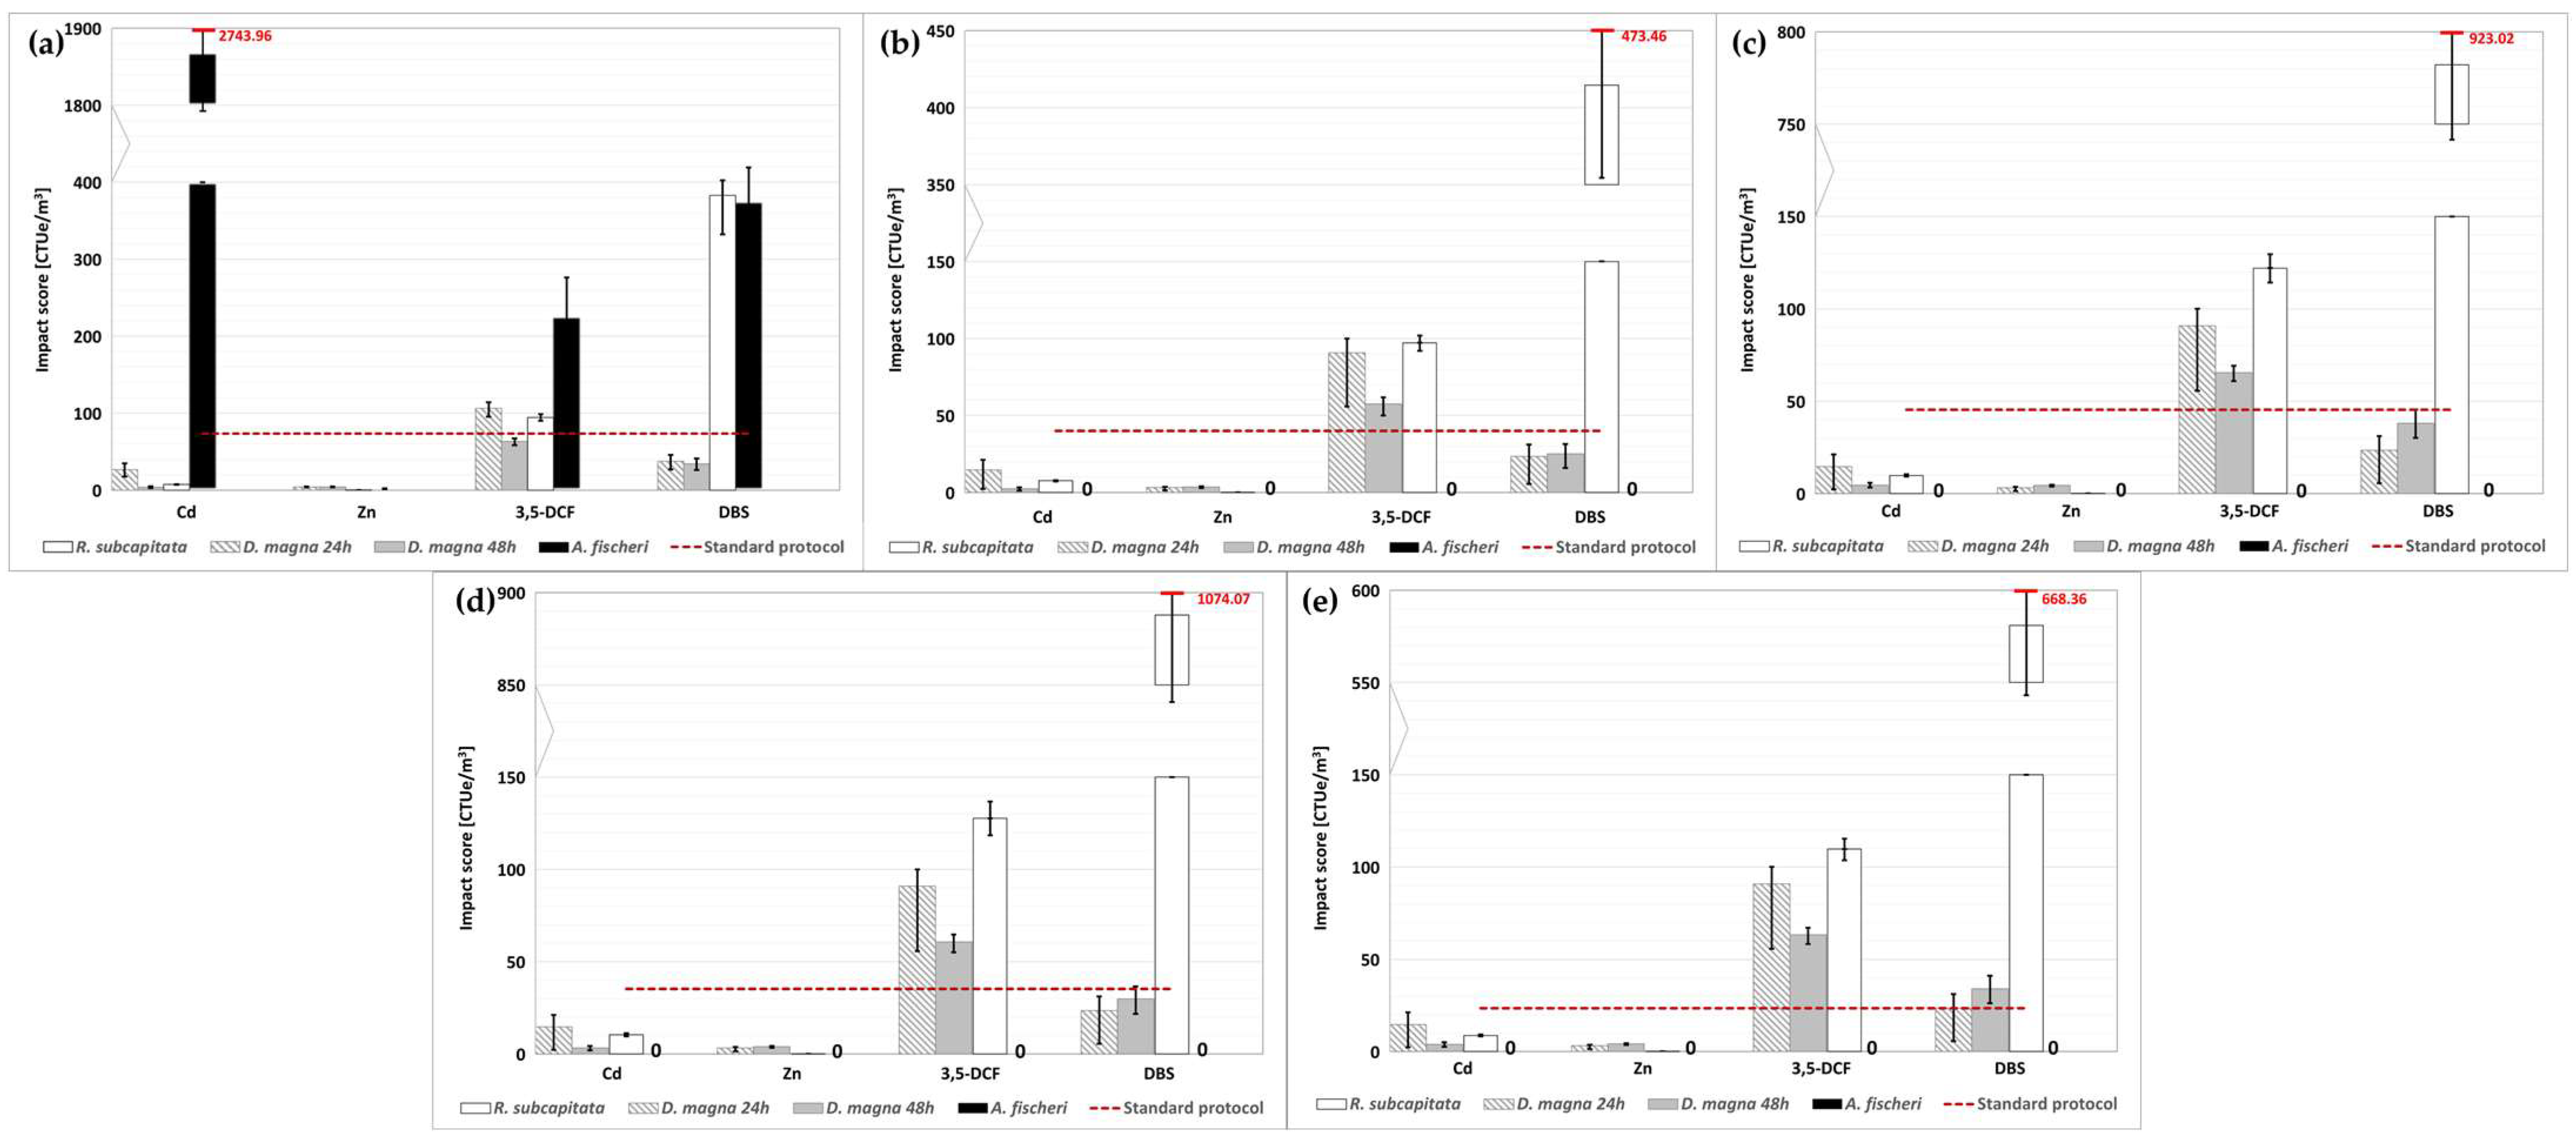
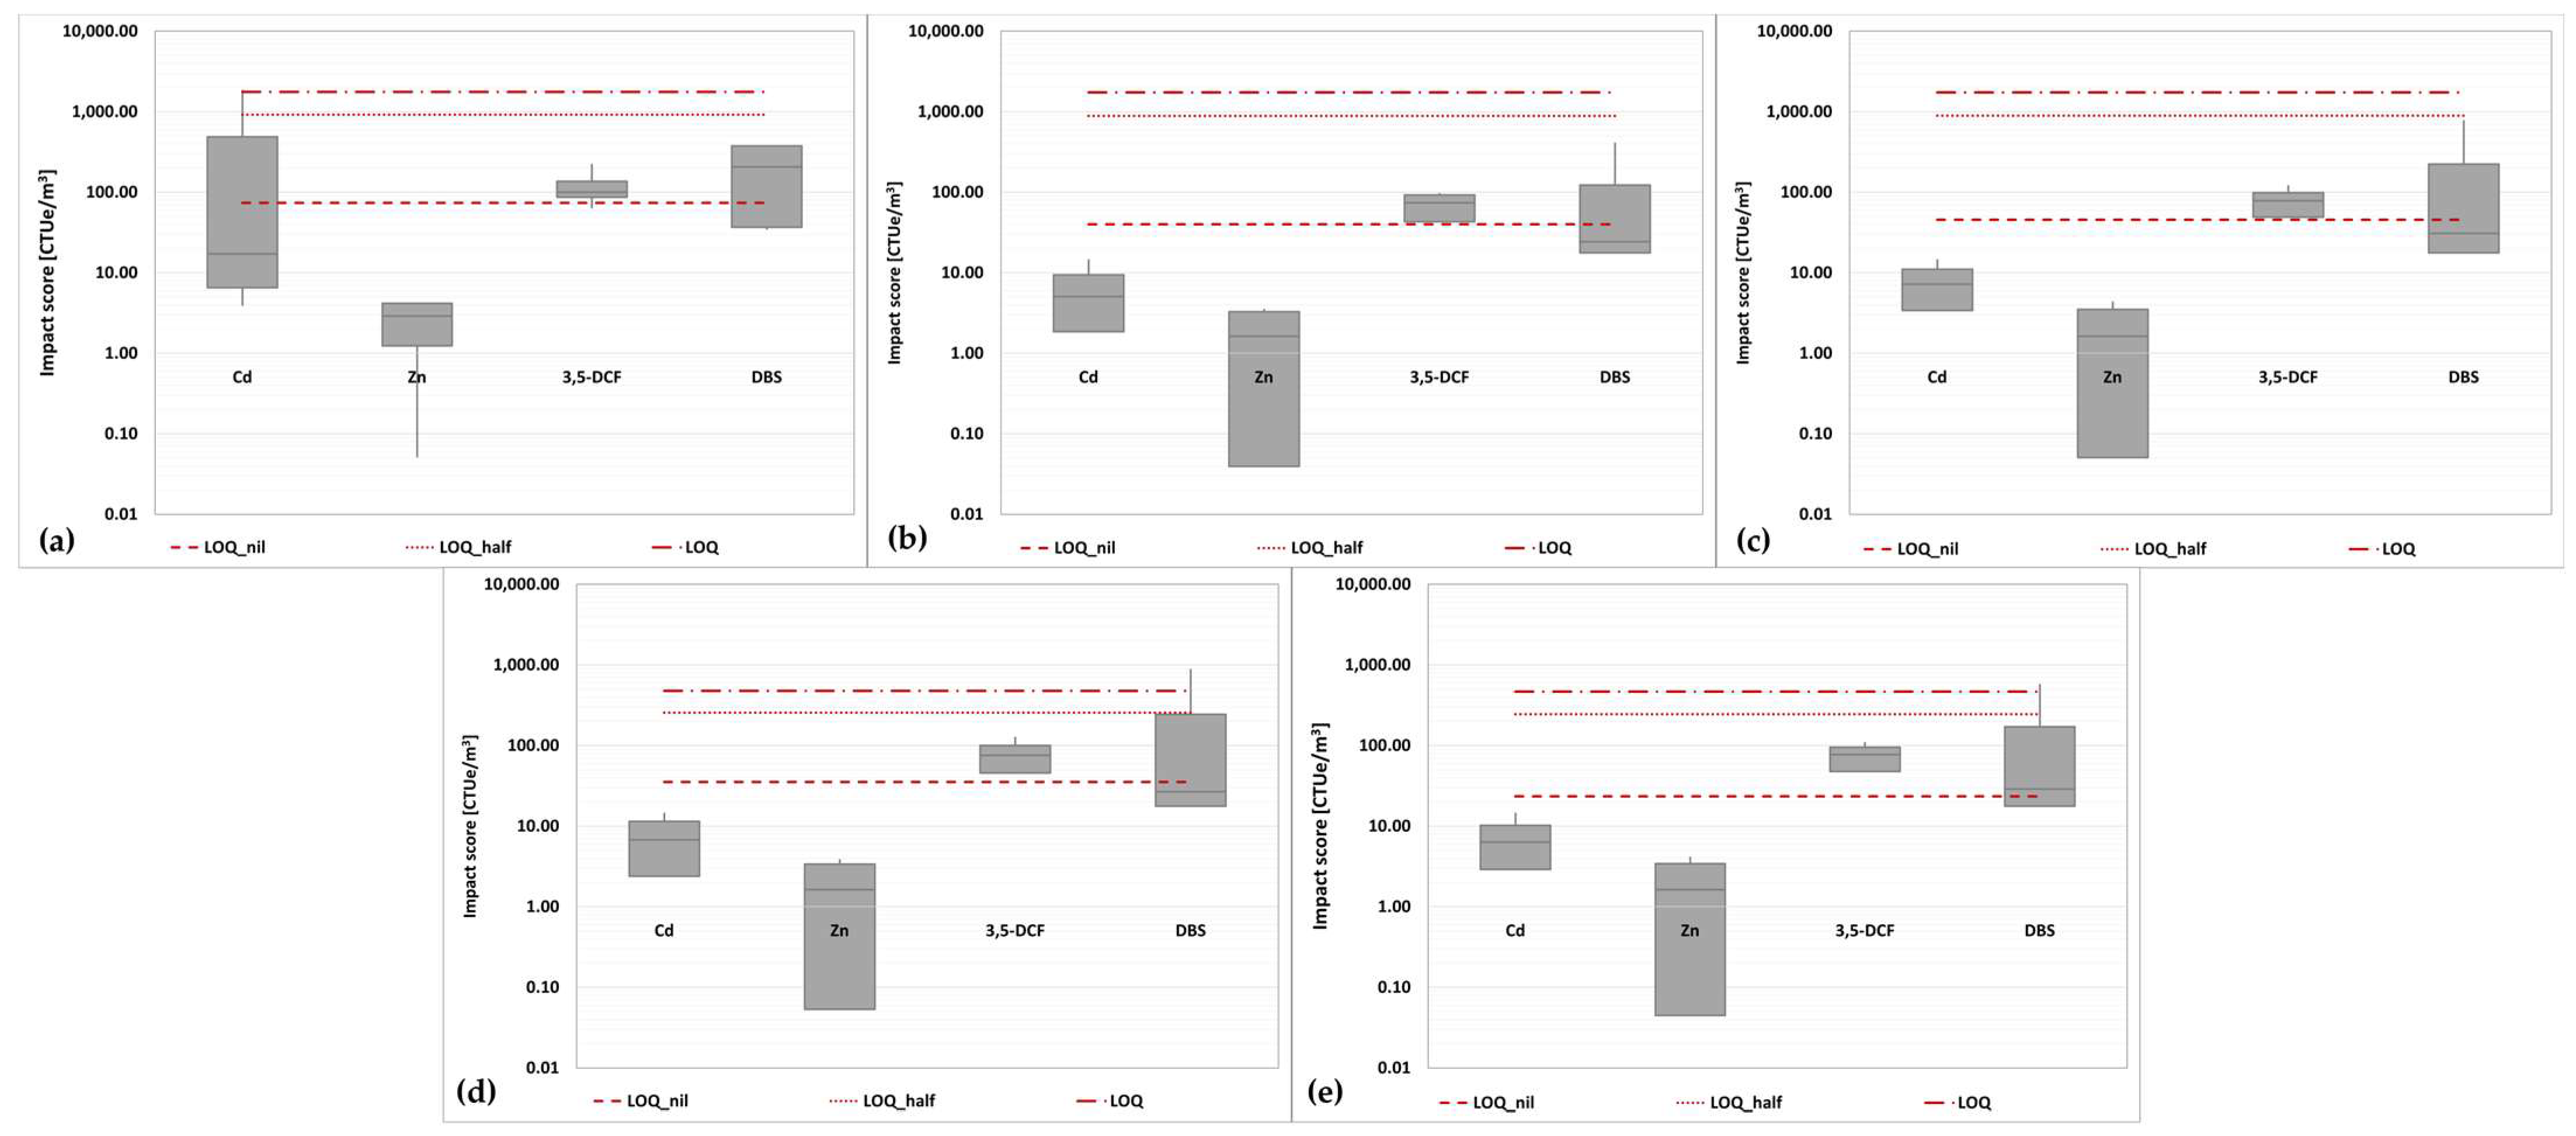
3.2.1. Comparing the Protocols: Freshwater Ecotoxicity
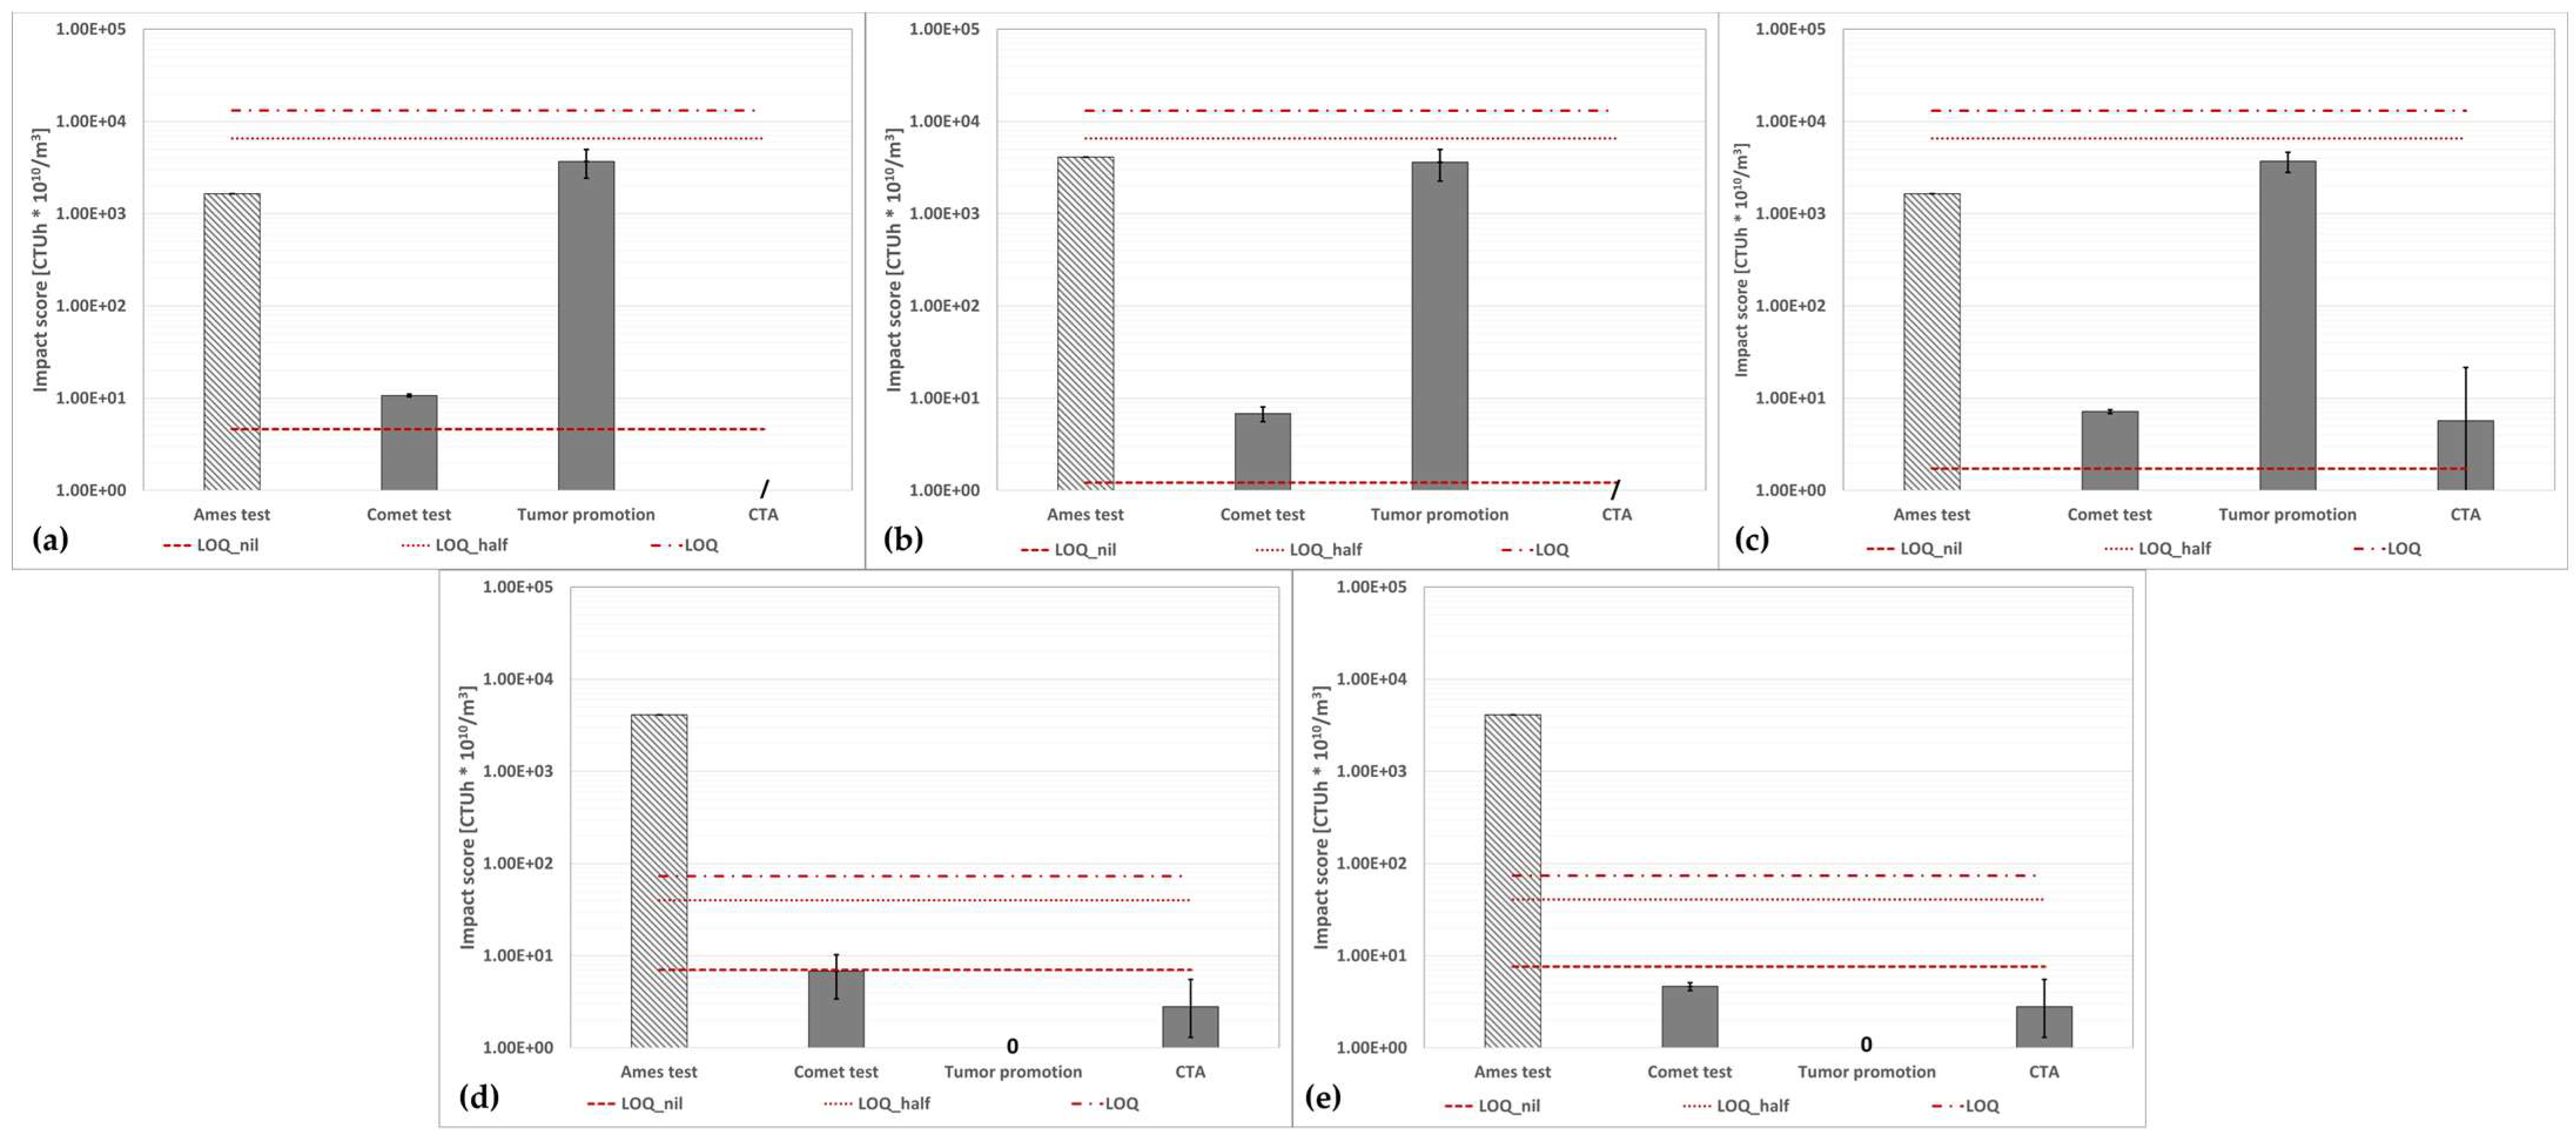
3.2.2. Comparing the Protocols: Human Toxicity/Cancer: Outcomes
4. Conclusions
Author Contributions
Funding
Data Availability Statement
Conflicts of Interest
References
- Lazzarini, G.A.; Visschers, V.H.M.; Siegrist, M. How to Improve Consumers’ Environmental Sustainability Judgements of Foods. J. Clean. Prod. 2018, 198, 564–574. [Google Scholar] [CrossRef]
- Sánchez-Bravo, P.; Chambers, V.E.; Noguera-Artiaga, L.; Sendra, E.; Chambers, E., IV; Carbonell-Barrachina, Á.A. Consumer Understanding of Sustainability Concept in Agricultural Products. Food Qual. Prefer. 2021, 89, 104136. [Google Scholar] [CrossRef]
- Kalboussi, N.; Biard, Y.; Pradeleix, L.; Rapaport, A.; Sinfort, C.; Ait-mouheb, N. Life Cycle Assessment as Decision Support Tool for Water Reuse in Agriculture Irrigation. Sci. Total Environ. 2022, 836, 155486. [Google Scholar] [CrossRef] [PubMed]
- Pasqualino, J.C.; Meneses, M.; Abella, M.; Castells, F. LCA as a Decision Support Tool for the Environmental Improvement of the Operation of a Municipal Wastewater Treatment Plant. Environ. Sci. Technol. 2009, 43, 3300–3307. [Google Scholar] [CrossRef] [PubMed]
- Sala, S.; Anton, A.; McLaren, S.J.; Notarnicola, B.; Saouter, E.; Sonesson, U. In Quest of Reducing the Environmental Impacts of Food Production and Consumption. J. Clean. Prod. 2017, 140, 387–398. [Google Scholar] [CrossRef]
- Muralikrishna, I.V.; Manickam, V.; Muralikrishna, I.V.; Manickam, V. Environmental Management: Science and Engineering for Industry; Butterworth-Heinemann: Oxford, UK, 2017; ISBN 9780128119891. [Google Scholar]
- Home-Consilium. Available online: https://www.consilium.europa.eu/en/ (accessed on 10 January 2023).
- Pedrazzani, R.; Ziliani, E.; Cavallotti, I.; Bollati, E.; Ferreri, M.; Bertanza, G. Use of Ecotoxicology Tools within the Environmental Footprint Evaluation Protocols: The Case of Wastewater Treatment Plants. Desalination Water Treat 2019, 172, 2–14. [Google Scholar] [CrossRef]
- European Commission Service Site. Available online: https://eplca.jrc.ec.europa.eu/ (accessed on 10 January 2023).
- Boldrin, M.T.N.; Formiga, K.T.M.; Pacca, S.A. Environmental Performance of an Integrated Water Supply and Wastewater System through Life Cycle Assessment—A Brazilian Case Study. Sci. Total Environ. 2022, 835, 155213. [Google Scholar] [CrossRef]
- Chhipi-Shrestha, G.; Hewage, K.; Sadiq, R. Fit-for-Purpose Wastewater Treatment: Testing to Implementation of Decision Support Tool (II). Sci. Total Environ. 2017, 607–608, 403–412. [Google Scholar] [CrossRef]
- Corominas, L.; Foley, J.; Guest, J.S.; Hospido, A.; Larsen, H.F.; Morera, S.; Shaw, A. Life Cycle Assessment Applied to Wastewater Treatment: State of the Art. Water Res. 2013, 47, 5480–5492. [Google Scholar] [CrossRef]
- de Feo, G.; Ferrara, C. Investigation of the Environmental Impacts of Municipal Wastewater Treatment Plants through a Life Cycle Assessment Software Tool. Environ. Technol. 2017, 38, 1943–1948. [Google Scholar] [CrossRef]
- Ferreira, A.C.D.; Oliveira, S.; Benassi, R.F. Comparison of Alternative Wastewater Treatment Plants Using Life Cycle Assessment (Lca); Springer Nature Switzerland AG: Cham, Switzerland, 2021; Volume 198, ISBN 9783030553739. [Google Scholar]
- Guven, H.; Eriksson, O.; Wang, Z.; Ozturk, I. Life Cycle Assessment of Upgrading Options of a Preliminary Wastewater Treatment Plant Including Food Waste Addition. Water Res. 2018, 145, 518–530. [Google Scholar] [CrossRef] [PubMed]
- Mellino, S.; Protano, G.; Buonocore, E.; Angelis, G.D.; Liu, G.; Xu, L.; Ulgiati, S. Alternative Options for Sewage Sludge Treatment and Process Improvement through Circular Patterns: LCA-Based Case Study and Scenarios. J. Environ. Account. Manag. 2015, 3, 77–85. [Google Scholar] [CrossRef] [Green Version]
- Muñoz, I.; José Gómez, M.; Molina-Díaz, A.; Huijbregts, M.A.J.; Fernández-Alba, A.R.; García-Calvo, E. Ranking Potential Impacts of Priority and Emerging Pollutants in Urban Wastewater through Life Cycle Impact Assessment. Chemosphere 2008, 74, 37–44. [Google Scholar] [CrossRef] [PubMed]
- Pham, A.; Moussavi, S.; Thompson, M.; Dvorak, B. Environmental Life Cycle Impacts of Small Wastewater Treatment Plants: Design Recommendations for Impact Mitigation. Water Res. 2021, 207, 117758. [Google Scholar] [CrossRef] [PubMed]
- Raghuvanshi, S.; Bhakar, V.; Sowmya, C.; Sangwan, K.S. Waste Water Treatment Plant Life Cycle Assessment: Treatment Process to Reuse of Water. In Proceedings of the Procedia CIRP; Elsevier: Berlin/Heidelberg, Germany, 2017; Volume 61, pp. 761–766. [Google Scholar]
- Rashid, S.S.; Liu, Y.-Q. Comparison of Life Cycle Toxicity Assessment Methods for Municipal Wastewater Treatment with the Inclusion of Direct Emissions of Metals, PPCPs and EDCs. Sci. Total Environ. 2021, 756, 143849. [Google Scholar] [CrossRef] [PubMed]
- Szulc, P.; Kasprzak, J.; Dymaczewski, Z.; Kurczewski, P. Life Cycle Assessment of Municipal Wastewater Treatment Processes Regarding Energy Production from the Sludge Line. Energies 2021, 14, 356. [Google Scholar] [CrossRef]
- Wu, J.-G.; Meng, X.-Y.; Liu, X.-M.; Liu, X.-W.; Zheng, Z.-X.; Xu, D.-Q.; Sheng, G.-P.; Yu, H.-Q. Life Cycle Assessment of a Wastewater Treatment Plant Focused on Material and Energy Flows. Environ. Manag. 2010, 46, 610–617. [Google Scholar] [CrossRef]
- Altenburger, R.; Brack, W.; Burgess, R.M.; Busch, W.; Escher, B.I.; Focks, A.; Mark Hewitt, L.; Jacobsen, B.N.; de Alda, M.L.; Ait-Aissa, S.; et al. Future Water Quality Monitoring: Improving the Balance between Exposure and Toxicity Assessments of Real-World Pollutant Mixtures. Environ. Sci. Eur. 2019, 31, 12. [Google Scholar] [CrossRef] [Green Version]
- Tousova, Z.; Oswald, P.; Slobodnik, J.; Blaha, L.; Muz, M.; Hu, M.; Brack, W.; Krauss, M.; di Paolo, C.; Tarcai, Z.; et al. European Demonstration Program on the Effect-Based and Chemical Identification and Monitoring of Organic Pollutants in European Surface Waters. Sci. Total Environ. 2017, 601–602, 1849–1868. [Google Scholar] [CrossRef]
- Brack, W.; Aissa, S.A.; Backhaus, T.; Dulio, V.; Escher, B.I.; Faust, M.; Hilscherova, K.; Hollender, J.; Hollert, H.; Müller, C.; et al. Effect-Based Methods Are Key. The European Collaborative Project SOLUTIONS Recommends Integrating Effect-Based Methods for Diagnosis and Monitoring of Water Quality. Environ. Sci. Eur. 2019, 31, 10. [Google Scholar] [CrossRef]
- Dingemans, M.M.L.; Baken, K.A.; van der Oost, R.; Schriks, M.; van Wezel, A.P. Risk-Based Approach in the Revised European Union Drinking Water Legislation: Opportunities for Bioanalytical Tools. Integr. Environ. Assess. Manag. 2019, 15, 126–134. [Google Scholar] [CrossRef] [PubMed]
- van der Oost, R.; Sileno, G.; Suárez-Muñoz, M.; Nguyen, M.T.; Besselink, H.; Brouwer, A. SIMONI (Smart Integrated Monitoring) as a Novel Bioanalytical Strategy for Water Quality Assessment: Part i–Model Design and Effect-Based Trigger Values. Environ. Toxicol. Chem. 2017, 36, 2385–2399. [Google Scholar] [CrossRef] [PubMed]
- Escher, B.; Neale, P.; Leusch, F. Bioanalytical Tools in Water Quality Assessment; IWA Publishing: London, UK, 2021. [Google Scholar] [CrossRef]
- Bertanza, G.; Boniotti, J.; Ceretti, E.; Feretti, D.; Mazzoleni, G.; Menghini, M.; Pedrazzani, R.; Steimberg, N.; Urani, C.; Viola, G.C.V.; et al. Environmental Footprint of Wastewater Treatment: A Step Forward in the Use of Toxicological Tools. Int. J. Environ. Res. Public Health 2021, 18, 6827. [Google Scholar] [CrossRef]
- Papa, M.; Paredes, L.; Feretti, D.; Viola, G.; Mazzoleni, G.; Steimberg, N.; Pedrazzani, R.; Lema, J.; Omil, F.; Carballa, M. How Should Ecohazard of Micropollutants in Wastewater Be Gauged? Using Bioassays to Profile Alternative Tertiary Treatments. Environ. Eng. Res. 2021, 26, 200153. [Google Scholar] [CrossRef]
- Chen, Z.; Li, M.; Wen, Q. Comprehensive Evaluation of Three Sets of Advanced Wastewater Treatment Trains for Treating Secondary Effluent: Organic Micro-Pollutants and Bio-Toxicity. Chemosphere 2017, 189, 426–434. [Google Scholar] [CrossRef] [PubMed]
- Smital, T.; Terzic, S.; Zaja, R.; Senta, I.; Pivcevic, B.; Popovic, M.; Mikac, I.; Tollefsen, K.E.; Thomas, K.V.; Ahel, M. Assessment of Toxicological Profiles of the Municipal Wastewater Effluents Using Chemical Analyses and Bioassays. Ecotoxicol. Environ. Saf. 2011, 74, 844–851. [Google Scholar] [CrossRef]
- Castro, A.M.; Nogueira, V.; Lopes, I.; Rocha-Santos, T.; Pereira, R. Evaluation of the Potential Toxicity of Effluents from the Textile Industry before and after Treatment. Appl. Sci. 2019, 9, 3804. [Google Scholar] [CrossRef] [Green Version]
- Bertanza, G.; Steimberg, N.; Pedrazzani, R.; Boniotti, J.; Ceretti, E.; Mazzoleni, G.; Menghini, M.; Urani, C.; Zerbini, I.; Feretti, D. Wastewater Toxicity Removal: Integrated Chemical and Effect-Based Monitoring of Full-Scale Conventional Activated Sludge and Membrane Bioreactor Plants. Sci. Total Environ. 2022, 851, 158071. [Google Scholar] [CrossRef]
- Neale, P.A.; Feliers, C.; Glauch, L.; König, M.; Lecarpentier, C.; Schlichting, R.; Thibert, S.; Escher, B.I. Application of: In Vitro Bioassays for Water Quality Monitoring in Three Drinking Water Treatment Plants Using Different Treatment Processes Including Biological Treatment, Nanofiltration and Ozonation Coupled with Disinfection. Environ. Sci. 2020, 6, 2444–2453. [Google Scholar] [CrossRef]
- Neale, P.A.; Escher, B.I. In Vitro Bioassays to Assess Drinking Water Quality. Curr. Opin. Environ. Sci. Health 2019, 7, 1–7. [Google Scholar] [CrossRef]
- Rosenmai, A.K.; Lundqvist, J.; le Godec, T.; Ohlsson, Å.; Tröger, R.; Hellman, B.; Oskarsson, A. In Vitro Bioanalysis of Drinking Water from Source to Tap. Water Res. 2018, 139, 272–280. [Google Scholar] [CrossRef]
- Gómez, L.; Niegowska, M.; Navarro, A.; Amendola, L.; Arukwe, A.; Ait-Aissa, S.; Balzamo, S.; Barreca, S.; Belkin, S.; Bittner, M.; et al. Estrogenicity of Chemical Mixtures Revealed by a Panel of Bioassays. Sci. Total Environ. 2021, 785, 147284. [Google Scholar] [CrossRef] [PubMed]
- Bertanza, G.; Canato, M.; Laera, G.; Vaccari, M.; Svanström, M.; Heimersson, S. A Comparison between Two Full-Scale MBR and CAS Municipal Wastewater Treatment Plants: Techno-Economic-Environmental Assessment. Environ. Sci. Pollut. Res. 2017, 24, 17383–17393. [Google Scholar] [CrossRef] [PubMed]
- Bertanza, G.; Boiocchi, R.; Pedrazzani, R. Improving the Quality of Wastewater Treatment Plant Monitoring by Adopting Proper Sampling Strategies and Data Processing Criteria. Sci. Total Environ. 2022, 806, 150724. [Google Scholar] [CrossRef] [PubMed]
- Pedrazzani, R.; Baroni, P.; Feretti, D.; Mazzoleni, G.; Steimberg, N.; Urani, C.; Viola, G.; Zerbini, I.; Ziliani, E.; Bertanza, G. Methodological Protocol for Assessing the Environmental Footprint by Means of Ecotoxicological Tools: Wastewater Treatment Plants as an Example Case; Ecotoxicological QSARs. Methods in Pharmacology and Toxicology; Humana: New York, NY, USA, 2020. [Google Scholar] [CrossRef]
- ISO 8692:2012; International Organization for Standardization (ISO) Water Quality-Fresh Water Algal Growth Inhibition Test with Unicellular Green Algae. International Organization for Standardization: Geneva, Switzerland, 2012.
- ISO 6341:2012; Water Quality-Determination of the Inhibition of the Mobility of Daphnia Magna Straus (Cladocera, Crustacea)-Acute Toxicity Test. International Organization for Standardization: Geneva, Switzerland, 2012.
- ISO 11368-3:2007; Water Quality-Determination of the Inhibitory Effect of Water Samples on the Light Emission of Vibrio Fischeri (Luminescent Bacteria Test)-Part 3: Method Using Freeze-Dried Bacteria. International Organization for Standardization: Geneva, Switzerland, 2007.
- Fiskesjö, G. Allium Test. In In Vitro Toxicity Testing Protocols; Springer Science and Business Media LCC: Berlin/Heidelberg, Germany, 1995; pp. 119–127. [Google Scholar]
- APHA. Standard Methods for the Examination of Water and Wastewater; American Public Health Association: Washington, DC, USA, 2017; ISBN 087553287X. [Google Scholar]
- Singh, N.P.; McCoy, M.T.; Tice, R.R.; Schneider, E.L. A Simple Technique for Quantitation of Low Levels of DNA Damage in Individual Cells. Exp. Cell Res. 1988, 175, 184–191. [Google Scholar] [CrossRef] [Green Version]
- Tice, R.R.; Agurell, E.; Anderson, D.; Burlinson, B.; Hartmann, A.; Kobayashi, H.; Miyamae, Y.; Rojas, E.; Ryu, J.-C.; Sasaki, Y.F. Single Cell Gel/Comet Assay: Guidelines for in Vitro and in Vivo Genetic Toxicology Testing. Environ. Mol. Mutagen. 2000, 35, 206–221. [Google Scholar] [CrossRef]
- Maron, D.M.; Ames, B.N. Revised Methods for the Salmonella Mutagenicity Test. Mutat. Res. Environ. Mutagen. Relat. Subj. 1983, 113, 173–215. [Google Scholar] [CrossRef]
- Rosenbaum, R.K.; Bachmann, T.M.; Gold, L.S.; Huijbregts, M.A.J.; Jolliet, O.; Juraske, R.; Koehler, A.; Larsen, H.F.; MacLeod, M.; Margni, M.; et al. USEtox-The UNEP-SETAC Toxicity Model: Recommended Characterisation Factors for Human Toxicity and Freshwater Ecotoxicity in Life Cycle Impact Assessment. Int. J. Life Cycle Assess. 2008, 13, 532–546. [Google Scholar] [CrossRef] [Green Version]
- Saouter, E.; Biganzoli, F.; Ceriani, L.; Versteeg, D.; Crenna, E.; Zampori, L.; Sala, S.; Pant, R. Environmental Footprint: Update of Life Cycle Impact Assessment Methods: Ecotoxicity Freshwater, Human Toxicity Cancer, and Non-Cancer; Publications Office of the European Union: Luxembourg, 2018. [Google Scholar]
- Rey-Álvarez, B.; Sánchez-Montañés, B.; García-Martínez, A. Building Material Toxicity and Life Cycle Assessment: A Systematic Critical Review. J. Clean. Prod. 2022, 341, 130838. [Google Scholar] [CrossRef]
- Kobetičová, K.; Černý, R. Ecotoxicology of Building Materials: A Critical Review of Recent Studies. J. Clean. Prod. 2017, 165, 500–508. [Google Scholar] [CrossRef]
- Maia, M.B.; de Brito, J.; Martins, I.M.; Silvestre, J.D. Toxicity of Cement-Based Materials. In Proceedings of the IOP Conference Series: Earth and Environmental Science; IOP Publishing: Bristol, UK, 2020; Volume 588. [Google Scholar]
- Dorca-Preda, T.; Fantke, P.; Mogensen, L.; Knudsen, M.T. Towards a More Comprehensive Life Cycle Assessment Framework for Assessing Toxicity-Related Impacts for Livestock Products: The Case of Danish Pork. Sci. Total Environ. 2022, 815, 152811. [Google Scholar] [CrossRef] [PubMed]
- Emara, Y.; Lehmann, A.; Siegert, M.W.; Finkbeiner, M. Modeling Pharmaceutical Emissions and Their Toxicity-Related Effects in Life Cycle Assessment (LCA): A Review. Integr. Environ. Assess. Manag. 2019, 15, 6–18. [Google Scholar] [CrossRef] [PubMed] [Green Version]
- Roos, S.; Jönsson, C.; Posner, S.; Arvidsson, R.; Svanström, M. An Inventory Framework for Inclusion of Textile Chemicals in Life Cycle Assessment. Int. J. Life Cycle Assess. 2019, 24, 838–847. [Google Scholar] [CrossRef] [Green Version]
- Zhang, S.; Ke, M.; Li, L.; Chen, K.; Hicks, A.; Wu, F.; You, J. UV-Dependent Freshwater Effect Factor of Nanoscale Titanium Dioxide for Future Life Cycle Assessment Application. Integr. Environ. Assess. Manag. 2022, 18, 1221–1232. [Google Scholar] [CrossRef] [PubMed]
- Sanyé-Mengual, E.; Sala, S. Life Cycle Assessment Support to Environmental Ambitions of EU Policies and the Sustainable Development Goals. Integr. Environ. Assess. Manag. 2022, 18, 1221–1232. [Google Scholar] [CrossRef]
- Avadí, A.; Benoit, P.; Bravin, M.; Cournoyer, B.; Feder, F.; Galia, W.; Garnier, P.; Haudin, C.-S.; Legros, S.; Mamy, L.; et al. Trace Contaminants in the Environmental Assessment of Organic Waste Recycling in Agriculture: Gaps between Methods and Knowledge. Adv. Agron. 2022, 174, 53–188. [Google Scholar] [CrossRef]
- Pivato, A.; Vanin, S.; Raga, R.; Lavagnolo, M.C.; Barausse, A.; Rieple, A.; Laurent, A.; Cossu, R. Use of Digestate from a Decentralized On-Farm Biogas Plant as Fertilizer in Soils: An Ecotoxicological Study for Future Indicators in Risk and Life Cycle Assessment. Waste Manag. 2016, 49, 378–389. [Google Scholar] [CrossRef] [Green Version]


| Reference Substance | ILCD | EF 3.0 |
|---|---|---|
| Cadmium | 9710 | 229,000 |
| Zinc | 38,600 | 1330 |
| 3,5-dichlorophenol | 6910 | 50,780 |
| Dodecyl benzene sulfonic acid | 3110 | 11,963 |
| Maleic hydrazide | 182 | 2175.2 |
| Reference Substance | ILCD | EF 3.0 |
|---|---|---|
| Methyl methanesulfonate (MMS) | 2.51 × 10⁻⁶ | 2.51 × 10⁻⁶ |
| Lindane | 3.35 × 10⁻⁵ | 1.10 × 10⁻⁴ |
| 3-methylcholanthrene (3MCA) | 4.82 × 10⁻⁵ | 4.08 × 10⁻⁵ |
| WWTP | ILCD CTUe/m3 | EF 3.0 CTUe/m3 |
|---|---|---|
| A | 4.27 | 73.62 |
| B (routine time) | 0.63 | 39.96 |
| B (grape harvest time) | 0.63 | 45.40 |
| C (CAS) | 8.94 | 35.25 |
| C (MBR) | 6.96 | 23.42 |
| WWTP | ILCD CTUh/m3 | EF 3.0 CTUh/m3 |
|---|---|---|
| A | 1.73 × 10⁻⁹ | 4.62 × 10⁻¹⁰ |
| B (routine time) | 6.71 × 10⁻¹⁰ | 1.22 × 10⁻¹⁰ |
| B (grape harvest time) | 8.63 × 10⁻¹⁰ | 1.73 × 10⁻¹⁰ |
| C (CAS) | 2.26 × 10⁻⁹ | 7.02 × 10⁻¹⁰ |
| C (MBR) | 2.45 × 10⁻⁹ | 7.61 × 10⁻¹⁰ |
| WWTP | Standard Approach | |||||
|---|---|---|---|---|---|---|
| Freshwater Ecotoxicity | Human Toxicity/Cancer | |||||
| Hyp. 1 | Hyp. 2 | Hyp. 3 | Hyp. 1 | Hyp. 2 | Hyp. 3 | |
| A | 73.62 | 919.89 | 1766.16 | 4.62 × 10⁻¹⁰ | 6.56 × 10⁻⁷ | 1.31 × 10⁻⁶ |
| B (routine time) | 39.96 | 886.29 | 1732.62 | 1.22 × 10⁻¹⁰ | 6.56 × 10⁻⁷ | 1.31 × 10⁻⁶ |
| B (grape harvest time) | 45.40 | 891.73 | 1738.06 | 1.73 × 10⁻¹⁰ | 6.56 × 10⁻⁷ | 1.31 × 10⁻⁶ |
| C (CAS) | 35.25 | 255.75 | 476.25 | 7.02 × 10⁻¹⁰ | 4.01 × 10⁻⁹ | 7.32 × 10⁻⁹ |
| C (MBR) | 23.42 | 243.92 | 464.42 | 7.61 × 10⁻¹⁰ | 4.01 × 10⁻⁹ | 7.32 × 10⁻⁹ |
Disclaimer/Publisher’s Note: The statements, opinions and data contained in all publications are solely those of the individual author(s) and contributor(s) and not of MDPI and/or the editor(s). MDPI and/or the editor(s) disclaim responsibility for any injury to people or property resulting from any ideas, methods, instructions or products referred to in the content. |
© 2023 by the authors. Licensee MDPI, Basel, Switzerland. This article is an open access article distributed under the terms and conditions of the Creative Commons Attribution (CC BY) license (https://creativecommons.org/licenses/by/4.0/).
Share and Cite
Menghini, M.; Pedrazzani, R.; Feretti, D.; Mazzoleni, G.; Steimberg, N.; Urani, C.; Zerbini, I.; Bertanza, G. Beyond the Black Box of Life Cycle Assessment in Wastewater Treatment Plants: Which Help from Bioassays? Water 2023, 15, 960. https://doi.org/10.3390/w15050960
Menghini M, Pedrazzani R, Feretti D, Mazzoleni G, Steimberg N, Urani C, Zerbini I, Bertanza G. Beyond the Black Box of Life Cycle Assessment in Wastewater Treatment Plants: Which Help from Bioassays? Water. 2023; 15(5):960. https://doi.org/10.3390/w15050960
Chicago/Turabian StyleMenghini, Michele, Roberta Pedrazzani, Donatella Feretti, Giovanna Mazzoleni, Nathalie Steimberg, Chiara Urani, Ilaria Zerbini, and Giorgio Bertanza. 2023. "Beyond the Black Box of Life Cycle Assessment in Wastewater Treatment Plants: Which Help from Bioassays?" Water 15, no. 5: 960. https://doi.org/10.3390/w15050960