
Assessment of Water Resources Pollution Associated with Mining Activities in the Parac Subbasin of the Rimac River

Abstract
:1. Introduction
2. Materials and Methods
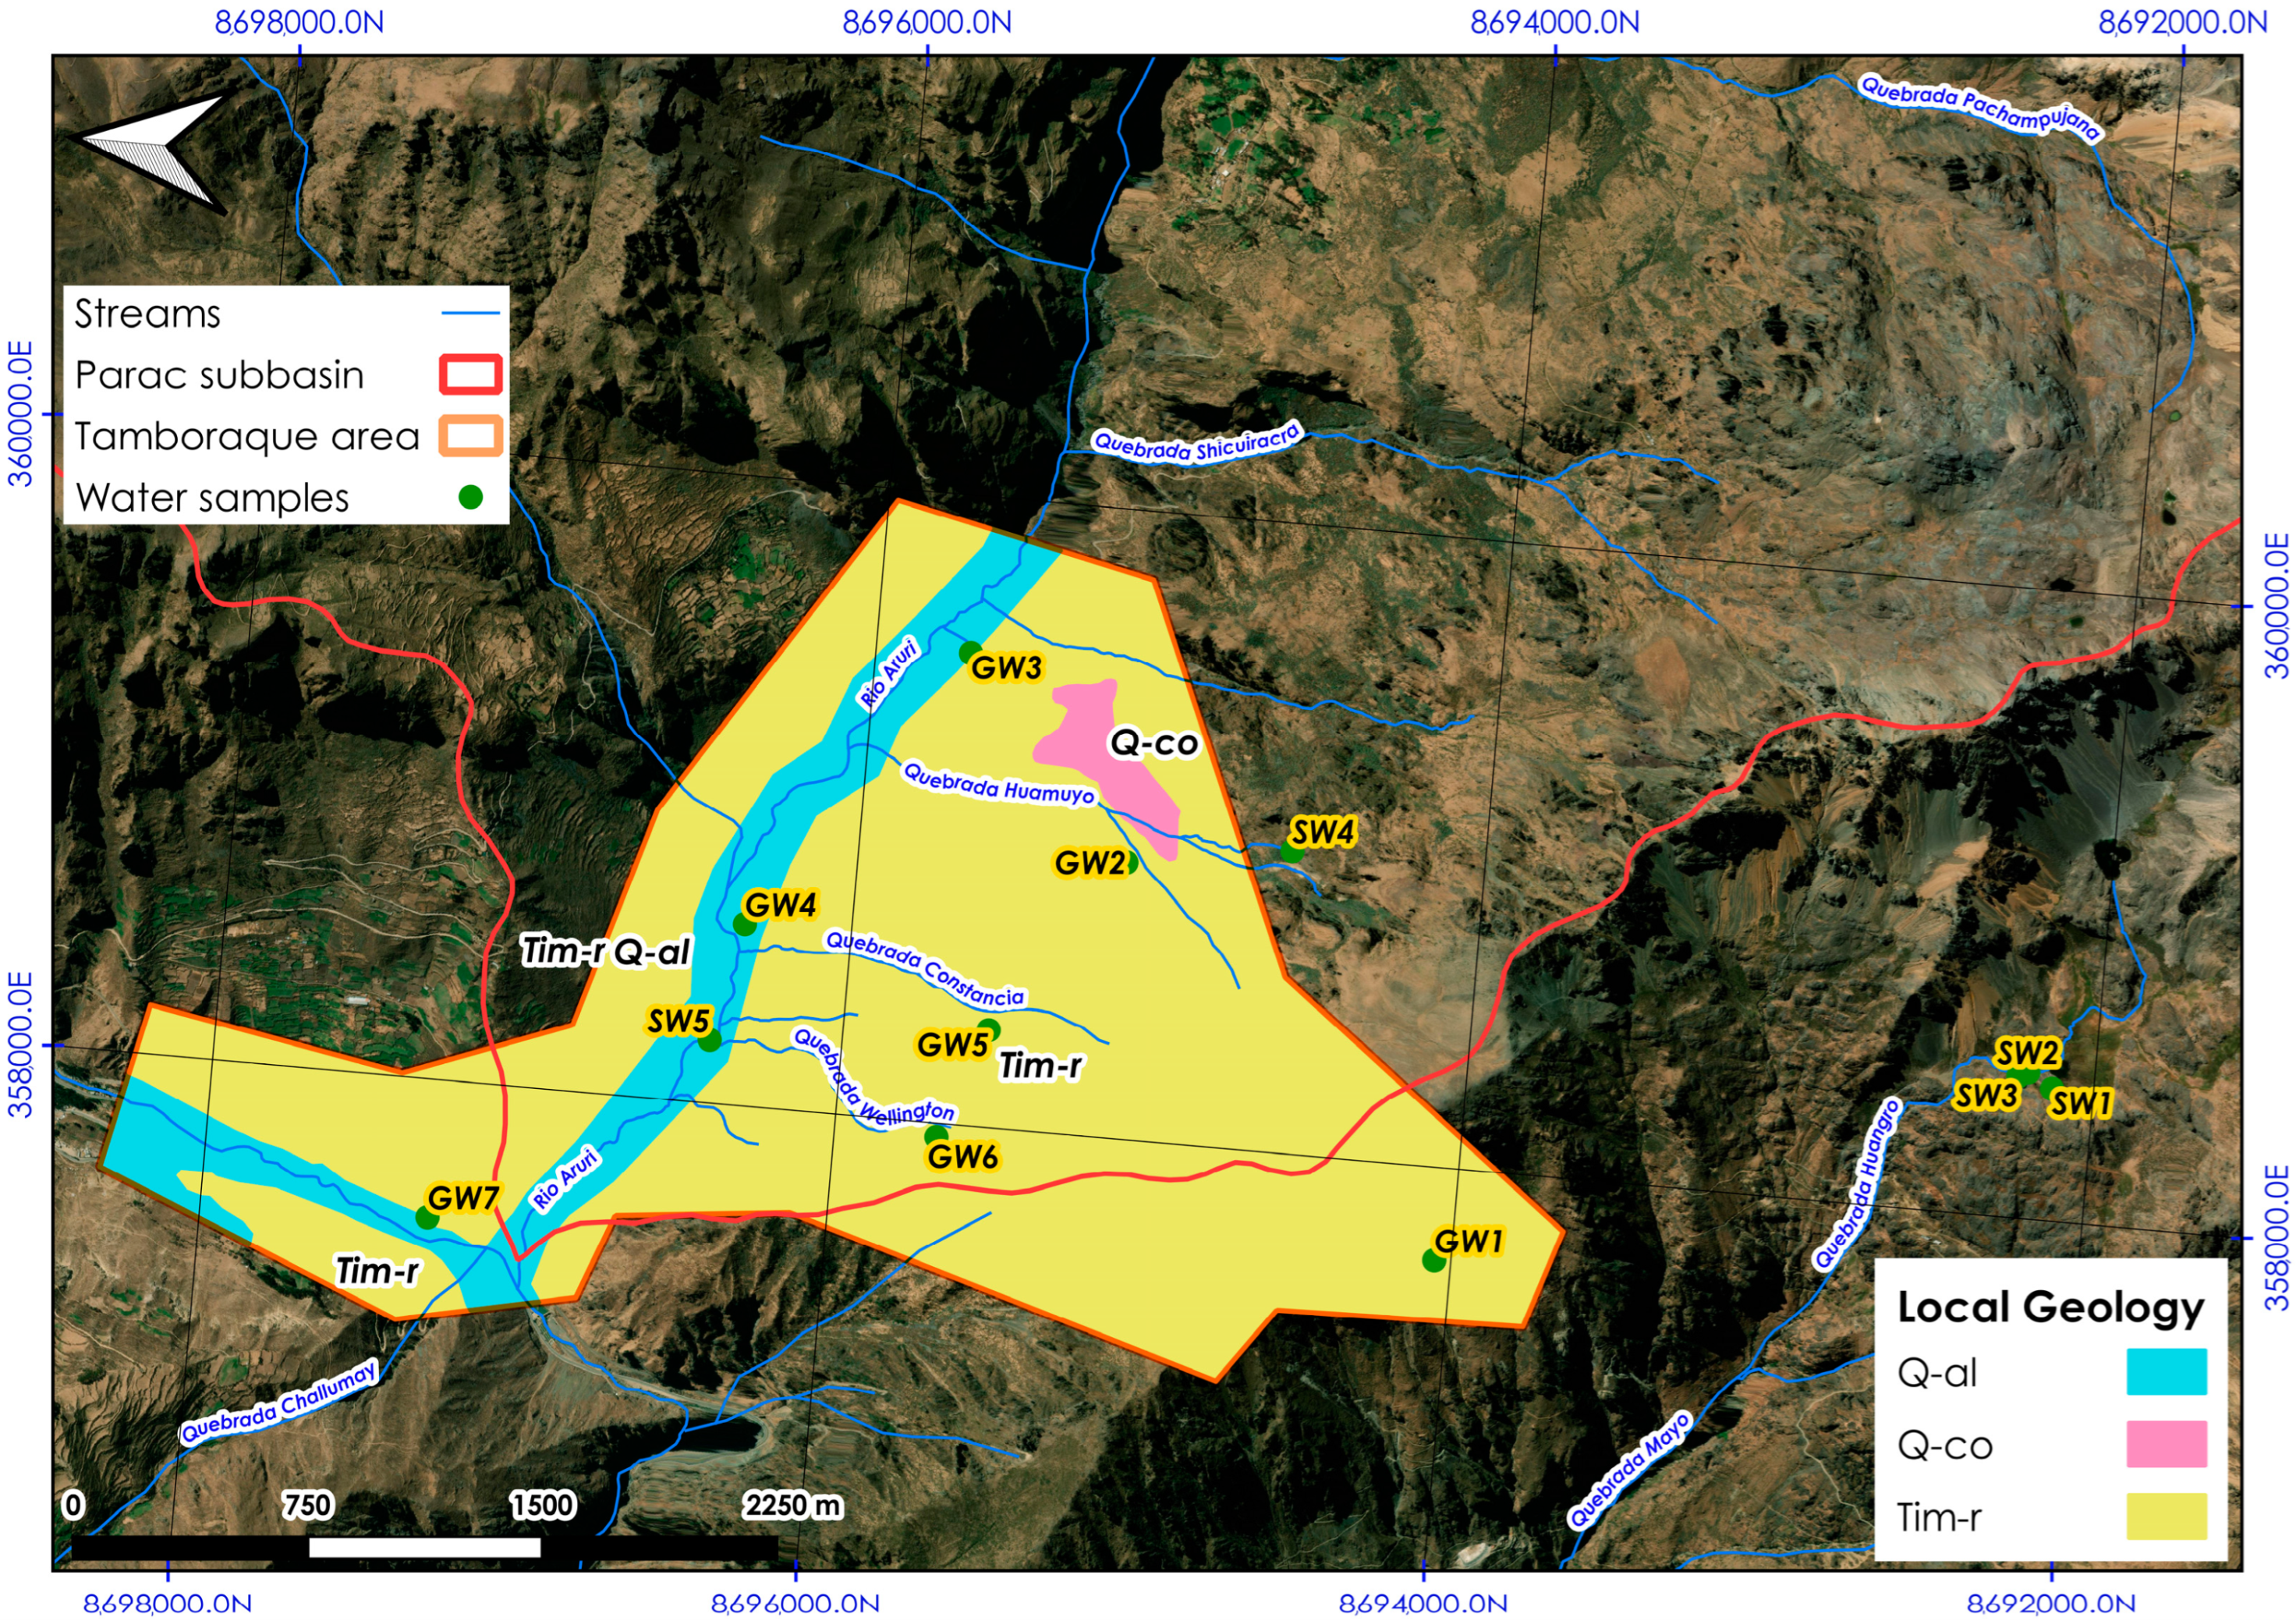
2.1. Study Area
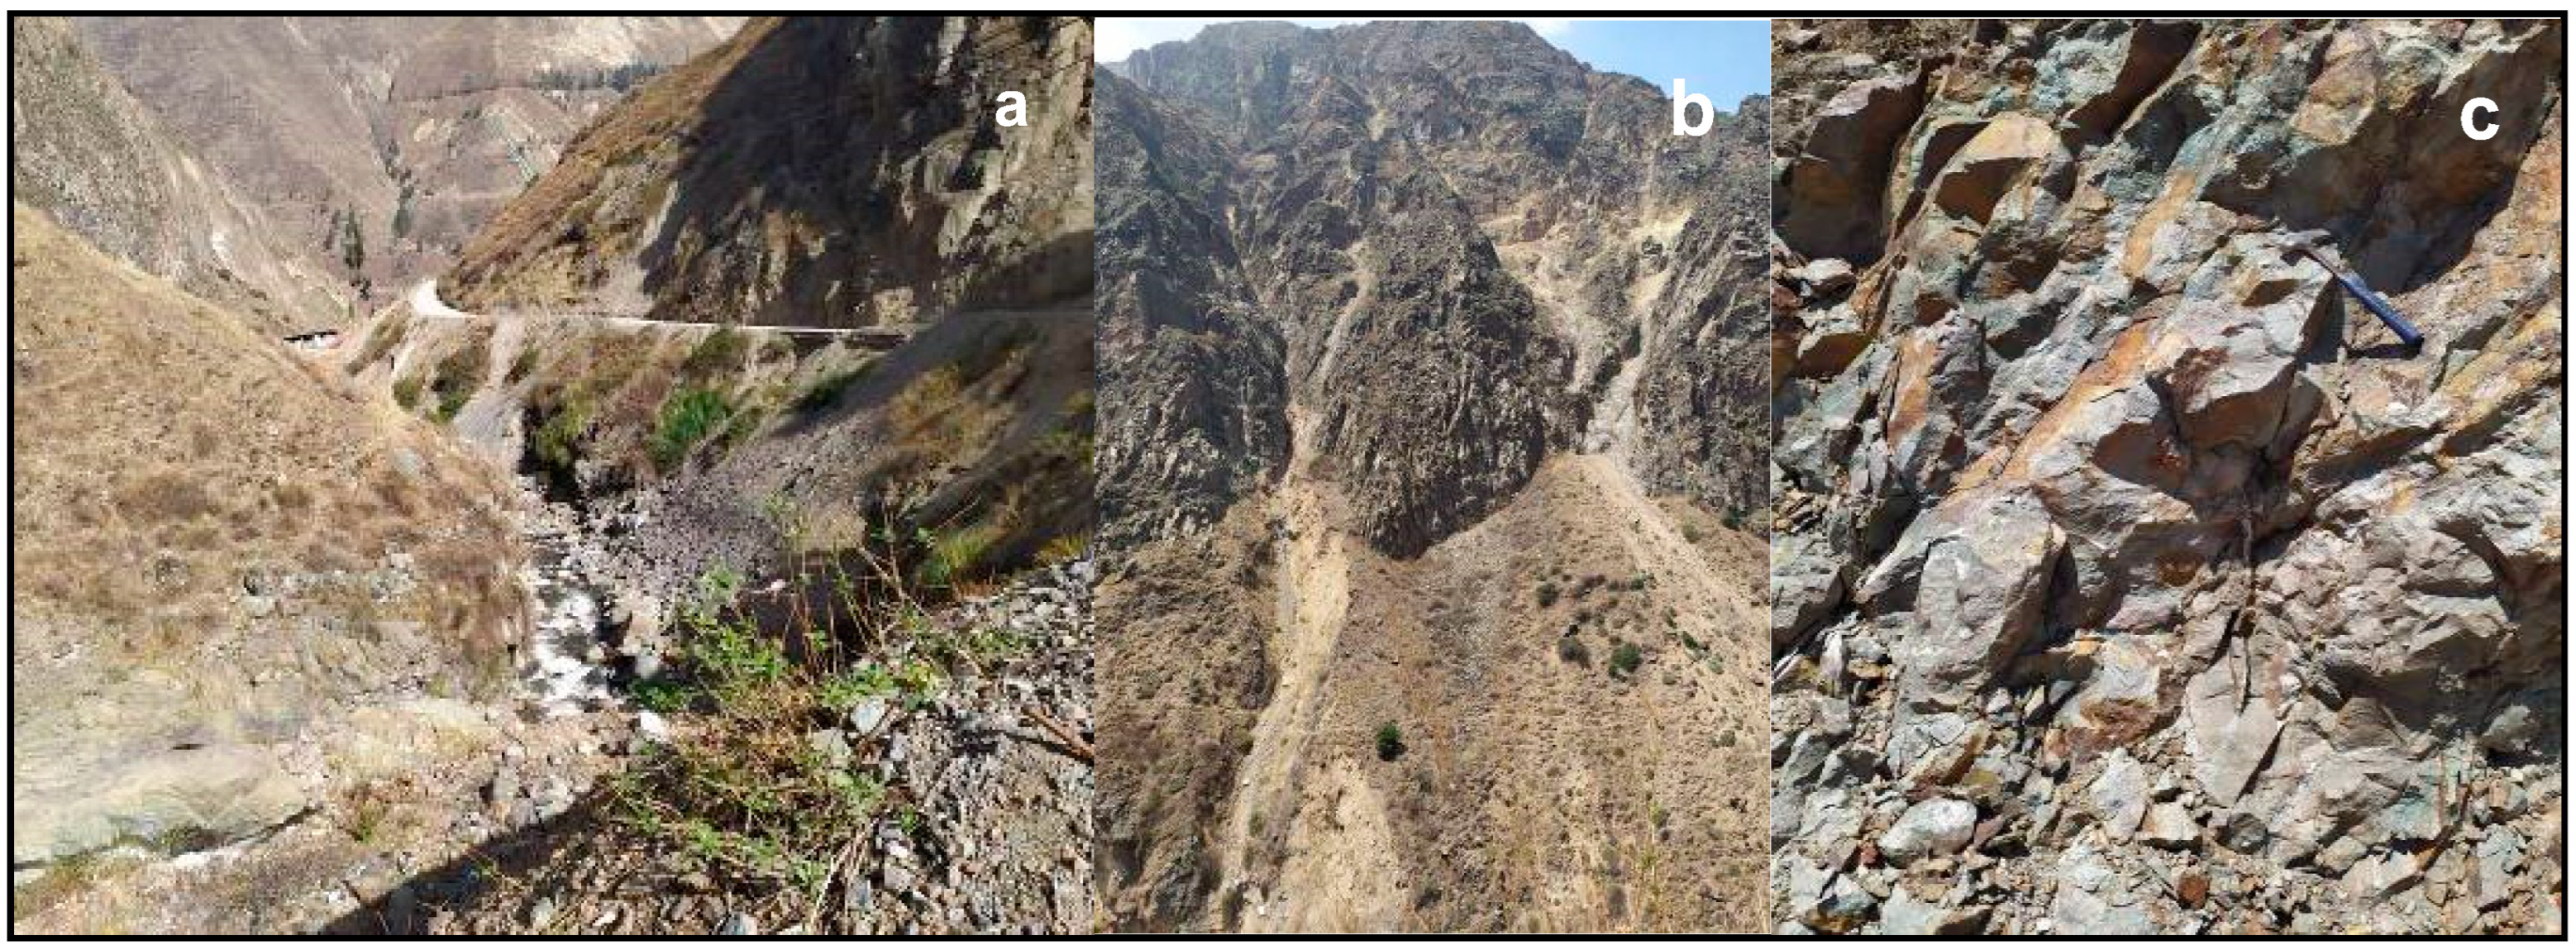
2.2. Geology of the Area Studied
2.3. Collection and Processing of Samples
2.4. Analytical Processes and Quality Control
2.5. Quantification of Surface Water Pollution
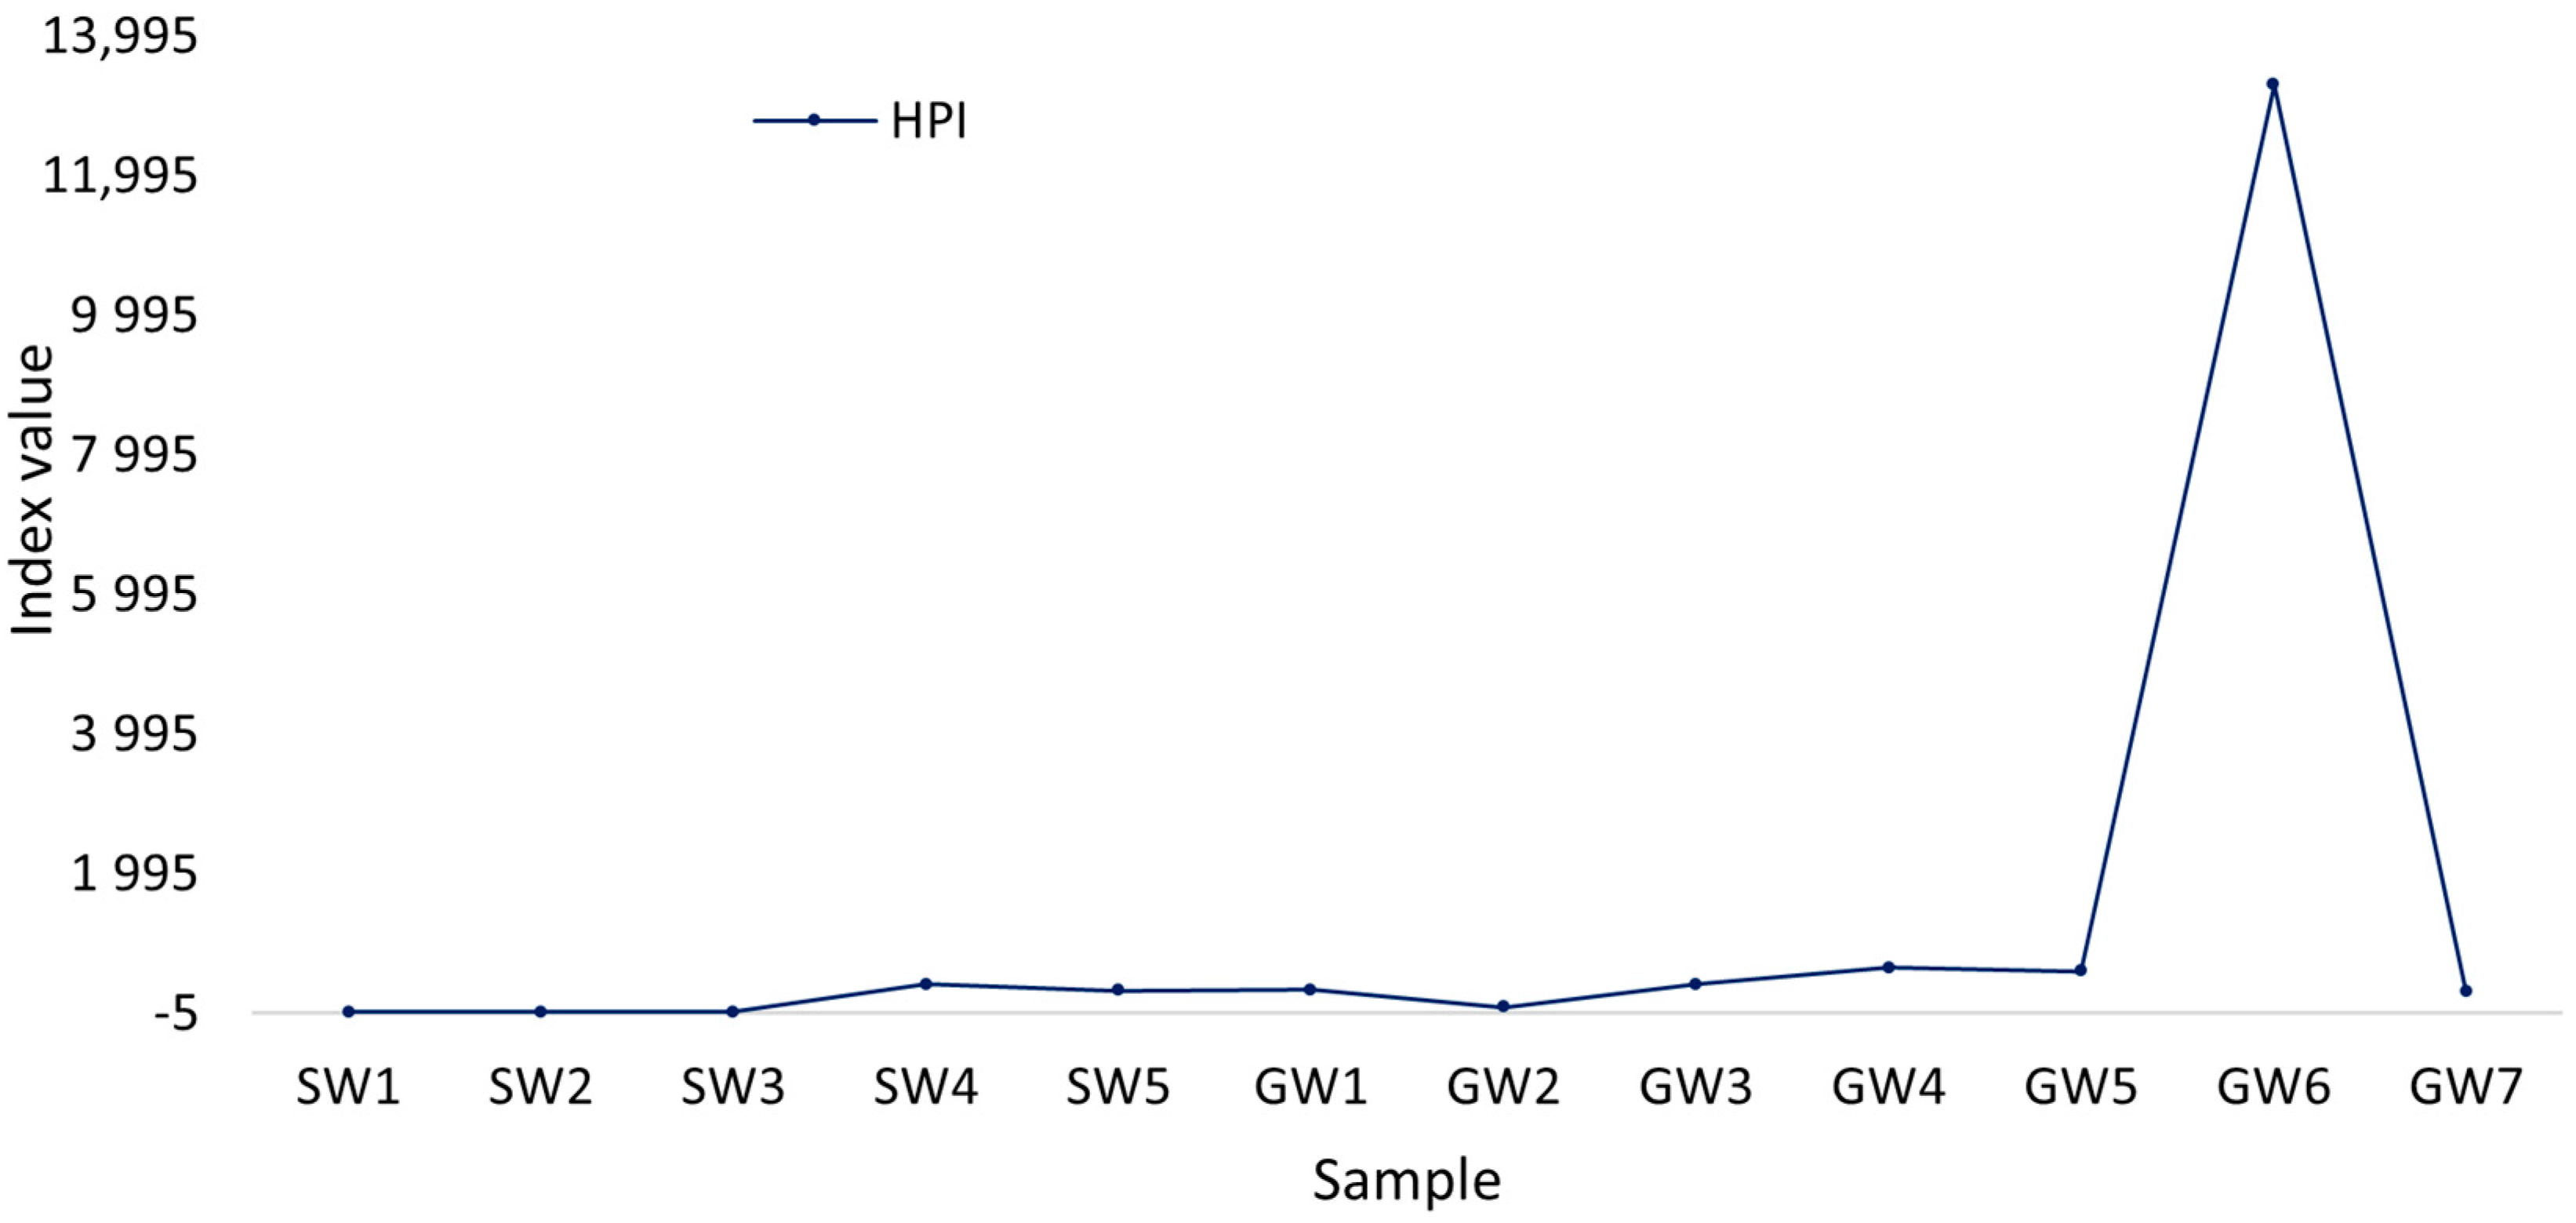
2.5.1. Heavy Metal Pollution Index
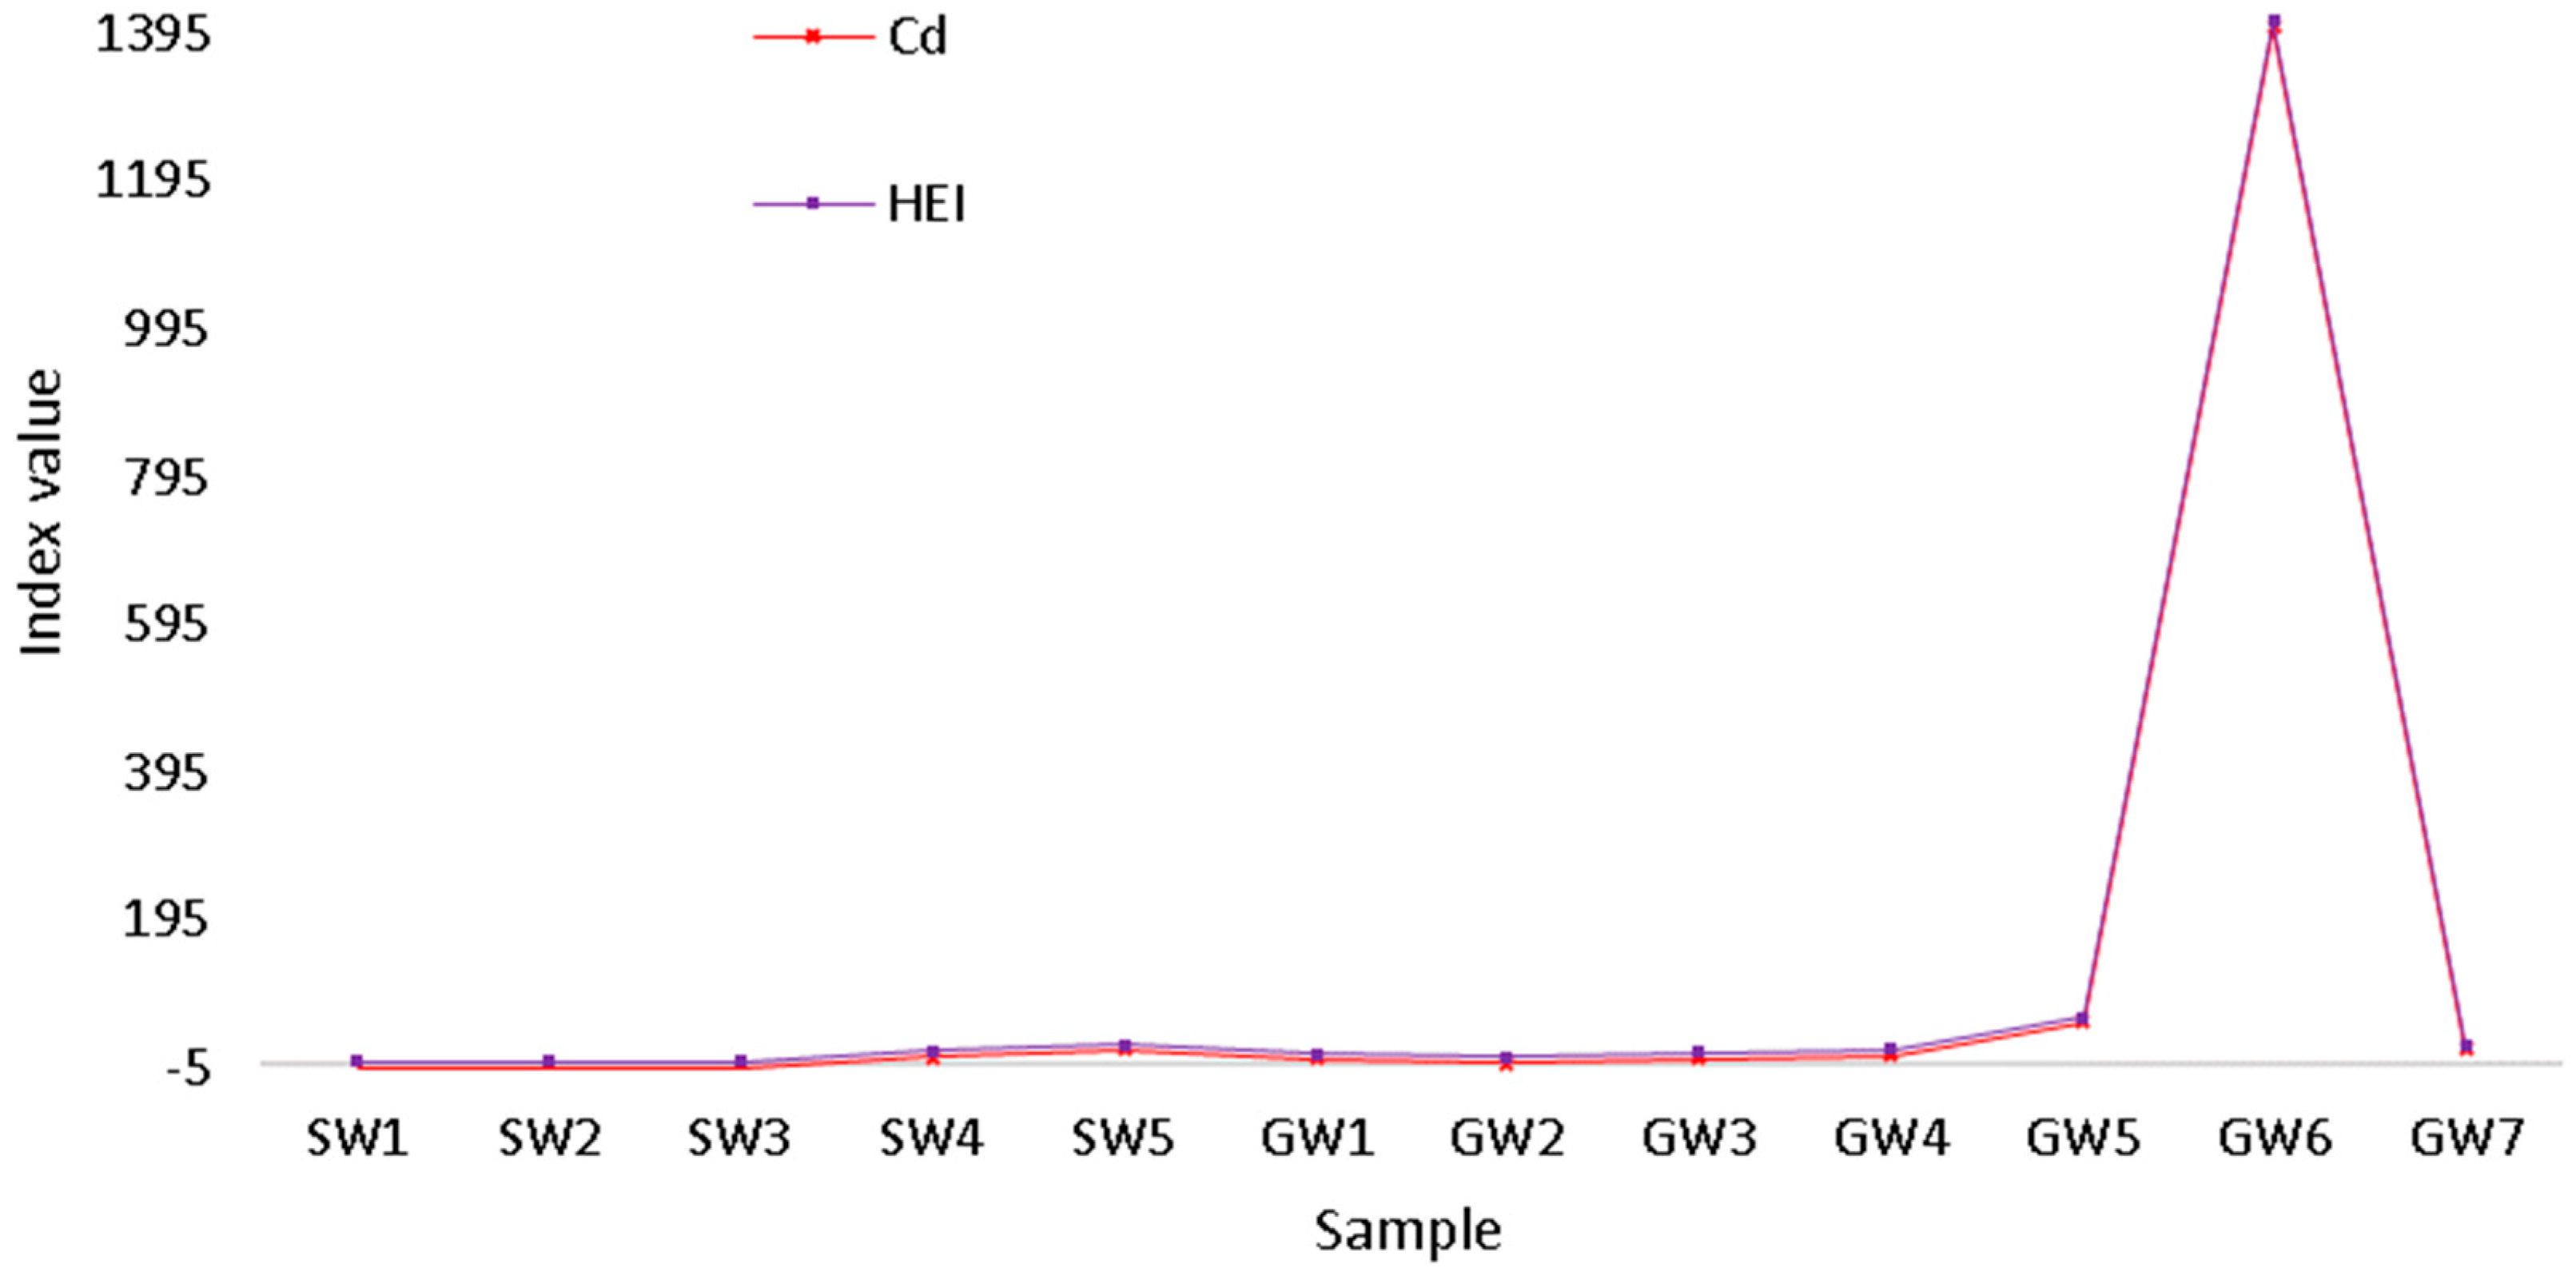
2.5.2. Heavy Pollution Index
2.6. Statistical Analysis to Assess Surface and Groundwater Pollution
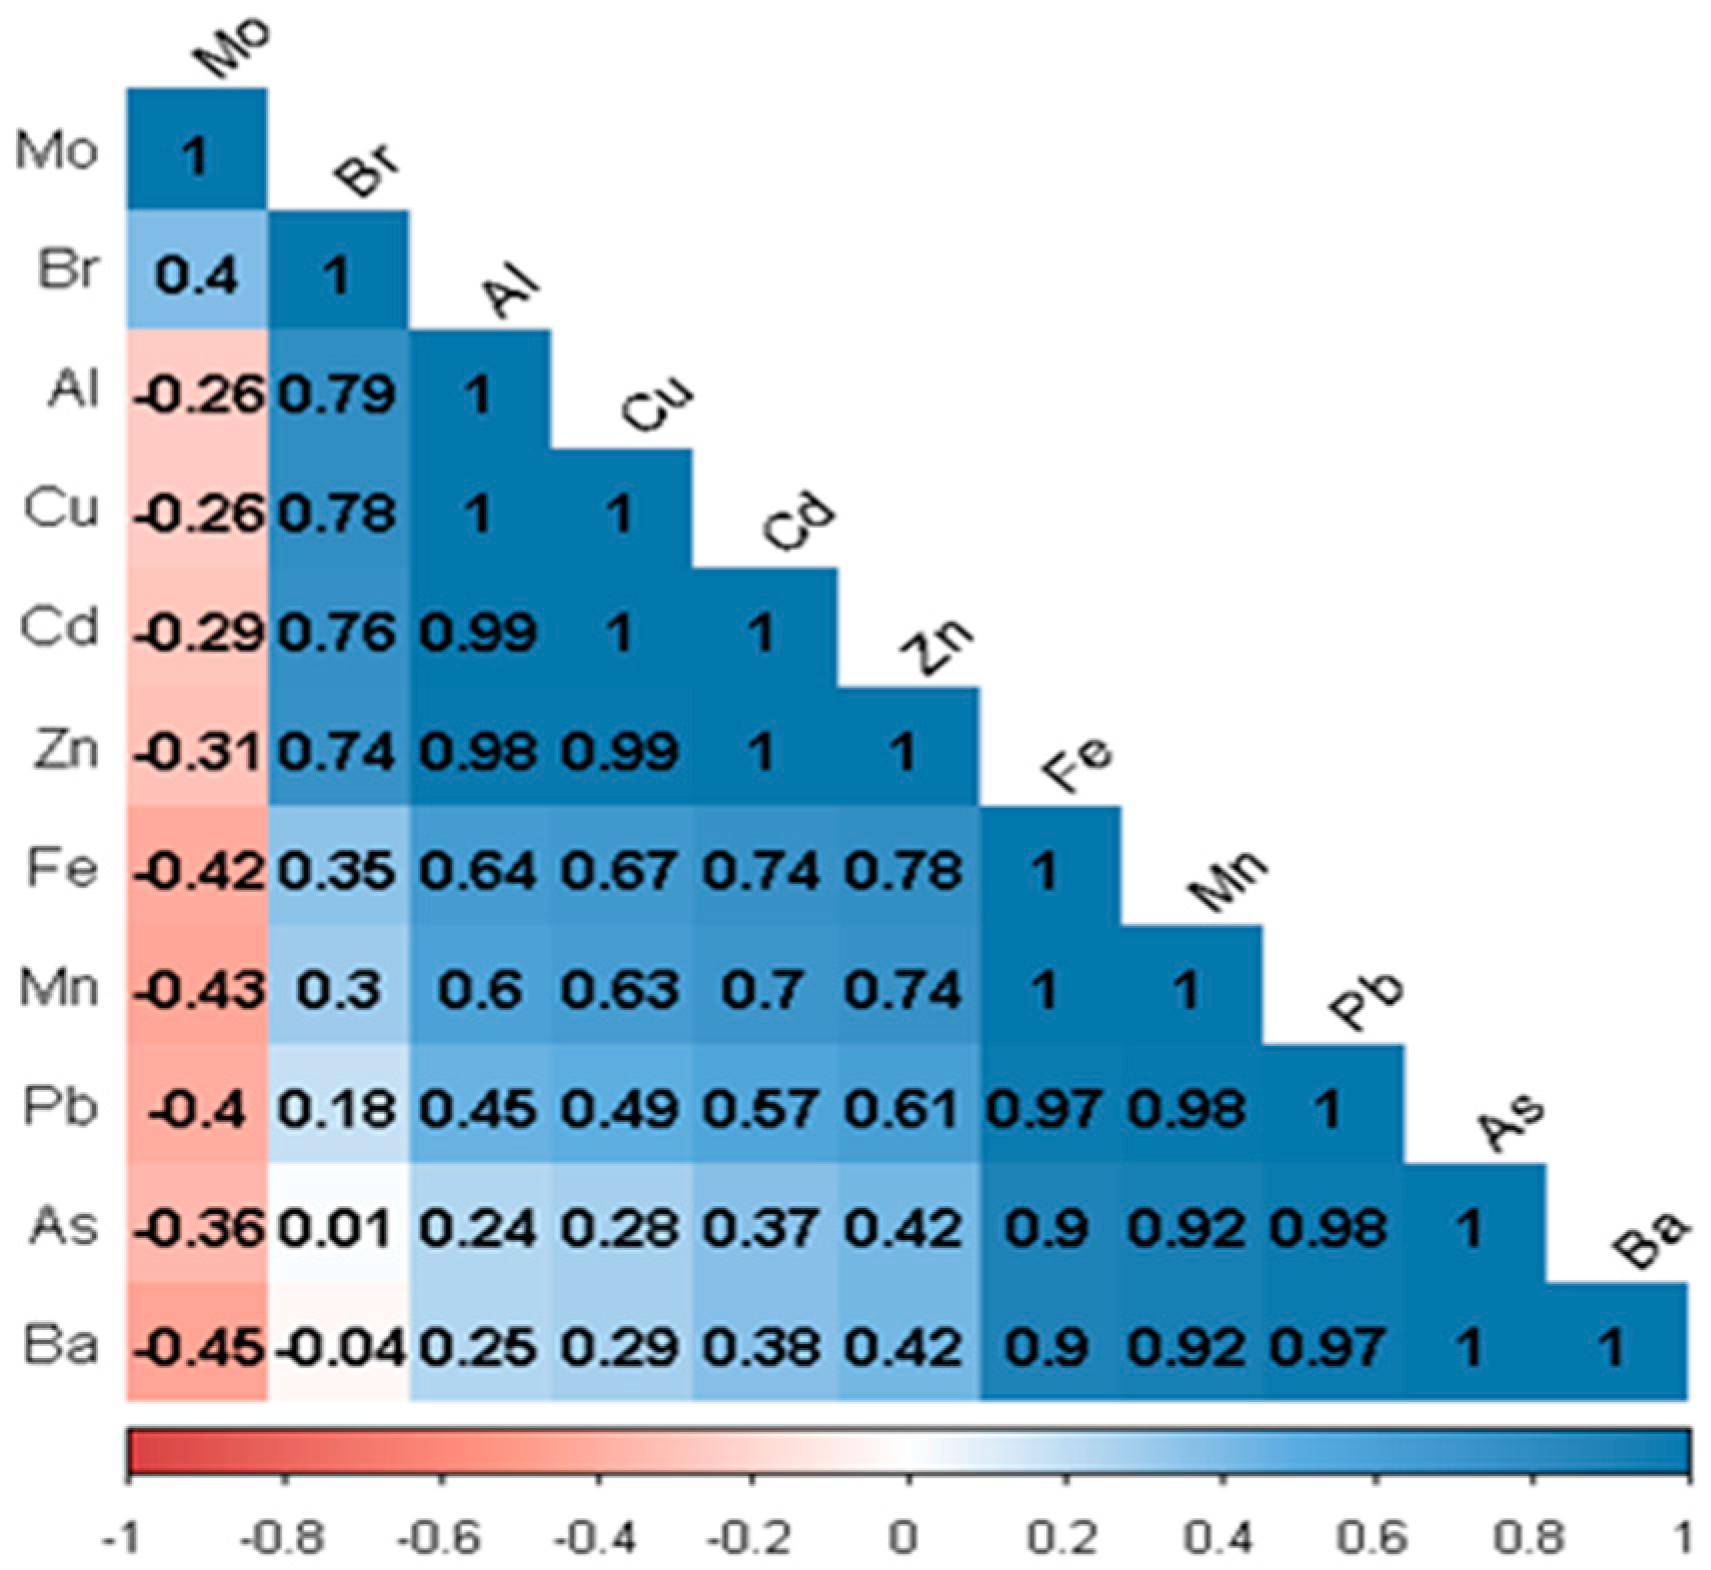
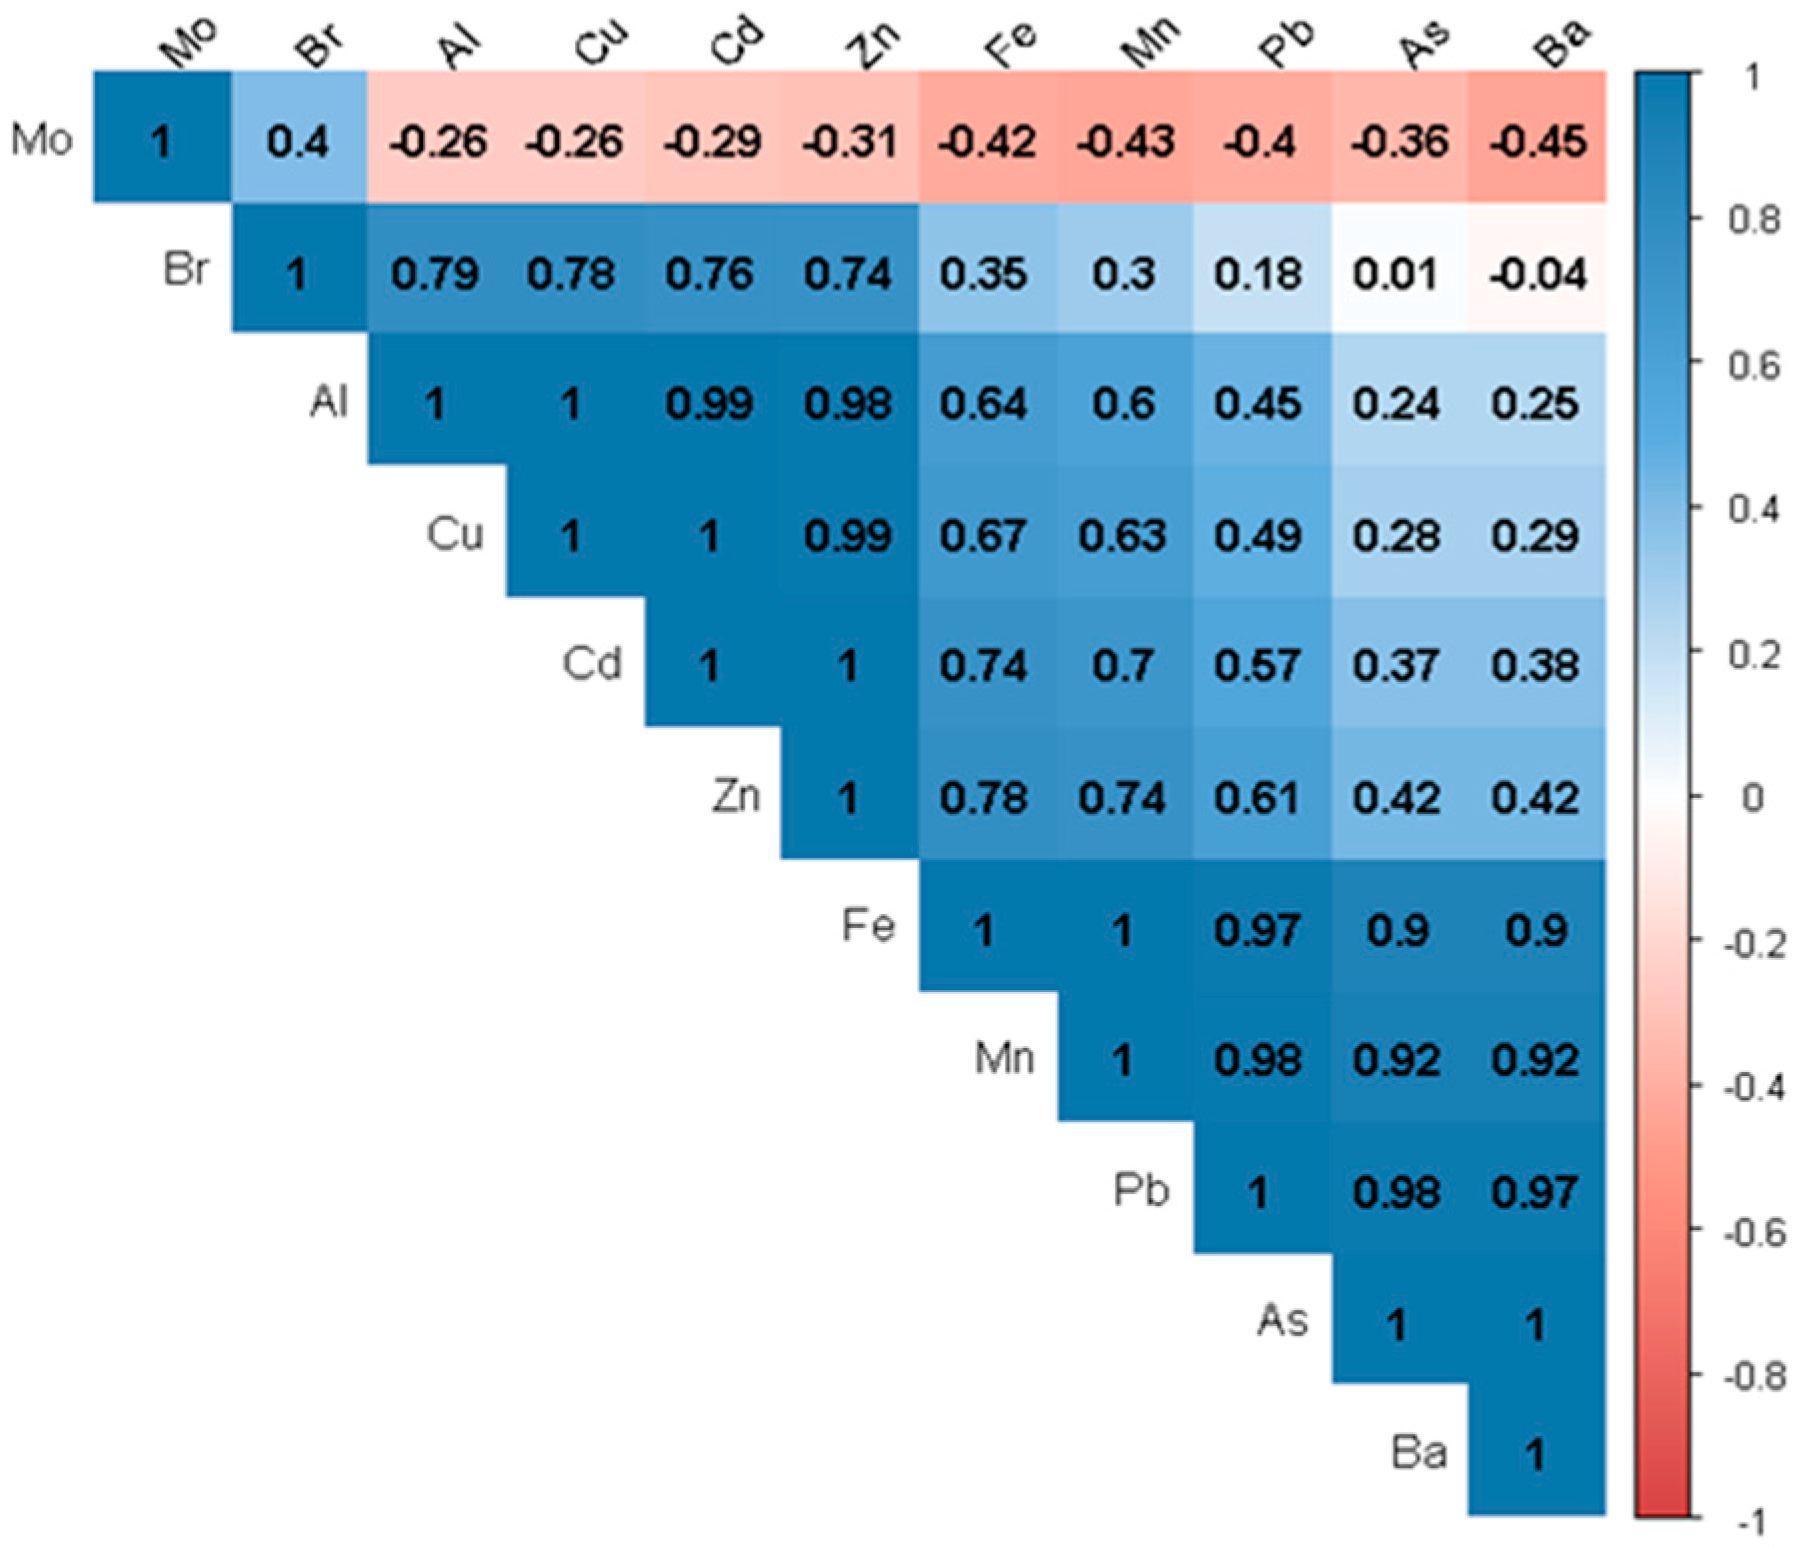
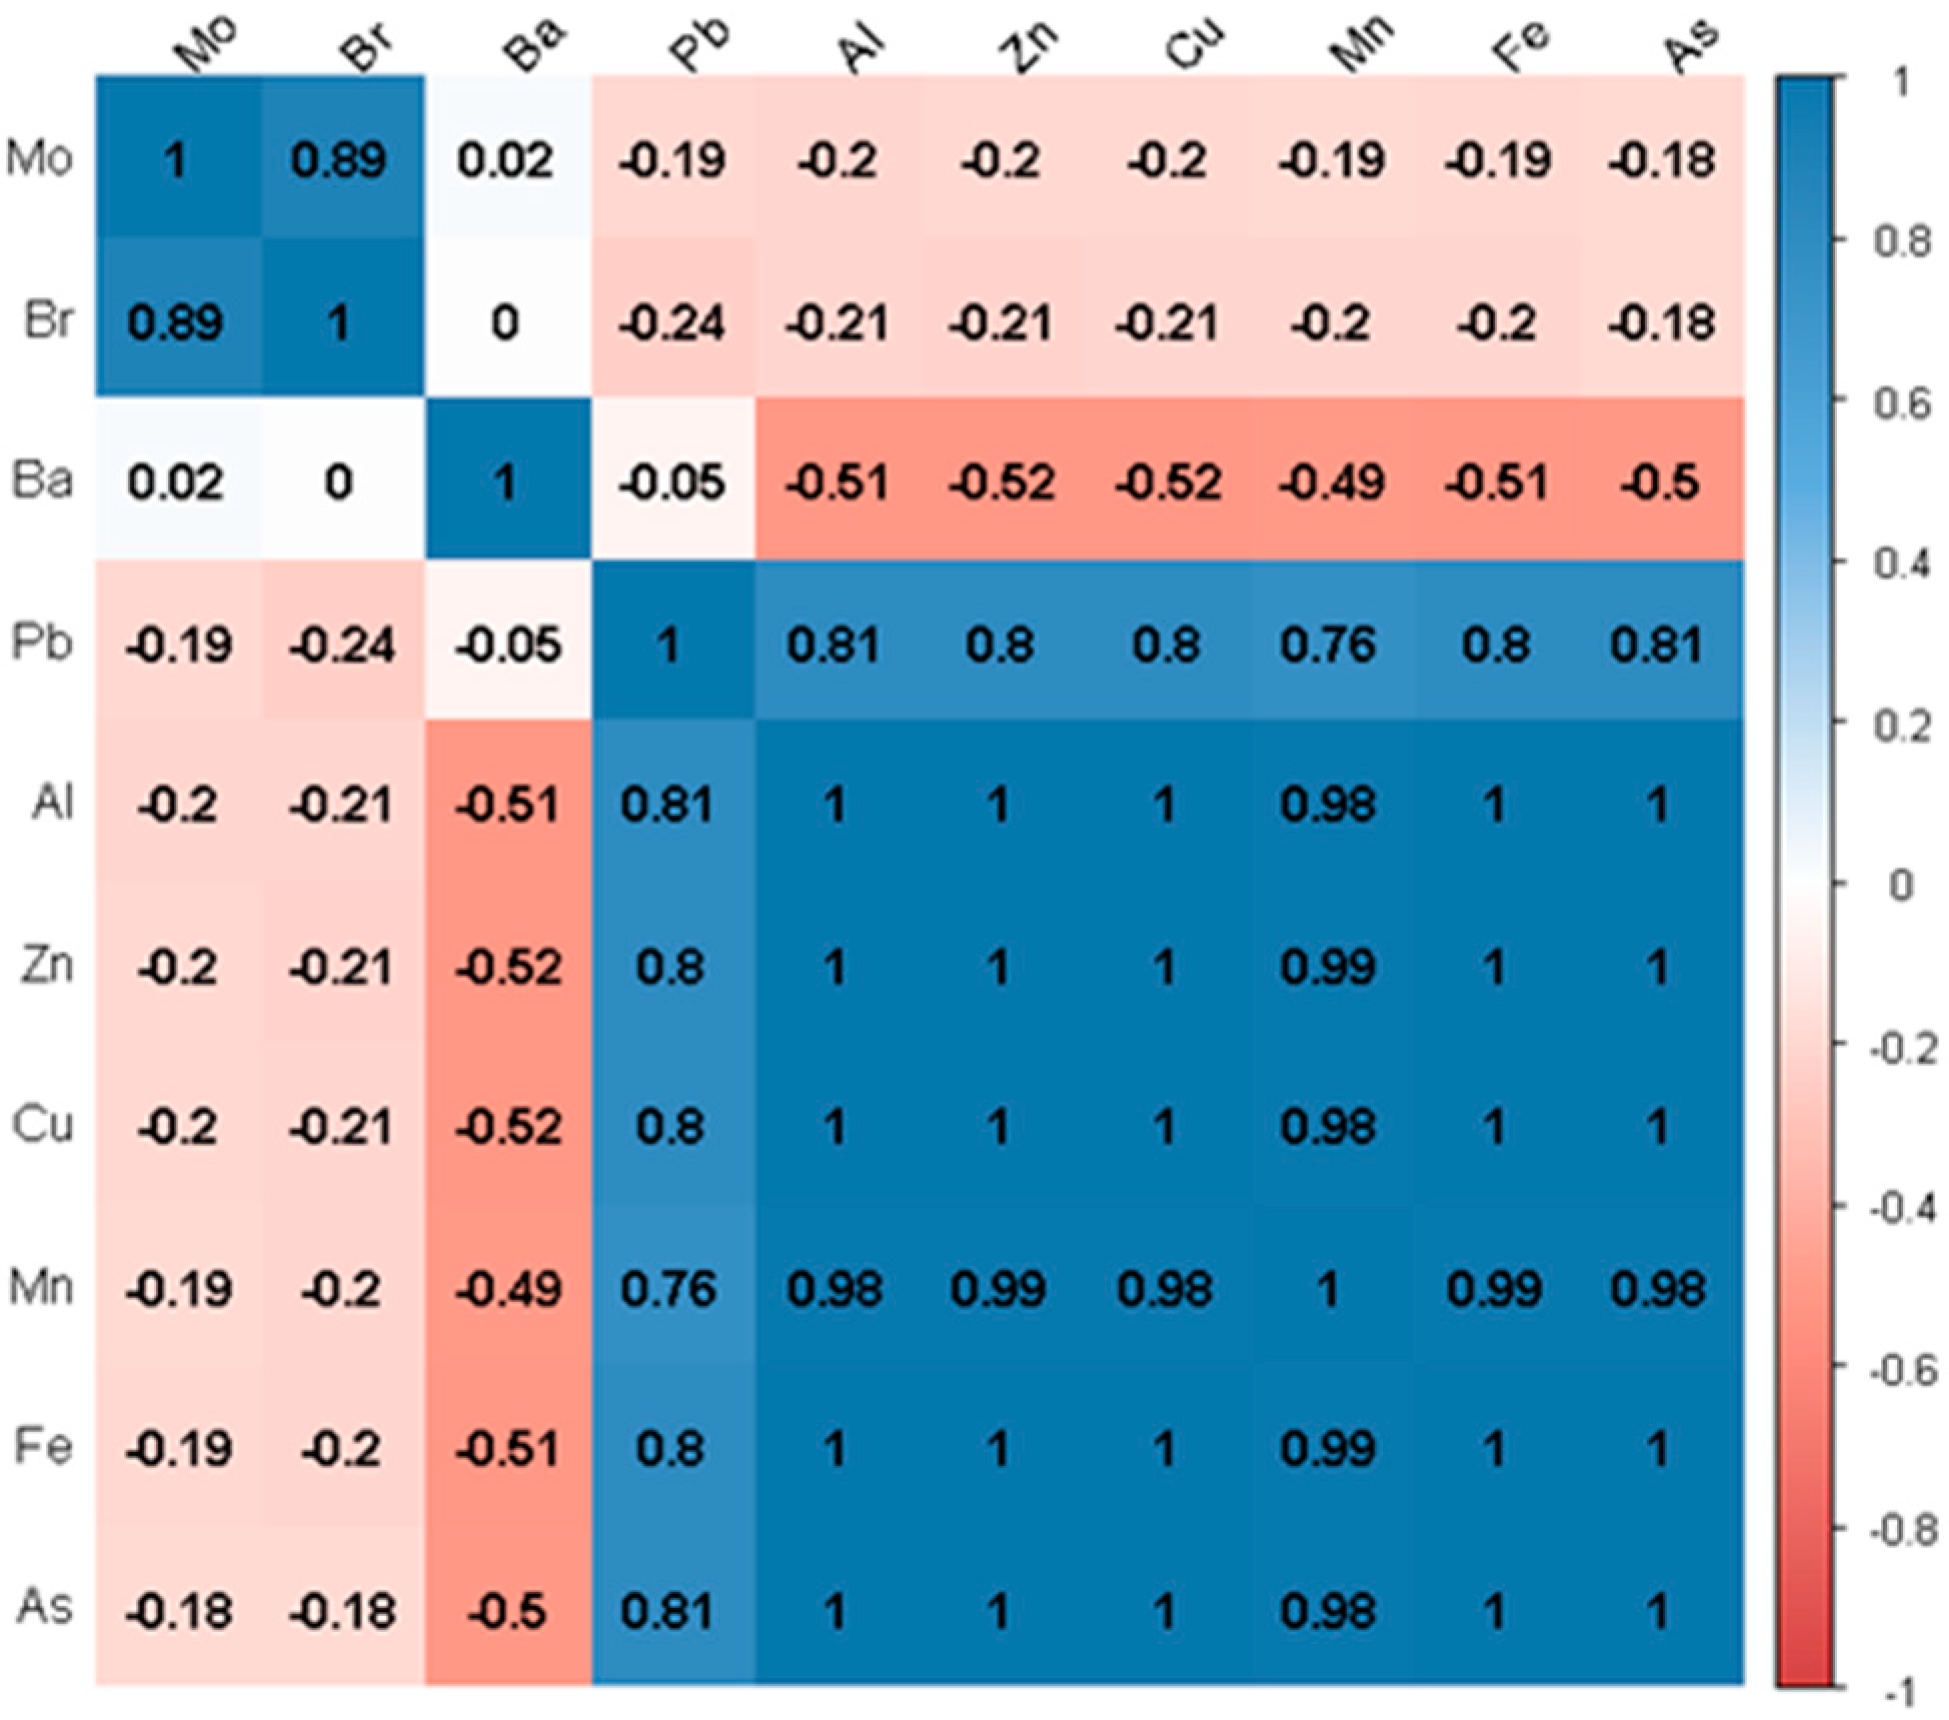
- Pearson correlation
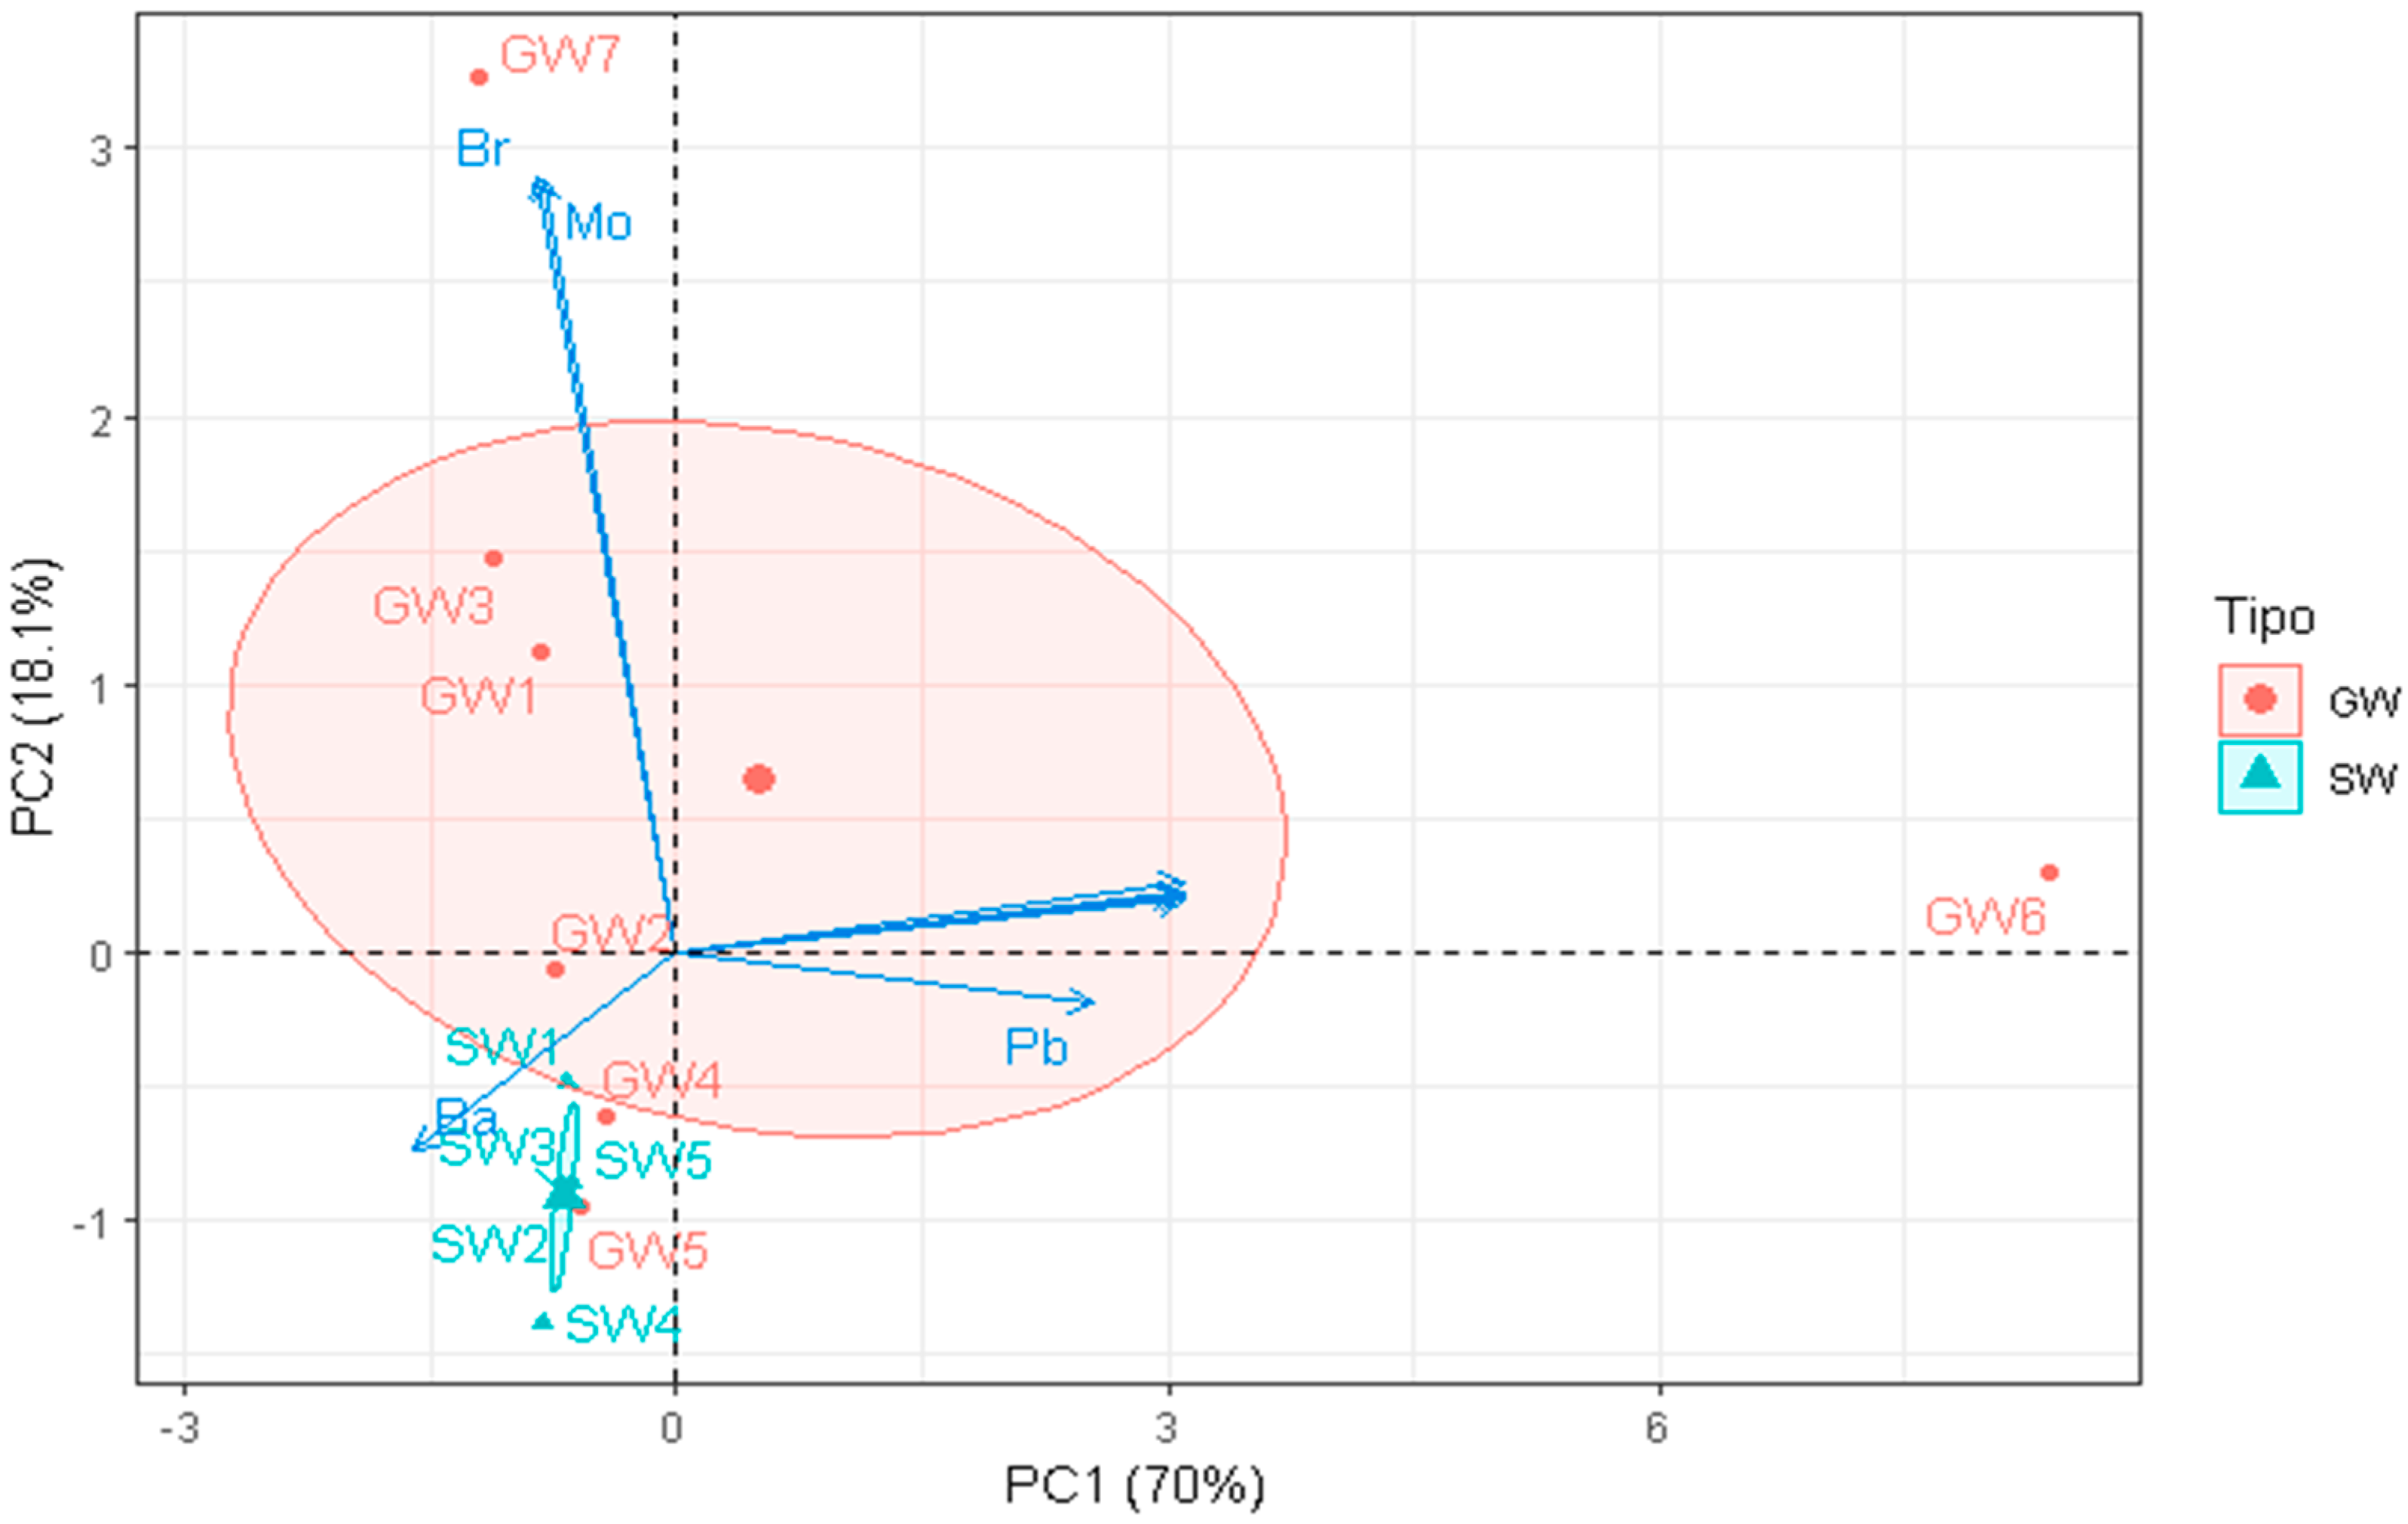
- Principal Component Analysis
3. Results and Discussion
4. Conclusions
Supplementary Materials
Author Contributions
Funding
Data Availability Statement
Acknowledgments
Conflicts of Interest
References
- Xing, W.; Wei, L.; Ma, W.; Li, J.; Liu, X.; Hu, J.; Wang, X. Geochemistry and Sources Apportionment of Major Ions and Dissolved Heavy Metals in a small Watershed on the Tibetan Plateau. Water 2022, 14, 3856. [Google Scholar] [CrossRef]
- Giri, S.; Singh, A.K. Assessment of surface water quality using heavy metal pollution index in Subarnarekha River, India. Water Qual. Expos. Health 2013, 5, 173–183. [Google Scholar] [CrossRef]
- Kumar, V.; Sharma, A.; Kumar, R.; Bhardwaj, R.; Kumar Thukral, A.; Rodrigo-Comino, J. Assessment of heavy-metal pollution in three different Indian water bodies by combination of multivariate analysis and water pollution indices. Hum. Ecol. Risk Assess. Int. J. 2018, 26, 1–16. [Google Scholar] [CrossRef]
- Bedregal, P.; Mendoza, P.; Ubillus, M.; Montoya, E.; Airas, R. Evaluation of wáter in Rimac river using Water Quality Index (WQI). IPEN Technol. Sci. Rep. 2010, 13–19. [Google Scholar]
- Burritt, R.; Christ, K. Water risk in mining: Analysis of the Samarco dam failure. J. Clean. Prod. 2018, 178, 196–205. [Google Scholar] [CrossRef]
- Lazo, P.; Lazo, A.; Hansen, H.K.; Ortiz-Soto, R.; Hansen, M.E.; Arévalo, F.; Gutiérrez, C. Removal of Heavy Metals from Mine Tailings in Central Chile Using Solidago chilensis Meyen, Haplopappus foliosus DC, and Lycium chilense Miers ex Bertero. Int. J. Environ. Res. Public Health 2023, 20, 2749. [Google Scholar] [CrossRef] [PubMed]
- Skoczko, I.; Szatyłowicz, E. Removal of heavy metal ions by filtration on activated alumina-assisted magnetic fied. Desalination Water Treat. 2018, 117, 345–352. [Google Scholar] [CrossRef] [Green Version]
- Bodrud-Doza, M.; Islam, A.; Ahmed, F.; Das, S. Characterization of groundwater quality using water evaluation indices, multivariate statistics and geostatistics in central Bangladesh. Water Sci. 2016, 30, 19–40. [Google Scholar] [CrossRef] [Green Version]
- Fashola, M.; Ngole-Jeme, V.; Babalola, O. Heavy metal pollution from goldmines: Environmental effects and bacterial strategies for resistance. Int. J. Environ. Res. 2016, 13, 1047. [Google Scholar]
- Congress of the Republic of Peru. Law That Regulates the Environmental Liabilities of the Mining Activity; The Peruvian Newspaper: Peru, 2004. [Google Scholar]
- Baeten, J.; Langston, N.; Lafreniere, D. A spatial evaluation of historic iron mining impacts on current impaired waters in Lake Superior’s Mesabi Range. Ambio 2018, 47, 231–244. [Google Scholar] [CrossRef]
- Villacorta, O.; Esenarro, D.; Alfaro, O.; Minga, J.; Vega, V. Design of an Artificial Wetland for the Treatment of Wastewater Generated in the Lower Zone of Belen in Iquitos-Peru. Ann. Rom. Soc. Cell Biol. 2021, 25, 11483–11495. [Google Scholar]
- Wheater, H.; Mathias, S.; Li, X. Groundwater Modelling in Arid and Semi-Arid Areas; Cambridge University Press: Cambridge, UK, 2010. [Google Scholar]
- Song, J.; Liu, Q.; Sheng, Y. Distribution and risk assessment of trace metals in riverine surface sediments in gold mining area. Environ. Monit. Assess. 2019, 191, 191. [Google Scholar] [CrossRef] [PubMed]
- Yang, W.; Liensheng, Y.; Jianxun, Z. Effect of metal pollution on the water quality in Taiku Lake. Geojournal 1996, 40, 197–200. [Google Scholar] [CrossRef]
- Yiping, H.; Min, Z. The water quality of Lak Taihu and its protection. Geojournal 1996, 40, 39–44. [Google Scholar]
- Zhongyi, W. Surface water chemical changes due to human activities in the Tarim Basin. Geojournal 1996, 40, 25–29. [Google Scholar] [CrossRef]
- Golfinopoulos, S.K.; Varnavas, S.P.; Alexakis, D.E. The Status of Arsenic Pollution in the Greek and Cyprus Environment: An Overview. Water 2021, 13, 224. [Google Scholar] [CrossRef]
- Santana, C.; Montalván, D.; Silva, V.; Luzardo, F.; Velasco, F.; de Jesus, R. Assessment of water resources pollution associated with mining activity in a semi-arid region. J. Environ. Manag. 2020, 273, 111148. [Google Scholar] [CrossRef]
- Butler, L.; Lall, U.; Bonnafous, L. Cumulative Heavy Metals Contamination in Mining Areas of the Rimac, Peru Basin. Columbia Water Cent. 2018, 1–27. Available online: https://water.columbia.edu/sites/default/files/content/publications/Cumulative-Heavy-Metal-Contamination-in-Mining-Areas.pdf (accessed on 13 January 2023).
- Bury, J.; Kolff, A. Livelihoods, mining and peasant protests in the Peruvian Andes. J. Lat. Am. Geog. 2002, 1, 3–16. [Google Scholar] [CrossRef] [Green Version]
- Bridge, G. Mapping the bonanza: Geographies of mining investment in an era of neoliberal reform. Prof. Geogr. 2004, 56, 406–421. [Google Scholar] [CrossRef]
- Hilson, G.; Yakovleva, N. Strained relations: A critical analysis of the mining conflict in Prestea, Ghana. Political Geogr. 2007, 26, 98–119. [Google Scholar] [CrossRef]
- Diaz, W.J. Contamination of the Ecosystem in San Mateo de Huanchor due to Mining and Metallurgical Environmental Liabilities and Its Impact on the Health of the Inhabitants. Master’s Thesis, National University of San Marcos, Lima, Peru, 2016. [Google Scholar]
- Bebbington, A.; Williams, M. Water and mining conflicts in Peru. Mt. Res. Dev. 2008, 28, 190–195. [Google Scholar] [CrossRef] [Green Version]
- Gil, V. Mining Landing: Culture, Conflict, Negotiations and Lessons for Development from Mining in Ancash; Institute of Peruvian Studies: Lima, Peru, 2009. [Google Scholar]
- Liverman, D.; Vilas, S. Neoliberalism and the environment in Latin America. Annu. Rev. Environ. Resour. 2006, 31, 327–363. [Google Scholar] [CrossRef]
- Multisectoral Technical Commission. National Water Resources Policy and Strategy of Peru; AND Water: Lima, Peru, 2009. [Google Scholar]
- Abdelaal, A.; Abdelkader, A.I.; Alshehri, F.; Elatiar, A. Almadani, S.A. Assessment and Spatiotemporal Variability of Heavy Metals Pollution in Water and Sediments of a Coastal Landscape at the Nile Delta. Water 2022, 14, 3981. [Google Scholar] [CrossRef]
- Corzo, A.; Gamboa, N. Environmental impact of mining liabilities in water resources of Parac micro-watershed San Mateo Huanchor district, Peru. Environ. Dev. Sustain. 2018, 20, 939–961. [Google Scholar] [CrossRef]
- Calla, H.; Cabrera, C. Water quality in the Rímac river basin, San Mateo sector, affected by mining activities. J. Figmmg Res. Inst. 2010, 13, 87–94. [Google Scholar]
- Instituto Geológico Minero y Metalúrgico [INGEMMET] Geology of the Matucana and Huarochiri Áreas 1983. Available online: https://repositorio.ingemmet.gob.pe/handle/20.500.12544/2567?mode=full (accessed on 13 January 2023).
- Backman, B.; Bodiš, D.; Lahermo, P.; Rapant, S.; Tarvainen, T. Application of a Groundwater Contamination Index in Finland and Slovakia. Environ. Geol. 1998, 36, 55–64. [Google Scholar] [CrossRef]
- Edet, A.; Offiong, O. Evaluation of water quality pollution indices for heavy metal contamination monitoring. A study case from Akpabuyo-Odukpani area, Lower Cross River Basin (Southeastern Nigeria). GeoJournal 2002, 57, 295–304. [Google Scholar] [CrossRef]
- Mohan, S.; Nithila, P.; Reddy, S. Estimation of heavy metals in drinking water and development of heavy metal pollution index. J. Environ. Sci. Health Part A Environ. Sci. Eng. Toxicol. 1996, 31, 283–289. [Google Scholar] [CrossRef]
- Zhang, J.; Li, X.; Guo, L.; Deng, Z.; Wang, D.; Liu, L. Assessment of heavy metal pollution and water quality characteristics of the reservoir control reaches in the middle Han River, China. Sci. Total Environ. 2021, 799, 149472. [Google Scholar] [CrossRef]
- Farhad, M.; Chakma, E.; Jahan, N.; Islam, S.; Abdullah, M.; Ahmed, Z.; Chowdhury, T.R.; Akter, S. The water quality and pollution sources assessment of Surma river, Bangladesh using, hydrochemical, multivariate statistical and water quality index methods. Groundw. Sustain. Dev. 2021, 12, 100523. [Google Scholar]
- Sharma, A.; Ganguly, R.; Kumar, A. Impact Assessment of Leachate Pollution Potential on Groundwater: An Indexing Method. J. Environ. Eng. 2020, 146, 05019007. [Google Scholar] [CrossRef]
- Khoshnam, Z.; Sarikhani, R.; Ghassemi, A.; Ahmadnejad, Z. Evaluation of water quality using heavy metal index and multivariate statistical analysis in Lorestan province, Iran. J. Adv. Environ. Health Res. 2017, 5, 29–37. [Google Scholar]
- Facchinelli, A.; Sacchi, E.; Mallen, L. Multivariate statistical and GIS-based approach to identify heavy metal sources in soils. Environ. Pollut. 2001, 114, 313–324. [Google Scholar] [CrossRef] [PubMed]
- Johnson, G.; Myers, W.; Patil, G. Predictability of Surface Water Pollution Loading in Pennsylvania Using Watershed-Based Landscape Measurements1. JAWRA J. Am. Water Resour. Assoc. 2001, 37, 821–835. [Google Scholar] [CrossRef]
- Rana, R.; Ganguly, R.; Gupta, A. Indexing method for assessment of pollution potential of leachate from non-engineered landfill sites and its effect on ground water quality. Environ. Monit. Assess. 2017, 190, 46. [Google Scholar] [CrossRef] [PubMed]
- Nasrabadi, T. An IndexApproach toMetallic Pollution in RiverWaters. Int. J. Environ. Res. 2015, 9, 385–394. [Google Scholar]
- Nouayti, N.; Khattach, D.; Hilali, M.; Brahimi, A.; Baki, S. Evaluation de la Contamination Métallique des eaux des Nappes du Jurassique du Haut Bassin de Ziz (Haut Atlas central, Maroc) Assessment of Metal, Contamination in Jurassic Water Tables of Ziz High Basin Central High Atlas, Morocco. J. Mater. Environ. Sci. 2016, 7, 1495–1503. [Google Scholar]
- Prasanna, M.; Praveena, S.; Chidambaram, S.; Nagarajan, R.; Elayaraja, A. Evaluation of water quality pollution indices for heavy metal contamination monitoring: A case study from Curtin Lake, Miri City, East Malaysia. Environ. Earth Sci. 2012, 67, 1987–2001. [Google Scholar] [CrossRef]
- Ministry of the Environment—MINAM. Environmental Quality Standards for Water Supreme Decree. No. 004-2017-MINAM; 2017. [Google Scholar]
- World Health Organization—WHO. Guidelines for Drinking-Water Quality, 4th ed.; World Health Organization (WHO): Geneva, Switzerland, 2017. [Google Scholar]
- Initiative for Responsible Mining Assurance (IRMA). IRMA Water Quality Criteria by End-Use Tables; Initiative for Responsible Mining Assurance: Washington, DC, USA, 2018. [Google Scholar]
- United States Environmental Protection Agency—USEPA. Regional Screening Level Summary Table. 2019. Available online: https://www.epa.gov/risk/regional-screening-levels-rsls-generic-tables (accessed on 1 January 2020).
- Salazar-Torres, C.; Carbajal-Kam, I.; Ponce-Ruiz, G.; Lazo-Vilela, J.; Alba-Baltazar, E. Environmental Impact of Mining Tailings in the Middle Basin of the Rimac River in Peru. Master’s Thesis, Universidad Privada del Norte, Trujillo, Peru, 2021. [Google Scholar]
- Piper, A.M. A graphic procedure in the geochemical interpretation of water-analyses. Eos Trans. Am. Geophys. Union 1944, 25, 914–928. [Google Scholar] [CrossRef]
- Stiff, H.A., Jr. The interpretation of chemical water analysis by means of patterns. J. Petroleum. Technol. 1951, 3, 15–17. [Google Scholar] [CrossRef]
- Fuoco, I.; De Rosa, R.; Barca, D.; Figoli, A.; Gabriele, B.; Apollaro, C. Arsenic polluted waters: Application of geochemical modelling as a tool to understand the release and fate of the pollutant in crystalline aquifers. J. Environ. Manag. 2022, 301, 113796. [Google Scholar] [CrossRef] [PubMed]
- Apollaro, C.; Tripodi, V.; Vespasiano, G.; De Rosa, R.; Dotsika, E.; Fuoco, I.; Critelli, S.; Muto, F. Chemical, isotopic and geotectonic relations of the warm and cold waters of the Galatro and Antonimina thermal areas, southern Calabria, Italy. Mar. Pet. Geol. 2019, 109, 469–483. [Google Scholar] [CrossRef]
- Han, Y.-J.; Liang, R.-Z.; Li, H.-S.; Gu, Y.-G.; Jiang, S.-J.; Man, X.-T. Distribution, Multi-Index Assessment, and Sources of Heavy Metals in Surface Sediments of Zhelin Bay, a Typical Mariculture Area in Southern China. Toxics 2023, 11, 150. [Google Scholar] [CrossRef] [PubMed]


| Metals | Surface Water (mg L−1) | Groundwater (mg L−1) | Guidelines Values (mg L−1) | ||||||
|---|---|---|---|---|---|---|---|---|---|
| ECA MINAM | WHO | IRMA | EPA | ||||||
| Range | Mean ± DS | Range | Mean ± DS | Cat1-A1 | Cat1-A2 | ||||
| Al | 0.071–1.229 | 0.3 ± 0.51 | <LOQ–37.5 | 9.5 ± 18.67 | 0.9 | 5 | 0.1 | ||
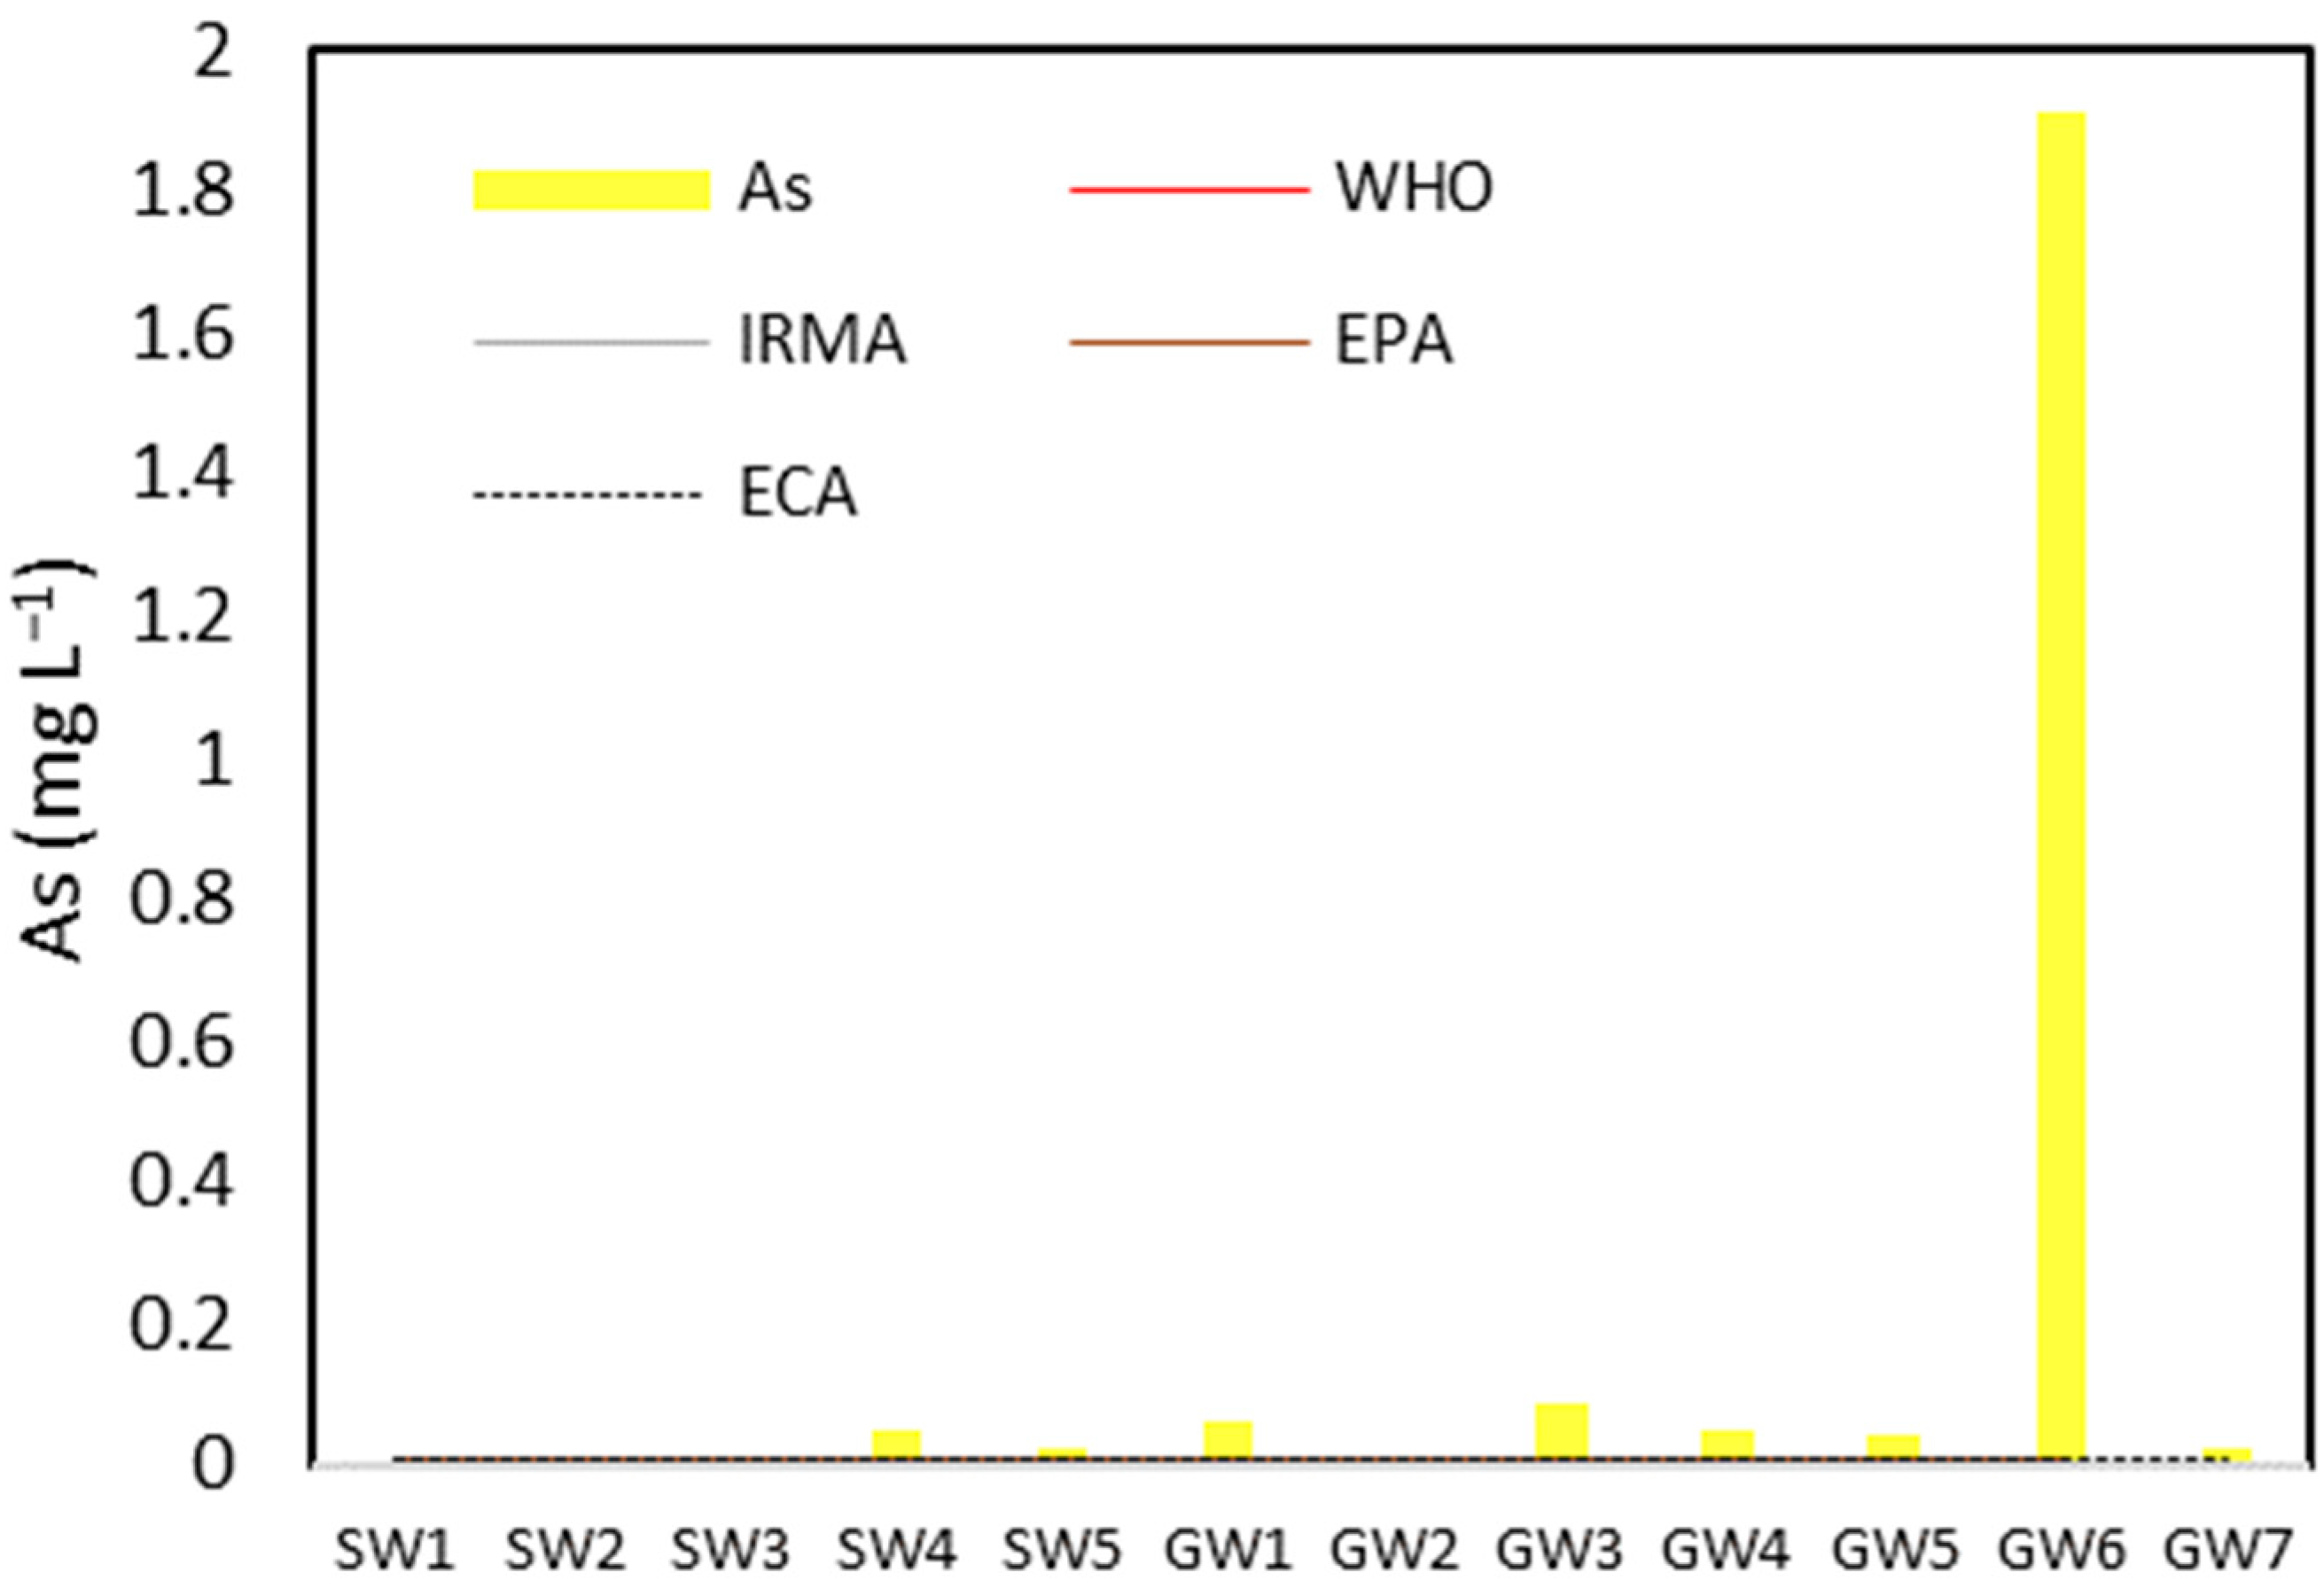
| As | 0–0.05 | 0.02 ± 0.02 | 0–1.9 | 0.31 ± 0.71 | 0.01 | 0.01 | 0.01 | 0.01 | 0.01 |
| Ba | 0.01–0.04 | 0.02 ± 0.01 | <LOQ–0.03 | 0.02 ± 0.01 | 0.7 | 1 | 1.3 | 1 | |
| Be | <LOQ | <LOQ–0.005 | 0.012 | 0.04 | 0.06 | ||||
| B | <LOQ–0.03 | 0.02 ± 0.005 | 0.01–0.15 | 0.07 ± 0.06 | 2.4 | 2.4 | 2.4 | ||
| Cd | <LOQ–0.003 | 0.002 | <LOQ–0.75 | 0.38 ± 0.53 | 0.003 | 0.005 | 0.003 | 0.005 | 0.005 |
| Cu | <LOQ–0.1 | 0.05 ± 0.07 | <LOQ–9.19 | 2.31 ± 4.59 | 2 | 2 | 2 | 1 | 1 |
| Cr | <LOQ | <LOQ–0.01 | 0.001 ± 0.005 | 0.05 | 0.05 | 0.05 | 0.05 | ||
| Fe | 0.2–1.7 | 0.8 ± 0.75 | <LOQ–160.1 | 28.01 ± 64.72 | 0.3 | 1 | 0.3 | ||
| Mn | 0–0.2 | 0.08 ± 0.07 | 0.04–12.78 | 2.37 ± 4.65 | 0.4 | 0.4 | 0.05 | 0.05 | |
| Hg | <LOQ | <LOQ | 0.001 | 0.002 | 0.006 | 0.001 | |||
| Mo | <LOQ–0.0003 | 0–0.002 | 0.001 ± 0 | 0.07 | ** | 0.05 | |||
| Ni | <LOQ | <LOQ–0.1 | 0.04 ± 0.06 | 0.07 | ** | 0.07 | 0.02 | ||
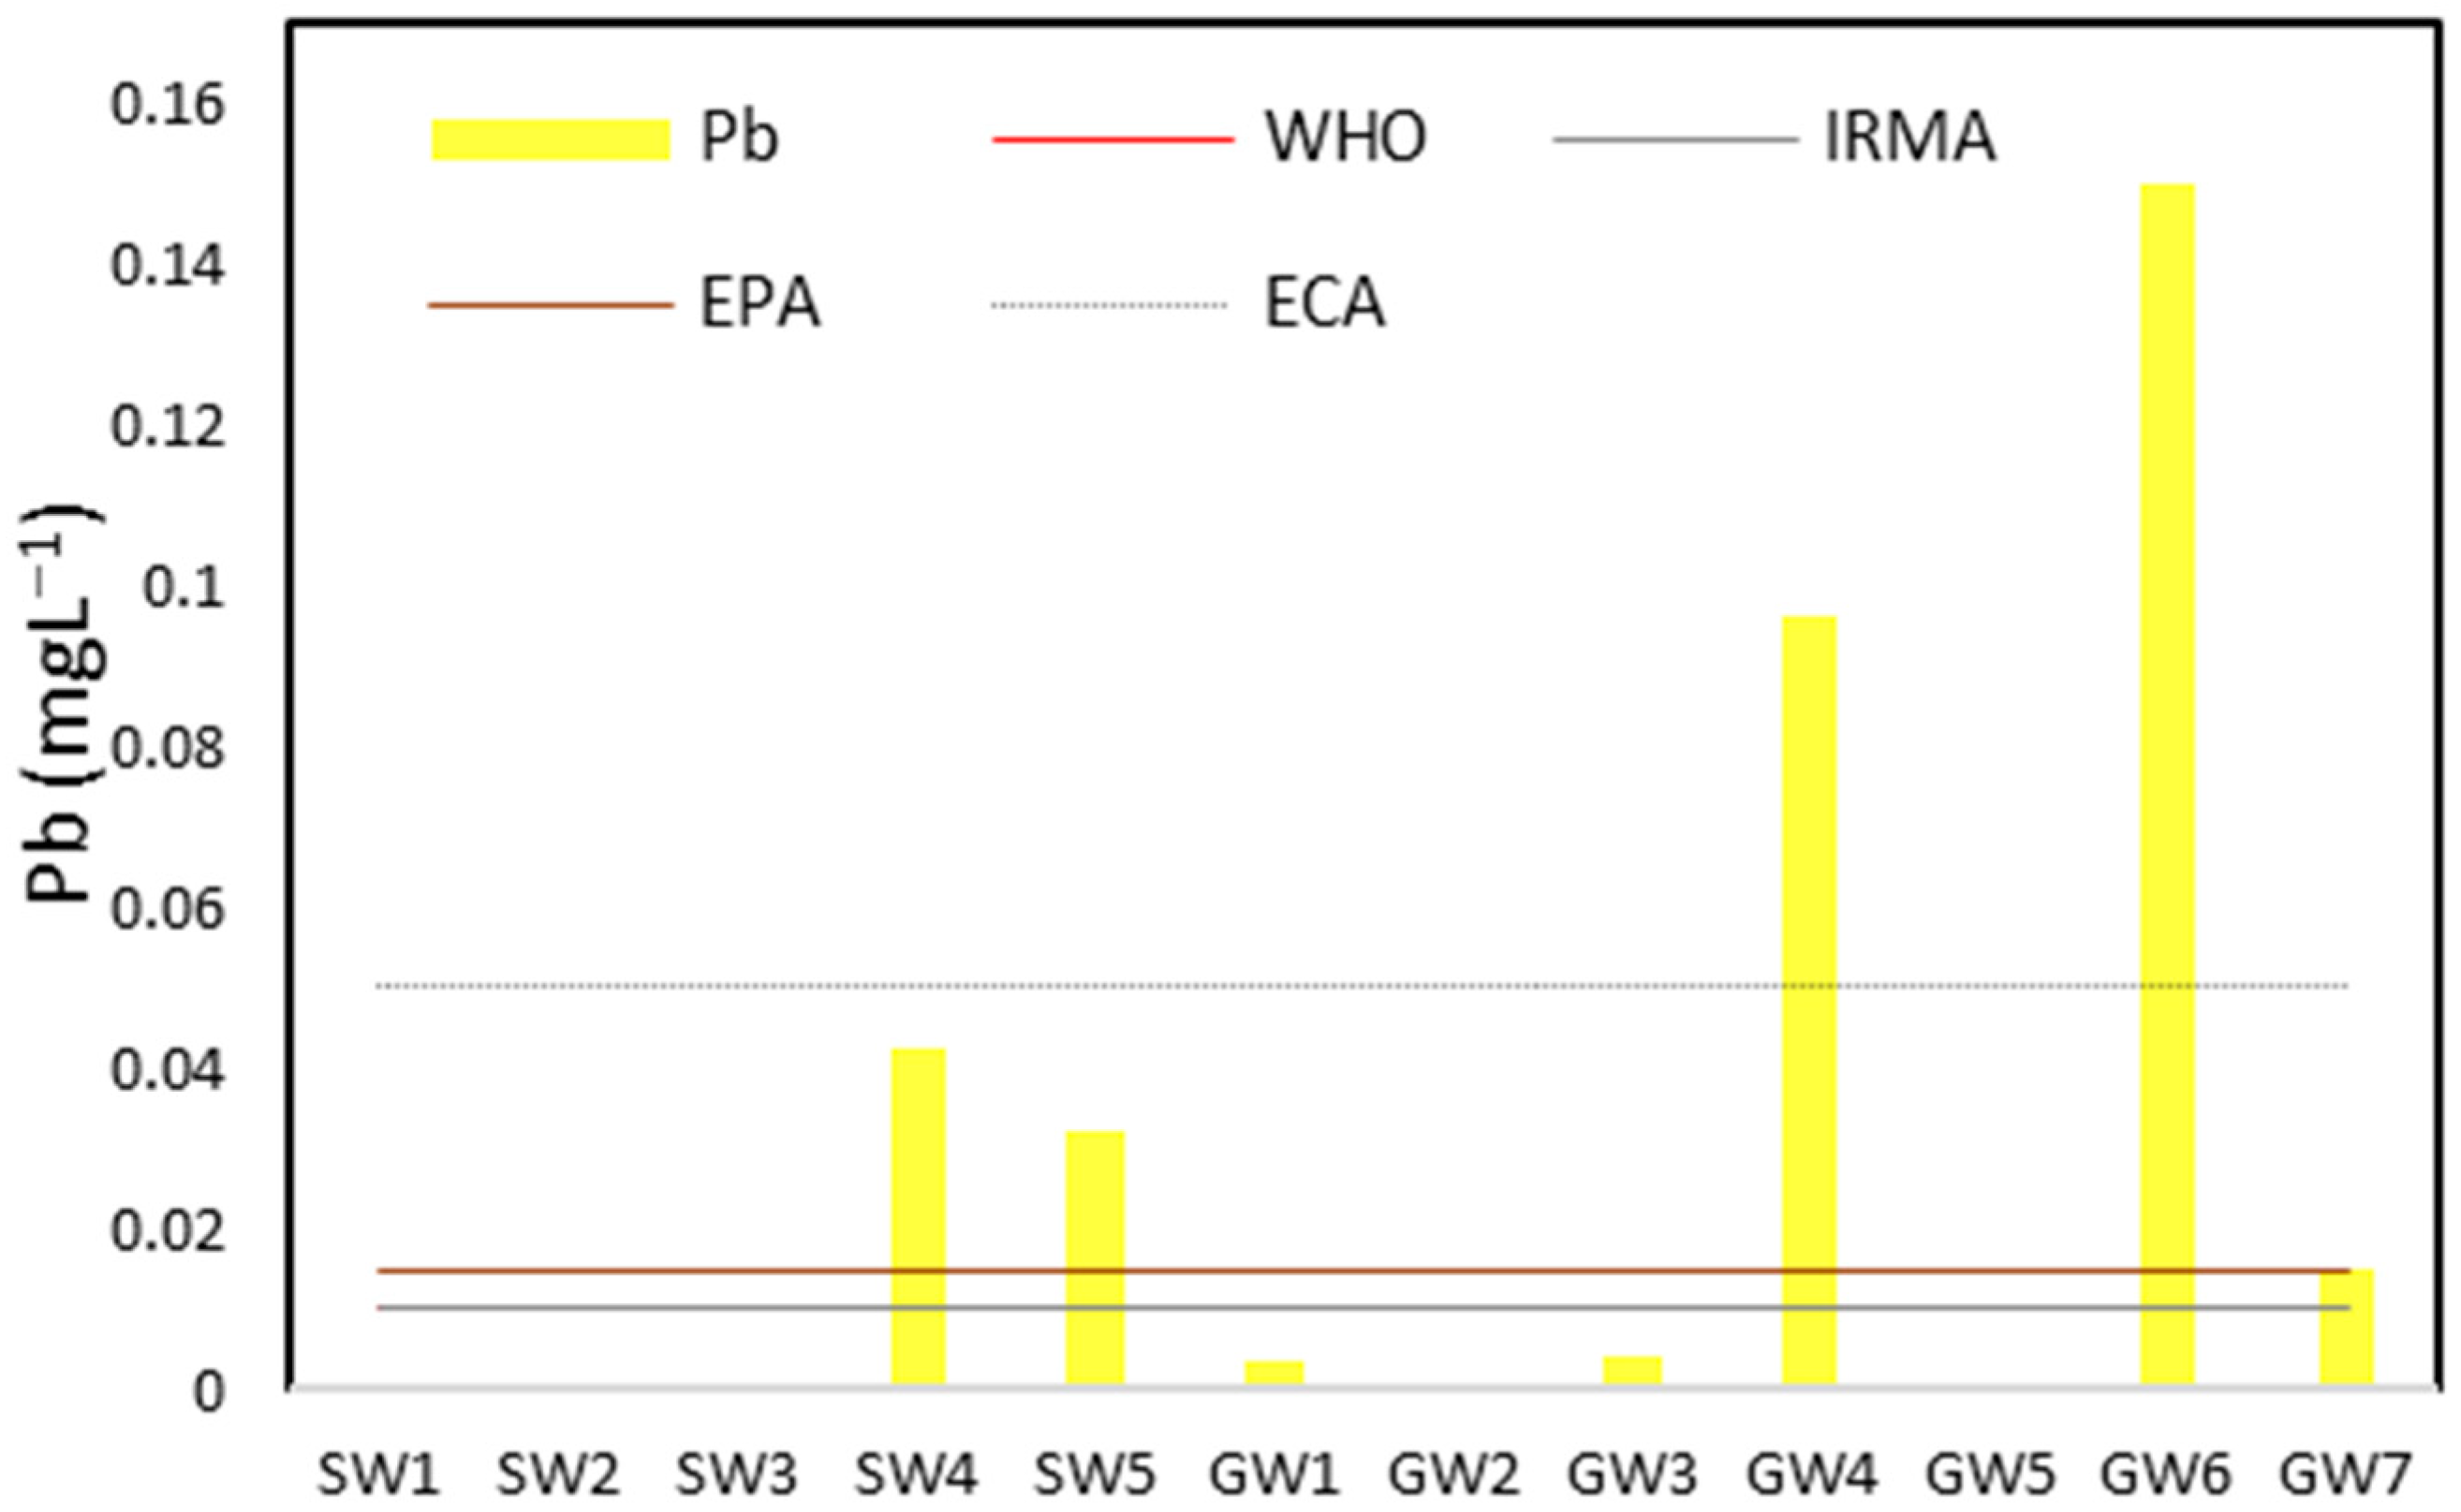
| Pb | <LOQ–0.04 | 0.04 ± 0.01 | 0–0.15 | 0.05 ± 0.07 | 0.01 | 0.05 | 0.01 | 0.01 | 0.015 |
| Se | <LOQ | <LOQ | 0.04 | 0.04 | 0.04 | 0.04 | |||
| U | <LOQ | <LOQ | 0.02 | 0.02 | 0.3 | 0.03 | |||
| Zn | 0–0.5 | 0.12 ± 0.20 | <LOQ–123.52 | 21.03 ± 50.22 | 3 | 5 | 3 | ||
Disclaimer/Publisher’s Note: The statements, opinions and data contained in all publications are solely those of the individual author(s) and contributor(s) and not of MDPI and/or the editor(s). MDPI and/or the editor(s) disclaim responsibility for any injury to people or property resulting from any ideas, methods, instructions or products referred to in the content. |
© 2023 by the authors. Licensee MDPI, Basel, Switzerland. This article is an open access article distributed under the terms and conditions of the Creative Commons Attribution (CC BY) license (https://creativecommons.org/licenses/by/4.0/).
Share and Cite
Cesar Minga, J.; Elorza, F.J.; Rodriguez, R.; Iglesias, A.; Esenarro, D. Assessment of Water Resources Pollution Associated with Mining Activities in the Parac Subbasin of the Rimac River. Water 2023, 15, 965. https://doi.org/10.3390/w15050965
Cesar Minga J, Elorza FJ, Rodriguez R, Iglesias A, Esenarro D. Assessment of Water Resources Pollution Associated with Mining Activities in the Parac Subbasin of the Rimac River. Water. 2023; 15(5):965. https://doi.org/10.3390/w15050965
Chicago/Turabian StyleCesar Minga, Julio, Francisco Javier Elorza, Ramon Rodriguez, Alfredo Iglesias, and Doris Esenarro. 2023. "Assessment of Water Resources Pollution Associated with Mining Activities in the Parac Subbasin of the Rimac River" Water 15, no. 5: 965. https://doi.org/10.3390/w15050965