Article

Removal of Naphthalene, Fluorene and Phenanthrene by Recyclable Oil Palm Leaves’ Waste Activated Carbon Supported Nano Zerovalent Iron (N-OPLAC) Composite in Wastewater

by
Hifsa Khurshid
1,*,
Muhammad Raza Ul Mustafa
2 and
Zeyneb Kilic
3
1
Department of Civil & Environmental Engineering, Universiti Teknologi PETRONAS, Seri Iskandar 32610, Malaysia
2
Centre for Urban Resource Sustainability, Institute of Self-Sustainable Building, Department of Civil & Environmental Engineering, Universiti Teknologi PETRONAS, Seri Iskandar 32610, Malaysia
3
Department of Civil Engineering, Adıyaman University, 02000 Adıyaman, Turkey
*
Author to whom correspondence should be addressed.
Water 2023, 15(5), 967; https://doi.org/10.3390/w15050967
Submission received: 31 December 2022 / Revised: 29 January 2023 / Accepted: 2 February 2023 / Published: 2 March 2023

Abstract

:
Despite keen interest in the development of efficient materials for the removal of polycyclic aromatic hydrocarbons (PAHs) in wastewater, the application of advanced composite materials is still unexplored and needs attention. Therefore, this study focused on the synthesis of the composite of oil palm leaves’ waste activated-carbon (OPLAC) and nano zerovalent iron (NZVI) at Fe:OPLAC = 1:1 (N-OPLAC-1) and 1:2 (N-OPLAC-2). The composite with enhanced surface properties was applied for removal of three PAHs including naphthalene (NAP), fluorene (FLU) and phenanthrene (PHE) in wastewater at various pH, dosages, contact time and initial concentration in batch testing. The PAHs’ removal parameters were optimized using design expert software. The PAHs’ removal efficiency was evaluated in produced water at optimized parameters. The results showed that the N-OPLAC-2 had superior surface properties compared to N-OPLAC-1. The removal of NAP, FLU and PHE was heterogenous, favorable and involved chemisorption proved by Freundlich isotherm and pseudo-second-order kinetic models using N-OPLAC-2. The optimum parameters were as follows: pH of 3, dosage and contact time of 122 mg/L and 49 min, respectively. The application of N-OPLAC-2 in produced water was favorable for removal of NAP, FLU and PHE and showed up to 90% removal efficiency, and higher stability up to 3 cycles. It can be concluded that the NZVI-OPLAC composite was successfully synthesized in this study and the materials showed good removal efficiency for three PAHs (NAP, FLU and PHE) in wastewater.

1. Introduction

Significant emphasis has been placed on polycyclic aromatic hydrocarbons’ (PAHs) removal in wastewater due to their carcinogenic consequences [1]. PAHs are highly hazardous substances that can affect aquatic species as well as humans through food chains [2]. Several industrial wastewater streams, including effluents from the oil and gas sector (called produced water), the pharmaceutical industry, coke manufacture and leachate from municipal landfills, have been identified as significant contributors of waterborne PAH pollution [3,4,5]. Therefore, wastewater must be treated to remove the PAHs before being discharged to the natural environment.
Produced water (PW) is one of the most significant contributors to environmental contamination. Total dissolved solids, dissolved oil, PAHs, heavy metals, radioactive contaminants and manufacturing chemical compounds are the principal sources of contamination in PW [6]. These contaminants increase the PW streams’ toxicity, chemical oxygen demand, biological oxygen demand and turbidity. The global environmental laws for the disposal of PW are concerned with the overall oil content, specifically hydrocarbon compounds [7]. The permissible discharge limit for PAHs in discharge water is 0.2 μg/L [8]. The level of PAHs in PW is between 100 and 1000 μg/L. Therefore, the PW streams require significant treatment for the elimination of PAHs in order to comply with discharge restrictions.
Adsorption has gained popularity for the separation of PAHs from wastewater owing to its ease of use, high efficacy in removing PAHs and accessibility of several adsorbent materials [9]. Numerous adsorbents, for example activated carbons (ACs) [10], nano zerovalent iron (NZVI) [11], ion-imprinted materials [12], mesoporous materials [13] and carbon nanotubes [14], have been utilized for PAHs’ removal. However, the adsorption efficiency and cost are material dependent. Therefore, developing low cost and efficient adsorbents for PAHs’ removal in wastewater are of keen interest. AC is the most popular adsorbent material for this purpose, due to its effectiveness and cost viability. In addition to being able to adsorb aromatic hydrocarbons, ACs are also capable of adsorbing more complex organic molecules, such as those containing benzene rings including pharmaceuticals and pesticides [15,16]. In recent years, composites of ACs with nanomaterials have gained prominence due to their unique chemical, physical and biological properties, as well as their thin geometries, large surface area, numeral functional groups and high adsorption capacity [17,18]. In comparison to AC, they also have better regeneration capacities and faster reaction rates [19]. This has increased interest among researchers in developing composite adsorbents.
The NZVI is frequently used to reductively remove organic contaminants from aqueous solutions. It possesses a large surface area, a high capacity for reduction and potent adsorption abilities for a range of contaminants [20]. Some of the issues with the application of NZVI include agglomeration and surface oxidation. Additionally, it is difficult to separate from an aqueous medium by filtering and centrifugation, which is still a significant problem. The literature suggests that using support elements in the adsorbent may help to solve this issue, such as ACs [21]. The most cost-effective, non-toxic and environmentally acceptable source of ACs is now known to be biowastes. They include waste from people, animals and crops. Globally, 140 million metric tons of agricultural waste are produced each year, and this waste has a great deal of potential for use as ACs in the water purification sector [22]. Therefore, supporting the NZVI on biowaste ACs can provide an economical and efficient solution for the water pollutants’ removal.
One of the most prevalent types of agricultural waste is palm tree waste, particularly in areas where oil palms are farmed [23]. The use of oil palm waste as AC in water treatment has only been the subject of a small number of studies. Adsorption of the pesticide 2,4-D from an aqueous solution was achieved using AC extracted from palm fronds by Salman et al. [24]. Soliman et al. [25] found the adsorption of Pb(II) ions on chemical AC derived from date-palm tree leaves. Oil palm leaves were used in a method developed by Fathy et al. to create amorphous carbon thin-films [26]. Eid [27] successfully synthesized polyethylenimine-functionalized magnetic amorphous carbon thin-film nanocomposite (Fe3O4-PEI-ACTF NC) using oil palm leaves. It worked as efficient adsorbent of Hg(II) from aqueous samples. The literature shows that studies have not focused on the usage of oil palm leaves to be used as adsorbents of PAHs in PW. Therefore, this study suggests using a composite of NZVI and oil palm leaves AC (OPLAC) for the removal of PAHs in wastewater, with application to PW. It could make commercial ACs used as adsorbents for PW treatment more affordable, allowing OPLAC to reach its full potential.
Naphthalene (NAP), fluorene (FLU) and phenanthrene (PHE) were chosen as representative PAHs’ compounds in this study because they are one of the most found priority PAHs. Another reason to choose NAP, FLU and PHE as representative PAHs was their low molecular weight. Pyrene, benzo[b]fluoranthene and benzo[g,h,i]perylene are examples of high molecular weight PAHs (four or more rings), which are highly sorbed to particles and have less negative environmental impacts [28]. The environment and people are seriously threatened by low molecular weight PAHs (two or three rings), such as NAP, FLU and PHE, which are water soluble and may be transferred with groundwater or surface water [29]. Therefore, it is more crucial to treat low molecular weight PAHs. This study will help to extend the application of abundantly available oil-palm leaves’ waste, advance composites and treatment of abundantly found PAHs to achieve the goals of sustainable development through waste management and water purification.

2. Materials and Methods

2.1. Reagents

An oil and gas company in Southeast Asia provided the PW sample. The oil palm leaves waste was gathered from FELCRA Berhad, Perak. Ammonium hydrogen difluoride (NH4HF2, 95%), phosphoric acid (H3PO4), sodium hydroxide (NaOH) and zinc chloride (ZnCl2) were acquired from Avantis Laboratory Supply. The PAHs used in the study were naphthalene (NAP), fluorine (FLU,) and phenanthrene (PHE). The Sigma-Aldrich Supelco analytical solid standards of NAP (C10H8, mol. weight = 128.17 g/mol), FLU (C13H10, mol. weight = 166.22 g/mol) and PHE (C14H10, mol. weight = 178.23 g/mol) were purchased from Avantis Laboratory Supply.

2.2. Characterization of PW

Using high performance liquid chromatography (HPLC, Agilent) with an inertsil ODS-P HPLC column and a diode array ultraviolet (UV) 254 nm detector, the NAP, FLU and PHE in PW were determined. The mobile phase was a combination of methanol and water in 80:20, flowing at a rate of 1 mL/minute for 20 min. The column temperature was 40 °C, and the injection volume was 20 μL.
The acetonitrile (ACN) solution containing 2000 mg of each PAH powder (NAP, FLU, and PHE) was diluted with methanol to the mark of 2000 mL to produce the stock standard solution with a concentration of 1000 mg/L. By diluting the stock standard with water, further diluted standards were prepared at 5 concentrations (2000, 1000, 500, 10 and 0.1 μg/L). The HPLC analysis was conducted for diluted standards and a chromatograph was obtained containing retention time and peak area for three PAHs. A calibration curve was drawn for each PAH and the unknown quantities of NAP, FLU and PHE in PW were find out by the peak analysis in calibration curve.

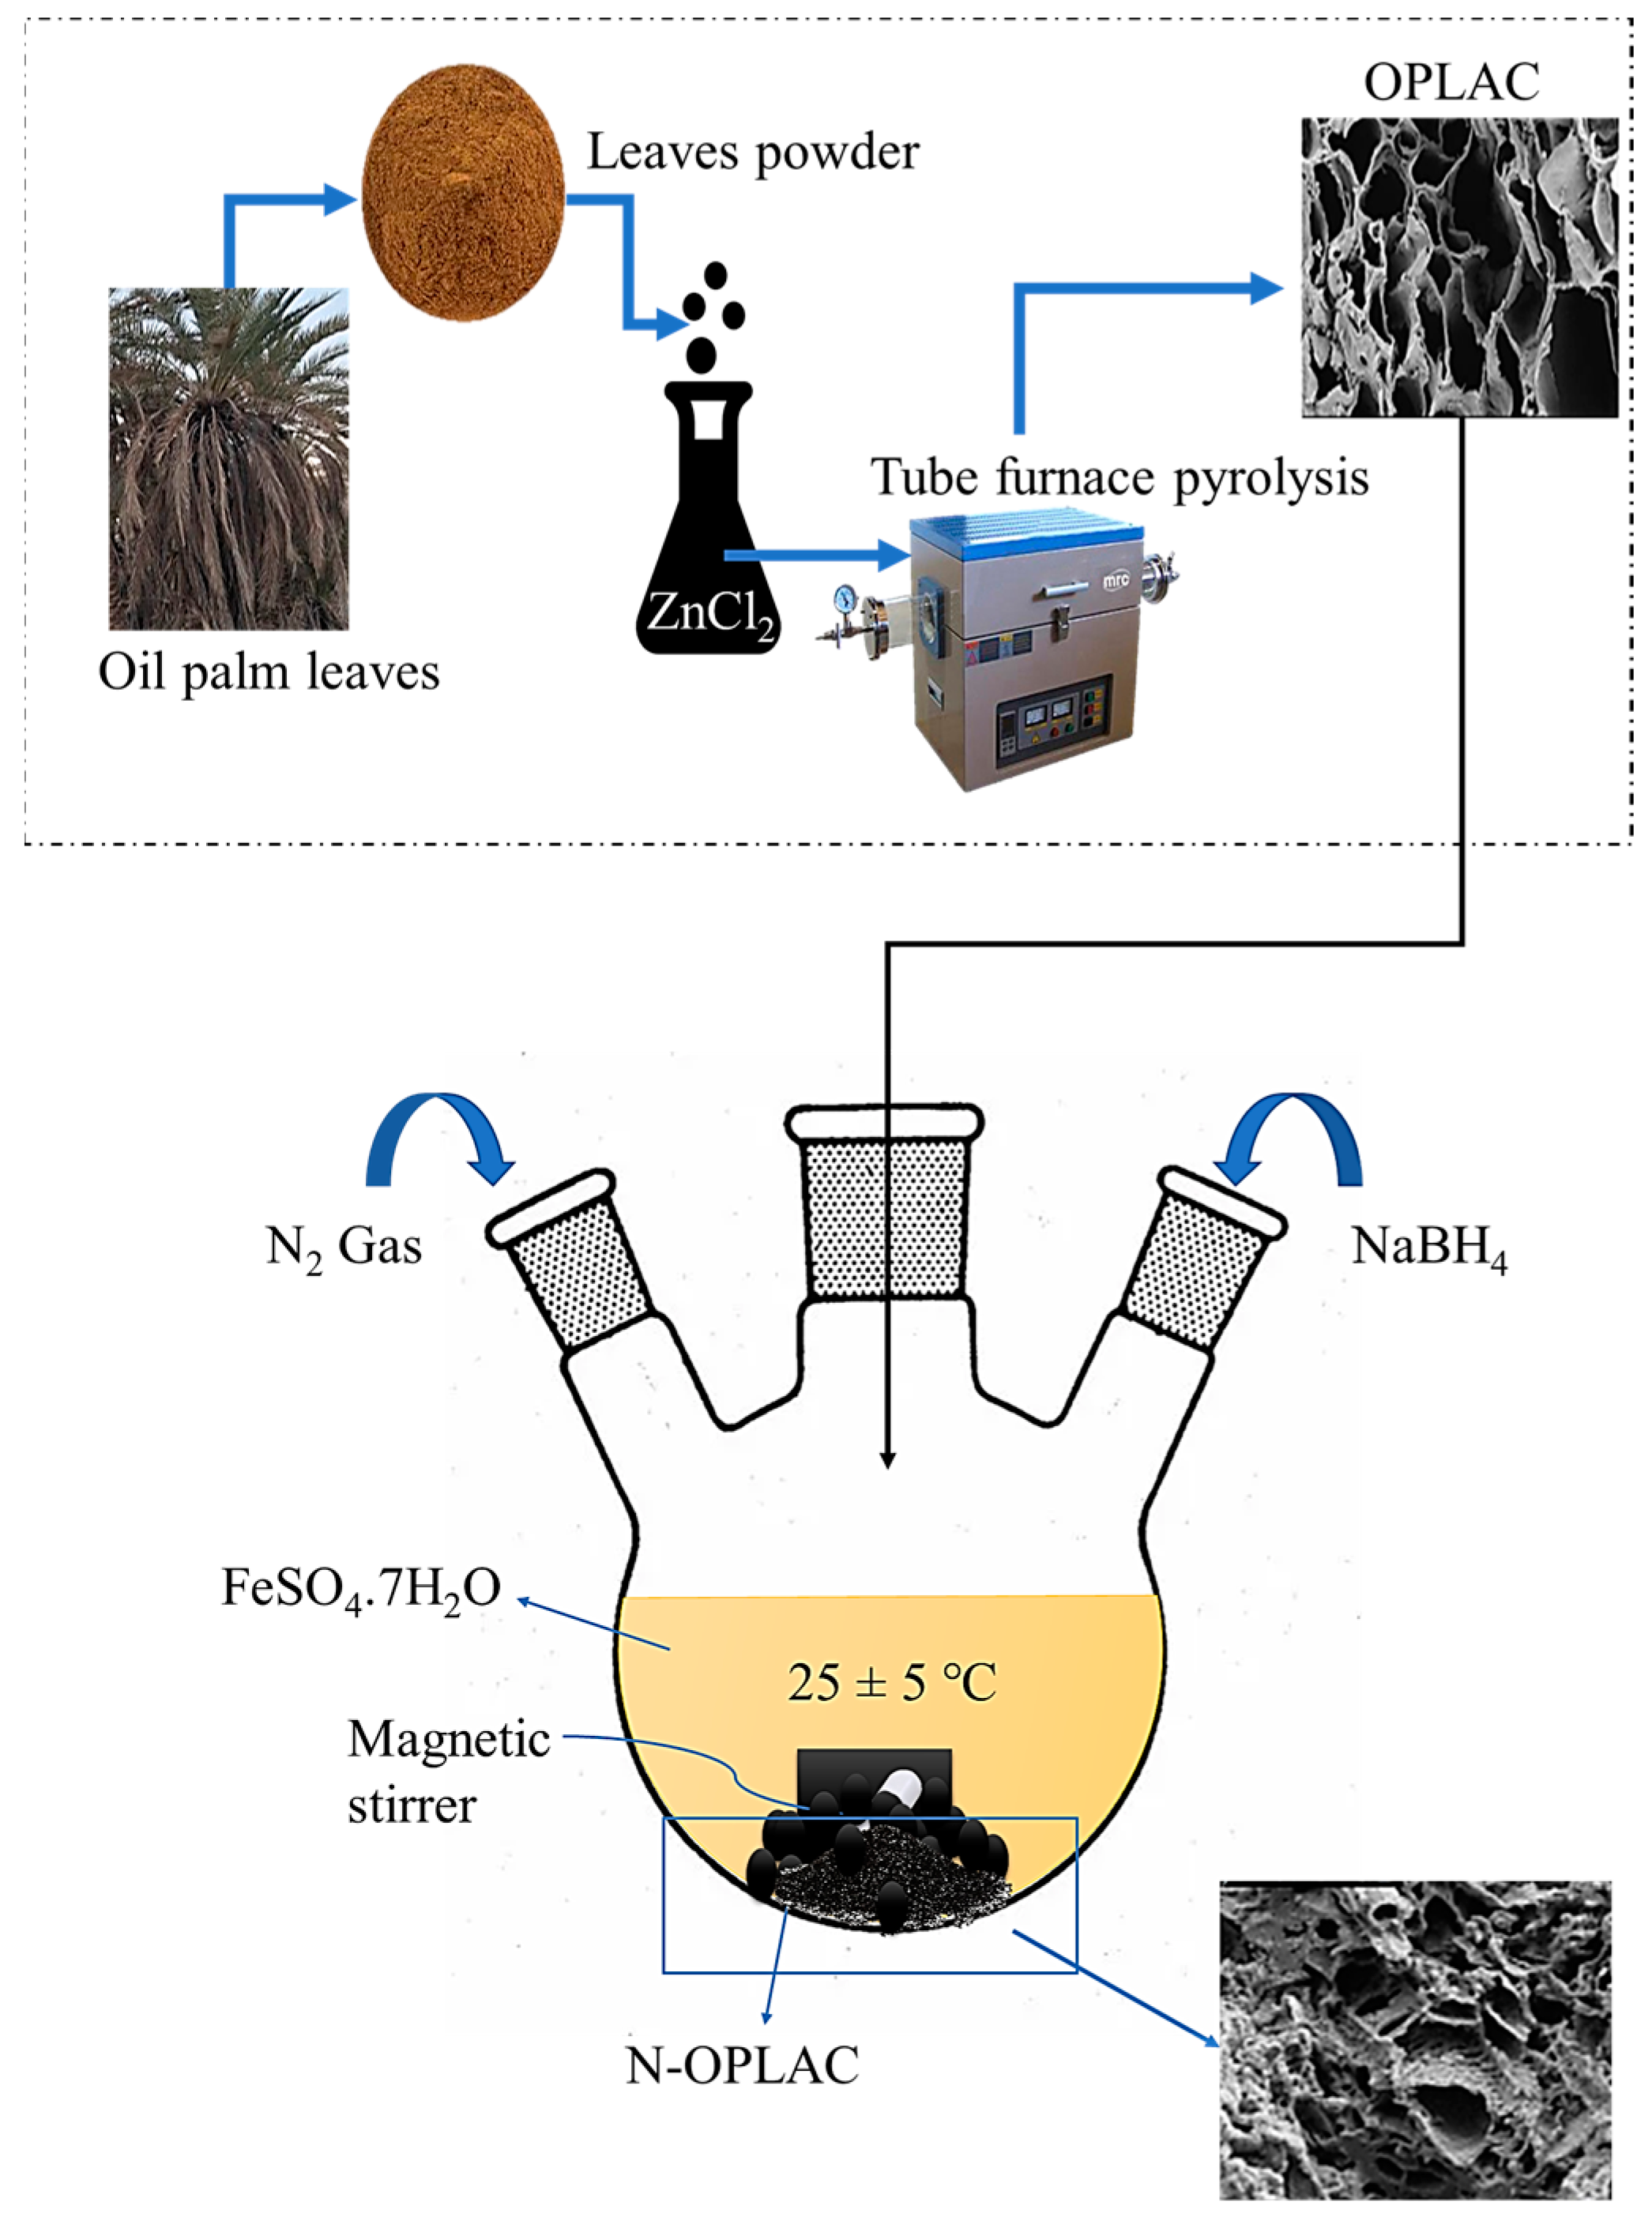
2.3. Synthesis of OPLAC and NZVI-OPLAC Composite (N-OPLAC)

The OPLAC was prepared by using oil palm leaves’ waste. OPLAC preparation method was adopted as reported earlier in our study [23]. The NZVI was synthesized in a three-neck flask by traditional liquid phase-reduction method [30]. The detailed procedure is described in Figure 1.
For NZVI synthesis, 5.56 g FeSO4·7H2O was dissolved in 200 mL water to prepare a 0.1 M solution. The solution was mechanically stirred for 15 min at 25 ± 5 °C. Later, the N2 gas was purged in solution for 30 min with mechanical stirring. While stirring at 250 rpm for 30 min, 1.9 g NaBH4 was carefully added to the solution. The obtained NZVI was centrifugally separated from the solution, washed by vacuum filtration and vacuum-dried at room temperature overnight. The obtained NZVI was stored in a sealed desiccator for further use.
The N-OPLAC was prepared at two mass ratios of Fe and OPLAC taken as 1:1 and 1:2. Using Fe: OPLAC = 1:1 as an example, the preparation process of N-OPLAC-1 consisted of the following steps: The 5.56 g FeSO4·7H2O was dissolved in 200 mL water to prepare a 0.1 M solution and mechanically stirred for 15 min in a three-neck flask. The 5.56 g OPLAC was added to the above solution. The solution was agitated at 120 rpm and 25 ± 5 °C for 30 min and kept at the same temperature overnight. The N2 gas was purged for 30 min with mechanical stirring. Subsequently 1.9 g NaBH4 was added dropwise in the above solution and stirred for 30 min at 120 rpm. During this process, NZVI was impregnated on the surface of OPLAC and the mass ratio of Fe and OPLAC was 1:1. The N-OPLAC-1 was centrifugally separated and rinsed with alcohol and deoxygenated water three times. The collected N-OPLAC-1 was vacuum-dried at room temperature overnight and then stored in a sealed desiccator.
A similar procedure was used to prepare the N-OPLAC with a different Fe and OPLAC mass ratio of 1:2. The N-OPLACs were named as N-OPLAC-1 (1:1) and N-OPLAC-2 (1:2). The entire process of NZVI and NZVI-OPLAC preparation was executed in an N2 environment.

2.4. Batch Experiments for Synthetic Wastewater

According to our knowledge, PAHs have a low solubility in water. Utilizing methanol and ACN as co-solvents for the solubilization of PAHs in aqueous medium was effective. Following the instructions in Section 2.2, a synthetic wastewater sample was prepared by diluting a 1000 mg/L stock solution of NAP, FLU and PHE with distilled water to the required concentrations. The effect of the initial solution’s pH (3–9), the materials’ dosage (100, 500, 1000, 1500, 2000, 2500 and 3000 mg/L), contact time (5, 15, 30, 45, 75 and 90 min) and initial concentration of PAHs (25, 50, 75, 87.5, 100, 125 and 1500 μg/L) was investigated through batch experiments for the removal of NAP, FLU and PHE in synthetic wastewater. The required dosages were added into 100 mL of synthetic wastewater at required pH and shaken for fixed durations. During the experiments, a beaker was placed on a hot plate and stirred at 220 rpm with a magnetic stirrer at a temperature of 25 ± 5 °C. After the stirring period had ended, samples were removed, filtered using a 0.45 m syringe filter and then evaluated using HPLC analysis to determine the final amounts of NAP, FLU and PHE. The NAP, FLU and PHE content was measured before and after each adsorption experiment.

2.5. Isotherm and Kinetic Modelling

2.5.1. Isotherm Modeling

The Langmuir isotherm model and the Freundlich isotherm model were used to analyze the experimental data from equilibrium studies. The batch experimental results obtained by application of various dosages of 25, 50, 75, 87.5, 100, 125 and 1500 μg/L in synthetic wastewater for removal of NAP, FLU and PHE were used for the modeling purpose of Langmuir and Freundlich models. Equations (1) and (2) below represent the linear form of the Langmuir and Freundlich isotherm models [31]:
C e q e = 1 K L q max + C e q max
log q e = log K F + 1 n log C e
The Ce values were calculated by measuring the amount of NAP, FLU and PHE left in the synthetic wastewater in mg/L after each batch experiment. The qe was calculated by measuring the NAP, FLU and PHE amount removed in the synthetic wastewater in mg/g after each batch experiment. From the slope and intercept of the Ce/qe versus the Ce graph, the qmax and KL values of the Langmuir model were calculated. Equation (3) was used to determine the dimensionless constant RL, which is the separation factor or equilibrium parameter in the Langmuir model:
R L = 1 + 1 K L C 0  
where C0 represents the initial concentration of NAP, FLU and PHE in synthetic wastewater. Isotherm shapes are categorized as unfavorable (RL > 1), linear (RL = 1), favorable(0 < RL < 1), or irreversible (RL = 0) according to their corresponding RL values [32].
Slope and intercept of the log qe versus log Ce plot were used to determine the Freundlich model parameters n and KF. Adsorption capacity, denoted by the Freundlich constant KF, is proportional to the adsorption intensity, denoted by the empirical constant 1/n. Partial equilibria between the two phases is independent of concentration when n = 1. Adsorption is preferred when n is greater than 1. Alternatively, if n is less than one, then there is cooperation in the adsorption process.

2.5.2. Kinetic Modeling

The removal kinetics of NAP, FLU and PHE were analyzed using the pseudo-first-order (PFO) and pseudo-second-order (PSO) kinetic models. The elimination kinetics of NAP, FLU and PHE were analyzed using the pseudo-first-order (PFO) and pseudo-second-order (PSO) kinetic models. Batch experimental results obtained by application of materials at 5, 15, 30, 45, 75 and 90 min contact times in synthetic wastewater for removal of NAP, FLU and PHE were used for the modeling purpose of PFO and PSO models. Equations (4) and (5), shown below, are the linear form of the PFO and PSO kinetic models:
ln q e q t = ln q e K 1 t  
t q t = 1 K 2 q e 2 + t q e  
The qt and qe were calculated by measuring the NAP, FLU and PHE amount removed in the synthetic wastewater in mg/g after each batch experiment at time t and equilibrium time. The PFO model’s parameters K1 and qe were calculated by plotting ln(qe − qt) versus t. The PSO model’s parameters K2 and qe were calculated by plotting t/qt versus time t.
All models were evaluated based on the R2 value to compare their performance in describing the isotherms and kinetics of NAP, FLU and PHE removal.

2.6. Adsorption Mechanism

Mass transfer occurs during the adsorption process through physisorption or chemisorption. Usually, hydrogen bonding, electron exchange interactions, and π–π interactions play a role in the mechanisms governing PAHs’ removal. The impact of numerous parameters and functional groups present can explain the true mechanism [33]. The removal mechanism of NAP, FLU and PHE was investigated based on characterization and modelling techniques.

2.7. Optimization of the Adsorption Process

For the design of experiments, design expert (DE) software (Stat-Ease, version 11) was used. The response surface methodology (RSM)-based polynomial central composite design (CCD) was chosen. The initial pH of the wastewater, the contact time and the dosage of the synthesized material were all used as inputs. NAP, FLU and PHE removal efficiencies were used as outputs. As determined by the analysis of PW, the initial concentrations of NAP, FLU and PHE were taken to be 200, 100 and 160 μg/L, respectively. There were 25 trial runs altogether. The second-order polynomial regression model was applied to the experimental data gathered through batch tests. Table 1 lists the generated runs and outputs. Analysis of variance (ANOVA) was used to assess the suitability of the developed model and the statistical significance of the constant regression coefficients [34]. The model terms were assessed by using the p-value and a confidence level of 95%.
Based on the desirability function, numerical optimization was used in CCD to determine the best conditions of all independent variables for maximum removal of PAHs (NAP, FLU and PHE) from wastewater. In this case, “in range” options were picked for all independent parameters, whereas “maximum range” options were chosen for PAHs (NAP, FLU and PHE) removal. The obtained optimized parameters were confirmed in the lab.

2.8. Batch Experiments for Produced Water

The optimized parameters (pH, adsorbent dosage and contact time) were used to evaluate the removal efficiency of NAP, FLU and PHE using synthesized adsorbent in PW.

2.9. Regeneration and Reuse of Spent Adsorbents

The commonly used thermal treatment and washing with methanol was used to regenerate the PAH-loaded adsorbents [35]. In the experiment, 100 mL of PW and N-OPLAC were combined and shaken at 25 ± 5 °C. The adsorbent dosage, contact time and pH of PW was adjusted as per the optimized parameters. The used adsorbents were taken out and regenerated by heating at 180 °C for 3 h [36]. The cycle was repeated three times in the subsequent adsorption–desorption experiment. Similarly, adsorbents were washed with methanol and shaken for 3 h. Each time the amount of NAP, FLU and PHE removed was calculated.

3. Results and Discussion

3.1. NAP, FLU and PHE in PW

The NAP found in the PW sample was 195 ± 5 μg/L. The amount of FLU was 100 ± 5 μg/L and the PHE in PW was in the range of 160 ± 5 μg/L. The found PAHs amounts in PW were much higher than the safe discharge limits of PAHs in fresh water (0.2 μg/L) as per USEPA [37]. The results are in line with earlier studies where various researchers have reported PAHs of PW in the range of 100–1000 μg/L [38]. The physiochemical properties of selected PAHs are given in Table 2. The NAP is highly soluble in water unlike FLU and PHE; thus, it stays in water for longer and builds up to potentially harmful concentrations. When compared to NAP and FLU, PHE has a much heavier molecular weight.

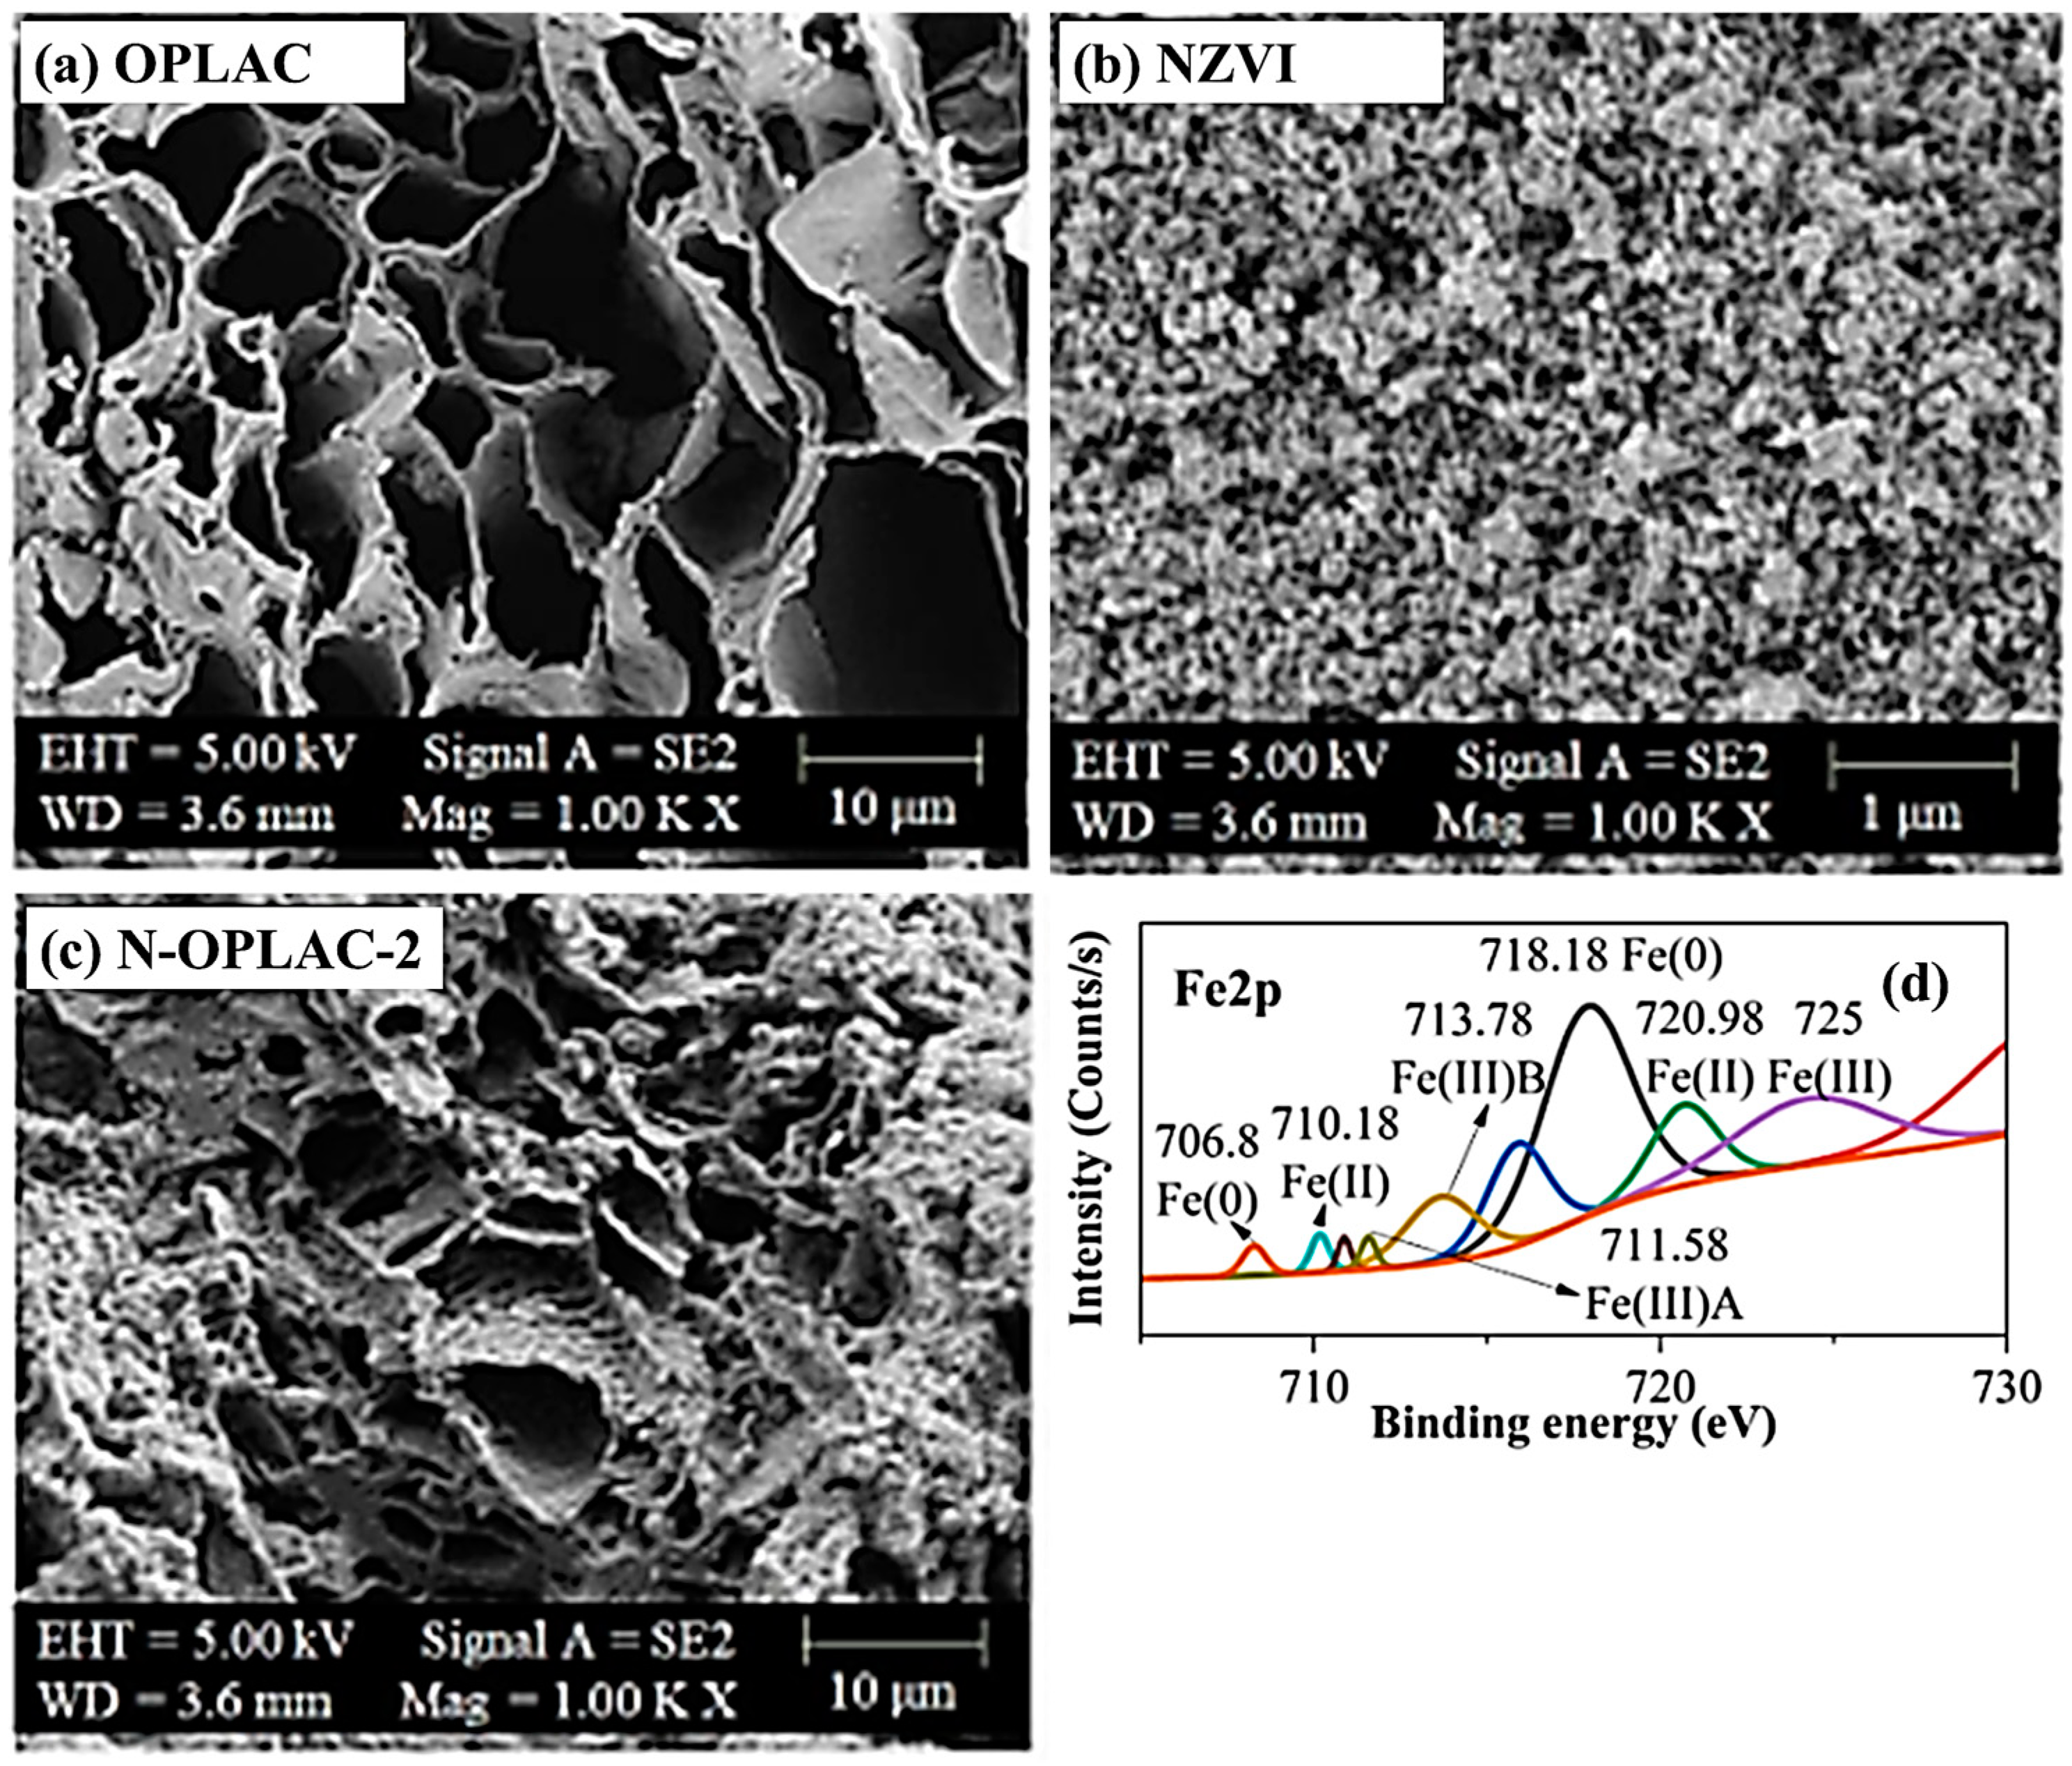
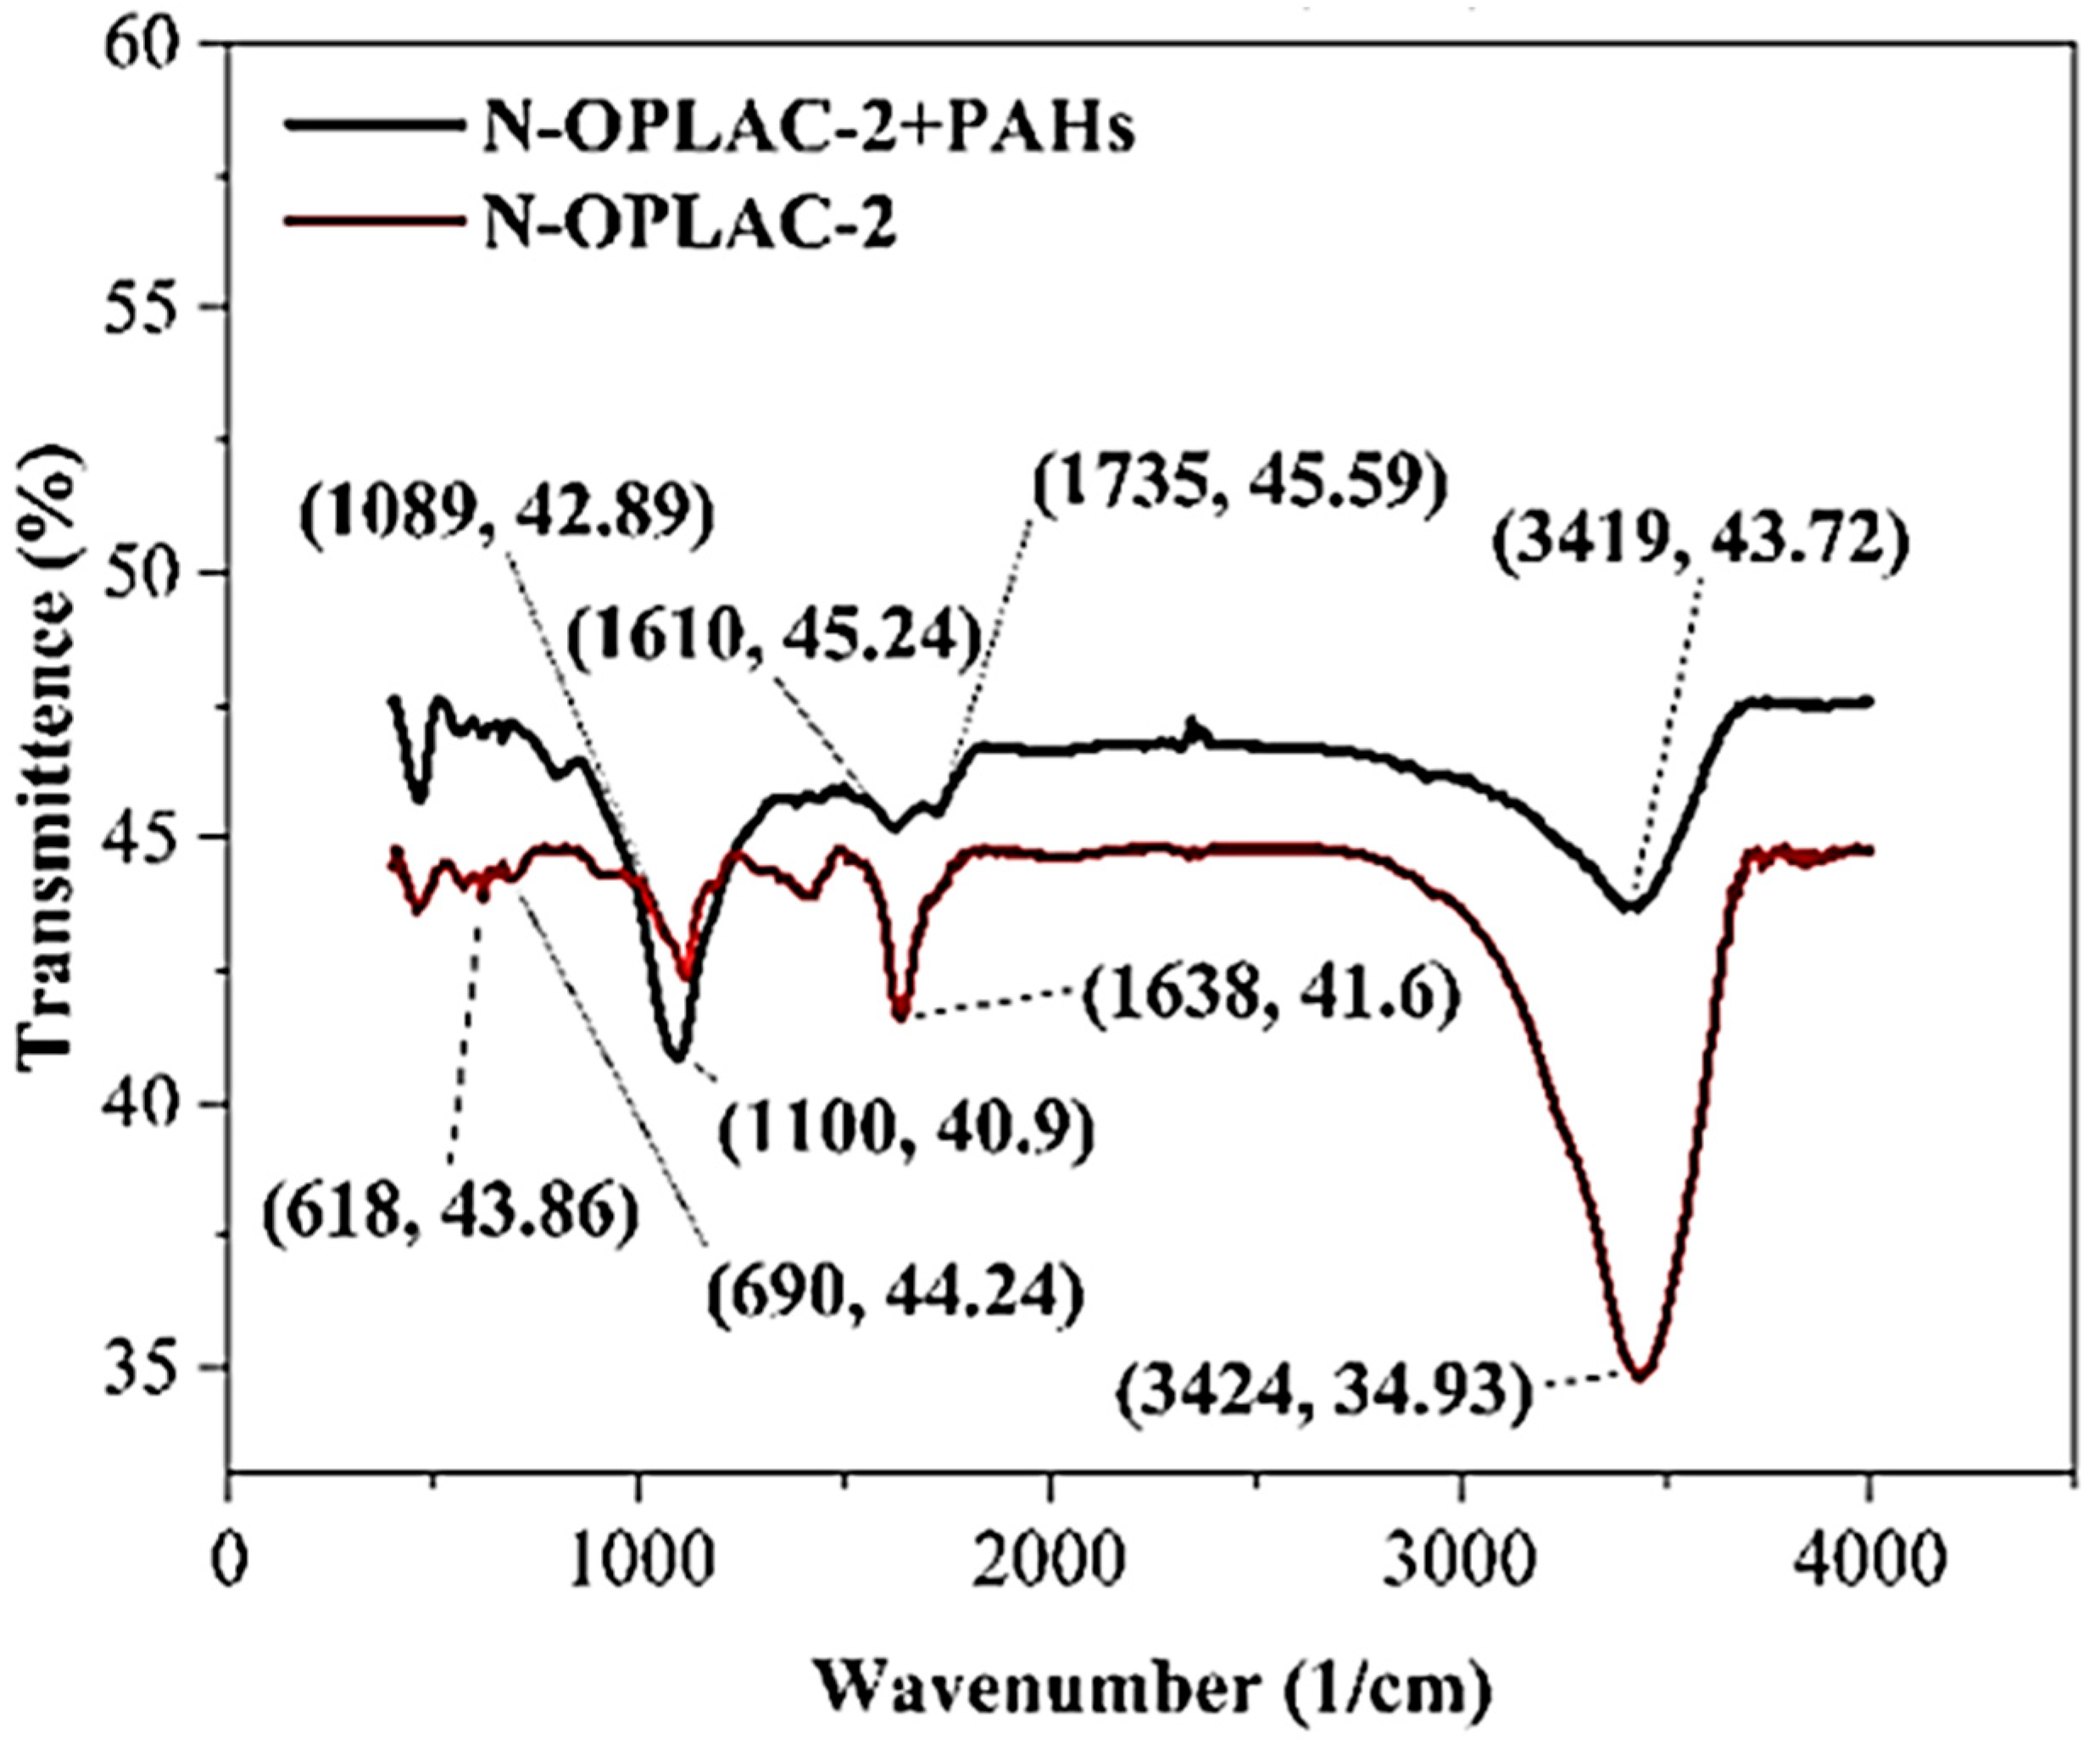
3.2. Characterization of Synthesized Materials

The prepared materials were characterized for their surface area, pore size, surface functional groups, crystallinity, elemental composition and chemical composition. The materials with a higher BET surface area, larger pore size, higher FTIR functional groups and having prominent XRD peaks of source materials were selected for the further analysis and application. The results are discussed in further sections. The prepared materials were characterized for their surface area, total pore volume and pore size using BET surface area analysis (Table 3). The percentage yield is also given in Table 3. Table 3 shows that the surface area of NZVI was 29.24 m2/g and adding OPLAC to make the composite, greatly raised the surface area. At varied mass ratios of 1:1 and 1:2 (Fe:OPLAC), the surface areas for N-OPLAC-1 and N-OPLAC-2 were 243.387 and 258.387 m2/g, respectively. The pore volume and pore size (0.325 cm3/g and 3.64 nm) of N-OPLAC-2 were substantially higher than that of N-OPLAC-1 (0.215 cm3/g and 3.53 nm). It suggested that higher OPLAC content in the composite of NZVI/OPLAC was advantageous for the dispersion of iron nanoparticles. However, adding further OPLAC may cause aggregation of OPLAC sheets, resulting in a lower surface area value rather than an improvement in the specific area [39]. Therefore, N-OPLAC-2 seemed a better composite compared to N-OPLAC-1 in terms of higher surface area and pore volume.
Since the adsorption of molecules with various sizes and shapes is directly correlated with the pore size of adsorbents, the pore size distribution is a significant factor of the adsorption mechanism [40]. Malvern Panalytical’s nanoparticle size analyzer (Zetasizer Nano-ZSP) and a microparticle size analyzer were used to determine the particle size (Horiba HR800, model: LA960). The OPLAC, N-OPLAC-1 and N-OPLAC-2 are microporous (pore size > 2 nm) [41], with a narrow pore size distribution centered at about 2.5–3 nm, according to Figure S1 (Supplementary Materials). The N-OPLAC-2 composite is more porous than the OPLAC and N-OPLAC-1, hence more suitable for the adsorption.
Figure 2a shows the FTIR peaks of NZVI supported on OPLAC prepared at Fe/OPLAC mass ratio of 1:1 and 1:2 (N-OPLAC-1 and N-OPLAC-2). The N-OPLAC-2 showed peaks around 3424 cm−1 (-OH groups), 1638 cm−1 (C=C stretching vibrations of alkenes), 1725 cm−1 (C=C stretching vibrations), 1408 cm−1 (CH3 bending vibrations of alkanes), 1089 cm−1 (C-O stretching vibrations of alcoholic compounds), 690 cm−1 (Fe-O-H) and 618 cm−1 (Fe-O) wavenumbers [42]. The peaks around 690 cm−1 and 618 cm−1 showed the chemical bonds between NZVI and OPLAC [43]. The FTIR peaks were higher for N-OPLAC-2 compared to N-OPLAC-1, indicating that a higher Fe content was able to form higher functional groups at the surface of composite.
To present the probable crystal structures of N-OPLACs, the results of XRD analysis are shown in Figure 2b for various Fe/OPLAC mass ratios (1:1 and 1:2). The amorphous structure of graphite in N-OPLAC-2 was ascribed to the XRD peak at 2θ = 20–25° representing the presence of OPLAC. NZVI was validated based on a large peak centered at 44–46° 2θ [44]. Any prominent peaks were not identified for N-OPLAC-1. The XRD spectrogram of N-OPLAC-2 revealed both Fe0 and OPLAC diffraction peaks, indicating that the composite was successfully synthesized for Fe/OPLAC ratio of 1:2.
The crystallinity was found by comparing the ratio of crystalline peak area to the peak area overall in the XRD graph using OriginPro. The crystallinity of OPLAC, NZVI and N-OPLAC-2 was 64.57%, 66.01% and 88.62%, respectively. The higher crystallinity of N-OPLAC-2 shows that the composite is rigid and it shows the increased mechanical property as well such as higher tensile strength [45]. The calculated average crystalline sizes of OPLAC, NZVI and N-OPLAC-2 using the Debye–Scherrer equation were 12.25 nm (2θ = 25.68°, FWHM = 0.695°), 28.59 (2θ = 45.6°, FWHM = 0.315°) and 8.98 nm (2θ = 45°, FWHM = 1°), respectively. The elemental composition of OPLAC, NZVI and their composites is given in Table 4. The OPLAC had 81.2% carbon content. The composites of OPLAC with NZVI had carbon contents of 61.09%. The carbon content reduced due to the formation of functional groups at the surface [46]. The Fe content of NZVI reduced after formation of complex with OPLAC (N-OPLAC-2).
Figure 3 shows the SEM images of OPLAC, NZVI and N-OPLAC-2. Figure 3a,b shows the OPLAC and fresh NZVI particles made of individual, spherical particles that form aggregates and chains, according to SEM pictures. In Figure 3c, the N-OPLAC-2 image shows that OPLAC surface is covered with NZVI, and pores are also covered with NZVI. Hence, it is evident from SEM images that composites were successfully synthesized.
The XPS analysis of N-OPLAC-2 confirmed that Fe exists in different oxidation states. The binding energies Fe2p3/2 and Fe2p1/2 at 718 and 729 eV corresponded to trivalent Fe [39]. The spectrum of Fe2p (Figure 3d) was deconvoluted into seven peaks at 706.8, 710.18, 711.58, 713.78, 718.18, 720.98 and 725 eV, corresponding to Fe(0), Fe(II)/Fe2O3, Fe(III)A/FeOOH, Fe(III)B, Fe(0), Fe(II) and Fe(III)/FeOOH, respectively.

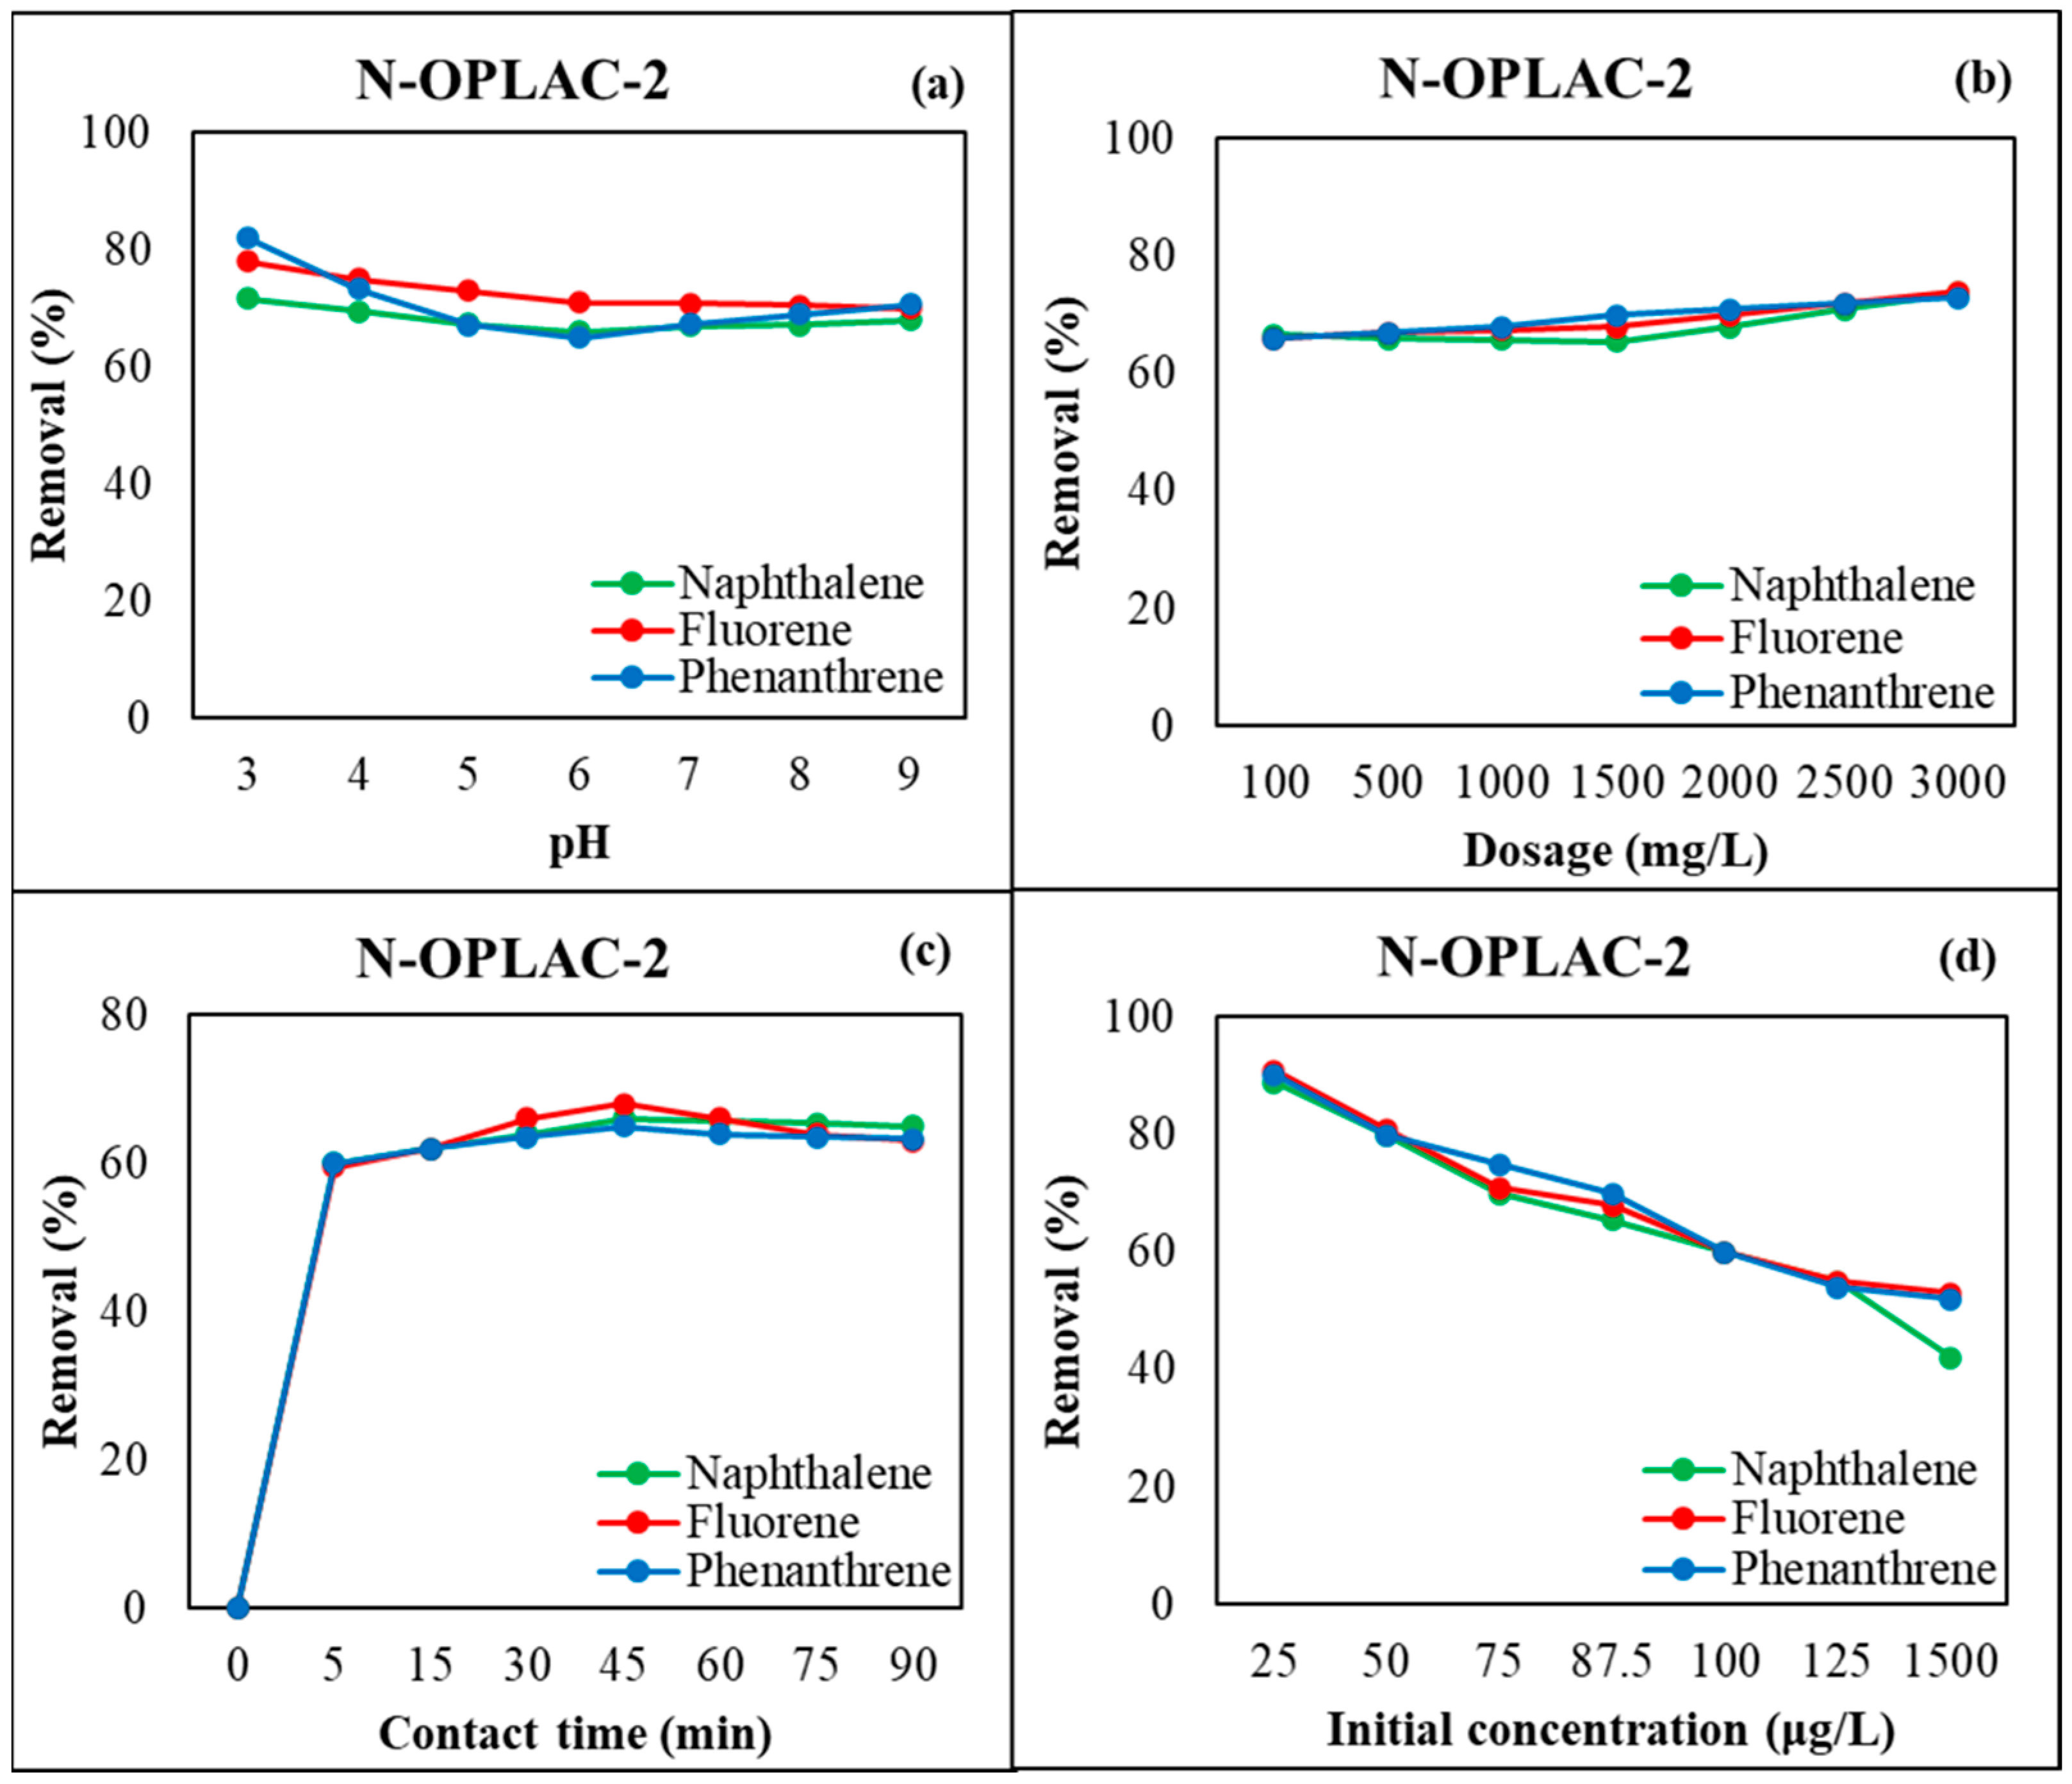
3.3. Adsorption Experiment Results

By relating the area of the HPLC chromatogram to the known concentrations of NAP, FLU, and PHE, calibration curves were obtained (Figure S2). The impact of synthetic wastewater pH, N-OPLAC-2 dosage (mg/L) and contact time (minutes) on removal of NAP, FLU and PHE was evaluated through batch testing. Each batch experiment resulted in an HPLC chromatogram, and the final concentration was determined by correlating the amount of peak area reduced for NAP, FLU, and PHE (Figure S3). The results are discussed further.
Figure 4a shows the results of the percentage removal of NAP, FLU and PHE in synthetic wastewater using N-OPLAC-2, with a change in the initial pH value. Initial solution pH has a negative correlation with the removal rate. Corrosion products such as precipitated metal hydroxides (Fe(OH)2) and Fe(OH)3) and metal carbonates (FeCO3) may further restrict the PAHs diffusion onto inner layers because of the involvement of higher H+ in the reactions [47]. The results showed that the percentage removal of NAP, FLU and PHE reduced from 71% to 66% (±2% error), 78% to 71% (±2% error) and 81% to 65% (±2% error), respectively, with an increase in pH from 3 to 6. A further increase in pH, from 7 to 9, slightly changed the NAP, FLU and PHE removal. Hence, pH 3 was considered optimum for the removal of NAP, FLU and PHE using N-OPLAC-2. It is noticeable that change in pH from 6–9 slightly increased the removal amount of NAP, FLU and PHE. It may be possible due to non-ionic nature of the three PAHs. At higher and lower pH, removal increased slightly due to increase in surface charge. However, removal was minimum near neutral pH. Similar findings have been reported by Hu et al. [48].
Figure 4b shows the plot between the removal efficiency of NAP, FLU and PHE and N-OPLAC-2 dosage. The maximum removal of NAP, FLU and PHE was 73 ± 2%, 74 ± 2% and 73 ± 2%, respectively, around a dosage of 3000 mg/L. The increase in removal efficiency of FLU and PHE with the increase in the N-OPLAC-2 dosage from 100 mg/L to 1500 mg/L can be considered due to availability of more sites for removal. A further increase in the dosage from 1500 mg/L to 3000 mg/L did not significantly increase the removal. However, NAP removal initially decreases with the increasing dosage up to 1500 mg/L and later increased. There was likely a competition for adsorption between FLU, PHE and NAP for reactive sites on the N-OPLAC-2 surface, which inhibited the efficiency with which NAP was removed. The increasing removal behavior at higher N-OPLAC-2 concentrations may be due to NAP adsorption by OPLAC itself, as suggested by reports of π–π interactions between OPLAC and benzene-containing materials [49]. With an increase in N-OPLAC-2 concentration, adsorbed FLU and PHE may provide new adsorptive sites, resulting in a slight enhancement of NAP removal efficiency.
The change in NAP, FLU and PHE removal efficiency at various contact times is represented in Figure 4c. The removal of NAP, FLU and PHE was considerably increased within 5 min contact time. Increasing the contact time further slightly improved the removal capacity until equilibrium reached. The initial removal rate was quicker because there were more active sites that were easily accessible on the N-OPLAC-2 surface. However, the removal rate became constant as the active sites were gradually occupied until they became saturated, and this is why the initial removal rate was faster. As a result, the removal of NAP, FLU and PHE was most effective when it took place after a contact time of 45 min. The removal efficiency of NAP, FLU and PHE was 66 ± 2%, 68 ± 2% and 65 ± 2%, respectively, at this contact time.
The higher removal efficiencies of NAP, FLU and PHE were achieved at lower initial concentrations (25 μg/L) using N-OPLAC-2 (Figure 4d). The percentage removal of NAP reduced from 89% to 42% (±2%) when initial concentration increased from 25 μg/L to 1500 μg/L. The percentage removal of FLU reduced from 91% to 53% (±2%) when initial concentration increased from 25 μg/L to 1500 μg/L. The percentage removal of PHE reduced from 90% to 52% (±2%) when initial concentration increased from 25 μg/L to 1500 μg/L. The removal capacity reduced with increasing PAHs’ concentration due to saturation of N-OPLAC-2 surface.

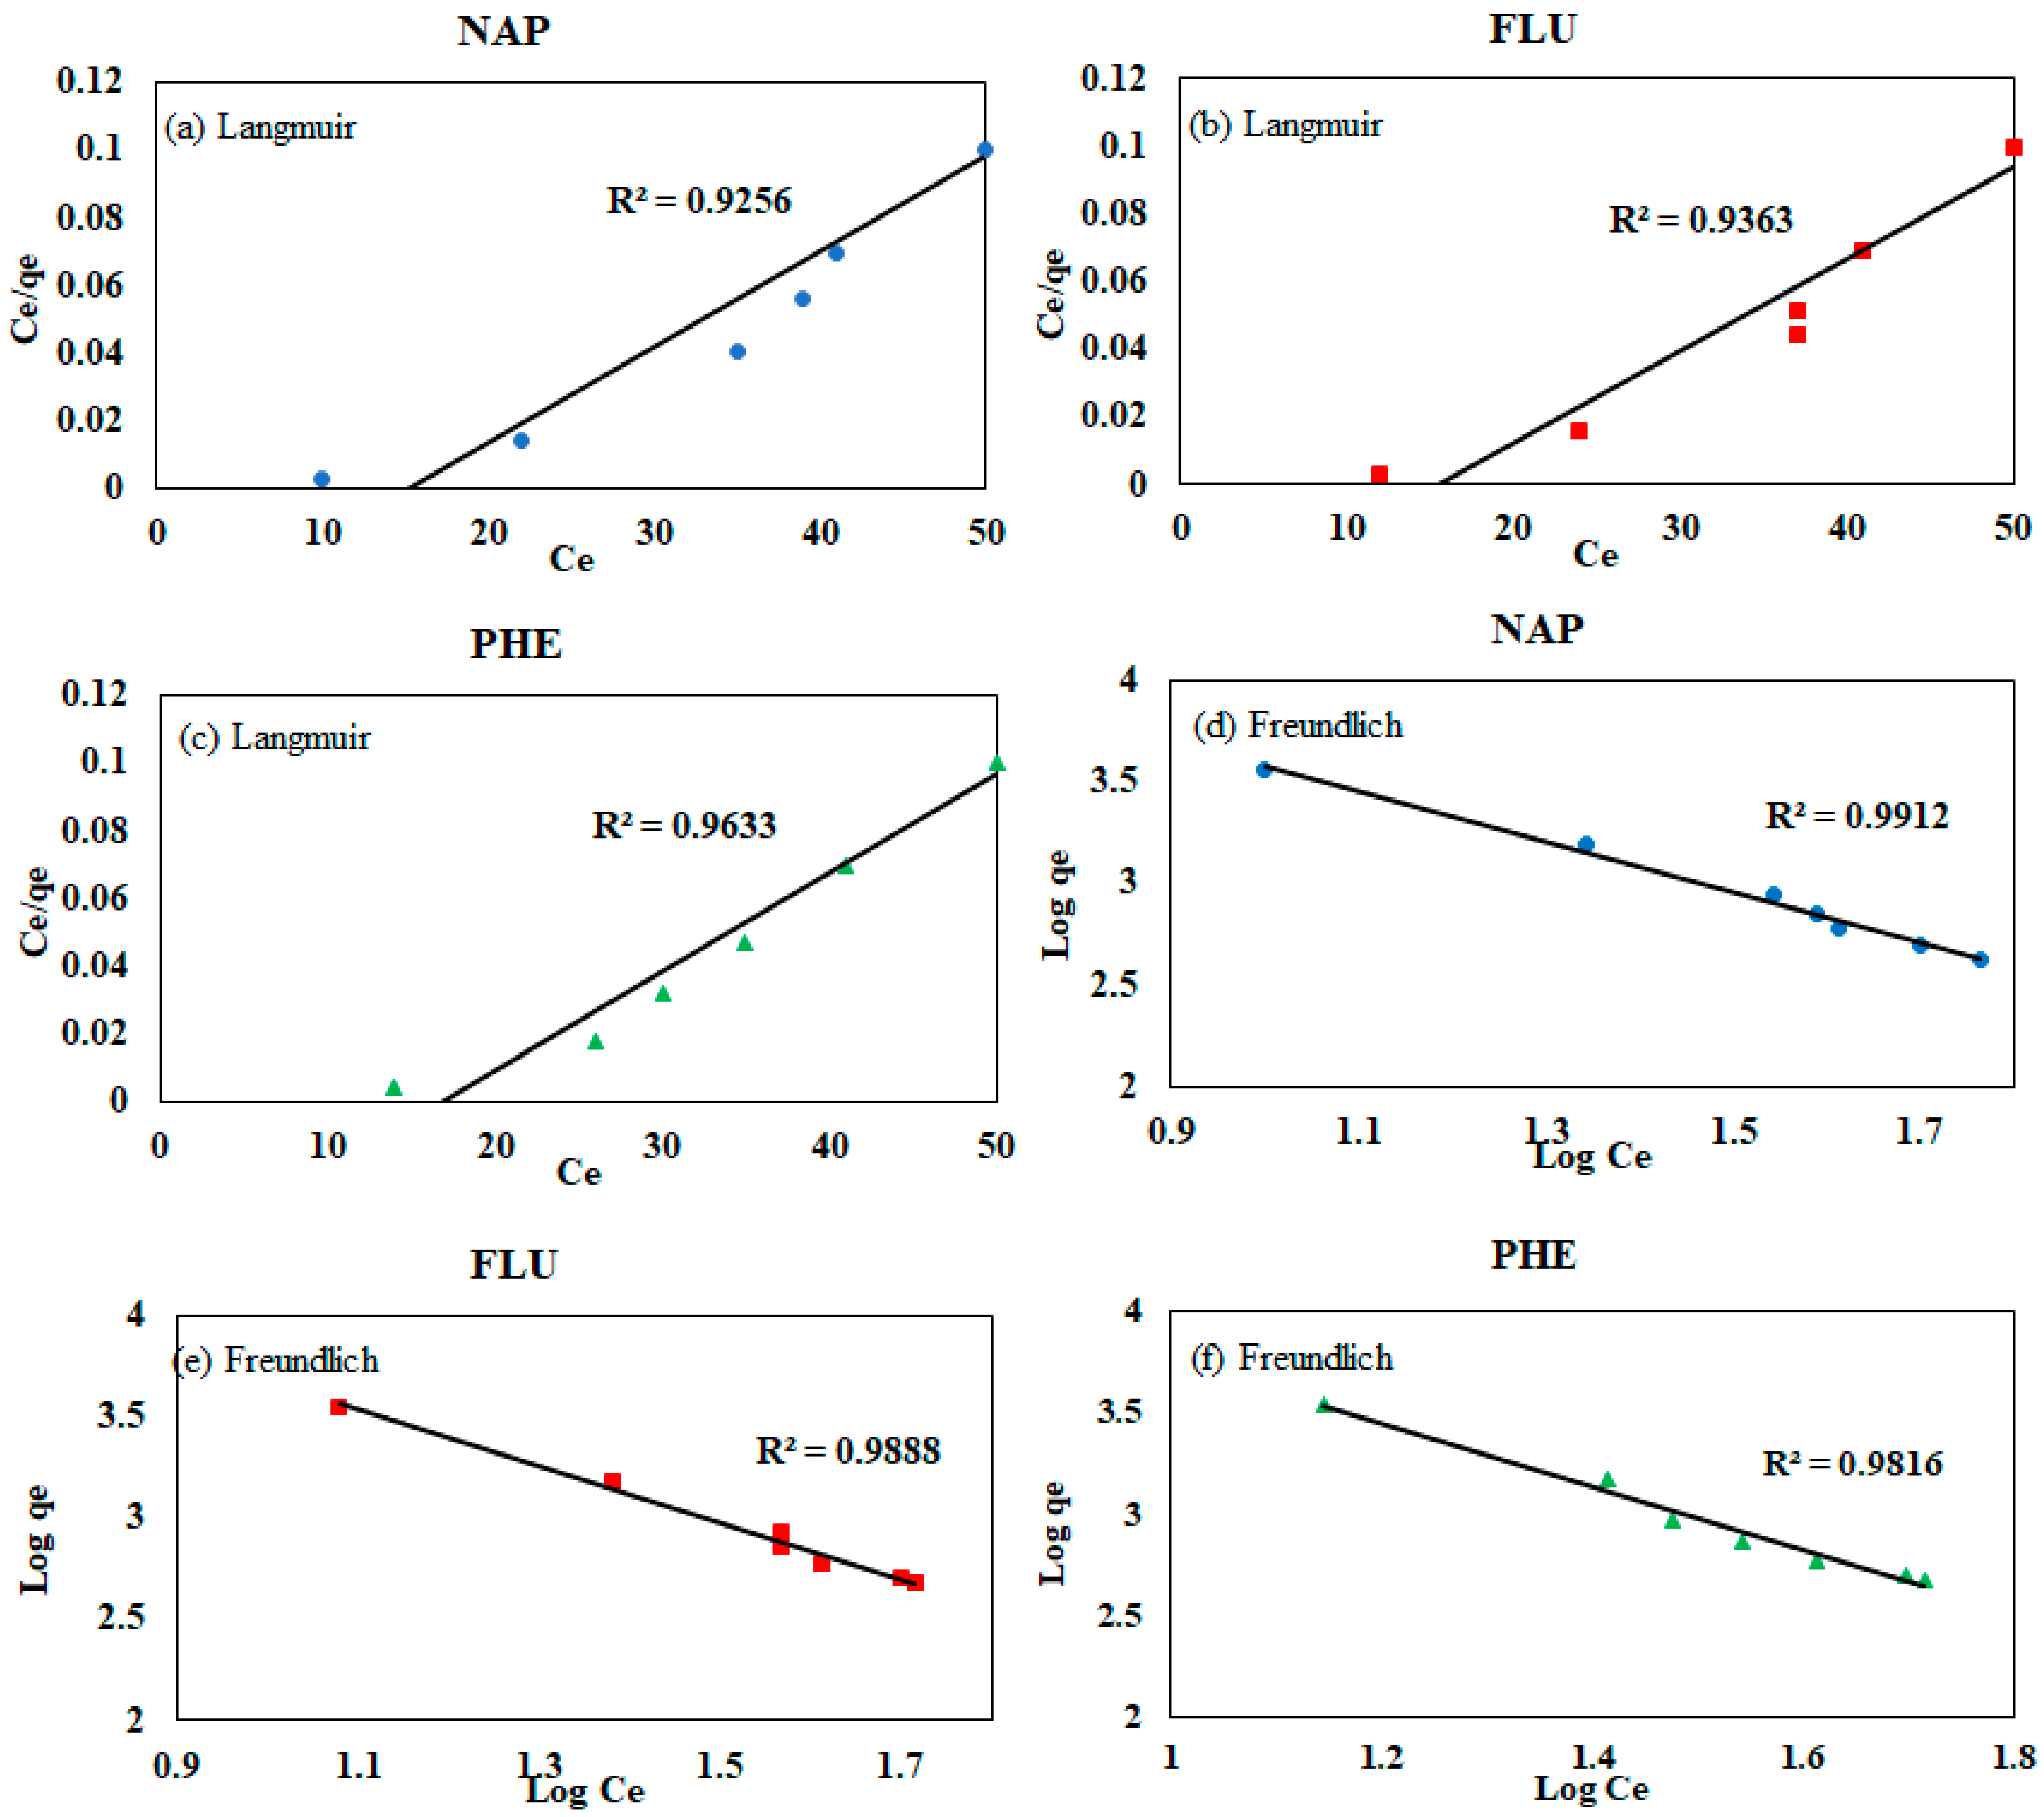
3.4. Langmuir and Freundlich Isotherm Models

Figure 5a–f represent the Langmuir and Freundlich isotherms for the removal of NAP, FLU and PHE onto N-OPLA-2.
Table 5 states the parameters of the isotherm models. The data revealed that the R2 values of the linear regression lines produced from the Langmuir isotherm model were 0.926, 0.936 and 0.963 for NAP, FLU and PHE, respectively. The R2 values of the Freundlich isotherm model were 0.991, 0.989 and 0.982 for NAP, FLU and PHE, respectively. The R2 values of Langmuir model were slightly lower than the R2 values of the Freundlich model; indicating that PAHs’ removal data followed the Freundlich model more favorably.
The data on removal were fitted to the Freundlich model, which gave rise to the hypothesis that the removal of NAP, FLU and PHE occurred on a heterogeneous surface and might involve a multilayer adsorption process [50]. The model indicated that NAP, FLU and PHE were bound to active sites with varying activation energies [51]. Similar conclusions have been reached by other researchers regarding PAHs removal from wastewater. [12]. As n > 1, it shows that the adsorption was favorable. Other studies have also reported that the Freundlich isotherm best describes the PAHs’ removal data [52]. The KF represents the adsorption capacity of the N-OPLAC-2. For FLU, the N-OPLAC-2 had the highest KF value.

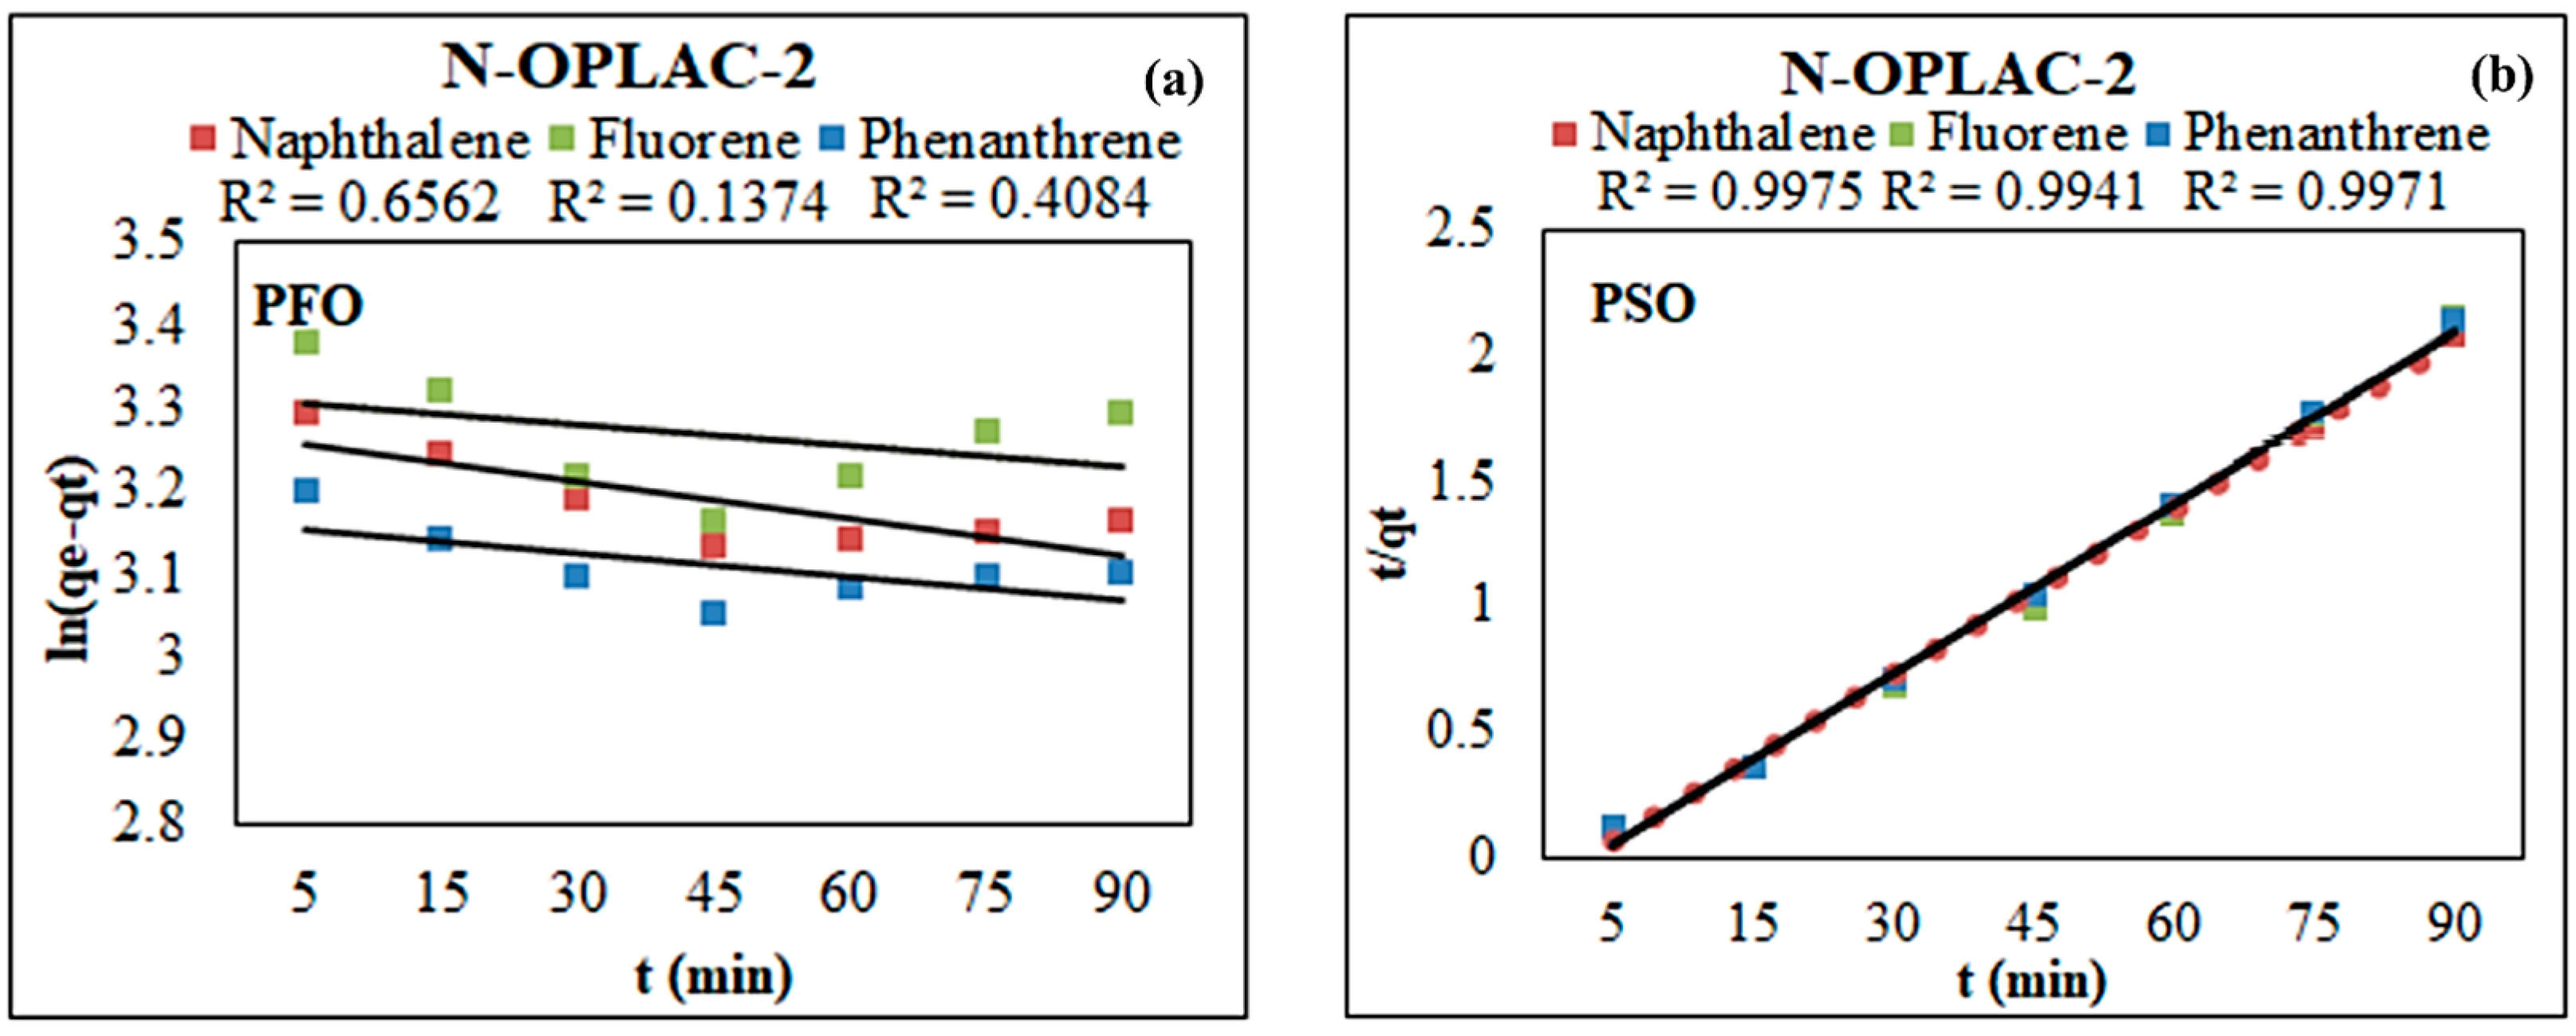
3.5. PFO and PSO Kinetic Models

Figure 6a,b represent the PFO and PSO models to study the removal behavior of NAP, FLU and PHE onto N-OPLAC-2 with the change in contact time.
The PFO model parameters qe, K1 and R2 are given in Table 5. As demonstrated in Table 5, the R2 values derived from the PSO kinetic model were greater than those derived from the PFO kinetic model. The experimental values of qe were also closer to the calculated values through PSO kinetic model, which confirmed the fitting of the PSO model to the adsorption data. The model suggested that chemical adsorption occurred via the formation of chemical bonds between the adsorbate and the adsorbents’ surface functional groups, and via the transfer of electrons between these two groups [53].

3.6. Proposed Mechanism of Removal

To investigate the removal mechanism and potential rate-limiting steps isotherm and kinetic models can be used. The experimental results showed that an acidic pH of 3, and the Freundlich isotherm and PSO kinetic models best fitted the PAHs’ removal data. At a lower pH, the N-OPLAC-2 surface could be positively polarized. Due to the electron donor–acceptor interaction or the interaction between N-OPLAC-2 and PAHs, the removal may be enhanced. As the removal data were found to be consistent with the PSO kinetic model and the Freundlich isotherm model, it was determined that the removal was primarily the result of electrostatic interaction and electron transfer between PAHs and the N-OPLAC-2 surface. Similar removal mechanisms have been reported in other studies [36]. Many reaction mechanisms such as adsorption, redox reactions, dehalogenation and precipitation could be involved in NAP, FLU and PHE removal by N-OPLAC-2 [42]. Figure 7 shows the following changes in FTIR spectra after removal of the PAHs: the 3424 cm−1 (-OH groups) peak shifted to 3419 cm−1, 1638 cm−1 (C=C stretching vibrations of alkenes) peak shifted to 1610 cm−1, 1089 cm−1 (C-O stretching vibrations of alcoholic compounds) peak shifted to 1100 cm−1 and 690 cm−1 (Fe-O-H) and 618 cm−1 (Fe-O) peaks became weak. All these changes showed the chemical adsorption of PAHs onto N-OPLAC-2 due to functional groups of OPLAC [54]. The Fe peaks shifting showed that Fe took part in the reduction in PAHs and formed new bonds with them.

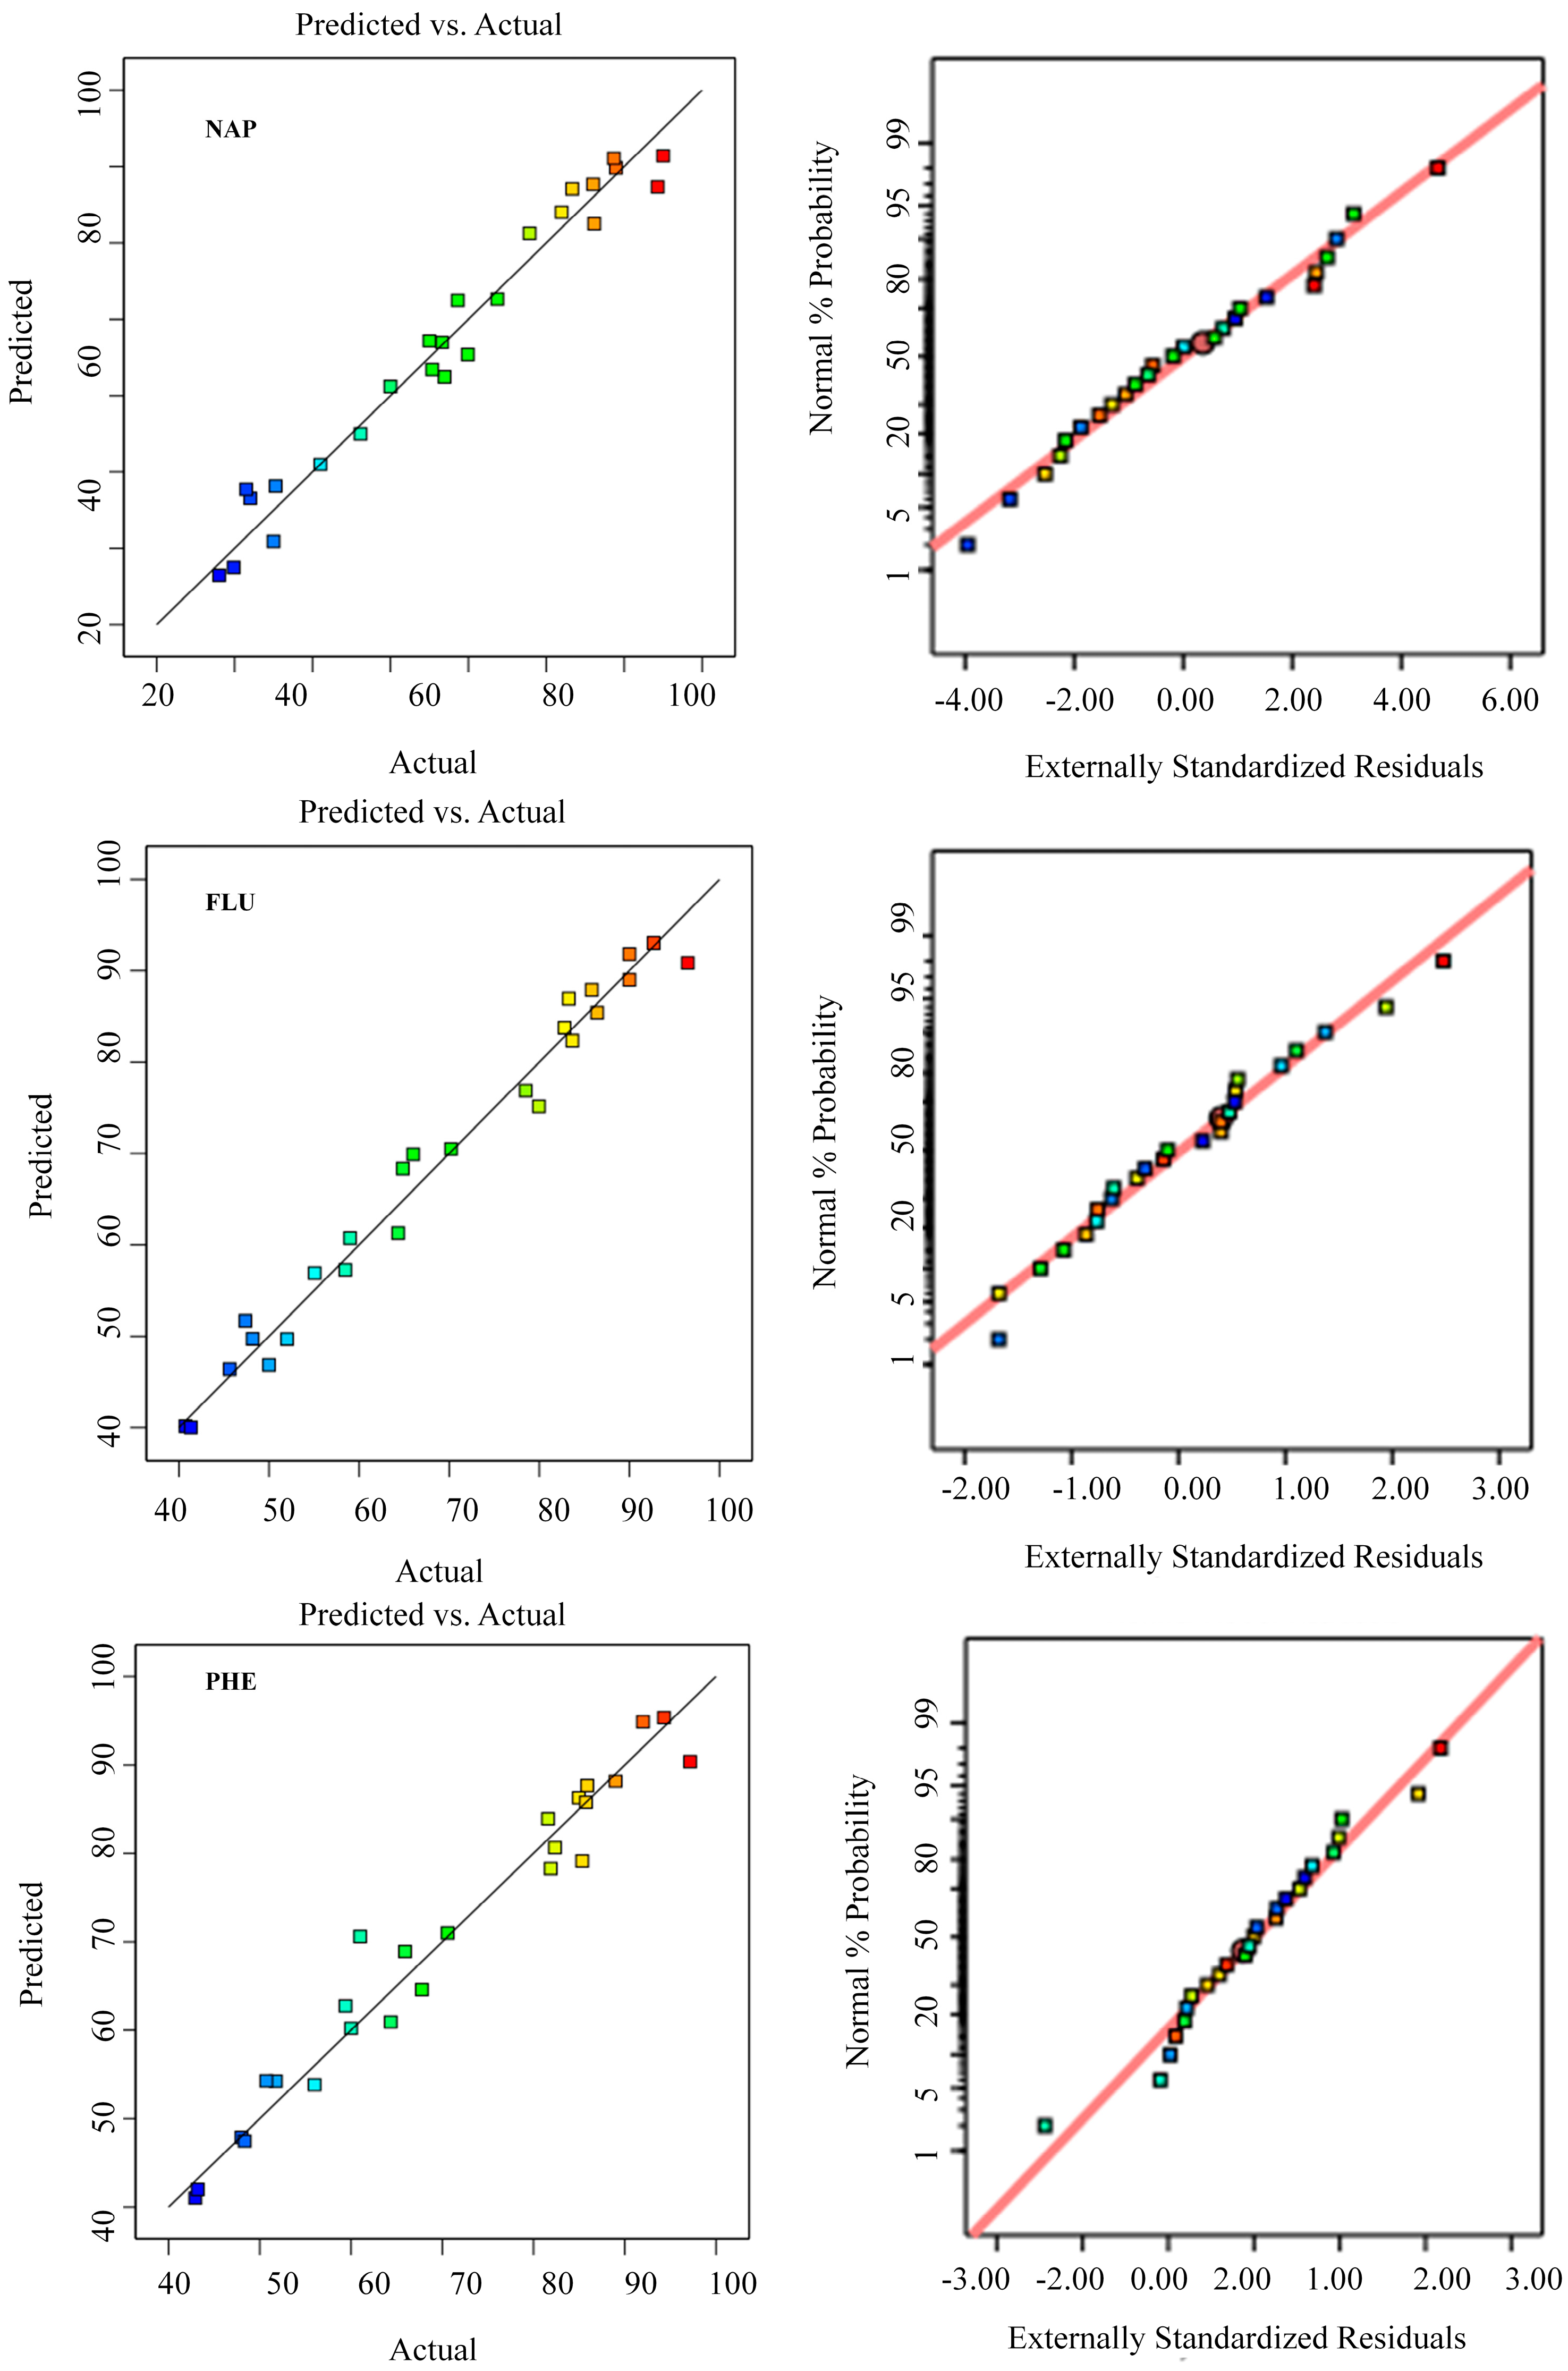
3.7. Modeling of RSM and Optimization of pH, Dosage and Contact Time

The removal efficiency of NAP, FLU and PHE was optimized considering three parameters i.e., pH, adsorbent dosage and contact time using the RSM in DOE software. Table 6 shows that all parameters, pH, dosage and contact time, significantly influenced the removal process. The model F-value of 20.35 implied that the model was significant for adsorption of NAP onto N-OPLAC-2. There is only a 0.01% chance that an F-value this large could occur due to noise. p-values less than 0.0500 indicated that model terms were significant. The predicted R2 of 0.7762 was in reasonable agreement with the Adjusted R2 of 0.9186; i.e., the difference was less than 0.2. The AP of 13.517 indicated an adequate signal. It shows that the model could be used to navigate the design space. The model F-value of 32.25 implies that the model was significant for removal of FLU onto N-OPLAC-2. There is only a 0.01% chance that an F-value this large could occur due to noise. p-values less than 0.0500 indicated that model terms were significant. The predicted R2 of 0.88 was in reasonable agreement with the adjusted R2 of 0.9480; i.e., the difference was less than 0.2. The AP of 16.741 indicated an adequate signal. It shows that the model could be used to navigate the design space. The model F-value of 17.40 implies that the model was significant for the removal of PHE onto N-OPLAC-2. There is only a 0.01% chance that an F-value this large could occur due to noise. p-values less than 0.0500 indicated that model terms were significant. The predicted R2 of 0.824 was in reasonable agreement with the adjusted R2 of 0.9054; i.e., the difference was less than 0.2. The AP of 13.150 indicated an adequate signal. It shows that the model could be used to navigate the design space.
The variation of the experimental and RSM model-predicted values of NAP, FLU and PHE removal are shown in Figure 8. It is quite clear that the experimental data are compatible with model-predicted data. The plots revealed a good match between actual and experimental values. Furthermore, as shown in Figure 8, the distribution of all data points was near to the 45° straight line. As illustrated in Figure 8, the assumption of normality was tested by plotting the normal percentage of probability against standardized residuals, which was shown to be sufficient for NAP, FLU and PHE removal efficiency. All of the data points in the residual’s graphs were roughly along the straight line, indicating a normal distribution.
The effect of independent factors and their interaction on the removal of NAP, FLU and PHE is depicted by 3D plots with different peak values and curves. In 3D plots, two independent variables were systematically varied while the other independent variables remained unchanged. Figure 9 indicates the effects of pH, dosage and contact time on NAP, FLU and PHE removal efficiency (%). Higher removal efficiencies of NAP, FLU and PHE are observed at pH of 3 and 9, higher dosage of N-OPLAC-2 and increasing contact time until 45 min. The results were consistent with the batch test results, that were already discussed in Section 3.3.
For numerical optimization of operating conditions for the present investigation, “in range” choices were used for independent variables, whilst “maximize” options were picked for PAHs’ elimination. Using N-OPLAC-2, numerical optimization indicated that the NAP, FLU, and PHE removal efficiencies were 92.5%, 97% and 97%, respectively. At the optimal values of all variables, including pH 3, dose of 122 mg/L and contact duration of 49 min, these removal efficiencies were predicted. Further tests were conducted using the recommended optimum values of independent parameters to validate the optimal conditions and the complete model. There was a minor difference between predicted and experimental results at the optimal conditions which verified the model validity as shown in Table 7.

3.8. Modeling of RSM and Optimization of pH, Dosage and Contact Time

The N-OPLAC-2 was utilized to extract NAP, FLU and PHE from the produced water (PW) sample containing NAP, FLU and PHE (200, 100 and 160 μg/L) to confirm the applicability of the suggested approach for real sample analysis. The PW sample was mixed with N-OPLAC-2 at optimized parameters viz., pH 3, dosage 122 mg/L for N-OPAC-2 and contact time 49 min. Table 8 shows the removal effectiveness of NAP, FLU and PHE from the PW sample. The removal efficiency of NAP, FLU and PHE from the PW sample were closer to the experimental results with a 4–5% error. The reduced removal may be due to presence of other pollutants in PW. As a result, these findings suggest that N-OPLAC-2 could be effectively used to remove NAP, FLU and PHE from PW.

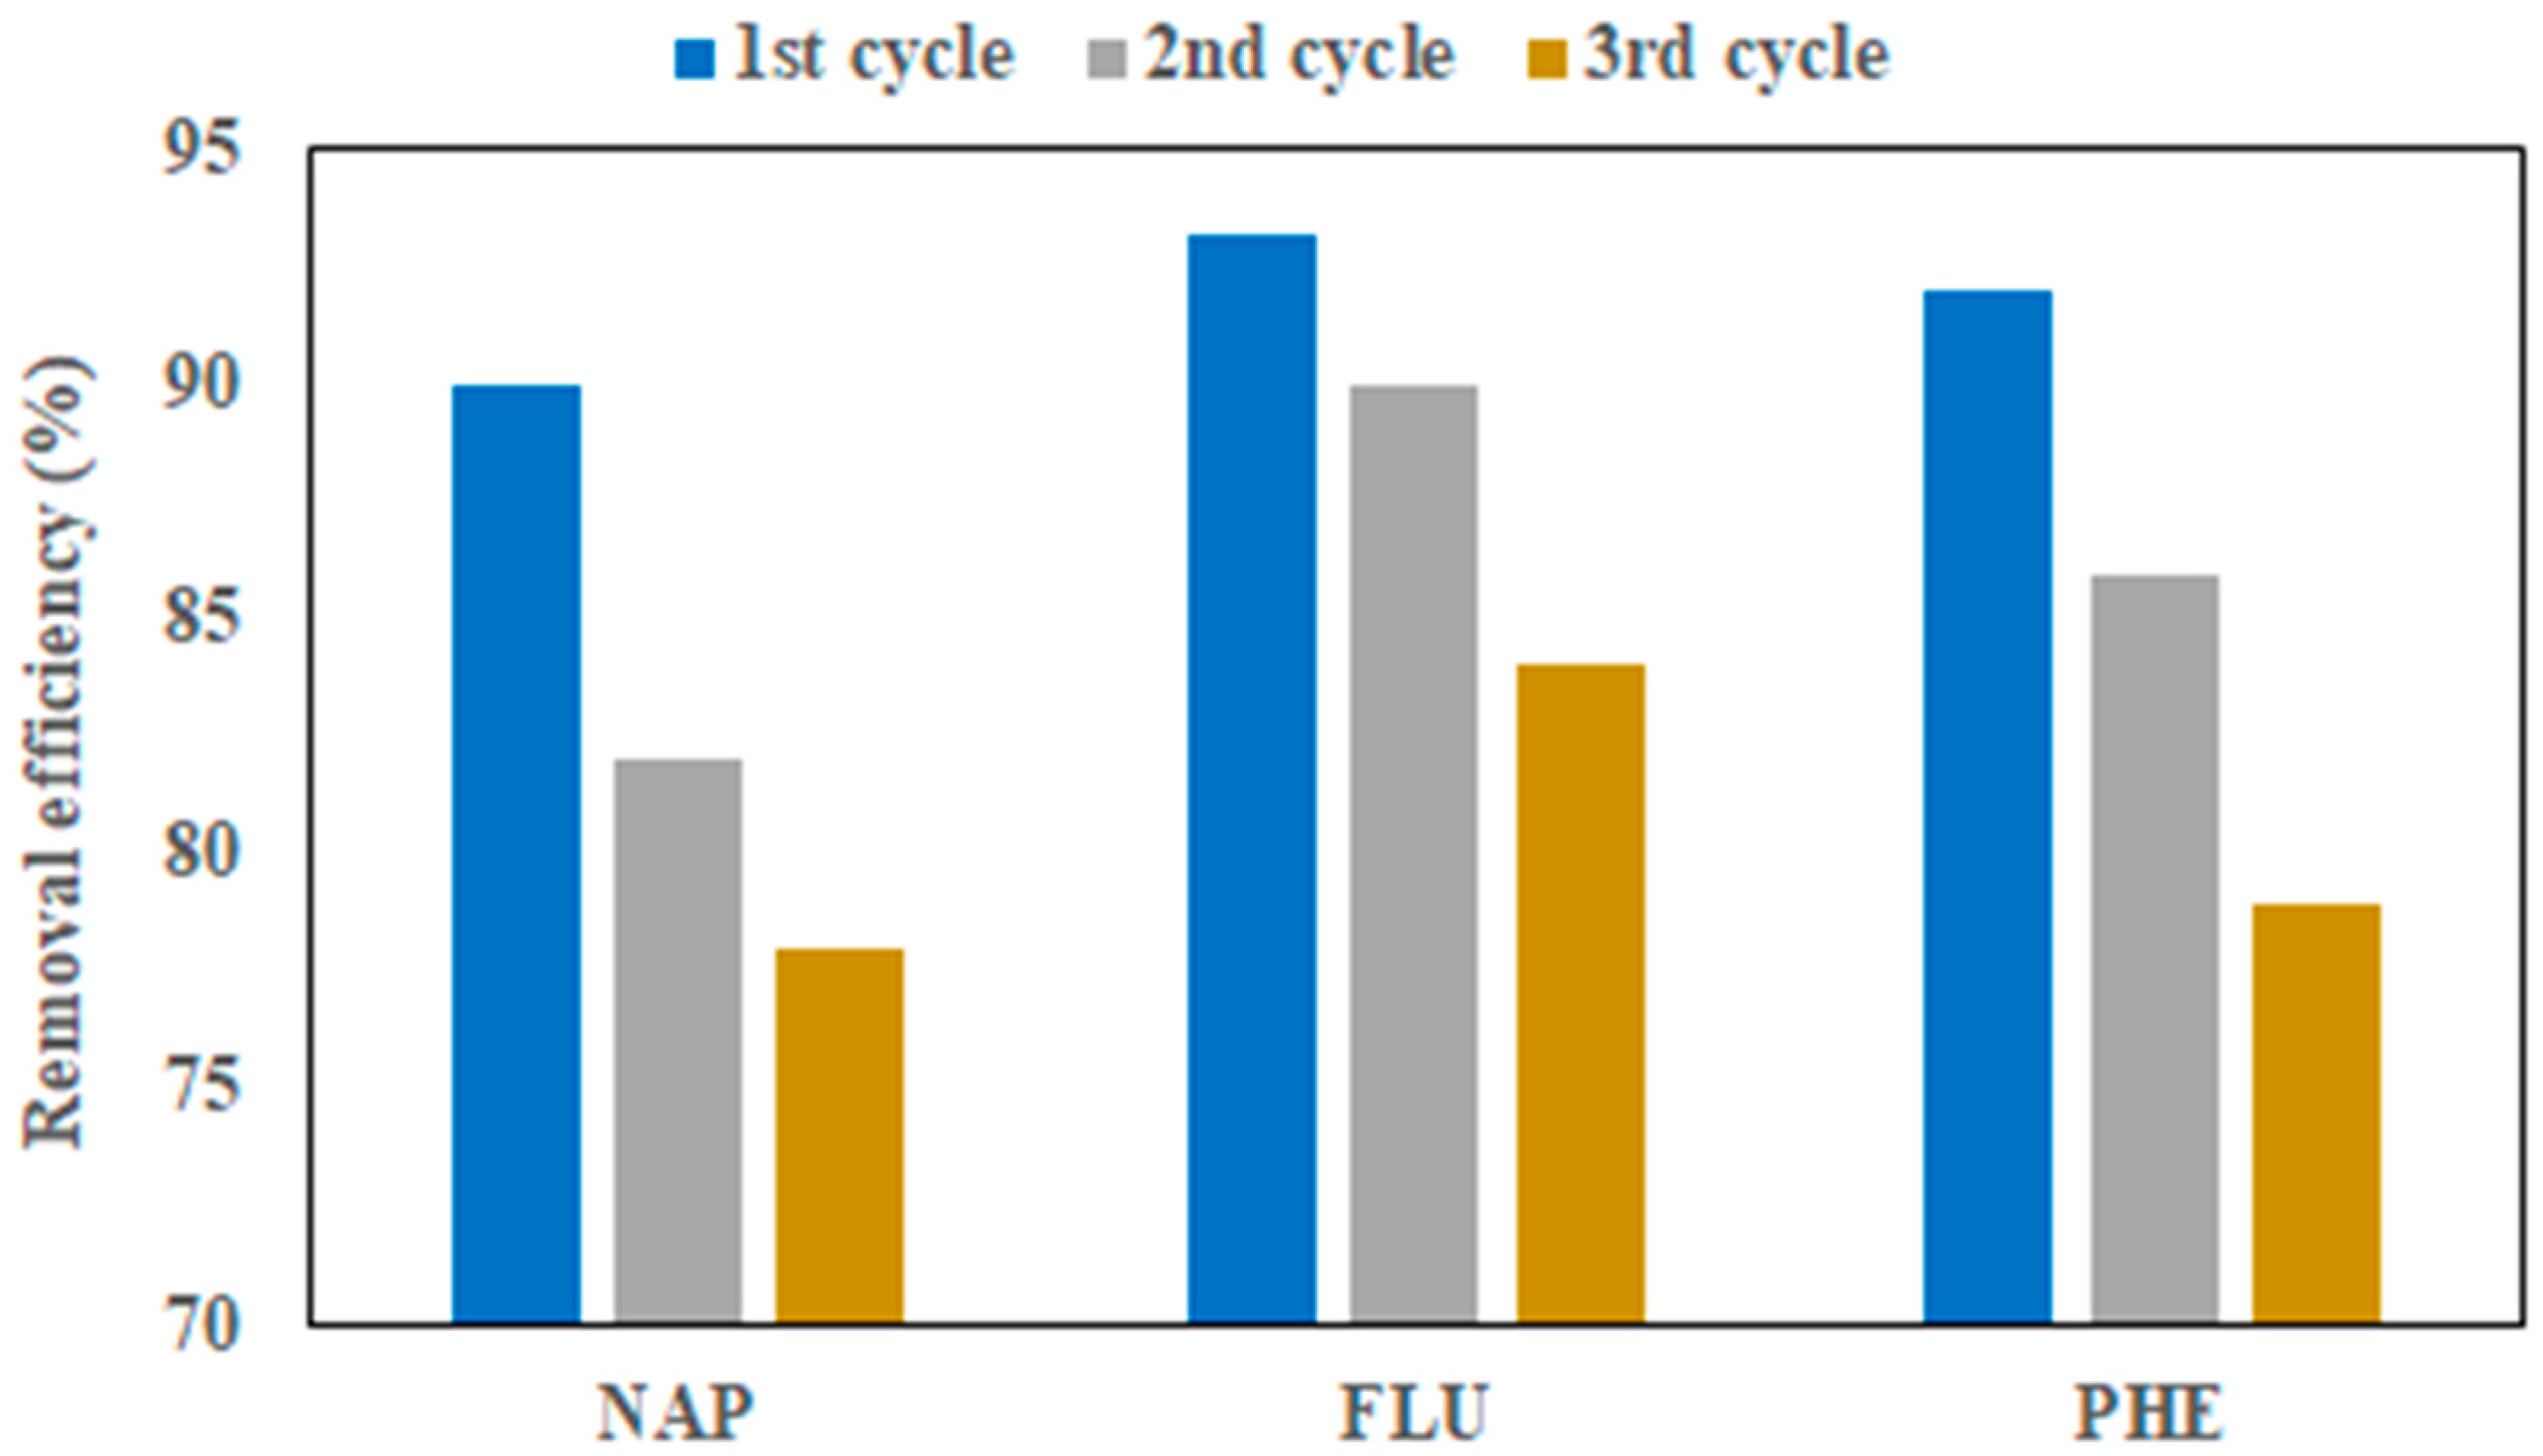
3.9. Regeneration and Reuse of N-OPLAC-2

The N-OPLAC-2 was regenerated after thermal treatment and reused up to three cycles for the NAP, FLU and PHE removal in PW shown in Figure 10. After three cycles, the NAP, FLU and PHE removal reduced to 78%, 84% and 79%, respectively, using N-OPLAC-2. Notably, even after three cycles, the removal efficiency barely decreased, indicating that N-OPLAC-2 could serve as a good reusable material. This is a valuable result which supports the rationale of sustainable material for removal of PAHs from wastewater.

4. Conclusions

The composite of OPLAC with NZVI at Fe: OPLAC = 1:2 (named as N-OPLAC-2) was successfully synthesized. The batch experimental results showed that acidic pH, lower concentrations of NAP, FLU and PHE and higher dosage of synthesized materials favored the NAP, FLU and PHE removal in synthetic wastewater. The adsorption isotherms at a materials’ dosage of 100, 500, 1000, 1500, 2000, 2500 and 3000 mg/L proved that the Freundlich isotherm model best explained the removal process. The kinetics at a contact time of 5, 15, 30, 45, 75 and 90 min proved that PSO kinetic model best fitted the removal data. The modeling results proved that the removal of PAHs was heterogenous, favorable and involved chemisorption and electrostatic interactions. The NAP, FLU and PHE removal efficiencies in synthetic wastewater were above 90% at RSM-based optimized parameters. The removal efficiency of NAP, FLU and PHE from the PW sample was closer to the experimental results with a 4–5% error at RSM-based optimized parameters. The N-OPLAC-2 had highest stability up to three cycles of application in PW at optimized parameters.
The study contributes well towards the removal of PAHs using locally available waste materials and nanomaterials. However, the study has a few limitations. The study did not investigate the secondary contamination caused by the BH4 reduction method to prepare NZVI. In addition, the used adsorbents were not investigated. It is recommended to further investigate the secondary contamination and used adsorbents for application at commercial scale. Real-world testing is necessary to determine the viability and efficacy of this study.

Supplementary Materials

The following supporting information can be downloaded at: https://www.mdpi.com/article/10.3390/w15050967/s1, Figure S1: Particle size distribution; Figure S2: Calibration Curves for NAP, FLU and PHE.; Figure S3: HPLC chromatogram before and after adsorption of NAP, FLU and PHE.

Author Contributions

Conceptualization, H.K. and M.R.U.M.; methodology, H.K.; software, H.K.; validation, H.K., M.R.U.M. and Z.K.; formal analysis, H.K.; investigation, H.K.; resources, M.R.U.M. and Z.K.; data curation, H.K.; writing—original draft preparation, H.K.; writing—review and editing, M.R.U.M. and Z.K.; supervision, M.R.U.M.; project administration, M.R.U.M.; funding acquisition, M.R.U.M. All authors have read and agreed to the published version of the manuscript.

Funding

This work was supported by Universiti Teknologi PETRONAS under YUTP, Malaysia grant with cost center 015LCO-190.

Data Availability Statement

Not applicable.

Acknowledgments

The authors acknowledge the financial support provided by the Universiti Teknologi PETRONAS under YUTP, Malaysia grant with cost center 015LCO-190. The authors would also like to acknowledge FELCRA Berhad Kawasan Nasaruddin Belia, Perak Malaysia, for providing oil palm leaves’ waste for this study.

Conflicts of Interest

The authors declare no conflict of interest.

References

  1. Lamichhane, S.; Bal Krishna, K.C.; Sarukkalige, R. Polycyclic Aromatic Hydrocarbons (PAHs) Removal by Sorption: A Review. Chemosphere 2016, 148, 336–353. [Google Scholar] [CrossRef] [PubMed]
  2. Zhang, C.; Lu, J.; Wu, J. Adsorptive Removal of Polycyclic Aromatic Hydrocarbons by Detritus of Green Tide Algae Deposited in Coastal Sediment. Sci. Total Environ. 2019, 670, 320–327. [Google Scholar] [CrossRef] [PubMed]
  3. Wang, Z.; Li, J.; Hesham, A.E.L.; He, S.; Zhang, Y.; Wang, Z.; Yang, M. Co-Variations of Bacterial Composition and Catabolic Genes Related to PAH Degradation in a Produced Water Treatment System Consisting of Successive Anoxic and Aerobic Units. Sci. Total Environ. 2007, 373, 356–362. [Google Scholar] [CrossRef] [PubMed]
  4. Ghosh, P.; Mukherji, S. Degradation of Carbazole, Fluorene, Dibenzothiophene and Their Mixture by P. aeruginosa RS1 in Petroleum Refinery Wastewater. J. Water Process Eng. 2020, 37, 101454. [Google Scholar] [CrossRef]
  5. Wei, Z.; Ma, X.; Zhang, Y.; Guo, Y.; Wang, W.; Jiang, Z.Y. High-Efficiency Adsorption of Phenanthrene by Fe3O4-SiO2-Dimethoxydiphenylsilane Nanocomposite: Experimental and Theoretical Study. J. Hazard. Mater. 2022, 422, 126948. [Google Scholar] [CrossRef]
  6. Jiménez, S.; Micó, M.M.; Arnaldos, M.; Medina, F.; Contreras, S. State of the Art of Produced Water Treatment. Chemosphere 2018, 192, 186–208. [Google Scholar] [CrossRef]
  7. Fakhru’l-Razi, A.; Pendashteh, A.; Abdullah, L.C.; Biak, D.R.A.; Madaeni, S.S.; Abidin, Z.Z. Review of Technologies for Oil and Gas Produced Water Treatment. J. Hazard. Mater. 2009, 170, 530–551. [Google Scholar] [CrossRef]
  8. Kusworo, T.D.; Aryanti, N.; Qudratun; Utomo, D.P. Oilfield Produced Water Treatment to Clean Water Using Integrated Activated Carbon-Bentonite Adsorbent and Double Stages Membrane Process. Chem. Eng. J. 2018, 347, 462–471. [Google Scholar] [CrossRef]
  9. Ali, I.; Asim, M.; Khan, T.A. Low Cost Adsorbents for the Removal of Organic Pollutants from Wastewater. J. Environ. Manag. 2012, 113, 170–183. [Google Scholar] [CrossRef]
  10. Kumar, J.A.; Kumar, P.S.; Krithiga, T.; Prabu, D.; Amarnath, D.J.; Sathish, S.; Venkatesan, D.; Hosseini-Bandegharaei, A.; Prashant, P. Acenaphthene Adsorption onto Ultrasonic Assisted Fatty Acid Mediated Porous Activated Carbon-Characterization, Isotherm and Kinetic Studies. Chemosphere 2021, 284, 131249. [Google Scholar] [CrossRef]
  11. Oleszczuk, P.; Koltowski, M. Effect of Co-Application of Nano-Zero Valent Iron and Biochar on the Total and Freely Dissolved Polycyclic Aromatic Hydrocarbons Removal and Toxicity of Contaminated Soils. Chemosphere 2017, 168, 1467–1476. [Google Scholar] [CrossRef] [PubMed]
  12. Huang, Y.; Fulton, A.N.; Keller, A.A. Simultaneous Removal of PAHs and Metal Contaminants from Water Using Magnetic Nanoparticle Adsorbents. Sci. Total Environ. 2016, 571, 1029–1036. [Google Scholar] [CrossRef] [PubMed] [Green Version]
  13. Shi, J.; Wang, J.; Wang, W.; Teng, W.; Zhang, W. xian Stabilization of Nanoscale Zero-Valent Iron in Water with Mesoporous Carbon (NZVI@MC). J. Environ. Sci. 2019, 81, 28–33. [Google Scholar] [CrossRef] [PubMed]
  14. Jung, C.; Son, A.; Her, N.; Zoh, K.D.; Cho, J.; Yoon, Y. Removal of Endocrine Disrupting Compounds, Pharmaceuticals, and Personal Care Products in Water Using Carbon Nanotubes: A Review. J. Ind. Eng. Chem. 2015, 27, 1–11. [Google Scholar] [CrossRef]
  15. Salman, J.M.; Njoku, V.O.; Hameed, B.H. Adsorption of Pesticides from Aqueous Solution onto Banana Stalk Activated Carbon. Chem. Eng. J. 2011, 174, 41–48. [Google Scholar] [CrossRef]
  16. Ayranci, E.; Hoda, N. Adsorption Kinetics and Isotherms of Pesticides onto Activated Carbon-Cloth. Chemosphere 2005, 60, 1600–1607. [Google Scholar] [CrossRef]
  17. Nkansah, M.A.; Christy, A.A.; Barth, T.; Francis, G.W. The Use of Lightweight Expanded Clay Aggregate (LECA) as Sorbent for PAHs Removal from Water. J. Hazard. Mater. 2012, 217‘, 360–365. [Google Scholar] [CrossRef] [Green Version]
  18. Wang, H.; Cui, H.; Song, X.; Xu, R.; Wei, N.; Tian, J.; Niu, H. Facile Synthesis of Heterojunction of MXenes/TiO2 Nanoparticles towards Enhanced Hexavalent Chromium Removal. J. Colloid Interface Sci. 2020, 561, 46–57. [Google Scholar] [CrossRef]
  19. He, X.; Wu, Z.; Sun, Z.; Wei, X.; Wu, Z.; Ge, X.; Cravotto, G. A Novel Hybrid of β-Cyclodextrin Grafted onto Activated Carbon for Rapid Adsorption of Naphthalene from Aqueous Solution. J. Mol. Liq. 2018, 255, 160–167. [Google Scholar] [CrossRef]
  20. Liang, L.; Li, X.; Guo, Y.; Lin, Z.; Su, X.; Liu, B. The Removal of Heavy Metal Cations by Sulfidated Nanoscale Zero-Valent Iron (S-NZVI): The Reaction Mechanisms and the Role of Sulfur. J. Hazard. Mater. 2021, 404, 124057. [Google Scholar] [CrossRef]
  21. Wang, S.; Zhao, M.; Zhou, M.; Li, Y.C.; Wang, J.; Gao, B.; Sato, S.; Feng, K.; Yin, W.; Igalavithana, A.D.; et al. Biochar-Supported NZVI (NZVI/BC) for Contaminant Removal from Soil and Water: A Critical Review. J. Hazard. Mater. 2019, 373, 820–834. [Google Scholar] [CrossRef] [PubMed]
  22. Gallo-Cordova, A.; Silva-Gordillo, M.D.M.; Muñoz, G.A.; Arboleda-Faini, X.; Almeida Streitwieser, D. Comparison of the Adsorption Capacity of Organic Compounds Present in Produced Water with Commercially Obtained Walnut Shell and Residual Biomass. J. Environ. Chem. Eng. 2017, 5, 4041–4050. [Google Scholar] [CrossRef]
  23. Khurshid, H.; Mustafa, M.R.U.; Isa, M.H. Modified Activated Carbon Synthesized from Oil Palm Leaves Waste as a Novel Green Adsorbent for Chemical Oxygen Demand in Produced Water. Sustainability 2022, 14, 1986. [Google Scholar] [CrossRef]
  24. Salman, J.M.; Njoku, V.O.; Hameed, B.H. Batch and Fixed-Bed Adsorption of 2,4-Dichlorophenoxyacetic Acid onto Oil Palm Frond Activated Carbon. Chem. Eng. J. 2011, 174, 33–40. [Google Scholar] [CrossRef]
  25. Soliman, A.M.; Elwy, H.M.; Thiemann, T.; Majedi, Y.; Labata, F.T.; Al-Rawashdeh, N.A.F. Removal of Pb(II) Ions from Aqueous Solutions by Sulphuric Acid-Treated Palm Tree Leaves. J. Taiwan Inst. Chem. Eng. 2016, 58, 264–273. [Google Scholar] [CrossRef]
  26. Fathy, M.; El-Sayed, M.; Ramzi, M.; Abdelraheem, O.H. Adsorption Separation of Condensate Oil from Produced Water Using ACTF Prepared of Oil Palm Leaves by Batch and Fixed Bed Techniques. Egypt. J. Pet. 2018, 27, 319–326. [Google Scholar] [CrossRef]
  27. Eid, M.E.-S. Synthesis of Polyethylenimine-Magnetic Amorphous Carbon Nano Composite as a Novel Adsorbent for Hg (II) from Aqueous Solutions. Aust. J. BASIC Appl. Sci. 2016, 10, 323–335. [Google Scholar]
  28. Hedayati, M.S.; Abida, O.; Li, L.Y. Adsorption of Polycyclic Aromatic Hydrocarbons by Surfactant-Modified Clinoptilolites for Landfill Leachate Treatment. Waste Manag. 2021, 131, 503–512. [Google Scholar] [CrossRef]
  29. Tsai, J.C.; Kumar, M.; Lin, J.G. Anaerobic Biotransformation of Fluorene and Phenanthrene by Sulfate-Reducing Bacteria and Identification of Biotransformation Pathway. J. Hazard. Mater. 2009, 164, 847–855. [Google Scholar] [CrossRef]
  30. Danila, V.; Vasarevicius, S.; Valskys, V. Batch Removal of Cd(II), Cu(II), Ni(II), and Pb(II) Ions Using Stabilized Zero-Valent Iron Nanoparticles. Energy Procedia 2018, 147, 214–219. [Google Scholar] [CrossRef]
  31. Khurshid, H.; Mustafa, M.R.U.; Rashid, U.; Isa, M.H.; Chia, H.Y.; Shah, M.M. Adsorptive Removal of COD from Produced Water Using Tea Waste Biochar. Environ. Technol. Innov. 2021, 23, 101563. [Google Scholar] [CrossRef]
  32. Asadpour, R.; Sapari, N.B.; Isa, M.H.; Orji, K.U. Enhancing the Hydrophobicity of Mangrove Bark by Esterification for Oil Adsorption. Water Sci. Technol. 2014, 70, 1220–1228. [Google Scholar] [CrossRef] [PubMed]
  33. Zhou, Y.; Zhang, L.; Cheng, Z. Removal of Organic Pollutants from Aqueous Solution Using Agricultural Wastes: A Review. J. Mol. Liq. 2015, 212, 739–762. [Google Scholar] [CrossRef]
  34. Ghaedi, M.; Azad, F.N.; Dashtian, K.; Hajati, S.; Goudarzi, A.; Soylak, M. Central Composite Design and Genetic Algorithm Applied for the Optimization of Ultrasonic-Assisted Removal of Malachite Green by ZnO Nanorod-Loaded Activated Carbon. Spectrochim. Acta—Part A Mol. Biomol. Spectrosc. 2016, 167, 157–164. [Google Scholar] [CrossRef] [PubMed]
  35. Meng, X.; Zhang, C.; Zhuang, J.; Zheng, G.; Zhou, L. Assessment of Schwertmannite, Jarosite and Goethite as Adsorbents for Efficient Adsorption of Phenanthrene in Water and the Regeneration of Spent Adsorbents by Heterogeneous Fenton-like Reaction. Chemosphere 2020, 244, 125523. [Google Scholar] [CrossRef] [PubMed]
  36. Wang, X.; Guo, Z.; Hu, Z.; Ngo, H.H.; Liang, S.; Zhang, J. Adsorption of Phenanthrene from Aqueous Solutions by Biochar Derived from an Ammoniation-Hydrothermal Method. Sci. Total Environ. 2020, 733, 139267. [Google Scholar] [CrossRef] [PubMed]
  37. De Jesus, J.H.F.; Cunha, G.D.C.; Cardoso, E.M.C.; Mangrich, A.S.; Romão, L.P.C. Evaluation of Waste Biomasses and Their Biochars for Removal of Polycyclic Aromatic Hydrocarbons. J. Environ. Manag. 2017, 200, 186–195. [Google Scholar] [CrossRef]
  38. Haneef, T.; Ul Mustafa, M.R.; Yusof, K.W.; Isa, M.H.; Bashir, M.J.K.; Ahmad, M.; Zafar, M. Removal of Polycyclic Aromatic Hydrocarbons (PAHs) from Produced Water by Ferrate (VI) Oxidation. Water 2020, 12, 3132. [Google Scholar] [CrossRef]
  39. Wang, S.; Zhou, Y.; Gao, B.; Wang, X.; Yin, X.; Feng, K.; Wang, J. The Sorptive and Reductive Capacities of Biochar Supported Nanoscaled Zero-Valent Iron (NZVI) in Relation to Its Crystallite Size. Chemosphere 2017, 186, 495–500. [Google Scholar] [CrossRef]
  40. Liu, D.; Wu, Z.; Ge, X.; Cravotto, G.; Wu, Z.; Yan, Y. Comparative Study of Naphthalene Adsorption on Activated Carbon Prepared by Microwave-Assisted Synthesis from Different Typical Coals in Xinjiang. J. Taiwan Inst. Chem. Eng. 2016, 59, 563–568. [Google Scholar] [CrossRef]
  41. Belhamdi, B.; Merzougui, Z.; Trari, M.; Addoun, A. A Kinetic, Equilibrium and Thermodynamic Study of L-Phenylalanine Adsorption Using Activated Carbon Based on Agricultural Waste (Date Stones). J. Appl. Res. Technol. 2016, 14, 354–366. [Google Scholar] [CrossRef] [Green Version]
  42. Wang, W.; Wang, J.; Guo, Y.; Zhu, C.; Pan, F.; Wu, R.; Wang, C. Removal of Multiple Nitrosamines from Aqueous Solution by Nanoscale Zero-Valent Iron Supported on Granular Activated Carbon: Influencing Factors and Reaction Mechanism. Sci. Total Environ. 2018, 639, 934–943. [Google Scholar] [CrossRef] [PubMed]
  43. Su, H.; Fang, Z.; Tsang, P.E.; Fang, J.; Zhao, D. Stabilisation of Nanoscale Zero-Valent Iron with Biochar for Enhanced Transport and in-Situ Remediation of Hexavalent Chromium in Soil. Environ. Pollut. 2016, 214, 94–100. [Google Scholar] [CrossRef] [PubMed]
  44. Li, H.; Chen, S.; Ren, L.Y.; Zhou, L.Y.; Tan, X.J.; Zhu, Y.; Belver, C.; Bedia, J.; Yang, J. Biochar Mediates Activation of Aged Nanoscale ZVI by Shewanella Putrefaciens CN32 to Enhance the Degradation of Pentachlorophenol. Chem. Eng. J. 2019, 368, 148–156. [Google Scholar] [CrossRef]
  45. Hussin, M.H.; Pohan, N.A.; Garba, Z.N.; Kassim, M.J.; Rahim, A.A.; Brosse, N.; Yemloul, M.; Fazita, M.R.N.; Haafiz, M.K.M. Physicochemical of Microcrystalline Cellulose from Oil Palm Fronds as Potential Methylene Blue Adsorbents. Int. J. Biol. Macromol. 2016, 92, 11–19. [Google Scholar] [CrossRef]
  46. Mines, P.D.; Uthuppu, B.; Thirion, D.; Jakobsen, M.H.; Yavuz, C.T.; Andersen, H.R.; Hwang, Y. Granular Activated Carbon with Grafted Nanoporous Polymer Enhances Nanoscale Zero-Valent Iron Impregnation and Water Contaminant Removal. Chem. Eng. J. 2018, 339, 22–31. [Google Scholar] [CrossRef] [Green Version]
  47. Wei, A.; Ma, J.; Chen, J.; Zhang, Y.; Song, J.; Yu, X. Enhanced Nitrate Removal and High Selectivity towards Dinitrogen for Groundwater Remediation Using Biochar-Supported Nano Zero-Valent Iron. Chem. Eng. J. 2018, 353, 595–605. [Google Scholar] [CrossRef]
  48. Hu, Y.; He, Y.; Wang, X.; Wei, C. Efficient Adsorption of Phenanthrene by Simply Synthesized Hydrophobic MCM-41 Molecular Sieves. Appl. Surf. Sci. 2014, 311, 825–830. [Google Scholar] [CrossRef]
  49. Li, J.; Zhou, Q.; Liu, Y.; Lei, M. Recyclable Nanoscale Zero-Valent Iron-Based Magnetic Polydopamine Coated Nanomaterials for the Adsorption and Removal of Phenanthrene and Anthracene. Sci. Technol. Adv. Mater. 2017, 18, 3–16. [Google Scholar] [CrossRef] [Green Version]
  50. Santoso, E.; Ediati, R.; Kusumawati, Y.; Bahruji, H.; Sulistiono, D.O.; Prasetyoko, D. Review on Recent Advances of Carbon Based Adsorbent for Methylene Blue Removal from Waste Water. Mater. Today Chem. 2020, 16, 100233. [Google Scholar] [CrossRef]
  51. Hendges, L.T.; Costa, T.C.; Temochko, B.; Gómez González, S.Y.; Mazur, L.P.; Marinho, B.A.; da Silva, A.; Weschenfelder, S.E.; de Souza, A.A.U.; de Souza, S.M.A.G.U. Adsorption and Desorption of Water-Soluble Naphthenic Acid in Simulated Offshore Oilfield Produced Water. Process Saf. Environ. Prot. 2021, 145, 262–272. [Google Scholar] [CrossRef]
  52. Huang, W.; Peng, P.; Yu, Z.; Fu, J. Effects of Organic Matter Heterogeneity on Sorption and Desorption of Organic Contaminants by Soils and Sediments. Appl. Geochem. 2003, 18, 955–972. [Google Scholar] [CrossRef]
  53. Pinto Brito, M.J.; Flores Santos, M.P.; De Souza, E.C., Jr.; Santos, L.S.; Ferreira Bonomo, R.C.; Da Costa Ilhéu Fontan, R.; Veloso, C.M. Development of Activated Carbon from Pupunha Palm Heart Sheaths: Effect of Synthesis Conditions and Its Application in Lipase Immobilization. J. Environ. Chem. Eng. 2020, 8, 104391. [Google Scholar] [CrossRef]
  54. Aravind Kumar, J.; Krithiga, T.; Vijai Anand, K.; Sathish, S.; Karthick Raja Namasivayam, S.; Renita, A.A.; Hosseini-Bandegharaei, A.; Praveenkumar, T.R.; Rajasimman, M.; Bhat, N.S.; et al. Kinetics and Regression Analysis of Phenanthrene Adsorption on the Nanocomposite of CaO and Activated Carbon: Characterization, Regeneration, and Mechanistic Approach. J. Mol. Liq. 2021, 334, 116080. [Google Scholar] [CrossRef]
Figure 1. Process of N-OPLAC synthesis.
Water 15 00967 g001
Figure 2. (a) FTIR and (b) XRD pattern of OPLAC, NZVI, N-OPLAC-1 and N-OPLAC-2.
Water 15 00967 g002
Figure 3. SEM images of (a) OPLAC, (b) NZVI (c) N-OPLAC-2 and (d) XPS spectra of Fe2p of N-OPLAC-2.
Water 15 00967 g003
Figure 4. Effect of parameters on percentage removal of NAP, FLU and PHE by N-OPLAC-2, (a) initial pH of the synthetic wastewater, (b) N-OPLAC-2 dosage, (c) contact time and (d) initial concentration of NAP, FLU and PHE.
Water 15 00967 g004
Figure 5. (ac) Langmuir and (df) Freundlich isotherm models for removal of NAP, FLU and PHE.
Water 15 00967 g005
Figure 6. (a) PFO and (b) PSO kinetic models for removal of NAP, FLU and PHE.
Water 15 00967 g006
Figure 7. FTIR before and after removal of NAP, FLU and PHE onto N-OPLAC-2.
Water 15 00967 g007
Figure 8. Predicted vs. actual removal (%) and normal plots of residuals for N-OPLAC-2.
Water 15 00967 g008
Figure 9. Impact of pH, N-OPLAC-2 dosage and contact time on removal percentage of NAP, FLU and PHE.
Water 15 00967 g009
Figure 10. Regeneration and reuse efficiency of spent N-OPLAC-2.
Water 15 00967 g010
Table 1. Experimental runs and outputs.
RunpHDosageContact TimeNAPFLUPHE
(mg/L)(min)(%)(%)(%)
1610047.566.664.865.9
26300047.573.779.985.3
3330009088.792.794.3
493000586.286.485.8
5615505605960
69155047.569.970.270.6
79100583.383.782.4
86155047.5656661
993000545.348.251.8
1091009039.941.343.2
11615509065.464.364.3
129300090515256
1331005455048
1433000556.258.567.8
15330009066.955.159.4
16330005869092
173155047.568.678.581.9
18310090959089
196155047.594.396.597.2
203100588.985.884.9
21910053840.742.9
226155047.541.547.450.7
233100904245.648.3
24930009077.983.385.9
2591009081.982.881.6
Table 2. Physiochemical properties of PAHs.
PAHsMolecular
Formula
Molecular
Weight
Solubility in Water
at 25 °C
(mg/L)
NAPC10H8128.231.02
FLUC13H10116.21.90
PHEC14H10178.21.18
Table 3. Physical properties of adsorbent materials.
MaterialBET Surface Area
(m2/g)
Total Pore Volume
(cm3/g)
Average Pore Size
(nm)
Yield
(%)
OPLAC331.1530.2062.546
NZVI29.24--65
N-OPLAC-1243.3870.2153.5350
N-OPLAC-2258.3870.3253.6460
Table 4. Elemental composition of OPLAC, NZVI and N-OPLAC-2 obtained through EDX mapping.
MaterialCOZnSiCaFe
OPLAC81.29.644.21.1-
NZVI6.817.26---77.5
N-OPLAC-245.1030.223.603.890.3039.3
Table 5. Isotherm and kinetic modeling parameters.
ModelParametersNAPFLUPHE
Freundlich isotherm modelKF0.9381.1310.59
n1.161.111.08
R20.9910.9890.982
Langmuir isotherm modelKL0.0250.0270.029
Qm11.6128.4326.93
R20.9260.9360.963
PFO modelqe (exp)43.334242.22
qe181520091422
K115 × 10−48 × 10−49 × 10−4
R20.6560.1370.408
PSO modelqe (exp)43.334242.22
qe43.8642.5542.55
K20.0440.0380.394
R20.9980.9940.997
Table 6. Statistical analysis using ANOVA for model validation of NAP, FLU and PHE removal via CCD quadratic model on N-OPLAC-2.
SourceSSDFMSF-Valuep-Value
N-OPLAC-2 for NAP
Model7831.6114559.4020.35<0.0001
A-pH227.361227.368.270.0165
B-Dosage144.471144.475.250.0448
C-Contact time21.90121.900.79650.03931
AB5.9615.960.21690.06514
AC21.61121.610.78580.03962
BC3.3213.320.12080.07353
A27.7917.790.28340.06061
B217.70117.700.64390.04410
C260.12160.122.190.01700
Residual274.941027.49
Model summaryR2R2adjR2predAPCV
0.96610.91860.776213.51757.82%
N-OPLAC-2 for FLU
Model7548.6914539.1932.25<0.0001
A-pH184.031184.0311.010.0078
B-Dosage208.381208.3812.460.0054
C-Contact time1.3011.300.07760.007863
AB0.728110.72810.04350.8389
AC0.104810.10480.00630.09385
BC0.011310.01130.00070.009798
A236.23136.232.170.1718
B28.4918.490.50760.4925
C2202.271202.2712.100.0059
Residual167.201016.72
Model summaryR2R2adjR2predAPCV
0.97830.94800.8816.74155.97%
N-OPLAC-2 for PHE
Model6929.2514494.9517.40<0.0001
A-pH238.791238.798.390.0159
B-Dosage469.091469.0916.490.0023
C-Contact time2.3812.380.08370.7783
AB11.94111.940.41990.5316
AC1.9511.950.06850.7988
BC1.9511.950.06850.7989
A241.57141.571.460.2545
B229.99129.991.050.3287
C2255.951255.959.000.0134
Residual284.441028.44
Model summaryR2R2adjR2predAPCV
0.96060.90540.824113.14997.62%
Table 7. Optimized results of NAP, FLU and PHE removal.
PollutantpHDosage
(mg/L)
Contact Time
(min)
Initial
Concentration
(mg/L)
RSM Predicted Removal
(%)
Experimental
Removal
(%)
NAP312249259594.8
FLU9798.4
PHE9797.4
Table 8. Removal of NAP, FLU and PHE in PW using N-OPLAC-2.
PollutantpHDosage
(mg/L)
Contact Time
(min)
Experimental Removal
(%)
Removal in PW
(%)
Error
(%)
NAP31224994.889.944.86
FLU98.493.25.2
PHE97.4925.4
Disclaimer/Publisher’s Note: The statements, opinions and data contained in all publications are solely those of the individual author(s) and contributor(s) and not of MDPI and/or the editor(s). MDPI and/or the editor(s) disclaim responsibility for any injury to people or property resulting from any ideas, methods, instructions or products referred to in the content.

