
Distribution Characteristics of Dissolved Oxygen in Spring in the Northern Coastal Beibu Gulf, a Typical Subtropical Bay


1
College of Chemistry and Environmental Science, Guangdong Ocean University, Zhanjiang 524088, China
2
Southern Marine Science and Engineering Guangdong Laboratory, Zhuhai 519082, China
3
Cooperative Research Center for Offshore Marine Environmental Change, Guangdong Ocean University, Zhanjiang 524088, China
*
Author to whom correspondence should be addressed.
Water 2023, 15(5), 970; https://doi.org/10.3390/w15050970
Submission received: 30 December 2022
/
Revised: 25 February 2023
/
Accepted: 26 February 2023
/
Published: 2 March 2023
(This article belongs to the Special Issue Origin and Dynamic of Micropollutants in Contaminated River, Estuary, and Surrounding Coastal Water Systems)
Abstract
:Dissolved oxygen (DO) is an important parameter for evaluating the seawater quality of the oce-anic environment, but the distribution of DO and its possible mechanisms of marine environ-mental regulation are less studied. Here, the spatial distribution of DO and the influence of main environmental factors on DO were explored using in-situ observation data collected in the northern coastal waters of the Beibu Gulf in April 2021, based on cluster analysis, partial correla-tion analysis, and multiple linear regression. The results showed that DO in surface water of the study area gradually increased from nearshore to offshore, with the nearshore’s DO being nearly saturated and the offshore supersaturated. Tieshan Port and the Maowei Sea had the lowest degree of DO saturation. The partial correlation analysis between DO concentration and environmental factors revealed that the distribution of DO concentration was mainly influenced by temperature and salinity as well as other biochemical factors (i.e., chlorophyll-a, turbidity, and pH). Significant differences existed between the dominant factors in various parts of the northern Beibu Gulf. The western river (Beilun River, Fangcheng River, Maoling River, Qinjiang River) estuaries and offshore areas were dominated by photosynthesis, while the eastern river (Fengfeng River, Nanliu River) estuaries were dominated by oxidation-decomposition. In addition, DO was also affected by the mangrove ecosystem, aquaculture, and coastal industry.
1. Introduction
Offshore bays are important regions for the development of the marine economy, which plays a substantial role in regional economic construction and social development. With the intensification of global climate change and human activities, ecological and environmental problems, such as eutrophication, hypoxia and red tide, have posed serious challenges to the sustainable development of coastal economies and societies [1]. Dissolved oxygen (DO) in seawater is an important parameter for evaluating the environmental quality of seawater, which affects the survival and distribution of marine organisms [2]. It is also an important indicator of the self-purification capacity of water bodies, which is important for maintaining a healthy aquatic ecosystem. Oxygen molecules are dissolved in water after atmospheric oxygen exchange or biochemical reactions [3]. The influencing factors of DO concentration include oxygen partial pressure in the air, depth, water temperature, wind speed, light intensity, biological and non-biological oxygen consumption, salt and algae. Studying the spatial distribution of DO content and water temperature, salinity, turbidity, Chl-a and other factors, analyzing the distribution of oxygen saturation, and exploring the correlation between DO and various indicators can not only provide a basis for the early warning of hypoxic disasters [4], but also provide theoretical support and solutions conducive to solving practical problems, which have important ecological and environmental significance.
Many reports have studied DO in the typical subtropical bay. Long [5] found that the distribution of DO in the surface seawater of the northern part of the South China Sea has an opposite trend to that of seawater temperature. Ma [6] pointed out that the seasonal variation of DO in the Northern Beibu Gulf was large. There was a low-oxygen area at the bottom of water in summer. Its lowest value gradually decreased and its low-oxygen area range increased. In addition, the potential low-oxygen area has a tendency to develop into a real low oxygen area. YI [7] pointed out that DO concentrations at the edges of the eddies in the northern South China Sea were higher than those at the eddy centers under the influence of tropical storms. The DO concentration in the inner, outer and outer subsurface of the anticyclonic vortex decreased significantly. The variation in DO concentration in the subsurface layer was mainly affected by water exchange in the horizontal and vertical directions. Previous studies on marine DO mostly focused on its characteristics of concentration distribution, few studies were found to investigate DO saturation and its spatial and regional differences. The spatial difference in DO saturation can reflect the main physical and chemical processes affecting DO in a region. It is helpful to further explore the relationship between the process of oxidative decomposition of organic matter into inorganic matter and the process of photosynthesis of inorganic matter to synthesize organic matter.
Beibu Gulf is a typical subtropical bay, enclosed by the coast of Guangxi, western Hainan, the Leizhou Peninsula in Guangdong and northeastern Vietnam. It is a semi-enclosed bay with poor hydrodynamic conditions. The main coastline of the northern Beibu Gulf is in the southern part of Guangxi Province [8]. The coastline is tortuous and has many harbors. The depth of the sea was generally less than 90 m, with an average depth of 42 m.The seafloor topography was high in the north and low in the south, and the isobath line was parallel to the coastline. Beibu Gulf is located on the southern side of the Tropic of Cancer and has a tropical and subtropical climate. In the northern part of the bay, the cities of Nanning, Qinzhou, Fangchenggang and Beihai have a humid subtropical monsoon climate, with high overall rainfall and long sunshine hours. On land in the Beibu Gulf coastal region, there are six major rivers from west to east: the Beilun River, the Fangcheng River, the Maoling River, the Qinjiang River, the Dafeng River and the Nanliu River. Some of the high-load input in this bay were mainly derived from this river [9,10,11]. The tides around the Beibu Gulf were mainly transmitted from the Pacific Ocean to the South China Sea, and then from the South China Sea to the Beibu Gulf, which were formed by the interference of geographical conditions and reflected tidal waves in the Beibu Gulf [12]. At the moment, organic pollution, inorganic pollution, and combined pollution are clearly affecting Qinzhou Bay, Lianzhou Bay, and Tieshan Port in the northern part of the Gulf [13].Red tides have occurred once a year on average in Guangxi’s coastal area in the last 20 years, mainly in spring and summer [14].
Although there has been a lot of research in the typical subtropical bay of Beibu Gulf in the northern South China Sea, there have been few in-depth discussions on the characteristics of dissolved oxygen changes and their regulation mechanism. There is a lack of analysis of the physical and biochemical processes that may occur in regional DO under different background conditions. This paper used the spring 2021 automatic online water quality monitoring data to investigate the distribution characteristics of DO concentration and theirs saturations in different areas of the subtropical bay. The study area was partitioned by agglomerative hierarchical cluster analysis, and the possible mechanism of regulating DO was explored by combining the results of partial correlation analysis and multiple regression analysis, so as to provide support for the protection and remediation of the marine ecological environment in the Beibu Gulf in the future.
2. Materials and Methods
2.1. Source of Data
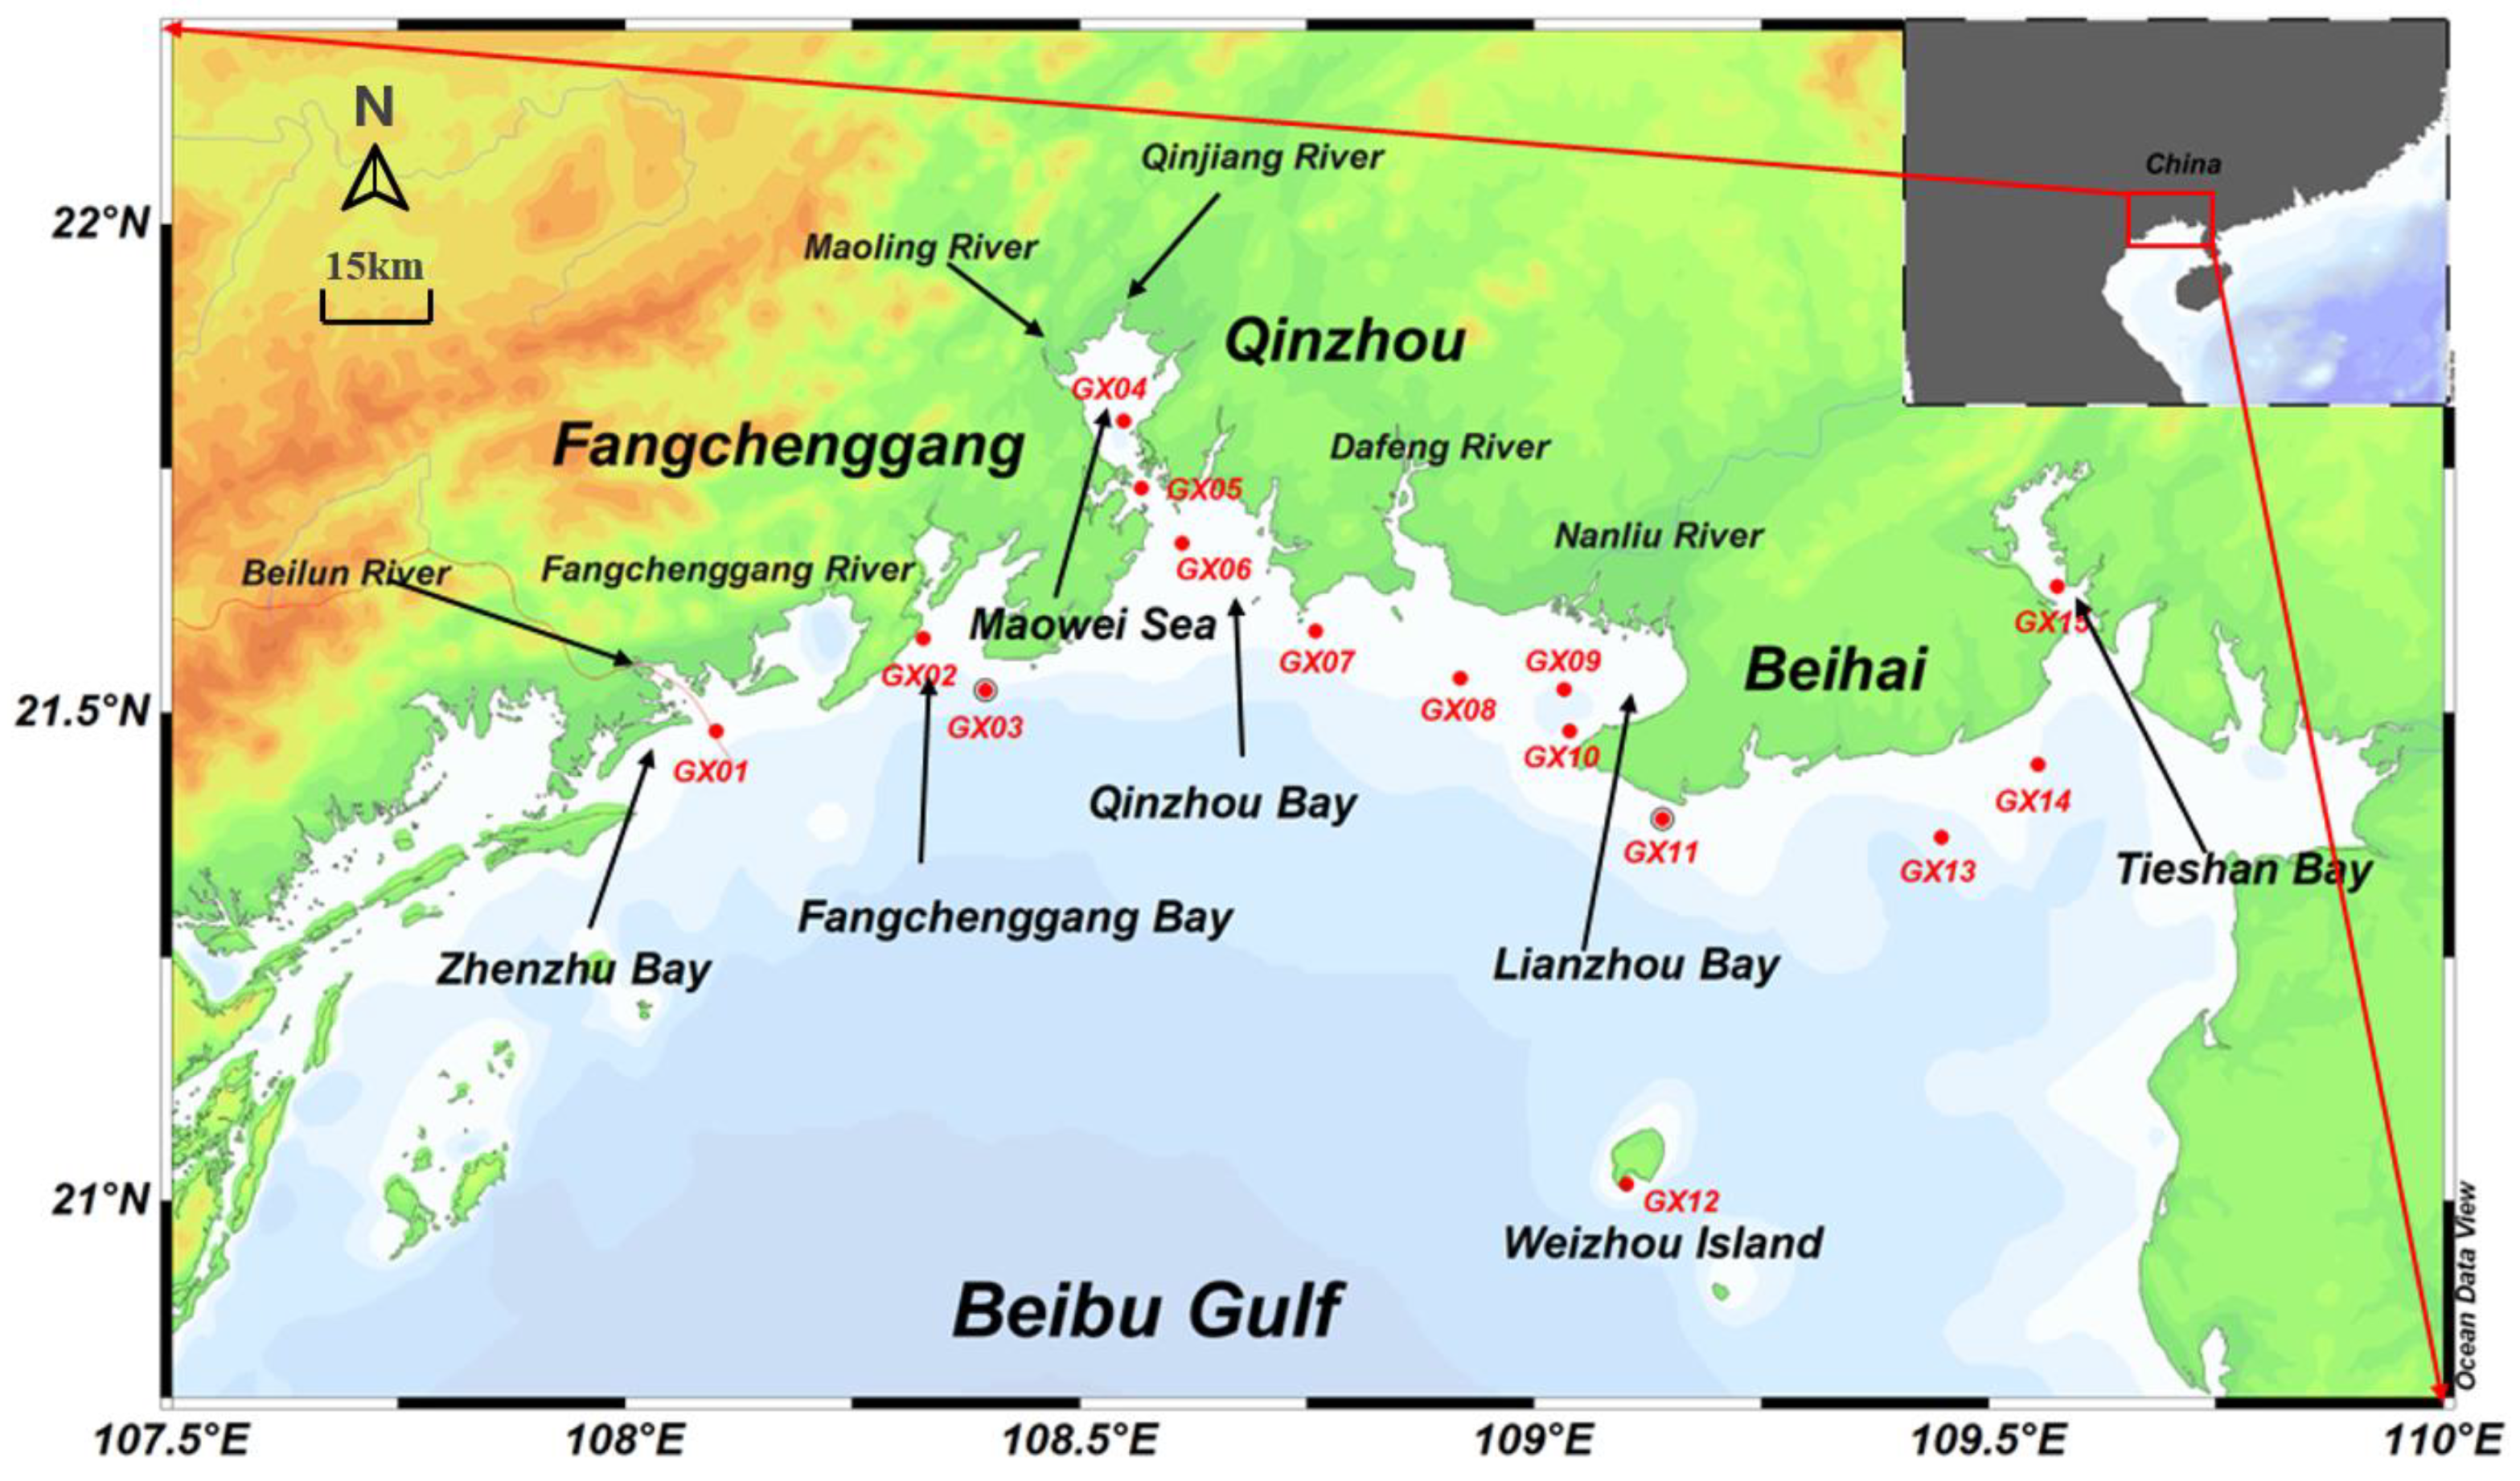
The data for this study were obtained from the automatic online water quality monitoring station of the Guangxi Zhuang Autonomous Region Marine Environment Monitoring Center Station in 2021. The main monitoring stations were located in the sea, where the environmental quality changed significantly according to the geographical location and topography of Beibu Gulf (Figure 1). The water quality automatic online monitor placed in the study area at 0.5 m above surface water was the American YSI brand 6600V2 multi-parameter water quality analysis instrument, equipped with model 599103-02. Chl-a probe, range: 0–400 g/L In this study, Chl-a content, temperature (SST), salinity (SAL), and turbidity (TUR) were selected for continuous monitoring 24 h a day throughout April 2021, with an interval of 0.5 h per monitoring. Simultaneously, nutrient concentrations (nitrate (NO3−), nitrite (NO2−), ammonia nitrogen (NH4+), and active phosphate (SRP) were determined in GX03, GX04, GX06, GX09, GX10, and GX12 stations using the model NPA-PRO nutrient automatic analyzer (SYSTEA, Italy). The range of ammonia nitrogen was 0–1 mg/L, the range of nitrate and nitrite was 0–5 mg/L, and the range of phosphate was 0–0.5 mg/L.
2.2. Calculation of Dissolved Oxygen Saturation and Saturation Concentration
Dissolved oxygen saturation is calculated according to (1):
In Equation (1), r(O) is the dissolved oxygen saturation in seawater, in %; c(O) is the measured dissolved oxygen content, in mg/L; and c(O’) is the saturation concentration of oxygen in seawater at the site water temperature and salinity, in mg/L.
The saturation concentration of dissolved oxygen in this study was calculated using Equation (2) as a function of temperature and salinity applicable to the surface water. The Weiss equation was used to calculate the saturation concentration of dissolved oxygen in seawater at various salinities and temperatures: [15,16,17,18]
lnc(O’) = A1 + A2(100/T) + A3ln(T/100) + A4(T/100) + S[B1 + B2(T/100) + B3(T + 100)2] + 0.4912
In Equation (2), c(O’) is the saturation concentration of oxygen in seawater, mg/L; T is the thermodynamic temperature of seawater at the site, K; and S is the salinity of seawater at the site. The quantities of constants A and B are: A1 = −173.4292, A2 = 249.6339, A3 = 143.3483, A4 = −1.8492, B1 = −0.033096, B2 = 0.014259, B3 = −0.001700.
2.3. Analytical Method
Firstly, based on the observation data from April, the data of dissolved oxygen and other water quality parameters were averaged into monthly average data by Matlab R2020a software. Next, the monthly average spatial distribution maps of dissolved oxygen, dissolved oxygen saturation, and other water quality factors in the study area were drawn by Ocean Data View 4.0 (ODV 4.0) software. This study selected the processed monthly average data of DO and other water quality parameters of the 15 stations and used the Z-score method to standardize the data by giving the mean and standard deviation of the data, thereby eliminating the influence of dimension and magnitude on data calculation, according to Equation (3). Later, the data were further used for clustering by an agglomerative hierarchical cluster algorithm based on Euclidean distance [19], according to Equation (4). Data calculation and analysis were implemented with the help of Matlab R2020a software and its statistic toolbox (e.g., the commends linkage.m and pdist.m). The matlab code of agglomerative hierarchical cluster analysis is shown in Figure S1. The calculation equations are as follows:
where u is the mean of the sample data, and σ is the standard deviation of the sample data. In addition, the standardized data maintains useful information about outliers.
Here, xik is the k-element of the i-sample; dij is Euclidean’s distance between xi and xj.
Based on the results of cluster analysis, SPSS 21 software was used to explore the relationship between dissolved oxygen and other water quality factors in each group. On the one hand, partial correlation analysis was used to analyze the linear correlation between DO and water quality factors one by one under the condition of controlling the linear influence of other variables. On the other hand, stepwise multiple regression analysis was used to reveal the main factors affecting DO in each group. The environmental parameters influencing the distribution of dissolved oxygen in the Beibu Gulf were thoroughly examined in conjunction with the results of the analysis mentioned above.
3. Results
3.1. Spatial Distribution of Dissolved Oxygen and Related Environmental Elements
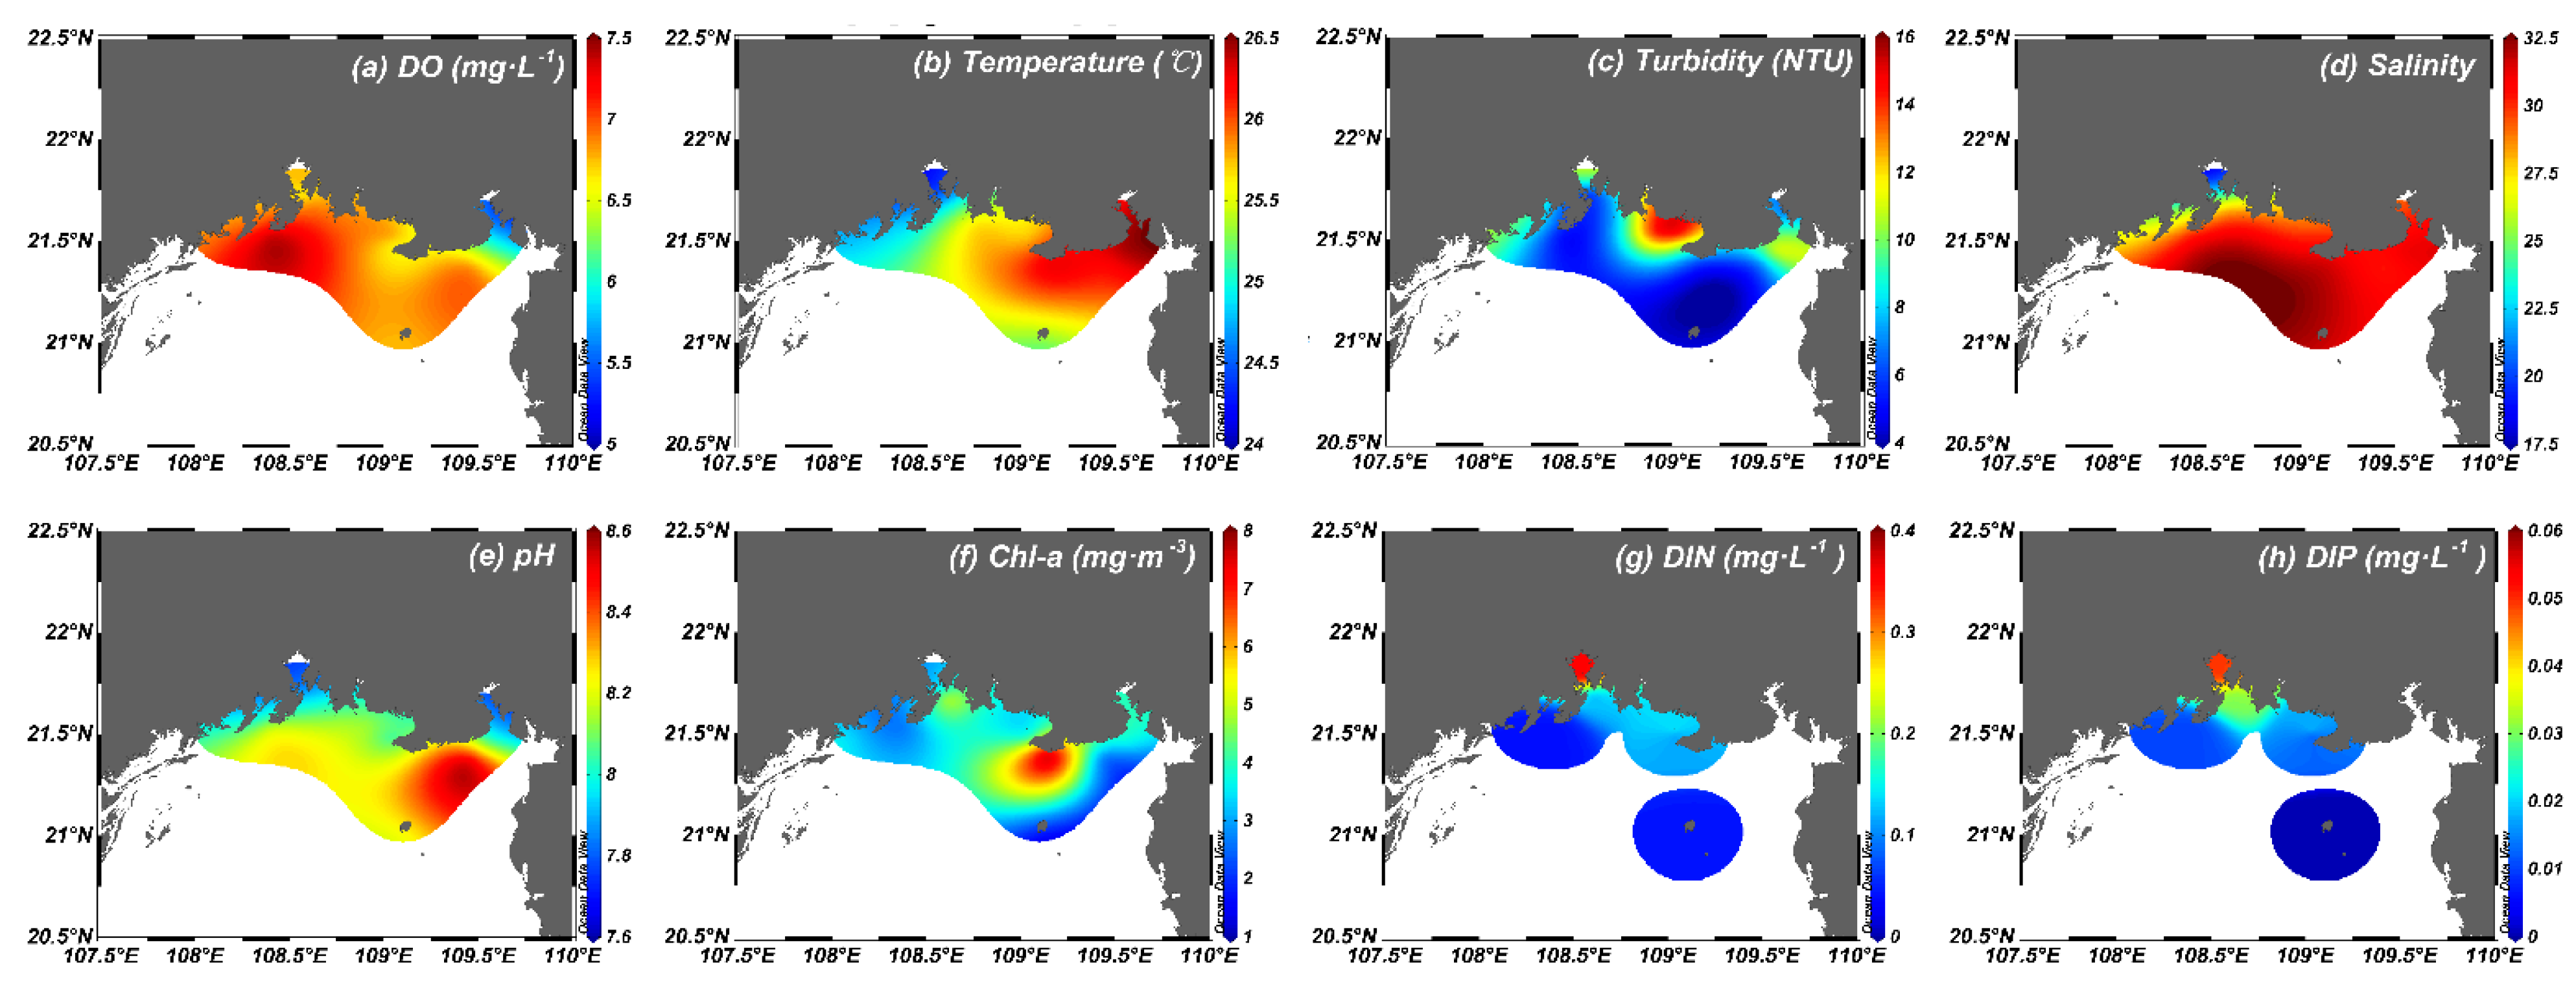
The monthly average distribution of DO and related environmental parameters in April 2021 showed that the concentration of dissolved oxygen in the study area of the northern Beibu Gulf ranged from 6.5 to 7.5 mg·L−1 (Figure 2). The DO minimum was located near Tieshan Port (GX15) (5.48 mg·L−1), and the DO maximum was located near GX03 (7.40 mg·L−1). DO showed a gradual increase from the estuarine bay to the offshore area. The average water temperature in northern Beibu Gulf in April was 25.33 °C. The highest monthly average water temperature values (>26.3 °C) located near Tieshan Harbor (GX14~GX15) in the nearshore inner bay, 26.43 °C and 26.39 °C respectively. The water temperature minimum of 24.30 °C located near Maowei Sea (GX04). The turbidity maximum was 14.63 near the mouth of Nanliu River and the minimum was 4.22 near Weizhou Island (GX12), where GX07, GX08 and GX09 are the high turbidity areas at the mouth of Nanliu River and Dafeng River. The salinity in the northern part of Beibu Gulf was influenced by both the sea and rivers, with salinity ranging from 19.78 to 31.88, showing a trend of gradual increase from the estuarine area to the sea within the bay. Its minimum was located in the estuary of Maoling River and Qinjiang River, and the second lowest value was located in the estuary of Fangcheng River. The pH value gradually increases from the estuarine coastal zone to the offshore waters, with the minimum being 7.79 at Maowei Sea(GX04~GX05) and 7.82 at Tieshangang (GX15) in Qinzhou Bay. Chl-a was a monitoring indicator of phytoplankton abundance, photosynthesis and water quality. The Chl-a content in this region ranges from 1.85 mg·m−3 to 7.95 mg·m−3 with a large span. Chl-a minimum was located in Weizhou Island GX12 station, and the maximum was located in Beihai Shankou Mangrove Nature Reserve (GX11) station. The concentrations of dissolved inorganic nitrogen and phosphate showed a similar trend in different regions and decreased from the high concentration in Qinzhou Bay estuary to the offshore bay.
3.2. Dissolved Oxygen Saturation Calculation Results and Distribution
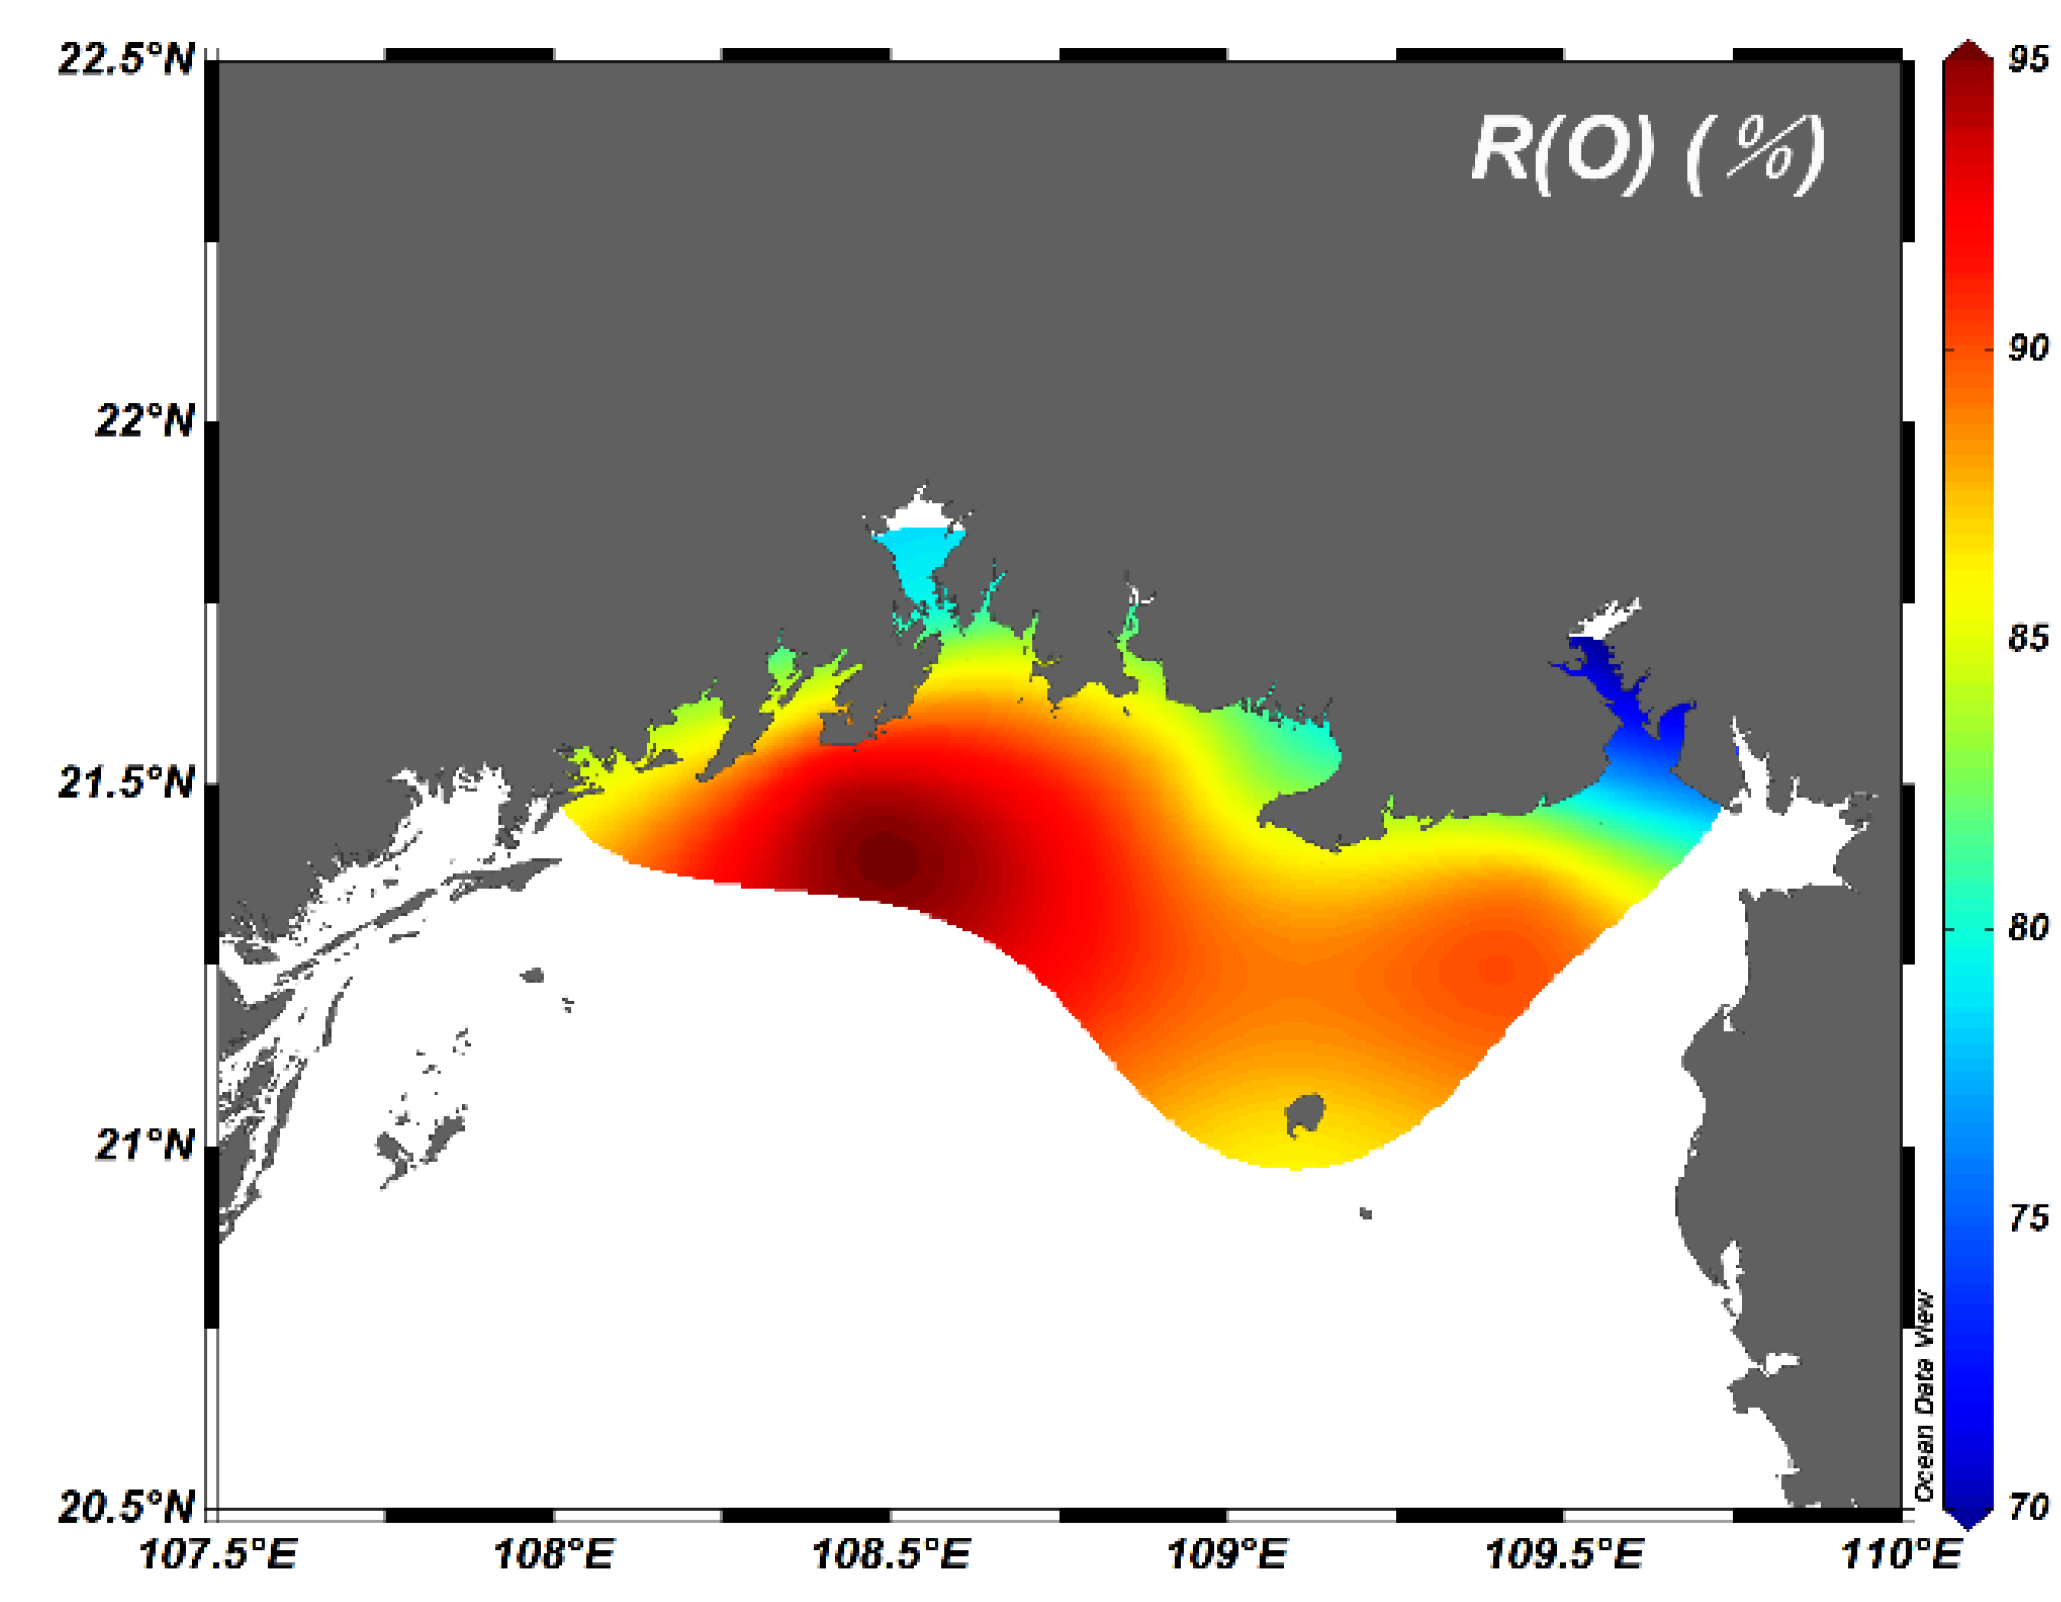
From the results (Figure 3), the range of DO saturation in the study area was from 80.76 to 106.52%, and the mean value of DO saturation in the study area was 96.47%. The highest saturation value of 106.52% was located near Fangchenggang Bay (GX03), and the lowest saturation value of 80.76% was located at station GX15 near Tieshangang Bay. On the whole, the DO saturation distribution trend in the study area was almost consistent with the DO concentration, with a gradually increasing trend from nearshore to offshore. The supersaturated areas (DO > 100% ) included offshore stations such as GX03, GX07 and GX13. The near-saturated areas ( 95–100% ) included GX01 ~ 02, GX06 and GX10~12 stations. The low-saturated areas ( DO < 95% ) were near the Tieshan Port (GX14~GX15 ) and Qinzhou Bay estuary (GX04~GX05).
3.3. Agglomerative Hierarchical Cluster Analysis of the Study Area
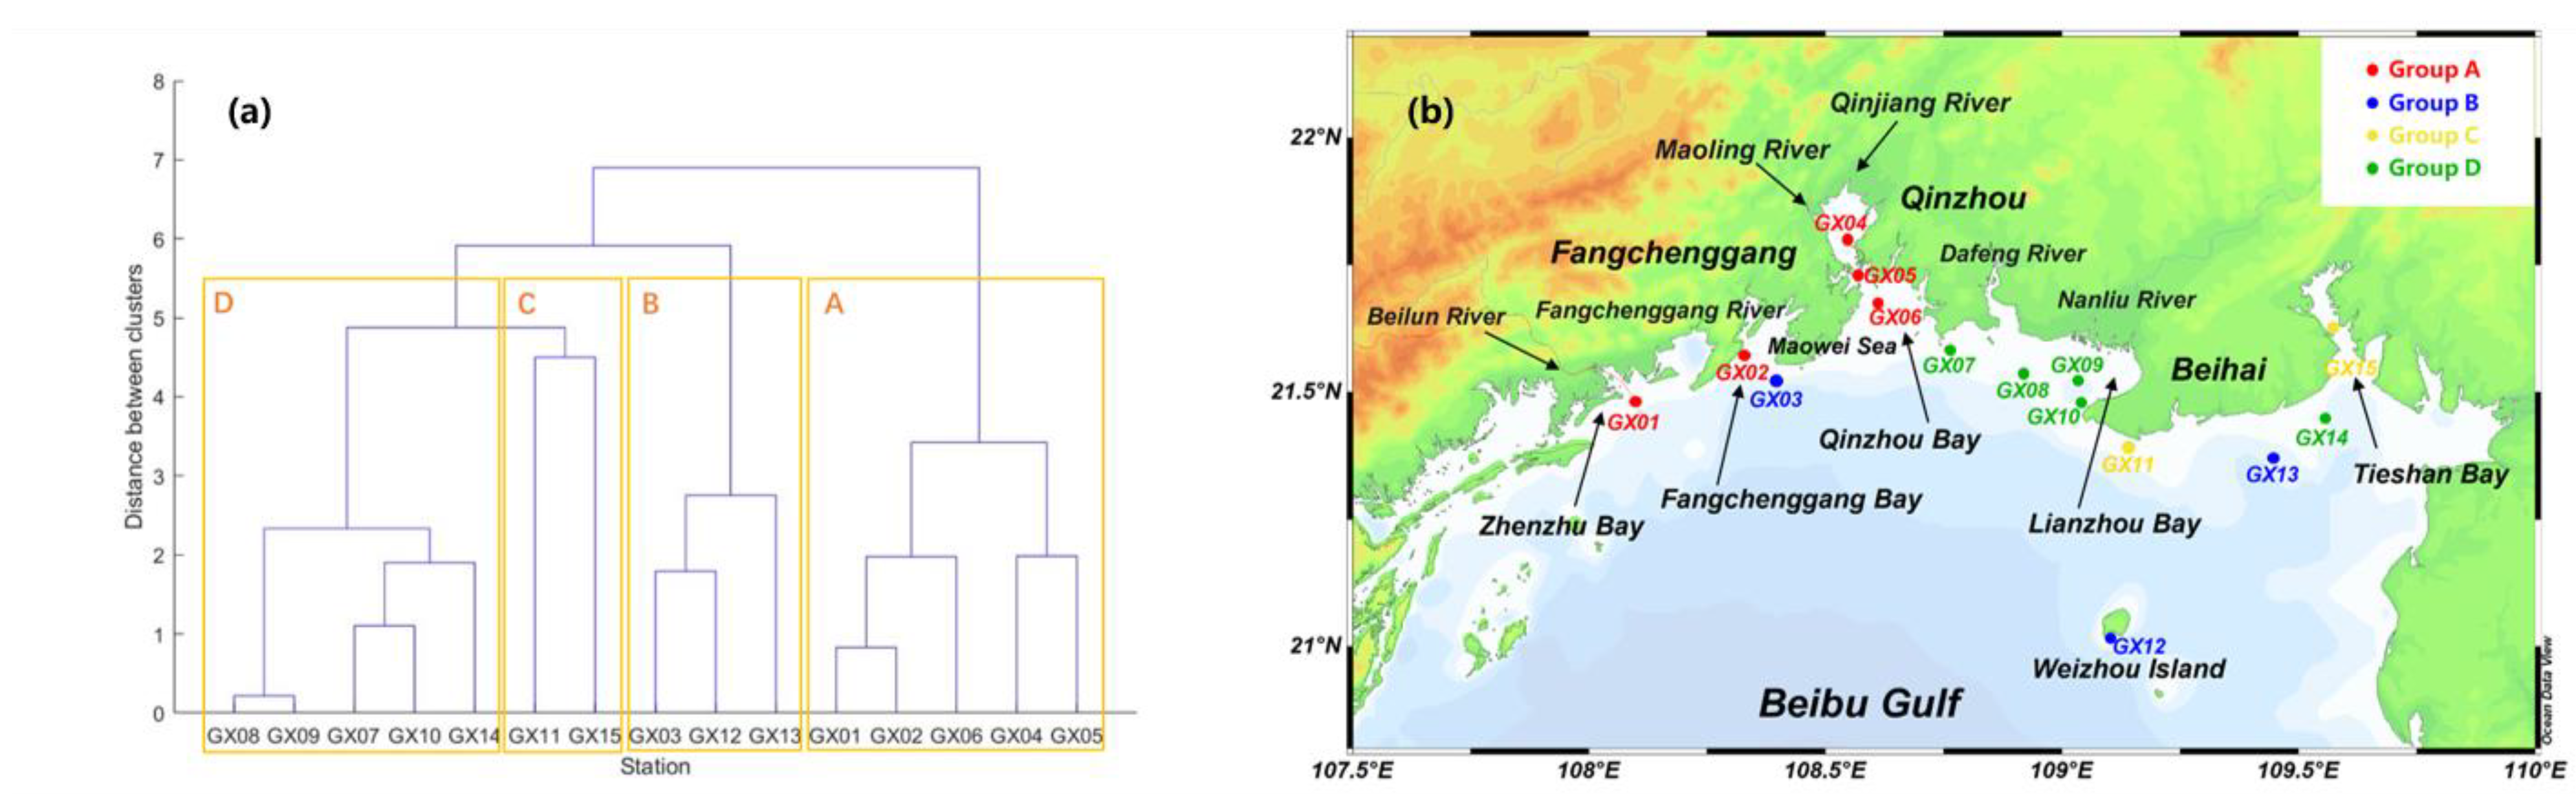
The results of cluster analysis of the study area were shown in Figure 4. The results showed that all stations can be divided into four regions: Group A included stations GX01, GX02, GX04, GX05 and GX06; Group B included stations GX03, GX12 and GX13; Group C included stations GX11 and GX15; Group D included stations GX07, GX08, GX09, GX10, GX11 and GX14. According to the results of cluster analysis combined with geographical location (Figure 4), it showed that stations in Group A were located in the estuaries of the Beilun River, Fangcheng River, Maoling River and Qinjiang River; Group B included stations GX03 and GX13, which were farther offshore, and then the station GX12, which was on the edge of an offshore island; Group C included stations in the Beihai Shankou Mangrove Ecological Nature Reserve (GX11) and the petrochemical industry zone (GX15): The stations in Group D were all geographically located in the northern part of Beihai Bay, which was heavily influenced by near-shore waters and less than 10 m deep.
3.4. Partial Correlation Analysis of Factors Affecting Dissolved Oxygen in Each Group
A partial correlation analysis was carried out on the original monitoring data of indicators in each group area. The statistical results of the partial correlation coefficients between DO and each water quality element are shown in Table 1. The correlation between DO and salinity in the whole area was high. DO was significantly correlated with temperature and pH in groups A, C, and D. From the perspective of the subgroup area, the environmental factors leading to DO changes in group A included pH, water temperature, and Chl-a, and their partial correlation coefficients were 0.641, −0.450, and 0.411, respectively. The environmental factors that dominated the DO changes in group B included turbidity, Chl-a, and salinity. Their partial correlation coefficients were −0.686, 0.582, and −0.540, respectively. In group C, DO changes were highly correlated with all indices, and the highest correlation with pH was 0.824. DO in group D was highly correlated with salinity, pH, and turbidity, and their partial correlation coefficients were −0.539, 0.465, and −0.434, respectively.
3.5. Multiple Linear Regression Analysis of DO for Each Group
DO was used as the explanatory variable, and temperature, salinity, PH, turbidity, and Chl-a were used as explanatory variables. Multiple regression analysis was performed on the regional indicators of each group in this study. From the multiple regression analysis results (Table 2), the R2 of the analysis results for group A was 0.550, and its F was 44.265. The main explanatory variables were pH, salinity, water temperature, and Chl-a, sequentially. The R2 of group B was 0.630, and its F was 48.834. The main explanatory variables were turbidity, Chl-a and salinity. The R2 of group C was 0.963, and its F was 284.770. The main explanatory variables were pH, Chl-a, water temperature, salinity, and turbidity. The R2 of group D was 0.553, and its F was 33.698. The main explanatory variables were salinity, turbidity, pH, and water temperature.
4. Discussion
4.1. Spatial Distribution Characteristics of Dissolved Oxygen in Surface Seawater in Beibu Gulf
In this study area, the dissolved oxygen concentration of 93.8% of the stations reached the requirement for first grade seawater (DO > 6 mg/L) [20]. Overall, there is a general trend toward a gradual increase in DO concentrations from nearshore to offshore. This was most likely due to the fact that the land would contribute a significant amount of terrestrial substances to the ocean. In the process of transporting these organic materials to the sea, decomposition would occur and consume dissolved oxygen in the water body, and the consumption of oxygen by decomposition would gradually decrease. This was mainly because the area around the station was an industrial area with a number of petrochemical refining enterprises and liquefied natural gas enterprises. On the one hand, the discharge of wastewater from industry increased the temperature of the surrounding seawater, and then the significant increase in seawater temperature would lead to a decrease in the solubility of oxygen in seawater, further affecting the DO [21,22,23]. On the other hand, the leakage and diffusion of organic matter such as oil in the ocean would have a significant impact on water light and air-sea exchange, resulting in the decrease of seawater DO to a certain extent [24,25,26]. The DO value of 5.48 mg/L at station GX15 near Tieshan Port did not meet the water quality requirement of first-class seawater (DO > 6 mg/L), which is located in a narrow bay and mainly relies on seawater movements such as tides, wind, waves and surges. Moreover, weak hydrodynamic conditions were not conducive to the material exchange between water bodies and the sea-air exchange of water bodies, which was more likely to lead to low DO. The DO of GX15 station in Tieshan Port was lower than that of GX14 station at baymouth. Weak hydrodynamic conditions, Tieshan Port’s coastal industry, aquaculture industry [27] and oil industry [28,29] were likely to cause the lowest DO in Tieshan Port (GX15). The comprehensive analysis of the water quality indicators concluded that the site exhibited low Chl-a, low pH, high water temperature, high salinity, and moderate to low turbidity. It is known that long-term low DO is detrimental to the activity of aquatic animals in this area [30].
Stations GX04, GX05 and GX06 were located in the Qinzhou Bay and Maowei Sea area influenced by the Qinjiang and Maoling rivers, with station GX04 at the mouth of Maowei Bay (the top of Qinzhou Bay), station GX05 at the mouth of Maowei Bay and station GX06 in Qinzhou Bay. GX04 was from an estuary with low water temperature, low salinity, low pH and high phosphate. As the river flows into the ocean, the freshwater and seawater in the river would intersect and mix, showing a typical estuary phenomenon in which the water temperature, salinity and pH of GX04, GX05 and GX06 gradually increase and the turbidity, DIN and DIP gradually decrease. The decomposition of terrestrial material ingested by rivers would gradually consume and reduce the DO in water. The GX05 station was located in the channel connecting Qinzhou Bay and the outer bay of Beibu Gulf. The terrain is narrow, and it was also affected by river input and ocean tides. It was an excellent aquaculture harbor because of the combination of freshwater and seawater. A large number of marine aquaculture such as oysters and crabs would bring a large amount of particulate organic matter to the seawater [31]. The decomposition of this organic matter would consume more dissolved oxygen, which was likely the reason why the DO in Qinzhou Bay showed a trend of GX06 > GX04 > GX05.
4.2. Spatial Distribution Characteristics of Dissolved Oxygen Saturation in Surface Seawater in Beibu Gulf
Temperature and salinity are two important factors that affect dissolved oxygen concentration. In this study area, there were not only many sea rivers, but also ports, industrial sewage, aquaculture and domestic sewage along the coast. The temperature and salinity of different regions were quite different. This study converted DO concentration into DO saturation for analysis and discussion in order to more accurately explore the variation pattern of DO and reveal the correlation between the environmental factors and DO in seawater. The replenishment and escape of dissolved oxygen in oceanic waters is usually dominated by sea-air exchange, and dissolved oxygen is mostly in a near-saturated state. In contrast, nearshore and estuarine waters can be saturated, unsaturated and supersaturated [32]. In this study area, the DO saturation at offshore stations GX03, GX07 and GX13 was >100%. When the DO saturation in surface waters was >100%, it was implied that photosynthetic features played an important role. The amount of oxygen produced by photosynthesis was greater than the amount consumed and escaped. This was likely caused by the active hydrodynamic of the offshore station and the large amount of oxygen released into the seawater by the proliferation of algae. Stations GX01-GX02, GX06, GX10-GX12 have saturations of 95–100%. When the DO saturation was closer to 100%, the DO concentration was closer to the DO saturation concentration of the water body under the conditions of water temperature and salinity. The effects of air-sea exchange, photosynthesis and oxidative decomposition of organic matter on DO concentration are approaching balance, or the biological decomposition of aerobic and photosynthetic oxygen production is approximately balance. DO Saturation was <95% in Tieshan Port (GX14, GX15) and Qinzhou Bay Estuary (GX04–GX05), indicating that the oxidation and decomposition of organic matter might play an important role in the water body. The consumption of DO exceeds the replenishment, and the decomposition of organic matter played a leading role in the water body [33]. In general, the saturation degree of DO in the water body generally showed an increasing trend from the estuary to the ocean. It might be due to the gradual consumption of terrestrial organic matter from the estuary to the ocean, resulting in the gradual weakening of oxygen consumption by decomposition [34]. The distribution trend of dissolved oxygen saturation was similar to that of pH value. The low value area of saturation is often consistent with the low value area of pH, which further indicates that the low value area was dominated by the decomposition of terrestrial substances such as organic matter to consume O2 and release CO2, and the increased amount of CO2 in water causes the decrease of seawater pH.
Combined with Figure 2 and Figure 3, the distribution trend of DO saturation and DO concentration was basically the same. The low DO concentration and low saturation in Maowei Sea (GX04~GX05) are probably due to the input of the Maoling River and Qinjiang River, which resulted in a large input of terrigenous matter and strong decomposition. The DO concentration and saturation of Tieshan Port (GX15) are the lowest in the region (5.48 m/L, 80.76%). The low DO concentration and low saturation might be affected by aquaculture wastewater, industrial sewage, port pollution, etc. Therefore, the oxidative decomposition in this area was stronger than photosynthesis, and the consumption of dissolved oxygen was faster, which will release more CO2 and cause the pH of marine water to decrease (pHGX15 = 7.82). Combined with the previous studies showing that Qinzhou Bay and Tieshan Port have been affected by pollution in recent years [13] and the frequent occurrence of red tide disasters in Qinzhou Bay [14]. Land-based emissions from Qinzhou Bay and Tieshan Bay in the northern Beibu Gulf in spring need to be monitored and managed for a long time. At the same time, it can also improve this situation by adjusting the structure of the industry and rationally planning the layout.
4.3. Regional Clustering Analysis of Beibu Gulf and Factors Influencing Dissolved Oxygen in the Region
Due to the complex terrain of the study area, including land, rivers, bays, estuaries, island and many other factors, through the standardization and agglomerative hierarchical cluster analysis of the basic monitoring data of dissolved oxygen and other water quality factors at each station, combined with partial correlation analysis and multiple regression analysis to eliminate the interference and influence of other variables. Analyzing the relationship between DO and each variable separately made it easier to reflect the dominant factors of DO change. Dissolved oxygen in seawater was affected by a variety of processes, including not only physical processes such as temperature, salinity changes, water movement and mixing, the diffusion of concentration difference, air-sea exchange, but also biochemical processes including organic matter oxidation into inorganic matter and inorganic photosynthesis synthesis of organic matter. From the longitudinal comparison of the overall results, all groups in this study area reflected a significant negative correlation between DO and salinity, which was consistent with the prevalent negative correlation between dissolved oxygen and salinity in the ocean [35,36,37]. When the salinity gradually increased, the DO in the water always decreased. The area of group A, C and D showed a significant correlation between DO and water temperature. When the water temperature increased, the dissolved ability of DO decreased, showing a significant negative correlation.
Combining the results of partial correlation analysis and multiple regression analysis with the geographical location of the group, the high correlation between DO and pH in group A means that regional biochemical action dominates the change of DO in the water body. The high correlation between DO and Chl-a reflects that DO is mainly dominated by photosynthesis. Group A stations are located to the west of the northern Beibu Gulf, including the Beilun Estuary, Fangcheng River, Maoling River and Qinjiang Estuary (GX01, GX02, GX04, GX05, GX06).Among them, seagrass bloom occurred in the Beilun River estuary [11] and red tide occurred frequently in the Fangcheng River estuary [11]. The input of total nitrogen and total phosphorus in Qinjiang River and Maoling River was large, mainly inorganic nitrogen and active phosphate. Compared with other stations in the northern Beibu Gulf, they had higher phytoplankton abundance, a higher eutrophication index (E value) and more frequent red tides [11,37]. The stations in group A were affected by large rivers. The river input brought a large amount of nutrients such as N and P to make phytoplankton flourish, and its photosynthesis significantly affected DO changes.
The DO of group B has a strong relationship with turbidity and Chl-a. Group B stations include the offshore waters of Fangchenggang (GX03), Weizhou Island (GX12) and offshore waters (GX13). Because of the high degree of water exchange and strong hydrodynamic conditions, the offshore stations were relatively affected by the ocean. The negative correlation between DO and turbidity was likely reflected in the large disturbance of offshore water caused by river input and seawater movement. The change in turbidity affected the water transparency, which in turn affected phytoplankton photosynthesis, as a result, the change in DO in water. The positive correlation between DO and Chl-a revealed that Chl-a dominated DO in water, and the photosynthetic oxygen production of phytoplankton was the main factor determining DO in water.
Group C included the Beihaishankou Mangrove Nature Reserve (GX11) and Tieshangang Bay (GX15). In this group, DO had a high correlation with each index, which meant that DO in group C was regulated by physical and biochemical factors at the same time, while the correlation between DO and pH, turbidity, and Chl-a also showed a high value (0.824, −0.522, 0.467), indicating that this area was affected by biochemical processes such as decomposition and photosynthesis. Mangroves in the GX11 Mangrove Nature Reserve performed the functions of filtering organic matter and pollutants from land runoff and inland discharge, providing organic debris for marine productivity as producers, and providing ideal habitats for marine animals to inhabit and forage [38]. The oxidation and decomposition of organic matter required the consumption of oxygen in water, and the inorganic matter produced by the decomposition of organic matter further promoted the life activities of phytoplankton in water, thereby influencing oxygen production by photosynthesis. Tieshan Bay (GX15) was an important sea area for aquaculture in the Beibu Gulf of Guangxi. The degree of eutrophication has recently been higher than in Qinzhou Bay and Lianzhou Bay. The coastal industry and the aquaculture industry were the main factors affecting the water quality of the sea [27,39]. Organic matter input and nutrient supplementation in the water body were clearly affected by aquaculture wastewater and industrial wastewater [38,40]. These factors would further strengthen the oxidation and decomposition of organic matter in the water body and the oxygen production of phytoplankton, and jointly regulate the concentration of DO in the water body.
Group D was located east of the northern Beibu Gulf, and included the Lianzhou Bay Station (GX07~GX10) and the petrochemical industrial area (GX14), demonstrating that DO has a strong correlation with salinity, pH and turbidity. The environmental carrying capacity of Lianzhou Bay was at a high risk level, with high eutrophication index [41] and red tide outbreaks [11]. The Dafengjiang River and Nanliujiang River flowed into Lianzhou Bay. The Nanliujiang River was the longest, the widest and the most abundant river in the south of Guangxi. The average annual runoff was 7.74 billion cubic meters [42]. There were 6700 hectares of aquaculture industry in the basin, and breeding and chemical oxygen demand had the highest load into the river [43], which means that human influence may bring a large amount of organic matter to Lianzhou Bay. The decomposition of organic matter in the water body was enhanced, and the DO in the water body was consumed. If there were pollution and leakage problems in the petroleum industry in the petroleum industry, not only would the decomposition of organic matter will cause oxygen consumption to change the consumption of DO, but also the oil film would affect photosynthesis and further impede the supplement of DO in the water body. In addition, the industrial temperature drainage with high water temperature will inevitably affect the water body ‘s ability to DO. The area of group D reflects the high correlation between DO and salinity, pH and turbidity, which proved that the biochemical action of the water body dominates the change of DO to a certain extent. The high correlation with salinity and turbidity also indicated that the oxidative decomposition of terrestrial materials imported from rivers was the main reason for the change in DO.
5. Conclusions
The DO concentration in the northern part of Beibu Gulf showed a gradual increase from the nearshore to the offshore, while the DO concentration in the narrow inner bay and the river inlet is relatively low. The DO saturation generally revealed an increasing trend from the nearshore of the estuaries to the ocean. Both Tieshangang and Maowei sea area showed the characteristics of low DO concentration and low saturation. The DO in the study area was significantly negatively correlated with salinity. And the DO showed negative correlation with temperature in most cases. The DO in the western river (Beilun River, Fangcheng River, Maoling River, and Qinjiang River) estuaries and offshore areas were often dominated by phytoplankton photosynthesis. The DO in the eastern rivers (Dafeng River and Nanliu River) was mainly affected by the oxidation-decomposition of terrestrial materials. Moreover, the DO concentration was also influenced by coastal mangrove ecosystems, aquaculture, and other offshore industries.
Supplementary Materials
The following supporting information can be downloaded at: https://www.mdpi.com/article/10.3390/w15050970/s1, Figure S1: The matlab code of agglomerative hierarchical cluster analysis.
Author Contributions
Conceptualization, H.Z. and Y.S.; methodology, H.Z. and Q.Z.; software, H.Z., M.D. and Q.Z.; validation, Q.Z., H.Z.; writing—original draft preparation, Q.Z.; writing—review and editing, Q.Z., H.Z. and Y.S.; visualization, Q.Z.; project administration, H.Z.; funding acquisition, H.Z. All authors listed made a substantial, direct and intellectual contribution to the work, and approved it for publication. All authors have read and agreed to the published version of the manuscript.
Funding
The present research is supported by the National Natural Science Foundation of China (No. 42076162), Innovation Training Program for college students of Guangdong Ocean University (NO. CXXL2020287) and the project was supported by the Innovation Group Project of Southern Marine Science and Engineering Guangdong Laboratory (Zhuhai) (No. 311020004).
Data Availability Statement
Data sharing is not applicable to this article.
Conflicts of Interest
The authors declare no conflict of interest.
References
- Breitburg, D.; Levin, L.A.; Oschlies, A.; Grégoire, M.; Chavez, F.P.; Conley, D.J.; Garçon, V.; Gilbert, D.; Gutiérrez, D.; Isensee, K.; et al. Declining oxygen in the global ocean and coastal waters. Science 2018, 359, eaam7240. [Google Scholar] [CrossRef] [PubMed] [Green Version]
- Diaz, R.J.; Rosenberg, R. Spreading dead zones and consequences for marine ecosystems. Science 2008, 321, 926–929. [Google Scholar] [CrossRef] [PubMed]
- Grantham, B.A.; Chan, F.; Nielsen, K.J.; Fox, D.S.; Barth, J.A.; Huyer, A.; Lubchenco, J.; Menge, B.A. Upwelling-driven nearshore hypoxia signals ecosystem and oceanographic changes in the northeast Pacific. Nature 2004, 429, 749–754. [Google Scholar] [CrossRef] [PubMed]
- Schmidtko, S.; Stramma, L.; Visbeck, M. Decline in global oceanic oxygen content during the past five decades. Nature 2017, 542, 335–339. [Google Scholar] [CrossRef]
- Long, A.M.; Chen, S.Y.; Zhou, W.H.; Xu, J.R.; Sun, C.C.; Zhang, F.Q. Distribution of Macro-nutrients, Dissolved Oxygen, pH and Chl a and their Relationships in Northern South China Sea. Mar. Sci. Bull. 2006, 5, 9–16. [Google Scholar]
- Ma, H.Y.; Wang, L.S.; Wu, M.L.; Zheng, A.R. Characteristics of potential hypoxic zone and its influencing factors in the northern Beibu Gulf. Mar. Sci. 2020, 44, 29–37. [Google Scholar]
- Yi, Z.H.; Wang, D.X.; Qiu, C.H.; Mao, H.B.; Yu, J.C.; Lian, S.M. Variations in Dissolved Oxygen Induced by a Tropical Storm Within an Anticyclone in the Northern South China Sea. J. Ocean Univ. China 2022, 21, 1084–1098. [Google Scholar] [CrossRef]
- Su, Z.; Yu, D.W.; Huang, L.; Cheng, A.Z. The geographical environment of the coastal zone of the Beibu Gulf and its influence on climate. J. Meteorol. Res. Appl. 2009, 30, 44–47. [Google Scholar]
- Lai, J.X.; Jiang, F.J.; Ke, K.; Xu, M.B.; Lei, F.; Chen, B. Nutrients distribution and trophic status assessment in the northern Beibu Gulf, China. Chin. J. Oceanol. Limnol. 2014, 32, 1128–1144. [Google Scholar] [CrossRef]
- Lao, Q.B.; Su, Q.Z.; Liu, G.Q.; Shen, Y.L.; Chen, F.J.; Lei, X.T.; Qing, S.M.; Wei, C.L.; Zhang, C.H.; Gao, J.S. Spatial distribution of and historical changes in heavy metals in the surface seawater and sediments of the Beibu Gulf, China. Mar. Pollut. Bull. 2019, 146, 427–434. [Google Scholar] [CrossRef]
- Yang, J.; Wen, S.C.; Han, B.X. Environmental Carrying Capacity of Coastal Zone in Beibu Gulf Economic Zone; China Ocean University Press: China, Qingdao, 2017. [Google Scholar]
- Li, W.; Yu, W.L.; Gao, F. Environmental Impact Assessment of Guangxi Beibu Gulf Economic Zone Development Planning; Science Press: China, Beijing, 2009. [Google Scholar]
- Tao, X.P.; Wu, M.; Liu, X.; Lei, F.; He, X.L. Investigation and analysis of water quality pollution in Beibu Gulf of Guangxi. Guangxi Sci. 2022, 29, 532–540. [Google Scholar]
- Su, Q.Z.; Lei, X.T.; Liu, G.Q.; Sun, Y.; Lao, Q.B.; Sun, T.L. Analysis of Red tide disaster characteristics in Beibu Gulf coastal area of Guangxi in recent 20 years. Guangxi Sci. 2022, 29, 552–557. [Google Scholar]
- Third Institute of Oceanography. Specification for Marine Investigations—Part 4: Investigation of the Chemical Elements of Seawater; The General Administration of Quality Supervision, Inspection and Quarantine of the PRC; Standardization Administration of China: China, Beijing, 2007; 76p. [Google Scholar]
- Ma, C.F.; Tian, R. The oxygen saturation of seawater and Weiss Equation. Ocean Technol. 2002, 1, 22–26. [Google Scholar]
- Xia, B.X.; Ning, X.X.; Yang, L.N.; Qu, L. Some problems in calculation of dissolved oxygen pollution index of seawater are discussed. Environ. Pollut. Control 2013, 35, 107–109. [Google Scholar]
- Cai, X.P.; Wei, N.; Mu, Q.L.; Wang, Y.M.; Ren, S.J.; He, S.Q. Distribution and influencing factors of surface dissolved oxygen saturation in coastal waters of Zhejiang in spring. Environ. Monit. China 2015, 31, 140–144. [Google Scholar]
- Li, K.H.; Yang, J.R.; Robinson, D.; Ma, J.; Ma, Z.J. An agglomerative hierarchical clustering-based strategy using Shared Nearest Neighbours and multiple dissimilarity measures to identify typical daily electricity usage profiles of university library buildings. Energy 2019, 174, 735–748. [Google Scholar] [CrossRef]
- GB 3097-1997; Seawater Quality Standard. National Environmental Protection Agency. State Oceanic Administration: China, Beijing, 1997.
- Yang, C.; Fu, Y.Y.; Yang, Y.M.; Li, W.W. Evaluation of dissolved oxygen and its influencing factors in Qinhuangdao Bathing Beach. Sci. Technol. Innov. 2021, 25, 70–72. [Google Scholar]
- Li, Z.Q.; Li, X.; Sun, L.Y.; Liu, Z.Z.; Gu, Y.Z.; Zhai, F.G.; Li, P.L. Analysis of dissolved oxygen concentration in bottom seawater of Dagu Estuary Periodical of Ocean University of China. Period. Ocean Univ. China 2019, 49, 23–33. [Google Scholar]
- Weiss, R.F. The solubility of nitrogen, oxygen and argon in water and seawater. Deep Sea Res. Oceanogr. Abstr. 1970, 17, 721–735. [Google Scholar] [CrossRef]
- Ermal, X.; Shkelqim, S. The behavior and effects of oil pollution into marine environment and ocean. Pomorstvo 2010, 24, 19–25. [Google Scholar]
- Wang, J.P. Harm of Marine oil pollution and countermeasures. Technol. Mark. 2014, 21, 129–130, 132. [Google Scholar]
- Roger, C.P.; Robert, M.G.; Richard, E.B.; Matthew, J.G.; Todd, T.; Joseph, M.S.; Kenneth, L.; Edward, H.O.; Gary, A.S.; Joan, F.B.; et al. The Roles of Photooxidation and Biodegradation in Long-term Weathering of Crude and Heavy Fuel Oils. Spill Sci. Technol. Bull. 2003, 8, 145–156. [Google Scholar]
- Sun, Y.; Shen, Y.L.; Shi, H.Y.; Liu, G.Q. Spatio-temporal variation and driving factors of water quality in Tieshan Port based on principal component analysis. Ocean Technol. 2022, 41, 30–36. [Google Scholar]
- Zhao, F.; Yu, H.X.; Sun, X. Effects of oil pollution on Marine phytoplankton and zooplankton. Sci. Technol. Innov. 2020, 24, 171–172. [Google Scholar]
- Song, H.; Chai, Y.H.; Liu, S.N.; Zhou, W.L. Bioremediation and microbial degradation of Marine oil pollution. Jiangxi Aquat. Sci. Technol. 2019, 1, 40, 48. [Google Scholar]
- Chen, Z.X.; Wang, W.Y. Mechanism and control of water quality factors affecting fish growth. Anim. Husb. Feed Sci. 2009, 30, 15–17. [Google Scholar]
- Huang, S. Source, Distribution, Decomposition and Environmental Effects of Particulate Organic Matter in Red Tide Areas of the East China Sea. Ph.D. Thesis, Ocean University of China, China, Qingdao, 2012. [Google Scholar]
- Lu, Y.; Li, H.L.; Chen, J.F.; Jing, H.Y.; Chen, F.J.; Gao, S.Q.; Wang, Q.; Wang, W.L.; Bai, Y.C. Seasonal variation and characteristics of dissolved oxygen saturation in surface water of Yangtze River Estuary and adjacent sea areas. J. Mar. Sci. 2011, 29, 71–77. [Google Scholar]
- Gong, S.B.; Gao, A.G.; Ni, G.T.; Zhu, X.X.; Zhang, Y.P.; Hou, Y.T. Study on anoxic phenomena in some estuaries and their offshore waters in China. Water Resour. Prot. 2017, 33, 62–69. [Google Scholar]
- Gao, X.L.; Song, J.M.; Li, X.G.; Long, A.M.; Chen, S.Y. Research progress and key influencing factors of offshore carbon cycle in China. Mar. Sci. 2008, 3, 83–90. [Google Scholar]
- Shi, X.Y.; Lu, R.; Zhang, C.S.; Wang, X.L. Distribution characteristics and main influencing factors of dissolved oxygen in the adjacent waters of Yangtze River Estuary. Period. Ocean Univ. China 2006, 2, 287–290, 294. [Google Scholar]
- Yu, Z.; Zhang, Y.; Jiang, M.X.; Xiong, Z.H.; Chen, H. Effect of salinity on dissolved oxygen. Sci. Consult. 2014, 3, 39–40. [Google Scholar]
- Sun, Y.; Lu, F.H.; Chen, Z.; Diao, X.Y.; Jiang, J.G.; Wei, C.J.; Pan, J. Spatial and temporal distribution of dissolved oxygen and its influencing factors in the waters near the Yangtze River Estuary. Mar. Sci. 2021, 45, 86–96. [Google Scholar]
- Lan, W.L.; Peng, X.Y. Variation characteristics of nutrient salts in Tieshangang Bay from 2003 to 2010. Guangxi Sci. 2011, 18, 380–384, 391. [Google Scholar]
- Shi, H.Y.; Zhao, H.; Sun, D. Distribution characteristics and influencing factors of chlorophyll a in phytoplankton in the northern Beibu Gulf in spring 2021. J. Guangdong Ocean Univ. 2022, 42, 62–71. [Google Scholar]
- Wen, Y.J.; Xu, Z.X.; Li, H.L.; Lei, F.; Xie, H.D.; Wu, M. Study on nutrient salt and eutrophication status in offshore waters of Beibu Gulf of Guangxi. Guangxi Sci. 2022, 29, 541–551. [Google Scholar]
- Zeng, D.N.; Niu, L.X.; Tao, W.; Fu, L.X.; Yang, Q.S. Nutrient distribution and eutrophication evaluation in the Pearl River Estuary in summer. J. Guangdong Ocean Univ. 2020, 40, 73–82. [Google Scholar]
- Xie, W.Z. Review of the General Annals of Guangxi—Physical Geography Annals of Guangxi. Local Chron. Guangxi 1995, 5, 50–51. [Google Scholar]
- Huang, X.S.; Chen, Z.M.; Pang, S.J.; Liang, Y.Z.; Tang, L.; Huang, Y.Y.; Guo, L.L. Environmental problems and countermeasures in offshore waters of Guangxi Beibu Gulf. Pop. Sci. Technol. 2018, 20, 29–32. [Google Scholar]
Figure 1.
Study region and Buoy location map in Beibu Gulf.

Figure 2.
Spatial distribution of water quality and environmental factors in Beibu Gulf in April 2021.
Figure 2.
Spatial distribution of water quality and environmental factors in Beibu Gulf in April 2021.

Figure 3.
April Dissolved Oxygen Saturation in Beibu Gulf.

Figure 4.
Dendrogram of agglomerative hierarchical cluster analysis (a) and the partition map of cluster analysis results (b) of Beibu Gulf research area.
Figure 4.
Dendrogram of agglomerative hierarchical cluster analysis (a) and the partition map of cluster analysis results (b) of Beibu Gulf research area.


Table 1.
Partial correlation coefficient between DO and each index.
| Region | Station | Factor | Temp | S | pH | Turb | Chl |
|---|---|---|---|---|---|---|---|
| Group A | GX01 | ||||||
| GX02 | R | −0.450 | −0.353 | 0.641 | 0.112 | 0.411 | |
| GX04 | P | 0.000 *** | 0.000 *** | 0.000 *** | 0.180 * | 0.000 *** | |
| GX05 | |||||||
| GX06 | |||||||
| Group B | GX03 | R | 0.081 | −0.540 | 0.170 | −0.686 | 0.582 |
| GX12 | P | 0.459 | 0.000 *** | 0.117 | 0.000 *** | 0.000 *** | |
| GX13 | |||||||
| Group C | GX11 | R | −0.453 | −0.739 | 0.824 | −0.522 | 0.467 |
| GX15 | P | 0.020 * | 0.000 *** | 0.000 *** | 0.003 ** | 0.016 * | |
| Group D | GX07 | ||||||
| GX08 | R | −0.388 | −0.539 | 0.465 | −0.434 | 0.167 | |
| GX09 | P | 0.000 *** | 0.000 *** | 0.000 *** | 0.000 *** | 0.048 * | |
| GX10 | |||||||
| GX14 |
Note: Temp: Water temperature; S: Salinity; Turb: Turbidity; R is the partial correlation coefficient; p is the significance level (unrelated probability); p < 0.05 is a significant correlation; * p ≤ 0.05, ** p ≤ 0.01, *** p ≤ 0.001.
Table 2.
Multiple linear regression analysis of each partition.
| Partition | Station | R2 | F | Variable | B | Std.Error | Beta | t | Sig |
|---|---|---|---|---|---|---|---|---|---|
| Group A | GX01 GX02 GX04 GX05 GX06 | 0.550 | 44.265 | pH | 2.876 | 0.287 | 0.945 | 10.009 | 0.000 |
| Temp | −0.117 | −0.018 | −0.390 | −6.378 | 0.000 | ||||
| Chl-a | 0.098 | 0.019 | 0.310 | 5.283 | 0.000 | ||||
| S | −0.039 | 0.008 | −0.458 | −4.697 | 0.000 | ||||
| Group B | GX03 GX12 GX13 | 0.630 | 48.834 | Chl-a | 0.392 | 0.060 | 0.475 | 6.503 | 0.000 |
| Turb | −0.266 | 0.029 | −0.659 | −9.306 | 0.000 | ||||
| S | −0.204 | 0.036 | −0.423 | −5.727 | 0.000 | ||||
| Group C | GX11 GX15 | 0.963 | 284.770 | pH | 1.905 | 0.253 | 0.642 | 7.545 | 0.000 |
| Temp | −0.176 | 0.031 | −0.214 | −5.655 | 0.000 | ||||
| Chl-a | 0.103 | 0.023 | 0.371 | 4.419 | 0.000 | ||||
| Turb | −0.048 | 0.014 | −0.098 | −3.403 | 0.001 | ||||
| S | −0.049 | 0.015 | −0.111 | −3.202 | 0.002 | ||||
| Group D | GX07 GX08 GX09 GX10 GX14 | 0.553 | 33.698 | Temp | −0.089 | 0.020 | −0.275 | −4.524 | 0.000 |
| S | −0.146 | 0.019 | −0.476 | −7.710 | 0.000 | ||||
| pH | 2.336 | 0.380 | 0.364 | 6.141 | 0.000 | ||||
| Turb | −0.024 | 0.004 | −0.370 | −6.037 | 0.000 | ||||
| Chl-a | 0.027 | 0.012 | 0.137 | 2.308 | 0.023 |
Note: Temp: Water temperature; S: Salinity; Turb: Turbidity; The dependent variable is DO; B means partial regression coefficient; and Beta means standardized partial regression coefficient.
Disclaimer/Publisher’s Note: The statements, opinions and data contained in all publications are solely those of the individual author(s) and contributor(s) and not of MDPI and/or the editor(s). MDPI and/or the editor(s) disclaim responsibility for any injury to people or property resulting from any ideas, methods, instructions or products referred to in the content. |
© 2023 by the authors. Licensee MDPI, Basel, Switzerland. This article is an open access article distributed under the terms and conditions of the Creative Commons Attribution (CC BY) license (https://creativecommons.org/licenses/by/4.0/).
Share and Cite
MDPI and ACS Style
Zheng, Q.; Zhao, H.; Shi, Y.; Duan, M. Distribution Characteristics of Dissolved Oxygen in Spring in the Northern Coastal Beibu Gulf, a Typical Subtropical Bay. Water 2023, 15, 970. https://doi.org/10.3390/w15050970
AMA Style
Zheng Q, Zhao H, Shi Y, Duan M. Distribution Characteristics of Dissolved Oxygen in Spring in the Northern Coastal Beibu Gulf, a Typical Subtropical Bay. Water. 2023; 15(5):970. https://doi.org/10.3390/w15050970
Chicago/Turabian StyleZheng, Qiwen, Hui Zhao, Yuzhen Shi, and Meina Duan. 2023. "Distribution Characteristics of Dissolved Oxygen in Spring in the Northern Coastal Beibu Gulf, a Typical Subtropical Bay" Water 15, no. 5: 970. https://doi.org/10.3390/w15050970
Note that from the first issue of 2016, this journal uses article numbers instead of page numbers. See further details here.