
Response Surface Modelling of Methylene Blue Adsorption onto Seaweed, Coconut Shell and Oak Wood Hydrochars

School of Chemical and Process Engineering, University of Leeds, LS2 9JT, UK
*
Author to whom correspondence should be addressed.
Water 2023, 15(5), 977; https://doi.org/10.3390/w15050977
Submission received: 29 January 2023
/
Revised: 23 February 2023
/
Accepted: 28 February 2023
/
Published: 3 March 2023
(This article belongs to the Special Issue Advances in Wastewater Treatment: Adsorption Mechanism, Isotherms, Kinetics and Reusability)
Abstract
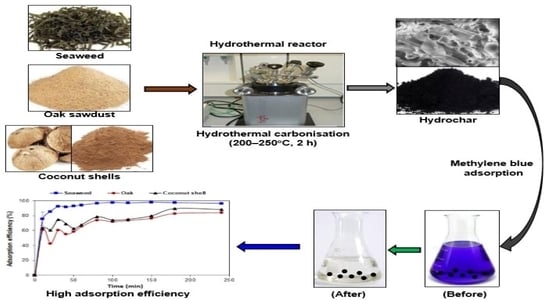
:Adsorption of methylene blue (MB) dye from an aqueous solution onto hydrochars produced from brown seaweed (Fucus Serratus) (FS-HC), coconut shell (CS-HC), and oak wood (Oak-HC) at different temperatures (200–250 °C) was investigated in a batch system. Response surface modelling (RSM) was used to investigate the effect of initial MB concentration (50–300 mg/L), contact time (0–240 min), and solution pH (2–12) on the adsorption process. RSM was also used to model and optimise these parameters for efficient adsorption. Kinetic and isotherms studies were carried out to study the adsorption mechanism onto the hydrochars. It was found that the best adsorbent from the RSM model was FS-HC200, and the optimal conditions for greater MB dye uptake were lower initial MB concentration (50 mg/L), pH 6 and contact time of 84 min; removing >99% of MB. Langmuir and Redlich–Peterson isotherm models fitted the adsorption of MB onto hydrochars prepared at 200 and 250 °C. Freundlich and Redlich–Peterson isotherms were suitable for hydrochars produced at 220 °C. FS-HCs have the highest maximum adsorption capacity of MB of about (8.60–28.57) mg/g calculated from the Langmuir isotherm. The adsorption process for all the hydrochars followed a pseudo-second-order model (R2 = 0.96–1.00), and film diffusion and intraparticle diffusion were the rate-determining steps. Therefore, this work identifies cheap adsorbents from biowaste that are effective for the removal of cationic pollutants from wastewater.
1. Introduction
The presence of dyes in industrial effluent is a problem for various industries such as textiles, leather and tanning, plastics, and printing [1,2]. About 2% of the dyes used in industry are being released unnoticeably into aqueous effluent. Small amounts of dyes (even as little as 1 ppm for some dyes) are highly visible and influence the public perception of water quality [3]. Methylene blue can be toxic to humans by causing skin and eye irritation, confusion, and breathing difficulties [3]. In addition, dyes and their metabolites can be toxic and carcinogenic, and thus can be harmful to humans, the environment, and aquatic life [1,4]. Hence, it is essential that dyes are removed from wastewater to an acceptable concentration to meet the stringent restrictions on the organic content of industrial effluent. However, the treatment of dyes in wastewater can be difficult, as they are resistant to aerobic digestion and stable to oxidising agents as well as heat and light [1]. Therefore, to remove dyes from industrial wastewater, an efficient, environmentally friendly, and inexpensive method is needed.
Several techniques are being used for the treatment of dyes in wastewater, namely chemical oxidation, coagulation, photochemical degradation, ion exchange, membrane techniques, biological degradation, and adsorption [4,5,6,7]. Adsorption is an equilibrium separation process and is the most widely used approach for the removal of dyes due to its simplicity, flexibility, high efficiency, and environmental friendliness [1,8]. Activated carbon is the most commonly used adsorbent for the treatment of wastewater containing dyes due to its affinity for various compounds, chemical stability, large specific surface area, and ability to be regenerated. However, activated carbon requires high temperatures of up to 1000 °C for its production and is thus expensive to produce [7]. Biochar is the solid product from pyrolysis reactions and has also been used for the removal of dyes from wastewater and can be thought of as carbon before the activation stage [9,10,11,12,13]. Biochar is produced at moderate to high temperatures (above 500 °C), resulting in a lower surface area in comparison to activated carbon. However, the surface functionality of biochar is high compared to activated carbon. This reduced surface area limits and the amount of pollutants that can be removed, and thus coupled with the lower solids yield and high processing costs, limits its large-scale application [2,14].
An alternative adsorbent called “hydrochar” has recently gained more attention as a cheap and efficient adsorbent for the treatment of pollutants in wastewater. Hydrochar is the solid product produced by a process called hydrothermal carbonisation (HTC) and requires moderate temperatures, up to 250 °C compared to pyrolysis. Hydrochar has a lower surface area and higher surface functionality, compared to biochar and activated carbon, hence their mechanism of adsorption is usually different. Hydrochar is produced in hot compressed liquid water, which results in partial demineralisation of the ash from the biomass [15]. The Brunauer-Emmett-Teller (BET) surface area is significantly higher for biochar than for hydrochar, although the hydrochar has higher H/C–O/C ratios than biochar [15], due to the presence of higher levels of surface oxygenated functional groups [16], which can aid in the adsorption of pollutants. Biochar is composed of turbo-strategically arranged graphite-like layers [17], while hydrochar has spherically shaped carbonaceous nanoparticles on the surface [15].
There are several reported studies focused on the removal of dyes using hydrochars. For instance, Martin et al. [18] utilised hydrochars derived from sewage sludge for the removal of basic red 46 dye. Bamboo hydrochars have been used for the adsorption of Congo red, 2-napththol, methylene blue (MB) and methyl orange [19,20,21]. Adsorption of MB onto hydrochars from different feedstock with and without post activation has been reportedfrom the HTC of pistachio (NaOH activated) [22], coffee husk (KOH activated) [23], orange peel [24], and bamboo-PVC [25]. In addition to dyes, adsorption of other organic pollutants using hydrochars derived from sewage sludge and swine manure has also been reported [9,26,27]. However, there is limited knowledge in the literature on the optimisation of adsorption parameters for dye removal compared with the adsorption of heavy metals. For example, a modelling approach to predict the removal of arsenic by zero-valent iron has shown that the As(V) adsorption rate is faster than that of As(III), which was affected by the available mass of Fe(III) in the system [28]. Some studies have also reported the interaction effects of the reaction conditions. For instance, Maamoun et al. [29] found a reciprocal relationship between residence time, barrier thickness, and hydraulic conductivity for the removal of Cr(VI) from groundwater using bimetallic nanoscale zero valent iron (nFe°/Cu) in a permeable reactive barrier. Eljamal et al. [30] observed that the most significant parameters towards the change in boron removal efficiency were adsorbent dosage and the initial pH of the solution. However, these studies are not hydrochars, hence, a more comprehensive study into the adsorption of MB onto different hydrochars is required to identify the interaction between the hydrochars and the adsorption conditions.
It has been reported that the type of feedstock impacts the adsorption characteristics of the produced hydrochar. Hydrochars produced from egg shell, lemon peel, rice husk, coconut peat, and coconut shell at 200 °C for 20 h were found to have different BET surface areas [31]. In addition, HTC conditions affect the adsorption properties of the hydrochars. Elaigwu and Greenway [32] studied the microwave-assisted HTC of coconut shell at temperatures between 150–200 °C and reaction times from 5–30 min and reported that HTC improved the chemical and structural composition of the hydrochars. However, it was found that the formation of tarry substances contaminate the hydrochars by blocking the pores, leading to a decrease in the BET surface area. A previous study on the physicochemical adsorbent characteristics of hydrochars derived from seaweed, coconut shell, and oak wood at different reaction temperatures revealed that the hydrochars have varying surface functionalities and BET surface areas, which were influenced by the HTC temperature. The surface areas generally increased with a rise in temperature, however, the surface functional groups were reduced [33]. Similarly, Saha et al. [34] reported that orange peel and grape skin-derived hydrochars produced at a lower temperature (180 °C) have higher adsorption capacity for methylene blue due to their maximum density of oxygen functional groups, even though they have low BET surface areas.
The findings from the previous studies suggest that modelling and optimisation of the HTC and adsorption conditions would be useful in developing hydrochars with a higher adsorption capacity as well as understanding the influence of these conditions on adsorption kinetics. This would also help in the development of large-scale adsorption systems for MB dye removal from industrial effluents. These are among the challenging tasks that need further investigation. There is also a knowledge gap in our understanding of how the characteristics of different hydrochars affect adsorption mechanisms. Knowledge of the adsorption of MB and dyes using hydrochars derived from brown seaweed (Fucus Serratus), coconut shell, and oak wood sawdust is limited in the literature.
In this study, three distinctive feedstocks: a brown seaweed (Fucus Serratus) (FS), coconut shell (CS), and oak wood sawdust (Oak) were carbonised to produce hydrochars for the adsorption of MB, a cationic dye, from aqueous solutions. These feedstocks are readily available biomass sources. For example, oak wood-derived wastes are produced from sawmills and the furniture industry. It has been estimated that nearly 61.5 million metric tons of coconut are produced yearly worldwide, generating about 18 million tons of waste coconut shells [35,36]. Seaweed is an abundant marine biomass resource found in temperate coastal regions [37], and can also be cultivated on many coastlines without competing with agricultural lands. Brown seaweed includes wracks and kelps, and have a more complex composition than lignocellulosic biomass, containing different carbohydrates such as laminarin, alginates, mannitol, and sulphated fucoidan as well as high contents of polyphenols, protein, and ash [38,39]. Coconut shells and oak wood are lignocellulosic biomasses; however, their biochemical composition differs, resulting in different hydrochar characteristics. Coconut shells are rich in cellulose [33] that breaks down above 220 °C due to its crystalline structure [40], and also contains a higher lignin content than oak wood, which decomposes at higher temperatures above 250 °C due to its more stable phenolic structure [41,42].
In this study, the effect of HTC temperature on sorption characteristics has been investigated to increase the understanding of how the hydrochars of FS, CS, and Oak interact with MB adsorption. The effect of adsorption conditions, namely pH, contact time, and initial dye concentration, have been investigated, and the optimal conditions have been modelled using a response surface methodology (RSM) through a central composite design (CCD). The underlying mechanism of the sorption of MB onto the hydrochars has been investigated through adsorption kinetics and isotherms.
2. Materials and Methods
2.1. Raw Materials
The sample of brown seaweed (F. Serratus) was collected by hand at a coastal area near Aberystwyth, UK. The samples were first frozen and then freeze dried. The coconut shell was obtained after deshelling whole coconut purchased at the local supermarket in Leeds, UK. The oak wood was collected from Holm Oak trees. Details of sample preparations have been reported in a previous study [26]. The MB dye (pure certified, 82% min dye content), sodium hydroxide (NaOH), and hydrochloric acid (HCl) were supplied by Fisher Scientific UK Ltd. (Loughborough, Leicestershire, UK).
2.2. Production of Hydrochars
About 192 g of the biomass was mixed with 798 mL of distilled water in a 2-litre batch autoclave (Parr USA) in a quartz glass insert to obtain about 20% solid loading (i.e., the biomass-to-water ratio of about 1:4 w/v). HTC was conducted by heating the biomass–water mixture in the sealed autoclave at three different temperatures of 200, 220, and 250 °C for a residence time of 2 h. After the completion of each run, the reactor was allowed to cool to room temperature, the vapour phase was vented in a fume cupboard, the carbonised solids were filtered to separate the hydrochar from the liquid byproduct, and the hydrochar was then allowed to dry at room temperature for 2 days. This process was repeated for each biomass feedstock. Details of the HTC process are available in a previous study [26]. The hydrochars were classified according to the HTC temperature as follows: FS-HC200, FS-HC220, and FS-HC250 for the FS hydrochars (FS-HC); CS-HC200, CS-HC220, and CS-HC250 for the CS hydrochars (CS-HC); and Oak-HC200, Oak-HC220, and Oak-HC250 for the oak hydrochars (Oak-HC).
The physicochemical adsorbent properties of the hydrochars utilised in this present work have been reported in a previous study [33].
2.3. Batch Adsorption Experiments
Batch adsorption experiments were conducted by agitating 1.0 g of the adsorbents in a 100 mL MB dye solution using a laboratory orbital shaker (Orbital Shaker SSL1, Stuart Scientific, Nottingham, Nottinghamshire, UK) at 150 rpm for 30 min unless stated otherwise. The concentration of the MB dye in the following solution was analysed using a UV-Vis Spectrophotometer (GENESYS 10S, Thermo Scientific, Loughborough, Leicestershire, UK) at a wavelength of 668 nm.
The effect of the initial MB dye concentration (50–300 mg/L) was investigated by maintaining the natural pH, which was about 3.75. The influence of pH (2–12) was studied using an initial MB concentration of 100 mg/L. The pH of the solutions was adjusted by adding either 0.1 M HCl or 0.1 M NaOH to obtain the desired initial pH. The effect of contact time (10–240 min) was investigated using 2.0 g of the adsorbents in a 200 mL solution, as samples had to be taken at specific time intervals during the adsorption process; hence, larger volumes of solutions were needed. Similarly, the pH of the solutions was not adjusted, maintaining the natural pH.
2.4. Response Surface Modelling and Optimisation
RSM by a CCD using Design Expert software v13 (StateEase) resulted in a total of 54 runs. The factors were coded low (−1) and high (+1), resulting in the following values: initial concentration 50 (low) to 300 mg/L (high) with a standard deviation of 20.74, HTC temperature 200 (low) to 250 °C (high) with a standard deviation of 86.19, pH 2.0 (low) to 12.0 (high) with a standard deviation of 3.45, and contact time 0 (low) to 240 min (high) with a standard deviation of (82.14).
2.5. Calculations
Adsorption capacity and efficiency
The MB uptake per gram of sorbent at equilibrium was determined by using Equation (1):
where is the equilibrium adsorption capacity (mg/g), m is the dry weight of the hydrochar (g), V is the volume of the aqueous MB dye solution (L), C0 is the initial concentration (mg/L) of the MB dye solution, Ce is the equilibrium concentration (mg/L), and is the adsorption capacity at time t and concentration Ct.
The removal efficiency of the MB dye in the aqueous solution was calculated as follows:
2.5.1. Adsorption Kinetics
The linear forms of the kinetic models in Equations (3)–(5) below were used in this study.
Pseudo First-Order Model
Pseudo Second-Order Model
where k2 (g/mg-min) is the pseudo second-order adsorption rate constant. A plot of vs. t should give a slope of and an intercept of .
Intraparticle Diffusion Model
where ki (mg/g-min1/2) is the intraparticle diffusion rate constant. A plot of vs. t1/2 should yield a slope of ki and an intercept of C.
2.5.2. Adsorption Isotherms
The adsorption mechanism was investigated by using the linear forms of the isotherms described below.
Freundlich Isotherm Model
The Freundlich isotherm equation is expressed in the linear form as
where KF is the relative adsorption capacity of the hydrochar (mg/g) and n is a constant related to adsorption intensity. A plot log () vs. log (Ce) would produce a slope of 1/n and an intercept of log (KF).
Langmuir Isotherm
The linear form of the Langmuir isotherm is written as:
where is the complete monolayer on the surface bound at high Ce (mg/g), and b is the Langmuir constant (L/mg). A plot of would produce a slope of and an intercept of .
A dimensionless equilibrium parameter, RL, was calculated using Equation (8):
where RL is the separation factor used to predict the efficiency of the adsorption process, i.e., the adsorption is irreversible when RL = 0, favourable when RL is between 0–1, linear when RL = 1, and unfavourable when RL > 1 [43].
Redlich–Peterson (R–P) Isotherm
The R–P isotherm equation is expressed in the linear form as:
where and bRP are the R–P constants and α is exponent, which lies between 1 and 0. A linear plot of vs. ln Ce would produce a slope of α and an intercept of . The constant values were tried to obtain the optimum line after which was calculated.
Akaike’s information criterion (AIC), which is a statistical tool was used to define the best isotherm model that represents the empirical data using Equation (10) as follows [44]:
where, SSE, N, and Np are the sum of square error, number of experimental data, and number of parameters in the model, respectively.
Sum of square error (SEE) can be obtained by using Equation (11) as follows [44]:
where, and represent the experimental adsorption capacity (mg/g) and computed adsorption capacity (mg/g) at a specific time t (min).
3. Results and Discussion
3.1. Effect of Initial Methylene Blue Concentration on Adsorption
3.1.1. Adsorption Capacity
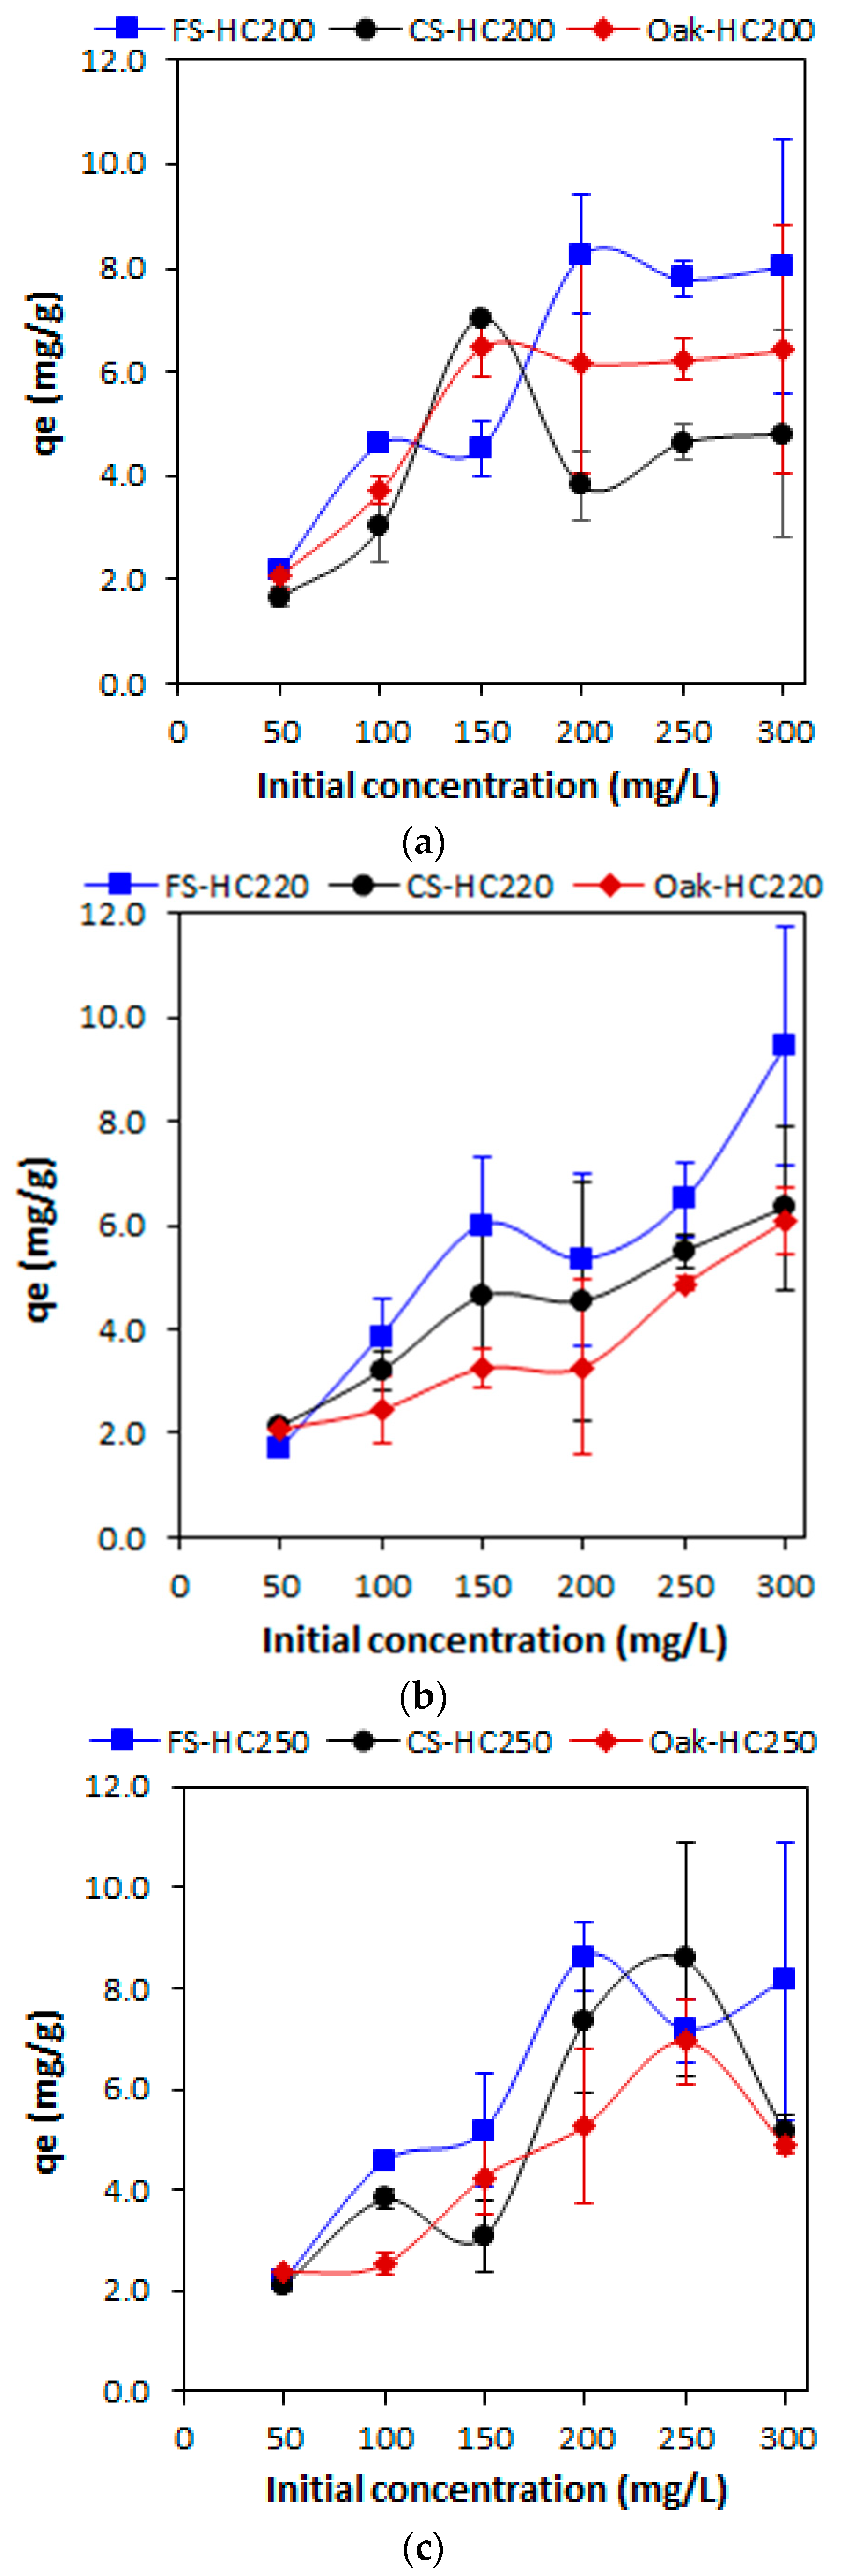
As indicated in Figure 1, the FS-HCs have the highest adsorption capacity over the range of MB concentrations used. The adsorption capacity of FS-HC220 (Figure 1b) increased as the initial MB concentration was increased from 50–300 mg/L, with the highest value of 9.43 mg/g being achieved at 300 mg/L. For FS-HC200 (Figure 1a), the maximum adsorption capacity (8.04 mg/g) was achieved at an initial MB concentration of 200 mg/L, which decreased when the concentration was increased and then remained constant. Similarly, the highest adsorption capacity for FS-HC250, shown in Figure 1c (8.63 mg/g), was obtained at an initial MB concentration of 200 mg/L, which was reduced slightly to 8.15 mg/g as the initial MB concentration was raised to 300 mg/L. In a previous study that looked into the physicochemical adsorbent characteristics of these hydrochars [33], it was found that the FS-HCs produced at HTC temperature of 200 °C have higher contents of volatile matter and fixed carbon. According to Martinez-Mendoza et al. [45], fixed carbon and volatile matter relate to porosity development in the hydrochars. The volatile matter is converted into gases or more carbon-rich products during HTC, leading to an increasing formation of porosity of the hydrochars as volatile matter is decreased [33]. Therefore, the FS-HC200 has a lower degree of porosity development, which was saturated at higher MB concentrations due to the limited active sites for adsorption at higher concentrations. For FS-HC250, the reduction in adsorption capacity at higher initial MB concentrations may be due to its high ash content as reported in the previous work [33]. High ash content is reported to block the micropores (<10 nm), creating inactive sites [45]. HTC temperature did not have a considerable effect on the adsorption capacity of FS-HCs, as a maximum of 8.05 mg/g was achieved at 200 °C (i.e., for FS-HC200) compared with 9.43 mg/g for FS-HC220 (i.e., HTC at 220 °C) and 8.63 mg/g for FS-HC250 (i.e., at HTC 250 °C).
For the CS-HC200, shown in Figure 1a, there was a rapid increase of adsorption capacity from 1.68 mg/g at MB concentration of 50.00 mg/L to approximately 7.04 mg/g at 150 mg/L MB concentration, and then reduced rapidly to 4.81 mg/g as the MB concentration was increased beyond 150 mg/L to 300 mg/L. The adsorption capacity of CS-HC220 (Figure 1b) increased between 2.11–6.33 mg/g as the initial MB concentration was raised from 50 to 300 mg/L. CS-HC250 had the highest adsorption capacity of 8.58 mg/g among the CS-HCs, which was achieved at the initial MB concentration of 250 mg/L (Figure 1c) and became saturated beyond this concentration. For CS-HCs, the increasing HTC temperature led to a marginal rise in the adsorption capacity of the hydrochars for each MB concentration. This may be caused by the decrease in volatile matter, resulting in improvements in BET surface area and porosity of the CS-HCs as the HTC temperature was increased, as reported in [33]. Again, it has been found that higher HTC temperatures lead to a decrease in the H/C and O/C atomic ratios, resulting in a decrease in the amount of oxygenated surface functional groups [33]. The marginal rise in the adsorption capacity of the CS-HCs produced at higher HTC temperatures is an indication that MB adsorption onto CS-HCs depends on both the adsorption sites and the Brunauer–Emmett–Teller (BET) surface area, and the amount of surface functional groups. This further explains the results of CS-HC200 (i.e., lower surface area), in which the maximum adsorption capacity was reached at 150 mg/L dye concentration (7.04. mg/g), but reduced to 4.81 mg/g as the MB dye concentration was increased to 300.00 mg/L.
The Oak-HCs have the lowest adsorption capacity compared with the other hydrochars over the concentration range. Like the FS-HCs and CS-HCs, the adsorption capacity increased marginally with the increasing dye concentration. However, increasing HTC temperature did not improve the adsorption capacity. Unlike the FS-HCs and CS-HCs, the highest average adsorption capacities were obtained for Oak-HC200, ranging from 2.10 to 6.50 mg/g with a rapid increase that remained almost constant after reaching the maximum adsorption capacity at 150 mg/L (Figure 1a), while Oak-HC220 have adsorption capacities between 2.08–6.08 mg/g over the concentration range. The adsorption capacities of Oak-HC250 increased almost linearly, achieving the highest value of 6.93 mg/g at 250 mg/L, though reduced to 4.86 mg/g when the initial MB concentration was increased. In the previous work, it was found that Oak-HCs produced at higher HTC temperatures have high levels of ash contents [33]. This might have been a contributing factor to Oak-HC220 and Oak-HC250 having lower adsorption capacities.
3.1.2. Removal Efficiency
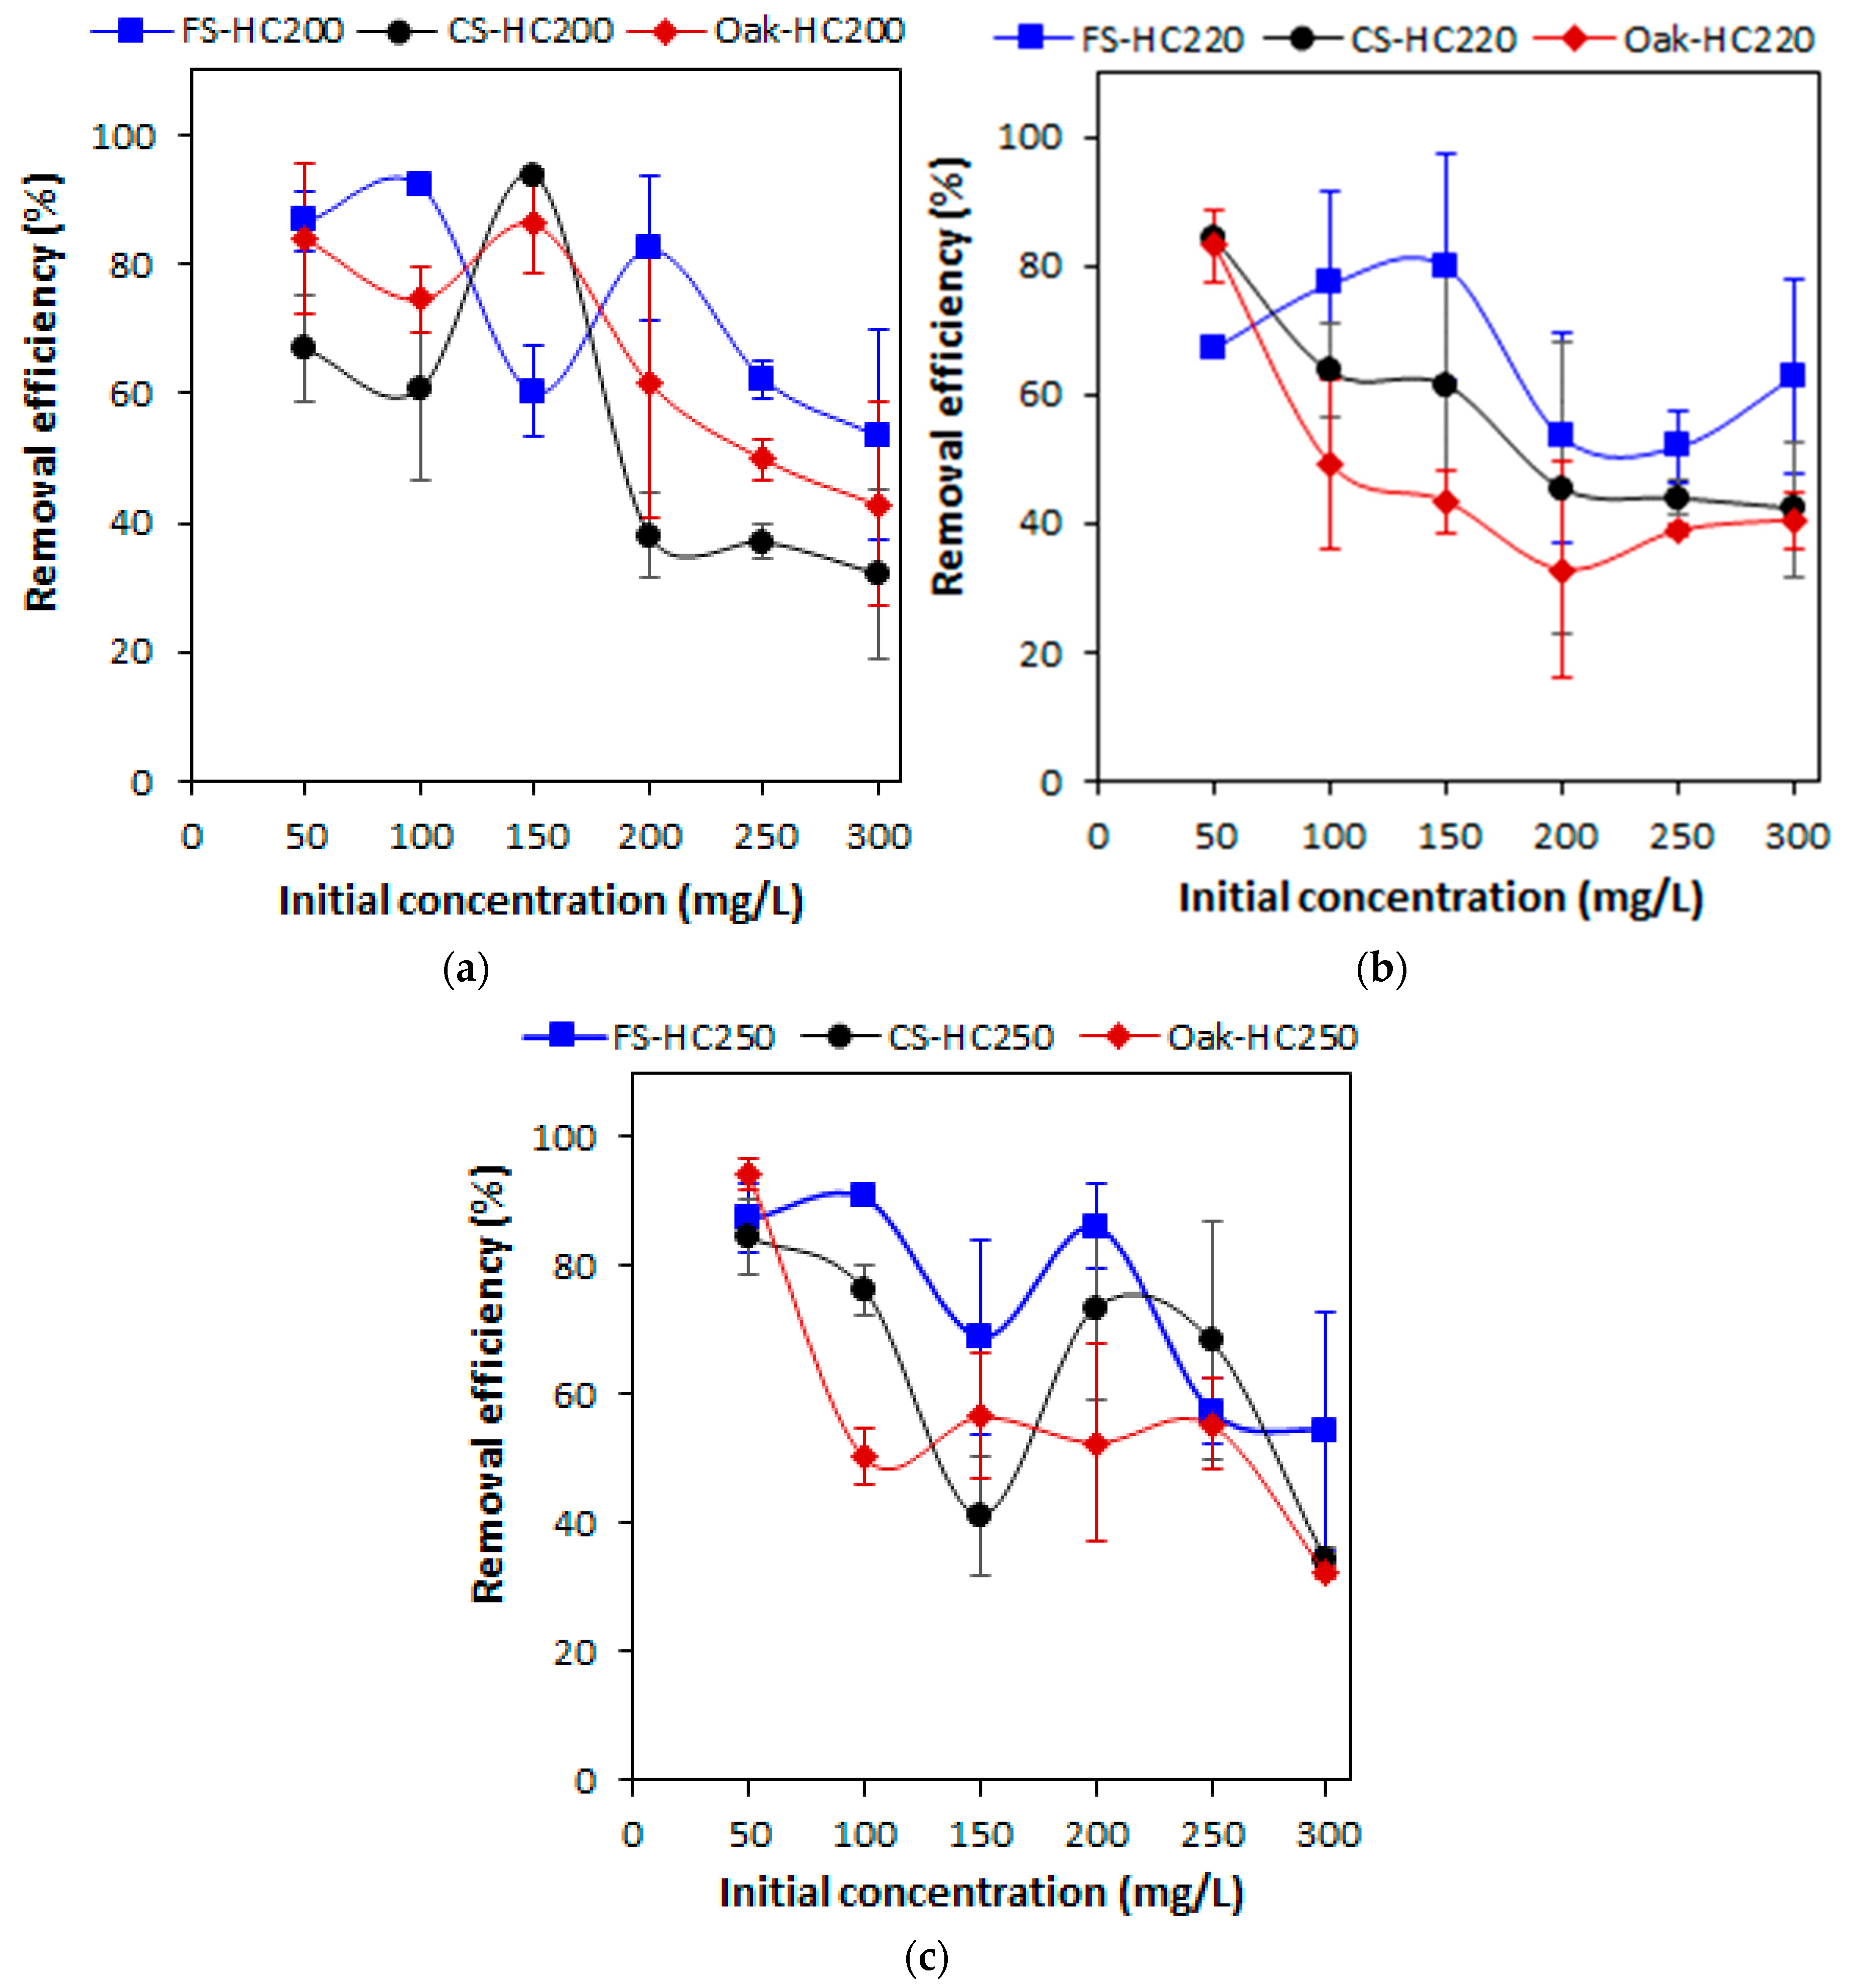
It can be seen from Figure 2 that adsorption onto FS-HCs, CS-HCs, and Oak-HCs depended on the initial MB concentration and that the best performing conditions were lower MB concentrations, with a decrease in MB removal efficiency as the MB concentration was increased. This dependence on the initial MB dye concentration can be attributed to three successive mass transport steps associated with the adsorption of solute from the solution by porous adsorbents [46]. The first step was the migration of the MB dye through the solution by film diffusion, followed by the movement of the MB dye from the surface of the particle into the interior site by pore diffusion, and finally, the MB dye was adsorbed into the active site in the interior of the hydrochars.
As shown in Figure 2a, at lower initial concentrations, the most effective hydrochar was Oak-HC250, removing 94.40% of the MB dye at 50 mg/L, which was followed by CS-HC200 and then FS-HC200, adsorbing 93.81% and 92.43% of the MB dye at 150 and 100 mg/L initial MB dye concentrations, respectively. The removal efficiency of CS-HC200 and Oak-HC200 reduced considerably when the initial MB dye concentration was increased beyond 150 mg/L, while FS-HC200 and Oak-250 showed a reduction in adsorption capacity after 200 and 50 mg/L respectively. The adsorbent best suited for the uptake of higher MB concentrations was FS-HC220, removing 62.89% (Figure 2b), which agrees with its highest adsorption capacity discussed earlier in Figure 1a. Tran et al. [23] obtained similar results in which the efficiencies of MB removal onto KOH-activated coffee husk hydrochar decreased from 99.66% to 83.13% as the initial concentrations of MB increased from 50–500 mg/L.
Like Figure 1, FS-HCs were, on average, the best-performing hydrochars. This is because the hydroxyl, sulphate, and carbonyl groups of the saccharides (e.g., mannitol) and sulphated polysaccharides (e.g., fucoidan, alginates, and laminarin) contained in F. Serratus are strong ion exchangers and are key sites for the complexation of cations [47], providing binding of the MB, which is a cationic dye. Although the higher HTC temperature caused an increase in the BET surface areas of the hydrochars, the reduction of the carboxylic functional groups at higher HTC temperatures [33] contributed to the decrease in adsorption capacity and removal efficiency of FS-HC220 and FS-HC250.
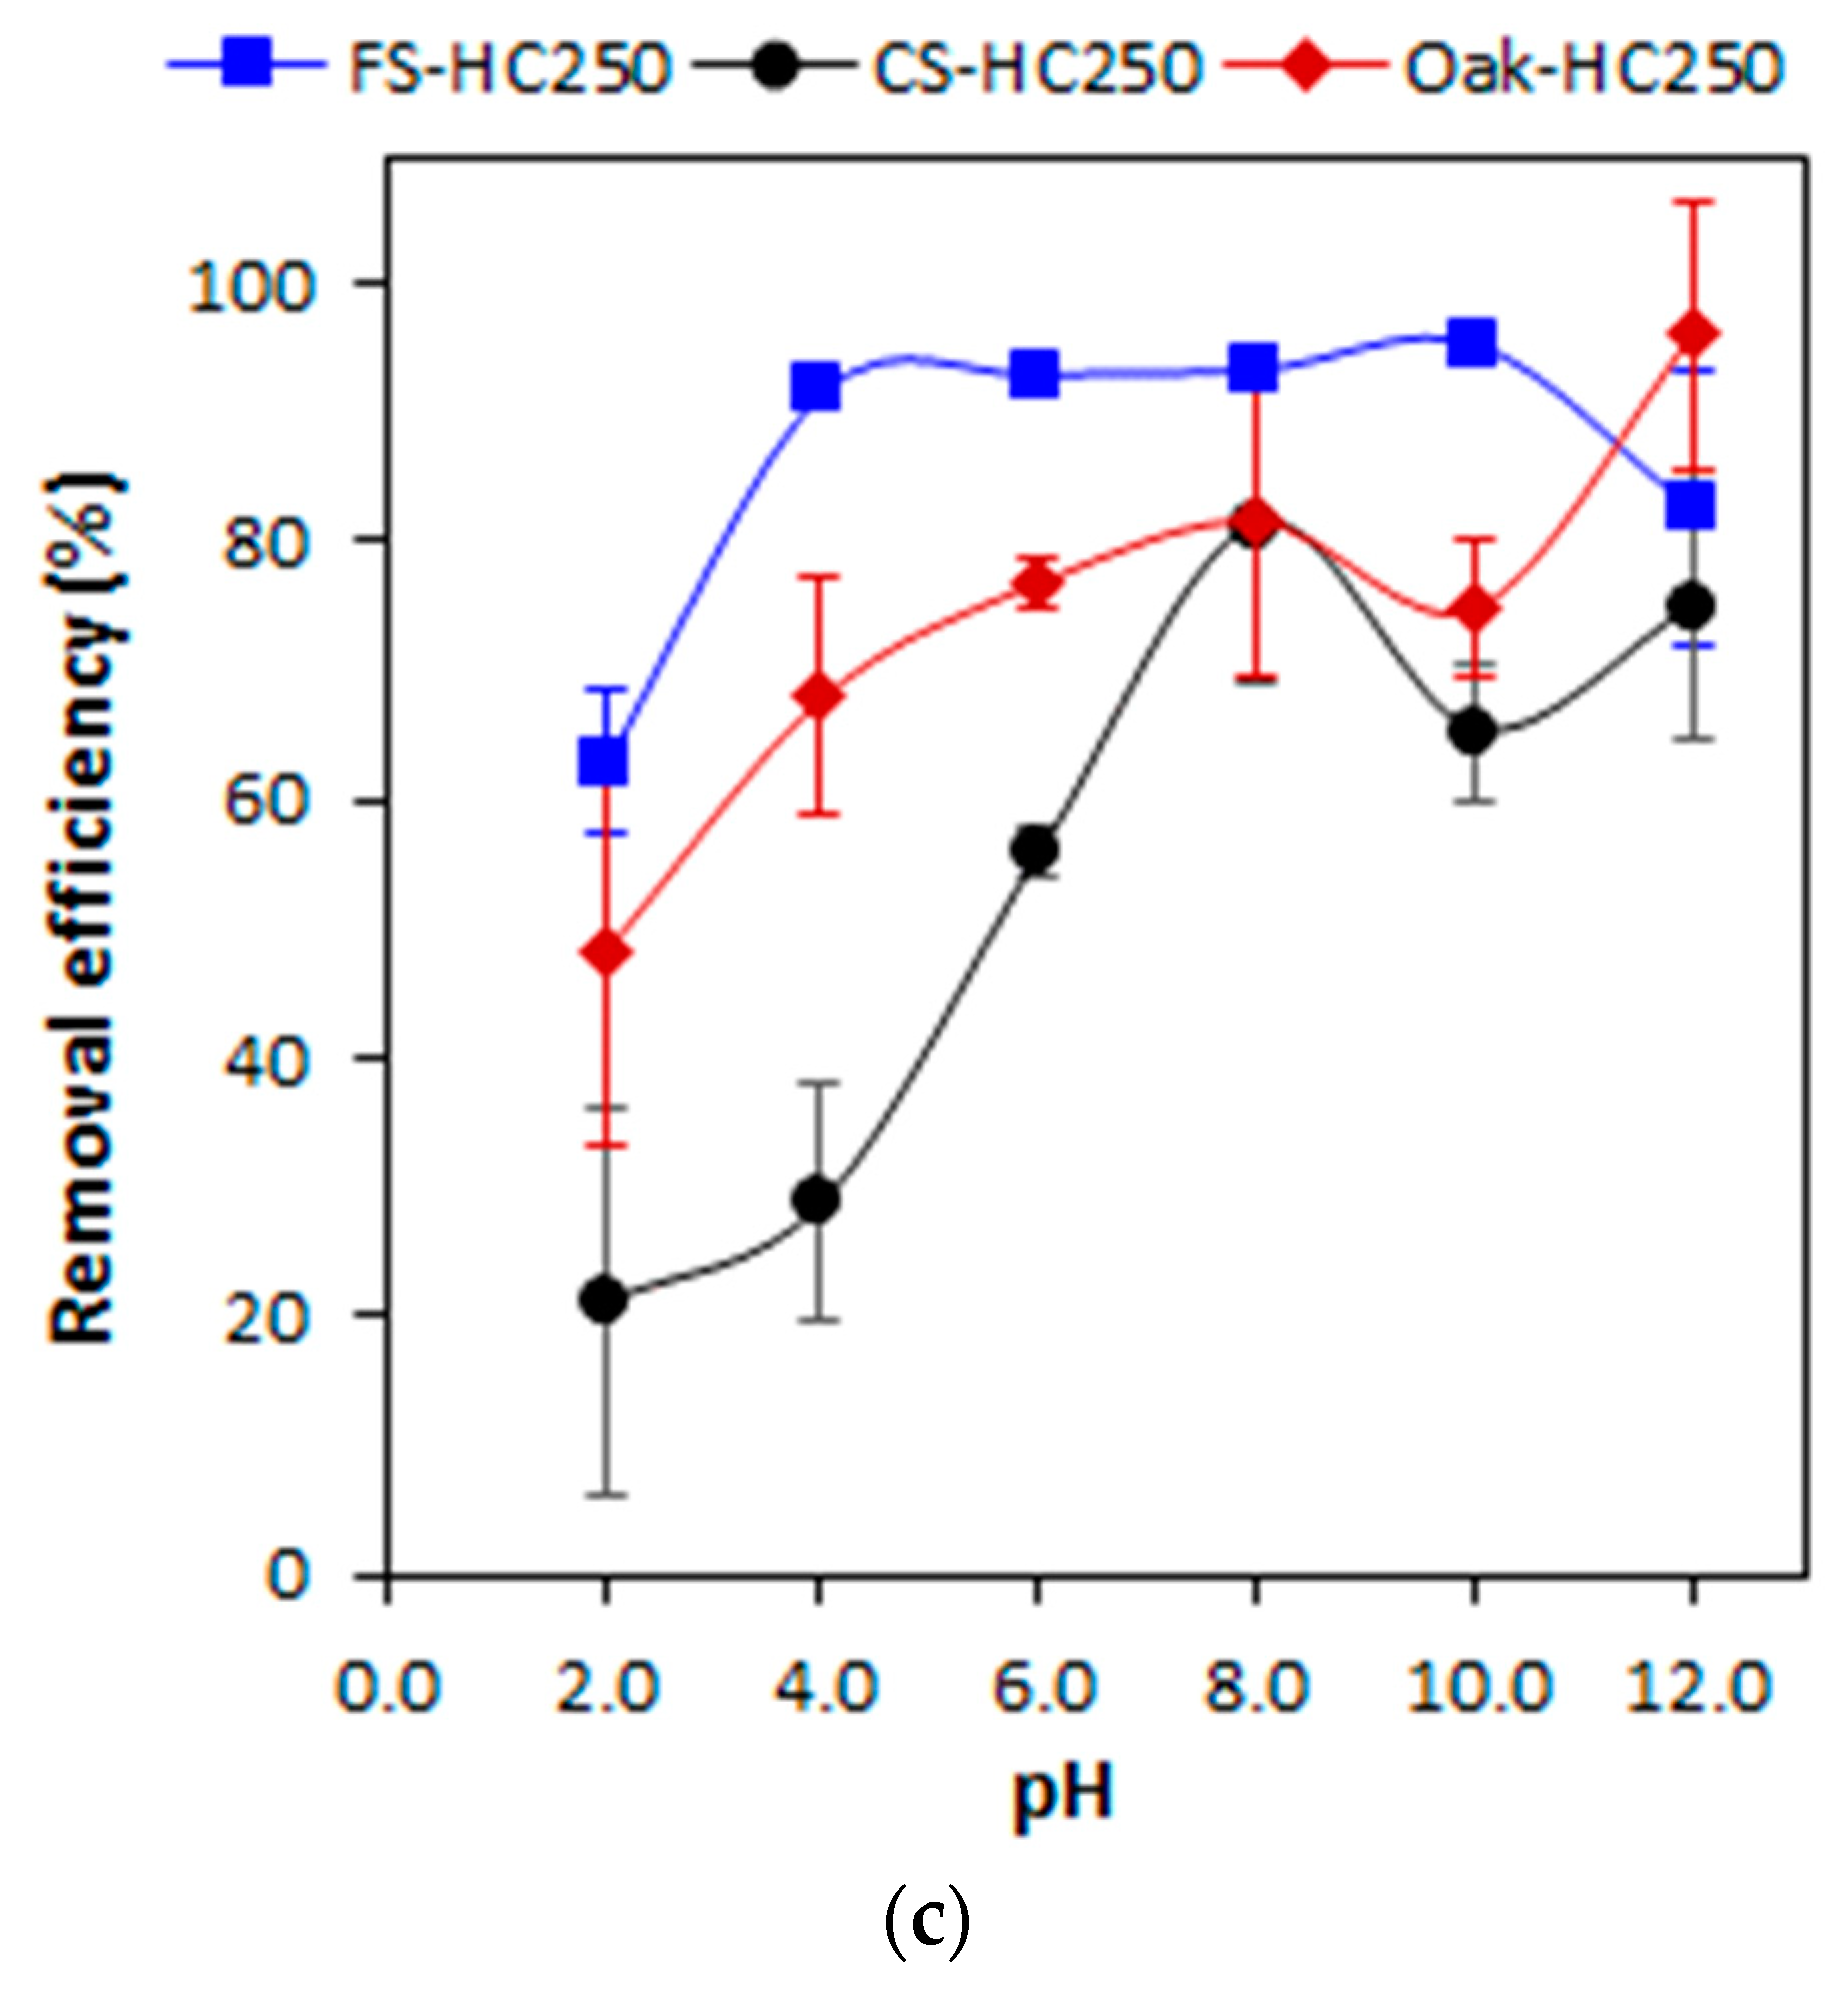
3.2. Effect of pH on Adsorption Efficiency
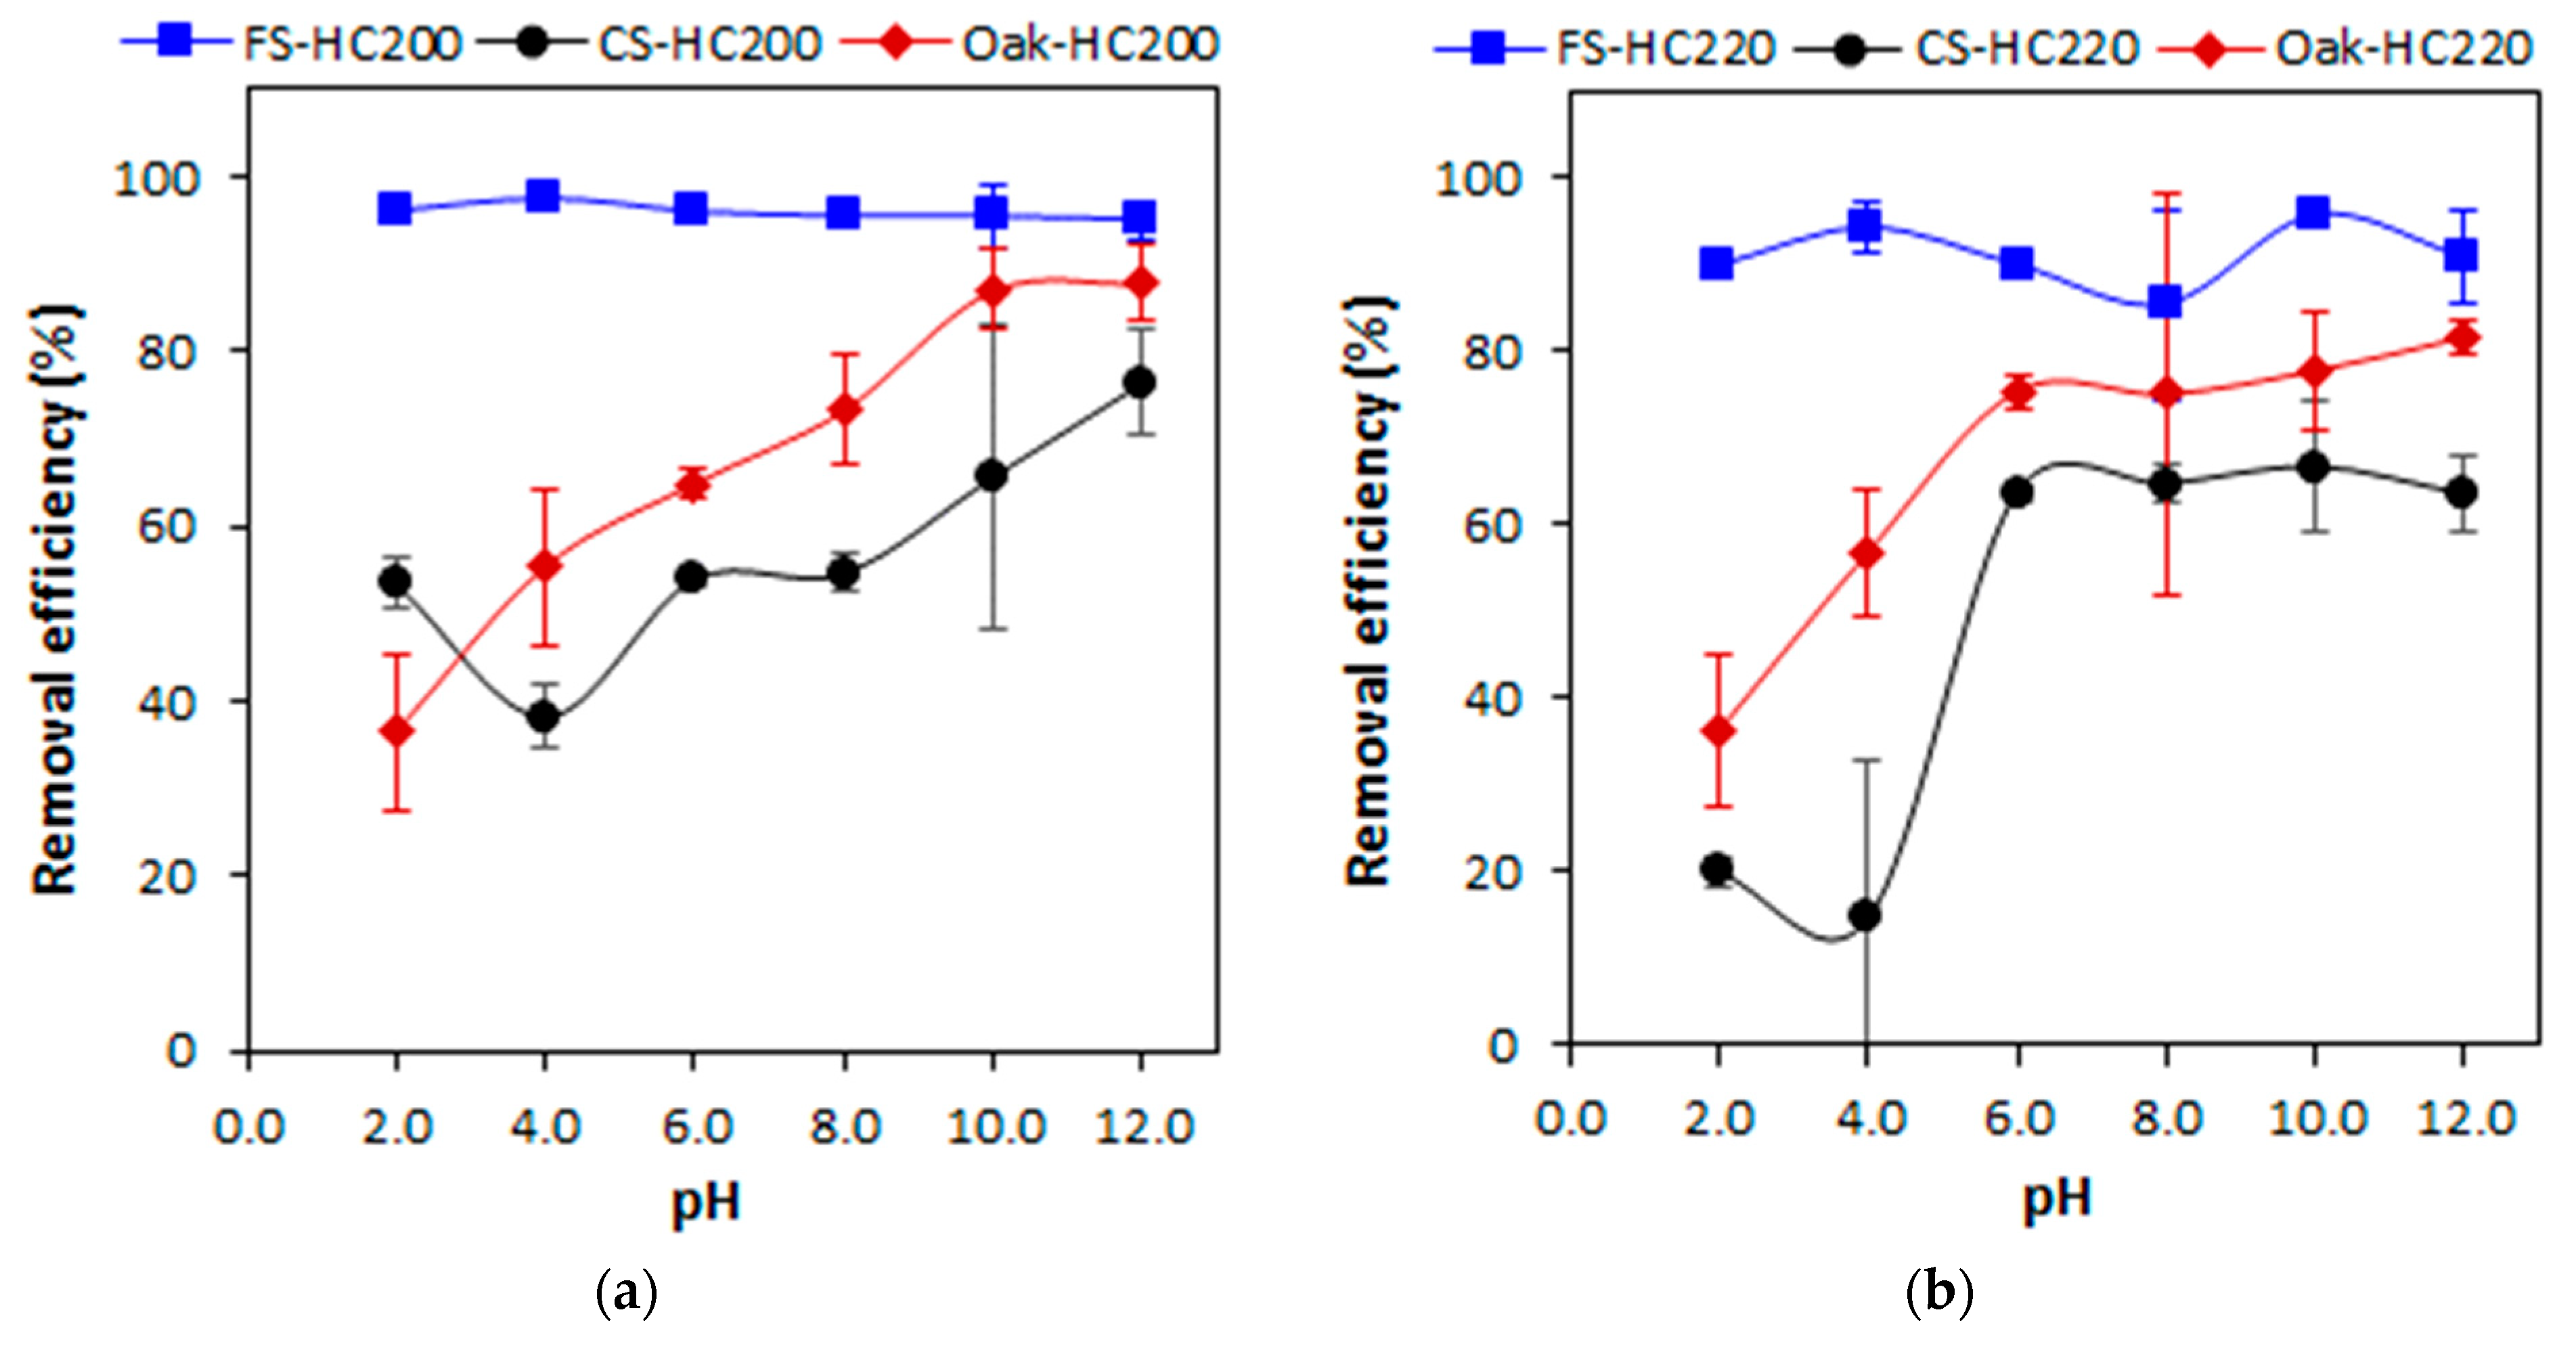
Figure 3 shows that, with the exception of the FS-HCs, increasing the solution pH increased the percentage of MB dye removed for the CS-HCs and Oak-HCs. The best performance of all the Oak-HCs and CS-HC200 was pH 12.0, whilst that for CS-HC220 and CS-HC250 was pH 10.0 and 8.0 respectively. At a higher pH, the surface functional groups of the hydrochars are negatively charged due to deprotonation, resulting in easy hydrogen bonding between the N atoms on the phenothiazine in MB and C-OH functional groups of the hydrochars. This enhances the adsorption of the cationic MB dye as there was a higher electrostatic attraction and hydrogen bonding interaction between the dye and the hydrochars. This agrees with the results of zeta potential reported in the previous study on the physicochemical characteristics of the hydrochars, showing negatively charged surfaces indicated by their negative zeta potential values [33]. At a lower pH, the functional groups on the hydrochars are protonated, creating a positive charge that repelled the cationic MB dye as well as the competition for the active sites between the dye molecules and the protons [48]. This is in contrast to the findings of Jóźwiak et al. [48] for a cationic dye (basic violet 10) that had the highest sorption efficiency at pH 3 and decreased with increasing pH, whereas the highest sorption efficiency for basic red 46 cationic dye was pH 6, which also decreased as the pH was increased between 6–8. This was found to be due to the presence of a carboxylic functional group in the basic violet 10 structure that generated a local negative charge, -COOH group (-COO-+H+).
The findings in this study agree with the work reported by Liu et al. [49] using Fe3O4-loaded protonated amine-modified hydrochar (Fe3O4-PAMH) derived from bamboo wood at 200 °C for 24 h for the selective removal of MB and methyl orange (MO) at pH 5.0–11.0. The maximum MB uptake capacity of the Fe3O4-PAMH (148.84 mg/g) was achieved at pH 11.0, compared with pH 5.0 for the anionic dye (MO) required to obtain maximum adsorption capacity of 202.02 mg/g. The positive charge of surface protonated amine groups in Fe3O4-PAMH resulted in a positive zeta potential, which contributed to adsorbing the MO from the aqueous solution by electrostatic attraction but reduced the adsorption capacity towards MB through electrostatic repelling between the protonated amine groups of Fe3O4-PAMH and MB.
Figure 3a shows that FS-HC200 performed better at all the pH ranges. The adsorption using the seaweed hydrochars is less affected by a reduction in pH. FS-HC200 was the best adsorbent, removing 97.63% of the MB dye at an acidic pH of 4.0, with the adsorption efficiency reducing slightly at pH >4.0. For the higher temperature seaweed hydrochars, adsorption increased at the higher pH with the maximum adsorption for FS-HC220 and FS-HC250 being at pH 10.0, adsorbing ~95.75% of the MB dye, which decreased to 90.83% and 82.50% when they exceeded 10.0. CS-HCs removed the lowest percentage of the MB dye at all pH values, with CS-HC220 having the lowest efficiency at pH 4, removing only 14.67% of the MB dye, with the highest removal of 81.33% achieved for CS-HC250 at pH 8.0.
The rate of increase in MB removal slowed down significantly at pH 10.0. This was caused by the saturation of the hydrochars’ surface after pH 10. This was also due to an adjusting charge on the surface of the hydrochars and the degree of ionisation of MB in the aqueous solution [50]. Hence, it can be concluded that MB adsorption onto CS-HCs and Oak-HCs is greatly dependent upon the initial pH of the solution and the maximum adsorption efficiency being attained at a pH of between 10–12. On the contrary, Lv et al. [51] reported that the uptake quantity of MB adsorption onto carboxylate-rich hydrochar (AAHC) derived from bamboo at 200 °C for 24 h increased rapidly first from pH 2.0 to 4.0 and then remained unchanged even when the pH was increased. The reason was that the zeta potential of AAHC reduced from +12.7 to −29.1 mV within pH 2.0–10.0, which is not conducive for MB adsorption due to repelling attraction. This does not agree with the findings in this present study.
The differences in the adsorption efficiency of coconut shell and oak may be caused by the differences in their lignocellulosic composition, which impacted their extent of carbonisation. Coconut shell mainly consists of hemicellulose (18–40%), cellulose (15–27%), and lignin (41–45%) [52,53,54]. Oak contains hemicellulose (19–30%), cellulose (38–46%), and lignin (22–29%) [55]. As explained earlier in Section 1, lignin decomposes at higher processing temperatures (above 250 °C) due to its more stable phenolic structure [41,42], while cellulose breaks down above 220 °C [40]. The previous work describing the physicochemical adsorbent characteristics found that the coconut shell has a high cellulose content, whereas the oak is rich in lignin [33].
Adsorption of MB onto FS-HCs was not influenced greatly by pH, although the highest adsorption percentage was obtained at pH 4 for FS-HC200, followed by pH 10 for FS-HC220 and FS-HC250. Navarro et al. [56] found a higher adsorption percentage of phenol at pH 10 with values between 10% and 35%, respectively, by the noncarbonised marine seaweeds Lessonia nigrescens Bory and Macrocystis integrifolia Bory. However, in their study, there was a strong adsorption dependence on pH that was driven purely by the polar mechanism involving the formation of hydrogen bonds with the hydroxyl groups that were spatially arranged in the polysaccharic chains constituting the F. Serratus structure.
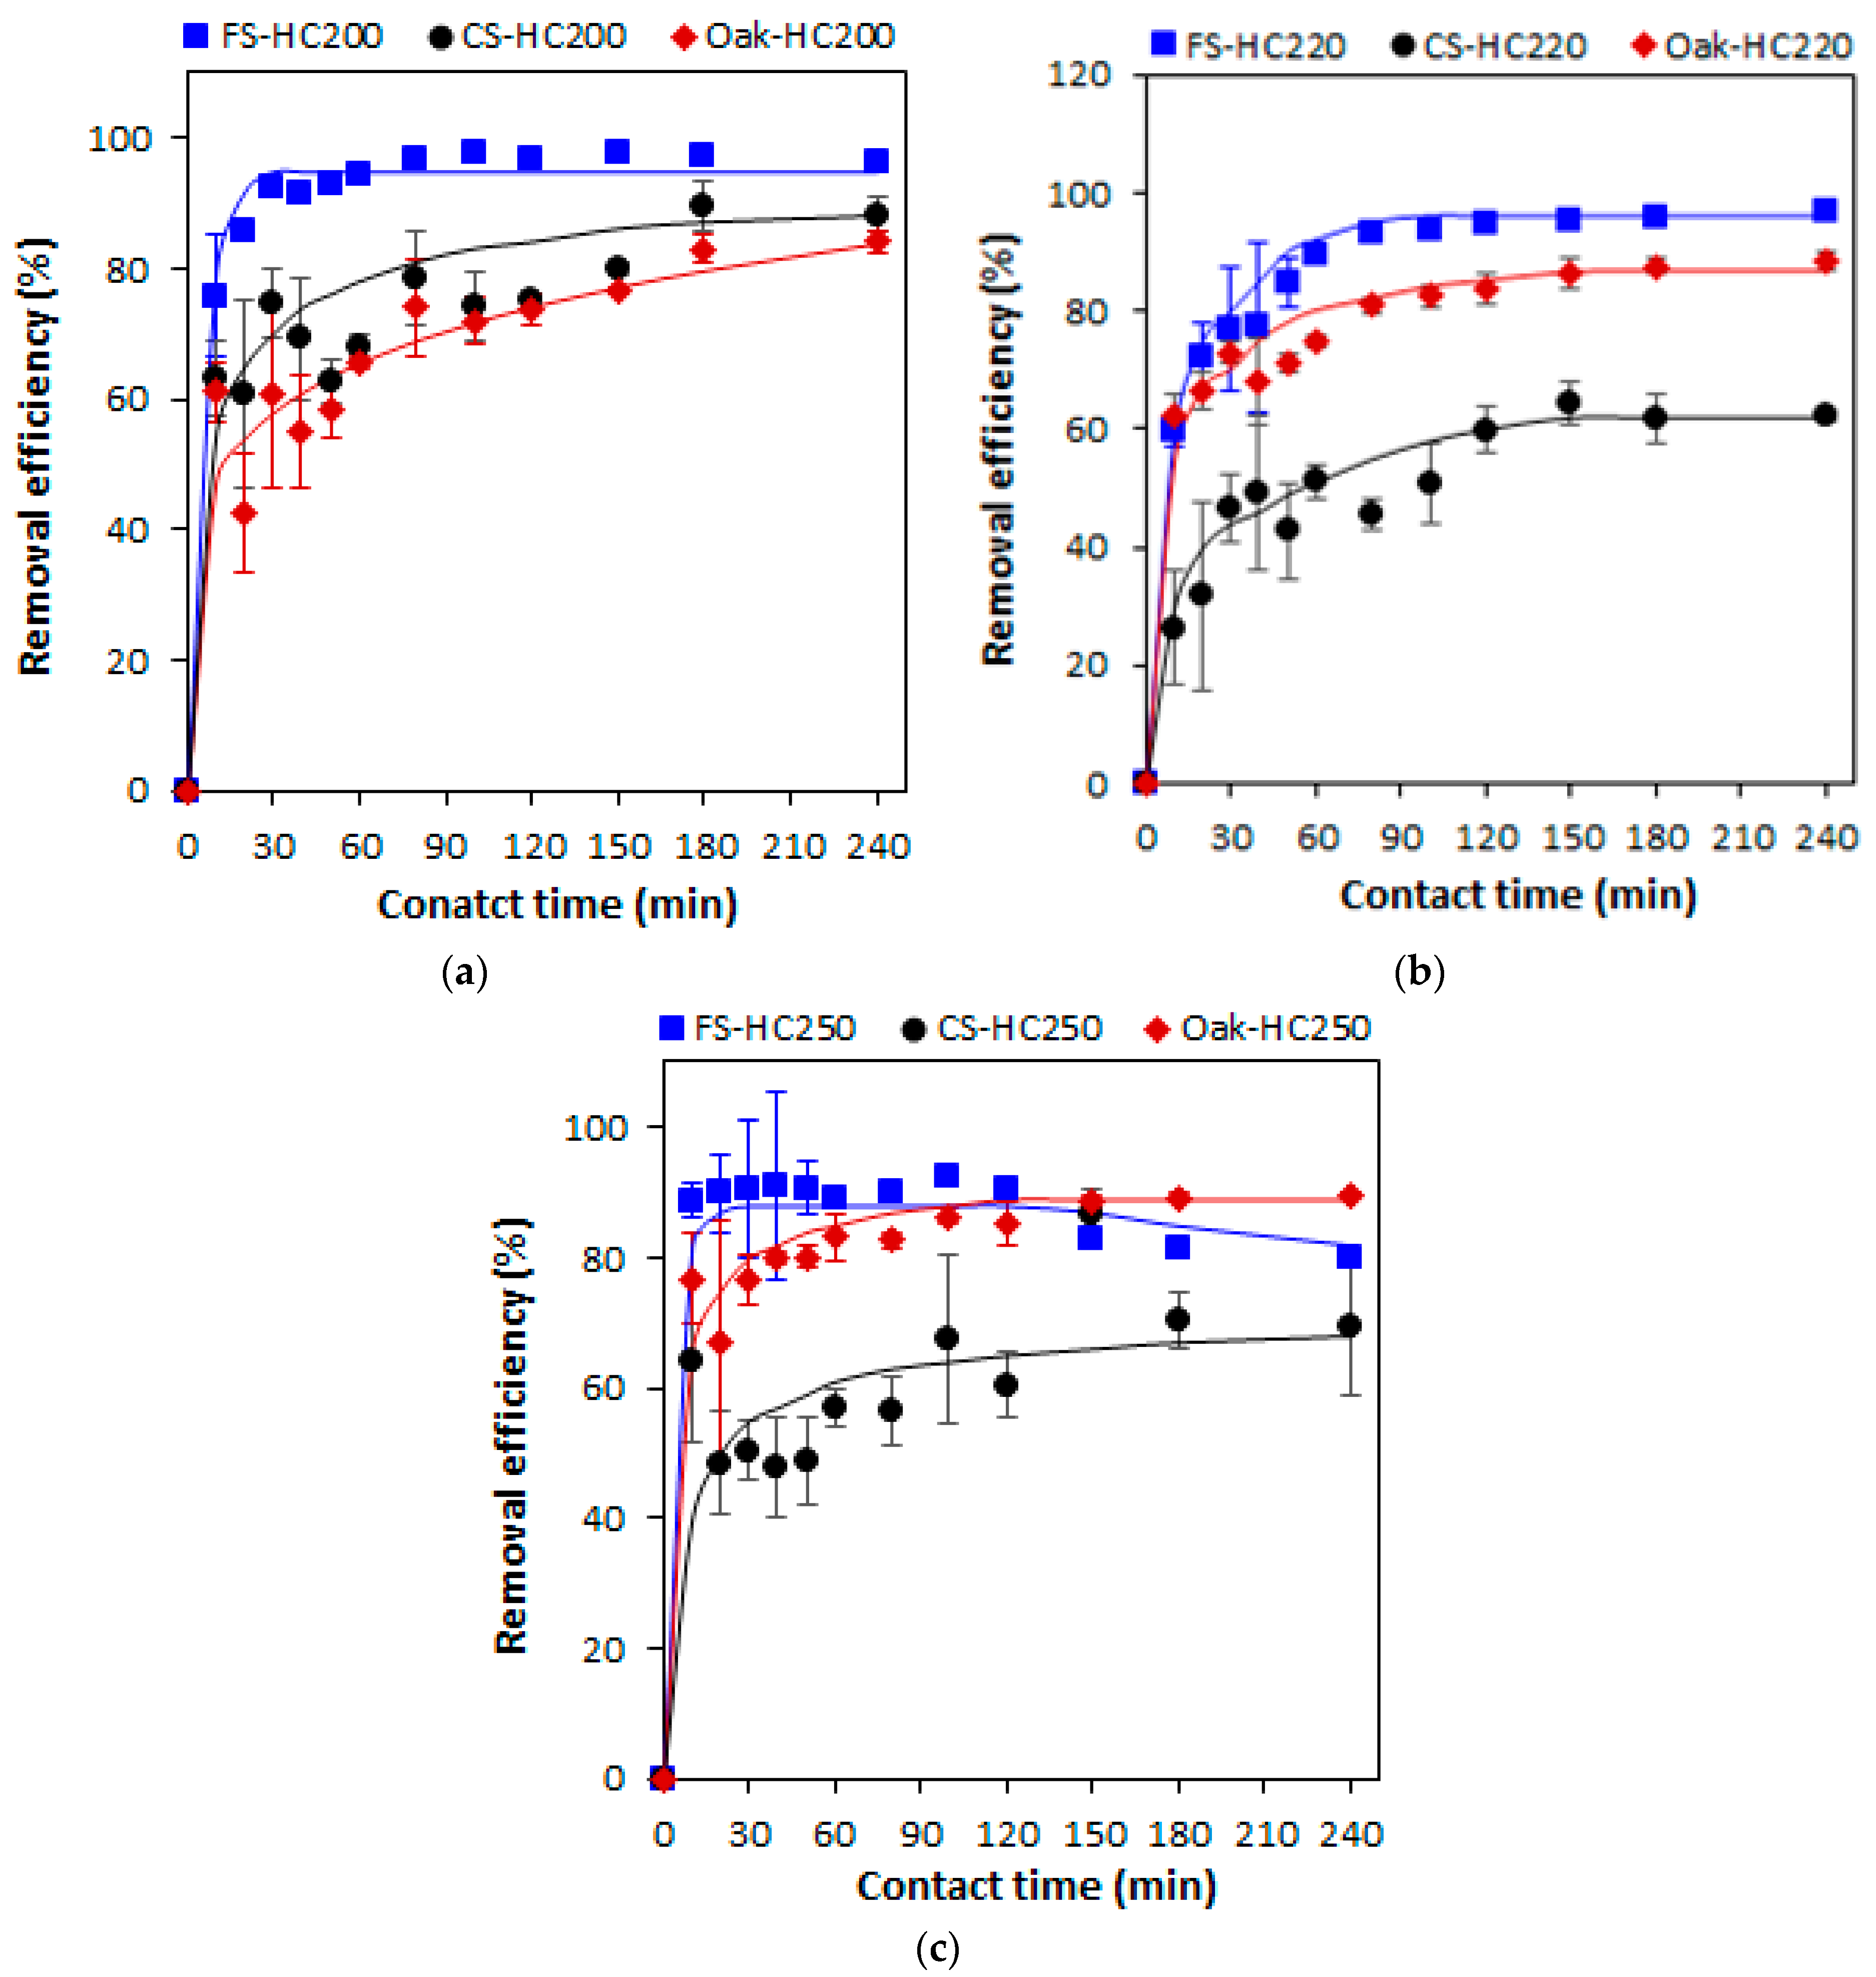
3.3. Effect of Contact Time on Adsorption Efficiency
Figure 4 shows that the efficiency of MB removal was rapid within the first 30 min with the best-performing hydrochar at the shortest time being FS-HC200 removing almost 92.43%, while FS-HC220 and Oak-HC250 removed 76.83% and 90.70% respectively. This is because the driving force for mass transfer was improved as there was a high concentration difference at the hydrochar–liquid interface, which resulted in the fast increase in MB sorption onto the hydrochars, quickening the rate at which vacant active sites on the surface were occupied by the MB dye. Zhang et al. [57] made a similar observation during the adsorption of tetracycline onto biochar derived from cow manure at different pyrolysis temperatures. Similarly, Cheng et al. [24] found MB as an electron acceptor, and that the interaction between Fe-doped porous graphite hydrochar and MB included π-π, electrostatic, and hydrogen bond interactions. Within 50–100 min, the removal rate of MB increased slightly as the effective area and active sites of the hydrochars surface were decreasing and reached equilibrium between 100–180 min as the vacant active sites decreased with time. This is because the remaining unoccupied sites were difficult to fill due to the repulsive forces between the dye molecules adsorbed within the film and the dye molecules in the solution [58]. FS-HC200 and FS-HC250 reached sorption equilibrium during 100 min, while FS-HC220 reached equilibrium at 180 min. CS-HC200, CS-HC220, Oak-HC200, Oak-HC220, and Oak-HC250 reached equilibrium within 180 min, while CS-HC250 reached equilibrium at 150 min.
FS-HCs were the best-performing hydrochars, with FS-HC200 removing 97.88% of the MB within 150 min, whilst FS-HC220 and FS-HC250 removed 96.83% and 92.33% of the MD dye within 240 and 100 min, respectively. Oak-HCs removed the second highest percentage of the dye, with Oak-HC250 removing 89.75% in 240 min, while Oak-HC200 and Oak-HC220 removed 84.17% and 88.30% in 240 min. CS-HC200 was the best among the CS-HCs over the range of contact times used, removing approximately 89.42% of the MB dye in 180 min compared with 64.33% and 86.83% in 150 min for CS-HC220 and CS-HC250, respectively. Hence, the interaction of adsorption contact time and HTC temperature affected the adsorption of MB dye onto the hydrochars.
3.4. Adsorption Kinetics
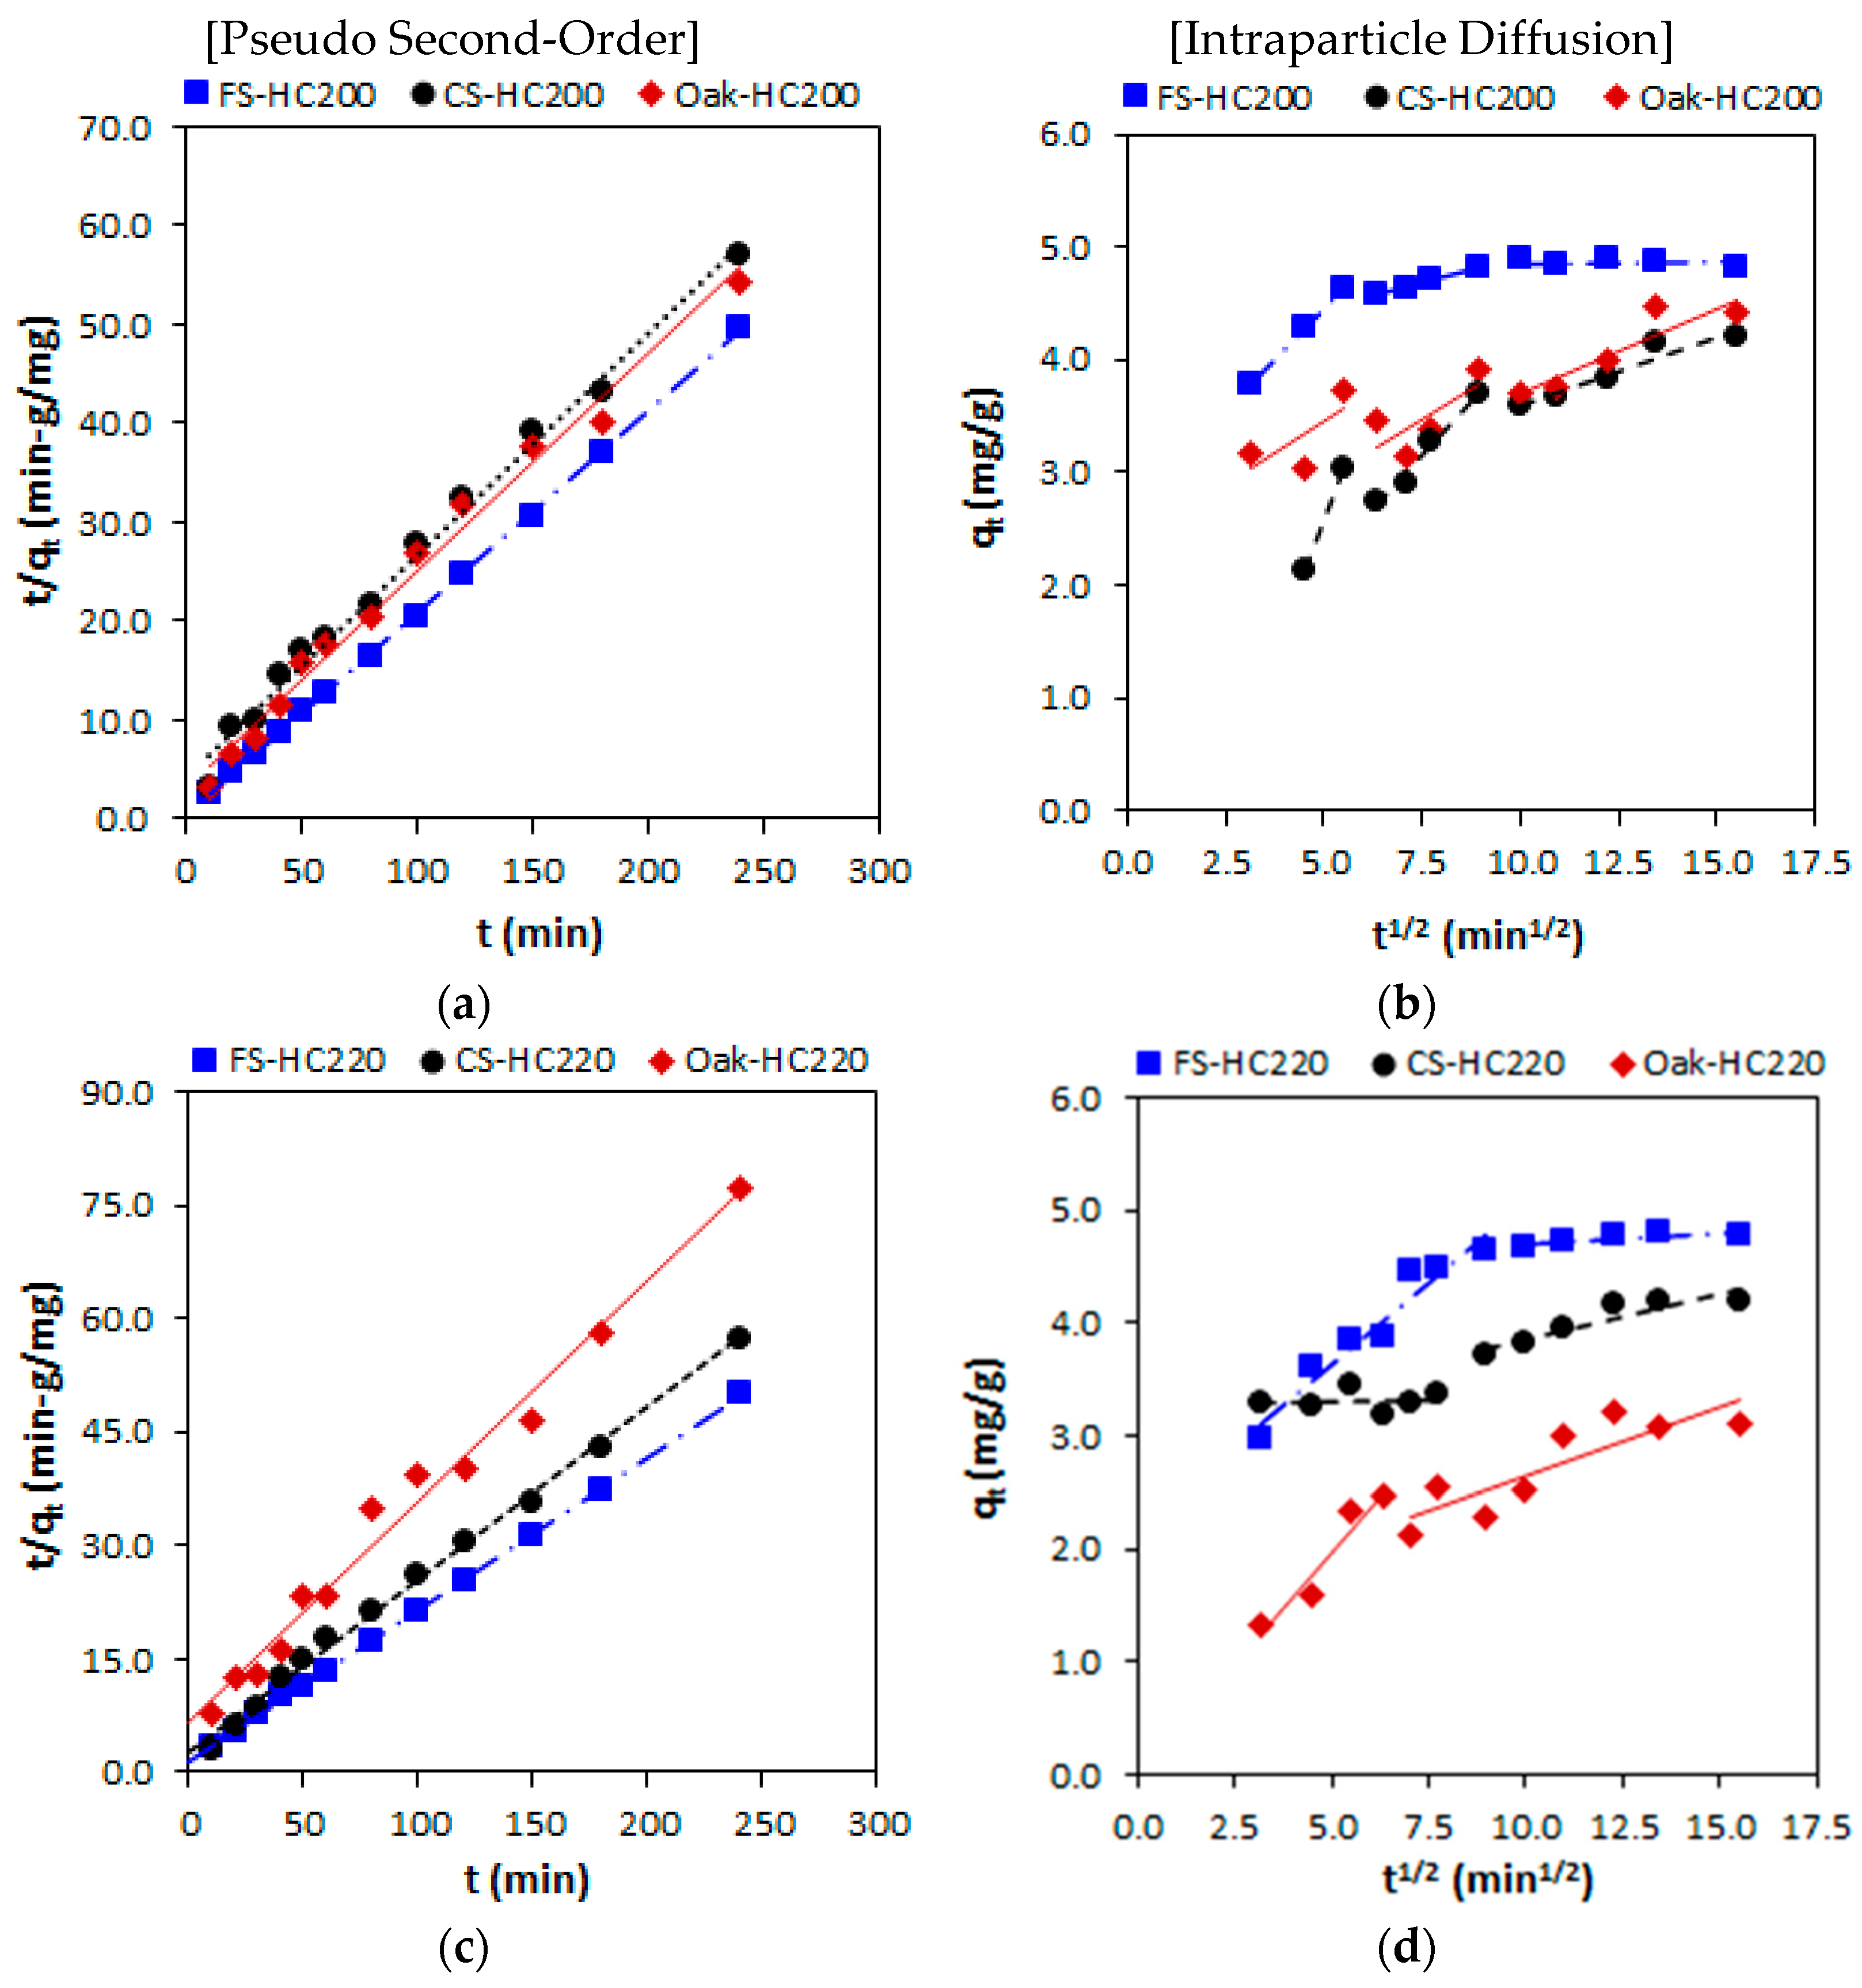
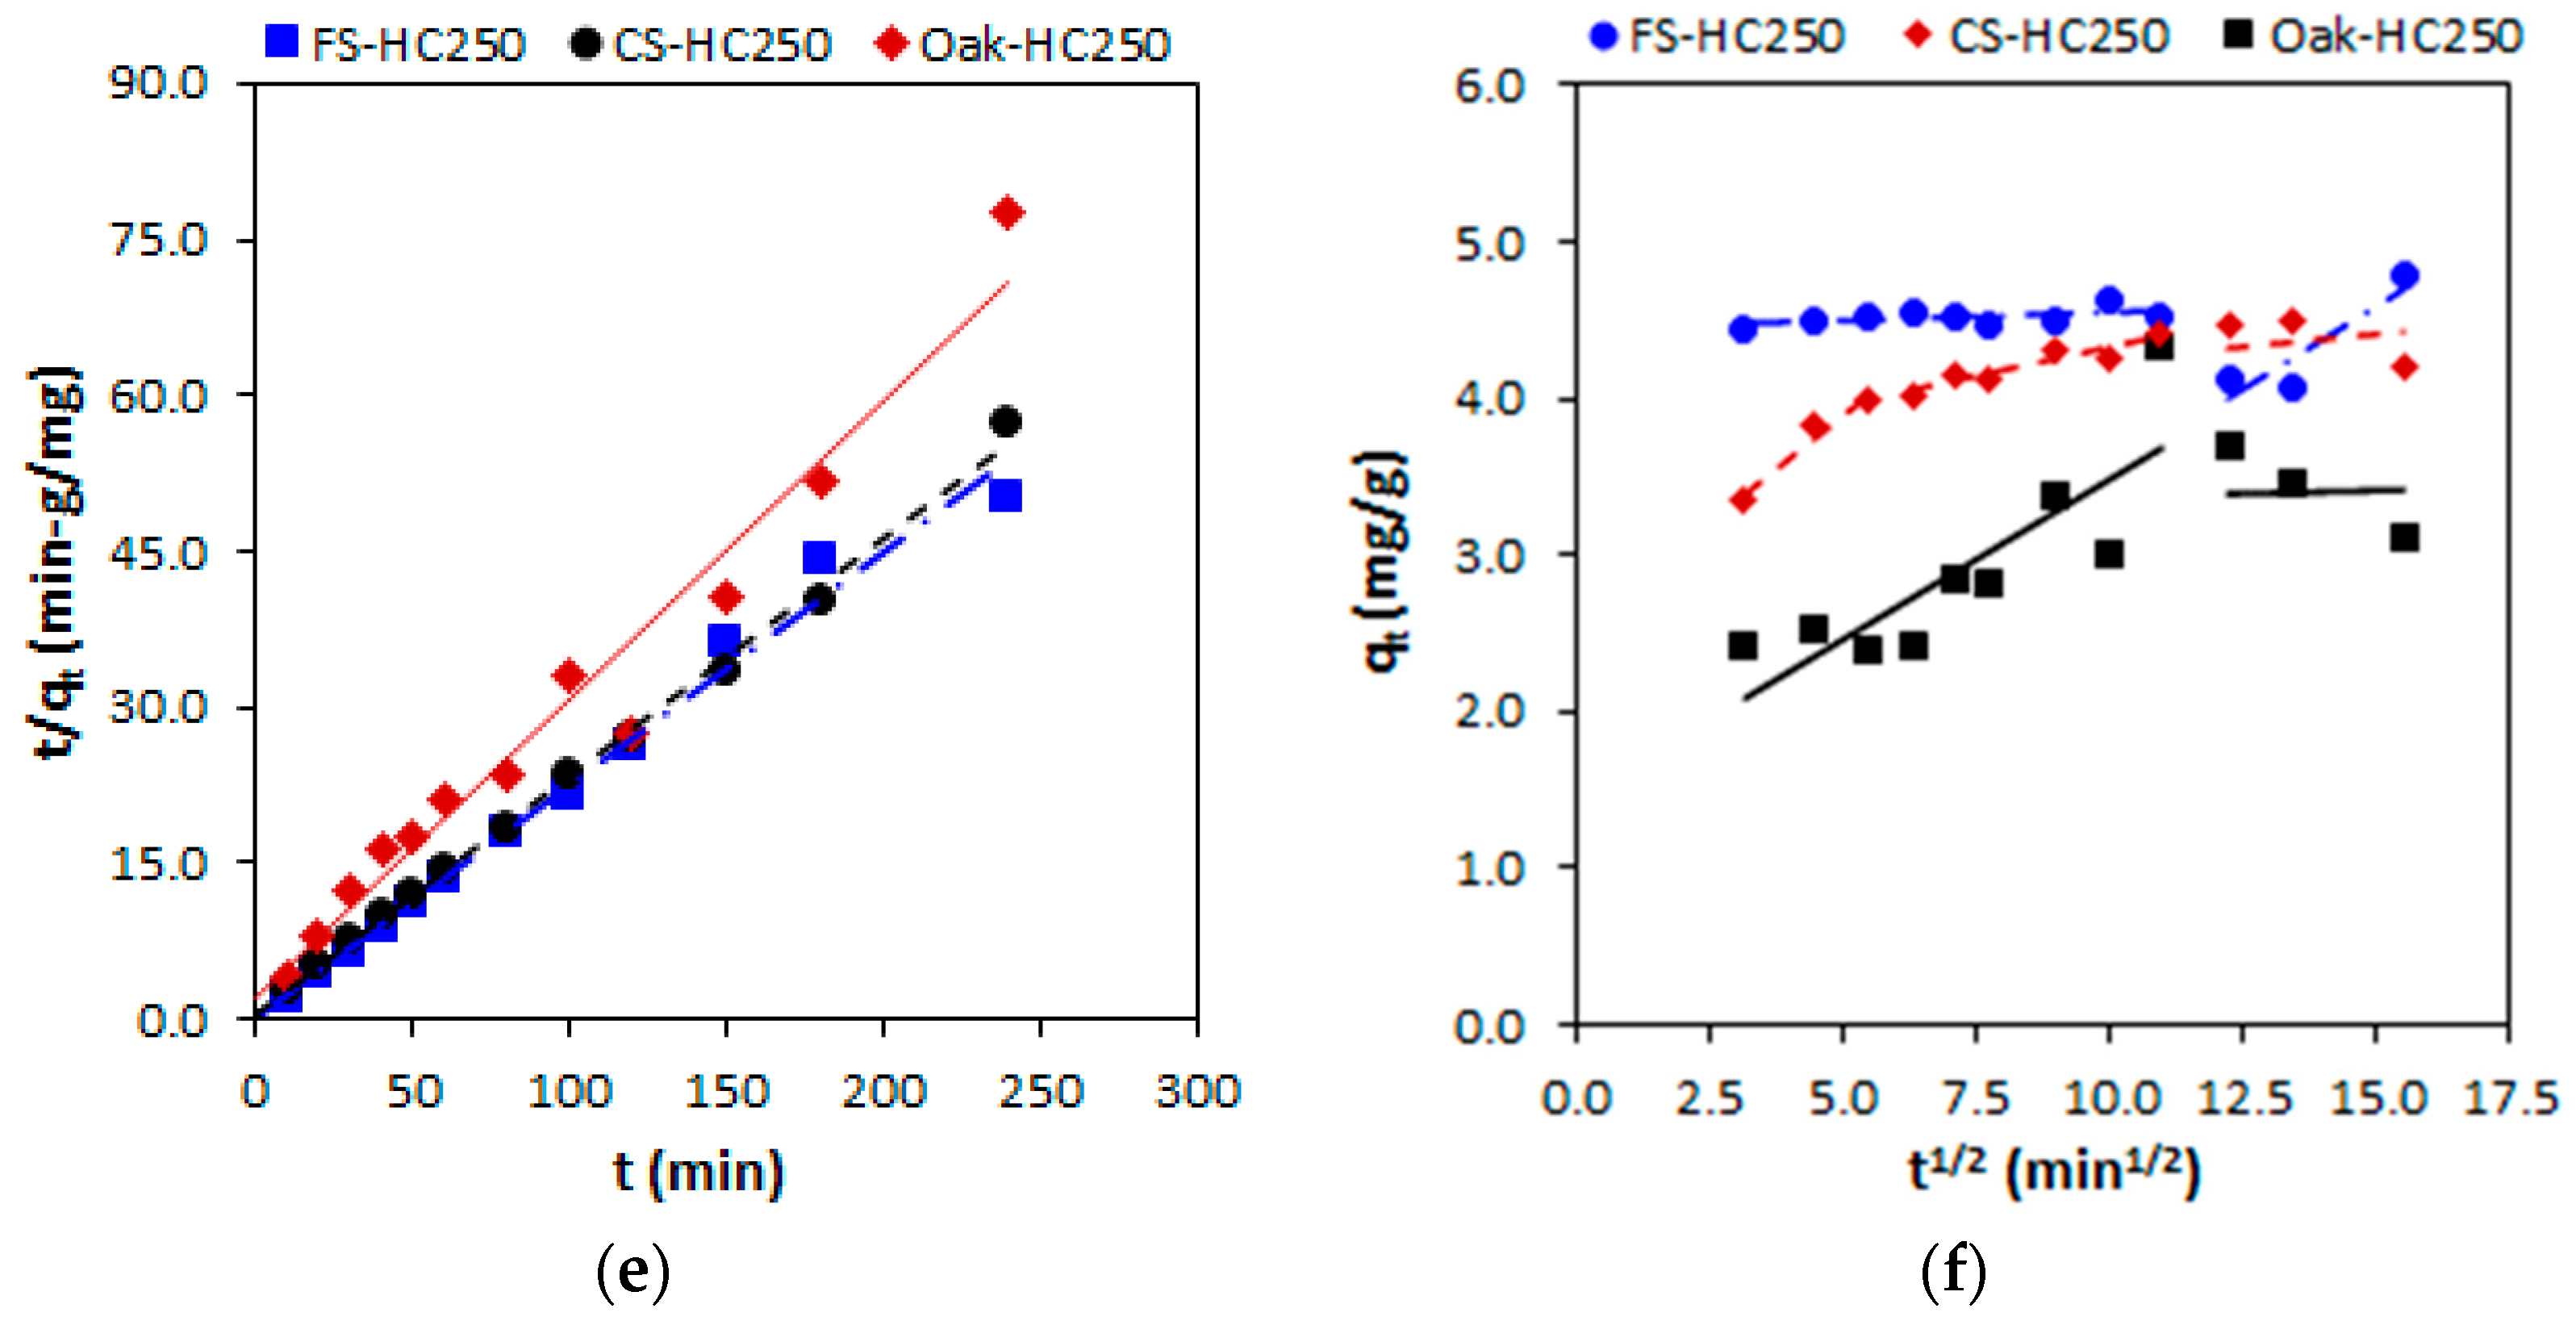
Figure 5 shows the adsorption kinetic models using FS-HCs, CS-HCs, and Oak-HCs produced at different HTC temperatures for the removal of MB dye from aqueous solutions. The calculated kinetic constants for each adsorbent are presented in Table 1. The plots of the pseudo first-order kinetic model are presented in Figure S1 and the kinetic parameters in Table S1 (in the Supplementary Material). The experimental results suitably fit the pseudo second-order kinetic model (Figure 5a–c) than the other models as indicated by the very high R2 values in Table 1. This implies that chemisorption was the rate-limiting step in the adsorption of MB onto FS-HCs, CS-HCs, and Oak-HCs. Hence, a chemical bond was the attracting force between the hydrochars and the adsorbate, and the molecules accumulate and form a monolayer. Chemisorption adsorption involves electrostatic attraction and valence forces through the exchange or sharing of electrons between the hydrochars and the adsorbate [24,59].
The initial adsorption rate constant of the pseudo second-order kinetic model, represented by the parameter h (mg/g-min), which relates to and , was calculated as h = . As shown in Table 2, FS-HC250 has the highest values of h, followed by FS-HC200, and then CS-HC250. The high h values of these hydrochars suggest that their adsorption process could occur by surface exchange reactions until the surface functional sites were occupied [59].
Intraparticle diffusion (Figure 5d–f) was further used to investigate the sorption mechanism and the rate limit step of the sorption process. Linear fitted results did not pass through the origin and did not give good fits with low R2 values; hence, multilinear curves were used, asserting that the sorption process was not controlled by intraparticle diffusion as the sole rate-determining step. Qu et al. [60] found a similar result for the adsorptive removal of chromium (VI) and naphthalene by KOH-activated porous biochar. As shown in Table 1, the intraparticle diffusion sorption rate constants of FS-HC200, CS-HC200, Oak-HC200, and CS-HC250 decreased consecutively , indicating that the internal diffusion of the MB dye was linked to sorption. This means that three stages were involved in the sorption of MB onto these hydrochars: film diffusion, which was mostly affected by external conduction resistance; intraparticle diffusion; and adsorptive attachment of the MB molecules (equilibrium).
Similar findings have been reported by Pei et al. [61] for the adsorption of MB onto tannin-immobilised cellulose microspheres, as well as a study by Wei et al. [62] the for adsorption and coadsorption of tetracycline and doxycycline by one-step synthesised iron loaded sludge biochar. During the first stage, there was a transfer of the MB molecules to the external surface of these hydrochars via a hydrodynamic boundary layer, and then in the second stage, internal diffusion of the MB occurred in which the MB molecules entered the internal pores from the external surface of the hydrochars. In the third stage, the hydrochars reached sorption equilibrium.
Two stages were involved in the absorption of MB onto FS-HC220, CS-HC220, Oak-HC220, FS-HC250, and Oak-HC250: film diffusion and intraparticle diffusion. For FS-HC220, Oak-HC220, and Oak-HC250, ki1 > ki2, implying the first stage was film diffusion, followed by intraparticle diffusion, while ki2 > ki1 for CS-HC220 and FS-HC250, meaning intraparticle diffusion was the first stage, and then lastly film diffusion. These suggest that during the sorption process, film diffusion and intraparticle diffusion dominated different stages. Cheng et al. [24] made a similar observation for MB adsorption onto KOH-activated coffee husk hydrochar.
The intercept, C, signifying the boundary layer effect or the surface adsorption was higher for FS-HCs, followed by CS-HCs, and then Oak-HCs (Table 2). The boundary layer effect of the hydrochars was not influenced by the HTC process temperature as the C values did not follow any sequence.
Chemisorption is the most reported mechanism of dye adsorption on hydrochars, which supports the findings in this study. For example, Liu et al. [49] and Lv et al. [51] found that MB adsorption onto Fe3O4-PAMH and AAHC is mainly a chemical process. However, a few studies obtained a pseudo first-order kinetic model for the adsorption of MB dye on beech sawdust hydrochar [63] and acridine orange and rhodamine G6 on food waste hydrochars [64].
3.5. Adsorption Isotherms
Three adsorption isotherms were used to study the correlation between the hydrochars and the adsorbate. The experimental equilibrium data were analysed using the extensively used Langmuir and Freundlich isotherm models as well as the Redlich–Peterson (R–P) isotherm equation, which is meant to amend the inaccuracies of the two parameter Freundlich and Langmuir equations [65]. The adsorption isotherm parameters of these models are presented in Table 2, and the isotherm plots are presented in Figure S2 in the Supplementary Material.
To evaluate the best fits of the isotherm model equations, the AIC statistical method was used together with the R2 value to compare the different models. This is because the value of R2 is not always suitable for a comparison of the goodness of fit as it does not consider the degree of freedom of the equations [66]. Table 2 shows that the adsorption of MB onto HC200 and HC250 (of FS, CS and Oak) hydrochars successfully fitted the Langmuir isotherm equation indicated by the low AIC values and high values of the linear correlation coefficient (R2). That is, FS-HCs (AIC is 12.48–13.43; R2 is 0.88–0.96), CS-HCs (AIC is 16.64–17.71; R2 is 0.83–0.96), and Oak-HCs (AIC is 7.92–10.97; R2 is 0.86–0.99). Even though the Freundlich model of FS-HC200, CS-HC200, and Oak-HC250 has slightly lower AIC values (i.e., 13.27, 14.55, and 9.49, respectively), they have extremely lower R2 values, so the Freundlich model is omitted. Also, values of the Langmuir adsorption efficiency, RL are in the range 0.10–0.12 for FS-HCs, 0.04–0.14 for CS-HCs, and 0.09–0.12 for Oak-HCs (i.e., between 0.0–1.0); hence, the adsorption was favourable, which confirms the suitability of the Langmuir model. This affirms that there was monolayer adsorption and that HC200 and HC250 hydrochars of FS, CS, and Oak have homogeneous surfaces with a fixed number of adsorption sites, which are equivalent in size and shape with equal affinity for the MB molecules. This further explains why increasing the initial MB dye concentration caused saturation of the hydrochar active sites and the adsorption capacity could not increase further (Section 3.1). High Langmuir constant (b) values imply a superior affinity between the adsorption sites on the hydrochar surface and dye molecules [67]. The values of b are as follows: CS-HC250 > Oak-HC200 > FS-HC250 > FS-HC200 = Oak-HC250 > CS-HC200, meaning that the interactions between CS-HC250 and MB molecules were highest in that order.
The Langmuir model has been reported for adsorption of MB dye onto KOH-activated coffee hydrochar, though with higher adsorption capacity (qm = 415.79 mg/g) [23], Sisal cellulose activated carbon (qm = 71.41–110.35 mg/g) [68], activated orange peel hydrochar (qm = 755.33 mg/g), although Sips isotherm was the best fit [20], and bamboo-PVC hydrochar (Qo = 213.08–258.97 mg/g) [25]. The qm values obtained in this study (5.10–28.57 mg/g) were lower than these reported values, suggesting that different hydrochars have different adsorption capacities for MB dye sorption. Similar observations were reported by Liu et al. [49] and Lv et al. [51] in which the adsorption of MB onto Fe3O4-PAMH and AAHC was a monolayer process obeying the Langmuir model than the Freundlich model.
The Freundlich model described the adsorption process on FS-HC220 (AIC = 35.52 and R2 = 0.64), CS-HC220 (AIC = −3.79 and R2 = 0.95) and Oak-HC220 hydrochars better (AIC = 5.80 and R2 = 0.70) as the regression coefficients were comparatively higher and the AIC was lower than in the Langmuir model. The energetic heterogeneity of these hydrochars, n is between 1.0–10.0, asserting that the Freundlich model describes the adsorption process of the hydrochars produced at an HTC temperature of 220 °C and that they have a heterogeneous surface and can be applied to multilayer adsorption. CS-HC220 and Oak-HC220 have 1/n values of 0.34 and 0.30, respectively, suggesting that MB was easily adsorbed on both hydrochars, however, the 1/n value for FS-HC250 was 0.53, meaning there was some difficulty with adsorption.
The R2 values in Table 2 show that the Langmuir and R–P isotherm models were more suitable for MB adsorption onto HC200 and HC250 (of FS, CS and Oak) hydrochars, while the Freundlich and R–P models fitted best to the data set of MB adsorption on FS-HC220, CS-HC220, and Oak-HC220. All α values in the R–P isotherm model were less than one (between 0.47 and 0.94). The value of bRP for CS-HCs and Oak-HCs decreased as the HTC temperature increased, while that of the FS-HCs did not follow any trend. It was expected that all the data sets would fit best to the R–P isothermal equation than the Langmuir and Freundlich models; however, this was not the case as further trials and adjustments of the constant’s bRPq’m values in Equation (9) yielded either negative slopes or intercepts. The same results were obtained when the other linear form of the R–P equation (Equation (12)), which requires trying the α values, was used.
In a study of MB, acid blue, and basic brown dye adsorption onto NaOH-activated pistachio shell char, the Freundlich and R–P equations appropriately fitted the data set of MB adsorption on the PSN2.5 char (bRP = 1.912, and α = 0.94) [22]. In a report of reactive blue 19 onto a chitosan–oil palm ash composite, the Freundlich and R–P isotherm equations were better fitted to the data than the Langmuir isotherm model [68]. In the study of reactive dyes onto Filtrasorb 400 activated carbon, adsorption of the dyes from single and multisolute systems was successfully described by the Langmuir and R–P equilibrium isotherm models [69]. Reports from these studies indicate that the results of the R–P fittings are either close to or less than those of Langmuir or Freundlich isotherm models.
3.6. Proposed MB Removal Mechanisms
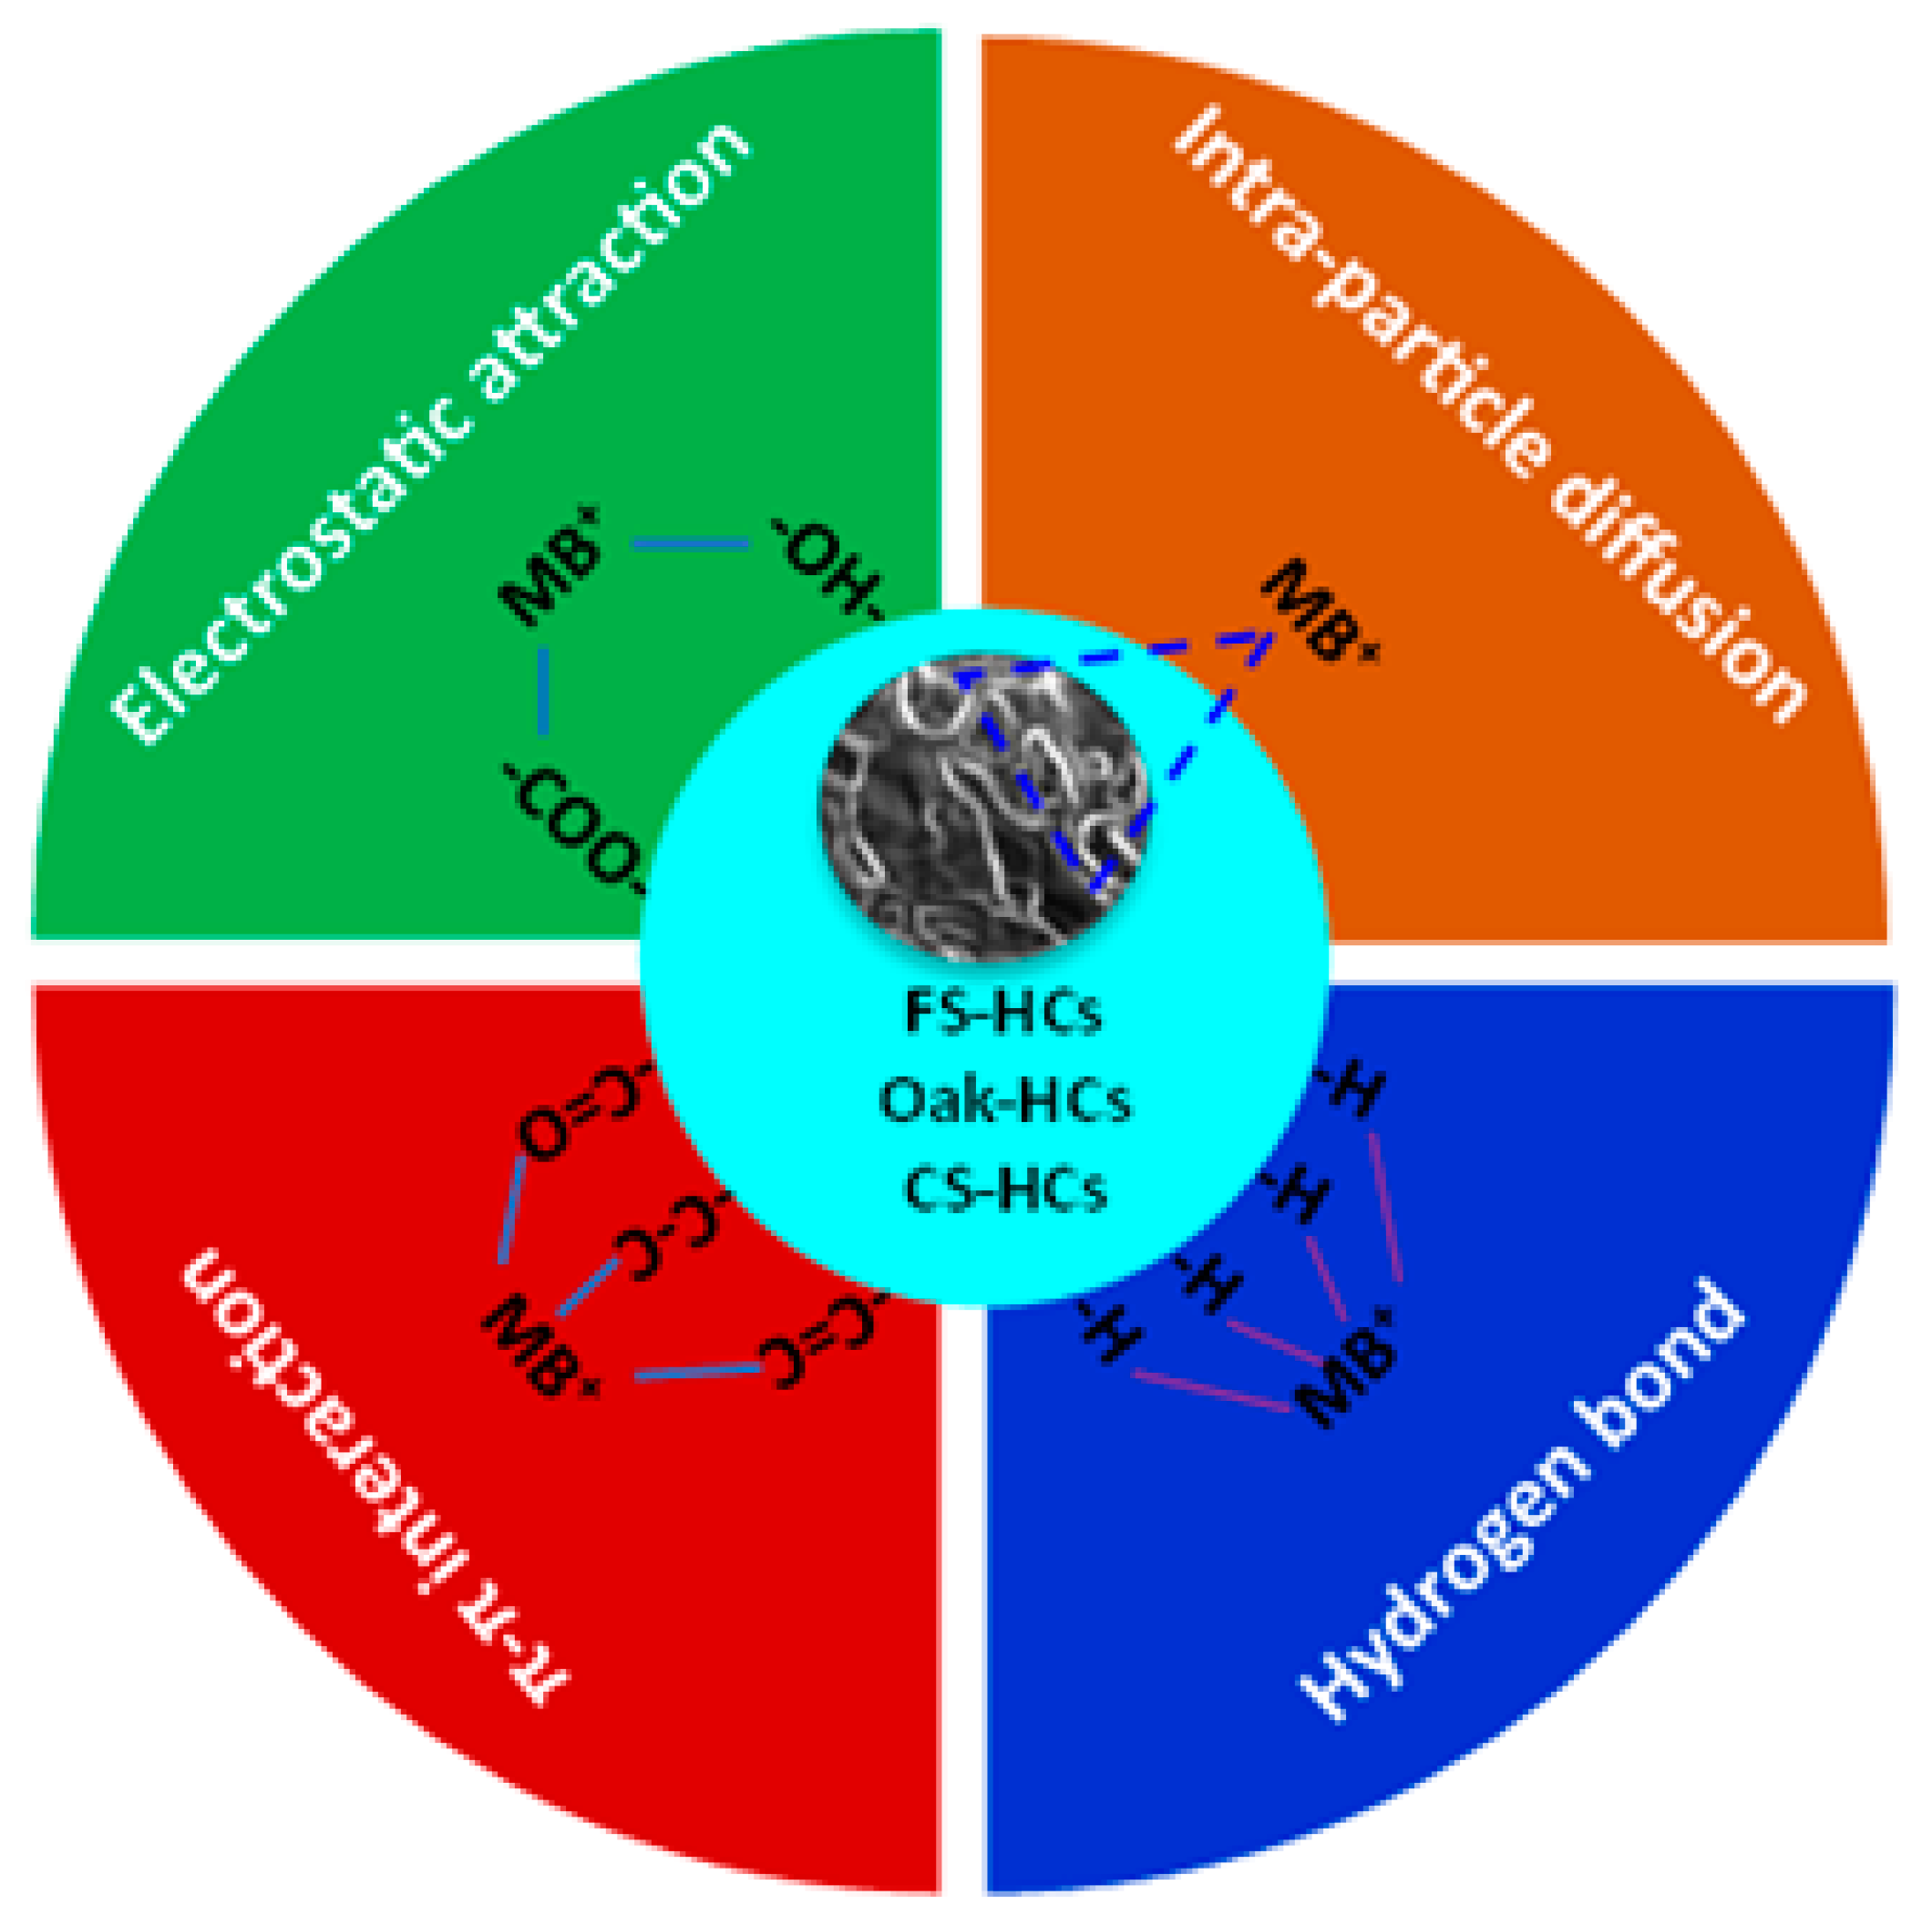
The proposed mechanisms of MB adsorption onto FS-HCs, CS-HCs, and Oak-HCs are illustrated in Figure 6. The MB is a cationic phenothiazine dye. From a previous study, the surface of the FS-HCs, CS-HCs, and Oak-HCs hydrochars contain carboxylic (-OH, -COOH), carbonyl (-C=O), and aromatic (-C=C, -C-C, -CH) groups [33]. As Section 3.2 explains, the adsorption capacities of all Oak-HCs and CS-HCs were maximum at a higher pH (8–12). At higher (alkaline) pH of the aqueous medium, the hydroxy or carbonyl groups on the hydrochars’ surface were dissociated to hydroxy and carbonyl anions allowing these anions to interact with MB cations. Also, the π-π conjugated structure present in (-C=O, -C-C, and -C=C) aromatic bonds within the hydrochars resulted in a greater adsorption force towards MB. This influences the electrostatic interactions between the quaternary ammonium cations in MB and the carbonyl anions on the surface of the hydrochars. In addition, due to the deprotonation of the functional groups, hydrogen bonding exists between the N atoms on the phenothiazine in MB and the hydroxyl (-OH) anions on the surface of the hydrochar. The adsorption on FS-HCs behaves differently and is less affected by a change in pH. The surface functionality of the seaweed hydrochars are different to the lignocellulosic chars. Seaweed hydrochars are generally basic due to increased mineral matter and N functionality, whereas lignocellulosic hydrochars are acidic. In a previous study [70], an XPS survey spectra indicated an increased level of C-O functionality in seaweed chars compared to oak wood hydrochar and higher levels of pryridinic N. The adsorption kinetics in Section 3.4 indicated that the MB on the FS-HCs, CS-HCs, and Oak-HCs was described by a pseudo second-order kinetic model, that is chemisorption. Hence, the predominant interaction mechanisms of the adsorption involved electrostatic attraction and hydrogen bonding. The intraparticle diffusion model, which explained the transfer mechanism, revealed there was film and intraparticle diffusion of MB molecules into the internal surface and filled pores of the hydrochars. Hence, the adsorption process of MB by FS-HCs, CS-HCs, and Oak-HCs was predominantly influenced by electrostatic attraction and hydrogen bonding, coupled with intraparticle diffusion and π-π interactions.
3.7. ANOVA, Modelling and Optimisation
3.7.1. Model Fitting and ANOVA
The results from the ANOVA and the modelling (Tables S2–S4 in the Supplementary Materials) for FS-HCs show that adsorption capacity and percentage of MB removal were significantly affected by the linear model terms (T, C0, and t), interactive terms (T pH and T t), and quadratic terms (t2 and pH2). For modelling of the HTC temperature and initial dye concentration, only the linear model term C0 was highly significant (p < 0.05) for adsorption capacity and percentage of dye removal. To model the effect of HTC temperature and pH on adsorption, the pH was not significant for adsorption capacity and the percentage of dye removal using FS-HCs. Model equations in terms of actual variables relating to the adsorption capacity () and percentage of dye removal are given in Equations (13)–(16).
In the case of CS-HCs, adsorption capacity was significantly affected by the linear model terms (T, C0, t, and pH), interactive term (T pH) and quadratic terms (C02 and t2). Equations in terms of actual variables are presented in Equations (17)–(20). All the stated model terms were highly significant for dye removal efficiency, except the quadratic term (C02). To model the effect of HTC temperature and initial dye concentration, only the linear model term (C0) significantly affected the percentage of dye removal presented in Equation (18), whilst the linear model term (C0) and the quadratic terms (C02) were significant (p < 0.05) for adsorption capacity (Equation (17)). Modelling of the HTC temperature and pH effect on adsorption indicated that the linear model term (T) was not significant (p < 0.05) for adsorption capacity and percentage of dye removal.
For Oak-HCs, the linear model terms (T, C0, pH, t) and quadratic terms (T2, t2) were significant (p < 0.05) for adsorption capacity and percentage of dye removal. Modelling of the initial dye concentration and HTC temperature effect on adsorption found that the linear model term (T) did not significantly affect the percentage of dye removal; only initial dye concentration (C0) showed a significant effect (Equation (22)), while both T and C0 significantly affected adsorption capacity (Equation (21)). In modelling of the pH and HTC temperature effect on adsorption, HTC temperature (T) did not significantly affect adsorption efficiency (Equation (23)) and adsorption capacity. Similar results were obtained for the modelling of HTC temperature and adsorption contact time on the adsorption process. All the model equations in terms of the actual variables are given in Equations (21)–(24).
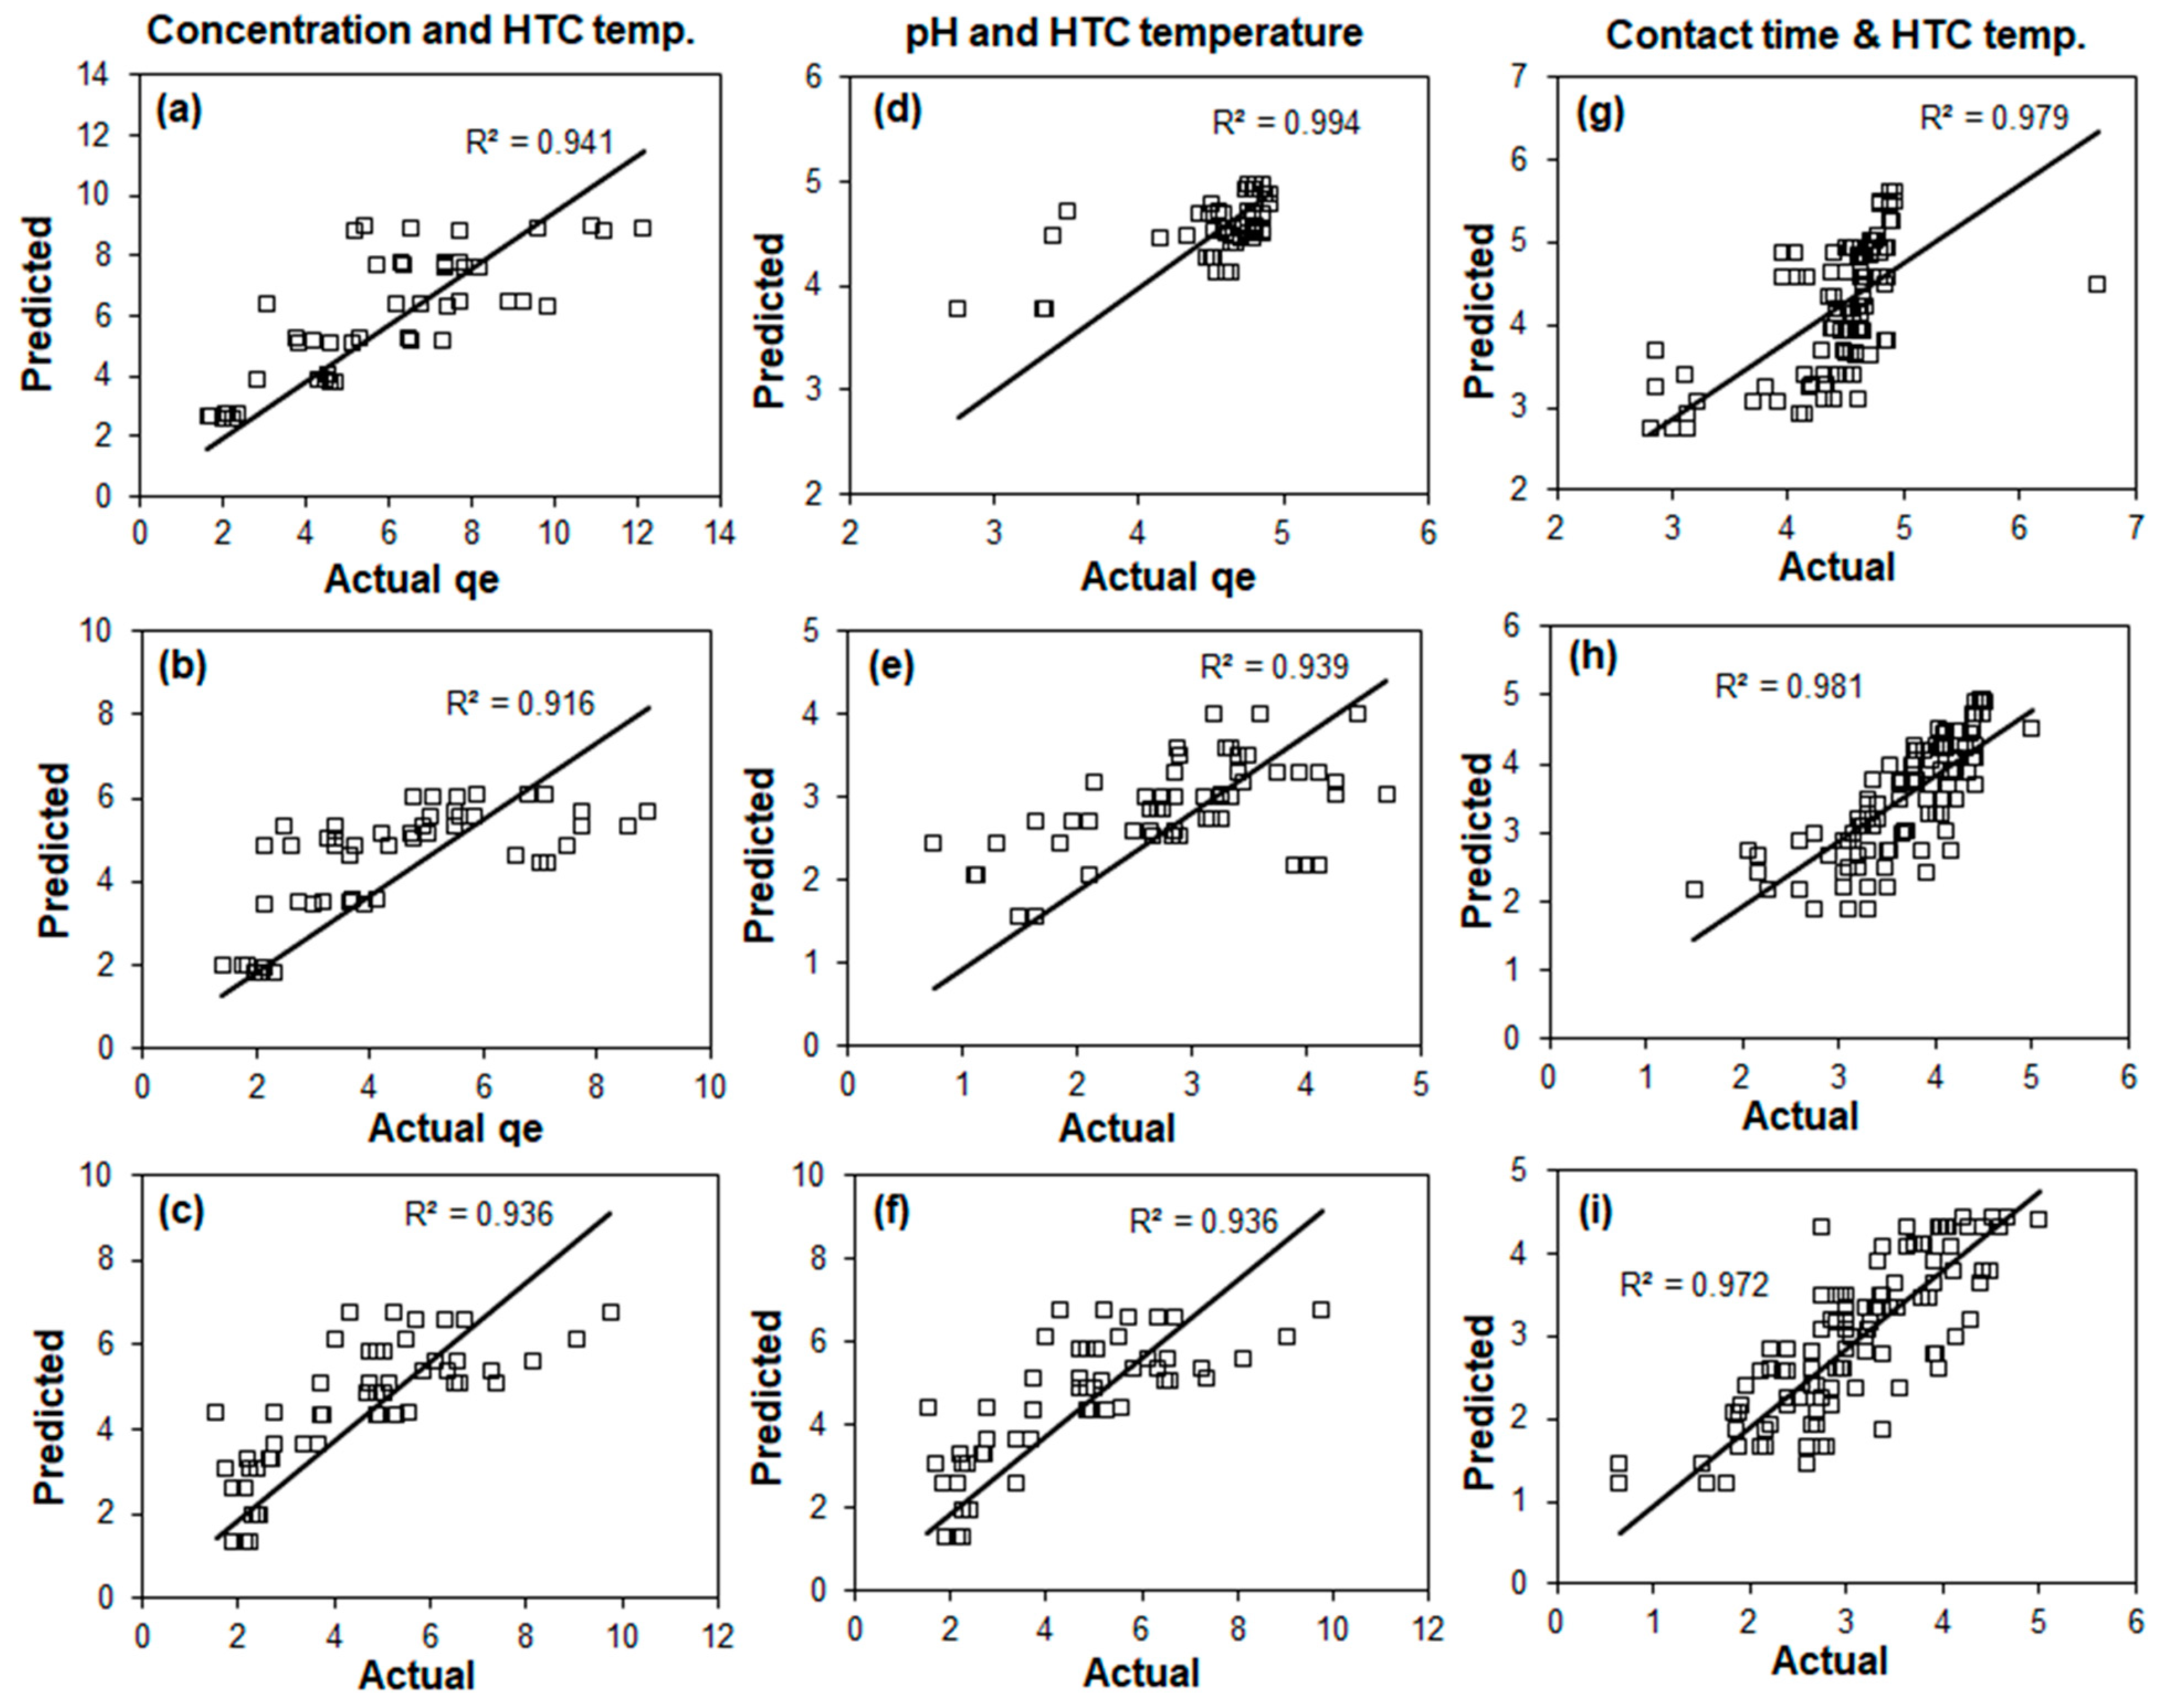
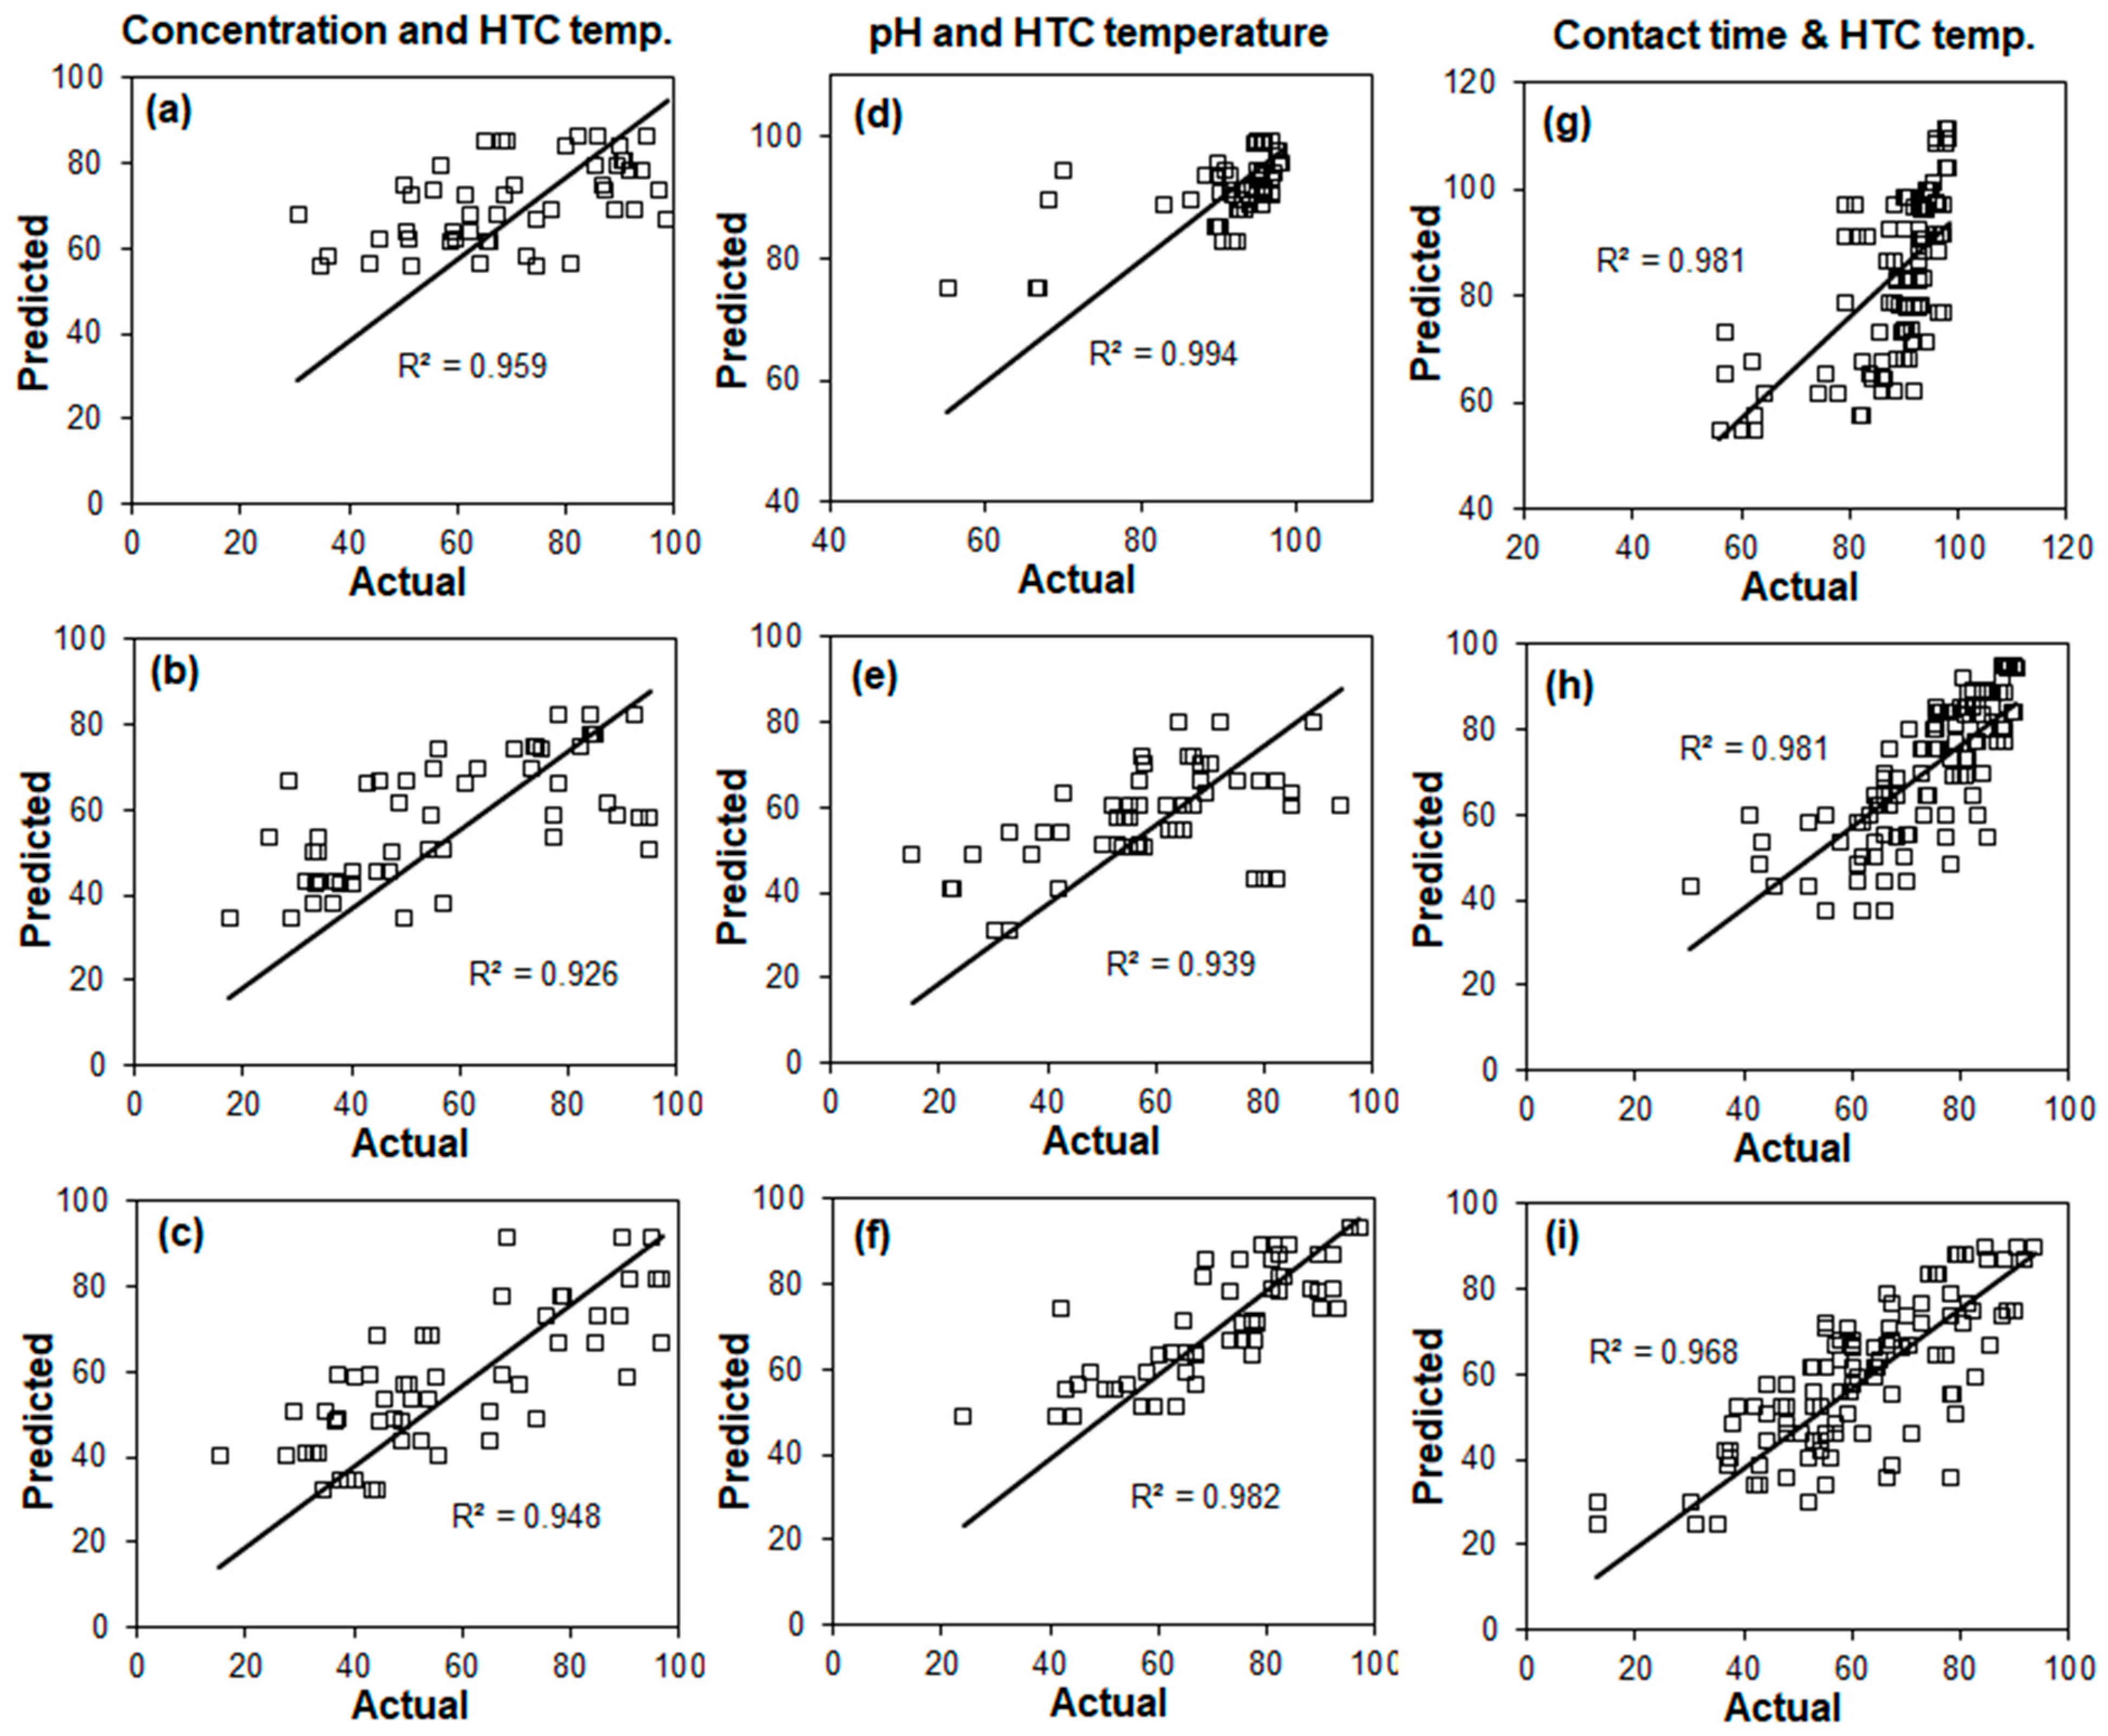
Plots of predicted values against experimental results (shown in Figure 7 and Figure 8) produced high R2 values. For the modelling of initial MB concentration and HTC temperature, values between 0.92–0.94 were obtained for adsorption capacity and 0.93–0.96 for percentage of dye removal. R2 values for pH and HTC temperature modelling range from 0.94–0.99 for adsorption capacity and percentage of MB removal, whilst that for contact time and HTC modelling were in the range 0.97–0.98 for adsorption capacity and percentage dye removal. The high R2 values between the experimental and predicted results indicated that the models developed in this study can be used to make predictions about the effects of HTC temperature on the adsorption properties of hydrochars and adsorption conditions, and their interactive effect on adsorption capacity and percentage removal for the hydrochars studied.
Detailed modelling results in the form of contour plots showing the interactive effect of HTC temperature, initial MB concentration, pH, and contact time on adsorption capacity and removal efficiency are shown in Figures S3–S6 in the Supplementary Materials.
3.7.2. Optimisation
The optimum adsorption conditions for greater dye removal are presented in Table 3. The criteria used were setting the factors (i.e., adsorption conditions and HTC temperature) “in range” and the response (i.e., percent of dye removal) to “maximised”. For FS-HCs, the optimal conditions were an initial dye concentration of 50 mg/L, pH 6, contact time of 84 min, and FS-HC200 to remove more than 99% of the MB dye. CS-HC250 was the best CS-HC to remove up to 95% of the MB from the solution at pH 12, initial MB dye concentration of 50 mg/L, and an adsorption contact time of 150 min. The optimal conditions for the Oak-HCs to remove about 92% of the MB dye were Oak-HC200 using an initial dye concentration of 50 mg/L, pH 12, and contact time of 190 min, although Oak-HC250 and pH 12 removed 93% of the MB from the solution for adsorption at 30 min using an initial dye concentration of 100 mg/L.
4. Conclusions
This study confirms that hydrochars prepared from F. Serratus (FS-HCs), coconut shell (CS-HCs), and oak (Oak-HCs) through hydrothermal carbonisation (HTC) at different temperatures had excellent surface properties and were effective for removing methylene blue (MB) from aqueous solutions. For lignocellulosic-derived hydrochars from oak wood and coconut shell, increasing the pH of the solutions led to a significant increase in the adsorption capacity of the hydrochars and the percentage of MB removed due to the negative charge of the hydrochars aiding in the adsorption of the cationic MB dye. For seaweed-derived hydrochar from F. serratus, the pH has less influence on adsorption. Seaweed hydrochars exhibit higher adsorption under all conditions. Adsorption was fast within the initial 30 min, although this slowed down at the active sites as adsorption became saturated, with FS-HC200 being the best-performing hydrochar, removing >99% of the MB and the optimal adsorption conditions were initial MB concentration of 50 mg/L, pH 6, and contact time of 84 min.
The adsorption mechanism was influenced by the HTC temperature utilised to produce the hydrochars. The adsorption kinetics was suitably described by the pseudo second-order kinetic model (R2 = 0.96–1.00), which was dominated by intraparticle and film diffusion stages. However, sorption of MB onto the hydrochars produced at 200 °C involved three stages: film diffusion, intraparticle diffusion, and adsorptive attachment of the MB molecules, while hydrochars derived at 220 and 250 °C involved two stages, namely film diffusion and intraparticle diffusion. Langmuir (AIC = 7.92–17.71; R2 = 0.83–0.99) and Redlich–Peterson (AIC =19.63–27.02; R2 = 0.79–0.95) isotherm models suitably were more appropriate for MB adsorption onto hydrochars produced at 200 °C and 250 °C, with FS-HC200 having the highest monolayer adsorption capacity of about 8.62 mg/g, while the Freundlich (AIC = −3.79–35.54; R2 = 0.64–0.95) and Redlich–Peterson (AIC = 14.26–23.24; R2 = 0.58–0.99) models fitted best to the data set of MB adsorption onto hydrochars derived at 220 °C.
Models developed here could aid in tailoring the HTC reaction temperature for producing hydrochars from F. Serratus, coconut shell, and oak with high adsorption capacity, and the identification of the best adsorption conditions for the efficient removal of dyes from aqueous solutions. However, areas such as thermodynamics analysis, coexisting anions and coexisting cations, as well as reusability and recycling of the hydrochars, need further investigation to fully understand the real-time applicability of the hydrochars as adsorbents.
Supplementary Materials
The following supporting information can be downloaded at: https://www.mdpi.com/article/10.3390/w15050977/s1, Figure S1: pseudo first-order adsorption kinetics plots for hydrochars produced at: (a) 200 °C; (b) 220 °C; and (c) 250 °C; Figure S2: Freundlich (a–c), Langmuir (d–f), and Redlich-–Peterson (g–i) adsorption isotherm models of MB on FS-HCs, CS-HCs, and Oak-HCs produced at (a,d,g) 200 °C; (b,e,h) 220 °C; and (c,f,i) 250 °C; Figure S3: contour plots showing the effect of initial MB dye concentration and HTC temperature on adsorption capacity: (a) FS-HCs; (b) CS-HCs; and (c) Oak-HCs; Figure S4: contour plots showing the effect of initial MB concentration and HTC temperature on adsorption removal efficiency: (a) FS-HCs; (b) CS-HCs; and (c) Oak-HCs; Figure S5: contour plots showing the effect of solution pH and HTC temperature on adsorption removal efficiency: (a) FS-HCs; (b) CS-HCs; and (c) Oak-HCs; Figure S6: contour plots showing the effect of adsorption time and HTC temperature on adsorption removal efficiency: (a) FS-HCs; (b) CS-HCs; and (c) Oak-HCs; Table S1: pseudo first-order kinetic parameters for adsorption of MB dye onto FS, CS, and Oak hydrochars; Table S2: analysis of variance (ANOVA) for initial concentration models; Table S3: analysis of variance (ANOVA) for initial pH models; Table S4: analysis of variance (ANOVA) for contact time models.
Author Contributions
Conceptualisation, E.D.-B. and A.B.R.; Methodology, M.F. and T.M.; Formal Analysis, M.F. and T.M.; Investigation, M.F. and T.M.; Resources: E.D.-B. and A.B.R.; Data Curation, E.D.-B.; Writing—Original Draft Preparation, M.F. and E.D.-B.; Writing—Review & Editing, A.B.R.; Visualization, M.F. and E.D.-B.; Supervision, E.D.-B.; Project Administration, M.F. and E.D.-B.; Funding Acquisition, A.B.R. All authors have read and agreed to the published version of the manuscript.
Funding
The research was supported by funding from the Biotechnology and Biological Sciences Research Council (BBSRC) through the BEFWAM project under grant agreement [BB/S011439/1] and a DST UKIERI funded thematic partnership between the University of Leeds and the Indian Institute of Technology, Bombay, on the conversion of wet wastes by hydrothermal carbonisation under grant agreement [IND/CONT/GA/18–19/18].
Institutional Review Board Statement
Not applicable.
Informed Consent Statement
Not applicable.
Data Availability Statement
The data presented in this study are available in this published article and its Supplementary Information files.
Conflicts of Interest
The authors declare no conflict of interest. The funders had no role in the design of the study; in the collection, analyses, or interpretation of data; in the writing of the manuscript; or in the decision to publish the results.
References
- Yagub, M.T.; Sen, T.K.; Ang, H.M. Equilibrium, kinetics, and thermodynamics of methylene blue adsorption by pine tree leaves. Water Air Soil Pollut. 2012, 223, 5267–5282. [Google Scholar] [CrossRef]
- Mohan, D.; Sarswat, A.; Ok, Y.S.; Pittman, C.U., Jr. Organic and inorganic contaminants removal from water with biochar, a renewable, low cost and sustainable adsorbent—A critical review. Bioresour. Technol. 2014, 160, 191–202. [Google Scholar] [CrossRef]
- Crini, G. Non-conventional low-cost adsorbents for dye removal: A review. Bioresour. Technol. 2006, 97, 1061–1081. [Google Scholar] [CrossRef]
- Vikrant, K.; Giri, B.S.; Raza, N.; Roy, K.; Kim, K.-H.; Rai, B.N.; Singh, R.S. Recent advancements in bioremediation of dye: Current status and challenges. Bioresour. Technol. 2018, 253, 355–367. [Google Scholar] [CrossRef] [PubMed]
- Bhavani, R.; Sivasamy, A. Sonocatalytic degradation of malachite green oxalate by a semiconductor metal oxide nanocatalyst. Ecotoxicol. Environ. Saf. 2016, 134, 403–411. [Google Scholar] [CrossRef] [PubMed]
- Chaudhari, A.U.; Paul, D.; Dhotre, D.; Kodam, K.M. Effective biotransformation and detoxification of anthraquinone dye reactive blue 4 by using aerobic bacterial granules. Water Res. 2017, 122, 603–613. [Google Scholar] [CrossRef]
- Katheresan, V.; Kansedo, J.; Lau, S.Y. Efficiency of various recent wastewater dye removal methods: A review. J. Environ. Chem. Eng. 2018, 6, 1676–4697. [Google Scholar] [CrossRef]
- Velusamy, S.; Roy, A.; Sundaram, S.; Mallick, T.K. A review on heavy metal ions and containing dyes removal through graphene oxide-based adsorption strategies for textile wastewater treatment. Chem. Rec. 2021, 21, 1570–1610. [Google Scholar] [CrossRef]
- Sun, K.; Ro, K.; Guo, M.; Novak, J.; Mashayekhi, H.; Xing, B. Sorption of bisphenol A, 17α-ethinyl estradiol and phenanthrene on thermally and hydrothermally produced biochars. Bioresour. Technol. 2011, 102, 5757–5763. [Google Scholar] [CrossRef] [PubMed]
- Mui, E.L.K.; Cheung, W.H.; Valix, M.; McKay, G. Dye adsorption onto char from bamboo. J. Hazard. Mater. 2010, 177, 1001–1005. [Google Scholar] [CrossRef] [PubMed]
- Xu, R.-K.; Xiao, S.-C.; Yuan, J.-H.; Zhao, A.-Z. Adsorption of methyl violet from aqueous solutions by the biochars derived from crop residues. Bioresour. Technol. 2011, 102, 10293–10298. [Google Scholar] [CrossRef] [PubMed]
- Yang, Y.; Lin, X.; Wei, B.; Zhao, Y.; Wang, J. Evaluation of adsorption potential of bamboo biochar for metal-complex dye: Equilibrium, kinetics and artificial neural network modeling. Int J. Environ. Sci. Technol. 2014, 11, 1093–1100. [Google Scholar] [CrossRef]
- Dzyazko, Y.S.; Palchik, O.V.; Ogenko, V.M.; Shtemberg, L.Y.; Bogomaz, V.I.; Protsenko, S.A.; Khomenko, V.G.; Makeeva, I.S.; Chernysh, O.V.; Dzyazko, O.G. Nanoporous biochar for removal of toxic organic compounds from water. In Nanophotonics, Nanooptics, Nanobiotechnology, and Their Applications; Fesenko, O., Yatsenko, L., Eds.; Springer Proceedings in Physics, NANO 2018; Springer: New York, NY, USA, 2019; Volume 222. [Google Scholar] [CrossRef]
- Ramavandi, B.; Farjadfard, S. Removal of chemical oxygen demand from textile wastewater using a natural coagulant. Korean J. Chem. Eng. 2014, 31, 81–87. [Google Scholar] [CrossRef]
- Kambo, H.S.; Dutta, A. A comparative review of biochar and hydrochar in terms of production, hysico-chemical properties and applications. Renew. Sustain. Energy Rev. 2015, 45, 359–378. [Google Scholar] [CrossRef]
- Libra, J.A.; Ro, K.S.; Kammann, C.; Funke, A.; Berge, N.D.; Neubauer, Y.; Titirici, M.-M.; Fühner, C.; Bens, O.; Jürgen Kern, J.; et al. Hydrothermal carbonization of biomass residuals: A comparative review of the chemistry, processes and applications of wet and dry pyrolysis. Biofuels 2011, 2, 71–106. [Google Scholar] [CrossRef] [Green Version]
- Downie, A.; Crosky, A.; Munroe, P. Physical properties of biochar. In Biochar for Environmental Management: Science and Technology, 1st ed.; Lehmann, J., Joseph, S., Eds.; Earthscan: London, UK, 2009; pp. 13–32. [Google Scholar]
- Martin, M.J.; Artola, A.; Dolors Balaguer, M.; Rigola, M. Activated carbons developed from surplus sewage sludge for the removal of dyes from dilute aqueous solutions. Chem. Eng. J. 2003, 94, 231–239. [Google Scholar] [CrossRef]
- Li, Y.; Meas, A.; Shan, S.; Yang, R.; Gai, X. Production and optimization of bamboo hydrochars for adsorption of Congo red and 2-naphthol. Bioresour. Technol. 2016, 207, 379–386. [Google Scholar] [CrossRef]
- Qian, W.C.; Luo, X.P.; Wang, X.; Guo, M.; Li, B. Removal of methylene blue from aqueous solution by modified bamboo hydrochar. Ecotoxicol. Environ. Saf. 2018, 157, 300–306. [Google Scholar] [CrossRef]
- Li, B.; Wang, Q.; Guo, J.-Z.; Huan, W.-W.; Liu, K. Sorption of methyl orange from aqueous solution by protonated amine modified hydrochar. Bioresour. Technol. 2018, 268, 454–459. [Google Scholar] [CrossRef]
- Wu, F.-C.; Liu, B.-L.; Wu, K.-T.; Tseng, R.-L. A new linear form analysis of Redlich-Peterson isotherm equation for the adsorption of dyes. Chem. Eng. J. 2010, 162, 21–27. [Google Scholar] [CrossRef]
- Tran, T.H.; Le, A.H.; Phama, T.H.; Nguyen, D.T.; Chang, S.W.; Chung, W.J.; Nguyen, D.D. Adsorption isotherms and kinetic modeling of methylene blue dye onto a carbonaceous hydrochar adsorbent derived from coffee husk waste. Sci. Total Environ. 2020, 725, 138325. [Google Scholar] [CrossRef] [PubMed]
- Cheng, L.; Ji, Y.; Liu, X. Insights into interfacial interaction mechanism of dyes sorption on a novel hydrochar: Experimental and DFT study. Chem. Eng. Sci. 2021, 233, 116432. [Google Scholar] [CrossRef]
- Li, H.-Z.; Zhang, Y.-N.; Guo, J.-Z.; Lv, J.-Q.; Huan, W.-W.; Li, B. Preparation of hydrochar with high adsorption performance for methylene blue by co-hydrothermal carbonization of polyvinyl chloride and bamboo. Bioresour. Technol. 2021, 337, 125442. [Google Scholar] [CrossRef]
- Chung, J.W.; Edewi, O.C.; Foppen, J.W.; Gerner, G.; Krebs, R.; Lens, O.N.L. Removal of Escherichia coli by intermittent operation of saturated sand columns supplemented with hydrochar derived from sewage sludge. Appl. Sci. 2017, 7, 839. [Google Scholar] [CrossRef] [Green Version]
- Danso-Boateng, E.; Nyktari, E.; Wheatley, A.D.; Holdich, R.G.; Mohammed, A.S. Removal of organic pollutants from effluent of anaerobic digester using hydrochars produced from faecal simulant and sewage sludge. Water Air Soil Pollut. 2020, 231, 192. [Google Scholar] [CrossRef]
- Eljamal, O.; Sasaki, K.; Hirajima, T. Numerical simulation for reactive solute transport of arsenic in permeable reactive barrier column including zero-valent iron. Appl. Math. Model. 2011, 35, 5198–5207. [Google Scholar] [CrossRef]
- Maamoun, I.; Falyouna, O.; Eljamal, R.; Bensaida, K.; Eljamal, O. Optimization modeling of nFe0/Cu-PRB Design for Cr(VI) Removal from Groundwater. Int. J. Environ. Sci. Dev. 2021, 12, 131–138. [Google Scholar] [CrossRef]
- Eljamal, O.; Maamoun, I.; Alkhudhayri, S.; Eljamal, R.; Falyouna, O.; Tanaka, K.; Kozai, N.; Sugihara, Y. Insights into boron removal from water using Mg-Al-LDH: Reaction parameters optimization & 3D-RSM modeling. J. Water Process Eng. 2022, 46, 102608. [Google Scholar] [CrossRef]
- Danso-Boateng, E.; Mohammed, A.S.; Sander, G.; Wheatley, A.D.; Nyktari, E.; Usen, I.C. Production and characterisation of adsorbents synthesized by hydrothermal carbonisation of biomass wastes. SN Appl. Sci. 2021, 3, 257. [Google Scholar] [CrossRef]
- Elaigwu, S.E.; Greenway, G.M. Characterization of energy-rich hydrochars from microwave-assisted hydrothermal carbonization of coconut shell. Waste Biomass Valoriz. 2019, 10, 1979–1987. [Google Scholar] [CrossRef]
- Danso-Boateng, E.; Ross, A.B.; Mariner, T.; Hammerton, J.; Fitzsimmons, M. Hydrochars produced by hydrothermal carbonisation of seaweed, coconut shell and oak: Effect of processing temperature on physicochemical adsorbent characteristics. SN Appl. Sci. 2022, 4, 203. [Google Scholar] [CrossRef]
- Saha, N.; Volpe, M.; Fiori, L.; Volpe, R.; Messineo, A.; Reza, T.M. Cationic dye adsorption on hydrochars of winery and citrus juice industries residues: Performance, mechanism, and thermodynamics. Energies 2020, 13, 4686. [Google Scholar] [CrossRef]
- Magat, S.S. Achieving coconut supply reliability through research-based crop nutrition management of coconut farms in the Philippines. CORD 2003, 19, 34. [Google Scholar] [CrossRef]
- Shahbandeh, M. Global Coconut Production 2000–2022. Available online: https://www.statista.com/statistics/577497/world-coconut-production/ (accessed on 11 October 2022).
- Ahmady-Asbchin, S.; Andrès, Y.; Gérente, C.; Cloirec, P. Biosorption of Cu (II) from aqueous solution by Fucus serratus: Surface characterization and sorption mechanisms. Bioresour. Technol. 2008, 99, 6150–6155. [Google Scholar] [CrossRef] [PubMed]
- Stiger-Pouvreau, V.; Bourgougnon, N.; Deslandes, E. Carbohydrates from seaweeds. In Seaweed in Health and Disease Prevention; Fleurence, J., Levine, I., Eds.; Elsevier: Amsterdam, The Netherlands, 2016; pp. 223–274. [Google Scholar] [CrossRef]
- Catarino, M.D.; Silva, A.M.S.; Cardoso, S.M. Phycochemical constituents and biological activities of Fucus spp. Mar. Drugs 2018, 16, 249. [Google Scholar] [CrossRef] [Green Version]
- Volpe, M.; Messineo, A.; Mäkelä, M.; Barr, M.R.; Volpe, R.; Corrado, C.; Fiori, L. Reactivity of cellulose during hydrothermal carbonization of lignocellulosic biomass. Fuel Process Technol. 2020, 206, 106456. [Google Scholar] [CrossRef]
- Borrero-lópez, A.M.; Masson, E.; Celzard, A.; Fierro, V. Modelling the reactions of cellulose, hemicellulose and lignin submitted to hydrothermal treatment. Ind. Crops Prod. 2018, 124, 919–930. [Google Scholar] [CrossRef]
- Mäkelä, M.; Volpe, M.; Volpe, R.; Fiori, L.; Dahl, O. Spatially resolved spectral determination of polysaccharides in hydrothermally carbonized biomass. Green Chem. 2018, 20, 1114–1120. [Google Scholar] [CrossRef] [Green Version]
- Jawad, A.H.; Rashid, R.A.; Ishak, M.A.M.; Wilson, L.D. Adsorption of methylene blue onto activated carbon developed from biomass waste by H2SO4 activation: Kinetic, equilibrium and thermodynamic studies. Desalin. Water Treat. 2016, 57, 25194–25206. [Google Scholar] [CrossRef]
- Falyouna, O.; Bensaida, K.; Maamoun, I.; Ashik, U.P.M.; Tahara, A.; Tanaka, K.; Aoyagi, N.; Sugihara, Y.; Eljamal, O. Synthesis of hybrid magnesium hydroxide/magnesium oxide nanorods [Mg(OH)2/MgO] for prompt and efficient adsorption of ciprofloxacin from aqueous solutions. J. Clean. Prod. 2022, 342, 130949. [Google Scholar] [CrossRef]
- Martínez-Mendoza, K.L.; Barraza-Burgos, J.M.; Marriaga-Cabrales, N.; Machuca-Martinez, F.; Barajas, M.; Romero, M. Production and characterization of activated carbon from coal for gold adsorption in cyanide solutions. Ing. Investig. 2020, 40, 34–44. [Google Scholar] [CrossRef]
- Faust, D.S.; Aly, O.M. Chemistry of Wastewater Treatment; CRC Press: Boca Raton, FL, USA, 2018. [Google Scholar] [CrossRef]
- Arumugam, N.; Chelliapan, S.; Kamyab, H.; Thirugnana, S.; Othman, N.; Nasri, N.S. Treatment of wastewater using seaweed: A review. Int. J. Environ. Res. Public Health 2018, 15, 2851. [Google Scholar] [CrossRef] [Green Version]
- Jóźwiak, T.; Filipkowska, U.; Bugajska, P.; Kalkowski, T. The use of coconut shells for the removal of dyes from aqueous solutions. J. Ecol. Eng. 2018, 19, 129–135. [Google Scholar] [CrossRef]
- Liu, J.-L.; Qian, W.-C.; Guo, J.-Z.; Shen, Y.; Li, B. Selective removal of anionic and cationic dyes by magnetic Fe3O4-loaded amine-modified hydrochar. Bioresour. Technol. 2021, 320, 124374. [Google Scholar] [CrossRef]
- Foo, K.Y.; Hameed, B.H. Coconut husk derived activated carbon via microwave induced activation: Effects of activation agents, preparation parameters and adsorption performance. Chem. Eng. J. 2012, 184, 57–65. [Google Scholar] [CrossRef]
- Lv, B.-W.; Xu, H.; Guo, J.-Z.; Bai, L.-Q.; Li, B. Efficient adsorption of methylene blue on carboxylate-rich hydrochar prepared by one-step hydrothermal carbonization of bamboo and acrylic acid with ammonium persulphate. J. Hazard. Mater. 2022, 421, 126741. [Google Scholar] [CrossRef] [PubMed]
- Liyanage, C.D.; Pieris, M. A physico-chemical properties of coconut shell powder. Procedia Chem. 2015, 16, 222–228. [Google Scholar] [CrossRef] [Green Version]
- Islam, M.A.; Ahmed, M.J.; Khanday, W.A.; Asif, M.; Hameed, B.H. Mesoporous activated coconut shell-derived hydrochar prepared via hydrothermal carbonization-NaOH activation for methylene blue adsorption. J. Environ. Manag. 2017, 203, 237–244. [Google Scholar] [CrossRef]
- Sangian, H.F.; Widjaja, A. The effect of alkaline concentration on coconut husk crystallinity and the yield of sugars released. IOP Conf. Ser. Mater. Sci. Eng. 2018, 306, 012046. [Google Scholar] [CrossRef]
- Floch, A.L.; Jourdes, M.; Teissedre, P.-L. Polysaccharides and lignin from oak wood used in cooperage: Composition, interest, assays: A review. Carbohydr. Res. 2015, 417, 94–102. [Google Scholar] [CrossRef]
- Navarro, A.E.; Portales, R.F.; Sun-Kou, M.R.; Llanos, B.P. Effect of pH on phenol biosorption by marine seaweeds. J. Hazard. Mater. 2008, 156, 405–411. [Google Scholar] [CrossRef]
- Zhang, P.; Li, Y.; Cao, Y.; Han, L. Characteristics of tetracycline adsorption by cow manure biochar prepared at different pyrolysis temperatures. Bioresour. Technol. 2019, 285, 121348. [Google Scholar] [CrossRef] [PubMed]
- Liu, L.; Gao, Z.Y.; Su, X.P.; Chen, X.; Jiang, L.; Yao, J.M. Adsorption removal of dyes from single and binary solutions using a cellulose-based bioadsorbent. ACS Sustain. Chem. Eng. 2015, 3, 432–442. [Google Scholar] [CrossRef]
- Wang, Z.; Xiang, B.; Cheng, R.; Li, Y. Behaviors and mechanism of acid dyes sorption onto diethylenetriamine-modified native and enzymatic hydrolysis starch. J. Hazard. Mater. 2010, 183, 224–232. [Google Scholar] [CrossRef]
- Qu, J.; Wang, Y.; Tian, X.; Jiang, Z.; Deng, F.; Tao, Y.; Jiang, Q.; Wang, L.; Zhang, Y. KOH-activated porous biochar with high specific surface area for adsorptive removal of chromium (VI) and naphthalene from water: Affecting factors, mechanisms and reusability exploration. J. Hazard. Mater. 2021, 401, 123292. [Google Scholar] [CrossRef] [PubMed]
- Pei, Y.; Wu, X.; Xu, G.; Sun, Z.; Zheng, X.; Liu, J.; Tang, K. Tannin-immobilized cellulose microspheres as effective adsorbents for removing cationic dye (Methylene Blue) from aqueous solution. J. Chem. Technol. Biotechnol. 2017, 92, 1276–1284. [Google Scholar] [CrossRef]
- Wei, J.; Liu, Y.; Li, J.; Zhu, Y.; Yu, H.; Peng, Y. Adsorption and co-adsorption of tetracycline and doxycycline by one-step synthesized iron loaded sludge biochar. Chemosphere 2019, 236, 124254. [Google Scholar] [CrossRef]
- Batzias, F.A.; Sidiras, D.K. Dye adsorption by calcium chloride treated in batch and fixed bed systems. J. Hazard. Mater. 2004, 114, 167–174. [Google Scholar] [CrossRef] [PubMed]
- Parshetti, G.K.; Chowdhury, S.; Balasubramanian, R. Hydrothermal conversion of urban food waste to chars for removal of textile dyes from contaminated waters. Bioresour. Technol. 2014, 161, 310–319. [Google Scholar] [CrossRef]
- Redlich, O.; Peterson, D.L. A useful adsorption isotherm. J. Phys. Chem. 1959, 63, 1024–1026. [Google Scholar] [CrossRef]
- Dávila-Jiménez, M.M.; Elizalde-González, M.P.; García-Díaz, E.; González-Perea, M.; Guevara-Villa, M.R.G. Using Akaike Information Criterion to select the optimal isotherm equation for adsorption from solution. Adsorpt. Sci. Technol. 2014, 32, 605–622. [Google Scholar] [CrossRef]
- Melo, B.C.; Francisco, A.A.; Paulino, A.A.; Cardoso, V.A.; Pereira, A.G.B.; Fajardo, A.R.; Rodrigues, F.H.A. Cellulose nanowhiskers improve the methylene blue adsorption capacity of chitosan-g-poly(acrylic acid) hydrogel. Carbohydr. Polym. 2018, 181, 358–367. [Google Scholar] [CrossRef]
- Somsesta, N.; Sricharoenchaikul, V.; Aht-Ong, D. Adsorption removal of methylene blue onto activated carbon/cellulose biocomposite films: Equilibrium and kinetic studies. Mater. Chem. Phys. 2020, 240, 122221. [Google Scholar] [CrossRef]
- Hasan, M.; Ahmed, A.L.; Hameed, B.H. Adsorption of reactive dye onto cross-linked chitosan/oil palm ash composite beads. Chem. Eng. J. 2008, 136, 164–172. [Google Scholar] [CrossRef]
- Quintana-Najera, J.; Blacker, A.J.; Fletcher, L.A.; Ross, A.B. The effect of augmentation of biochar and hydrochar in anaerobic digestion of a model substrate. Bioresour. Technol. 2021, 321, 124494. [Google Scholar] [CrossRef]
Figure 1.
Effect of initial MB dye concentration and HTC temperature on adsorption capacity of hydrochars derived at: (a) 200 °C; (b) 220 °C; and (c) 250 °C.
Figure 1.
Effect of initial MB dye concentration and HTC temperature on adsorption capacity of hydrochars derived at: (a) 200 °C; (b) 220 °C; and (c) 250 °C.

Figure 2.
Effect of initial MB concentration and HTC temperature on adsorption removal efficiency of hydrochars derived at (a) 200 °C; (b) 220 °C; and (c) 250 °C.
Figure 2.
Effect of initial MB concentration and HTC temperature on adsorption removal efficiency of hydrochars derived at (a) 200 °C; (b) 220 °C; and (c) 250 °C.

Figure 3.
Effect of solution pH and HTC temperature on adsorption removal efficiency of hydrochars derived at (a) 200 °C; (b) 220 °C; and (c) 250 °C.
Figure 3.
Effect of solution pH and HTC temperature on adsorption removal efficiency of hydrochars derived at (a) 200 °C; (b) 220 °C; and (c) 250 °C.


Figure 4.
Effect of adsorption contact time and HTC temperature on adsorption removal efficiency of hydrochars derived at (a) 200 °C; (b) 220 °C; and (c) 250 °C.
Figure 4.
Effect of adsorption contact time and HTC temperature on adsorption removal efficiency of hydrochars derived at (a) 200 °C; (b) 220 °C; and (c) 250 °C.

Figure 5.
Pseudo second-order (a–c), and intraparticle diffusion (d–f) adsorption kinetic models of MB dye on FS-HCs, CS-HCs, and Oak-HCS produced at (a,d) 200 °C; (b,e) 220 °C; and (c,f) 250 °C.
Figure 5.
Pseudo second-order (a–c), and intraparticle diffusion (d–f) adsorption kinetic models of MB dye on FS-HCs, CS-HCs, and Oak-HCS produced at (a,d) 200 °C; (b,e) 220 °C; and (c,f) 250 °C.


Figure 6.
Proposed chemical pathways involved in the removal mechanism of MB onto the hydrochars.

Figure 7.
Predicted vs. actual results of adsorption capacity for: concentration and HTC temperature modelling; (a) FS hydrochars, (b) CS hydrochars, (c) Oak hydrochars. pH and HTC temperature modelling; (d) FS hydrochars, (e) CS hydrochars, (f) Oak hydrochars. Contact time and HTC temperature modelling; (g) FS hydrochars, (h) CS hydrochars, (i) Oak hydrochars.

Figure 8.
Predicted vs. actual results of percentage dye removal for: concentration and HTC temperature modelling; (a) FS hydrochars, (b) CS hydrochars, (c) Oak hydrochars. pH and HTC temperature modelling; (d) FS hydrochars, (e) CS hydrochars, (f) Oak hydrochars. Contact time and HTC temperature modelling; (g) FS hydrochars, (h) CS hydrochars, (i) Oak hydrochars.


Table 1.
Comparison of kinetic parameters for adsorption of MB dye onto FS-HCs, CS-HCs, and Oak-HCs.
Table 1.
Comparison of kinetic parameters for adsorption of MB dye onto FS-HCs, CS-HCs, and Oak-HCs.
| Hydrochars | Pseudo Second-Order | Intraparticle Diffusion | |||||||||||
|---|---|---|---|---|---|---|---|---|---|---|---|---|---|
| k2 | qe | h | R2 | ki1 | C1 | R2 | Ki2 | C2 | R2 | Ki3 | C3 | R2 | |
| FS-HC200 | 4.93 | 0.98 | 4.69 | 1.00 | 0.36 | 2.64 | 1.00 | 0.10 | 3.98 | 0.99 | 0.01 | 4.80 | 0.36 |
| CS-HC200 | 4.46 | 0.01 | 0.001 | 0.99 | 0.90 | −1.92 | 1.00 | 0.42 | 0.01 | 0.99 | 0.12 | 2.38 | 0.92 |
| Oak-HC200 | 4.55 | 0.02 | 0.0002 | 0.99 | 0.23 | 2.32 | 0.51 | 0.21 | 1.87 | 0.52 | 0.15 | 2.19 | 0.83 |
| FS-HC220 | 4.98 | 0.09 | 0.04 | 1.00 | 0.29 | 2.18 | 0.94 | 0.02 | 4.51 | 0.68 | – | – | – |
| CS-HC220 | 4.39 | 0.03 | 0.001 | 1.00 | 0.01 | 3.26 | 0.03 | 0.08 | 3.07 | 0.84 | – | – | – |
| Oak-HC220 | 3.41 | 0.01 | 0.0002 | 0.98 | 0.40 | 0.001 | 0.93 | 0.12 | 1.42 | 0.74 | – | – | – |
| FS-HC250 | 4.46 | 13.25 | 784.18 | 0.99 | 0.01 | 4.43 | 0.31 | 0.22 | 1.35 | 0.80 | – | – | – |
| CS-HC250 | 4.39 | 0.94 | 3.86 | 1.00 | 0.28 | 2.49 | 0.96 | 0.08 | 3.56 | 0.86 | 0.03 | 4.00 | 0.82 |
| Oak-HC250 | 3.48 | 0.07 | 0.02 | 0.96 | 0.21 | 1.47 | 0.70 | 0.01 | 3.30 | 1.00 | – | – | – |
Table 2.
Comparison of adsorption isotherm models for MB dye adsorption onto FS-HCs, CS-HCs, and Oak-HCs.
Table 2.
Comparison of adsorption isotherm models for MB dye adsorption onto FS-HCs, CS-HCs, and Oak-HCs.
| Isotherm | Hydrochar | ||||||||
|---|---|---|---|---|---|---|---|---|---|
| FS- HC200 | CS- HC200 | Oak- HC200 | FS- HC220 | CS- HC220 | Oak- HC220 | FS- HC250 | CS- HC250 | Oak- HC250 | |
| Freundlich | |||||||||
| n | 3.22 | 16.95 | 3.31 | 1.87 | 2.96 | 3.37 | 3.12 | 3.56 | 4.70 |
| KF (mg/g) | 3.85 | 12.59 | 2.72 | 3.18 | 1.08 | 1.09 | 3.79 | 2.58 | 3.62 |
| R2 | 0.59 | 0.02 | 0.61 | 0.64 | 0.95 | 0.70 | 0.62 | 0.36 | 0.57 |
| AIC | 13.27 | 14.55 | 10.30 | 35.54 | −3.79 | 5.80 | 13.31 | 17.04 | 9.49 |
| Langmuir | |||||||||
| b (L/mg) | 0.06 | 0.05 | 0.08 | 0.01 | 0.56 | 0.01 | 0.07 | 0.19 | 0.06 |
| qm (mg/g) | 8.62 | 5.10 | 6.94 | 28.57 | 10.10 | 10.10 | 8.55 | 5.16 | 5.62 |
| R2 | 0.88 | 0.96 | 0.99 | 0.34 | 0.93 | 0.56 | 0.96 | 0.83 | 0.86 |
| RL | 0.12 | 0.14 | 0.09 | 0.50 | 0.01 | 0.36 | 0.10 | 0.04 | 0.12 |
| AIC | 13.43 | 17.71 | 7.92 | 28.85 | 28.00 | 12.42 | 12.48 | 16.64 | 10.97 |
| Redlich–Peterson | |||||||||
| q’m | 1.94 | 3.06 | 1.56 | 0.62 | 1.08 | 1.00 | 1.91 | 1.58 | 1.94 |
| bRP (m3/g) | 5.16 | 16.36 | 32.04 | 16.02 | 9.27 | 9.98 | 5.23 | 6.35 | 5.15 |
| α | 0.70 | 0.94 | 0.70 | 0.47 | 0.70 | 0.71 | 0.69 | 0.73 | 0.81 |
| R2 | 0.87 | 0.86 | 0.89 | 0.58 | 0.99 | 0.93 | 0.88 | 0.79 | 0.95 |
| AIC | 23.20 | 24.49 | 20.28 | 23.24 | 14.26 | 15.90 | 23.67 | 27.02 | 19.63 |
Table 3.
Optimisation of adsorption conditions and HTC temperature.
| Conditions | % Dye Removal | ||
|---|---|---|---|
| FS-HC | CS-HC | Oak-HC | |
| Concentration modelling | |||
| 50 mg/L, 250 °C | 86.48 | 82.60 | |
| 50 mg/L, 200 °C | 91.73 | ||
| pH modelling | |||
| pH 6, 200 °C | 99.40 | ||
| pH 12, 250 °C | 80.22 | 93.42 | |
| Contact time modelling | |||
| 84 min, 200 °C | 98.85 | ||
| 190 min, 200 °C | 90.18 | ||
| 150 min, 250 °C | 95.01 | ||
Disclaimer/Publisher’s Note: The statements, opinions and data contained in all publications are solely those of the individual author(s) and contributor(s) and not of MDPI and/or the editor(s). MDPI and/or the editor(s) disclaim responsibility for any injury to people or property resulting from any ideas, methods, instructions or products referred to in the content. |
© 2023 by the authors. Licensee MDPI, Basel, Switzerland. This article is an open access article distributed under the terms and conditions of the Creative Commons Attribution (CC BY) license (https://creativecommons.org/licenses/by/4.0/).
Share and Cite
MDPI and ACS Style
Danso-Boateng, E.; Fitzsimmons, M.; Ross, A.B.; Mariner, T. Response Surface Modelling of Methylene Blue Adsorption onto Seaweed, Coconut Shell and Oak Wood Hydrochars. Water 2023, 15, 977. https://doi.org/10.3390/w15050977
AMA Style
Danso-Boateng E, Fitzsimmons M, Ross AB, Mariner T. Response Surface Modelling of Methylene Blue Adsorption onto Seaweed, Coconut Shell and Oak Wood Hydrochars. Water. 2023; 15(5):977. https://doi.org/10.3390/w15050977
Chicago/Turabian StyleDanso-Boateng, Eric, Melissa Fitzsimmons, Andrew B. Ross, and Ted Mariner. 2023. "Response Surface Modelling of Methylene Blue Adsorption onto Seaweed, Coconut Shell and Oak Wood Hydrochars" Water 15, no. 5: 977. https://doi.org/10.3390/w15050977
Note that from the first issue of 2016, this journal uses article numbers instead of page numbers. See further details here.