

Advances in Assessing the Reliability of Water Distribution Networks: A Bibliometric Analysis and Scoping Review


1
Department of Civil Engineering, Institute of Technology, Nirma University, Ahmedabad 382481, Gujarat, India
2
Department of Civil and Environmental Engineering, Faculty of Engineering, United Arab Emirates University, Al Ain P.O. Box 15551, United Arab Emirates
3
Department of Electrical Engineering, Faculty of Engineering, American University of Sharjah, Sharjah P.O. Box 2666, United Arab Emirates
*
Author to whom correspondence should be addressed.
Water 2023, 15(5), 986; https://doi.org/10.3390/w15050986
Submission received: 1 November 2022
/
Revised: 15 January 2023
/
Accepted: 28 February 2023
/
Published: 4 March 2023
(This article belongs to the Special Issue Water Supply System (WSS) Reliability, Safety and Risk Modelling & Assessment)
Abstract
:The reliability of Water Distribution Networks (WDNs) is a critical topic that has been explored by many researchers over the last few decades. Nevertheless, this research domain has gained momentum in the last decade. WDN reliability was addressed in the literature using different approaches and techniques. This study presents a bibliometric analysis and scoping review of the progress and gaps in research on WDN reliability. The analysis was performed on a total of 347 articles from 2000 to 2022, which were retrieved from the SCOPUS database. The bibliometric analysis identified trends and gaps by focusing on articles output, citation network of articles, co-authorship and collaboration analysis, co-citation, and clustering analysis. In addition, coupling keywords analysis with thematic maps analysis helped identify basic, niche, emerging, and declining research themes in the field of WDN reliability. Three major research themes were found: WDN optimization, reliability assessment, and consideration of GHG emissions and energy-cost for WDN expansion. Reliability surrogate measures (RSMs) were found to be one of the most widely researched topics in this field. Performance assessment of various RSMs, as well as the consideration of energy and cost for WDN design and expansion stood out as the emerging trends for future research in the field of WDN reliability.
1. Introduction
Water Distribution Networks (WDNs) are subject to hydraulic and mechanical failures. The performance assessment of WDNs, considering both failure and operating conditions, falls under the general term of WDN reliability [1]. Various techniques exist in the literature to conduct a representative reliability assessment of WDNs, including: the minimum cut set method [2], Monte Carlo simulation (MCS) [3], node availability [4], node-reliability factor, volume-reliability factor, and network reliability factor [5], etc. Most of these techniques require prohibitively long computational time and power when applied to complex real-world networks. For example, computational times of 19.72, 43.95, and 90.5 h were reported a hydraulic reliability-based design using the MCS method of the standard WDNs: Two loop, GoYang, and Fossolo, respectively [6]. Similarly, for a mechanical reliability-based design using the minimum cut set method, computational times of 1.211, 2.825, and 9.083 h were reported for Two loops, GoYang and Fossolo WDNs, respectively [6]. To overcome this issue, several studies presented reliability surrogate measures (RSMs), such as entropy [7], resiliency [8], network resilience [9], modified resilience index [10], etc., to reduce the computational time and reach a near-optimal solution, even when considering multiple objectives.
Several studies highlighted the importance of consideration of reliability in the design of WDNs such as [11,12,13]. Many studies formulated the reliability-based design problem as a single objective optimization by minimizing cost while setting a constraint on reliability [12,14,15]. Several other studies used the multi-objective optimization approach [16,17,18,19]. Studies have also highlighted the importance of the selected optimization tool in solving the reliability-based design problem of WDNs; some of the most commonly applied mathematical programming optimization tools include linear programming (LP) [20,21], non-linear programming (NLP) [22], mixed integer linear programming (MILP) [23], and mixed integer non-linear programming (MINLP) [24,25,26]. Subsequently, several Evolutionary Algorithms (EAs) were employed to solve the problem of the reliability-based single and multi-objective design of WDNs, such as Genetic Algorithm (GA) [27,28,29], Particle Swarm Optimization (PSO) [30,31,32], Ant Colony Optimization (ACO) [16,33], and Differential Evolution (DE) [12,15] for single objective optimization and Multi-Objective GA (MOGA) [34,35,36], Multi-Objective DE (MODE) [13,37,38] and Multi-Objective PSO [39,40,41] for multi-objective optimization. In addition, several other modeling factors were incorporated into studies of WDN reliability, such as the prediction of failure probability of pipes [42,43,44], the allocation of isolation valves [45,46,47], leak detection and quantification [48,49,50,51], etc. Thus, several approaches were proposed in the literature for the reliability-based design of WDNs with varying considerations of the factors influencing WDN reliability.
Some bibliometric reviews concerned with Water Distribution Systems (WDSs) [52] and the resilience of WDNs [53] recently appeared in the literature. A bibliometric analysis quantitatively assesses trends in a specific research field by conducting statistical and metadata analysis of the typical attributes of articles published in a particular domain, including the title, authors, keywords, date of publication, number of citations, etc. [52,53]. It also helps discover the subtle differences in the scientific evolution of a specific domain. More specifically, it can be effectively used for quantifying the research output from different authors, the collaboration between the authors, countries, universities, and the impact of different authors and articles on the advancement of a specific field [54]. The previous analysis focused on WDSs in general, considering all problems such as optimal design, risk assessment, etc. [52], whereas another bibliometric review focused on the resilience assessment of WDNs [53]. Resilience is, however, a subset of reliability assessment for WDNs. Thus, a broader bibliometric analysis and scoping review is needed to provide a better direction on the use of different optimization tools for reliability-based design, expansion, and maintenance planning of WDNs. Therefore, this study, for the first time, presents a bibliometric analysis and scoping review of reliability assessment tools for managing and designing WDNs. The primary research questions answered by the analysis pertain to the identification of the dominant research themes in the domain, their extent of exploration, the nature of collaboration, key concepts, tools, and applications, as well as research gaps, and recommendations for future research on WDN reliability assessment. Thus, the study can be useful to researchers in the field for scoping future research and identifying collaboration opportunities.
2. Background
Consideration of reliability dates to Goulter and Morgan (1985) [55], who considered redundancy in the pipe network as a measure to ensure reliability in the network. Some studies focused on the consumer’s perspective of reliability by assigning a damage function to each consumer, that defines the damages caused when the demands are not met [56]. Other studies presented a methodology for reducing the impacts of failures in WDNs by minimizing the negative effects on consumers and operational costs [57]. A recent study focused on the consumers’ lack of water supply by identifying the longest suspension time [58]. In addition, inherent deficiencies in WDSs, such as inadequate disinfection, low pressure, intermittent operations, leakages, and corrosion, can lead to decreased quantity as well as the quality of water reaching the consumers [59]. Fluctuating pressures in the WDNs have also led to the development of advanced automated tools operating the amount of inflow to the system, including pumps and valves [60]. However, most articles have focused on quantifying the hydraulic and mechanical reliability of WDNs, as these can be accurately modeled. Bao and Mays [1] clearly distinguished between the hydraulic and mechanical reliabilities of WDNs. They defined hydraulic reliability as water demand satisfaction considering uncertainty in parameters, such as demand and pipe roughness coefficient, while mechanical reliability was defined as demand satisfaction considering the failure of one or more pipes. Goulter [61] presented the multi-objective optimization approach for the reliability-based design of WDNs based on the constraint method. Su et al. [2] presented the minimum cut set approach for mechanical reliability estimation of WDNs, which is one of the most widely used approaches. Jacobs and Goulter [62] presented the graph theory-based approach for the reliability analysis of WDNs. Bhave and Gupta [63] represented uncertainty in decision variables by fuzzifying the variables. Shibu and Reddy [64] presented a fuzzy probabilistic approach to transform uncertainty in variables into fuzzy random variables.
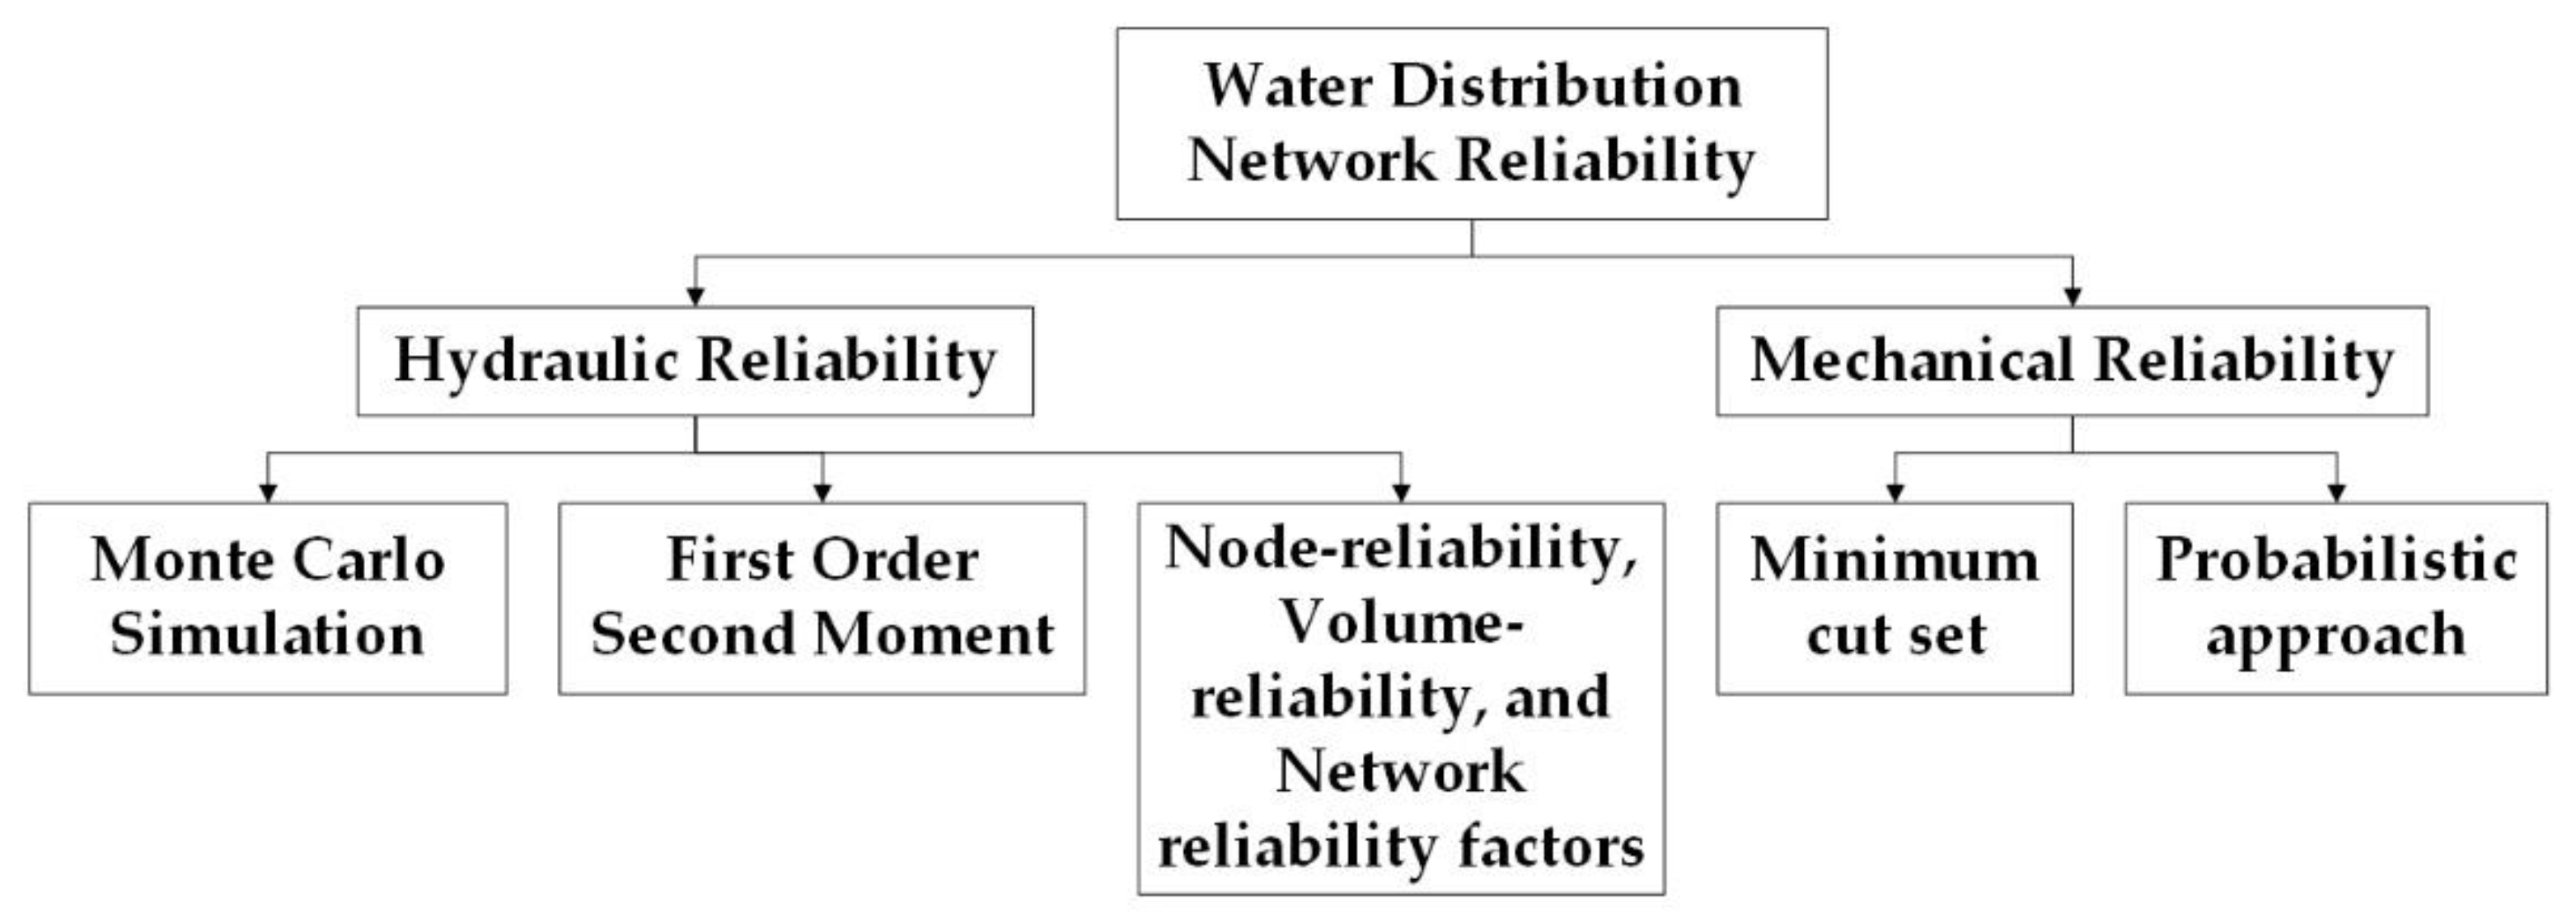
Reliability assessment tools can be classified into two major classes: hydraulic and mechanical. Hydraulic reliability can be estimated using techniques such as MCS, First Order Second Moment (FOSM), node-reliability, volume-reliability, and network reliability factors. The most used techniques for mechanical reliability estimation include the minimum cut set approach and the simple probabilistic approach. The classification of the reliability assessment approaches is presented in Figure 1.
The following is a summary of the typical application of these tools in the reliability assessment of WDNs:
- The MCS method involves generating random values for uncertain variables, such as nodal demands and/or pipe roughness coefficients. The random variables are usually modeled by assuming that they follow a certain probability distribution with a deterministic mean and a certain percentage of the mean as the standard deviation. The network is then analyzed for each of these random samples of uncertain variables. The reliability is then estimated as the ratio of the number of times the system performed satisfactorily to the total number of samples. The system is in failure condition if at least one of the nodes has any deficit in supply. The advantage of this approach is that it is easy to implement, while the major disadvantage is that it requires a substantial amount of random sample generation, making it a very time-consuming process.
- The FOSM includes the estimation of the covariance matrix of output parameter(s) as a function of the variance of the model input parameters. In addition, the gradient of the model output with respect to the model input parameters is calculated. The WDN needs to be evaluated for K + 1 scenarios (K being the number of input parameters and one base scenario, where the parameters are assumed to be certain). The main advantage of the FOSM method is that it does not require the substantial number of simulations needed in the MCS method. The drawback of the method is that it becomes inefficient in cases of large variations in the random variables, since the effect of non-linearity in the model becomes dominant, thereby deteriorating the accuracy of the model.
- Node reliability factor is defined as the ratio of available outflow to desired outflow volume at a node. Volume reliability factor is defined as the ratio of the total outflow volume to desired outflow volume for the entire network, considering all the states during the analysis period. Network reliability factor is calculated by multiplying the time factor and node factor with the volume reliability factor. The advantage of considering these factors is that they provide a more accurate picture of the reliability values when compared to the normal approach followed in the MCS method. The drawback of this method is that it requires significant computational time, as it employs the MCS approach.
- Minimum cut set is defined as the minimum number of components that, upon collectively failing, causes a system failure. However, if any of the components is in a working state, the system failure would not occur. Thus, for a branched network, the failure of a single component can lead to the failure of the entire network; in a looped network, simultaneous failure of two or more components might be needed to cause system failure. This implies that the size of the cut set would be different for different networks. The reliability of the WDN is estimated as the demand satisfaction considering failure of each of these minimum cut sets.
- The probabilistic approach considers that the failure probability of each pipe is the same and thus estimates reliability as the demand satisfaction under the simulated failure of each pipe at a time and aggregate for all failure situations. Different tools exist to determine the failure scenarios, such as reliability block diagrams [65], failure tree analysis [66], etc.
3. Methodology
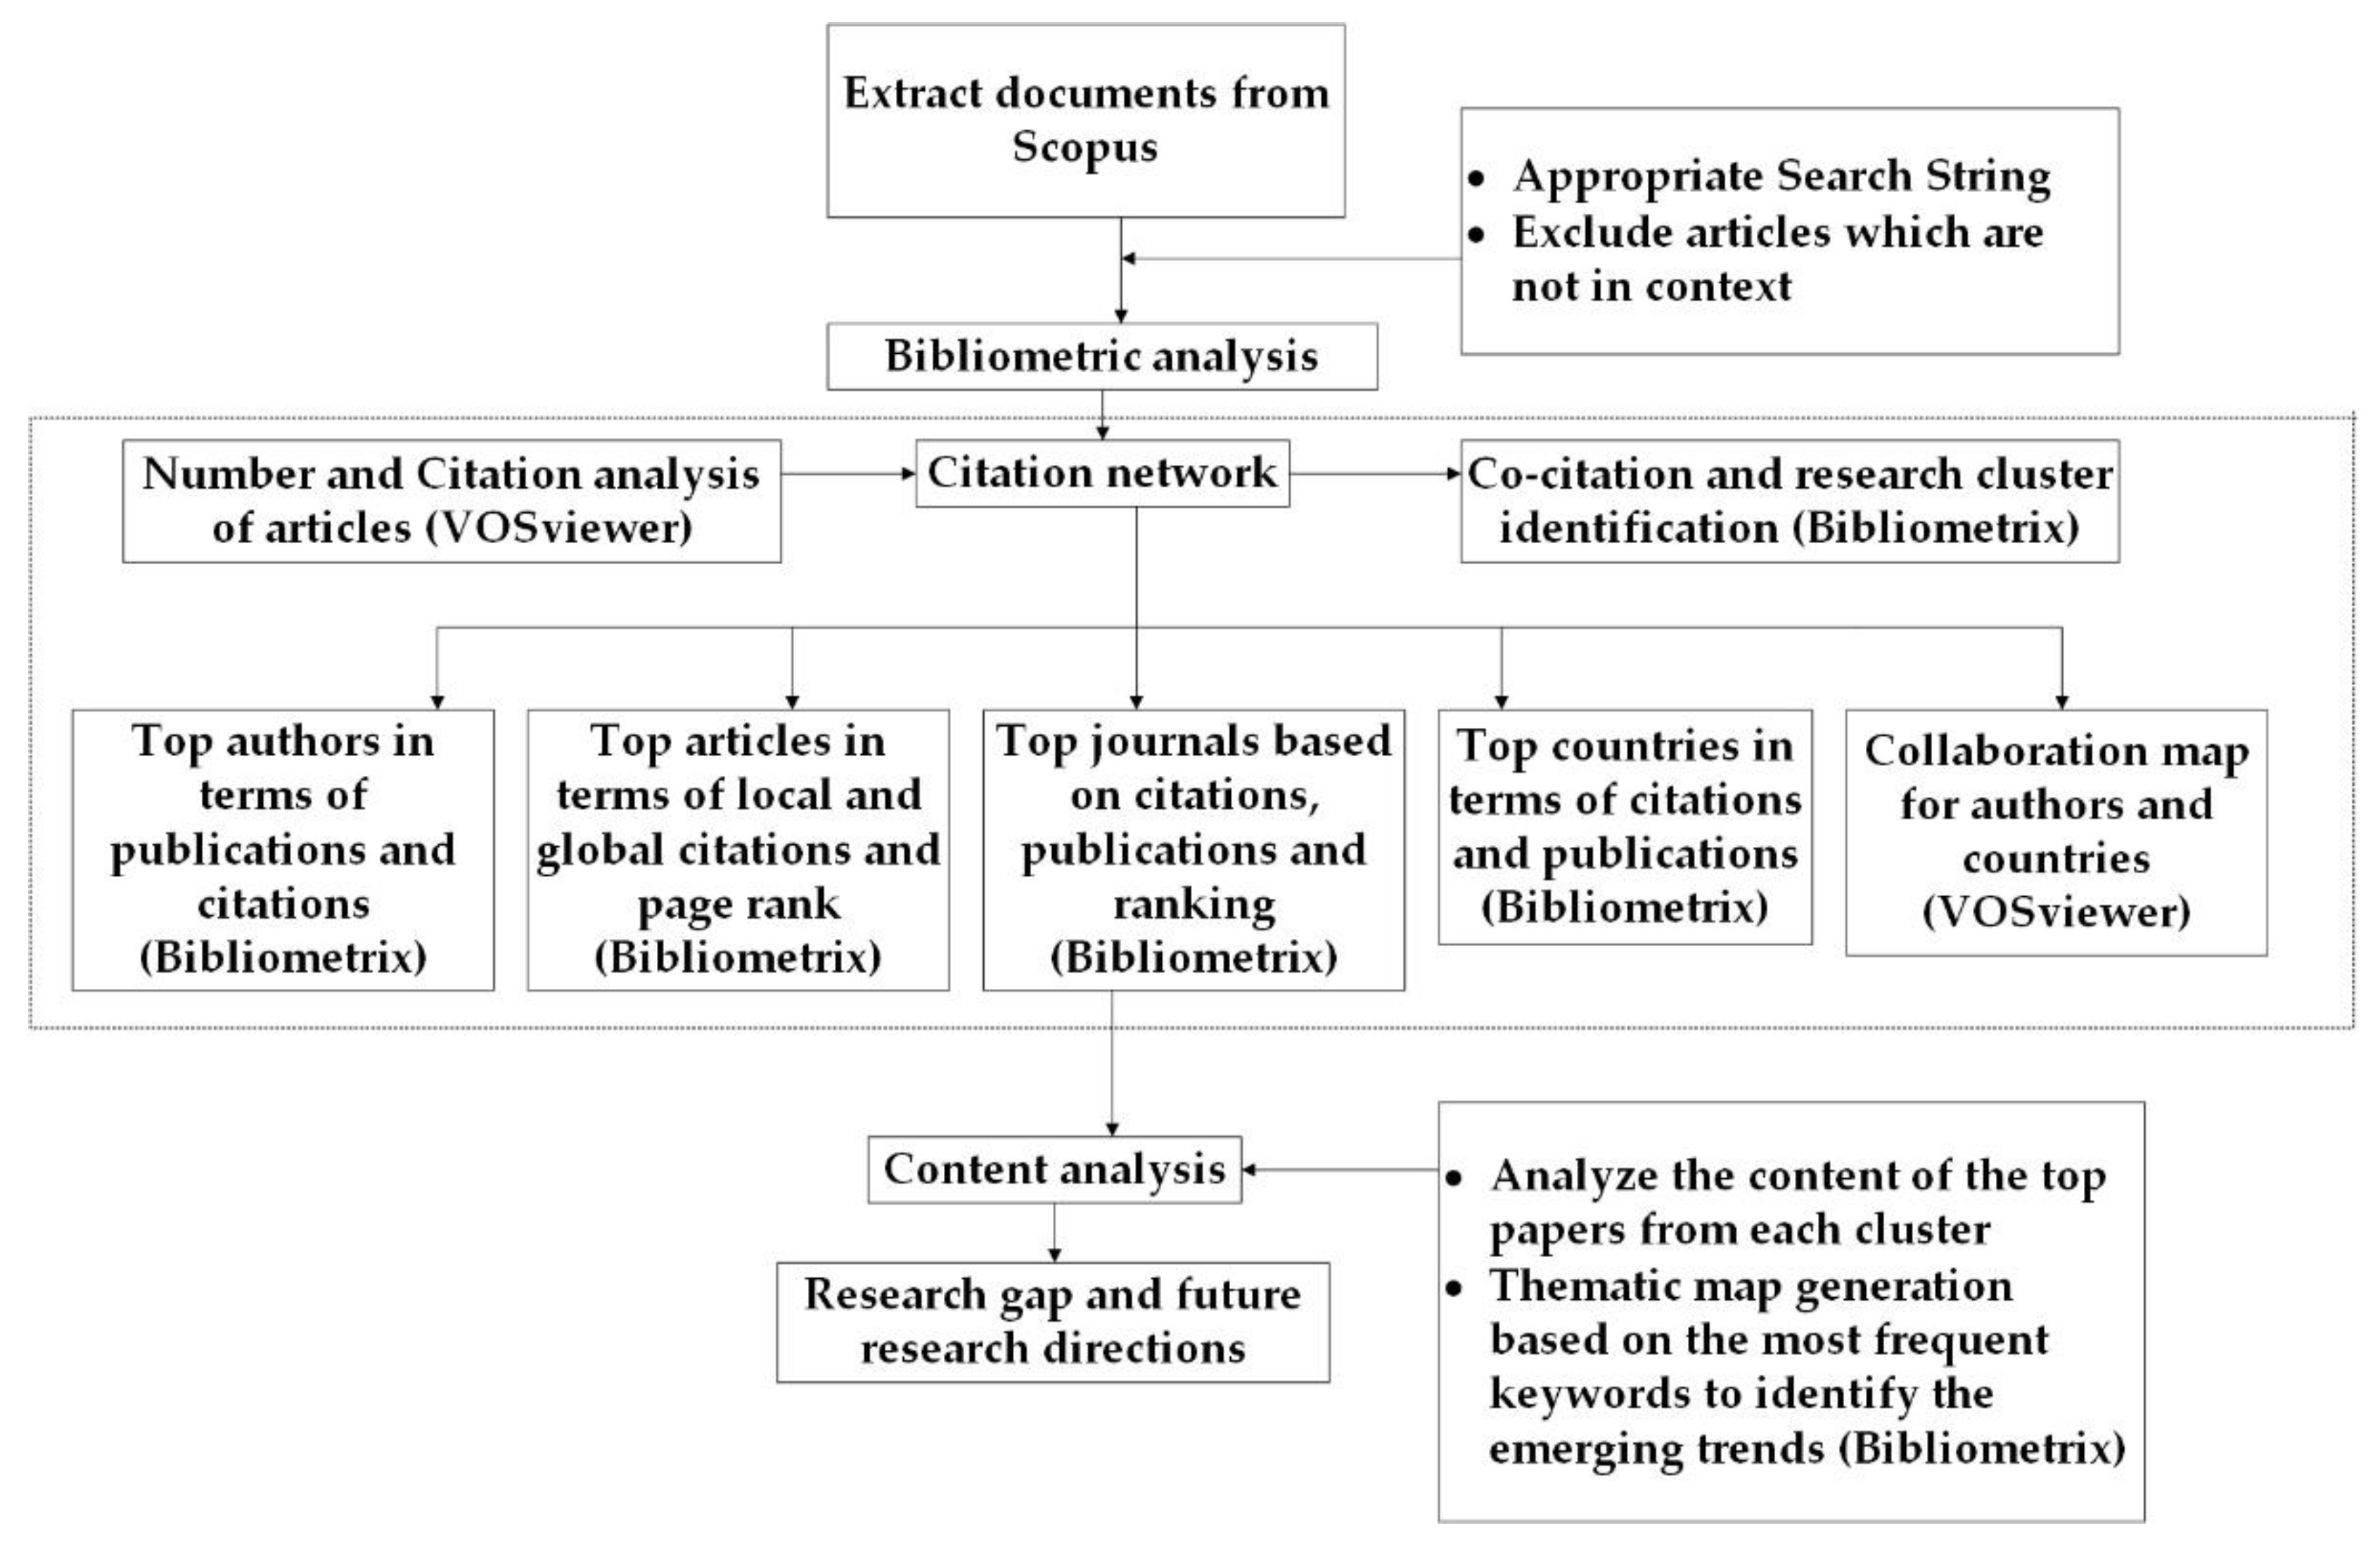
The methodology of the analysis conducted in this study involved three steps: (1) data extraction; (2) bibliometric analysis; and (3) content analysis. The framework of the methodology is presented in Figure 2. The research questions addressed in the study are presented first, followed by the details of each of these steps.
3.1. Research Questions
This bibliometric analysis will address the following research questions (RQs):
- What trends and patterns can be detected by analyzing articles on WDN reliability in terms of:
- a.
- The number of relevant publications and citations.
- b.
- The countries that contributed the most to the knowledge base.
- c.
- The top journals that have published the most cited articles on the topic.
- d.
- The top articles in the literature that have the greatest impact in terms of citation as well as page rank analysis.
- e.
- The top authors in the literature that have the greatest impact in terms of number of publications and citation.
- What is the nature of collaboration in the field of WDN reliability as evidenced by co-authored publications?
- What are the key concepts, tools, and applications that have been explored in the field of WDN reliability and how they are related?
In addition, the article will discuss research gaps, and make recommendations for future research on WDN reliability assessment and related applications.
3.2. Data Extraction
Data extraction included the retrieval of documents related to WDN reliability from different literature databases. In the present study, “SCOPUS” was used as the search database due to its wider range of journal coverage compared to databases, such as “Web of Science”, “ERIC”, or “IEEE Xplore”. The search focused only on peer reviewed journal articles. The search found 808 documents when (TITLE (water AND distribution AND network *) OR TITLE (water AND supply AND network *) OR TITLE (water AND distribution AND system *) AND TITLE-ABS-KEY (reliability)) were considered. Upon limiting the search to document type “article”, language “English”, and publication year “2000–2022”, 347 articles were selected for detailed analysis.
3.3. Bibliometric Analysis
Bibliometric analysis involves quantitative and statistical analysis of the literature [59]. In the present study, the analysis was carried out by determining the following aspects:
- (1)
- The number of documents and citations in a defined period.
- (2)
- The top authors publishing articles in the field of WDN reliability by number of publications and citations and their collaborations.
- (3)
- Top articles by the number of citations.
- (4)
- The top countries producing articles in the field of WDN reliability and their collaborations.
The analysis was performed using two open-source software packages, VOSviewer V.1.6.18 and Bibliometrix V.4.0.1, as suggested by past studies [52,53]. VOSviewer was employed to generate the collaboration maps for different authors and countries, as well as the citation network of authors. Bibliometrix was used to present statistical data regarding the number of publications and citations for different authors, articles, countries, and journals [67]. To determine the ranking of the articles in the co-citation network, page rank was used as a measure. Page rank is a measure of how often and where the article has been cited [53]; it implies that, if the article has been authored by highly cited authors and cited by highly cited articles, the page rank for that article would be high. Page rank for journal citation network was estimated using the following equation [68,69]:
where π(k)T = Page rank vector at the kth iteration, pn−1 and pn−2 are the number of papers published in journal J in the years n − 1 and n − 2, n being the current year, and π(k)T is updated using the following equation
H = very sparse, raw substochastic hyperlink matrix, α = scaling parameter between 0 and 1, a = binary dangling node, and eT = row vector of all 1 s.
3.4. Content Analysis
The content analysis consisted of two parts:
Cluster analysis: The co-citation network of the authors in the field of WDN reliability was generated to formulate clusters for different authors based on their common citations. The top articles by global citations from each cluster were then selected to identify the common themes of the various journals. Thereafter, the clusters were generated for author keywords to determine the focus areas of different articles based on the commonly used keywords in them.
Thematic map generation: Thematic maps were generated based on the keywords for the various articles to determine the basic themes explored in various articles, the most widely explored themes, niche themes, and emerging themes. A theme is decided based on the common keywords used by a group of articles. Density and centrality were used to measure the development and influence of a particular theme. Density measures the strength of internal ties among all the keywords within a theme and so is a measure of the development of that theme. Centrality represents the extent of connection to other themes and can be used to measure the influence of the theme in the research field. The following equations were used to calculate the centrality and density of a theme [68]:
ehk is the count for collective occurrence of keywords h and k belonging to different themes.
eij is the count for collective occurrence of keywords i and j belonging to the same theme and w is the total keyword count for the theme.
Conclusions were drawn in terms of the niche themes that require more exploration, emerging themes, and future research directions.
4. Results
4.1. Trend in Articles Output
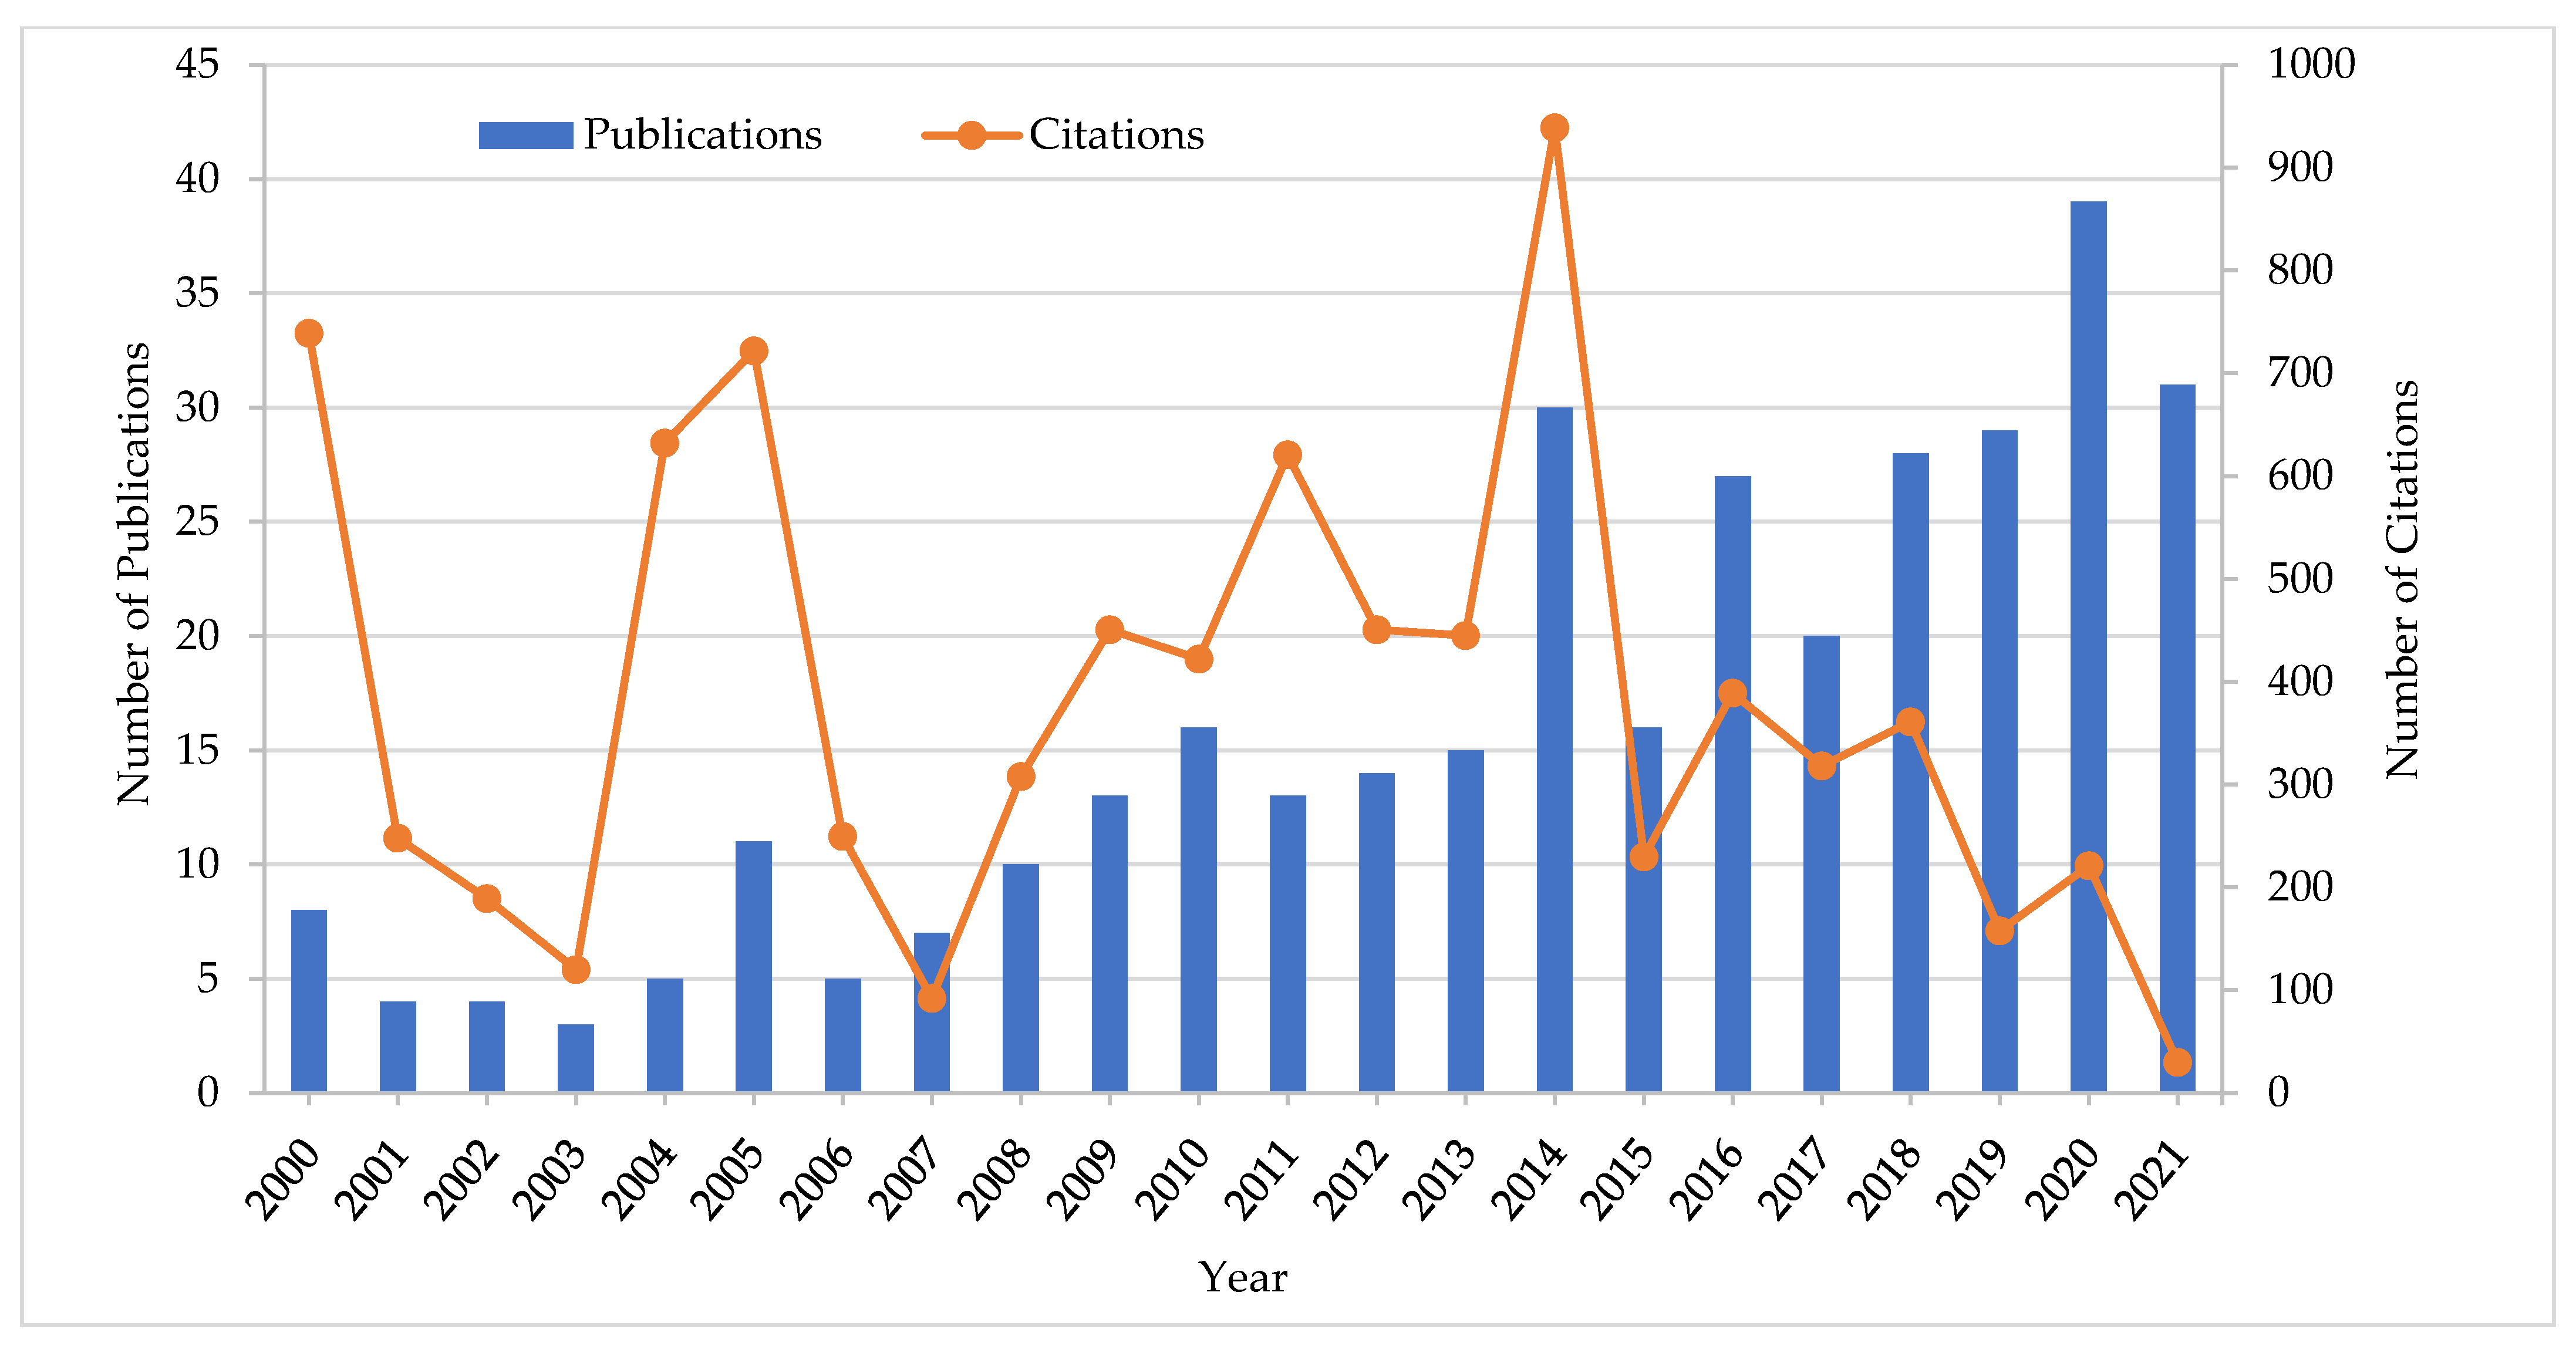
The trend in the number of publications and citations with respect to time is presented in Figure 3. The number of publications has increased gradually over the years, with the highest number of publications in 2020 (39 articles). There was a slight decline in 2021. The number of citations, however, was remarkably high in 2000, with gradual decline over subsequent years with a sudden spike in 2005. The highest number of citations was in 2014 (939 citations). The number of citations, however, declined again over subsequent years. The figure shows that the number of citations has been increasing and decreasing over this period, despite an increasing trend in the number of publications in this field. This confirms findings from a recent literature review [70] that showed an increasing trend in the number of publications in the field of WDN optimization. This is also in agreement with findings from a similar analysis considering publications on the resilience assessment of WDNs [53]. This depicts the growing interest in the field of WDN reliability.
4.2. Citation Analysis of Articles
The contribution and impact of articles is depicted by citation analysis. Figure 4 shows the citation network of different articles with a minimum of twenty citations. This limit was selected to obtain a clear citation network map with readable fonts. The size of the node depicts the number of citations, while the links between the various nodes depict the collaboration between them. The distance between the nodes depicts the association between any two nodes in terms of co-citation. Three clusters are identified in Figure 4. Cluster 1 groups articles focusing on reliability/resilience assessment of WDNs. Cluster 2 groups articles focusing on reliability-based design of WDNs, while cluster 3 focuses on the optimal design of WDNs considering aspects of entropy, resiliency, and reliability.
The ten articles with the highest number of citations are presented in Table 1. The article [8], published in Urban Water Journal, is the most cited document. The probable reason for this is that the article introduced the resilience index as a surrogate for WDN reliability; this index is one of the most widely used RSMs. The ratio of local to global citations is 17.60%, implying that a significant fraction of the total citations fall in the field of WDN reliability. The Normalized Local Citations (NLC) and Normalized Global Citations (NGC) are calculated as the ratio of the actual (local/global) citations to the average number of citations for documents citing the article with the same year of publication [70]. NLC and NGC for [8] is 5.39 and 5.60, respectively, implying that it has around five times more citations when compared to similar articles published in the same year. The second highest cited article is [9], published in Journal of Water Resources Planning and Management (JWRPM). The high number of citations may be credited to the fact that the paper introduced network resilience, another widely used RSM. The NLC and NGC values are 3.37 and 3.42, respectively, which shows a higher citation score (around three times) when compared to similar articles. The third highest number of citations is obtained for [71], published in Engineering Optimization, as it employs resilience in their study for multi-objective design of WDNs. The NLC and NGC values are also more than 1, implying it has been cited a greater number of times on average when compared to similar articles published in that year. This shows that the use of RSMs, such as resilience and network resilience, has gained a wide popularity in last 22 years.
4.3. Co-Authorship and Collaboration Analysis
4.3.1. Co-Author Analysis
A total of 740 authors were extracted from 34 countries. The ten most influential authors by number of citations and publications are presented in Table 2. The statistics presented in Table 2 are presented based on the 347 articles shortlisted for the analysis. Farmani R. has the highest number of citations (779), followed by Tanyimboh T.T. and Walters G.A. (646 and 609, respectively). Farmani R. has highly cited articles primarily focused on evolutionary algorithms, reliability assessment, and the use of artificial neural networks (ANN) for pipe burst rate prediction. Tanyimboh T.T., who started publishing significantly in 2000 (and even before), has the highest number of publications in the field, with total 20 publications; Farmani R., who started publishing in 2005, has the second highest number of publications, with 11. The major works by Tanyimboh T.T. involve optimal design of WDNs, reliability assessment, and use of RSMs, such as entropy and resiliency. Walters G.A. has primarily published works on WDN design, considering aspects such as multi-objective design, calibration of WDN models, consideration of uncertainty, tank simulation, maintenance, and rehabilitation as well as risk and vulnerability assessment of WDNs. Jeffrey P. and Yazdani A. started publishing much later, in 2011, and have published only 4 articles in this field. However, they have a considerable number of citations (458 each). Dissemination of professional and technical information to the civil engineering professional was a major goal of the research field. This was accomplished through a variety of publications and information products, including 35 professional and technical journals.
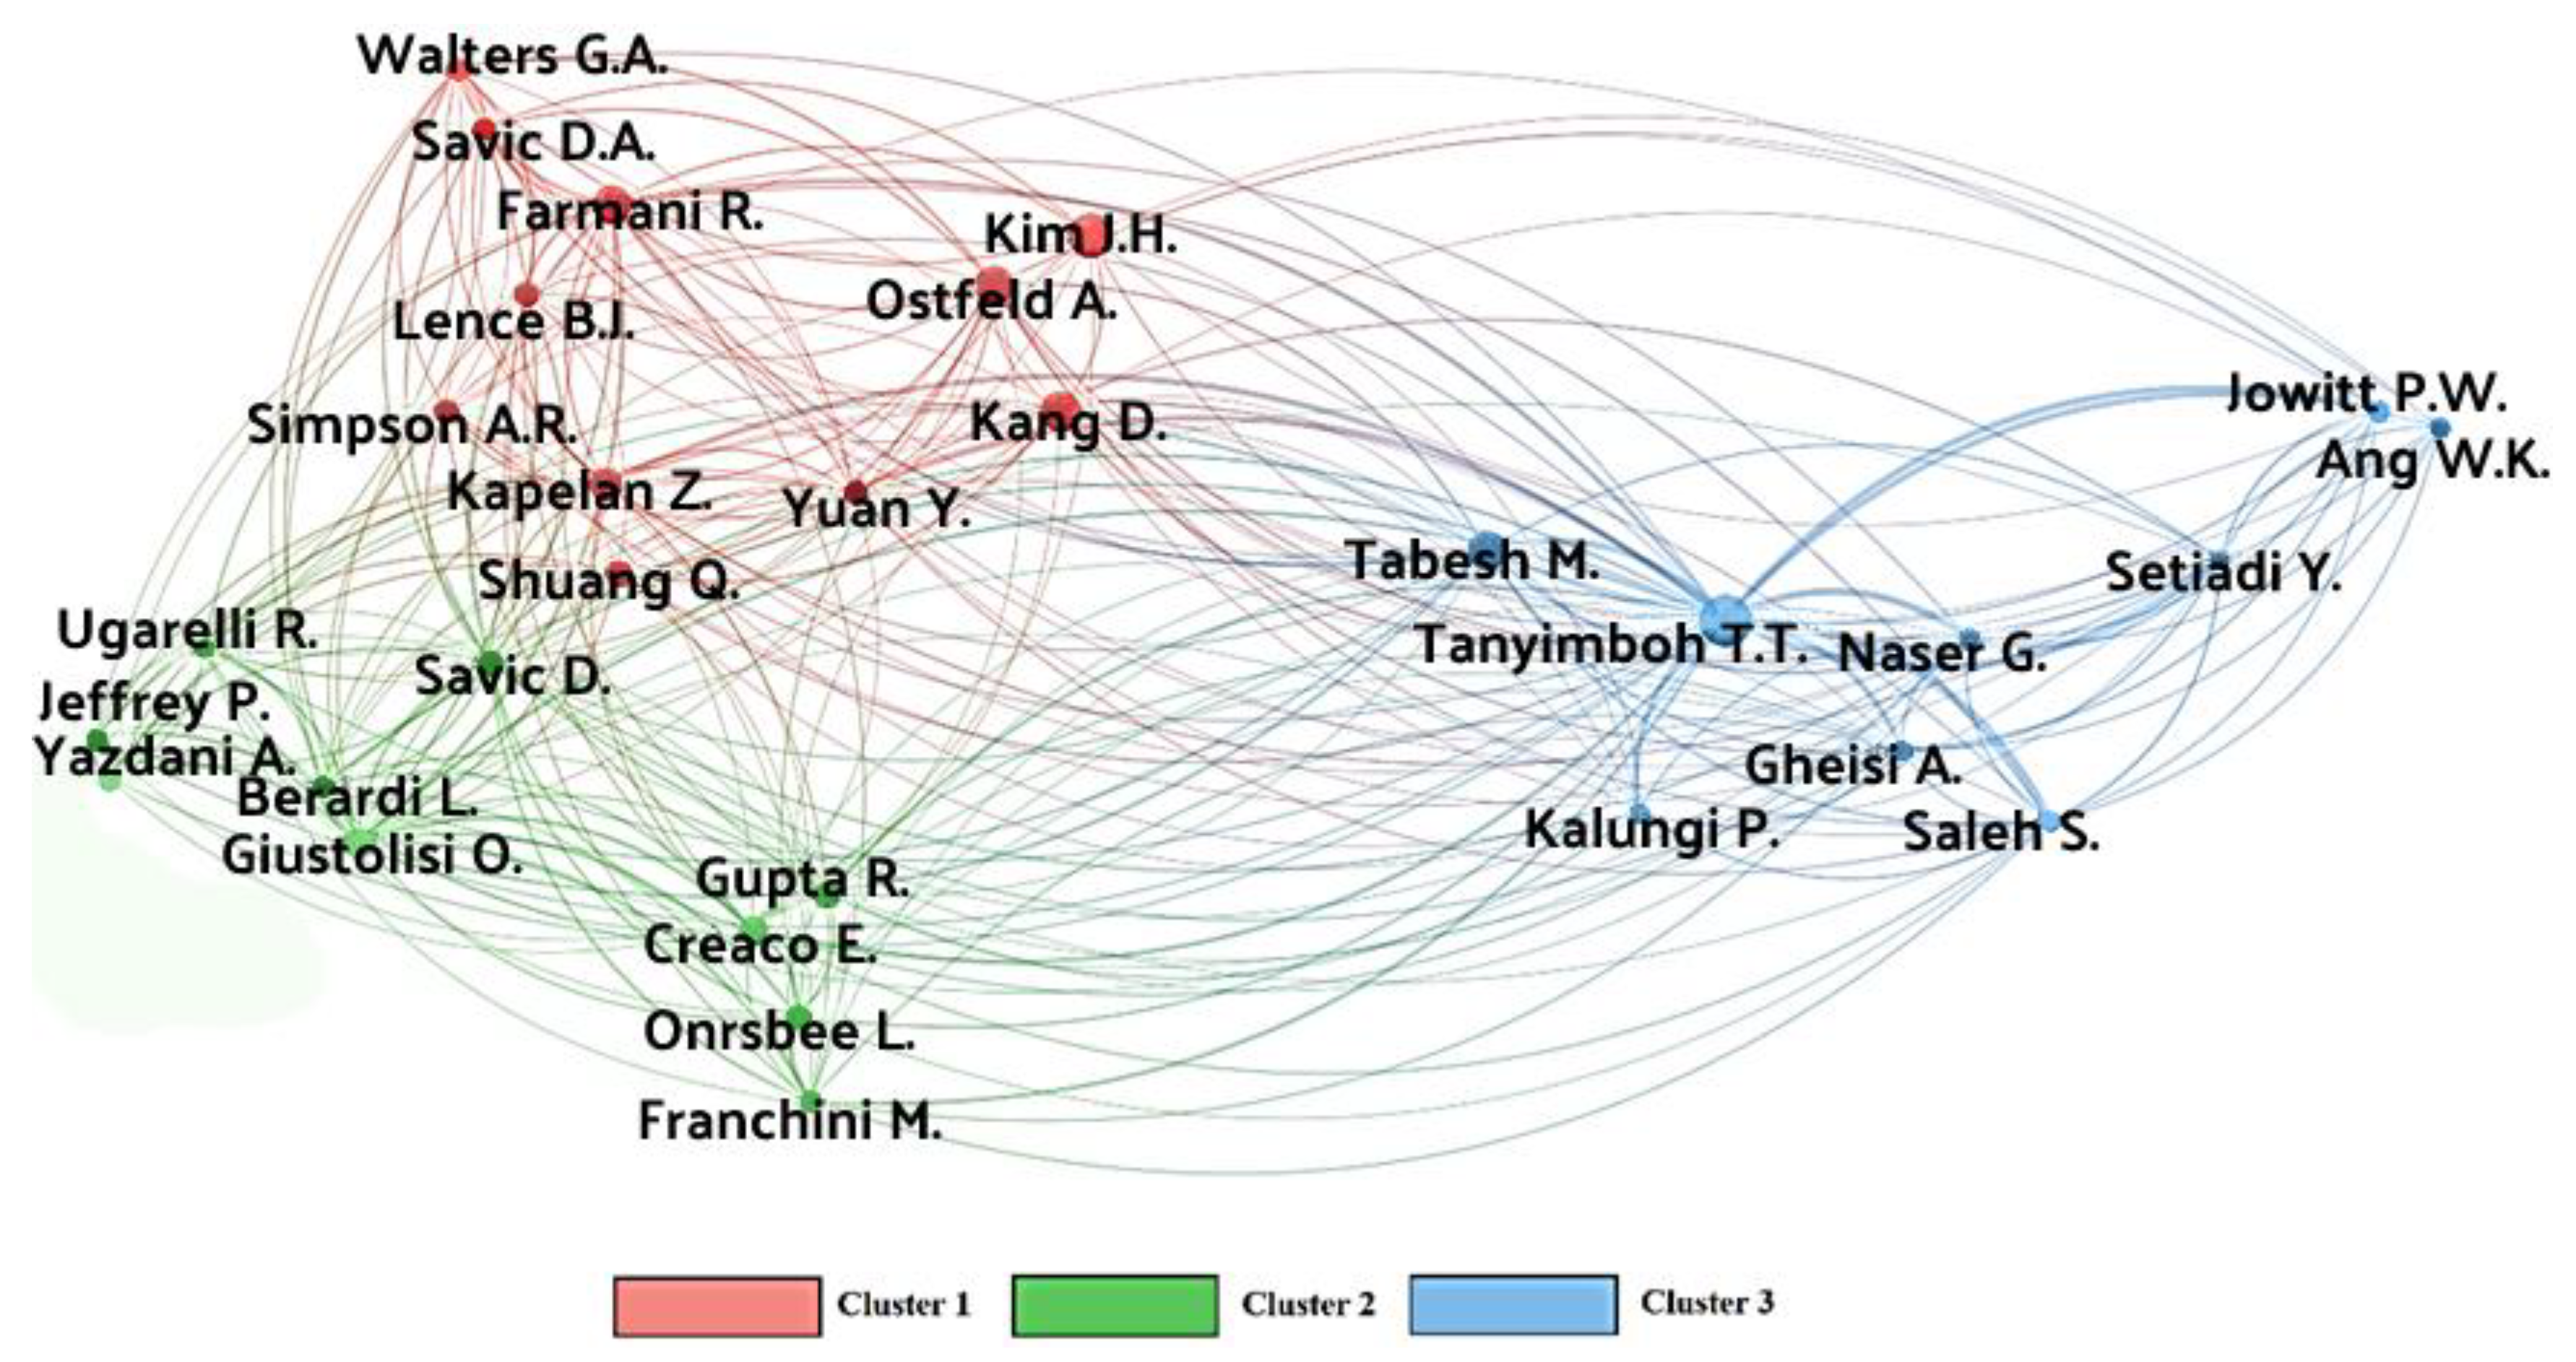
To better understand and visualize the collaboration among the authors, a collaboration map is presented in Figure 5. The map is generated using VOSviewer by setting the minimum number of documents as three and minimum number of citations as 20. The top 30 authors are presented from the shortlisted authors in order to present a clear and readable picture of collaboration. The bigger the node size, the larger the number of publications by the author. The closer the two nodes, the greater the association between the two in terms of co-citation. The thicker the links between two nodes, the stronger the collaboration between the two. Three clusters can be seen; these clusters represent a sub-community with a strong collaboration between the authors. Cluster 1 is comprised of articles on the optimal design of WDNs using evolutionary algorithms and the application of other soft computing tools. Cluster 2 is comprised of articles on optimal WDN design, pipe failure prediction models, and optimal valve placement models. Cluster 3 is comprised of articles on reliability-based design of WDNs and the use of surrogate measures for reliability assessment. In cluster 1, Farmani R. has the highest number of publications, while Savic D.A. and Tanyimboh T.T. have the highest number of publications for cluster 2 and cluster 3, respectively. The links between the various authors represent the collaboration in terms of co-authorship for various documents. The topology appears quite dense for each community, depicting strong collaboration among the authors. However, the sparse topology between the green and blue cluster indicates that more collaborative works should be carried out between the authors of these two communities.
4.3.2. Countries Network Map
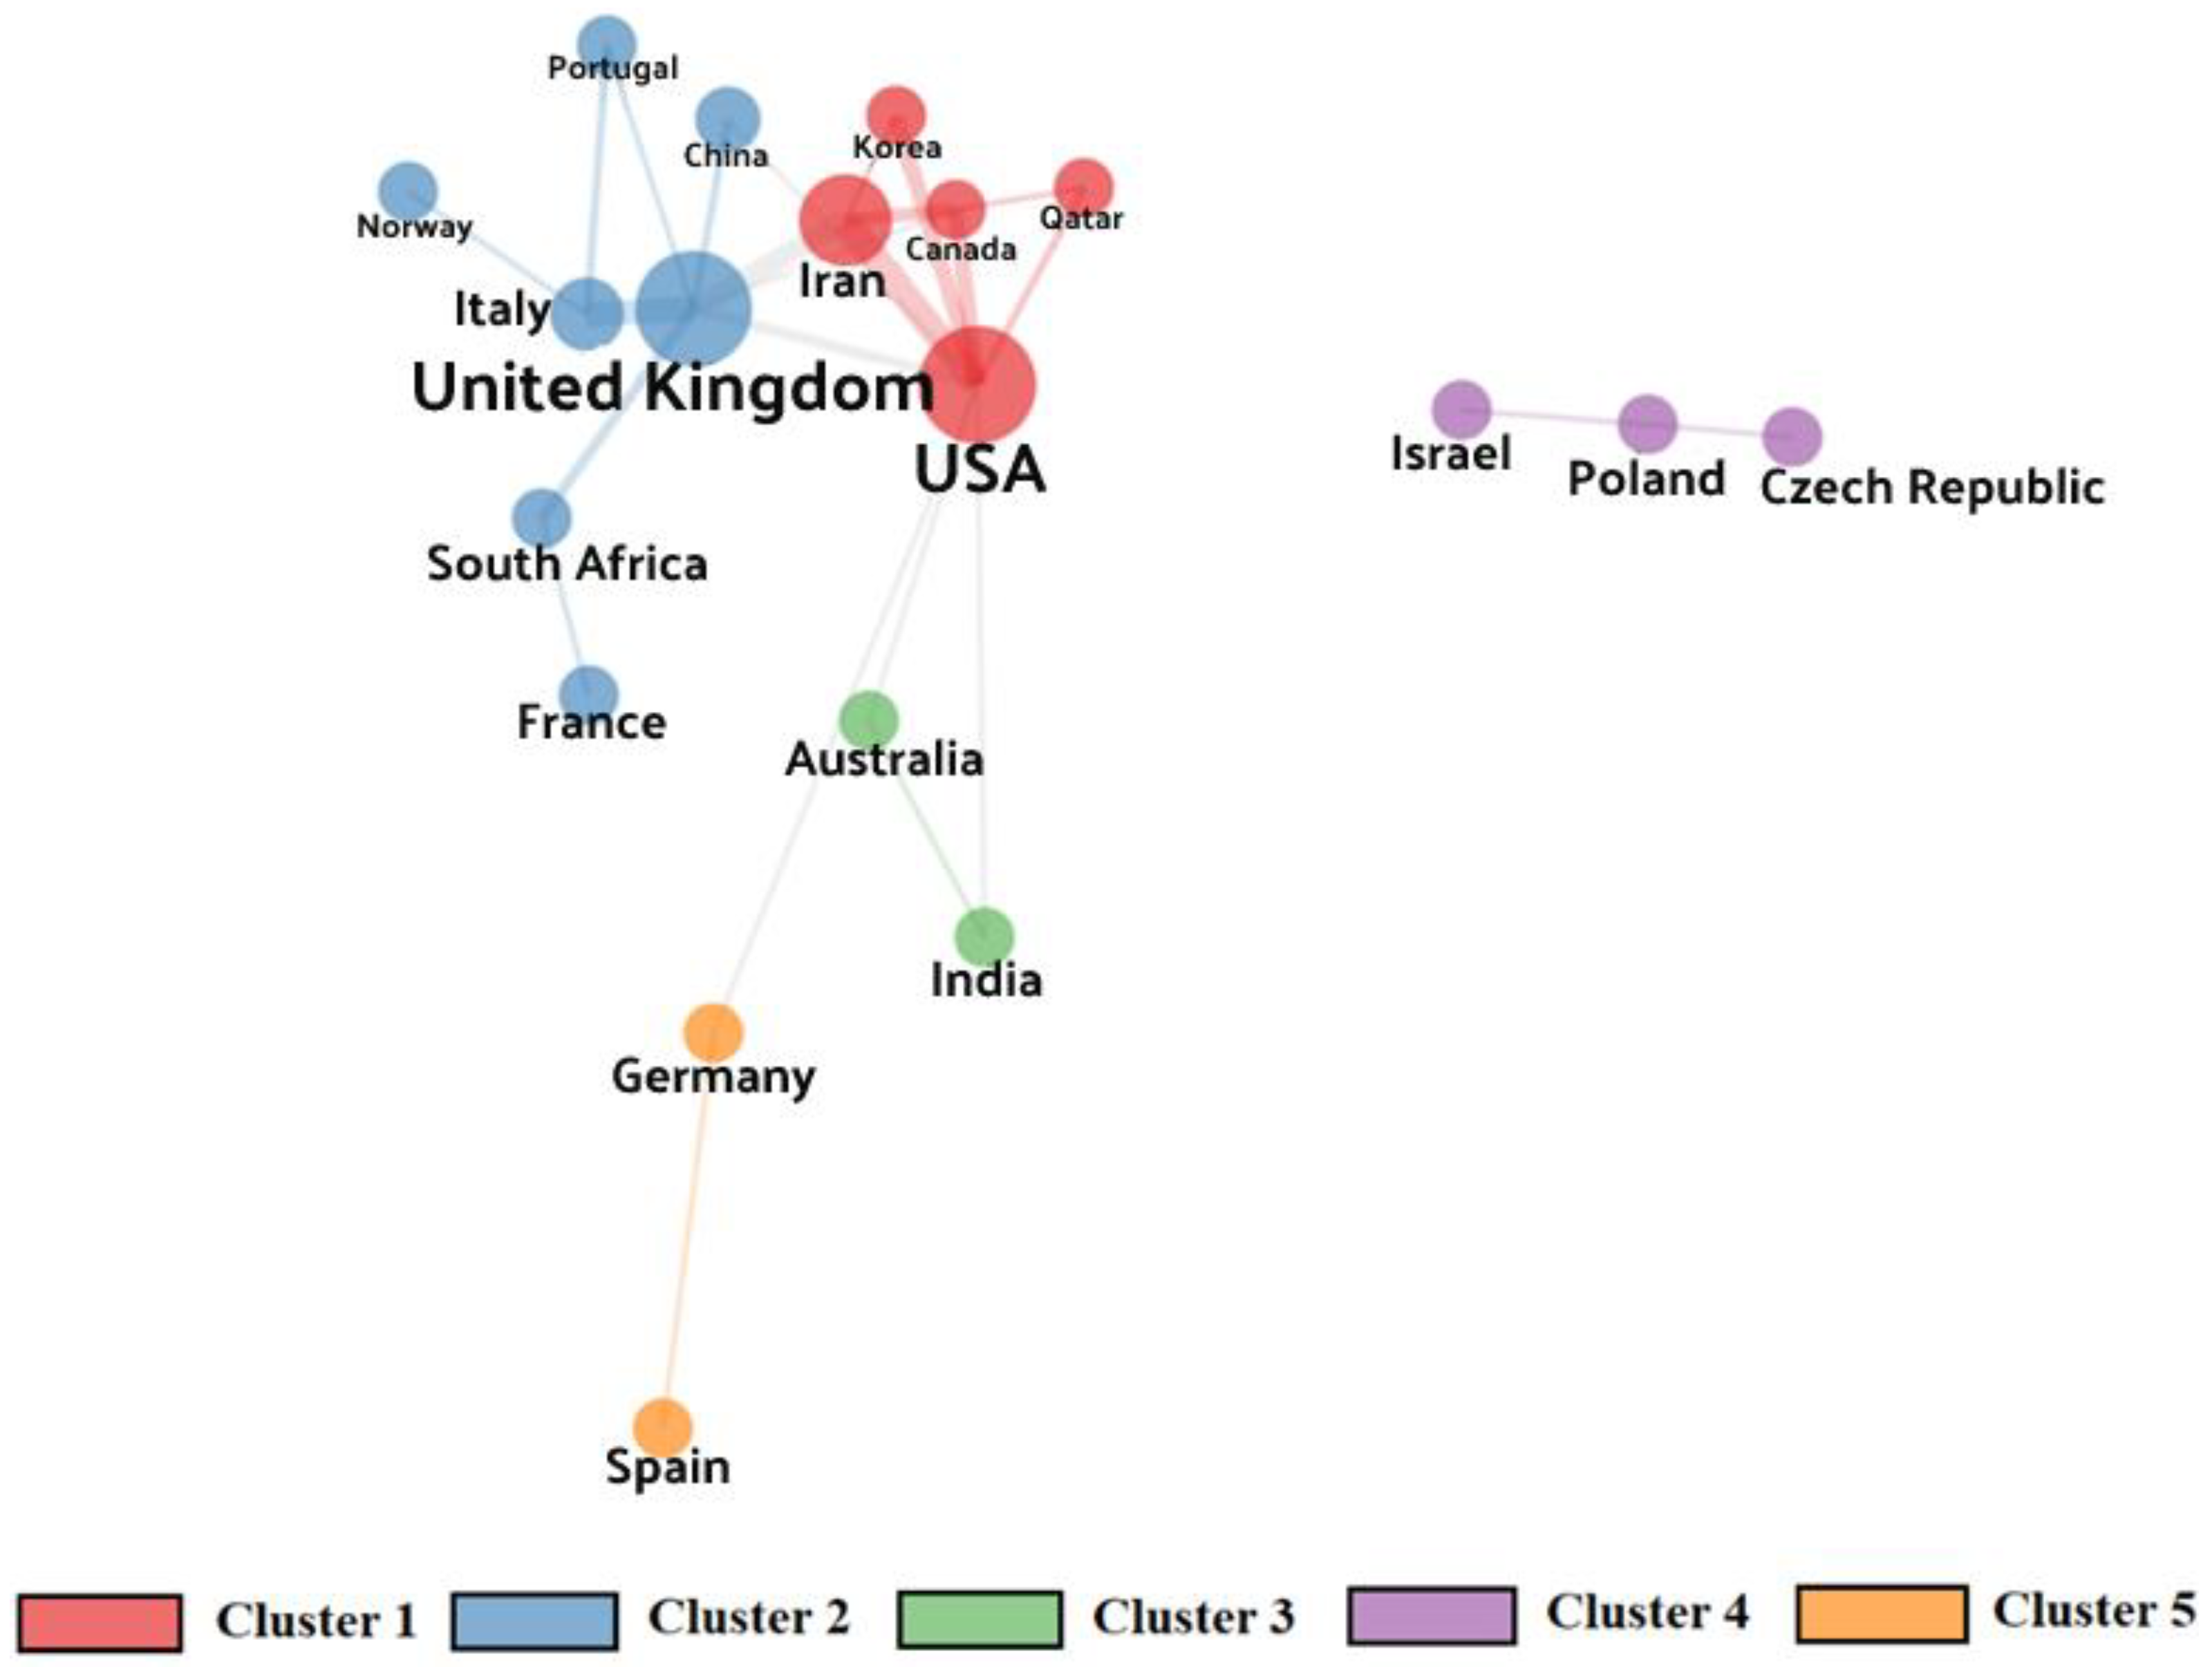
In order to explore the global distribution of publications in this specific research field, a network map for collaboration among various countries was generated. A network of 19 countries is shown in Figure 6. The size of the node represents the production volume by number of documents, while the links represent collaboration between the countries. The distance between two nodes depicts their association by of co-citation. Five clusters can be identified and are presented in Table 3. Cluster 1 is comprised of the US, Iran, Canada, Korea, and Qatar; this cluster has the highest number of publications (273). Cluster 2 includes the UK, Italy, South Africa, Portugal, China, France, and Norway; this cluster has the highest number of citations (4738). The US, UK, and China are the countries with highest number of publications (93, 84, and 76 articles, respectively). The US belongs to cluster 1, while the UK and China belong to cluster 2. This shows that the UK and China strongly collaborate with each other, while the US has minimal collaborations with UK and China. However, the country producing documents with highest number of citations is the UK, followed by Italy and US. The United Kingdom (UK) and the United States (US) are the two countries that have produced the highest number of publications. The substantial number of publications in the UK can be attributed to the fact that the University of Exeter has a strong partnership with the private sector in an attempt to regulate the water laws to reduce leakage levels, improve water quality, and level of service of the water infrastructure [72]. In the US, the American Society of Civil Engineers (ASCE), founded in 1852, is one of the oldest and largest bodies working on the development, maintenance, and enhancement of civil engineering infrastructure. The emerging countries in this research domain are Qatar, Portugal, Norway, and Czech Republic, with 3, 7, 8, and 8 publications, respectively. Portugal and Norway belong to cluster 2, while Qatar and the Czech Republic belong to cluster 1 and 4. While cluster 2 leads in terms of highest number of citations, cluster 3 has the lowest number of citations. It can be inferred that the countries belonging to cluster 4 and 5 (Israel, Poland, Czech Republic, Germany, and Spain) need to collaborate with the countries of other clusters to improve their scientific contributions.
4.3.3. Journal Impact
To study the global distribution of publication among various journals in the field of WDN reliability, Table 4 presents the publication, citations, and indexing for various journals. JWRPM is one of the oldest journals in the field. It began publishing in 2001 and has the highest number of publications and citations in this field. This may be attributed to the fact that JWRPM belongs to ASCE, based in US, one of the countries with highest number of publications. The focus of the journal is advancement in knowledge of civil engineering infrastructures, and so has many publications on the topic of WDNs. Urban Water Journal started publishing in 2000 and has the second highest number of citations. It has 20 publications in the research domain. However, it has a high value of citations per publications. Water Resources Management (WARM) started publishing in this field later than other journals, beginning in 2008, but still has the third highest number of citations and second highest number of publications. It should be noticed JWRPM was established in 1993, WARM in 1987, and the Urban Water Journal in 2000. This may be the reason for lower number of publications in Urban Water Journal.
4.4. Co-Citation and Clustering Analysis
4.4.1. Co-Citation Analysis
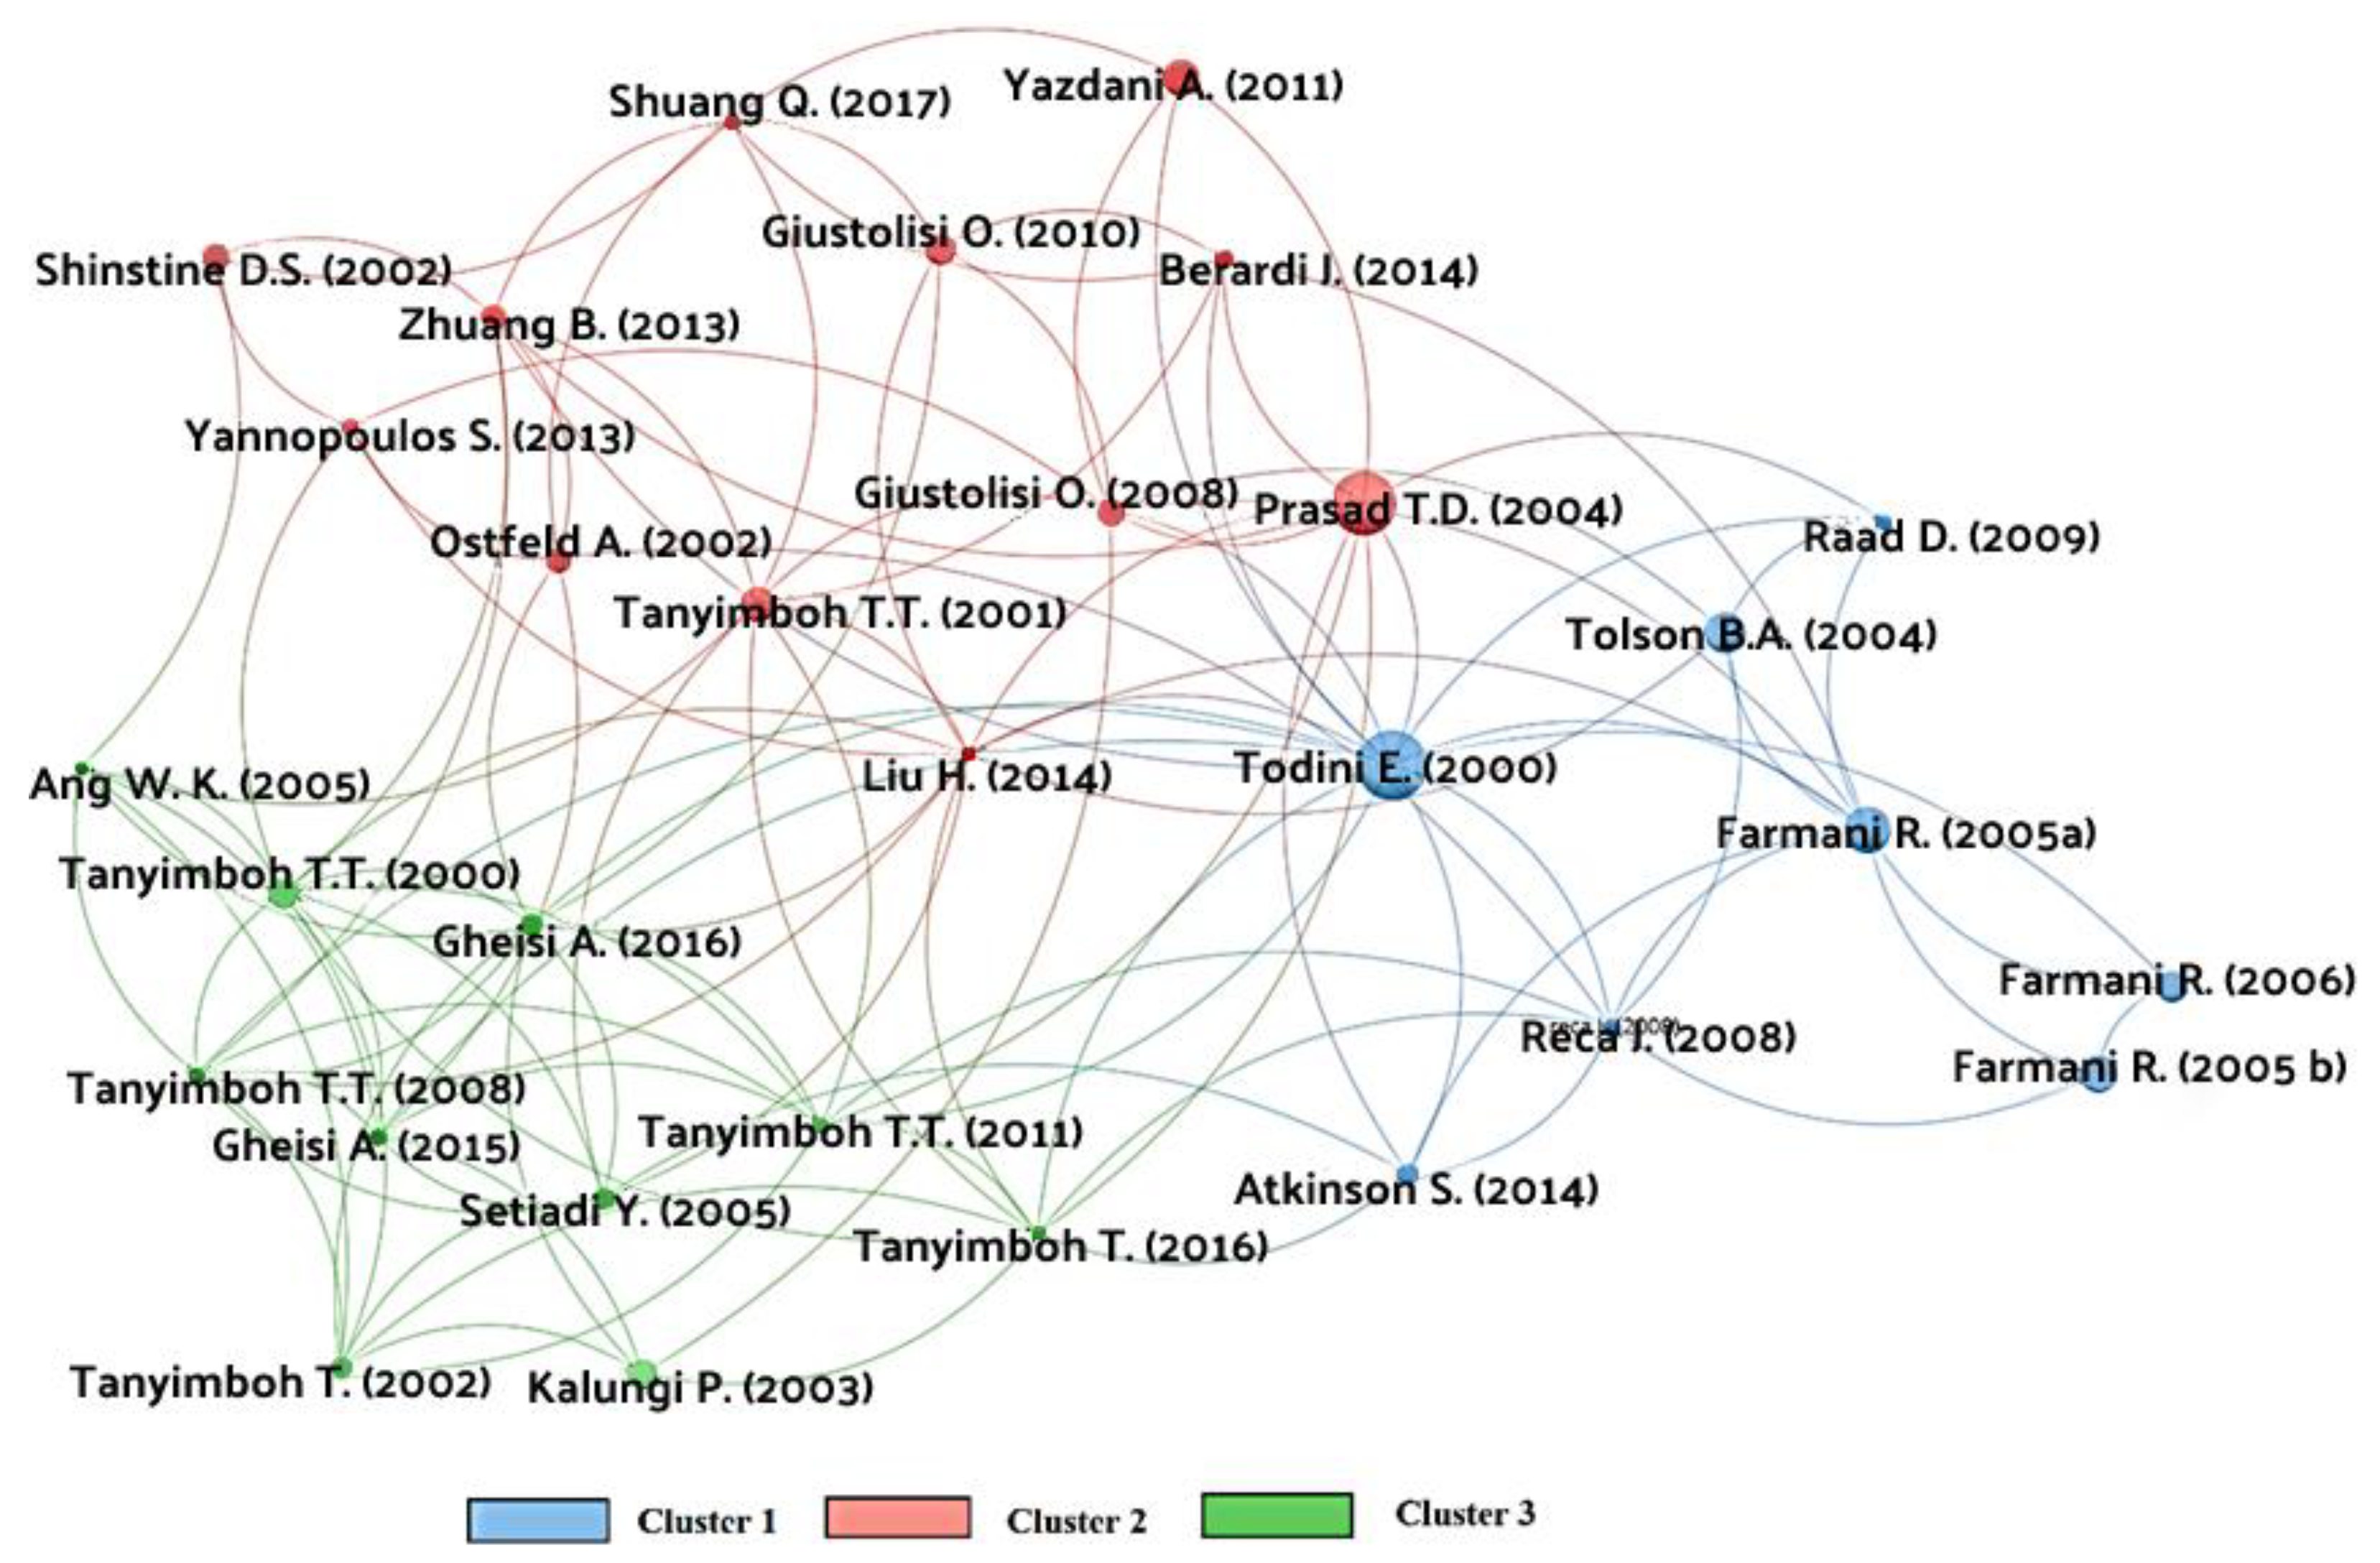
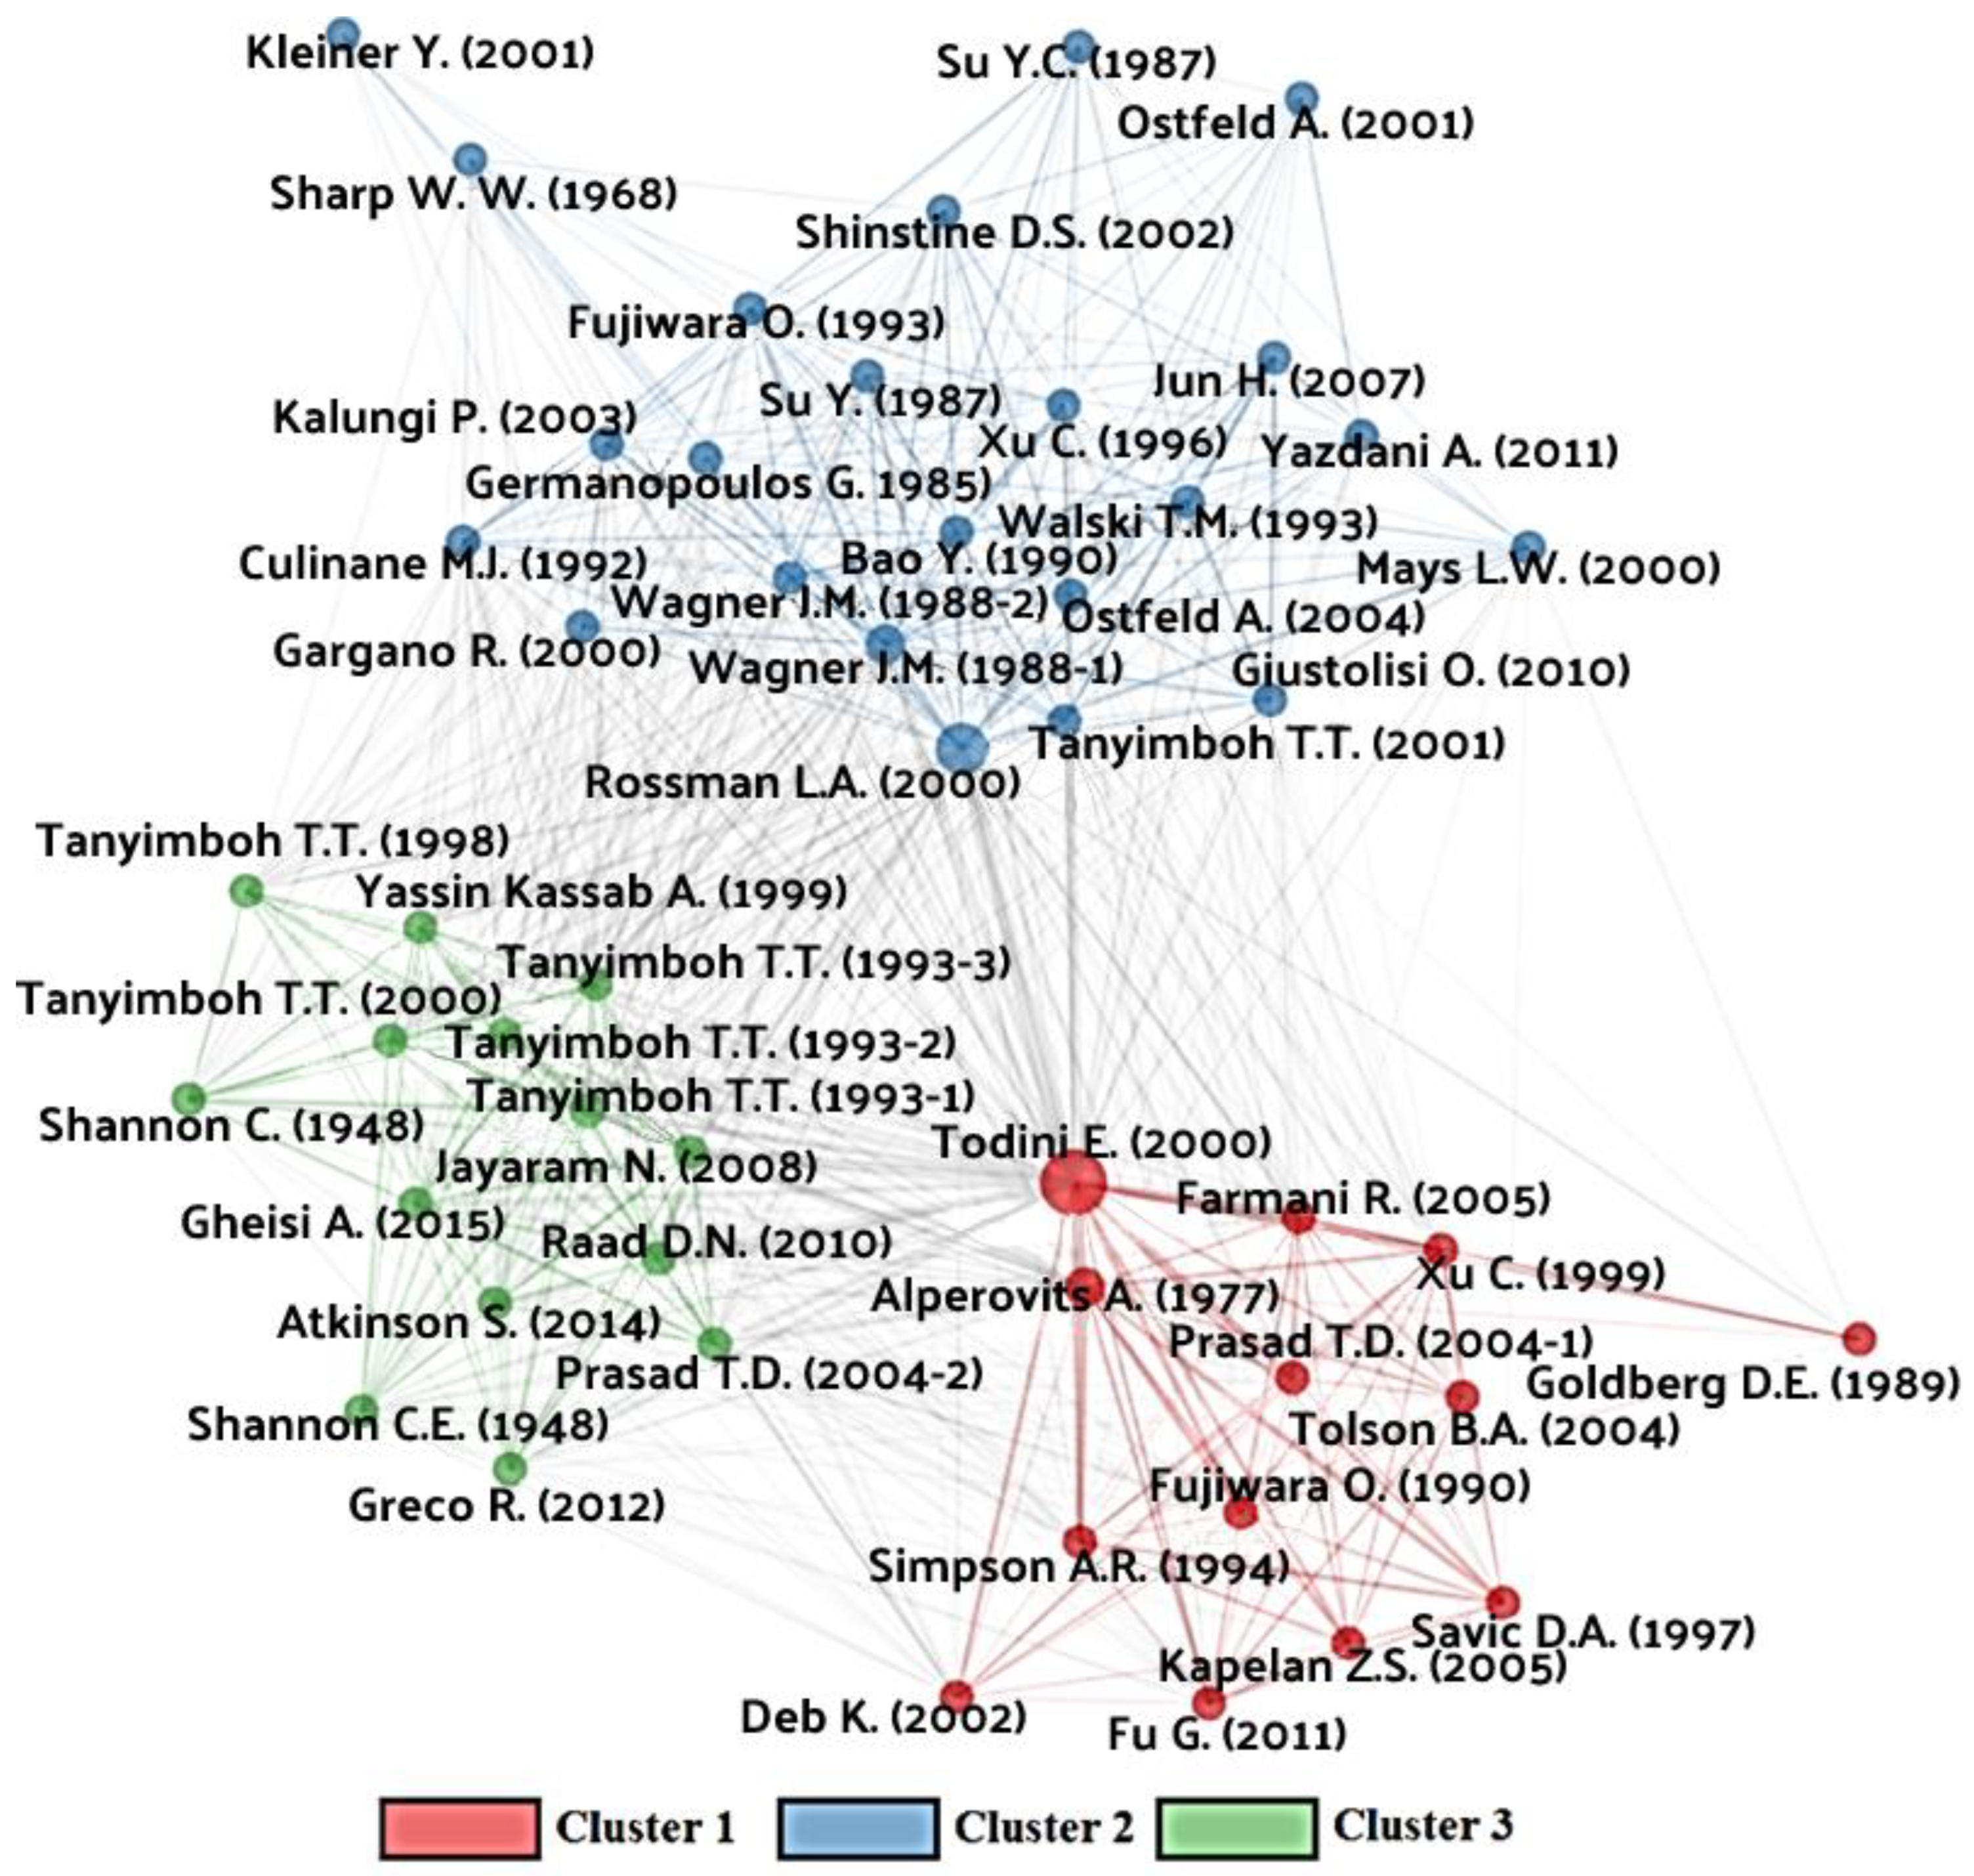
Co-citation analysis is conducted using bibliometric information of the articles. A Co-citation network is comprised of articles that have been cited by the articles considered for the analysis. Articles belonging to a common theme (commonly cited by a group of authors) are aggregated into one cluster. An author co-citation map was generated using Bibliometrix, as shown in Figure 7. The minimum number of citations was fixed to three and minimum number of articles to 20. As shown in Figure 7, three clusters can be identified. The top ten articles by number of citations from each cluster are presented in Table 5. Betweenness is a measure of how often a node falls on the shortest path between two nodes. Thus, a higher value of betweenness implies that the node has been cited a greater number of times by the authors in the co-citation network.
Cluster 1 belongs to articles on reliability-based design of WDNs and application of optimization techniques. These articles primarily focus on development and application of optimization tools for single and multi-objective reliability-based design of WDNs. One study had the highest page rank in this cluster [8] as it introduced resilience as a surrogate for reliability; this has been employed by numerous studies as an RSM. Another study [20] had the second highest page rank. The article employs the LPG method for the optimal design of WDN, which has been subsequently employed by many studies published in high impact journals. Cluster 2 groups articles focusing on reliability assessment techniques and simulation methods. The highest citation in this cluster was for the EPANET manual [77], that has been used by a substantial number of articles as a simulation tool. The second highest number of citations belongs to a study that introduced a simulation methodology for analyzing the reliability of WDNs [78]. The third highest was for a study that introduced the MCS method for hydraulic reliability estimation this is now one of the most widely used techniques [1]. Cluster 3 groups articles focusing on the use and analysis of various RSMs as substitute for WDN reliability. In this cluster, the study that introduced a modified resilience index as a surrogate for WDN reliability was the most cited article [10]. A comparative study on the usage of various RSMs, such as entropy, resilience, and network resilience, was presented in one article [79] and, thus, it is one of the widely cited articles. Some studies [71,80,81] presented entropy as a surrogate for WDN reliability while other studies [74,75,79] presented a comparative analysis of the various RSMs.

Table 5.
Clustering of co-cited articles.
| Article | Cluster | Betweenness | PageRank |
|---|---|---|---|
| Todini (2000) [8] | 1 | 223.332 | 0.021 |
| Alperovits and Shamir (1977) [20] | 1 | 48.809 | 0.021 |
| Fujiwara and De Silva (1990) [82] | 1 | 1.811 | 0.020 |
| Xu and Goulter (1999) [83] | 1 | 11.478 | 0.020 |
| Simpson et al. (1994) [84] | 1 | 3.457 | 0.019 |
| Farmani et al. (2005) [11] | 1 | 7.735 | 0.020 |
| Prasad and Park (2004) [9] | 1 | 6.198 | 0.019 |
| Savic and Walters (1997) [85] | 1 | 0.577 | 0.018 |
| Tolson et al. (2004) [73] | 1 | 10.340 | 0.019 |
| Deb et al. (2002) [86] | 1 | 2.421 | 0.019 |
| Rossman (2000) [77] | 2 | 96.938 | 0.024 |
| Wagner et al. (1988) [78] | 2 | 22.916 | 0.023 |
| Bao and Mays (1990) [1] | 2 | 9.589 | 0.021 |
| Walski (1993) [87] | 2 | 1.870 | 0.021 |
| Tanyimboh et al. (2001) [72] | 2 | 6.720 | 0.021 |
| Wagner et al. (1988) [88] | 2 | 5.422 | 0.023 |
| Ostfeld and Salomons (2004) [89] | 2 | 4.448 | 0.022 |
| Xu and Goulter (1998) [14] | 2 | 5.327 | 0.020 |
| Germanopoulos (1985) [90] | 2 | 1.488 | 0.020 |
| Fujiwara and Ganesharajah (1993) [91] | 2 | 1.670 | 0.021 |
| Jayaram and Srinivasan (2008) [10] | 3 | 45.350 | 0.020 |
| Raad et al. (2010) [79] | 3 | 42.236 | 0.020 |
| Tanyimboh and Templeman (1993) [80] | 3 | 27.807 | 0.020 |
| Tanyimboh and Templeman (2000) [71] | 3 | 42.326 | 0.020 |
| Tanyimboh and Templeman (1993) [81] | 3 | 22.664 | 0.019 |
| Prasad et al. (2004) [92] | 3 | 49.053 | 0.020 |
| Gheisi and Naser (2015) [75] | 3 | 27.446 | 0.019 |
| Atkinson et al. (2014) [74] | 3 | 15.626 | 0.019 |
| Yassin-Kassab et al. (1999) [93] | 3 | 13.915 | 0.019 |
| Tanyimboh and Templeman (1993) [94] | 3 | 0.080 | 0.020 |
4.4.2. Keywords Clustering Analysis
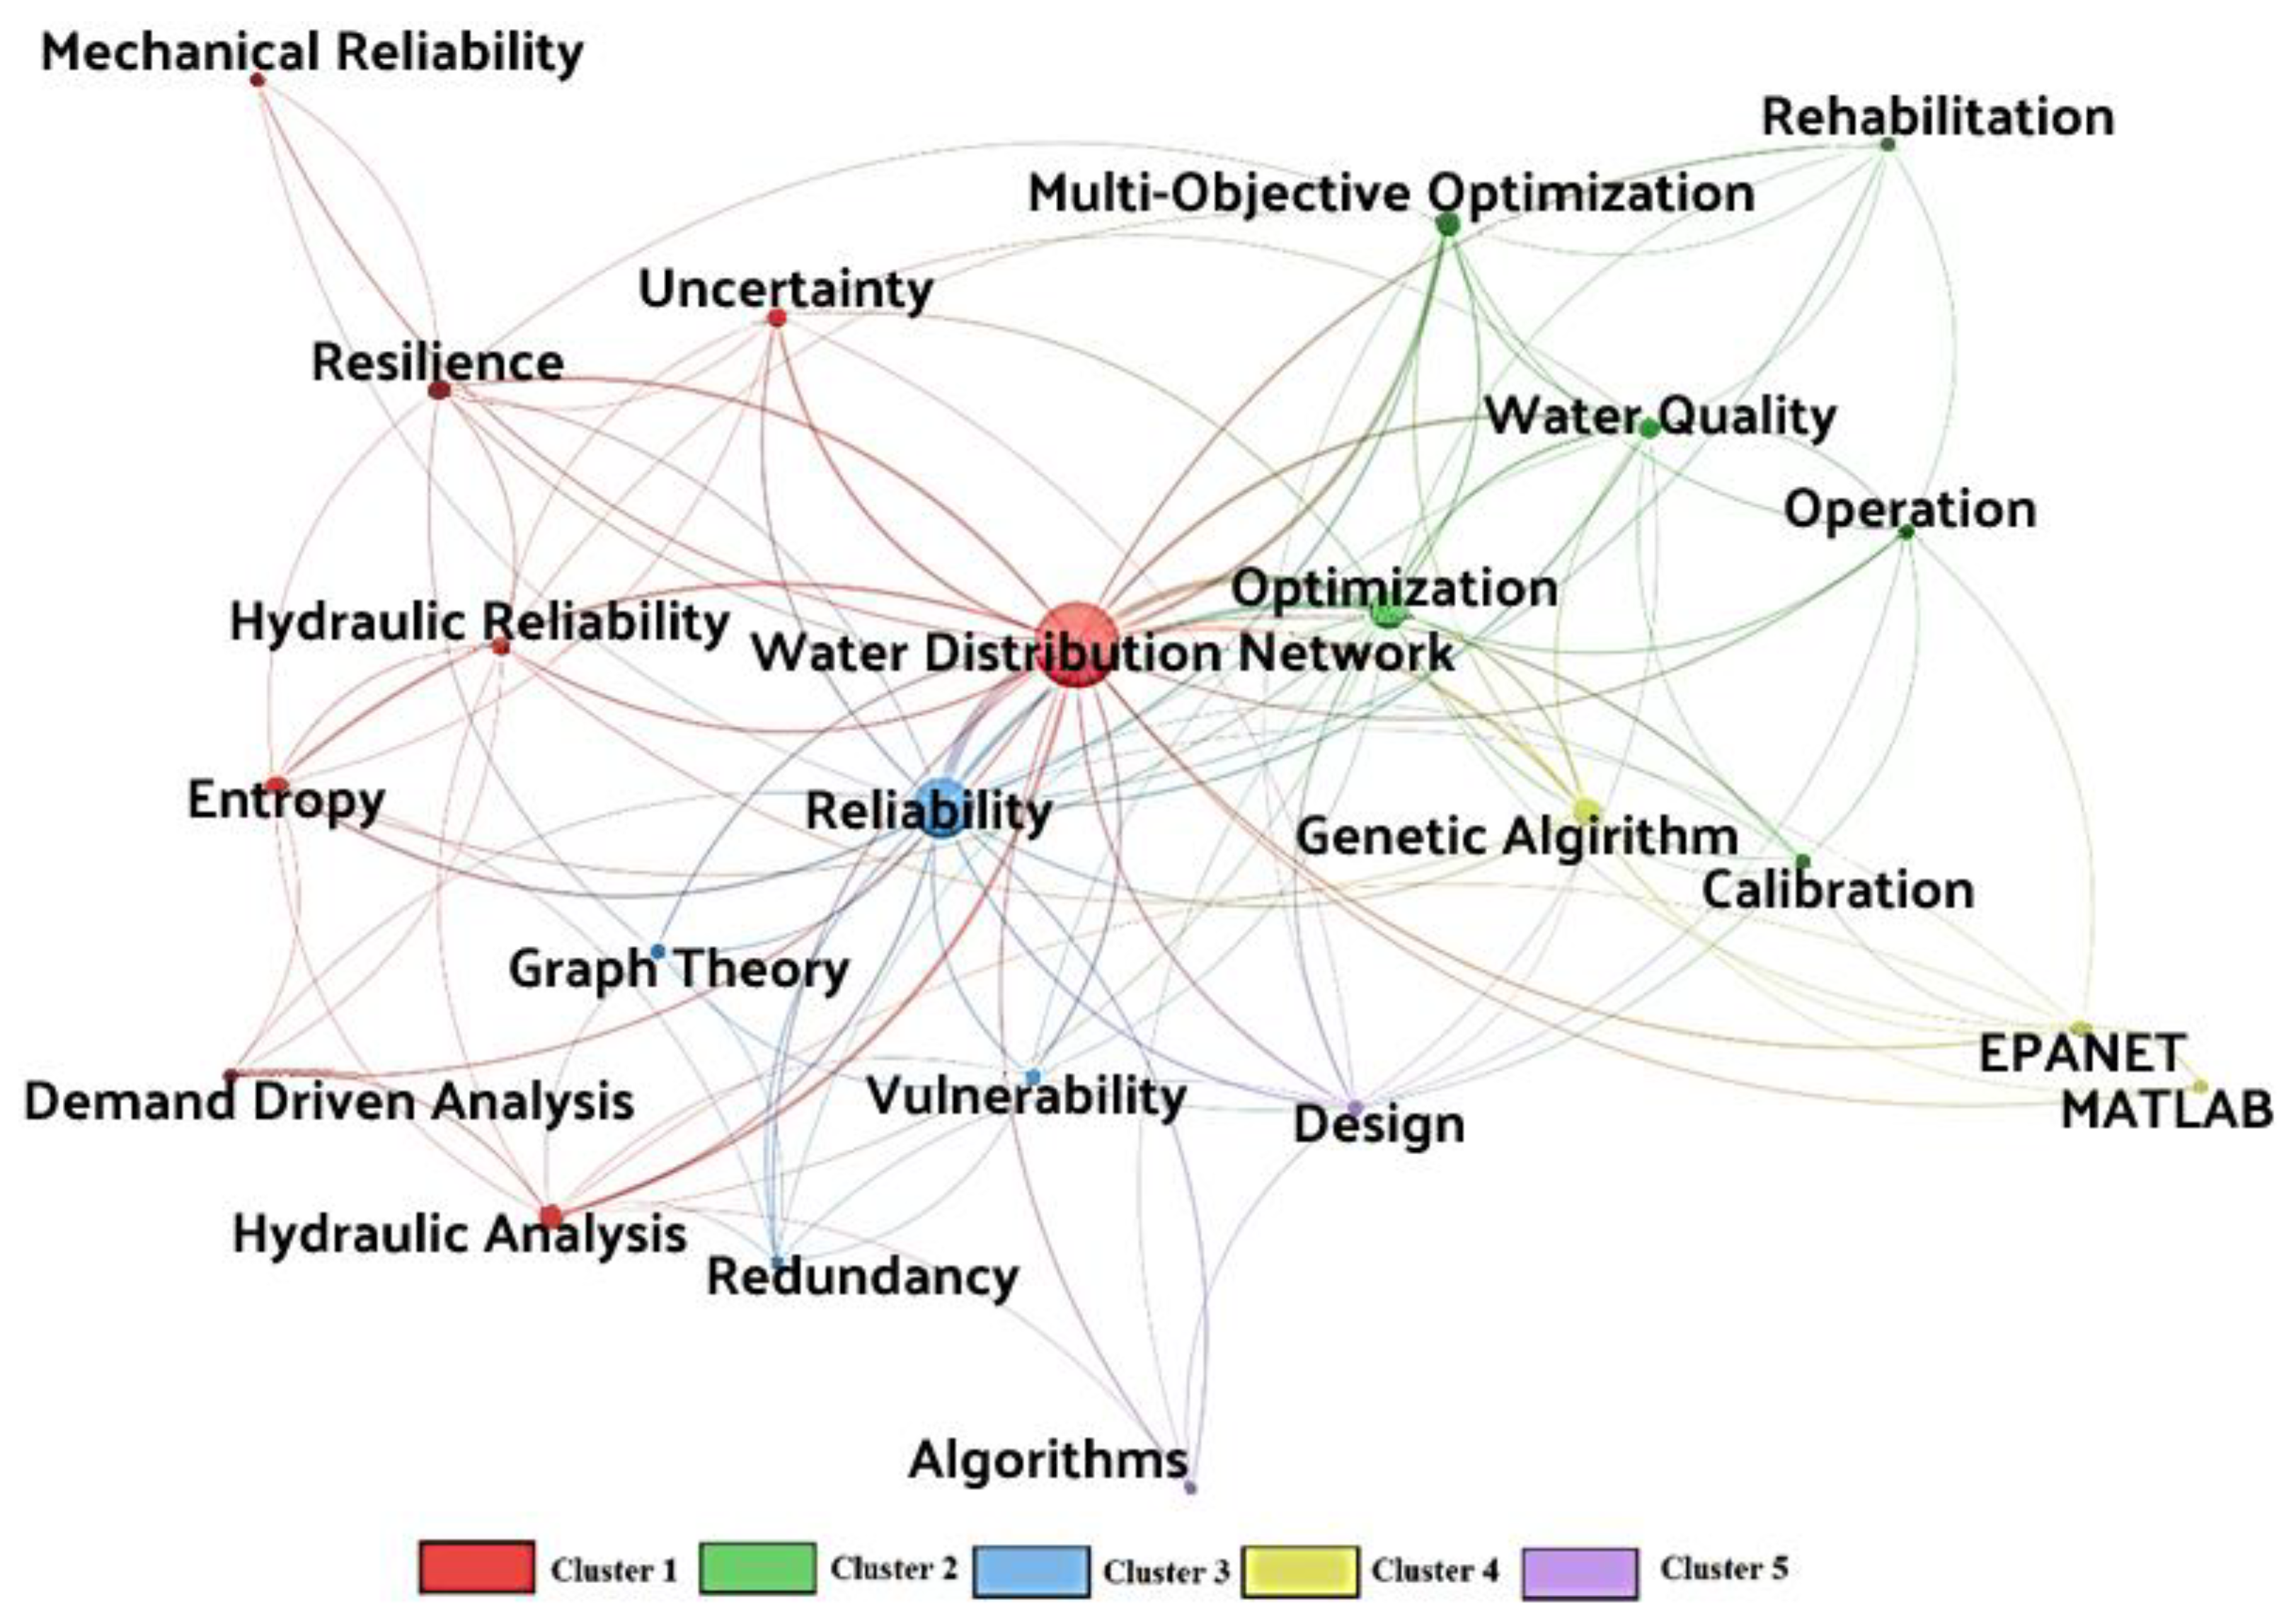
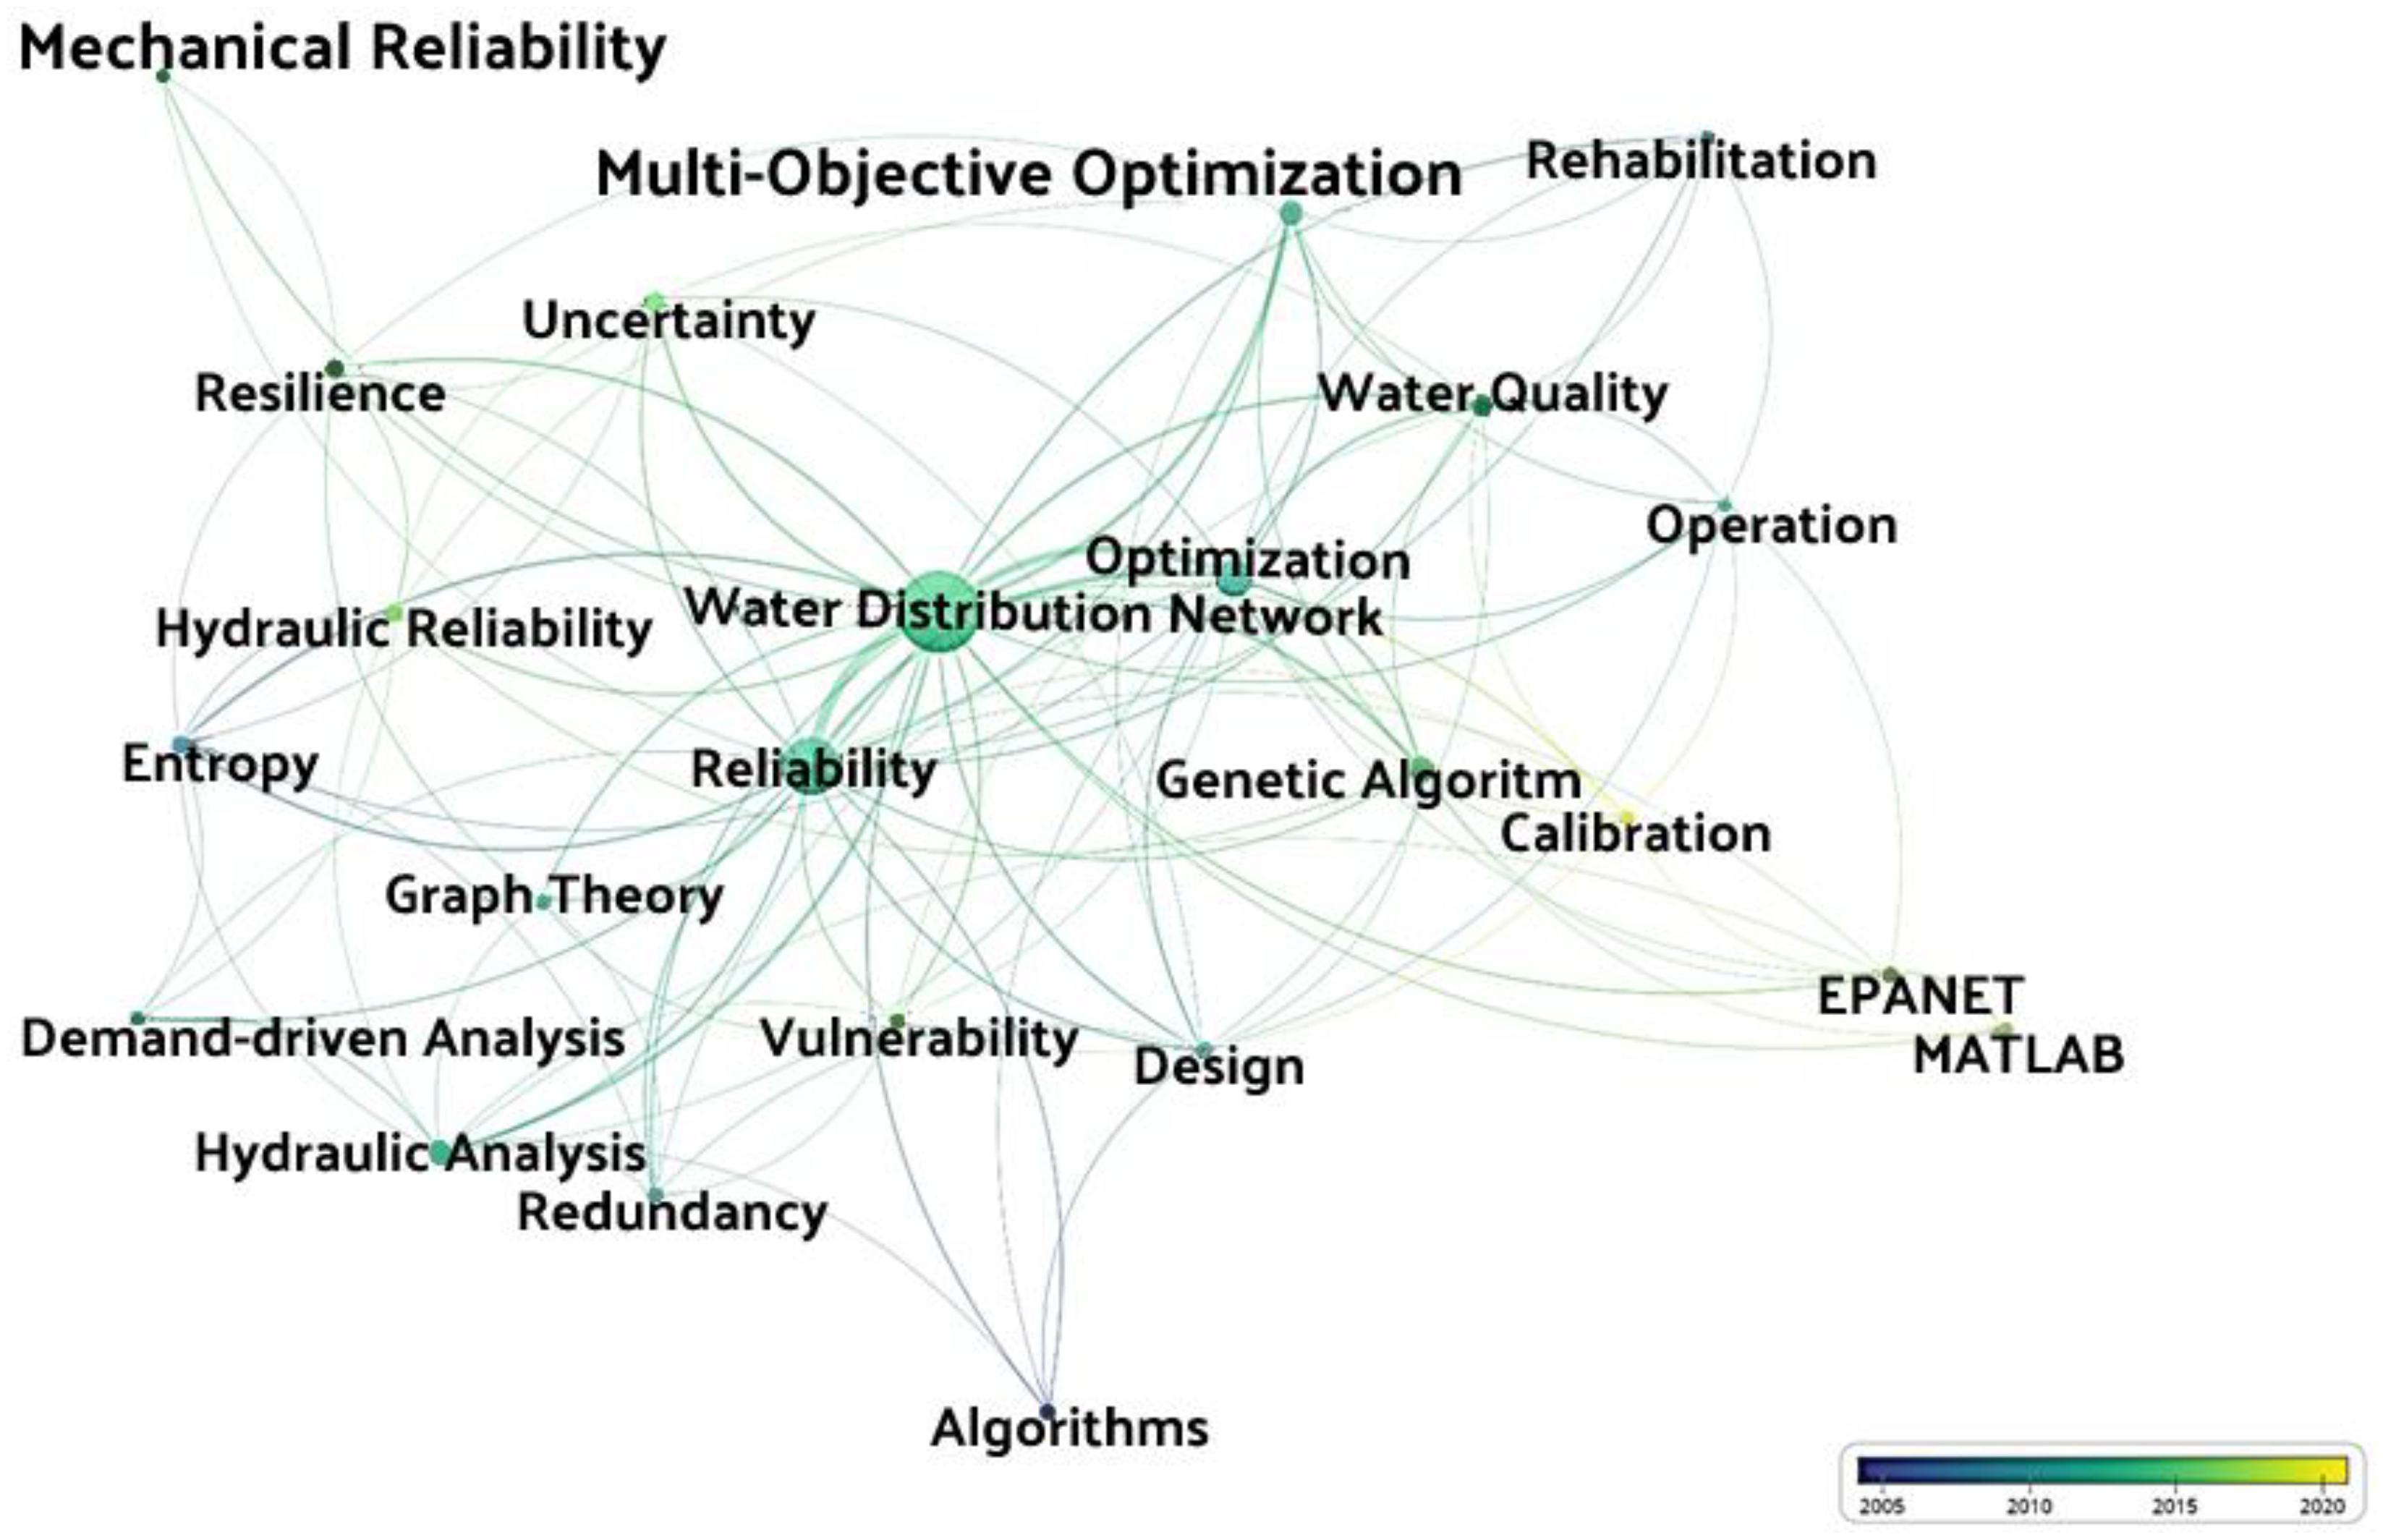
Clustering of articles was conducted based on the most frequently used keywords, as shown in Figure 8. Keywords were aggregated into one cluster if they commonly appeared in a group of articles. The links between different nodes represent that they appear in articles that have collaborations among themselves. The thickness of the links depicts the extent of collaboration, while the distance represents the co-citation. Similar keywords are grouped into one, as they imply the same meaning. The most frequent keywords, their grouping, and the number of occurrences is presented in Table 6. The most widely used keyword was “water distribution network(s)” and related keywords, with 228 occurrences, followed by keywords such as “reliability” and “optimization”, with 116 and 48 occurrences, respectively.
Five clusters were identified, as shown in Figure 8. Cluster 1 (red) consists of keywords such as water distribution system(s), hydraulic and mechanical reliability, resilience, uncertainty, entropy, demand driven analysis, hydraulic analysis etc. Thus, the focus of this cluster is on articles concerned with WDN design that consider the aspects of reliability, resilience, entropy, uncertainty etc. The largest node in cluster 2 (green) is optimization, linked with other keywords such as multi-objective optimization, water quality, rehabilitation, and operation. Thus, the articles in this cluster primarily focus on aspects of multi-objective design, operation, and rehabilitation of WDNs, incorporating aspects of optimal design and water quality. Cluster 3 (blue) involves keywords such as reliability, vulnerability, redundancy, and graph theory. Thus, the focus of this cluster is on reliability assessment tools, considering other aspects such as vulnerability and redundancy. Cluster 4 (yellow) is comprised of the keywords “genetic algorithm” (GA), “EPANET”, and “MATLAB”. This shows that the application of GA, linked with EPANET and MATLAB, forms a sizable portion of articles in this field. The fifth and final cluster (purple) is comprised of two keywords, “algorithms” and “design”. Thus, the articles that incorporate various algorithms for optimizing WDNs are presented in this cluster.
Figure 9 shows the evolution of author keywords over time. The color of the node represents the period when it has been most employed, the size of the node represents the number of times the specific keyword was used, and the links represents the co-occurrence in different articles. The use of keywords like entropy, rehabilitation, and algorithms dates to 2005. The use of keywords such as water distribution network(s), optimization, reliability, redundancy, hydraulic analysis seems to gain momentum in 2010. Keywords such as resilience, genetic algorithm, mechanical reliability, and water quality gained importance between 2010 to 2015. Whereas keywords such as hydraulic reliability, uncertainty, and vulnerability evolved hugely in 2015. The keywords significant employed in recent years include EPANET, MATLAB, and calibration.
4.5. Thematic Clustering and Research Trends
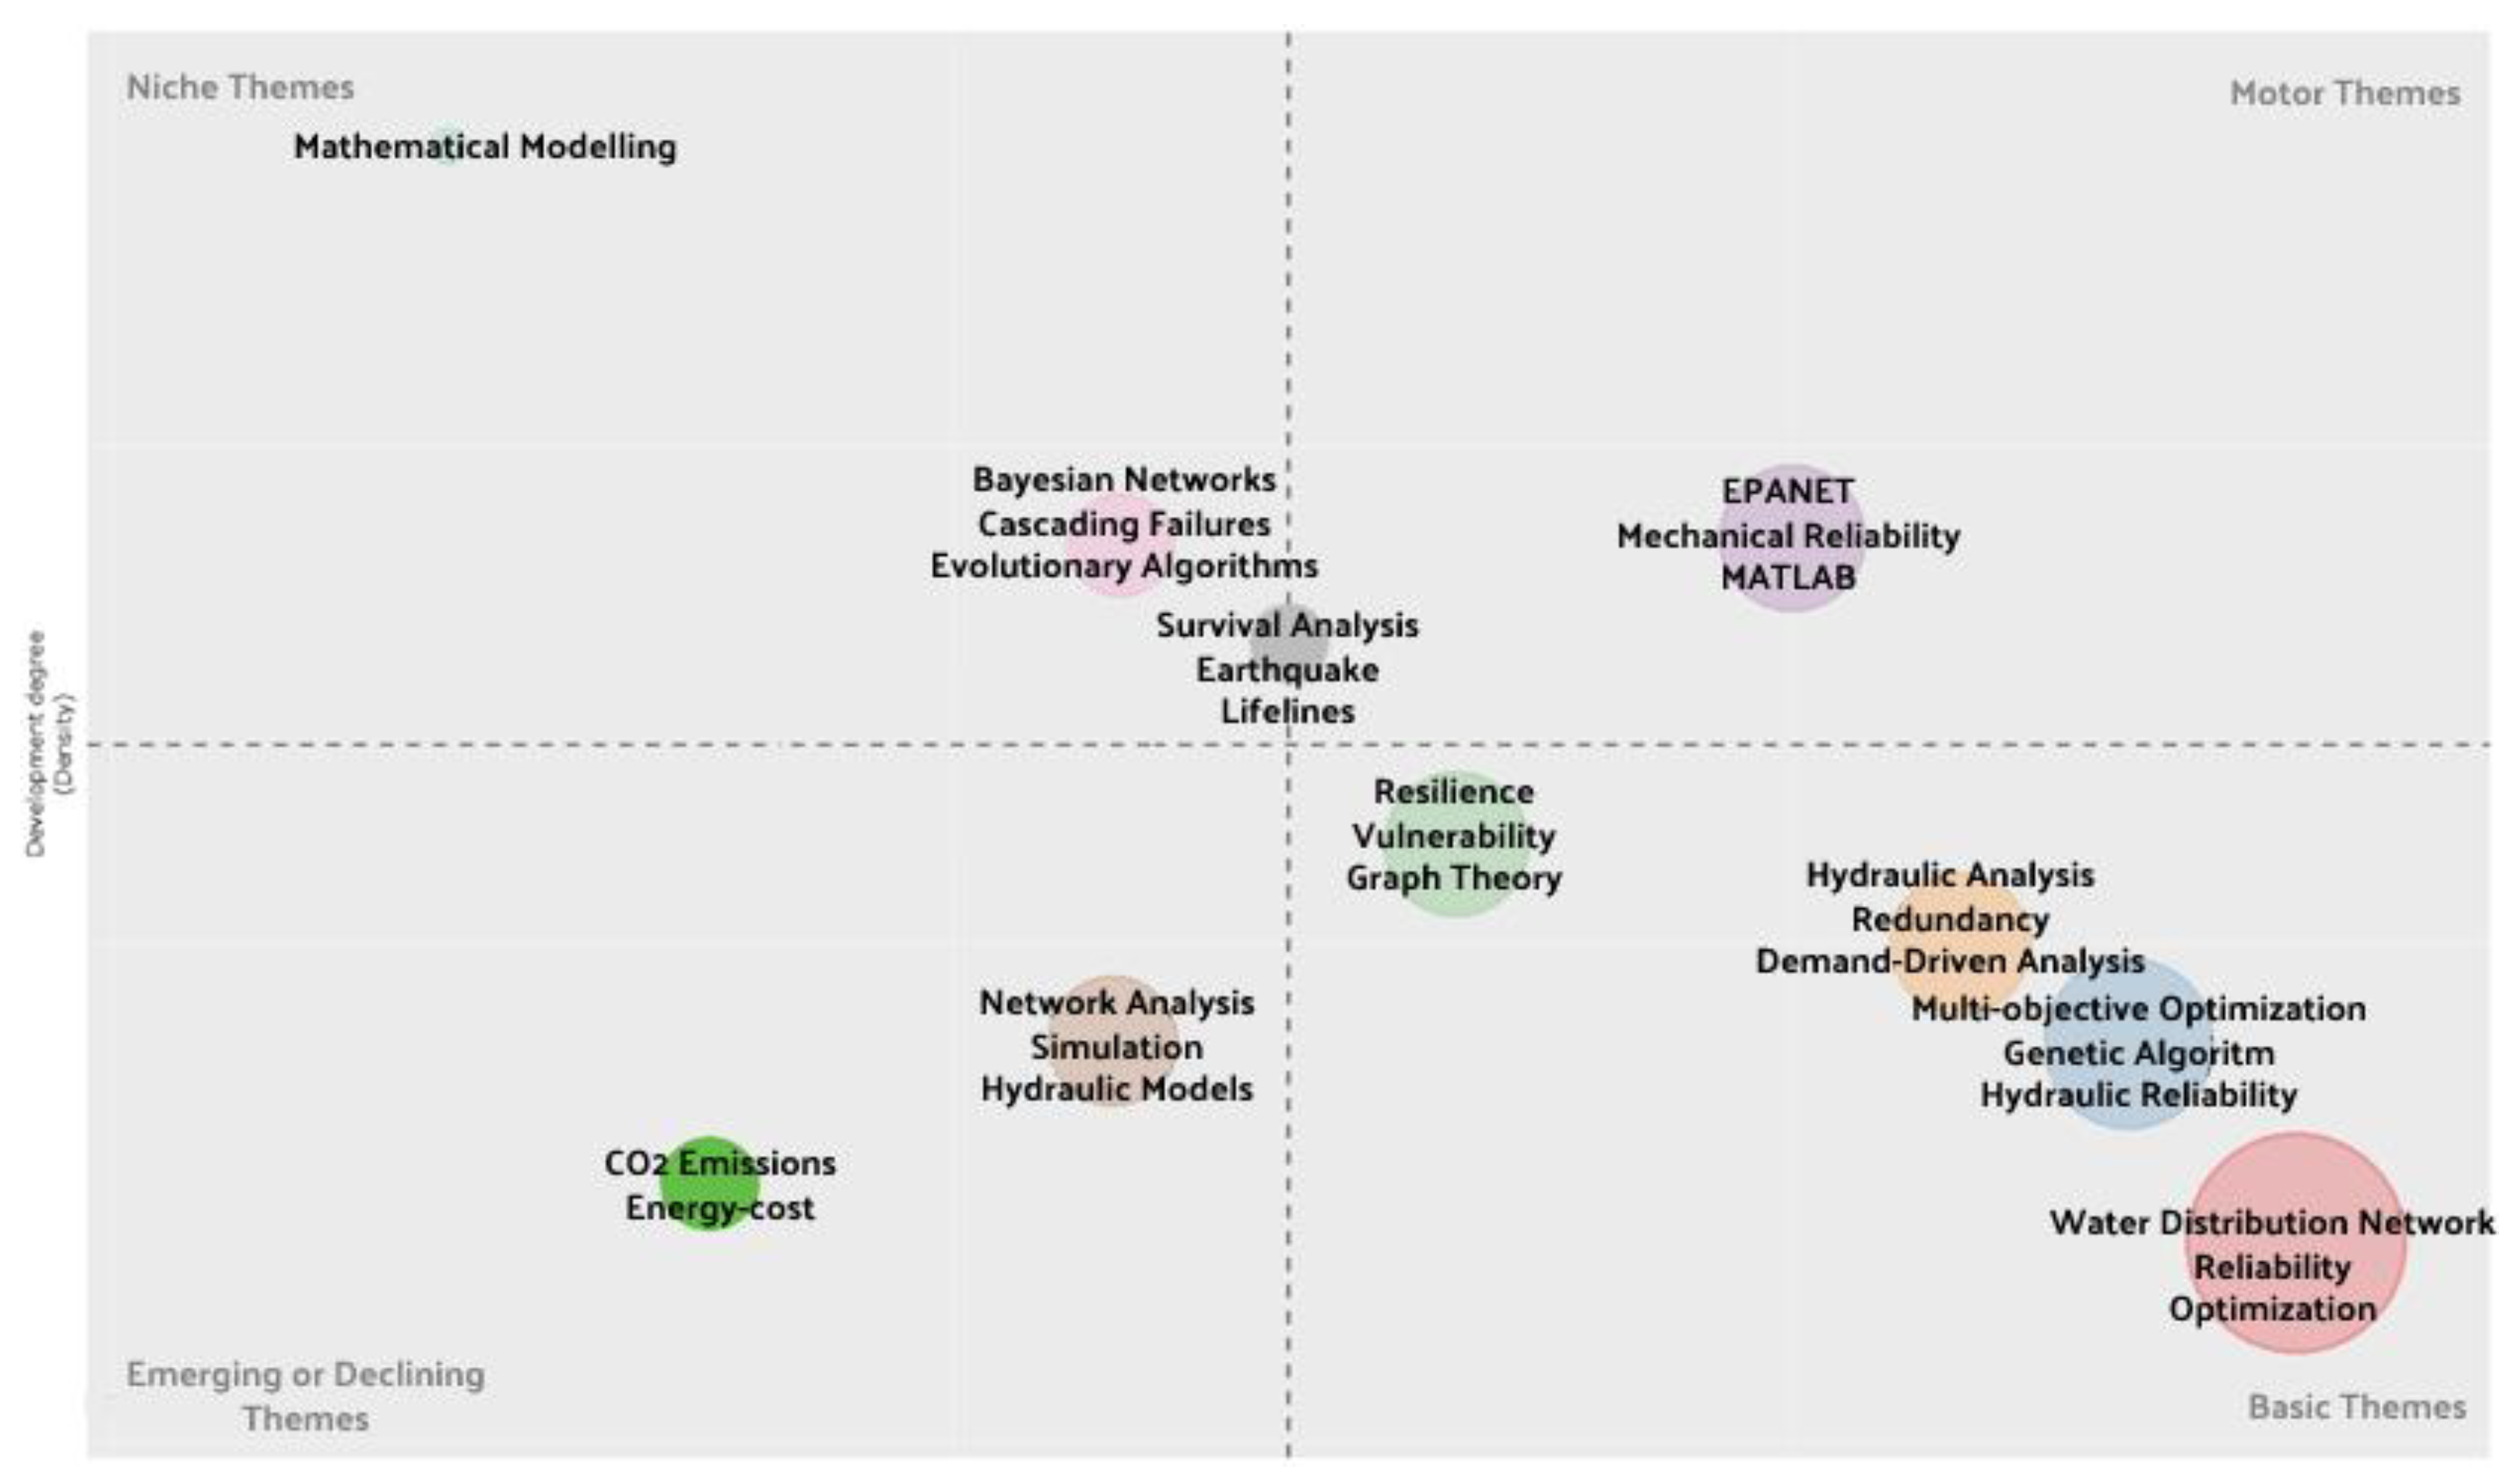
A thematic map is generated using the author keywords to determine the basic themes, niche themes, emerging themes, widely explored, and unexplored themes. The thematic map generated is shown in Figure 10.
The size of ae bubble represents the number of articles that have explored the keywords within a theme. Thus, bigger bubble sizes represent a greater number of articles that have explored a particular theme. There are four quadrants in the map. The bottom right quadrant represents the themes with high centrality but low density, constituting the basic themes. These are the themes that have not yet fully developed but play a vital role in the research field. These topics, such as optimization, hydraulic reliability, redundancy, hydraulic analysis etc., constitute the basic themes in this field. The grouping of the keywords represents that consideration of redundancy in hydraulic and demand driven analysis constitute one research field, while multi-objective genetic algorithm considering hydraulic reliability has been employed together to a significant extent. The top right quadrant represents the motor themes; these are the themes with high density and centrality. These themes are fully developed and are vital in the research domain. The consideration of EPANET and MATLAB for mechanical reliability is revealed as a motor theme. This, however, does not necessarily mean that there is no scope for future development in this research domain. The top left quadrant consists of the niche themes that have been fully developed but have less relevance in the research domain. Thus, these themes are of limited importance for the research field. Topics such as mathematical modeling, Bayesian networks, and cascading failures are niche themes. The bottom left quadrant represents the themes with low density and centrality. These are the topics that have been less developed and thus have exceptionally low relevance. These themes are the emerging themes. Topics such as consideration of CO2 emissions and energy and cost were underexplored but are emerging themes in the research domain. Network analysis, simulation, and hydraulic models are emerging themes that have been significantly explored. Thus, future works should focus on the consideration of CO2 emissions, energy, and cost for multi-objective design of WDNs, as well as development of the hydraulic models for network analysis and simulation.
5. Discussion
The results of the bibliometric analysis included several insights into the development of research on the reliability of WDNs. One important finding is that the number of publications in the field has increased over the last two decades. This was discussed in a recent article by [53], who reported an increasing trend in the number of articles produced in the field of WDN design. Article [8] is found to be the most cited article; this finding coincides with the study by [52], which showed that there is an increasing trend in articles considering resilience in WDN design. Farmani R. and Tanyimboh T.T. are the most cited authors; they have published articles on the use of EAs for WDN design, reliability assessment, and the use of RSMs, such as entropy and resiliency. This aligns with the conclusions by [52,53] and the increase in the use of EAs and RSMs for WDN design. Article [77] is found to be the article with the highest page rank in the co-citation network; this is because it is the EPANET manual, that has been employed in numerous studies as the simulation tool. Further exploration of articles is conducted to determine the research areas and the associated research gaps and presented in the following sub sections.
5.1. Major Research Areas
The major research areas are classified into three main categories:
- Reliability-based single and multi-objective design of WDNs: The works in this category consists of the application and development of improved optimization tools for reliability-based design of WDNs. Various traditional methods, such as LP, NLP, and MINLP, were employed by past studies. Subsequently, advanced techniques, such as evolutionary algorithms, were employed and were found to possess several advantages over the traditional approaches. Article [11], published in JWRPM, is one of the most cited publications in this field. They formulated the problem as a multi-objective optimization problem for cost minimization and reliability maximization (estimated using resilience as surrogate) using NSGA-II as the optimization tool. Article [95], published in JWRPM, is also a highly cited study employing GA for solving a reliability-based single objective problem: cost minimization keeping reliability as a constraint, considering uncertainty in nodal demands using MCS. Some of the recent publications in this field are [12], that incorporates Self-Adaptive Differential Evolution (SADE) for reliability-based design of WDNs; [96], that presented a Dynamic Adaptive Approach for WDN design; and [97], that presented Self-Adaptive Solution-Space Reduction Algorithm for WDN design.
- Reliability Assessment Models: Development of reliability assessment techniques are the focus of this field. Some of the oldest techniques include minimum cut set method and simple probabilistic approach for mechanical reliability estimation; and MCS, FORM, and network reliability factor for hydraulic reliability estimation. Later, several RSMs evolved, including resilience, network resilience, and entropy etc., that have the advantage of reduced computational time compared to the traditional approaches. Article [8], published in Urban Water Journal, is one of the most cited articles in the field; it introduced resilience as a surrogate for reliability. Article [9], published in JWRPM, is another highly cited article; it introduced network resilience as an RSM. Several studies focused on performance assessment of one or more of these RSMs [6,13,79,98,99]. Studies reported different findings in terms of the performance of these RSMs under different conditions.
- Consideration of energy, life cycle cost (LCC), and GHG emissions for expansion and rehabilitation of WDNs: The research in this field focuses on the consideration of aspects such as optimal design and expansion, considering aspects such as LCC, energy consumption, and GHG emissions. Article [11] is a highly cited article that considered LCC in the formulation of WDNs. Article [100] is another highly cited article that presented a model for minimization of LCC and CO2 emissions and found that minimizing CO2 emissions can be achieved at a higher LCC. Article [101] presented a dynamic design for the expansion and rehabilitation of WDNs. It found that a dynamic design led to more reliable and lower cost networks. Articles [102,103] presented a enhanced evolutionary algorithm frameworks for the expansion of WDNs considering LCC in their model, and found that this framework led to better solutions when compared to traditional approaches.
5.2. Research Gaps
The major research gaps in each of the research areas are as follows:
- Reliability-based single and multi-objective design of WDNs: Many optimization tools are provided in the literature. Different studies have shown different tools to be efficient for solving the WDN design problem. There is, however, a need to present a comprehensive review of the various optimization tools and to test their suitability, their advantages, and their drawbacks. The suitability of these algorithms has mostly been tested for consideration of objectives such as cost and reliability. A detailed analysis in terms of how the algorithms will perform on consideration of other objectives, such as GHG emissions, vulnerability etc., should be performed.
- Reliability Assessment Models: The last two decades have shown an emerging trend in the usage of RSMs. Studies presented and tested these RSMs under various conditions. However, different studies reported different conclusions regarding the suitability of these RSMs. Few studies compared the performance of the various RSMs and the outcomes varied for different studies. Surrogate measures such as entropy, resilience, and network resilience are based on the pressure and flow conditions that would prevail in case of probable failure scenarios. Some studies focused on the consumer’s perspective in terms of the damages caused by incorporating a damage function, when the requirements are not met. Thus, there is a lack of a comprehensive review in terms of the usage of these RSMs, the conditions under which they have been tested and found to be suitable, and their advantages and disadvantages. Findings in terms of which RSMs need further exploration, which RSMs are suitable under what conditions, and which RSMs are unsuitable for some specific conditions must be produced.
- Consideration of energy, LCC, and GHG emissions for the expansion and rehabilitation of WDNs: Some studies considered the aspects of energy, LCC, and GHG emissions for the optimal expansion and rehabilitation of WDNs. The benefit of considering these aspects in WDN optimization must be tested by acquiring real data in terms of emissions or cost under different scenarios but when implemented at similar locations. Improvements of the WDN expansion techniques are needed, as new optimization approaches continue to be developed.
6. Conclusions and Recommendations
WDN reliability is of the most important and relevant areas of research in the field of safe drinking water supply. This study applied bibliometric analysis and review techniques to explore research themes, trends, and gaps in the topic of WDN reliability. The major insights and conclusions from the bibliometric analysis and content review are as follows:
- There is an increasing trend in the number of publications in the field of WDN reliability, revealing its growing importance over the past two decades. The number of citations, however, has an alternating increasing and decreasing cycle.
- Some of the most cited documents are comprised of articles focused on the introduction of RSMs, such as resilience, network resilience etc. This shows that the use of RSMs has gained considerable momentum over the last two decades.
- Bibliographic coupling led to identification of three major areas of publications: reliability, water distribution networks, and optimization. Thus, cluster 1 is comprised of articles on reliability-based design of WDNs, including aspects such as hydraulic and mechanical failures, uncertainty, vulnerability, and redundancy. Cluster 2 is comprised of articles focused on WDN design and modeling, including aspects such as single and multi-objective optimization, rehabilitation, leakage, calibration, etc. Cluster 3 includes articles on the development and application of various optimization tools for WDN design.
- Thematic maps revealed that the consideration of cost and energy constitute one of the emerging trends in this field. Detailed analysis of the articles sheds light on the need to assess the suitability and performance of various RSMs in WDN analysis.
The insights and findings from this study can be useful in terms of forming the scope of the upcoming editions for journals and conferences. These can focus on emerging themes such as consideration of CO2 emissions and energy cost for WDN reliability. The identified research must include employing novel multi-objective optimization tools, extensively exploring and comparing RSMs, and incorporating environmental factors such as GHG emissions in WDN design and expansion. These needs can help formulate the objectives of future research.
Author Contributions
Conceptualization, M.A.H. and M.F.S.; methodology, S.S., M.A.H. and M.F.S.; software, S.S.; formal analysis, S.S., M.A.H. and M.F.S.; investigation, S.S., M.A.H. and M.F.S.; resources, M.A.H. and M.F.S.; data curation, S.S.; writing—original draft preparation, S.S.; writing—review and editing, S.S. and M.A.H.; visualization, S.S. and M.A.H.; supervision, M.A.H. and M.F.S.; project administration, M.A.H. and M.F.S.; funding acquisition, M.A.H. and M.F.S. All authors have read and agreed to the published version of the manuscript.
Funding
This work was supported by the American University of Sharjah, grant number FRG20-LE112, and by the National Water and Energy Center at UAE University, under Grant Number 12R019.
Data Availability Statement
The data that support the findings of this study are available on request from the corresponding author.
Conflicts of Interest
The authors have no conflicts of interest to declare.
References
- Bao, Y.; Mays, L.W. Model for Water Distribution System Reliability. J. Hydraul. Eng. 1990, 116, 1119–1137. [Google Scholar] [CrossRef]
- Su, Y.C.; Mays, L.W.; Duan, N.; Lansey, K.E. Reliability-Based Optimization Model for Water Distribution Systems. Am. Soc. Civ. Eng. J. Hydraul. Div. 1987, 113, 1539–1556. [Google Scholar] [CrossRef]
- Hobbs, B.F.; Beim, G.K. Analytical Simulation of Water System Capacity Reliability: 1. Modified Frequency-Duration Analysis. Water Resour. Res. 1988, 24, 1431–1444. [Google Scholar] [CrossRef]
- Cullinane, M.J., Jr. Methodologies for the Evaluation of Water Distribution System Reliability/Availability. Doctoral Dissertation, The University of Texas at Austin, Austin, TX, USA, 1989. [Google Scholar]
- Gupta, R.; Bhave, P.R. Reliability Analysis of Water-Distribution Systems. J. Environ. Eng. 1994, 120, 447–461. [Google Scholar] [CrossRef]
- Sirsant, S.; Reddy, M.J. Assessing the Performance of Surrogate Measures for Water Distribution Network Reliability. J. Water Resour. Plan. Manag. 2020, 146, 04020048. [Google Scholar] [CrossRef]
- Awumah, K.; Goulter, I.; Bhatt, S.K. Assessment of Reliability in Water Distribution Networks Using Entropy Based Measures. Stoch. Hydrol. Hydraul. 1990, 4, 309–320. [Google Scholar] [CrossRef]
- Todini, E. Looped Water Distribution Networks Design Using a Resilience Index Based Heuristic Approach. Urban Water 2000, 2, 115–122. [Google Scholar] [CrossRef]
- Prasad, T.D.; Park, N.-S. Multiobjective Genetic Algorithms for Design of Water Distribution Networks. J. Water Resour. Plan. Manag. 2004, 130, 73–82. [Google Scholar] [CrossRef]
- Jayaram, N.; Srinivasan, K. Performance-Based Optimal Design and Rehabilitation of Water Distribution Networks Using Life Cycle Costing. Water Resour. Res. 2008, 44. [Google Scholar] [CrossRef]
- Farmani, R.; Walters, G.A.; Savic, D.A. Trade-off between Total Cost and Reliability for Anytown Water Distribution Network. J. Water Resour. Plan. Manag. 2005, 131, 161–171. [Google Scholar] [CrossRef]
- Sirsant, S.; Janga Reddy, M. Reliability-Based Design of Water Distribution Networks Using Self-Adaptive Differential Evolution Algorithm. ISH J. Hydraul. Eng. 2018, 24, 198–212. [Google Scholar] [CrossRef]
- Monsef, H.; Naghashzadegan, M.; Farmani, R.; Jamali, A. Deficiency of Reliability Indicators in Water Distribution Networks. J. Water Resour. Plan. Manag. 2019, 145, 04019022. [Google Scholar] [CrossRef]
- Xu, C.; Goulter, I.C. Probabilistic Model for Water Distribution Reliability. J. Water Resour. Plan. Manag. 1998, 124, 218–228. [Google Scholar] [CrossRef]
- Vasan, A.; Simonovic, S.P. Optimization of Water Distribution Network Design Using Differential Evolution. J. Water Resour. Plan. Manag. 2010, 136, 279–287. [Google Scholar] [CrossRef]
- Maier, H.R.; Simpson, A.R.; Zecchin, A.C.; Foong, W.K.; Phang, K.Y.; Seah, H.Y.; Tan, C.L. Ant Colony Optimization for Design of Water Distribution Systems. J. Water Resour. Plan. Manag. 2003, 129, 200–209. [Google Scholar] [CrossRef] [Green Version]
- Vamvakeridou-Lyroudia, L.S.; Walters, G.A.; Savic, D.A. Fuzzy Multiobjective Optimization of Water Distribution Networks. J. Water Resour. Plan. Manag. 2005, 131, 467–476. [Google Scholar] [CrossRef]
- Fu, G.; Kapelan, Z. Fuzzy Probabilistic Design of Water Distribution Networks. Water Resour. Res. 2011, 47. [Google Scholar] [CrossRef]
- Marques, J.; Cunha, M.; Savić, D.A. Multi-Objective Optimization of Water Distribution Systems Based on a Real Options Approach. Environ. Model. Softw. 2015, 63, 1–13. [Google Scholar] [CrossRef] [Green Version]
- Alperovits, E.; Shamir, U. Design of Optimal Water Distribution Systems. Water Resour. Res. 1977, 13, 885–900. [Google Scholar] [CrossRef]
- Fujiwara, O.; Jenchaimahakoon, B.; Edirishinghe, N.C.P. A Modified Linear Programming Gradient Method for Optimal Design of Looped Water Distribution Networks. Water Resour. Res. 1987, 23, 977–982. [Google Scholar] [CrossRef]
- Watanatada, T. Least-Cost Design of Water Distribution Systems. J. Hydraul. Div. 1973, 99, 1497–1513. [Google Scholar] [CrossRef]
- Morsi, A.; Geißler, B.; Martin, A. Mixed Integer Optimization of Water Supply Networks. In Mathematical Optimization of Water Networks; Martin, A., Klamroth, K., Lang, J., Leugering, G., Morsi, A., Oberlack, M., Ostrowski, M., Rosen, R., Eds.; International Series of Numerical Mathematics; Springer: Basel, Switzerland, 2012; pp. 35–54. ISBN 978-3-0348-0436-3. [Google Scholar]
- Bragalli, C.; D’Ambrosio, C.; Lee, J.; Lodi, A.; Toth, P. Water Network Design by MINLP; IBM Research Division: New York, NY, USA, 2008. [Google Scholar]
- Bragalli, C.; D’Ambrosio, C.; Lee, J.; Lodi, A.; Toth, P. On the Optimal Design of Water Distribution Networks: A Practical MINLP Approach. Optim. Eng. 2012, 13, 219–246. [Google Scholar] [CrossRef]
- D’Ambrosio, C.; Lodi, A.; Wiese, S.; Bragalli, C. Mathematical Programming Techniques in Water Network Optimization. Eur. J. Oper. Res. 2015, 243, 774–788. [Google Scholar] [CrossRef]
- Montesinos, P.; Garcia-Guzman, A.; Ayuso, J.L. Water Distribution Network Optimization Using a Modified Genetic Algorithm. Water Resour. Res. 1999, 35, 3467–3473. [Google Scholar] [CrossRef]
- Keedwell, E.; Khu, S.-T. A Novel Evolutionary Meta-Heuristic for the Multi-Objective Optimization of Real-World Water Distribution Networks. Eng. Optim. 2006, 38, 319–333. [Google Scholar] [CrossRef]
- Johns, M.B.; Keedwell, E.; Savic, D. Adaptive Locally Constrained Genetic Algorithm for Least-Cost Water Distribution Network Design. J. Hydroinform. 2013, 16, 288–301. [Google Scholar] [CrossRef] [Green Version]
- Suribabu, C.R.; Neelakantan, T.R. Design of Water Distribution Networks Using Particle Swarm Optimization. Urban Water J. 2006, 3, 111–120. [Google Scholar] [CrossRef]
- Bansal, J.C.; Deep, K. Optimal Design of Water Distribution Networks via Particle Swarm Optimization. In Proceedings of the 2009 IEEE International Advance Computing Conference, Patiala, India, 6–7 March 2009; IEEE: Piscataway, NJ, USA, 2009; pp. 1314–1316. [Google Scholar] [CrossRef]
- Ezzeldin, R.; Djebedjian, B.; Saafan, T. Integer Discrete Particle Swarm Optimization of Water Distribution Networks. J. Pipeline Syst. Eng. Pract. 2014, 5, 04013013. [Google Scholar] [CrossRef]
- Zecchin, A.C.; Maier, H.R.; Simpson, A.R.; Leonard, M.; Nixon, J.B. Ant Colony Optimization Applied to Water Distribution System Design: Comparative Study of Five Algorithms. J. Water Resour. Plan. Manag. 2007, 133, 87–92. [Google Scholar] [CrossRef] [Green Version]
- Prasad, T.D.; Hong, S.-H.; Park, N. Reliability Based Design of Water Distribution Networks Using Multi-Objective Genetic Algorithms. KSCE J. Civ. Eng. 2003, 7, 351–361. [Google Scholar] [CrossRef]
- Farmani, R.; Walters, G.; Savic, D. Evolutionary Multi-Objective Optimization of the Design and Operation of Water Distribution Network: Total Cost vs. Reliability vs. Water Quality. J. Hydroinform. 2006, 8, 165–179. [Google Scholar] [CrossRef]
- Alvisi, S.; Franchini, M. Near-Optimal Rehabilitation Scheduling of Water Distribution Systems Based on a Multi-Objective Genetic Algorithm. Civ. Eng. Environ. Syst. 2006, 23, 143–160. [Google Scholar] [CrossRef]
- Moosavian, N.; Lence, B.J. Nondominated Sorting Differential Evolution Algorithms for Multiobjective Optimization of Water Distribution Systems. J. Water Resour. Plan. Manag. 2017, 143, 04016082. [Google Scholar] [CrossRef]
- Sirsant, S.; Janga Reddy, M. Sobol Sequence-Based MOSaDE Algorithm for Multi-Objective Design of Water Distribution Networks. In Differential Evolution: From Theory to Practice; Kumar, B.V., Oliva, D., Suganthan, P.N., Eds.; Studies in Computational Intelligence; Springer Nature: Singapore, 2022; pp. 215–240. ISBN 9789811680823. [Google Scholar] [CrossRef]
- Reddy, M.J.; Kumar, D.N. Performance Evaluation of Elitist-Mutated Multi-Objective Particle Swarm Optimization for Integrated Water Resources Management. J. Hydroinform. 2009, 11, 79–88. [Google Scholar] [CrossRef] [Green Version]
- Montalvo, I.; Izquierdo, J.; Schwarze, S.; Pérez-García, R. Multi-Objective Particle Swarm Optimization Applied to Water Distribution Systems Design: An Approach with Human Interaction. Math. Comput. Model. 2010, 52, 1219–1227. [Google Scholar] [CrossRef]
- Torkomany, M.R.; Hassan, H.S.; Shoukry, A.; Abdelrazek, A.M.; Elkholy, M. An Enhanced Multi-Objective Particle Swarm Optimization in Water Distribution Systems Design. Water 2021, 13, 1334. [Google Scholar] [CrossRef]
- Tabesh, M.; Soltani, J.; Farmani, R.; Savic, D. Assessing Pipe Failure Rate and Mechanical Reliability of Water Distribution Networks Using Data-Driven Modeling. J. Hydroinform. 2009, 11, 1–17. [Google Scholar] [CrossRef]
- Aydogdu, M.; Firat, M. Estimation of Failure Rate in Water Distribution Network Using Fuzzy Clustering and LS-SVM Methods. Water Resour. Manag. 2015, 29, 1575–1590. [Google Scholar] [CrossRef]
- Phan, H.C.; Dhar, A.S.; Thodi, P.; Sadiq, R. Probability of Network Disconnection of Water Distribution System for Maintenance Prioritization. J. Water Supply Res. Technol.-Aqua 2018, 67, 252–269. [Google Scholar] [CrossRef]
- Liu, H.; Walski, T.; Fu, G.; Zhang, C. Failure Impact Analysis of Isolation Valves in a Water Distribution Network. J. Water Resour. Plan. Manag. 2017, 143, 04017019. [Google Scholar] [CrossRef] [Green Version]
- Giustolisi, O.; Savic, D. Identification of Segments and Optimal Isolation Valve System Design in Water Distribution Networks. Urban Water J. 2010, 7, 1–15. [Google Scholar] [CrossRef]
- Giustolisi, O. Water Distribution Network Reliability Assessment and Isolation Valve System. J. Water Resour. Plan. Manag. 2020, 146, 04019064. [Google Scholar] [CrossRef]
- Aksela, K.; Aksela, M.; Vahala, R. Leakage Detection in a Real Distribution Network Using a SOM. Urban Water J. 2009, 6, 279–289. [Google Scholar] [CrossRef]
- Sophocleous, S.; Savić, D.; Kapelan, Z. Leak Localization in a Real Water Distribution Network Based on Search-Space Reduction. J. Water Resour. Plan. Manag. 2019, 145, 04019024. [Google Scholar] [CrossRef]
- Al Qahtani, T.; Yaakob, M.S.; Yidris, N.; Sulaiman, S.; Ahmad, K.A. A Review on Water Leakage Detection Method in the Water Distribution Network. J. Adv. Res. Fluid Mech. Therm. Sci. 2020, 68, 152–163. [Google Scholar] [CrossRef]
- Marzola, I.; Mazzoni, F.; Alvisi, S.; Franchini, M. Leakage Detection and Localization in a Water Distribution Network through Comparison of Observed and Simulated Pressure Data. J. Water Resour. Plan. Manag. 2022, 148, 04021096. [Google Scholar] [CrossRef]
- Li, Y.; Li, X. Research on Water Distribution Systems from the Past to the Future: A Bibliometric Review. Environ. Technol. Rev. 2021, 10, 161–176. [Google Scholar] [CrossRef]
- Assad, A.; Bouferguene, A. Resilience Assessment of Water Distribution Networks – Bibliometric Analysis and Systematic Review. J. Hydrol. 2022, 607, 127522. [Google Scholar] [CrossRef]
- Donthu, N.; Kumar, S.; Mukherjee, D.; Pandey, N.; Lim, W.M. How to Conduct a Bibliometric Analysis: An Overview and Guidelines. J. Bus. Res. 2021, 133, 285–296. [Google Scholar] [CrossRef]
- Goulter, I.C.; Morgan, D.R. An Integrated Approach to the Layout and Design of Water Distribution Networks. Civ. Eng. Syst. 1985, 2, 104–113. [Google Scholar] [CrossRef]
- Ostfeld, A.; Shamir, U. Incorporating Reliability in Optimal Design of Water Distribution Networks—Review and New Concepts. Reliab. Eng. Syst. Saf. 1993, 42, 5–11. [Google Scholar] [CrossRef]
- Mahmoud, H.A.; Kapelan, Z.; Savić, D. Real-Time Operational Response Methodology for Reducing Failure Impacts in Water Distribution Systems. J. Water Resour. Plan. Manag. 2018, 144, 04018029. [Google Scholar] [CrossRef]
- Szpak, D. Method for Determining the Probability of a Lack of Water Supply to Consumers. Energies 2020, 13, 5361. [Google Scholar] [CrossRef]
- Lee, E.J.; Schwab, K.J. Deficiencies in Drinking Water Distribution Systems in Developing Countries. J. Water Health 2005, 3, 109–127. [Google Scholar] [CrossRef] [Green Version]
- Peng, X.; Xiao, L.; Mo, Z.; Liu, G. The Variable Frequency and Speed Regulation Constant Pressure Water Supply System Based on PLC and Fuzzy Control. In Proceedings of the 2009 International Conference on Measuring Technology and Mechatronics Automation, Zhangjiajie, China, 11–12 April 2009; Volume 1, pp. 910–913. [Google Scholar]
- Goulter, I.C. Multi-Objective Optimization of Water Distribution Networks. Civ. Eng. Syst. 1986, 3, 222–231. [Google Scholar] [CrossRef]
- Jacobs, P.; Goulter, I. Evaluation of Methods for Decomposition of Water Distribution Networks for Reliability Analysis. Civ. Eng. Syst. 1988, 5, 58–64. [Google Scholar] [CrossRef]
- Bhave, P.R.; Gupta, R. Optimal Design of Water Distribution Networks for Fuzzy Demands. Civ. Eng. Environ. Syst. 2004, 21, 229–245. [Google Scholar] [CrossRef]
- Shibu, A.; Reddy, M.J. Optimal Design of Water Distribution Networks Considering Fuzzy Randomness of Demands Using Cross Entropy Optimization. Water Resour. Manag. 2014, 28, 4075–4094. [Google Scholar] [CrossRef]
- Čepin, M. Reliability Block Diagram. In Assessment of Power System Reliability: Methods and Applications; Čepin, M., Ed.; Springer: London, UK, 2011; pp. 119–123. ISBN 978-0-85729-688-7. [Google Scholar]
- Lee, W.S.; Grosh, D.L.; Tillman, F.A.; Lie, C.H. Fault Tree Analysis, Methods, and Applications ߝ A Review. IEEE Trans. Reliab. 1985, R-34, 194–203. [Google Scholar] [CrossRef]
- Aria, M.; Cuccurullo, C. Bibliometrix: An R-Tool for Comprehensive Science Mapping Analysis. J. Informetr. 2017, 11, 959–975. [Google Scholar] [CrossRef]
- Pritchard, A. Statistical Bibliography or Bibliometrics. J. Doc. 1969, 25, 348. [Google Scholar]
- Su, C.; Pan, Y.T.; Yuan, J.P.; Guo, H.; Yu, Z.L.; Hu, Z.Y. PageRank, HITS and Impact Factor for Journal Ranking. In Proceedings of the 2009 WRI World Congress on Computer Science and Information Engineering, Los Angeles, CA, USA, 31 March–2 April 2009; IEEE: Piscataway, NJ, USA, 2009; Volume 6, pp. 285–290. [Google Scholar]
- Mala-Jetmarova, H.; Sultanova, N.; Savic, D. Lost in Optimisation of Water Distribution Systems? A Literature Review of System Design. Water 2018, 10, 307. [Google Scholar] [CrossRef] [Green Version]
- Tanyimboh, T.T.; Templeman, A.B. A Quantified Assessment of the Relationship Between the Reliability and Entropy of Water Distribution Systems. Eng. Optim. 2000, 33, 179–199. [Google Scholar] [CrossRef]
- Tanyimboh, T.T.; Kalungi, P.; Xu, C.; Goulter, I.C. Reliability-Based Optimal Design of Water Distribution Networks. J. Water Resour. Plan. Manag. 2001, 127, 278–280. [Google Scholar] [CrossRef]
- Tolson, B.A.; Maier, H.R.; Simpson, A.R.; Lence, B.J. Genetic Algorithms for Reliability-Based Optimization of Water Distribution Systems. J. Water Resour. Plan. Manag. 2004, 130, 63–72. [Google Scholar] [CrossRef] [Green Version]
- Atkinson, S.; Farmani, R.; Memon, F.A.; Butler, D. Reliability Indicators for Water Distribution System Design: Comparison. J. Water Resour. Plan. Manag. 2014, 140, 160–168. [Google Scholar] [CrossRef] [Green Version]
- Gheisi, A.; Naser, G. Multistate Reliability of Water-Distribution Systems: Comparison of Surrogate Measures. J. Water Resour. Plan. Manag. 2015, 141, 04015018. [Google Scholar] [CrossRef]
- Kalungi, P.; Tanyimboh, T.T. Redundancy Model for Water Distribution Systems. Reliab. Eng. Syst. Saf. 2003, 82, 275–286. [Google Scholar] [CrossRef]
- Rossman, L.A. EPANET 2.0 User Manual; Water Supply and Water Resources Division, National Risk management Laboratory, USEPA: Cincinnati, OH, USA, 2000. [Google Scholar]
- Wagner, J.M.; Shamir, U.; Marks, D.H. Water Distribution Reliability: Simulation Methods. J. Water Resour. Plan. Manag. 1988, 114, 276–294. [Google Scholar] [CrossRef] [Green Version]
- Raad, D.N.; Sinske, A.N.; van Vuuren, J.H. Comparison of Four Reliability Surrogate Measures for Water Distribution Systems Design. Water Resour. Res. 2010, 46. [Google Scholar] [CrossRef]
- Tanyimboh, T.T.; Templeman, A.B. Maximum Entropy Flows for Single-Source Networks. Eng. Optim. 1993, 22, 49–63. [Google Scholar] [CrossRef] [Green Version]
- Tanyimboh, T.T.; Templeman, A.B. Calculating Maximum Entropy Flows in Networks. J. Oper. Res. Soc. 1993, 44, 383–396. [Google Scholar] [CrossRef]
- Fujiwara, O.; De Silva, A.U. Algorithm for Reliability-Based Optimal Design of Water Networks. J. Environ. Eng. 1990, 116, 575–587. [Google Scholar] [CrossRef]
- Xu, C.; Goulter, I.C. Reliability-Based Optimal Design of Water Distribution Networks. J. Water Resour. Plan. Manag. 1999, 125, 352–362. [Google Scholar] [CrossRef] [Green Version]
- Simpson, A.R.; Dandy, G.C.; Murphy, L.J. Genetic Algorithms Compared to Other Techniques for Pipe Optimization. J. Water Resour. Plan. Manag. 1994, 120, 423–443. [Google Scholar] [CrossRef] [Green Version]
- Savic, D.A.; Walters, G.A. Genetic Algorithms for Least-Cost Design of Water Distribution Networks. J. Water Resour. Plan. Manag. 1997, 123, 67–77. [Google Scholar] [CrossRef]
- Deb, K.; Pratap, A.; Agarwal, S.; Meyarivan, T. A Fast and Elitist Multiobjective Genetic Algorithm: NSGA-II. IEEE Trans. Evol. Comput. 2002, 6, 182–197. [Google Scholar] [CrossRef] [Green Version]
- Walski, T.M. Water Distribution Valve Topology for Reliability Analysis. Reliab. Eng. Syst. Saf. 1993, 42, 21–27. [Google Scholar] [CrossRef]
- Wagner, J.M.; Shamir, U.; Marks, D.H. Water Distribution Reliability: Analytical Methods. J. Water Resour. Plan. Manag. 1988, 114, 253–275. [Google Scholar] [CrossRef] [Green Version]
- Ostfeld, A.; Salomons, E. Optimal Layout of Early Warning Detection Stations for Water Distribution Systems Security. J. Water Resour. Plan. Manag. 2004, 130, 377–385. [Google Scholar] [CrossRef]
- Germanopoulos, G. A Technical Note on the Inclusion of Pressure Dependent Demand and Leakage Terms in Water Supply Network Models. Civ. Eng. Syst. 1985, 2, 171–179. [Google Scholar] [CrossRef]
- Fujiwara, O.; Ganesharajah, T. Reliability Assessment of Water Supply Systems with Storage and Distribution Networks. Water Resour. Res. 1993, 29, 2917–2924. [Google Scholar] [CrossRef]
- Prasad, T.D.; Walters, G.A.; Savic, D.A. Booster Disinfection of Water Supply Networks: Multiobjective Approach. J. Water Resour. Plan. Manag. 2004, 130, 367–376. [Google Scholar] [CrossRef]
- Yassin-Kassab, A.; Templeman, A.B.; Tanyimboh, T.T. Calculating Maximum Entropy Flows in Multi-Source, Multi-Demand Networks. Eng. Optim. 1999, 31, 695–729. [Google Scholar] [CrossRef]
- Tanyimboh, T.T.; Templeman, A.B. Optimum Design of Flexible Water Distribution Networks. Civ. Eng. Syst. 1993, 10, 243–258. [Google Scholar] [CrossRef]
- Babayan, A.; Kapelan, Z.; Savic, D.; Walters, G. Least-Cost Design of Water Distribution Networks under Demand Uncertainty. J. Water Resour. Plan. Manag. 2005, 131, 375–382. [Google Scholar] [CrossRef]
- Cunha, M.; Marques, J.; Creaco, E.; Savić, D. A Dynamic Adaptive Approach for Water Distribution Network Design. J. Water Resour. Plan. Manag. 2019, 145, 04019026. [Google Scholar] [CrossRef] [Green Version]
- Tanyimboh, T.T.; Czajkowska, A. Self-Adaptive Solution-Space Reduction Algorithm for Multi-Objective Evolutionary Design Optimization of Water Distribution Networks. Water Resour. Manag. 2018, 32, 3337–3352. [Google Scholar] [CrossRef] [Green Version]
- Balekelayi, N.; Tesfamariam, S. Graph-Theoretic Surrogate Measure to Analyze Reliability of Water Distribution System Using Bayesian Belief Network–Based Data Fusion Technique. J. Water Resour. Plan. Manag. 2019, 145, 04019028. [Google Scholar] [CrossRef]
- Cimorelli, L.; Morlando, F.; Cozzolino, L.; D’Aniello, A.; Pianese, D. Comparison Among Resilience and Entropy Index in the Optimal Rehabilitation of Water Distribution Networks Under Limited-Budgets. Water Resour. Manag. 2018, 32, 3997–4011. [Google Scholar] [CrossRef]
- Piratla, K.R.; Ariaratnam, S.T.; Cohen, A. Estimation of CO2 Emissions from the Life Cycle of a Potable Water Pipeline Project. J. Manag. Eng. 2012, 28, 22–30. [Google Scholar] [CrossRef]
- Shirzad, A.; Tabesh, M.; Atayikia, B. Multiobjective Optimization of Pressure Dependent Dynamic Design for Water Distribution Networks. Water Resour. Manag. 2017, 31, 2561–2578. [Google Scholar] [CrossRef]
- Sirsant, S.; Reddy, M.J. Optimal Design of Pipe Networks Accounting for Future Demands and Phased Expansion Using Integrated Dynamic Programming and Differential Evolution Approach. Water Resour. Manag. 2021, 35, 1231–1250. [Google Scholar] [CrossRef]
- Sirsant, S.; Hamouda, M.A.; Shaaban, M.F.; Al Bardan, M.S. A Chaotic Sobol Sequence-Based Multi-Objective Evolutionary Algorithm for Optimal Design and Expansion of Water Networks. Sustain. Cities Soc. 2022, 87, 104215. [Google Scholar] [CrossRef]
Figure 1.
Classification of reliability assessment approaches.

Figure 2.
Overall methodology.

Figure 3.
Number of articles and number of citations for articles published on the topic of reliability of WDN.
Figure 3.
Number of articles and number of citations for articles published on the topic of reliability of WDN.

Figure 4.
Citation network of articles: the node size represents citation number; the link between different nodes represent the collaboration between them; the distance between nodes represents the association between them in terms of co-citation.
Figure 4.
Citation network of articles: the node size represents citation number; the link between different nodes represent the collaboration between them; the distance between nodes represents the association between them in terms of co-citation.

Figure 5.
A network map of co-authorship for different authors, node size represents the number of publications for each author and the link thickness represents the collaboration extent.
Figure 5.
A network map of co-authorship for different authors, node size represents the number of publications for each author and the link thickness represents the collaboration extent.

Figure 6.
Collaboration network for countries. Node size represents the number of publications and link represents the collaboration among the countries.
Figure 6.
Collaboration network for countries. Node size represents the number of publications and link represents the collaboration among the countries.

Figure 7.
Author co-citation network. These articles have been commonly cited by the original articles. Node size represents the number of articles that have cited the article and links represent that they appear as a common citation in one or more articles.
Figure 7.
Author co-citation network. These articles have been commonly cited by the original articles. Node size represents the number of articles that have cited the article and links represent that they appear as a common citation in one or more articles.

Figure 8.
Clusters based on author keywords. Node size represents the number of occurrences of the keyword and the link between two nodes represent their simultaneous occurrences in articles.
Figure 8.
Clusters based on author keywords. Node size represents the number of occurrences of the keyword and the link between two nodes represent their simultaneous occurrences in articles.

Figure 9.
Author keyword evolution over time. Node size represents the number of occurrences of the keyword and the link between two nodes represent their simultaneous occurrences in articles.
Figure 9.
Author keyword evolution over time. Node size represents the number of occurrences of the keyword and the link between two nodes represent their simultaneous occurrences in articles.

Figure 10.
Thematic map based on author keywords. Node size represents the number of articles on a particular theme.
Figure 10.
Thematic map based on author keywords. Node size represents the number of articles on a particular theme.

Table 1.
Top ten articles with highest number of citations.
| Author, Journal | LC | GC | LC/GC (%) | NLC | NGC |
|---|---|---|---|---|---|
| Todini (2000) [8], Urban Water Journal | 91 | 517 | 17.60 | 5.39 | 5.60 |
| Prasad and Park (2004) [9], Journal of Water Resources Planning and Management | 70 | 432 | 16.20 | 3.37 | 3.42 |
| Tanyimboh and Templeman (2000) [71], Engineering Optimization | 38 | 97 | 39.18 | 2.25 | 1.05 |
| Tanyimboh et al. (2001) [72], Journal of Water Resources Planning and Management | 30 | 129 | 23.26 | 2.45 | 2.08 |
| Farmani et al. (2005) [11], Journal of Water Resources Planning and Management | 29 | 230 | 12.61 | 3.13 | 3.50 |
| Tolson et al. (2004) [73], Journal of Water Resources Planning and Management | 27 | 186 | 14.52 | 1.30 | 1.47 |
| Atkinson et al. (2014) [74], Journal of Water Resources Planning and Management | 23 | 52 | 44.23 | 5.95 | 1.66 |
| Gheisi and Naser (2015) [75], Journal of Water Resources Planning and Management | 20 | 37 | 54.05 | 7.27 | 2.57 |
| Kalungi and Tanyimboh (2003) [76], Reliability Engineering and System Safety | 20 | 91 | 21.98 | 2.14 | 2.27 |
| Giustolisi and Savic (2010) [46], Urban Water Journal | 19 | 105 | 18.10 | 6.91 | 3.98 |
Notes: LC = Local Citations, GC = Global Citations, NLC = Normalized Local Citations, NGC = Normalized Global Citations.
Table 2.
Top ten most influential authors ranked by total number of citations.
| Author Name | h_Index | TC | NP | PY_Start | Institute | Country |
|---|---|---|---|---|---|---|
| Farmani R. | 9 | 779 | 11 | 2005 | University of Exeter | United Kingdom |
| Tanyimboh T.T. | 14 | 646 | 20 | 2000 | University of the Witwatersrand, Johannesburg | South Africa |
| Walters G.A. | 4 | 609 | 4 | 2000 | University of Exeter | United Kingdom |
| Savic D. A. | 5 | 1061 | 9 | 2000 | National University of Malaysia | Malaysia |
| Todini E. | 1 | 517 | 1 | 2000 | University of Bologna | Italy |
| Kapelan Z. | 7 | 464 | 8 | 2005 | Delft University of Technology | Netherlands |
| Jeffrey P. | 4 | 458 | 4 | 2011 | Cranfield University | United Kingdom |
| Yazdani A. | 4 | 458 | 4 | 2011 | Princeton University | United States |
| Park N.S. | 1 | 432 | 1 | 2004 | University of South Florida, Tampa | United States |
| Prasad T.D. | 1 | 432 | 1 | 2004 | Gandhi Institute of Technology and Management | India |
Notes: TC: Total Citations, NP: Number of Publications, PY_start: Publication start year.
Table 3.
Countries collaboration, production, and citation data.
| Cluster | Country | NP | TC | TNP | TTC |
|---|---|---|---|---|---|
| 1 | United States | 93 | 791 | 273 | 1955 |
| Iran | 76 | 613 | |||
| Canada | 39 | 207 | |||
| Korea | 62 | 344 | |||
| Qatar | 3 | 0 | |||
| 2 | United Kingdom | 84 | 2850 | 254 | 4738 |
| Italy | 57 | 1410 | |||
| South Africa | 13 | 56 | |||
| Portugal | 7 | 16 | |||
| China | 76 | 406 | |||
| France | 9 | 0 | |||
| Norway | 8 | 0 | |||
| 3 | India | 34 | 144 | 53 | 239 |
| Australia | 19 | 95 | |||
| 4 | Poland | 26 | 159 | 49 | 476 |
| Israel | 15 | 290 | |||
| Czech Republic | 8 | 27 | |||
| 5 | Germany | 11 | 30 | 31 | 295 |
| Spain | 20 | 265 |
Notes: NP: Number of Publications, TC: Total Citations, TNP: Total Number of Publications for the cluster, TTC: Total Number of Citations for the cluster.
Table 4.
Top ten most cited journals.
| Element | TC | TP | CPP | PY_Start |
|---|---|---|---|---|
| Journal of Water Resources Planning and Management | 2608 | 68 | 38.35 | 2001 |
| Urban Water Journal | 1032 | 20 | 51.6 | 2000 |
| Water Resources Management | 710 | 36 | 19.72 | 2008 |
| Engineering Optimization | 472 | 11 | 42.91 | 2000 |
| Reliability Engineering and System Safety | 377 | 11 | 34.27 | 2003 |
| Journal of Hydroinformatics | 313 | 10 | 31.30 | 2006 |
| Water Resources Research | 298 | 7 | 42.57 | 2011 |
| Environmental Modelling and Software | 218 | 4 | 54.50 | 2009 |
| Journal of Hydraulic Engineering | 207 | 4 | 51.75 | 2007 |
| Water (Switzerland) | 182 | 15 | 12.13333 | 2013 |
Notes: TC: Total citation, TP: Total publication, CPP: Citation per publication, PY_start: Publication start year.
Table 6.
Frequently used author keywords.
| Category | Keyword(s) | Occurrence | Total | Category | Keyword(s) | Occurrence | Total |
|---|---|---|---|---|---|---|---|
| Water Distribution Network | water supply | 11 | 228 | Genetic algorithm | genetic algorithm | 15 | 23 |
| water supply network | 8 | genetic algorithms | 8 | ||||
| WDN | 5 | Hydraulic analysis | hydraulic analysis | 9 | 18 | ||
| water distribution | 18 | network analysis | 9 | ||||
| water distribution network | 44 | Others | resilience | 14 | |||
| water distribution networks | 48 | uncertainty | 14 | ||||
| water distribution system | 38 | water quality | 14 | ||||
| water distribution systems | 56 | entropy | 11 | ||||
| pipe networks | 7 | EPANET | 9 | ||||
| networks | 6 | hydraulic reliability | 9 | ||||
| Reliability assessment and analysis | reliability | 76 | 116 | design | 8 | ||
| reliability analysis | 9 | vulnerability | 8 | ||||
| reliability assessment | 9 | graph theory | 7 | ||||
| network reliability | 9 | redundancy | 6 | ||||
| system reliability | 13 | rehabilitation | 6 | ||||
| Multi-objective optimization | multi-objective | 6 | 21 | algorithms | 6 | ||
| multi-objective optimization | 10 | calibration | 5 | ||||
| Multi-objective optimization | 5 | demand-driven analysis | 5 | ||||
| Optimization | optimization | 5 | 48 | MATLAB | 5 | ||
| optimization | 43 | mechanical reliability | 5 | ||||
| operation | 5 |
Disclaimer/Publisher’s Note: The statements, opinions and data contained in all publications are solely those of the individual author(s) and contributor(s) and not of MDPI and/or the editor(s). MDPI and/or the editor(s) disclaim responsibility for any injury to people or property resulting from any ideas, methods, instructions or products referred to in the content. |
© 2023 by the authors. Licensee MDPI, Basel, Switzerland. This article is an open access article distributed under the terms and conditions of the Creative Commons Attribution (CC BY) license (https://creativecommons.org/licenses/by/4.0/).
Share and Cite
MDPI and ACS Style
Sirsant, S.; Hamouda, M.A.; Shaaban, M.F. Advances in Assessing the Reliability of Water Distribution Networks: A Bibliometric Analysis and Scoping Review. Water 2023, 15, 986. https://doi.org/10.3390/w15050986
AMA Style
Sirsant S, Hamouda MA, Shaaban MF. Advances in Assessing the Reliability of Water Distribution Networks: A Bibliometric Analysis and Scoping Review. Water. 2023; 15(5):986. https://doi.org/10.3390/w15050986
Chicago/Turabian StyleSirsant, Swati, Mohamed A. Hamouda, and Mostafa F. Shaaban. 2023. "Advances in Assessing the Reliability of Water Distribution Networks: A Bibliometric Analysis and Scoping Review" Water 15, no. 5: 986. https://doi.org/10.3390/w15050986
Note that from the first issue of 2016, this journal uses article numbers instead of page numbers. See further details here.