Article

Impact of a Sand Filtration Pretreatment Step on High-Loaded Greywater Treatment by an Electrocoagulation Technique

by
Khalid Bani-Melhem
1,2,*,
Abeer Al Bsoul
3,*,
Zakaria Al-Qodah
4,
Nada Al-Ananzeh
3,
Muhammad Rasool Al-Kilani
5,
Mohammad Al-Shannag
6 and
Walid Bani-Salameh
7
1
Water Technology Unit (WTU), Center for Advanced Materials (CAM), Qatar University, Doha P.O. Box 2713, Qatar
2
Department of Water Management, and Environment, Faculty of Prince El-Hassan bin Talal for Natural Resources and Environment, The Hashemite University, P.O. Box 330127, Zarqa 13133, Jordan
3
Department of Chemical Engineering, Al-Huson University College, Al-Balqa Applied University, Al-Huson P.O. Box 50, Al-Huson 21510, Jordan
4
Chemical Engineering Department, Faculty of Engineering Technology, Al-Balqa Applied University, Marka, P.O. Box 340558, Amman 11134, Jordan
5
Department of Land, Water, and Environment, Faculty of Agriculture, University of Jordan, Amman 11942, Jordan
6
Department of Chemical Engineering, School of Engineering, University of Jordan, Amman 11942, Jordan
7
Department of Chemical Engineering, Al-Balqa Applied University, Marka, P.O. Box 15008, Amman 11134, Jordan
*
Authors to whom correspondence should be addressed.
Water 2023, 15(5), 990; https://doi.org/10.3390/w15050990
Submission received: 8 February 2023 / Revised: 24 February 2023 / Accepted: 2 March 2023 / Published: 5 March 2023
(This article belongs to the Special Issue Water and Wastewater Treatment: Latest Advances and Prospects)

Abstract

:
Greywater (GW) treatment by the electrocoagulation (EC) technique alone might not meet the required standards in terms of pollutant removal, specifically when GW contains high loads of pollutants. In this preliminary study, a sand filtration (SF) unit was integrated with the EC technique as a pretreatment step to enhance the EC process for treating high-loaded GW. Three different voltage gradients were investigated (5 V/cm, 10 V/cm, and 15 V/cm) in the EC unit. The results demonstrated that the pretreatment SF step can contribute significantly to reducing pollutant concentrations in the greywater to be treated by EC. In terms of physical impurities, the results showed that the SF pretreatment step reduced the turbidity and the color of the treated GW by 28.4%, and 9.4%, respectively. The COD concentration was reduced by 25.5% by the SF step, which allowed a reduction of EC steady state time in the EC unit from 45 min to 30 min at an applied voltage of 15 V/cm. In addition, a high COD removal rate of 87.8% from high-load greywater was achieved with an energy consumption of only 4.11 kWh/m3 in comparison with 6.21 kWh/m3 without the SF step, which is equivalent to a 34% saving in energy consumption.

1. Introduction

Water resources are increasingly under pressure from economic activity and population growth. Therefore, wastewater reusability is becoming technologically and economically justified as a non-conventional water resource in most countries, specifically in regions where water shortages are a serious problem [1]. In this domain, wastewater generated from households (domestic wastewater) can be a good alternative for wastewater reclamation and reuse.
However, domestic wastewater is classified into two groups: blackwater and greywater. Blackwater contains the discharges from toilets that contain high levels of nitrogen, phosphorous, hormones, pathogens, and pharmaceutical residues [2]. This means that blackwater seems to be more difficult to be recycled in comparison with greywater, which is generated from showers, bathtubs, hand basins, laundries, washing machines, and kitchen sinks. Furthermore, greywater can be further classified into light greywater and dark greywater. Light greywater is generated from bathrooms, showers, and basins, while dark greywater contains more contaminated waste from laundry facilities, dishwashers, and kitchen sinks [2]. Therefore, light greywater comprises less pollutant loads, so it seems to be the easiest wastewater to recycle [2]. The treated greywater (GW) can be reused for non-potable applications, such as flushing of toilets, irrigation, and washing, which allows saving up to 75% of household water consumption [3].
Although GW presents a lower sanitary hazard than black wastewater, it still needs some kind of treatment that make it acceptable for reuse applications [4]. Wide ranges of treatment technologies have been applied to GW treatment, including physical [5], chemical [6,7,8], and biological [9,10,11] treatment processes, or sometimes a combination of two or more technologies [4,12].
Among the different treatment processes, electrocoagulation (EC) has been proven as an efficient method for the treatment of different types of wastewater, including GW [13,14,15,16]. In addition, EC produces less sludge in comparison with chemical coagulation, since no addition of chemicals is required because metallic electrodes are used as the coagulants [17,18,19,20]. Furthermore, the scrap metals can serve as electrodes in the EC process, which classifies this technique as an environmentally friendly green process [21].
Many researchers have tested the application of EC to greywater treatment. However, the GW treated by the EC technique alone might not meet the required standards in terms of pollutant removal, especially when the applications of EC on greywater deal with high loads of pollutants [7]; that scenario requires integration of the EC technique with other treatment methods to enhance the overall treatment process [12,22,23]. Additionally, the consumption of electric energy in EC units can be addressed as a negative concern for using the EC technique in wastewater treatment, specifically if the process is operated at high levels of applied current densities [23]. Therefore, integrating EC into other treatment technologies has become an attractive approach in the last few years, and many researchers worldwide have improved the overall treatment process and reduced the energy consumption [24]. Generally, it was reported that the removal efficiency of any process combined with EC is higher than that of any single treatment process [23]. In conclusion, the use of a post- or pretreatment process with EC will enhance its performance in terms of the effluent quality of the treated wastewater.
Despite the impressive amount of scientific research on the processes integrated with EC, it was noticed that most of the integrated processes were always integrated after the EC step, with some exceptions where, in some cases, chemical coagulation was used as a pretreatment step before the EC process [23]. Generally, combining a post-treatment process with EC may increase the quality of the wastewater treated by EC, but it will not affect the energy consumption in the EC reactor, such as in the case of an enhancement process added after the EC reactor. Therefore, this research aimed to extend the principle of integrating EC with other treatment processes. Specifically, the main objective of this research was to integrate the sand filtration (SF) process before the EC step, which could improve the overall treatment and permit the use of low current densities and/or reduce the EC time in the EC reactor, leading to reduced consumption of electrical energy.
From a technical point of view, sand filtration is a physical treatment process, which has been conducted by many researchers as a sole treatment process with great potential for greywater treatment [25,26,27,28]. However, a large area for treatment may be required for SF treatment. Furthermore, the effluent from SF treatment might need a disinfection process. On the other hand, the EC process does not require a large area for treatment, unlike the use of sand filtration technology.
Therefore, this study sought to integrate an SF unit into the EC process as a pretreatment step that could lead to a reduction in the land required for SF treatment and in the energy consumed by the EC units, thus leading to reduced overall cost.

2. Materials and Methods

2.1. EC Electrodes

In this study, the EC process utilized aluminum (Al) as the sacrificial electrode in the EC reactor. Theoretically, when aluminum is used as an electrode, the following chemical reactions take place accordingly [29]:
At the anode:
    Al ( s )   Al ( aq ) + 3 + 3 e
At the cathode:
        2 H 2 O + 2 e   2 OH + H 2
In the solution:
          Al ( aq ) + 3 + 6 H 2 O   Al ( OH ) 3 ( s ) + 3 H 3 O +
  Al ( OH ) 3 ( s ) + OH   Al ( OH ) 4
The produced aluminum hydroxide serves as a coagulant material which has the characteristic of sweep flocs with a large surface area that is beneficial for the rapid adsorption of pollutants in the EC reactor [4].

2.2. Greywater Selection and Characteristics

Real greywater was used in this study. The greywater samples with relatively high loads of COD were collected from different locations in the Faculty of Natural Resources and Environment at the Hashemite University, Jordan. Specifically, the samples were collected from the bathroom sinks of male and female students, the water sink in the water quality lab, floor mopping, and male students’ ablution water. The greywater samples were filtered using a pre-filtration grid to remove large particles and most of the suspended solids before being used for the subsequent study. To ensure consistency with the initial concentrations of the raw greywater, all of the collected samples were mixed in one container to produce 40 L of the mixed sample, which was stored at 4 °C. Then the experiments were conducted and analyzed within 48 h. The average values of the physicochemical parameters of the greywater obtained at the beginning of the experiments are shown in Table 1

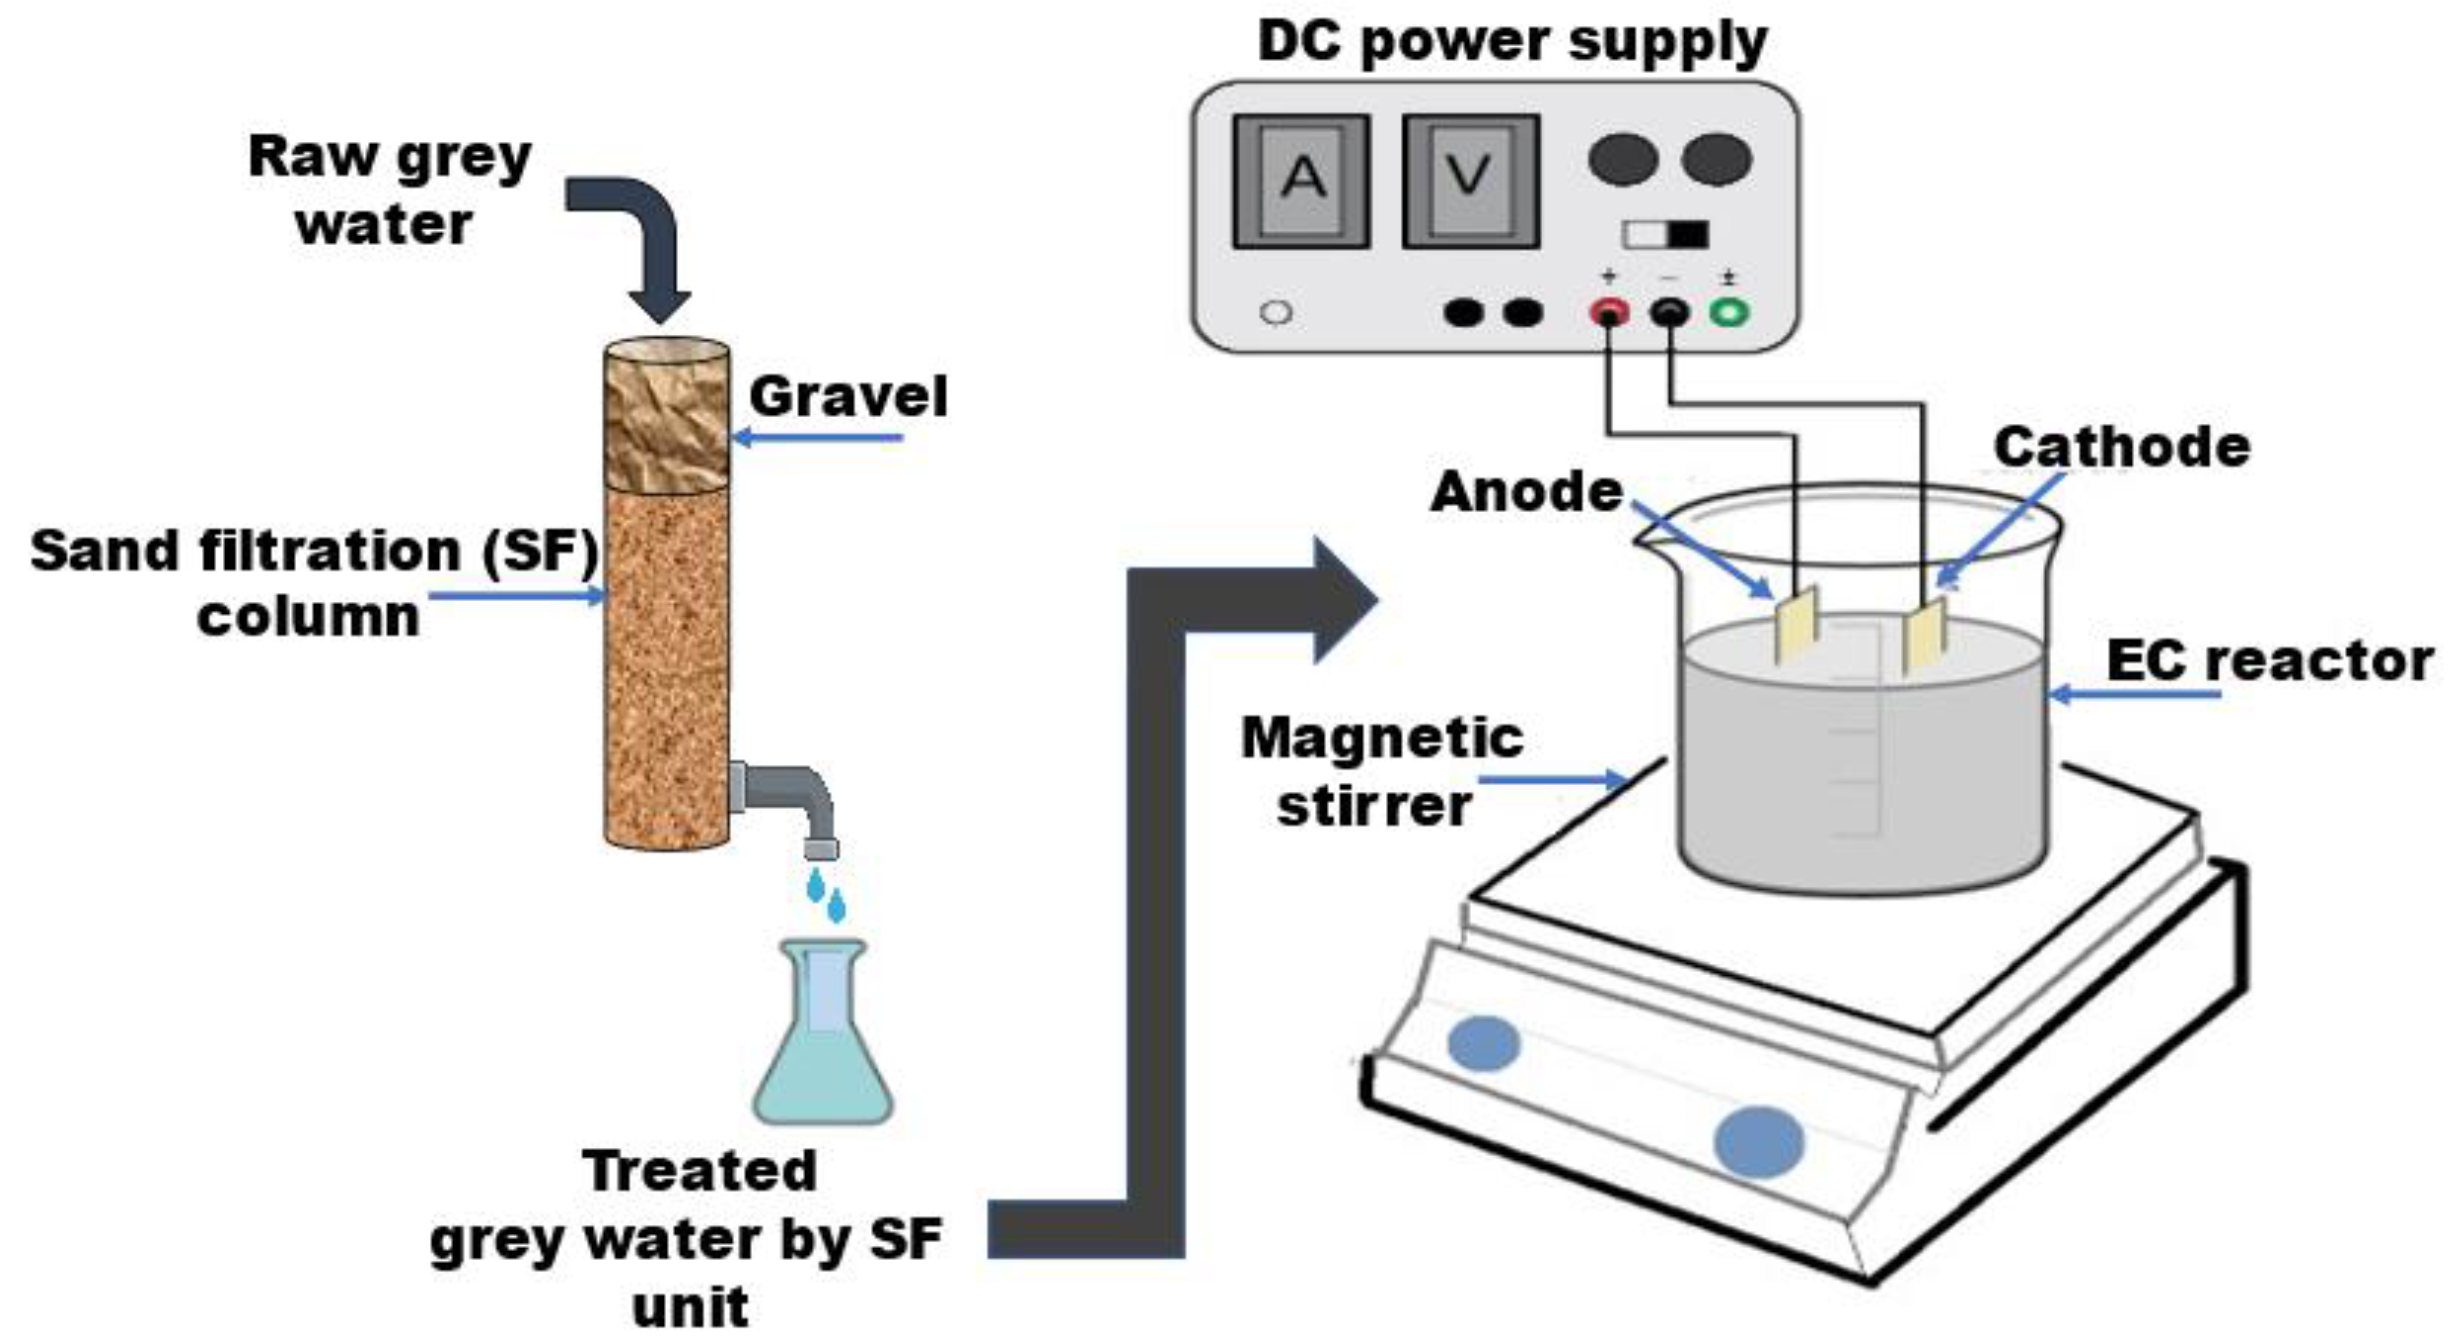
2.3. Experimental Setup and Operating Conditions

The experimental setup used in this study is shown in Figure 1. The setup consisted mainly of two integrated units: electrocoagulation (EC) reactor, and a sand filtration (SF) unit. The EC experiments were performed in a batch-scale unit of 300 mL, which served as an EC reactor in which 250 mL of greywater was treated in each experimental run. The EC unit was placed over a magnetic stirrer (Velp Scientifica, Usmate Velate, Italy), and a constant stirring speed was maintained at around 200 rpm. Two flat-plate parallel electrodes were submerged vertically in the greywater solution. The electrodes in the EC unit were made from an aluminum sheet with a total surface area of around 17.17 cm2 (10.1 cm × 1.7 cm) and an effective surface area of nearly 14.45 cm2 (8.5 cm × 1.7 cm). The space between the electrodes was fixed at 1 cm. The electrodes were connected to an external direct current (DC) power supply, which allowed the application of direct current and voltage ranges of 0–3 A and 0–30 V, respectively. Three different voltage gradients were investigated (5 V/cm, 10 V/cm, and 15 V/cm) in the EC reactor.
Between every two experiments, the electrodes were immersed in a diluted hydrochloric acid solution for two hours and then rinsed with distilled water. For each voltage gradient, the greywater samples were treated with and without sand filtration pre-step. A sand filtration column was used before the electrocoagulation reactor in order to reduce the proportion of contaminants entering the EC reactor. All of the conducted experiments were monitored during 60 min of EC time.
The sand filter column with a diameter of 5 cm and height of 15 cm used in the pretreatment step was made from glass and consisted of two layers; the upper layer was 5 cm high. It was filled with gravel sand with an effective diameter of 8.5 mm, while the lower layer consisted of silica with an effective diameter of 1.2 mm. Fresh gravel sand and silica were used for each conducted experiment to exclude the impact of the used sands in the previous experiment on the results of the subsequent experiment. Before starting each experiment, all gravel and sand materials were washed with distilled water to remove impurities and air-dried before being filled in the column. Furthermore, each experiment was conducted three times.

2.4. Analytical Methods

The performance of the SF unit, EC reactor, and the SF–EC process was monitored by analyzing both initial and final samples for COD, color, turbidity, TSS, TDS, pH, temperature, and conductivity. The total COD, color, and turbidity were analyzed by an MD600 photometer (Lovibond, Germany). The SensoDirect 150 m (Lovibond, Germany) was used to measure TDS. The temperature, pH, and electrical conductivity were also monitored, using a pH-electrical conductivity meter (Hanna HI 5521, Carrollton, Texas, USA) that was calibrated prior to usage. All samples in this study were analyzed in triplicate unless otherwise stated, and the reported results of this study present the average values.

2.5. Calculations

The reduction levels in COD, color, and turbidity concentrations achieved by the sand filter column and EC reactor were determined by calculating the percent removal (R %) as:
  R   % = 100 × C 0 C C 0
where C0 and C are pollutant concentrations (COD (mg/L), turbidity (FTU), or color (Pt-Co)) before and after both the SF unit and EC reactor treatments, respectively.
The performance of the EC technique for GW treatment in terms of energy consumption (E) can be calculated using [21]:
        E = U   ×   I   ×   t 1000   v
where E is the energy consumption (kWh/m3), U is the voltage (volt), I is the applied current in amperes (A), t is the EC time (h), and v is the volume of treated GW sample (m3).
On the other hand, the amount of dissolved anode can be approximated from Faraday’s law:
  m = I   ×   t   ×   M w ZF
where m is the amount of dissolved anode (g), I is the applied current (A), Mw is the molecular weight of electrode material (g/mole), Z is the valence of the electrode material, F is the Faraday constant (96,486 C/mol).

3. Results and Discussion

3.1. Greywater Characteristics
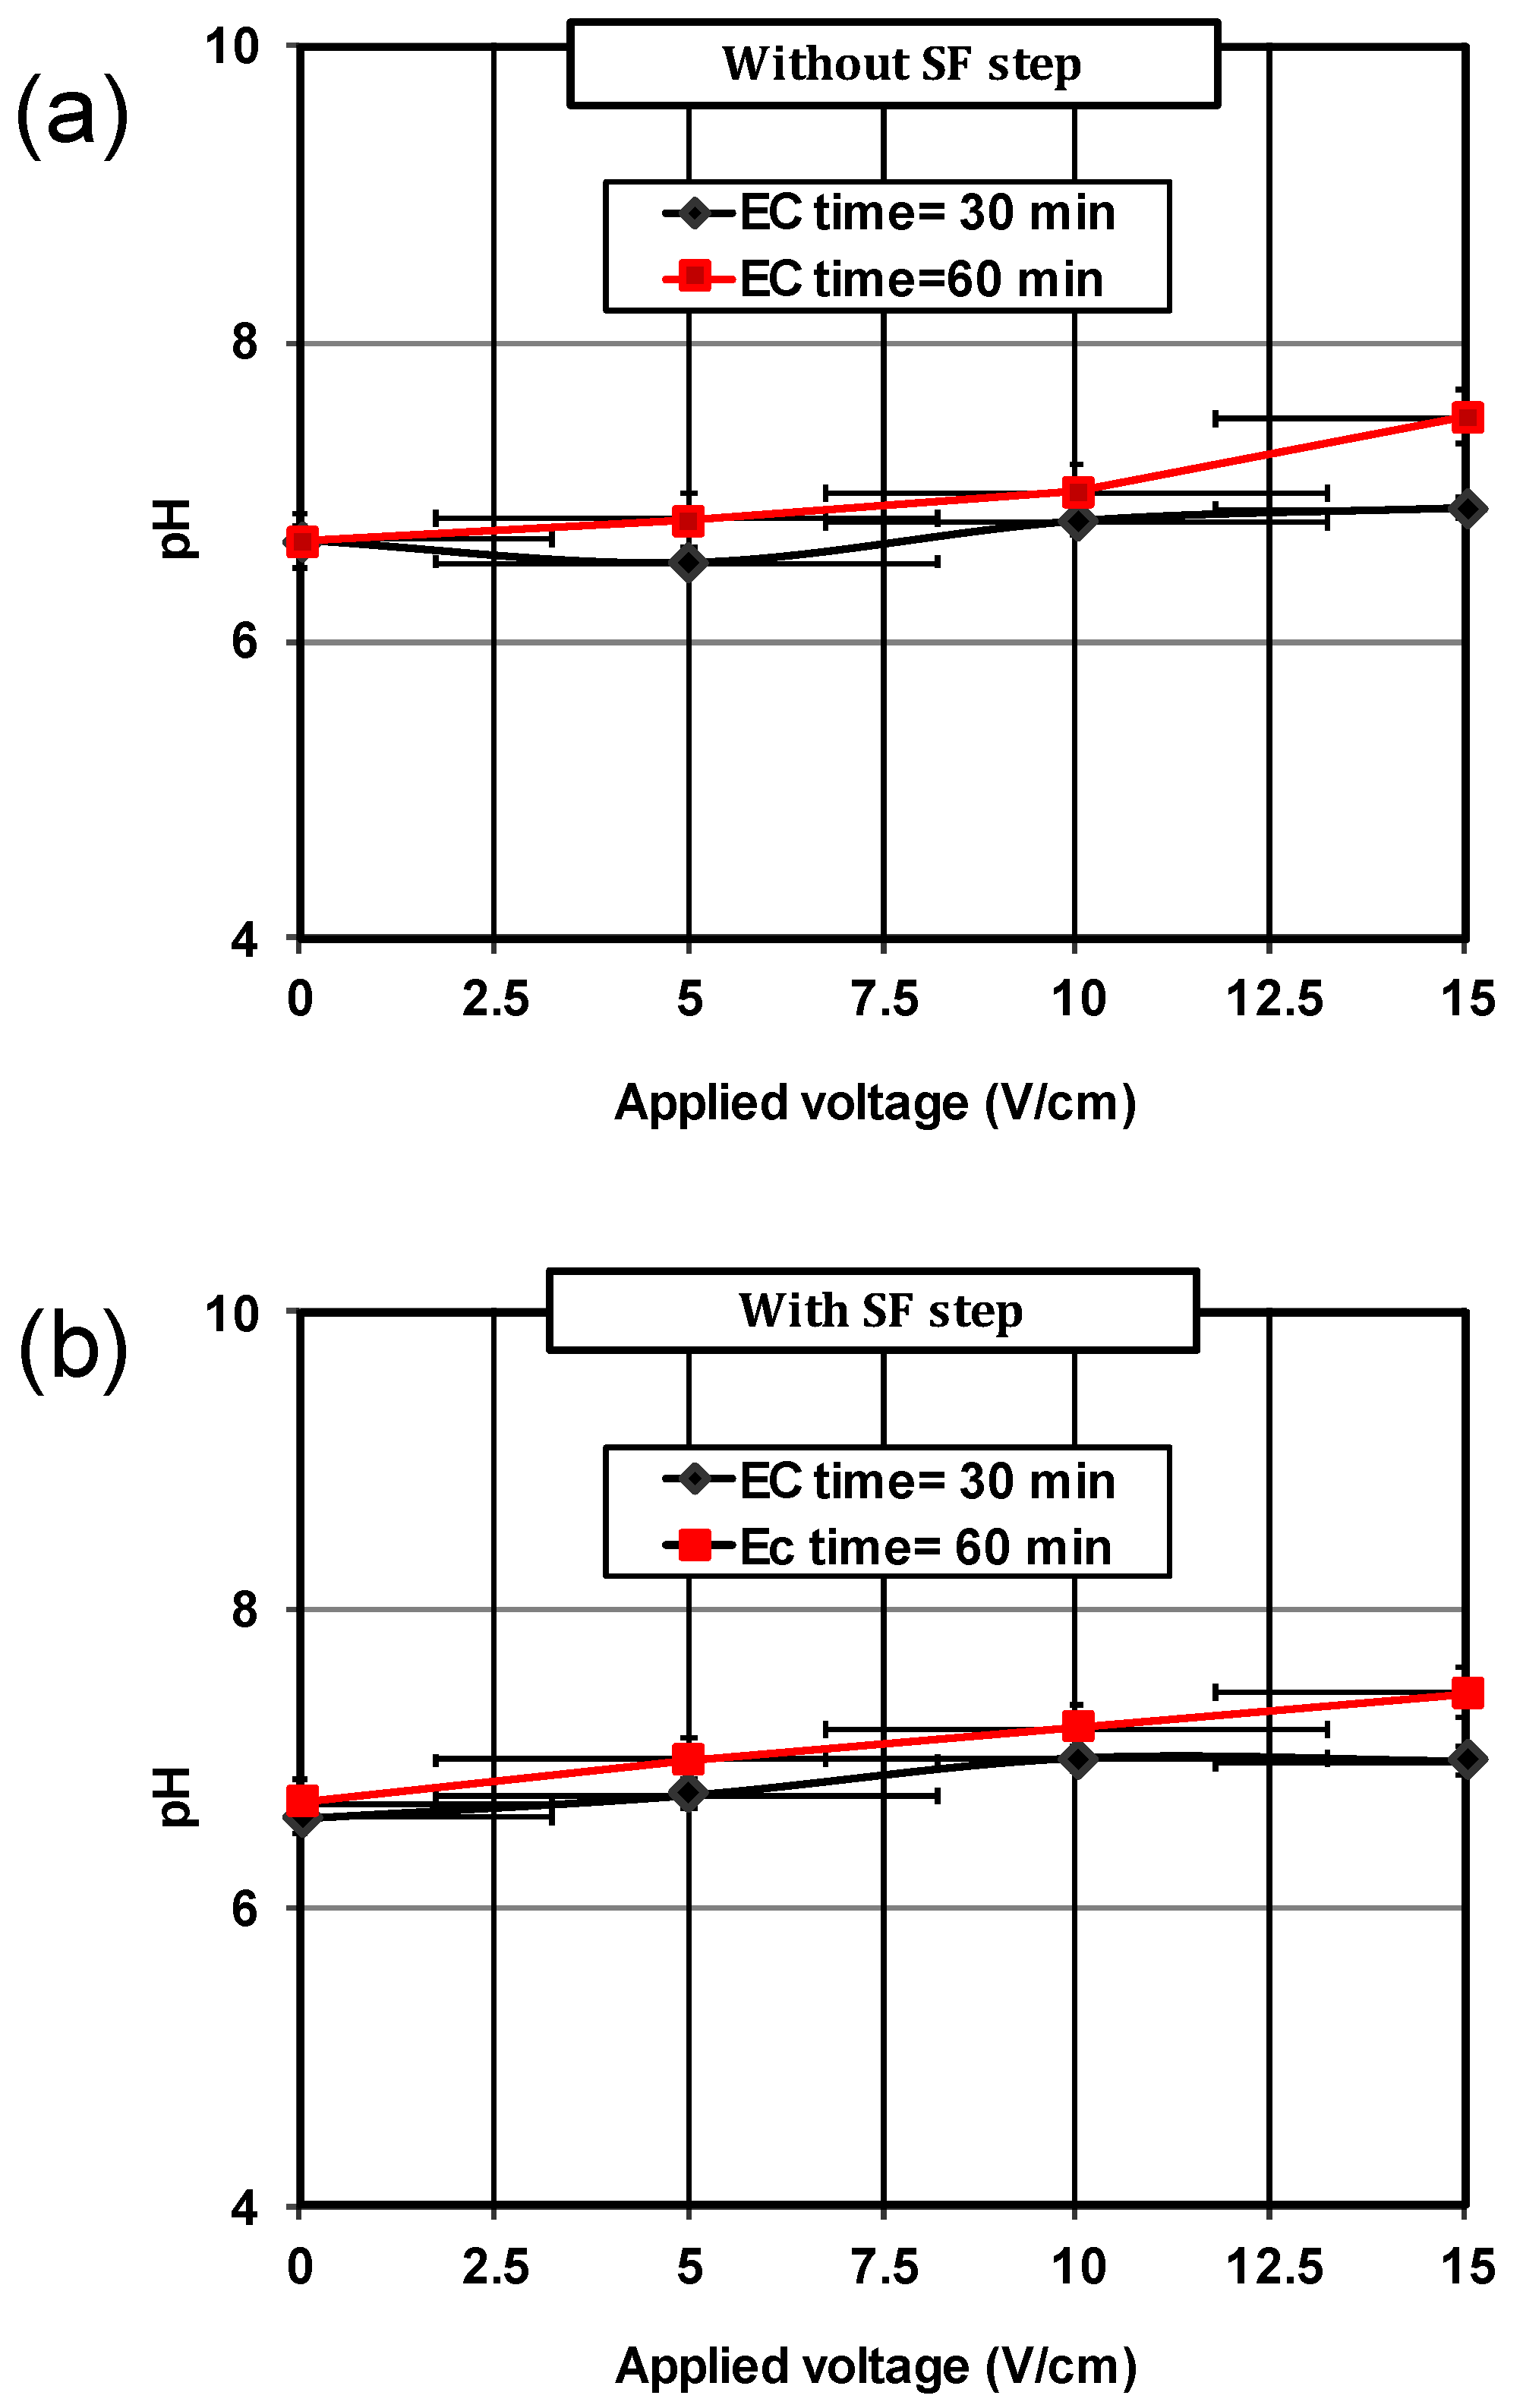
It is well known that the characteristics of greywater depend on the human activities at the source on the day the samples are collected. Therefore, the characteristics of the raw greywater solution used in the experiments conducted in this study (Table 1) presented average values for the physicochemical parameters of the greywater obtained at the beginning of the experiments. Analysis of the greywater characteristics did not demonstrate high variation in their characteristics. The pH values ranged from 6.4 to 7.6, with an average value of 6.59 ± 0.14. The concentration of total suspended solids (TSS) might be due to the fine particles of sand and clay in the collected samples, which were not removed by a pre-filtration grid. As for COD, the average concentration was around 1102 ± 5 mg/L. The average concentrations of color and turbidity were around 662 ± 20 Pt-Co, and 313.3 ± 1.5 FTU, respectively. These concentrations enabled us to classify the raw sample as highly loaded greywater [30]. Table 2 shows the characteristics of the raw greywater generated elsewhere in Jordan for comparison.

3.2. Changes in pH

Because the pH parameter is considered an important factor that could affect the removal performance in the EC process [29], the changes in pH solution were monitored during the EC time at 30 min, and 60 min in all the conducted experiments. Figure 2 shows the evolution in pH for 30, and 60 min of EC time for the conducted applied voltage gradients. An increase in pH solution was observed with increasing the EC time, and the applied voltage gradient, the most significant increase was observed at 15 V/cm because of the increase in releasing of hydroxide ions (OH-) from the cathode to the solution according to the chemical reaction presented in Equation (2). However, the pH values of the solution did not show significant variation for all applied voltages. The maximum change was observed at 15 V/cm when the solution pH increased from 6.67 to 7.5 and from 6.71 to 7.44 when the treatment was without, and with sand filtration step (Figure 2), respectively, during 60 min of EC time. Accordingly, the change in pH solution could not be considered a major factor that can affect the performance of EC treatment in this study, and the changes in removals of the proposed parameters (COD, Turbidity, color) can be attributed to the changes in electrochemical reactions resulted from the applied voltage gradients.

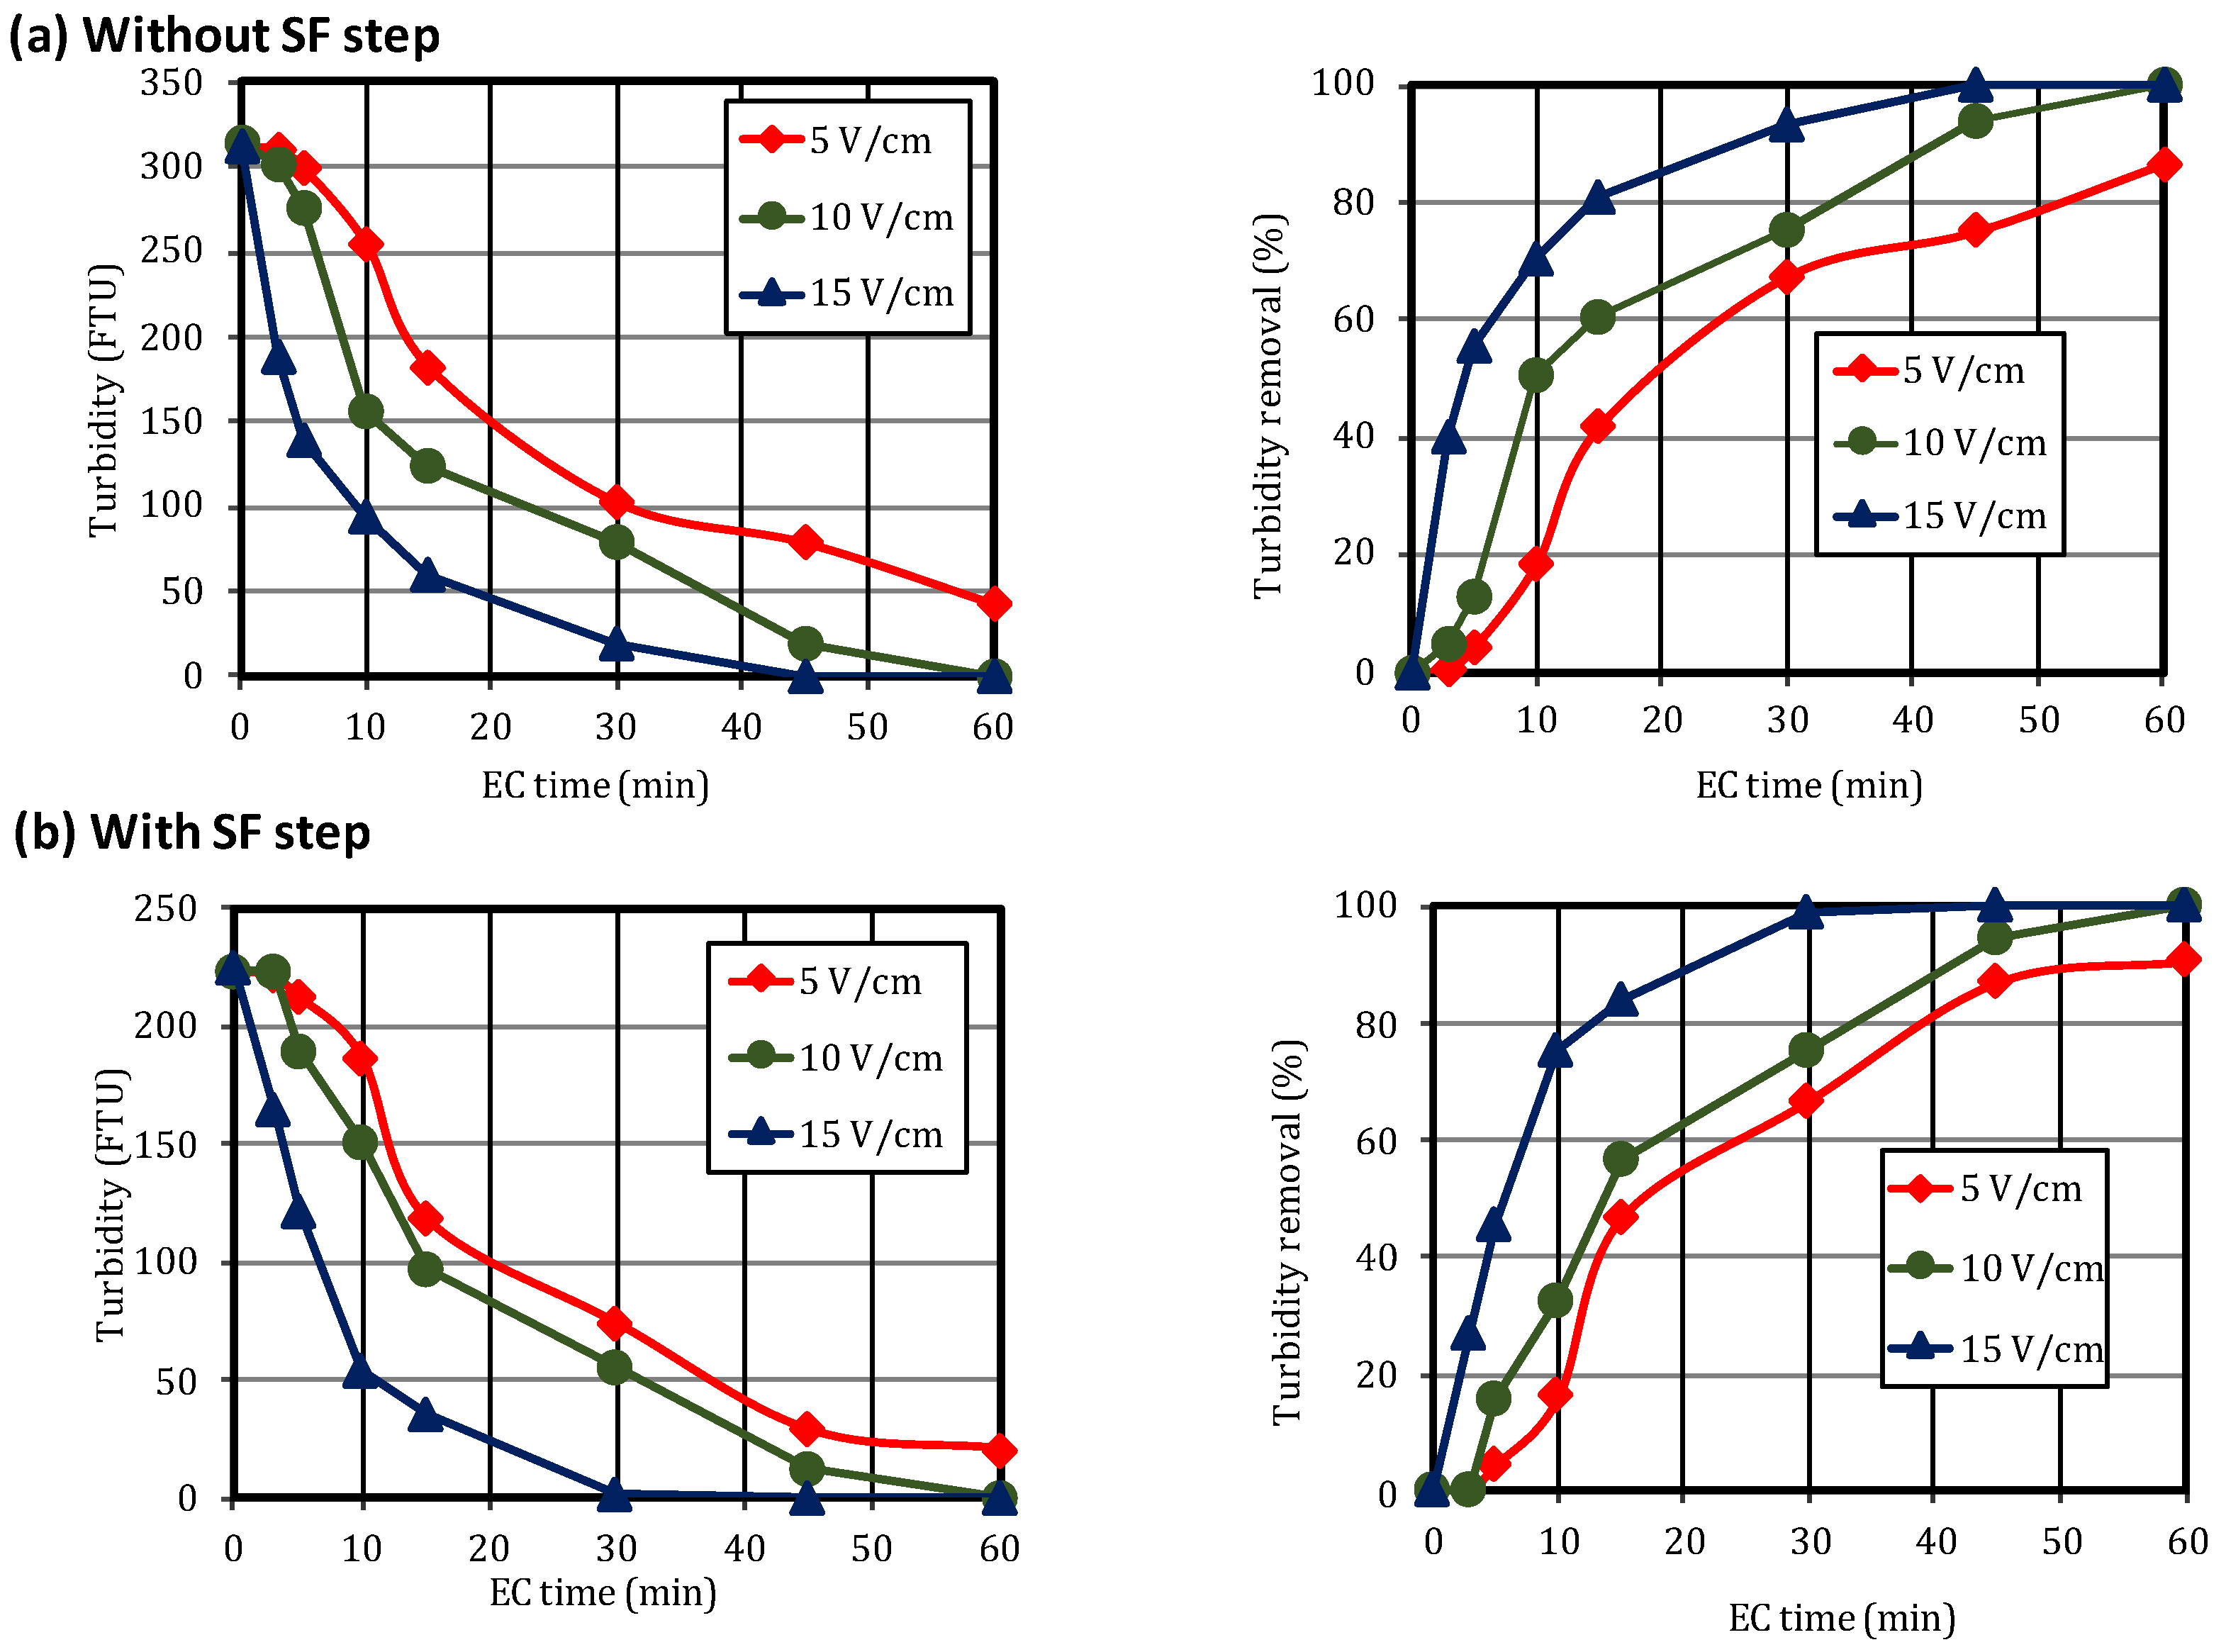
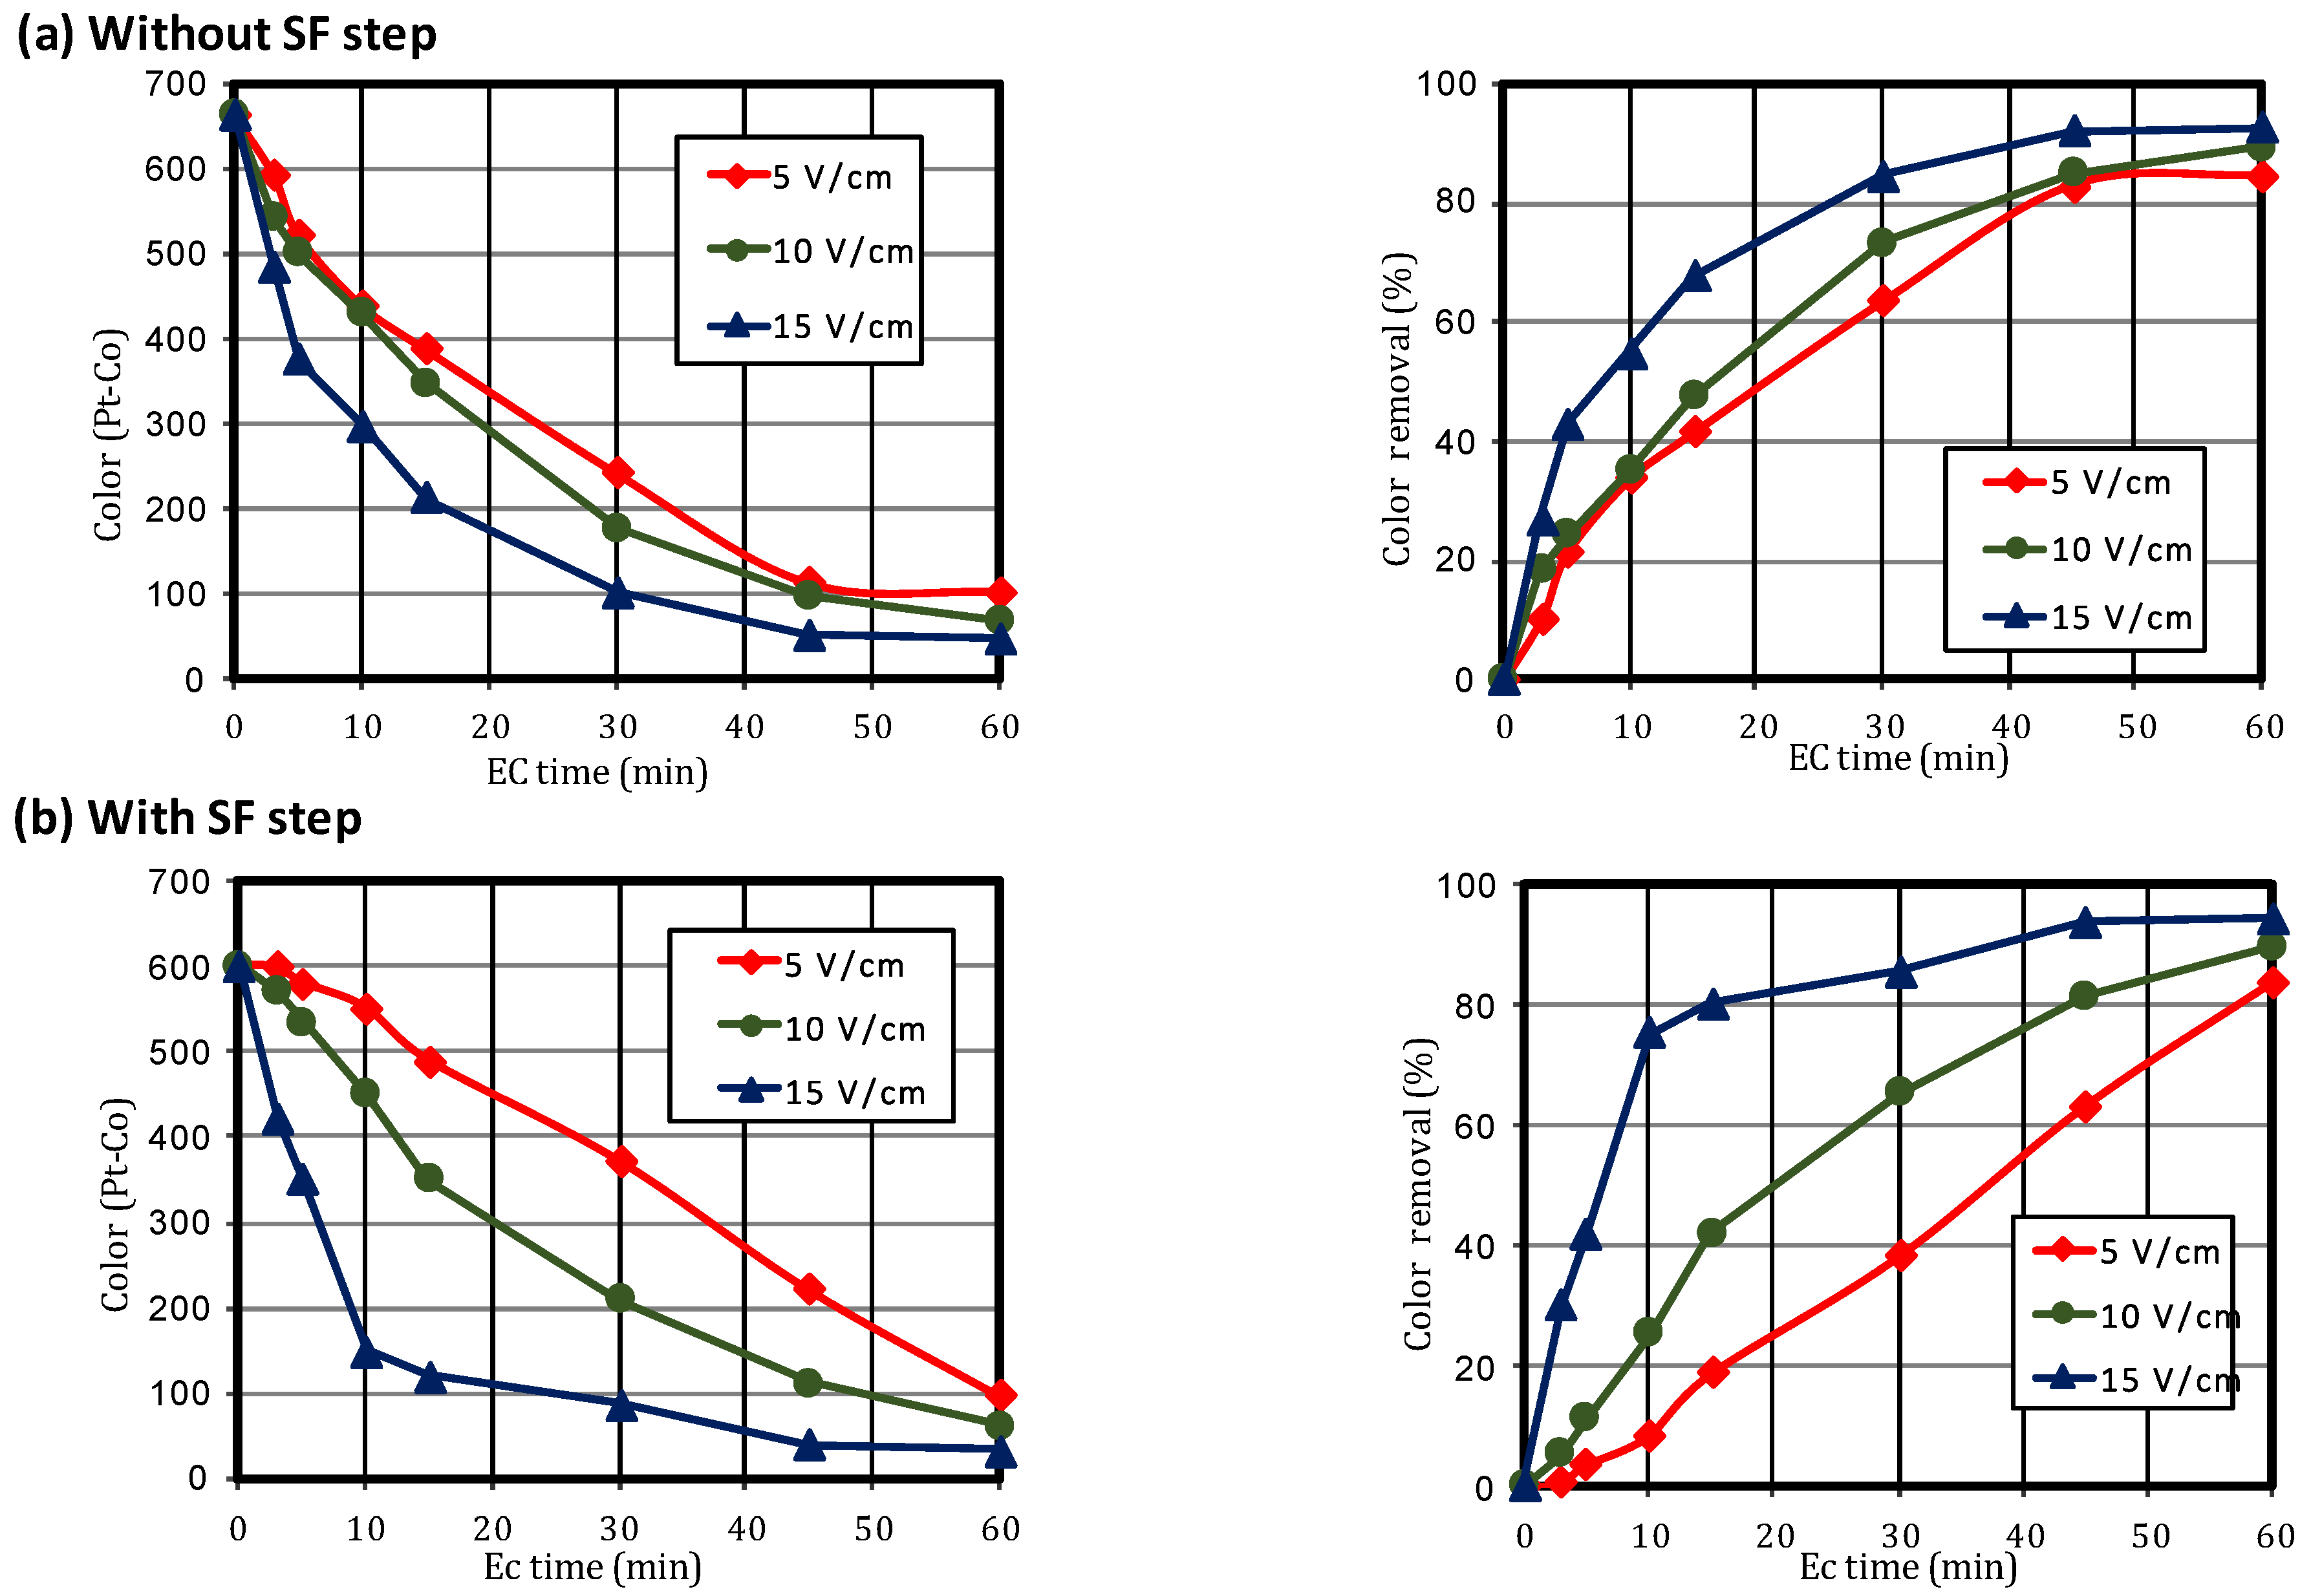
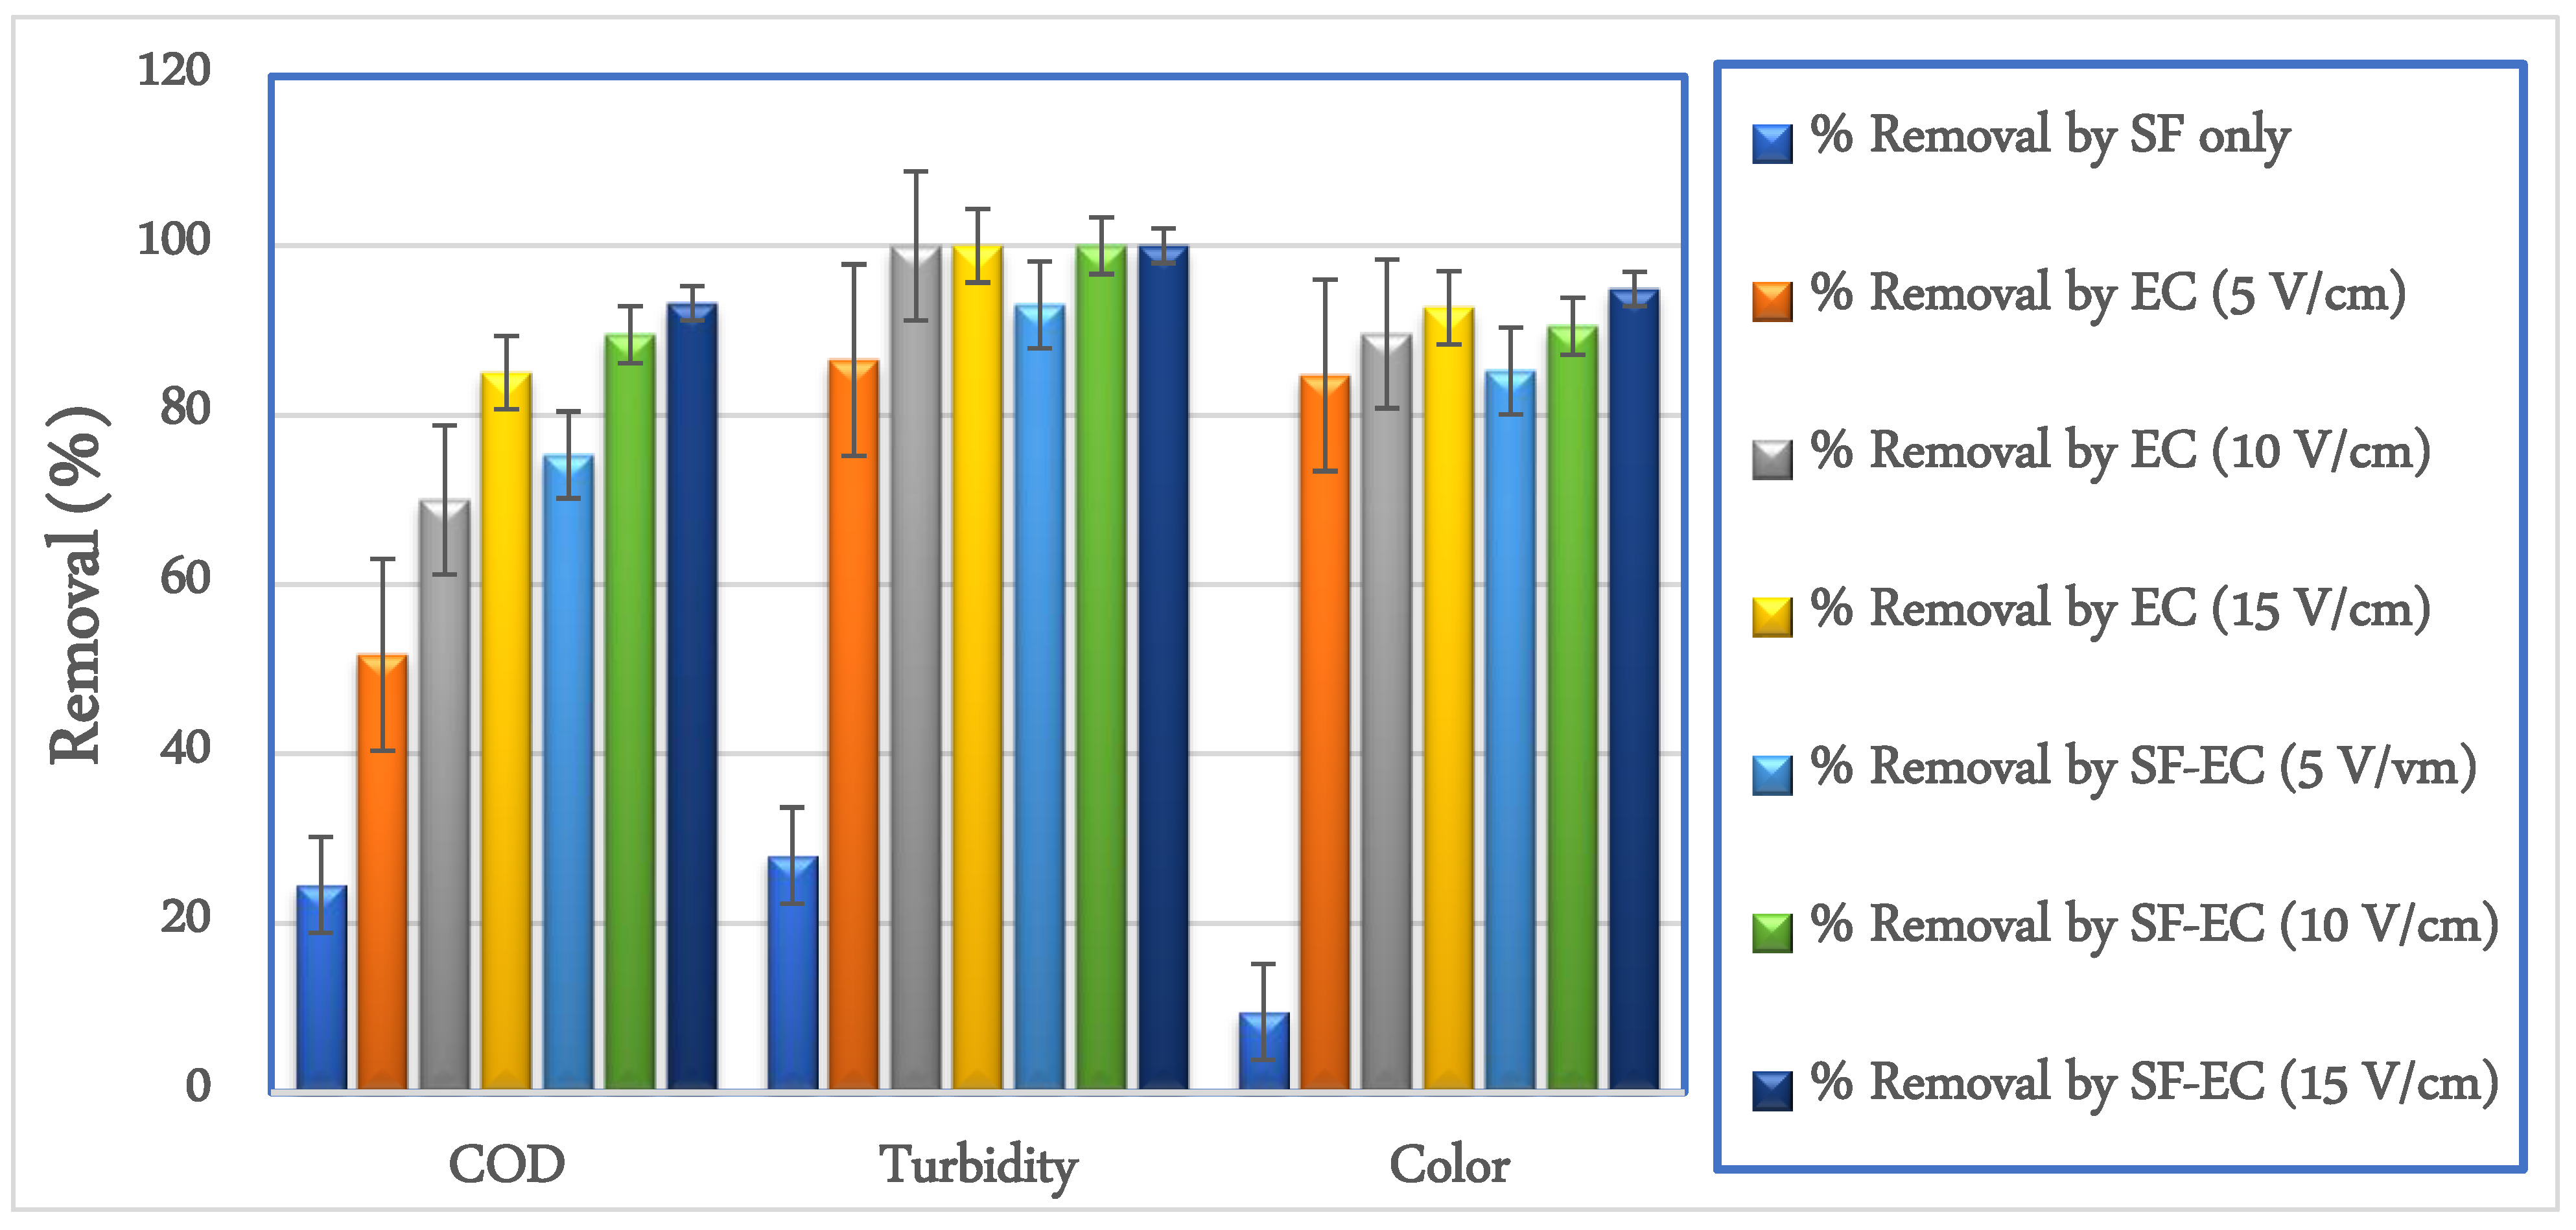
3.3. Turbidity, and Color Removals
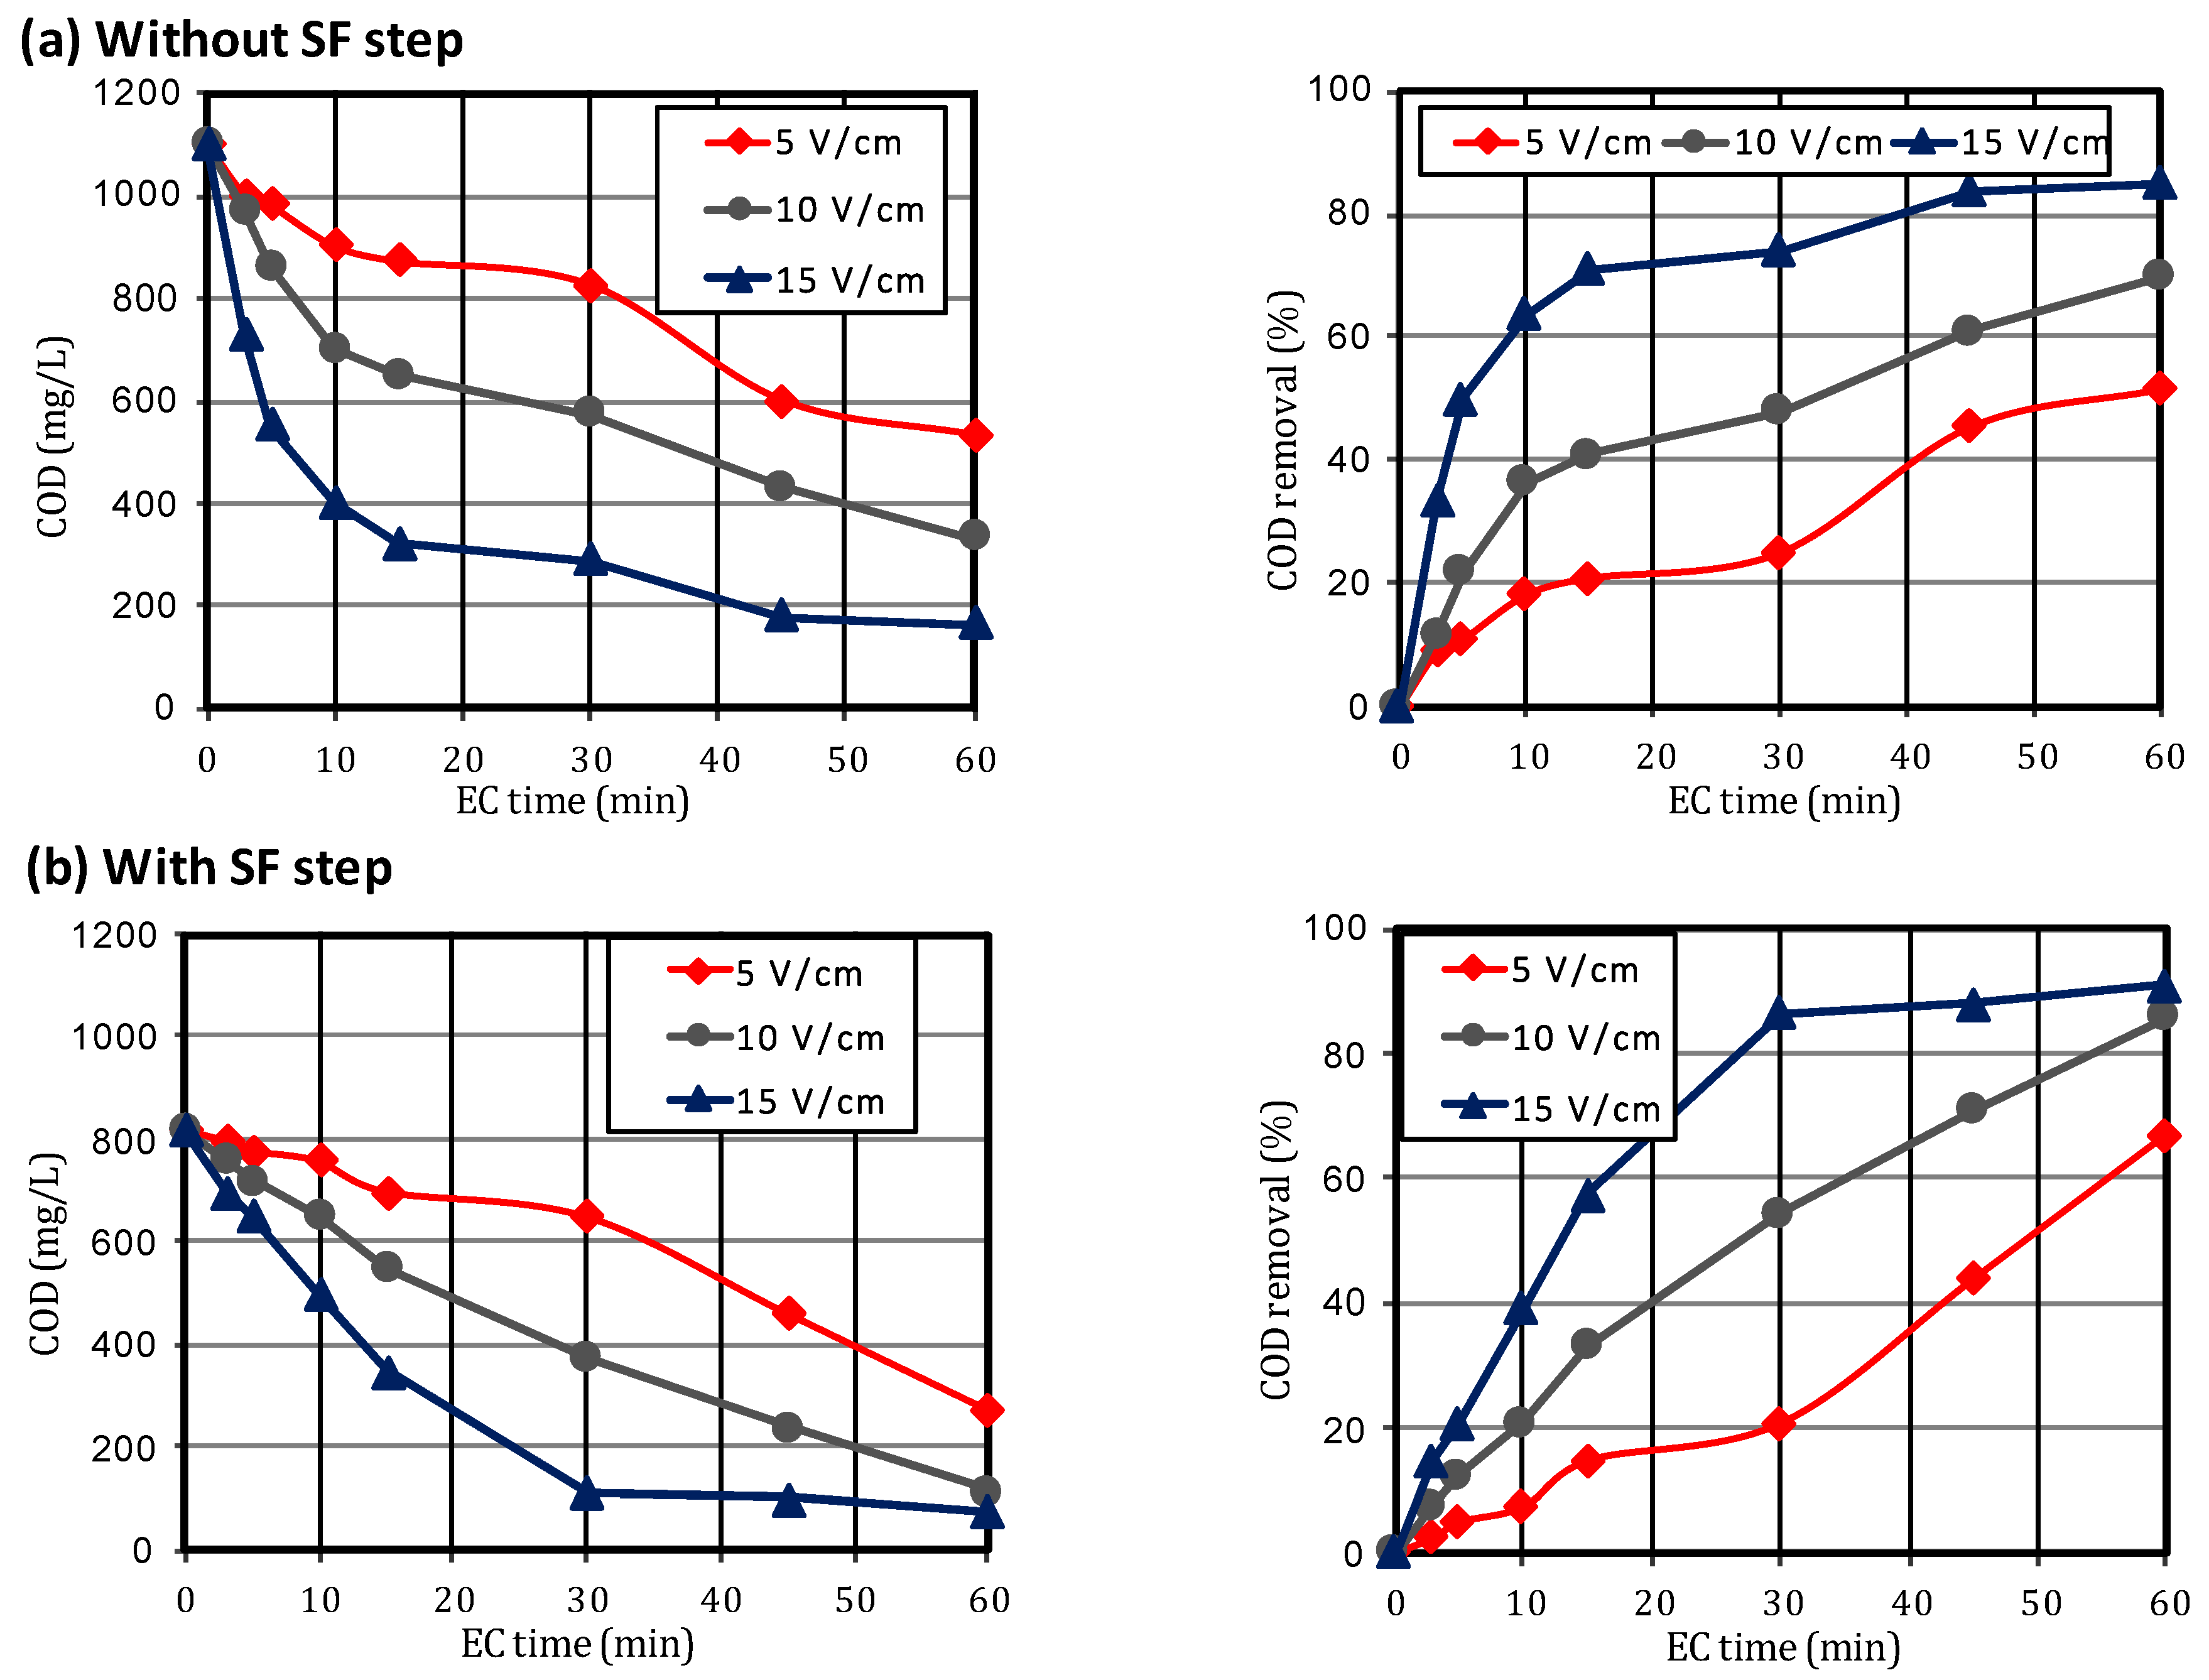
Turbidity and color are two physical parameters that can give visual indications about the quality of the treated water in terms of residual suspended solids and dissolved solids [34]. Removal efficiencies for turbidity by EC technique without and with a pretreatment sand filtration unit are shown in Figure 3. The figure demonstrates that the percentage of turbidity removal increases with increases in the applied voltage gradients with or without applying a filtration step. The figure also shows that the sand filtration step reduced the turbidity concentration before EC treatment from 313 FTU to 224 FTU, which is equivalent to a 28.4% reduction. This is due to the ability of sand filtration to retain suspended particles accounting for turbidity [25,35]. This improvement was reflected in the EC performance. For 60 min of EC time, and without sand filtration treatment, the turbidity decreased from 313 FTU to 42 FTU, 2 FTU, and 0 FTU for the applied voltage gradients of 5 V/cm, 10 V/cm, and 15 V/cm, respectively. However, after applying the SF step, the turbidity decreased from 224 FTU to 21 FTU at an applied voltage of 5 V/cm and was completely removed (0 FTU) at the applied voltage gradients of 10 V/cm and 15 V/cm during 60 min of EC time.
It is shown in Figure 3 that the applied voltage gradients of 5 V/cm and 10 V/cm could not achieve complete removal of turbidity within 60 min of EC time without applying sand filtration as a pretreatment (Figure 3a). Meanwhile, the applied voltage of 15 V/cm needed more than 45 min of EC time to achieve 100% turbidity removal, whereas after applying the SF step, a complete reduction in turbidity could be achieved within 55 min of EC time at an applied voltage gradient of 10 V/cm (Figure 3b). In addition, the filtration step reduced the EC time required to reach the steady-state removal of turbidity from 45 min without sand filtration to 30 min with SF at an applied voltage gradient of 15 V/cm, which would reduce energy consumption.
The filtration step also improved the performance of EC with respect to color removal, as shown in Figure 4. The color decreased from 662 Pt-Co to 600 Pt-Co after applying the SF step before EC, which was equivalent to a 9.4% reduction by SF. When the EC reactor operated without the SF step, the color decreased from 662 Pt-Co to 101 Pt-Co (84.7%), 69 Pt-Co (89.6%), and 48 Pt-Co (92.7%) for the applied voltage gradients of 5 V/cm, 10 V/cm, and 15 V/cm, respectively, during 60 min of EC time. After applying the SF step, the color was decreased by the EC unit only from 600 Pt-Co to 98 Pt-Co (83.7%), 63 Pt-Co (89.5%), and 34 Pt-Co (94.4%) for the applied voltage gradients of 5 V/cm, 10 V/cm, and 15 V/cm, respectively, during 60 min of EC time. However, if we account the color removal with both units (SF–EC), the overall removal percentages were 85.2%, 90.5%, and 94.9% for the applied voltage gradients of 5 V/cm, 10 V/cm, 15 V/cm, respectively. In comparison with another study [7], it seems that the greywater used in this study had more colored constituents. Therefore, a complete reduction in color could not be achieved with and without the SF step even at high applied voltage gradients. This result suggests that the true color of greywater, which usually results from the dissolved constituents, dominates the apparent color, which is produced from suspended solids. This might be due to the types of detergent present in the GW solution [36].

3.4. COD Removal

In terms of organic matter, Figure 5 shows the performance of the EC process for COD removal with and without the sand filtration pretreatment step. The figure demonstrates a significant improvement in reducing the COD load in greywater after applying the SF step. The COD in raw greywater decreased from 1102 mg/L to 821 mg/L, which is equivalent to a 25.5% improvement. Furthermore, the significant improvement in COD removal achieved by the SF step process coincided mostly with the turbidity removal observed in Figure 3 which indicates that most of the organic matter in the GW constituted suspended and colloidal particles.
After applying the EC treatment to greywater samples without the SF pretreatment step, the COD in the raw greywater was reduced from 1102 mg/L to 532 (51.7%), 332 (69.9%), and 165 (85.0%) at the applied voltage gradients of 5 V/cm, 10 V/cm, 15 V/cm, respectively, during 60 min of EC time. In addition, the performance of EC with respect to COD removal increased after applying the SF pretreatment step, reducing COD from 821 mg/L to 272 mg/L (66.9%), 116 (85.9%), and 77 (90.6%) at the applied voltage gradients of 5 V/cm, 10 V/cm, 15 V/cm, respectively, during 60 min of EC time. However, if we account for the COD removed by both units (SF–EC) based on the initial concentration of COD before SF pretreatment (1102 mg/L), the overall removal of COD was 75.3%, 89.5%, and 93.0% at the applied voltage gradients of 5 V/cm, 10 V/cm, 15 V/cm, respectively. Apparently, the SF step reduced the organic load in the EC unit, which enabled increasing percentages of removal at all applied voltage gradients.

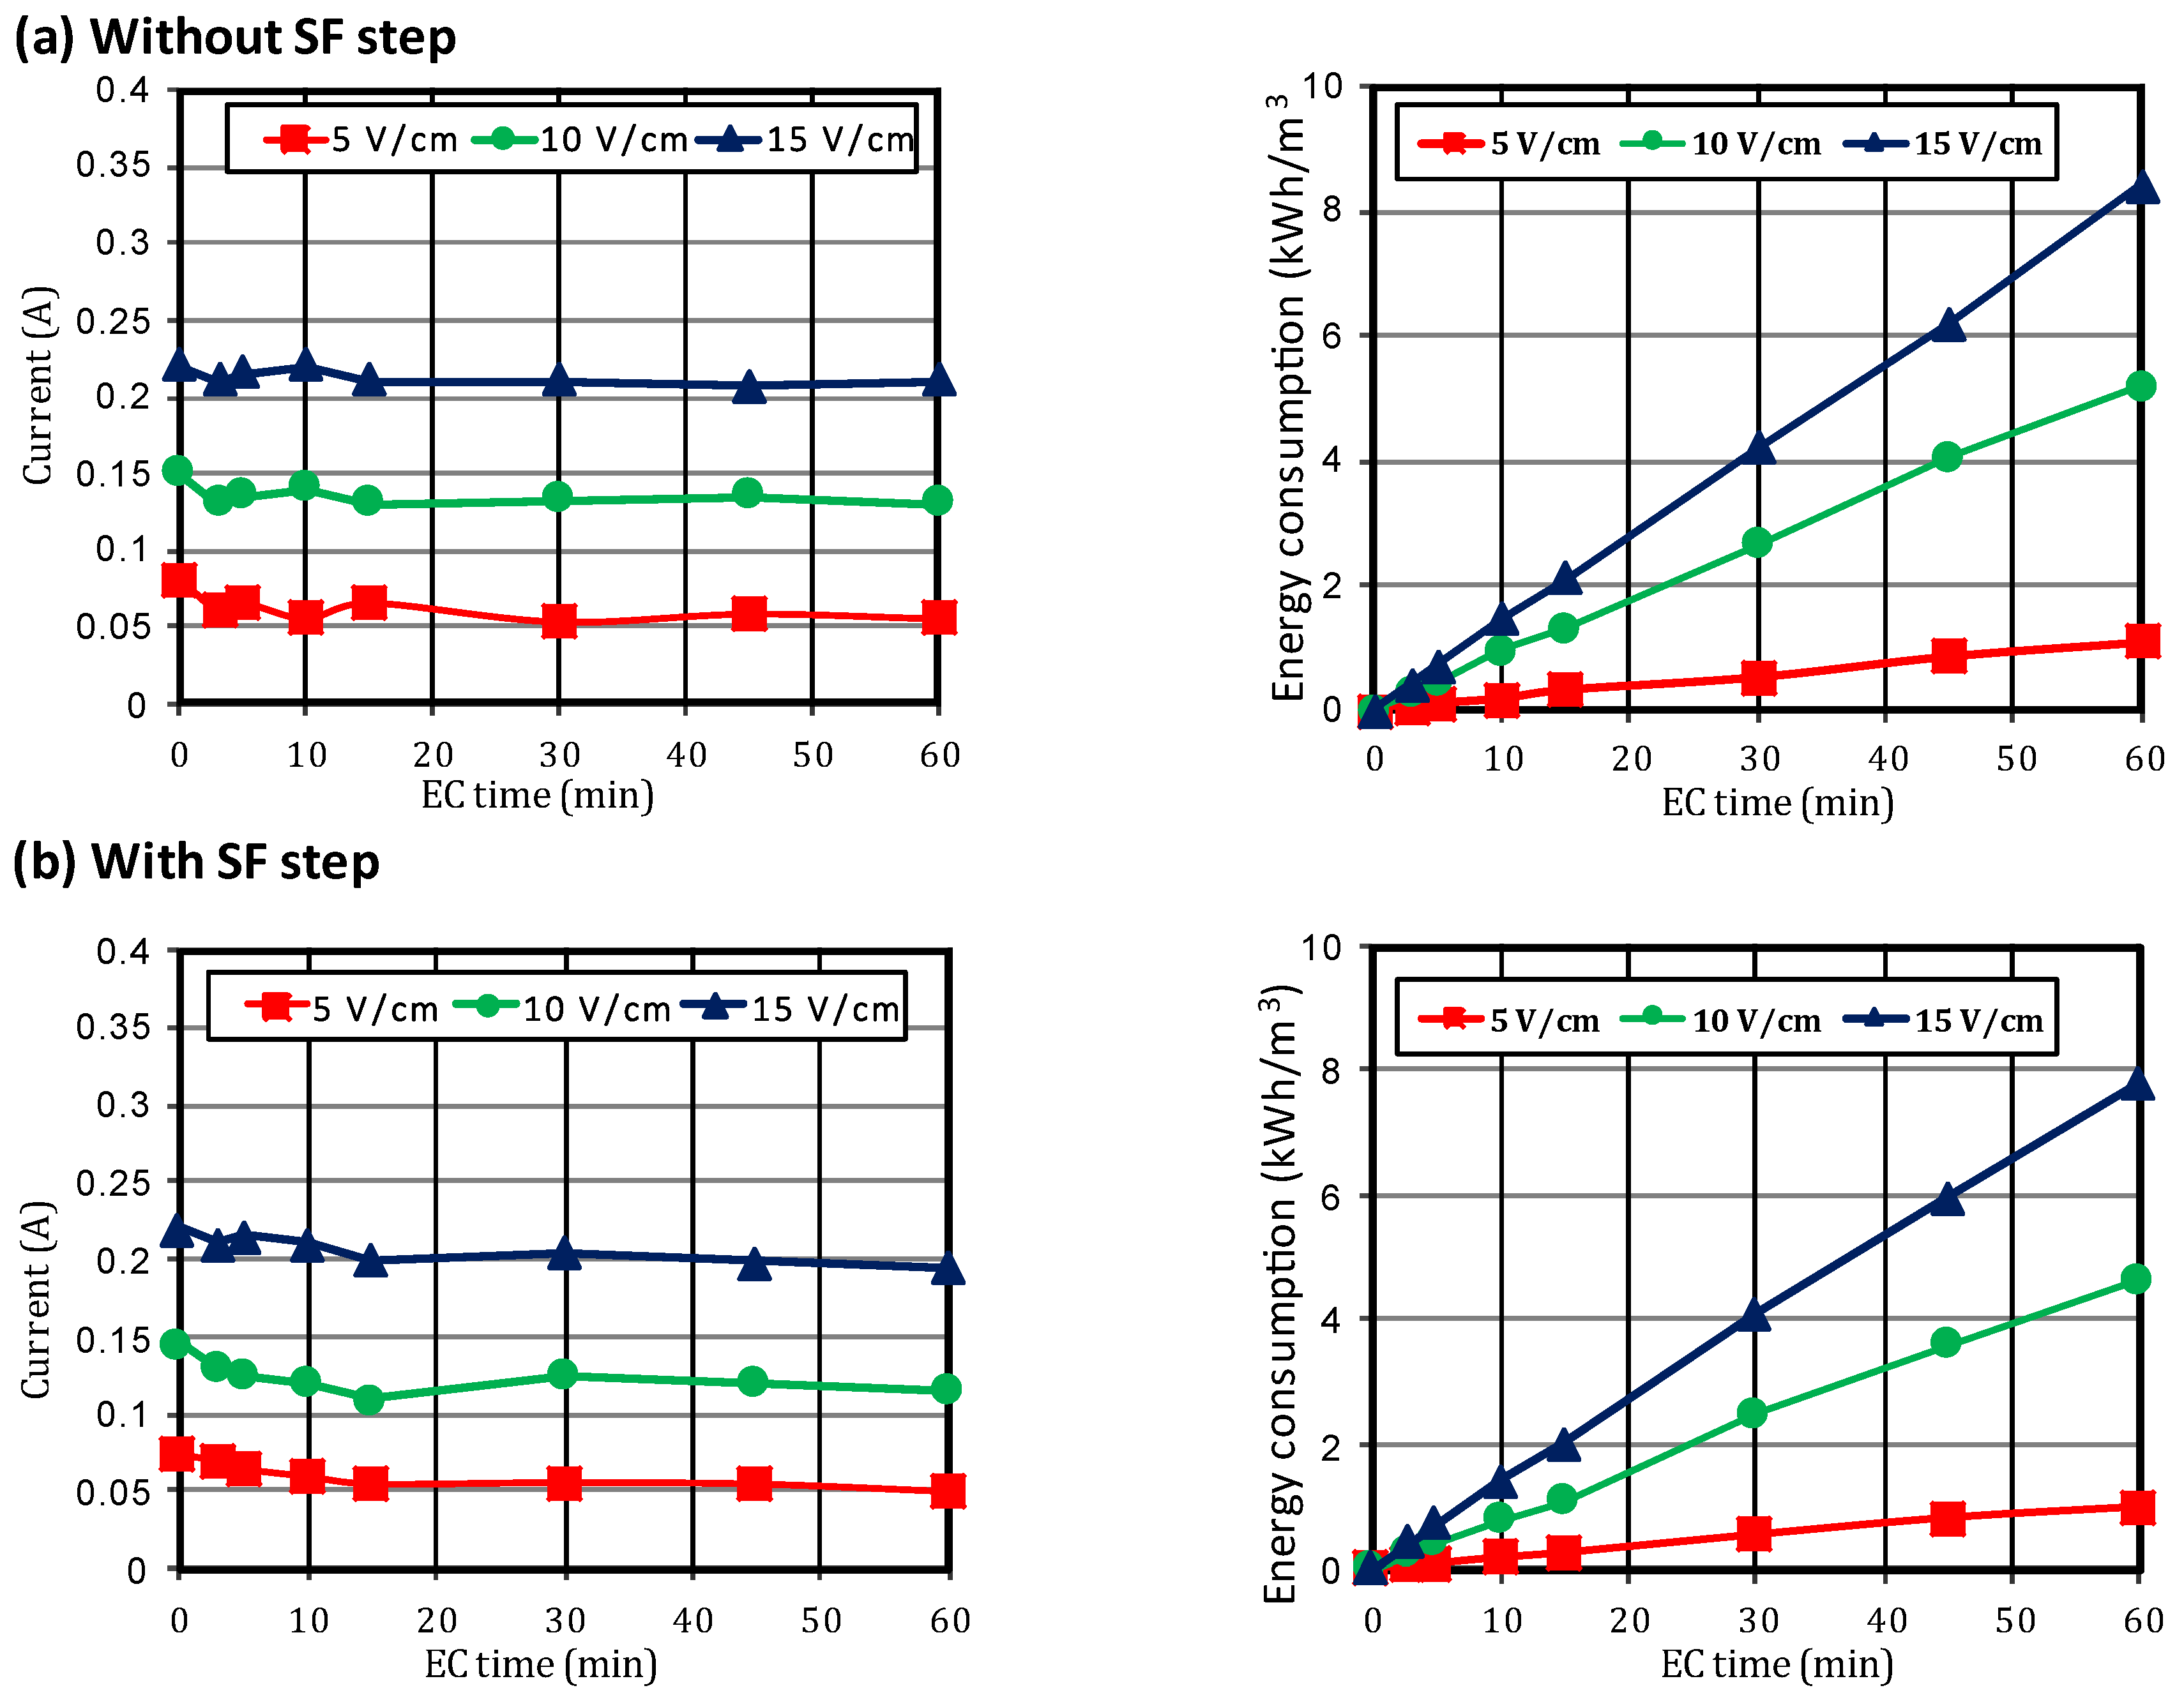
3.5. Energy Consumption

Energy consumption is considered a significant indicator of economical operational in any EC process [37]. Therefore, during greywater treatment by EC technology, it is recommended to reduce the operational costs to make the treatment by EC competitive with other, conventional treatment processes. Generally, the energy consumption in the EC process depends on the operating conditions in terms of the applied current, applied voltage, and EC time. Other parameters related to the characteristics of the treated solution, such as initial pH and the type of treated wastewater, might also affect the performance of the EC process. For greywater treatment by EC, some studies reported a very low amount (0.153 kWh/m3) of consumed energy at optimum operating conditions (current density = 3 A/m2, EC time = 60 min, and pH = 7) [38], while another study reported a high amount (9.46 kWh/m3) of consumed energy at optimum operating conditions [6].
From an electrical point of view and at a fixed applied voltage gradient, there are two major parameters that can reduce the energy consumed during EC operation: the EC time and the applied current density (Equation (6)). In this study, the applied voltages were fixed at 5 V/cm, 10 V/cm, and 15 V/cm, which led to fluctuations in the applied DC density, as shown in Figure 6, which also shows the corresponding specific energy consumption of the applied currents. Figure 6 shows a linear relationship between EC time and the specific energy consumption for a given applied voltage. Apparently, the specific energy consumption increased both with increasing EC time and applied voltage. However, the reduction in the applied DC was not sufficient to reduce the energy consumed by a significant amount, as shown in Figure 6. For example, at an applied voltage of 15 V/cm, the energy consumption was reduced from 8.4 kWh/m3 without SF to 7.8 kWh/m3 with SF, which is equivalent to only a 7.1% reduction if the EC reactor operates for 60 min.
Meanwhile, according to Figure 5, the reduction in EC time was observed to reach a steady-state condition with a considerable reduction in COD concentration after applying the SF step. It was reported that EC time is a very important parameter that affects the economic applicability of the EC process in wastewater treatment [21], as it is expected that an increase in the applied voltage gradient and in the EC time will increase the operational costs in terms of energy consumption. As shown in Figure 5a, at an applied voltage gradient of 15 V/cm, the COD removal efficiency reached a steady-state value of 83.7% after 45 min without the SF pretreatment step. On the other hand, after integrating the SF step, the COD removal efficiency reached a steady-state value of 87.8% within 30 min, as shown in Figure 5b. In other words, high rates of COD removal can be achieved within a short EC run time by using the SF pretreatment step. Ultimately, this significant decrease in EC steady-state time led to a decrease in energy consumption per cubic meter of treated greywater, as shown in Figure 7. At steady state, and at 15 V/cm, the energy consumption decreased from 6.21 kWh/m3 (without the SF step) to 4.11 kWh/m3 (with the SF step) for EC times of 45 min (without the SF step) and 30 min (with the SF step), respectively. This is equivalent to a 34% savings in energy. Therefore, to achieve the highest possible removal efficiency with the lowest energy consumption, the EC treatment time must not be greater than 30 min at an applied voltage gradient of 15 V/cm when it is operated with the SF pretreatment step. Improving cost-related variables with the inclusion of sand filtration have been demonstrated for other greywater treatment technologies [39].
On the other hand, the amount of coagulating dose released from anodic dissolution will also increase with EC time during the electrolysis reaction, as calculated from Equation (7), which may release an excessive number of metallic ions. Figure 7 demonstrates that under a steady-state condition, 34.4 mg/L is required to remove 87.8% of COD when EC is operated with the SF step for 30 min, while 52.1 mg/L is required to achieve 83.7% removal of COD within 45 min of EC time without the SF step. Therefore, it is more cost-effective to operate the EC unit for an optimized duration when it reaches a steady-state condition.

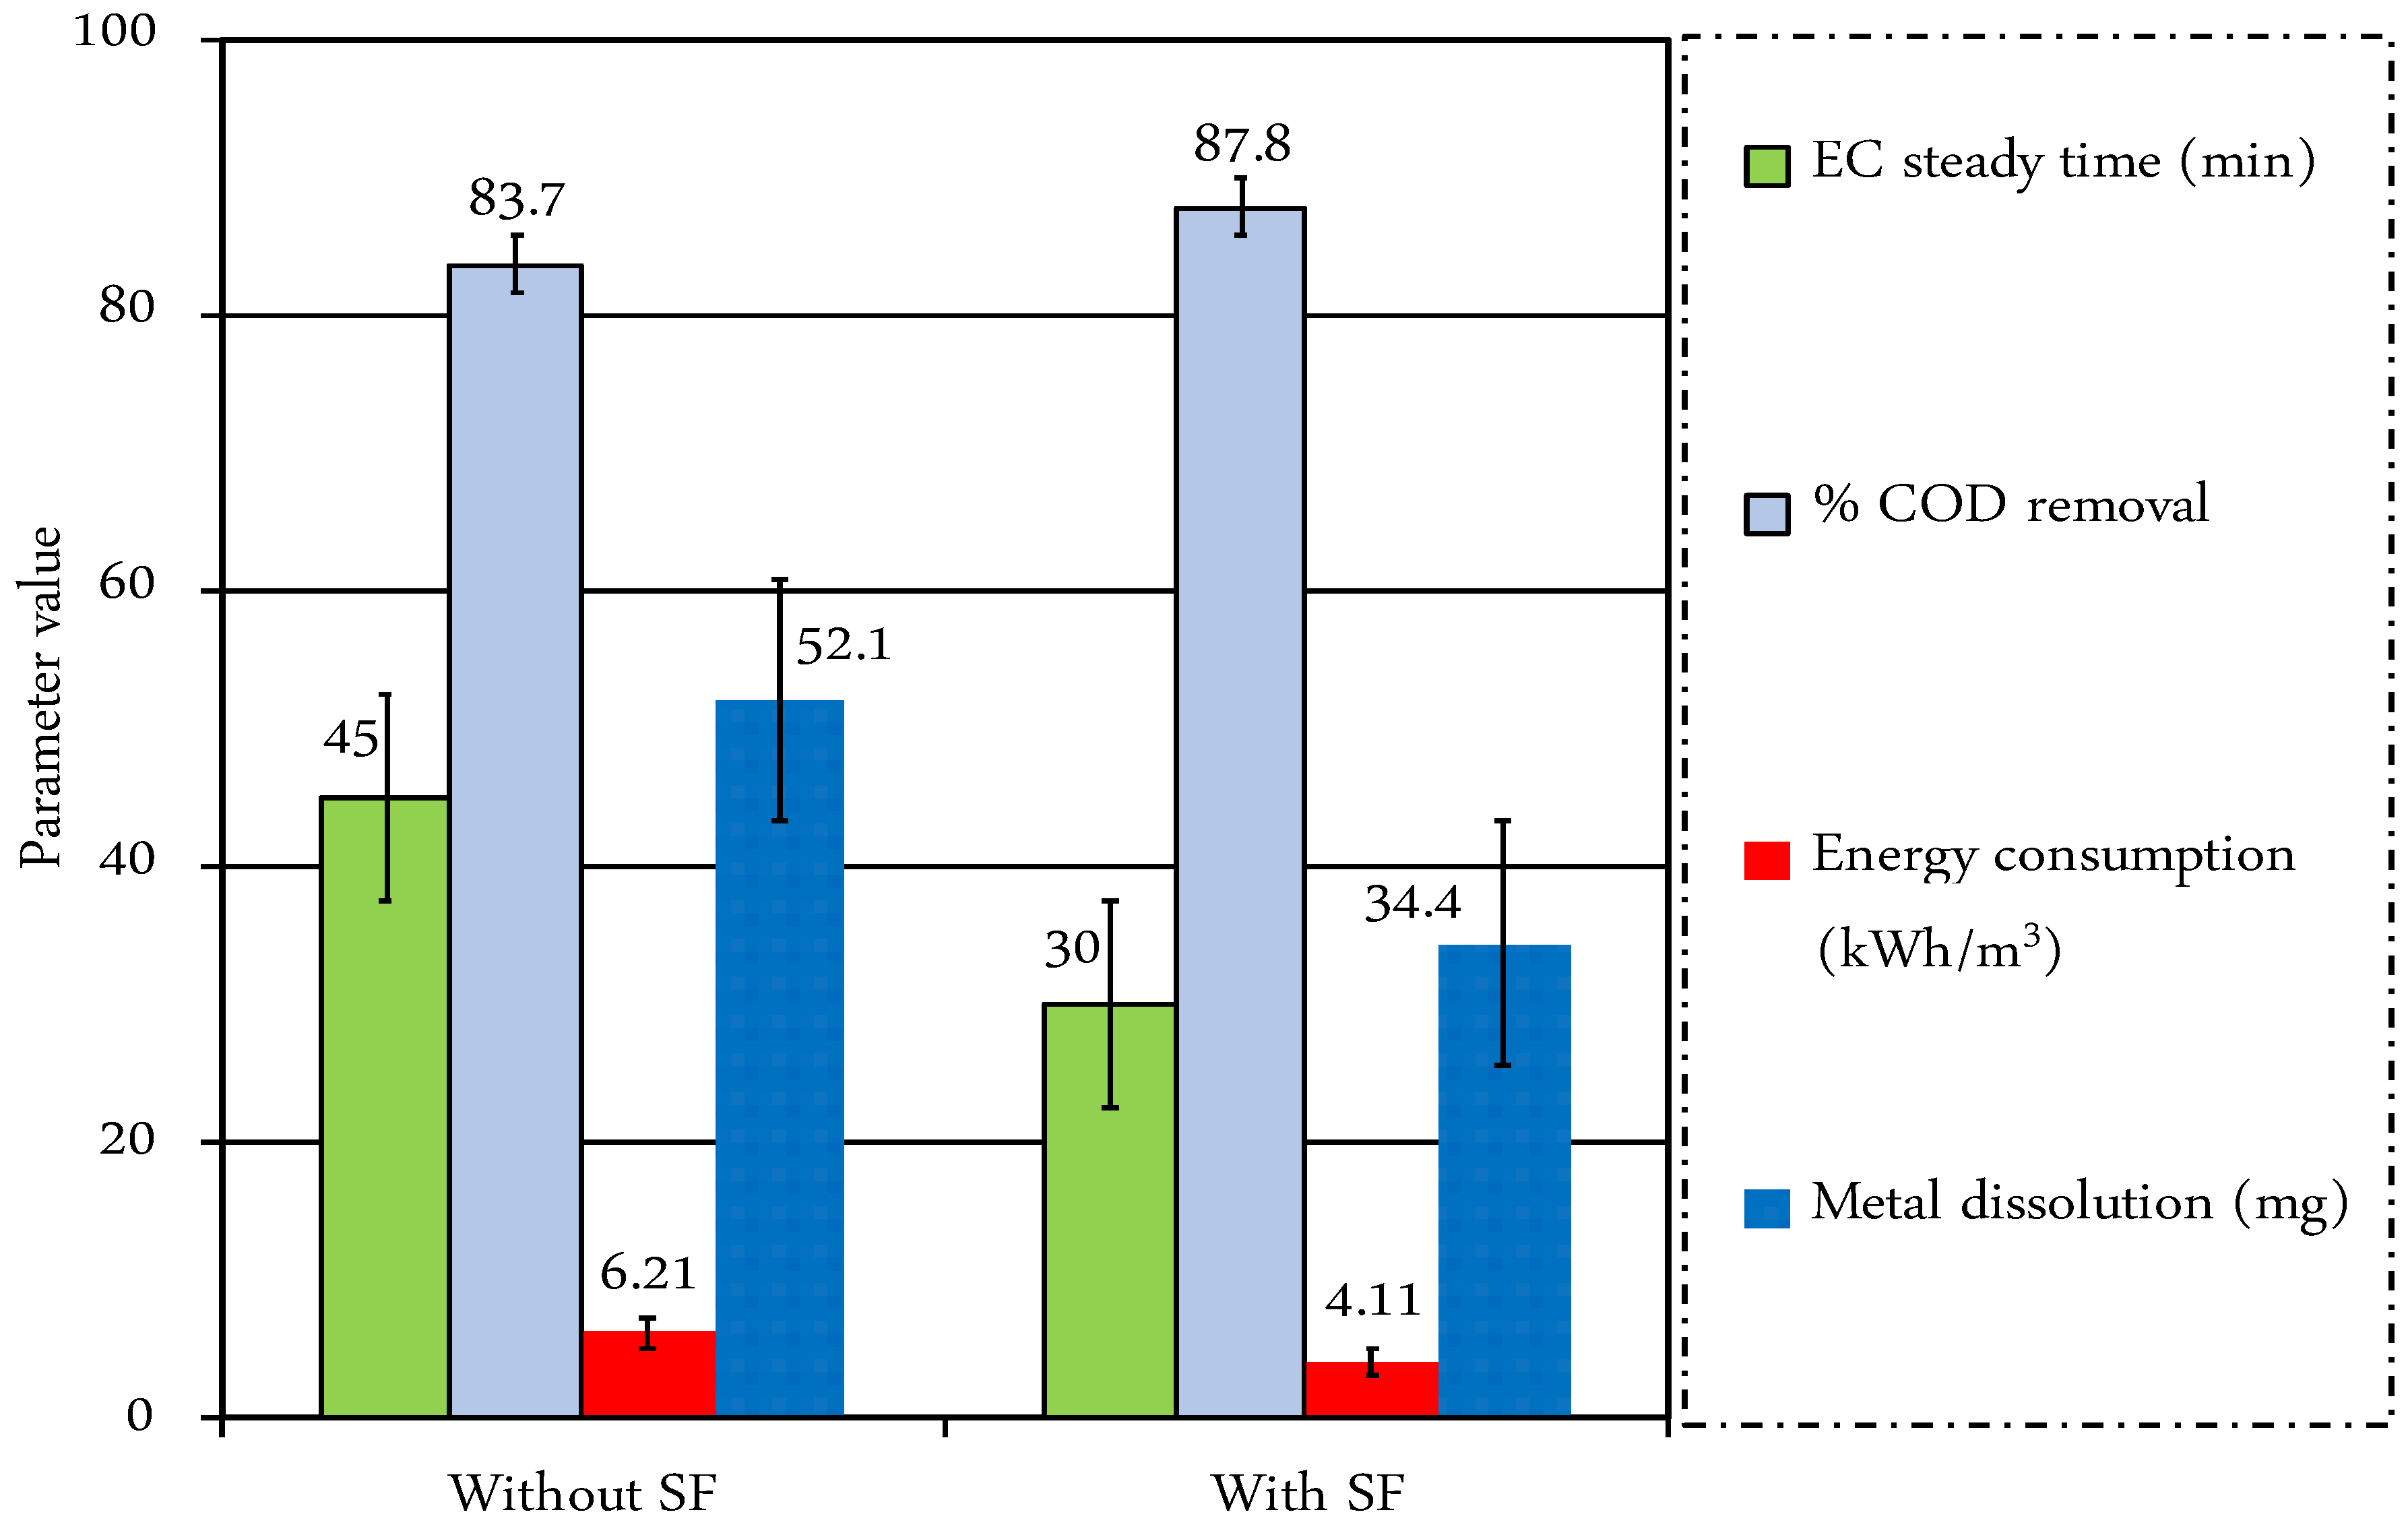
3.6. Technical Concerns Regarding the Performance of the Sand Filtration Unit

Figure 8 summarizes the performance of the sand filtration step, the EC unit only, and the SF–EC process in terms of pollutant reduction during 60 min of EC time. The figure demonstrates the significant impact of adding a filtration pretreatment step before electrocoagulation treatment. It is obvious from Figure 8 that the percentage reduction achieved by the SF step was more significant with respect to turbidity (28.4%) in comparison with the percentage reduction in color (9.4%). In conjunction with these reductions, the percentage reduction in COD achieved by the SF step was 25.5%. These results suggested that most of the pollutant removals achieved by the SF step were mainly due to the suspended and colloidal particles, while the removal of soluble organic matter was not significant. The obtained results of this study are reasonable, as only short test experiments were conducted to validate the concept of this research. It is well known that the sand filtration system consists of a multi-layer series of beds filled with a particular medium, such as washed graded sands, gravel, crushed glass, or peat [25]. While the sand filer medium in the bed is able to retain most of the suspended particles, a biofilm should be first developed on the sand particles, which, in turn, adsorbs the soluble organic matter [25]. This mechanism was not implemented in this study, as the SF step was only based on a small unit operating for a very short duration.
To further confirm the significance of integrating the SF step with the EC process, the experimental results obtained from this study were also compared with the standards of greywater treatment for local requirements [40] and different uses, as shown in Table 3. Obviously, Table 3 demonstrates that the studied parameters (pH, turbidity, color and COD) satisfy the requirements of local standards specifically for reducing the COD concentration from 165 mg/L without an integrated SF step to 77 mg/L with an integrated SF step.
However, on a large scale and with a continuous flow operation, many technical limitations may be revealed that could limit the application of SF, such as clogging problems [41]. Therefore, a continuous SF–EC process on a pilot scale, together with a proper approach to the rewashing procedure, should be first designed and characterized. It is also worth mentioning that using EC as the sole treatment process would not be a feasible technique if operated at high voltage gradients to treat high organic loads of wastewater, as was the case in this study. Therefore, the integration of SF with EC would decrease these limitations to some degree and bring some benefits in terms of operating costs. In conclusion, integrating sand filtration before EC may reduce the requirements for treatment with single units if used as the sole treatment process. Research is now under way to identify appropriate designs for the sand filtration unit that will take into consideration the important design parameters of the unit in terms of rewashing procedure, hydraulic surface loading, and organic surface loading.

4. Conclusions

In this preliminary study, a sand filtration (SF) process was integrated with the EC technique as a pretreatment step to improve the performance of EC for treating high- loaded greywater. Three different voltage gradients were investigated (5 V/cm, 10 V/cm, and 15 V/cm) in the EC unit. The pretreatment sand filtration step can contribute significantly to reducing pollutant concentrations in the greywater to be treated by EC. The results demonstrated that the SF pretreatment step achieved relatively significant organic matter removal (25.5%) in terms of COD. In terms of physical impurities, the results showed that the SF pretreatment step reduced the turbidity and the color of the treated greywater by up to 28.4%, and 9.4%, respectively. This reduction was reflected directly in the energy consumed by the EC reactor. In terms of energy consumption, a combination of the SF step with the EC process permitted a reduction in the EC processing time, which led to a reduction in the consumption of electrical energy by up to 34%. The results of this paper suggest that, at steady-state conditions, a high COD removal rate of 87.8% from high-loaded greywater can be obtained by an EC unit with an energy consumption of 4.11 kWh/m3, thus allowing significant savings in larger-scale wastewater treatment processes. However, there are some important considerations in terms of the time scale, which is too short to reflect practical engineering significance. Therefore, additional test series based on continuous operations are required to generalize these concepts for future large-scale applications, taking into consideration the impact of continuous operation on the column of the sand filter in terms of clogging time and loading treatment on the overall performance. Research is now under way to identify an appropriate design for the sand filtration unit, which will take into consideration important unit design parameters in terms of hydraulic surface loading and organic surface loading with a proper approach for the rewashing procedure.

Author Contributions

Conceptualization, K.B.-M., A.A.B. and N.A.-A.; methodology, K.B.-M. and A.A.B.; validation, K.B.-M., Z.A.-Q. and N.A.-A.; formal analysis, K.B.-M., Z.A.-Q. and M.R.A.-K.; investigation, K.B.-M. and M.R.A.-K.; resources, K.B.-M.; data curation, K.B.-M. and M.A.-S.; writing—original draft preparation, K.B.-M., A.A.B. and Z.A.-Q.; writing—review and editing, K.B.-M., Z.A.-Q., M.A.-S. and W.B.-S.; visualization, A.A.B.; supervision, K.B.-M., M.R.A.-K. and W.B.-S.; project administration, K.B.-M.; funding acquisition, K.B.-M. and A.A.B. All authors have read and agreed to the published version of the manuscript.

Funding

This research was funded by the Scientific Research and Innovation Support Fund in Jordan; Grant Reference WE/1/19/2015.

Data Availability Statement

The datasets generated and/or analyzed during the current study are available from the corresponding authors upon reasonable request.

Acknowledgments

The authors would like to thank The Scientific Research and Innovation Support Fund in Jordan for the financial support provided for conducting this study under grant number WE/1/19/2015.

Conflicts of Interest

The authors declare no conflict of interest. The funder had no role in the design of the study; in the collection, analyses, or interpretation of data; in the writing of the manuscript, or in the decision to publish the results.

References

  1. Smith, E.; Bani-Melhem, K. Greywater characterization, and treatment for reuse in an arid environment. Water Sci. Technol. 2012, 66, 72–78. [Google Scholar] [CrossRef]
  2. Khajvand, M.; Mostafazadeh, A.K.; Drogui, P.; Tyagi, R.D.; Brien, E. Greywater characteristics, impacts, treatment, and reclamation using adsorption processes towards the circular economy. Environ. Sci. Pollut. Res. 2022, 29, 10966–11003. [Google Scholar] [CrossRef]
  3. Boddu, V.M.; Paul, T.; Page, M.A.; Byl, C.; Ward, L.; Ruan, J. Gray water recycle: Effect of pretreatment technologies on low pressure reverse osmosis treatment. J. Environ. Chem. Eng. 2016, 4, 4435–4443. [Google Scholar] [CrossRef] [Green Version]
  4. Bani-Melhem, K.; Smith, E. Greywater Treatment by a Continuous Process of an Electro-coagulation Unit, and a Submerged Membrane Bioreactor System. Chem. Eng. J. 2012, 198–199, 201–210. [Google Scholar] [CrossRef]
  5. Abdel-Shafy, H.I.; El-Khateeb, M.A.; Shehata, M. Greywater Treatment using different designs of sand filters. Desal. Water Treat. 2014, 52, 5237–5242. [Google Scholar] [CrossRef]
  6. Barışçı, S.; Turkay, O. Domestic greywater treatment by electrocoagulation using hybrid electrode combinations. J. Water Process Eng. 2016, 10, 56–66. [Google Scholar] [CrossRef]
  7. Bani-Melhem, K.; Al-Shannag, M.; Alrousan, D.; Al-Kofahi, S.; Al-Qodah, Z.; Al-Kilani, M.R. Impact of soluble COD on greywater treatment by electrocoagulation technique. Desal. Water Treat. 2017, 89, 101–110. [Google Scholar] [CrossRef] [Green Version]
  8. Alrousan, D.; Afkhami, A.; Bani-Melhem, K.; Dunlop, P. Organic degradation potential of real greywater using TiO2-Based advanced oxidation processes. Water 2020, 12, 2811. [Google Scholar] [CrossRef]
  9. Chanakya, H.N.; Kumar, K.H. Treatment of gray water using anaerobic biofilms created on synthetic, and natural fibers. Process Saf. Environ. Prot. 2014, 92, 186–192. [Google Scholar] [CrossRef]
  10. Bani-Melhem, K.; Al-Qodah, Z.; Al-Shannag, M.; Qasaimeh, A.; Qtaishat, M.R.; Alkasrawi, M. On the performance of real greywater treatment using a submerged membrane bioreactor system. J. Membr. Sci. 2015, 476, 40–49. [Google Scholar] [CrossRef]
  11. Al-Ghazawi, Z.; Qasaimeh, A.; Bani-Melhem, K. Ablution gray water qualitative assessment, and treatment by submerged membrane bioreactor: A case study in Jordan. Desal. Water Treat. 2018, 127, 213–221. [Google Scholar] [CrossRef]
  12. Barzegar, G.; Wu, J.; Ghanbari, F. Enhanced treatment of greywater using electrocoagulation/ozonation: Investigation of process parameters. Process Saf. Environ. Prot. 2019, 121, 125–132. [Google Scholar] [CrossRef]
  13. Al-Shannag, M.; Lafi, W.; Bani-Melhem, K.; Gharagheer, F.; Dhaimat, O. Reduction of COD, and TSS from paper industries wastewater using electro-coagulation, and chemical coagulation. Sep. Sci. Technol. 2012, 47, 700–708. [Google Scholar] [CrossRef]
  14. Al-Shannag, M.; Al-Qodah, Z.; Bani-Melhem, K.; Qtaishat, M.R.; Alkasrawi, M. Heavy metal ions removal from metal plating wastewater using electrocoagulation: Kinetic study, and process performance. Chem. Eng. J. 2015, 260, 749–756. [Google Scholar] [CrossRef]
  15. Al-Qodah, Z.; Al-Shannag, M.; Bani-Melhem, K.; Assirey, E.; Yahya, M.A.; Al-Shawabkeh, A. Free radical-assisted electrocoagulation processes for wastewater treatment. Environ. Chem. Lett. 2018, 16, 695–714. [Google Scholar] [CrossRef]
  16. Ronaldo Anuf, A.; Ramaraj, K.; Sivasankarapillai, V.S.; Dhanusuraman, R.; Maran, J.P.; Rajeshkumar, G.; Rahdar, A.; Díez-Pascual, A.M. Optimization of electrocoagulation process for treatment of rice mill effluent using response surface methodology. J. Water Process Eng. 2022, 49, 103074. [Google Scholar] [CrossRef]
  17. Bani-Melhem, K. Development of a Novel Submerged Membrane Electro-Bioreactor for Wastewater Treatment. Ph.D. Thesis, Concordia University, Montreal, QC, Canada, 2008. [Google Scholar]
  18. Bani-Melhem, K.; Elektorowicz, M. Development of a novel submerged membrane electro-bioreactor (SMEBR): Performance for fouling reduction. Environ. Sci. Technol. 2010, 44, 3298–3304. [Google Scholar] [CrossRef]
  19. Bani-Melhem, K.; Elektorowicz, M. Performance of the submerged membrane electoro bioreactor (SMEBR) with iron electrodes for wastewater treatment, and fouling reduction. J. Membr. Sci. 2011, 379, 434–439. [Google Scholar] [CrossRef]
  20. Khandegar, V.; Saroha, A.K. Electrocoagulation for The Treatment of Textile İndustry Effluent. J. Environ. Manag. 2013, 128, 949–963. [Google Scholar] [CrossRef]
  21. Bani-Melhem, K.; Qtaishat, M.R.; Tawalbeh, M. Evaluation of scrap metallic waste electrode materials for the application in electrocoagulation treatment of wastewater. Chemosphere 2023, 310, 136668. [Google Scholar] [CrossRef]
  22. Asaithambi, P.; Govindarajan, R.; Yesuf, M.B.; Selvakumar, P.; Alemayehu, E. Enhanced treatment of landfill leachate wastewater using sono(US)-ozone(O3)–electrocoagulation(EC) process: Role of process parameters on colour, COD, and electrical energy consumption. Process Saf. Environ. Prot. 2020, 142, 212–218. [Google Scholar] [CrossRef]
  23. Al-Qodah, Z.; Tawalbeh, M.; Al-Shannag, M.; Al-Anber, Z.; Bani-Melhem, K. Combined electrocoagulation processes as a novel approach for enhanced pollutants removal: A state-of-the-art review. Sci. Total. Environ. 2020, 744, 140806. [Google Scholar] [CrossRef] [PubMed]
  24. Nigri, E.M.; Santos, A.L.; Rocha, S.D. Removal of organic compounds, calcium, and strontium from petroleum industry effluent by simultaneous electrocoagulation, and adsorption. J. Water Process Eng. 2020, 37, 101442. [Google Scholar] [CrossRef]
  25. Assayed, A.; Chenoweth, J.; Pedley, S. Drawer compacted sand filter: A new, and innovative method for on-site greywater treatment. Environ. Technol. 2014, 35, 2435–2446. [Google Scholar] [CrossRef] [Green Version]
  26. Katukiza, A.Y.; Ronteltap, M.; Niwagaba, C.B.; Kansiime, F.; Lens, P.N.L. Greywater treatment in urban slums by a filtration system: Optimisation of the filtration medium. J. Environ. Manag. 2014, 146, 131–141. [Google Scholar] [CrossRef] [PubMed]
  27. Albalawneh, A.; Chang, T.; Alshawabkeh, H. Greywater treatment by granular filtration system using volcanic tuff, and gravel media. Water Sci. Technol. 2017, 75, 2331–2341. [Google Scholar] [CrossRef] [PubMed]
  28. Spychała, M.; Niec, J.; Zawadzki, P.; Matz, R.; Nguyen, T.H. Removal of Volatile Solids from Greywater Using Sand Filters. Appl. Sci. 2019, 9, 770. [Google Scholar] [CrossRef] [Green Version]
  29. Morales-Figueroa, A.; Teutli-Sequeira, E.A.; Linares-Hernández, I.; Martínez-Miranda, V.; García-Morales, M.A.; Roa-Morales, G. Optimization of the Electrocoagulation Process with Aluminum Electrodes for Rainwater Treatment. Front. Environ. 2022, 10, 860011. [Google Scholar] [CrossRef]
  30. Shaikh, I.N.; Ahammed, M. Quantity, and quality characteristics of greywater: A review. J. Environ. Manag. 2020, 261, 110266. [Google Scholar] [CrossRef] [PubMed]
  31. Jamrah, A.; Al-Omari, A.; Al-Qasem, L.; Ghani, N.A. Assessment of availability and characteristics of greywater in Amman. Water Inter. 2006, 31, 210–220. [Google Scholar] [CrossRef]
  32. Halalsheh, M.; Dalahmeh, S.; Sayed, M.; Suleiman, W.; Shareef, M.; Mansour, M.; Safi, M. Grey water characteristics and treatment options for rural areas in Jordan. Bioresour. Technol. 2008, 99, 6635–6641. [Google Scholar] [CrossRef] [PubMed]
  33. Al-Hamaiedeh, H.; Bino, M. Effect of treated grey water reuse in irrigation on soil and plants. Desalination 2010, 256, 115–119. [Google Scholar] [CrossRef]
  34. Daphne, L.H.X.; Utomo, H.D.; Kenneth, L.Z.H. Correlation between turbidity, and total suspended solids in Singapore rivers. J. Water Sustain. 2011, 1, 313–322. [Google Scholar]
  35. Saad, F.N.M.; Jamaludin, S.Z.A.; Izhar, T.N.T. Investigation of using sand filter in treating grey water. IOP Conf. Ser. Earth Environ. Sci. 2021, 646, 012056. [Google Scholar] [CrossRef]
  36. Zipf, M.S.; Pinheiro, I.G.; Conegero, M.G. Simplified greywater treatment systems: Slow filters of sand, and slate waste followed by granular activated carbon. J. Environ. Manag. 2016, 176, 119–127. [Google Scholar] [CrossRef] [PubMed]
  37. Al-Shannag, M.; Bani-Melhem, K.; Al-Anber, Z.; Al-Qodah, Z. Enhancement of COD-nutrients removals and filterability of secondary clarifier municipal wastewater influent using electrocoagulation technique. Sep. Sci. Technol. 2013, 48, 673–680. [Google Scholar] [CrossRef]
  38. Patel, P.; Gupta, S.; Mondal, P. Electrocoagulation process for greywater treatment: Statistical modeling, optimization, cost analysis and sludge management. Sep. Purif. Technol. 2022, 296, 121327. [Google Scholar] [CrossRef]
  39. Li, F.; Wichmann, K.; Otterpohl, R. Review of the technological approaches for greywater treatment, and reuses. Sci. Total. Environ. 2009, 407, 3439–3449. [Google Scholar] [CrossRef]
  40. JSMO. Water—Reclaimed Grey Water JS1776:2013, 2nd ed.; Jordan Standards and Metrology Organization: Amman, Jordan, 2013; pp. 1–16. [Google Scholar]
  41. Leverenze, G.; Tchobanoglous, G.; Darby, J. Clogging in intermittently dosed sand filters used for wastewater treatment. Water Res. 2009, 43, 695–705. [Google Scholar] [CrossRef]
Figure 1. Experimental setup used in the study.
Water 15 00990 g001
Figure 2. Evolution of pH during EC time: (a) without SF step, and (b) with SF step.
Water 15 00990 g002
Figure 3. Performance of turbidity removal: (a) without SF pretreatment step, (b) with SF pretreatment step.
Water 15 00990 g003
Figure 4. Performance of color removal: (a) without SF pretreatment step, (b) with SF pretreatment step.
Water 15 00990 g004
Figure 5. Performance of COD removal: (a) without SF pretreatment step, (b) with SF pretreatment step.
Water 15 00990 g005
Figure 6. Evolution of DC during EC time and specific energy consumption during EC treatment: (a) without SF pretreatment step, (b) with SF pretreatment step.
Water 15 00990 g006
Figure 7. Performance of EC unit with and without SF step at steady-state conditions at 15 V/cm.
Water 15 00990 g007
Figure 8. Summary of % removals of COD, turbidity, and color achieved by SF only, EC only, and SF–EC during 60 min of EC time.
Water 15 00990 g008
Table 1. Characteristics of raw greywater solution used in the experiments conducted in this study.
Parameter IndexUnitValue
pH-6.59 ± 0.14
TemperatureCelsius (°C)20.2 ± 0.2
Total dissolved solids (TDS)mg/L750 ± 70
Total suspended solids (TSS)mg/L275 ± 14
Chemical oxygen demand (COD)mg/L1102 ± 50
TurbidityFAU313 ± 1.5
ColorPt-Co662 ± 20
Conductivity(µS/cm)1235 ± 136
Table 2. Comparison of the characteristics of greywater collected in this study with other studies in Jordan.
ParameterThis StudyBani-Melhem at al. [7]Jamrah et al. [31]Halalsheh et al. [32]Al-Hamaiedeh and Bino [33]
pH6.59 ± 0.146.4–7.67.816.356.9–7.8
Turbidity (FAU/NTU)313.3 ± 1.5
(FAU)
704–901
(FAU)
48.9
(NTU)
--
Conductivity (µS/cm)1235 ± 136716.7–900191018301570–2000
Total dissolved solids (TDS) (mg/L)750 ± 70400–507893--
Total suspended solids (TSS) (mg/L)275 ± 14808–100016884523–358
Color (Pt-Co)662 ± 20194–388---
COD (mg/L)1102 ± 501450–160078256892–2263
Table 3. Comparison of the characteristics of the treated GW in this study with the Jordan GW standard (EC = 60 min, applied voltage = 15 V/cm).
ParameterJordan GW Standard JS1776:2013 for Different Uses [40]:Results of This Study
Cooked Vegetables IrrigationRaw Vegetables IrrigationToilet FlushingWithout SF StepWith SF Step
pH (unitless)6–96–9<107.99 ± 0.457.45 ± 0.34
Turbidity (NTU)--5000
Color (Pt-Co)---48 ± 534 ± 4
Chemical oxygen demand (mg/L)120120<10165 ± 28.677 ± 28.6
Disclaimer/Publisher’s Note: The statements, opinions and data contained in all publications are solely those of the individual author(s) and contributor(s) and not of MDPI and/or the editor(s). MDPI and/or the editor(s) disclaim responsibility for any injury to people or property resulting from any ideas, methods, instructions or products referred to in the content.

