
Analysis of Water-Lifting Aerator Performance Based on the Volume of Fluid Method
1
School of Building Services Science and Engineering, Xi’an University of Architecture & Technology, Xi’an 710055, China
2
School of Environmental and Municipal Engineering, Xi’an University of Architecture & Technology, Xi’an 710055, China
*
Author to whom correspondence should be addressed.
Water 2023, 15(5), 991; https://doi.org/10.3390/w15050991
Submission received: 31 January 2023
/
Revised: 2 March 2023
/
Accepted: 3 March 2023
/
Published: 5 March 2023
(This article belongs to the Special Issue Advanced Treatment and Disinfection Technologies for Water and Wastewater)
Abstract
:Water quality deterioration is a major problem faced by reservoirs globally, owing to the inflow of pollution from industrial and municipal activities. Water-lifting aeration is an in situ water quality improvement technology that mixes and oxygenates deep water bodies in reservoirs to improve pollution control efficiency and water quality. While previous studies have mainly focused on the mixing process in the reservoir outside the water-lifting aerator (WLA), knowledge of the internal flow remains limited. In this study, a two-phase flow within a WLA system was numerically studied using the volume of fluid (VOF) method to comprehensively analyze the internal two-phase flow characteristics and the influence on the water-lifting and oxygenation performance of the system. The statistical analysis results showed that increasing the aeration chamber volume enhanced the bottom oxygenation performance by 27% because of the prolonged time of the deflector plate outlet outflow. Additionally, increasing the air release rate enhanced the water-lifting performance by 47%, which was induced by the shortened air piston release period. This study demonstrates the internal flow mechanism of the WLA and provides technical support for parameter optimization design, which has significant scientific research and engineering application value.
1. Introduction
Reservoirs are widely used as primary water sources for cities in many countries [1]. Owing to the nutrient-enriched inflow from industrial waste and municipal sewage [2], eutrophication has become one of the main causes of water quality degradation in reservoirs in recent years [3], posing severe challenges to water treatment and threatening the drinking water safety of urban residents [4]. Various remediation methods, including biological, chemical, and physical remediation, have been developed to effectively address this problem [5]. Highly efficient in situ remediation technology for source water quality treatment has become an important method to ensure water supply safety. Various mixing and oxygenation systems have been deployed in drinking water reservoirs to mitigate water quality problems. Standard mixing and oxygenation systems, including side-stream oxygenation systems [6], bubble plumes [7,8], and other technologies [9,10], have successfully improved water quality in lakes and reservoirs.
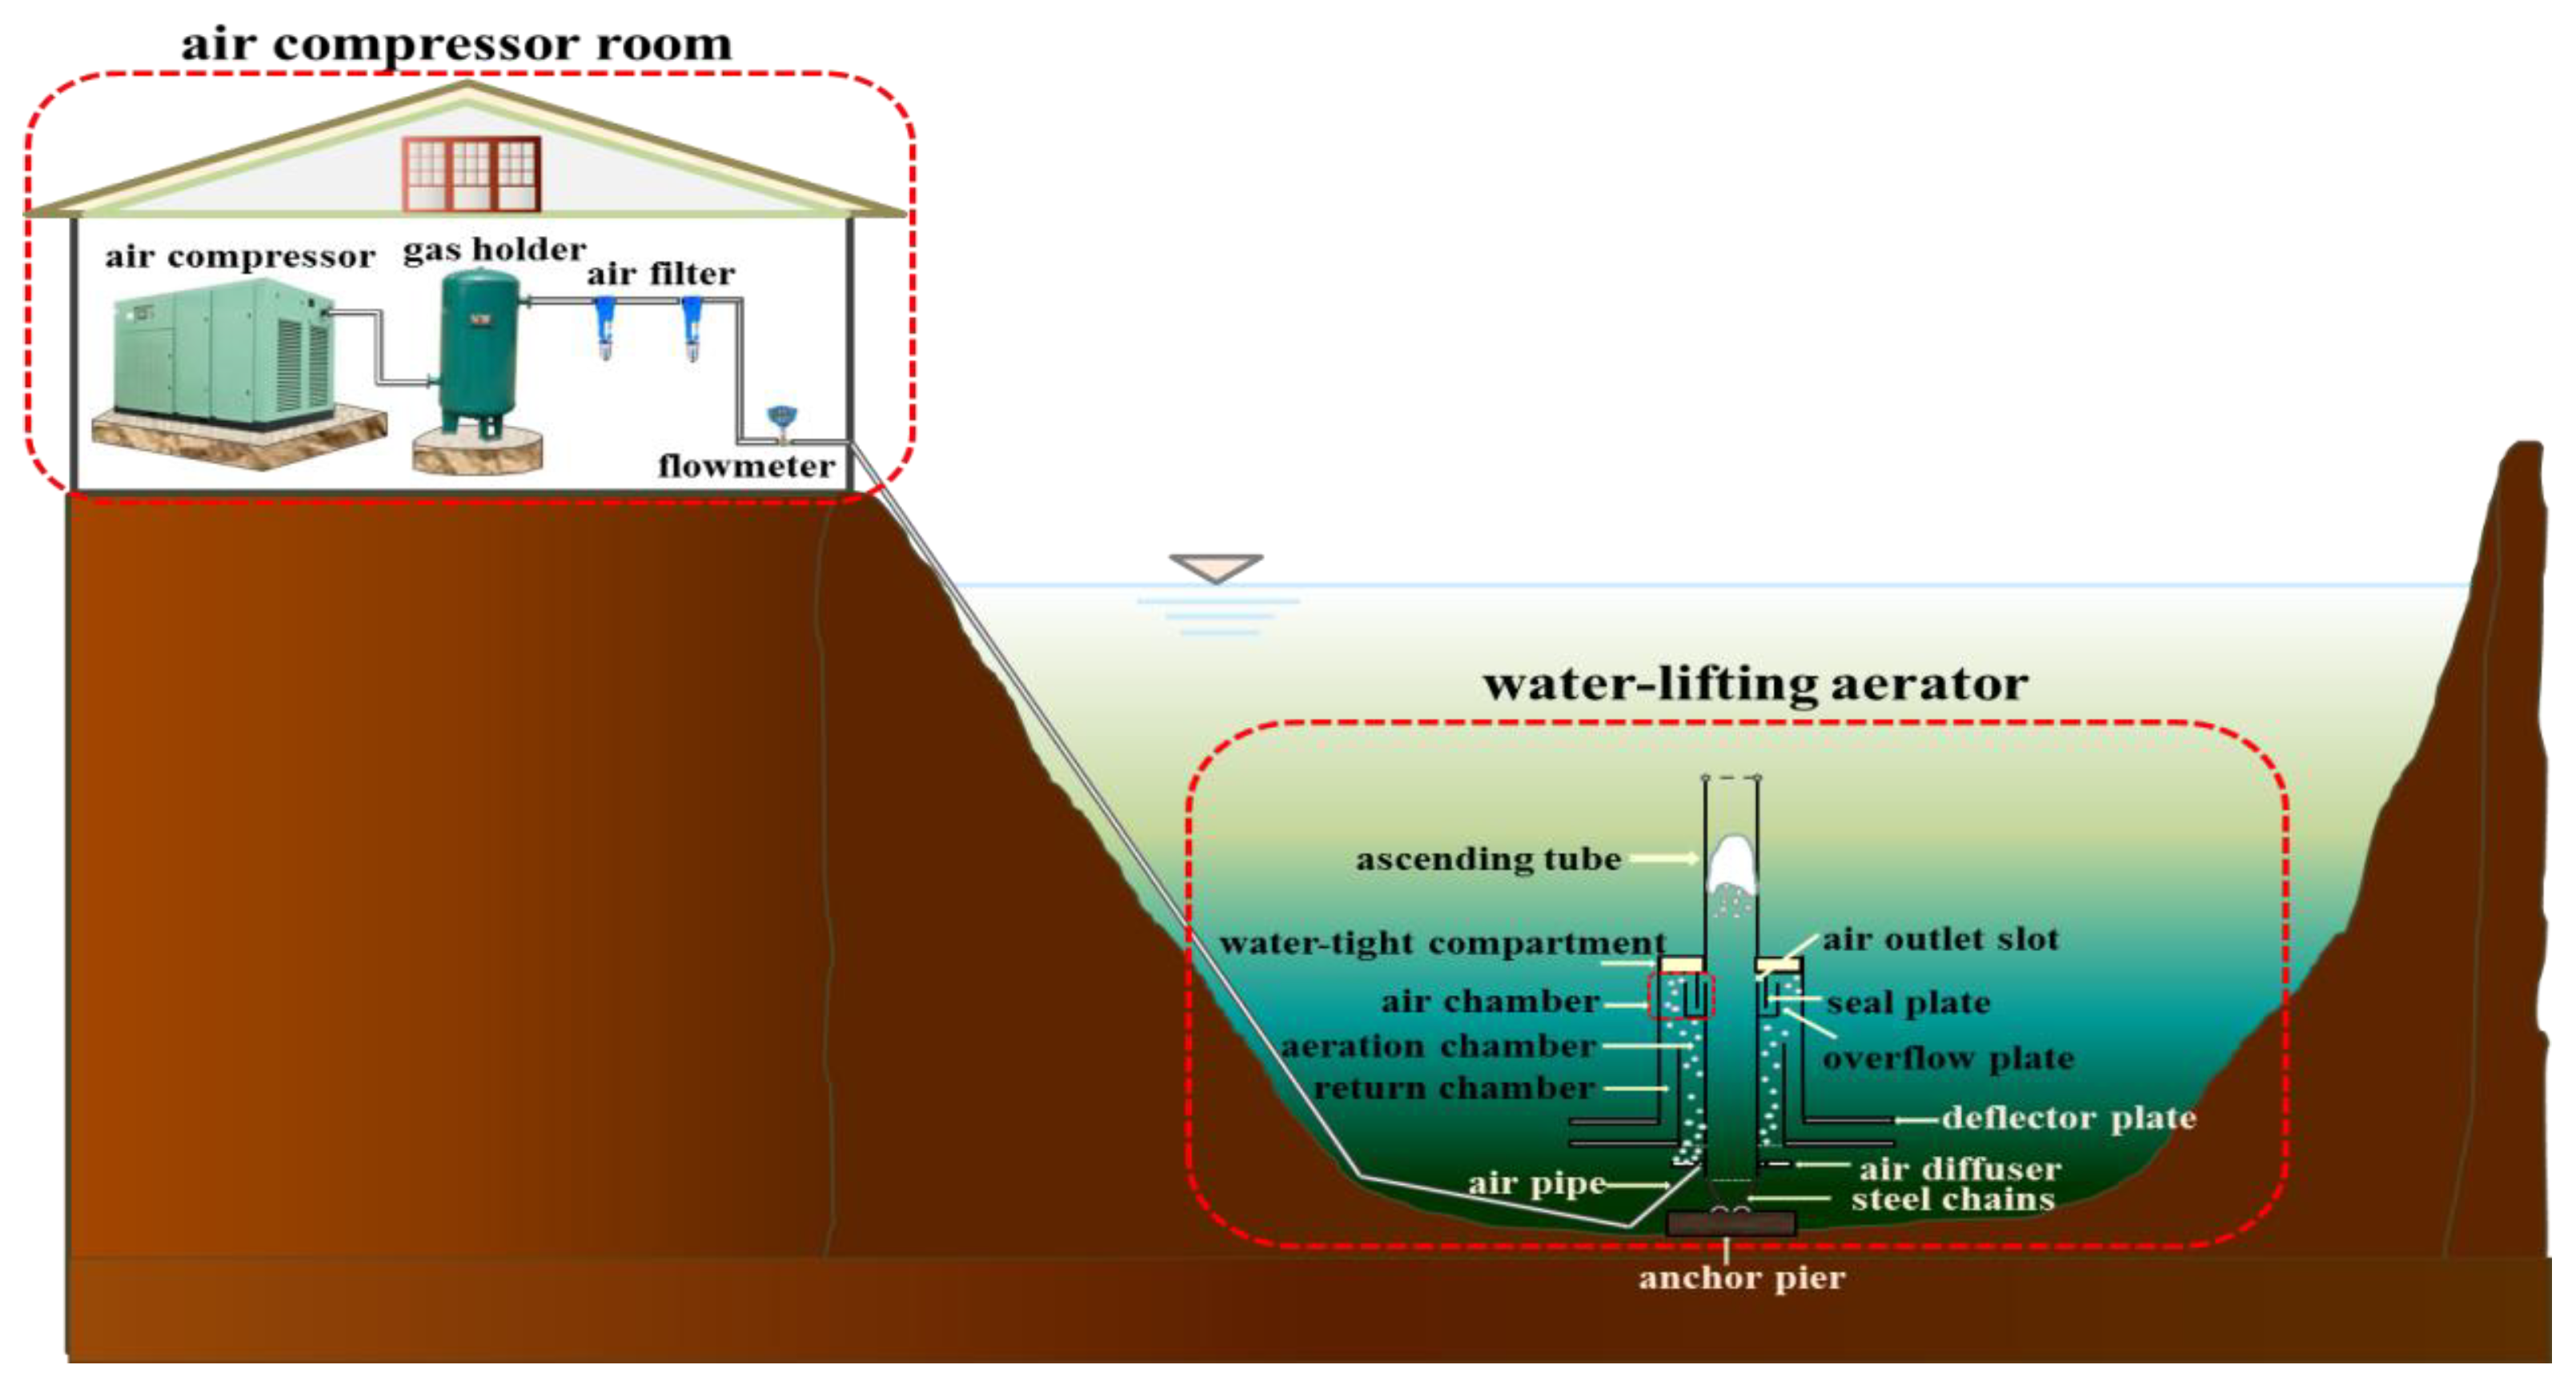
The water-lifting aerator (WLA) [11] is an in situ water quality improvement technology developed by our group [12] in China, which functions by artificially mixing and oxygenating deep water bodies in reservoirs [13]. The layout of the WLA system is shown in Figure 1. The WLA system is composed of an air compressor room, air conveying pipe, and a WLA [14]. The WLA is the core component of the WLA system, consisting of an ascending tube; watertight compartment; air, aeration, and return chambers; air diffuser; deflector plate; air inlet pipe; steel chain; and anchor pier. The WLA is suspended vertically in the reservoir by the buoyancy of the watertight component and is fixed to the concrete anchor pier sunk at the bottom of the reservoir by steel chains. When the WLA system is started, compressed air bubbles released by the air diffuser rise and gradually gather in the air chamber, oxygenating the water in the aeration chamber. The oxygenated water in the aeration chamber then flows back to the deep water through the deflector plate. When the air chamber is full of air, the air piston is released, and the deep water is lifted to the surface layer of the reservoir. To control algal overgrowth and eutrophication, algae are transported from the shallow to the deep water zone by mixing, where the temperature and dissolved oxygen concentrations are lower. To increase the dissolved oxygen content and decrease the release of pollutants in the sediment, oxygenated water is transported to the bottom water by mixing. The WLA system has the functions of water-lifting [15] and deep water aeration, which improve pollution control efficiency and water quality in reservoirs. The WLA system has been used in many drinking water supply reservoirs, such as the Xi’an Jin Pen, Yan’an Hong Zhuang, and Shan Dong Zhoucun Reservoirs, showing the system’s ability to limit eutrophication and improve water quality.
In recent years, the water-lifting performance of the WLA system has been analyzed through experimental and numerical simulations. Cong et al. [16] derived simplified momentum differential equations of the air piston in the acceleration and deceleration sections of the ascending tube using theoretical analysis and verified them using a scaled experiment test. Zhu [17] performed a 2D numerical simulation of a WLA flow field using a single-phase flow model. Additionally, the influence of different water temperature stratification and depth on the mixing of the reservoir was discussed by Wang [18]. Sun et al. [19,20] optimized the outflow structure of a WLA by analyzing the flow outside the aerator, core algae inhibition zones, and algae mixing. Zhang et al. [21] optimized the installation height of the WLAs by simulating the velocity variation of the ascending tube using the VOF method. These studies on WLA water-lifting performance have mainly focused on the mixing process in the reservoir outside the WLA. However, the internal flow details, including the process of the air piston formation and release inside the WLA, remain limited.
Furthermore, the fine bubble diffuser plays a vital role in the WLA oxygenation performance. Many studies have been conducted on fine bubble diffuser oxygenation [22], which has become an essential method for domestic sewage treatment [23] and river management owing to its strong oxygenation performance and low energy consumption [24]. Researchers have also investigated the effects of bubble size distribution [25], aeration density [26], ventilation [27], pulse oxygenation [28], and micro-porous diffuser shape [29] on the oxygenation performance of fine bubble diffusers through experiments and numerical calculations. These studies mainly focused on fine bubble diffusers used in sewage treatment and river management, while numerical research on the oxygenation performance of WLA systems has seldom been conducted. To study the water-lifting and oxygenation performances of the WLA system, the internal flow must be thoroughly analyzed. As it is challenging to conduct in situ measurements when the WLA system is in operation, theoretical analysis and single-phase flow numerical simulation cannot reveal the flow details inside the WLA. Accurate flow analysis is crucial for studying the complex flow in air piston formation and release. Hence, these problems must be addressed using the volume of fluid (VOF) numerical simulation method. The VOF model [30] is a widely used method in two-phase flow research [31]. Numerous studies based on the VOF have focused on microbubbles [32], small bubbles [33], and medium-sized bubbles [34,35], but few have investigated large-scale bubbles. Furthermore, information regarding the details of the air piston formation process in the WLA is lacking. Therefore, we used the VOF method to simulate air piston formation and release. In this study, the flow characteristics of the fluid inside the WLA and the influences of air release rate and air chamber volume on the water-lifting and oxygenation performances of the WLA were analyzed, which demonstrated the internal flow mechanism of the WLA and provided optimized methods for the WLA system.
2. Numerical Simulation Methods
2.1. VOF Method
The VOF method used in this study is effective in capturing and tracking air–water interfaces [36] in the flow field, which is a critical characteristic of air piston formation and flow release in the WLA. In the VOF method, different phases share a standard set of control equations, and interface tracking is achieved by solving the volume fraction function . Each phase has a partial volume , which is a fraction of the cell element volume (), defined by its local volume fraction [37]:
with
There were two phases in this study, with the subscripts and representing the gas (air) and liquid (water) phases, respectively. The volume fraction traces the interface between the gas and liquid by calculating the volume fractions and in each grid. When , the calculation area is full of the liquid phase; when , the calculation area is full of the gas phase; when , the computational region is the two-phase interface, and any grid in it satisfies .
The volume fraction equation is calculated as follows:
where and denote the volume-weighted average density and kinetic viscosity, respectively. The mixture density and viscosity are assumed to vary linearly with the volume fraction of each phase as follows:
The continuity and momentum equations are expressed as follows:
where represents the velocity vector of the flow; represents time; represents pressure; represents gravitational acceleration; and represents the surface force per unit of interfacial area calculated at the fluid interface in the control volume. The continuous surface force model [38] defines surface tension as a volumetric force acting on the fluid within the grid cells of the phase interface region and is expressed as follows:
where is the fluid surface tension coefficient; is the curvature of the interface; is the volume fraction defined at the center of the grid; and is the normal interfacial vector.
2.2. Computational Model and Boundary Condition
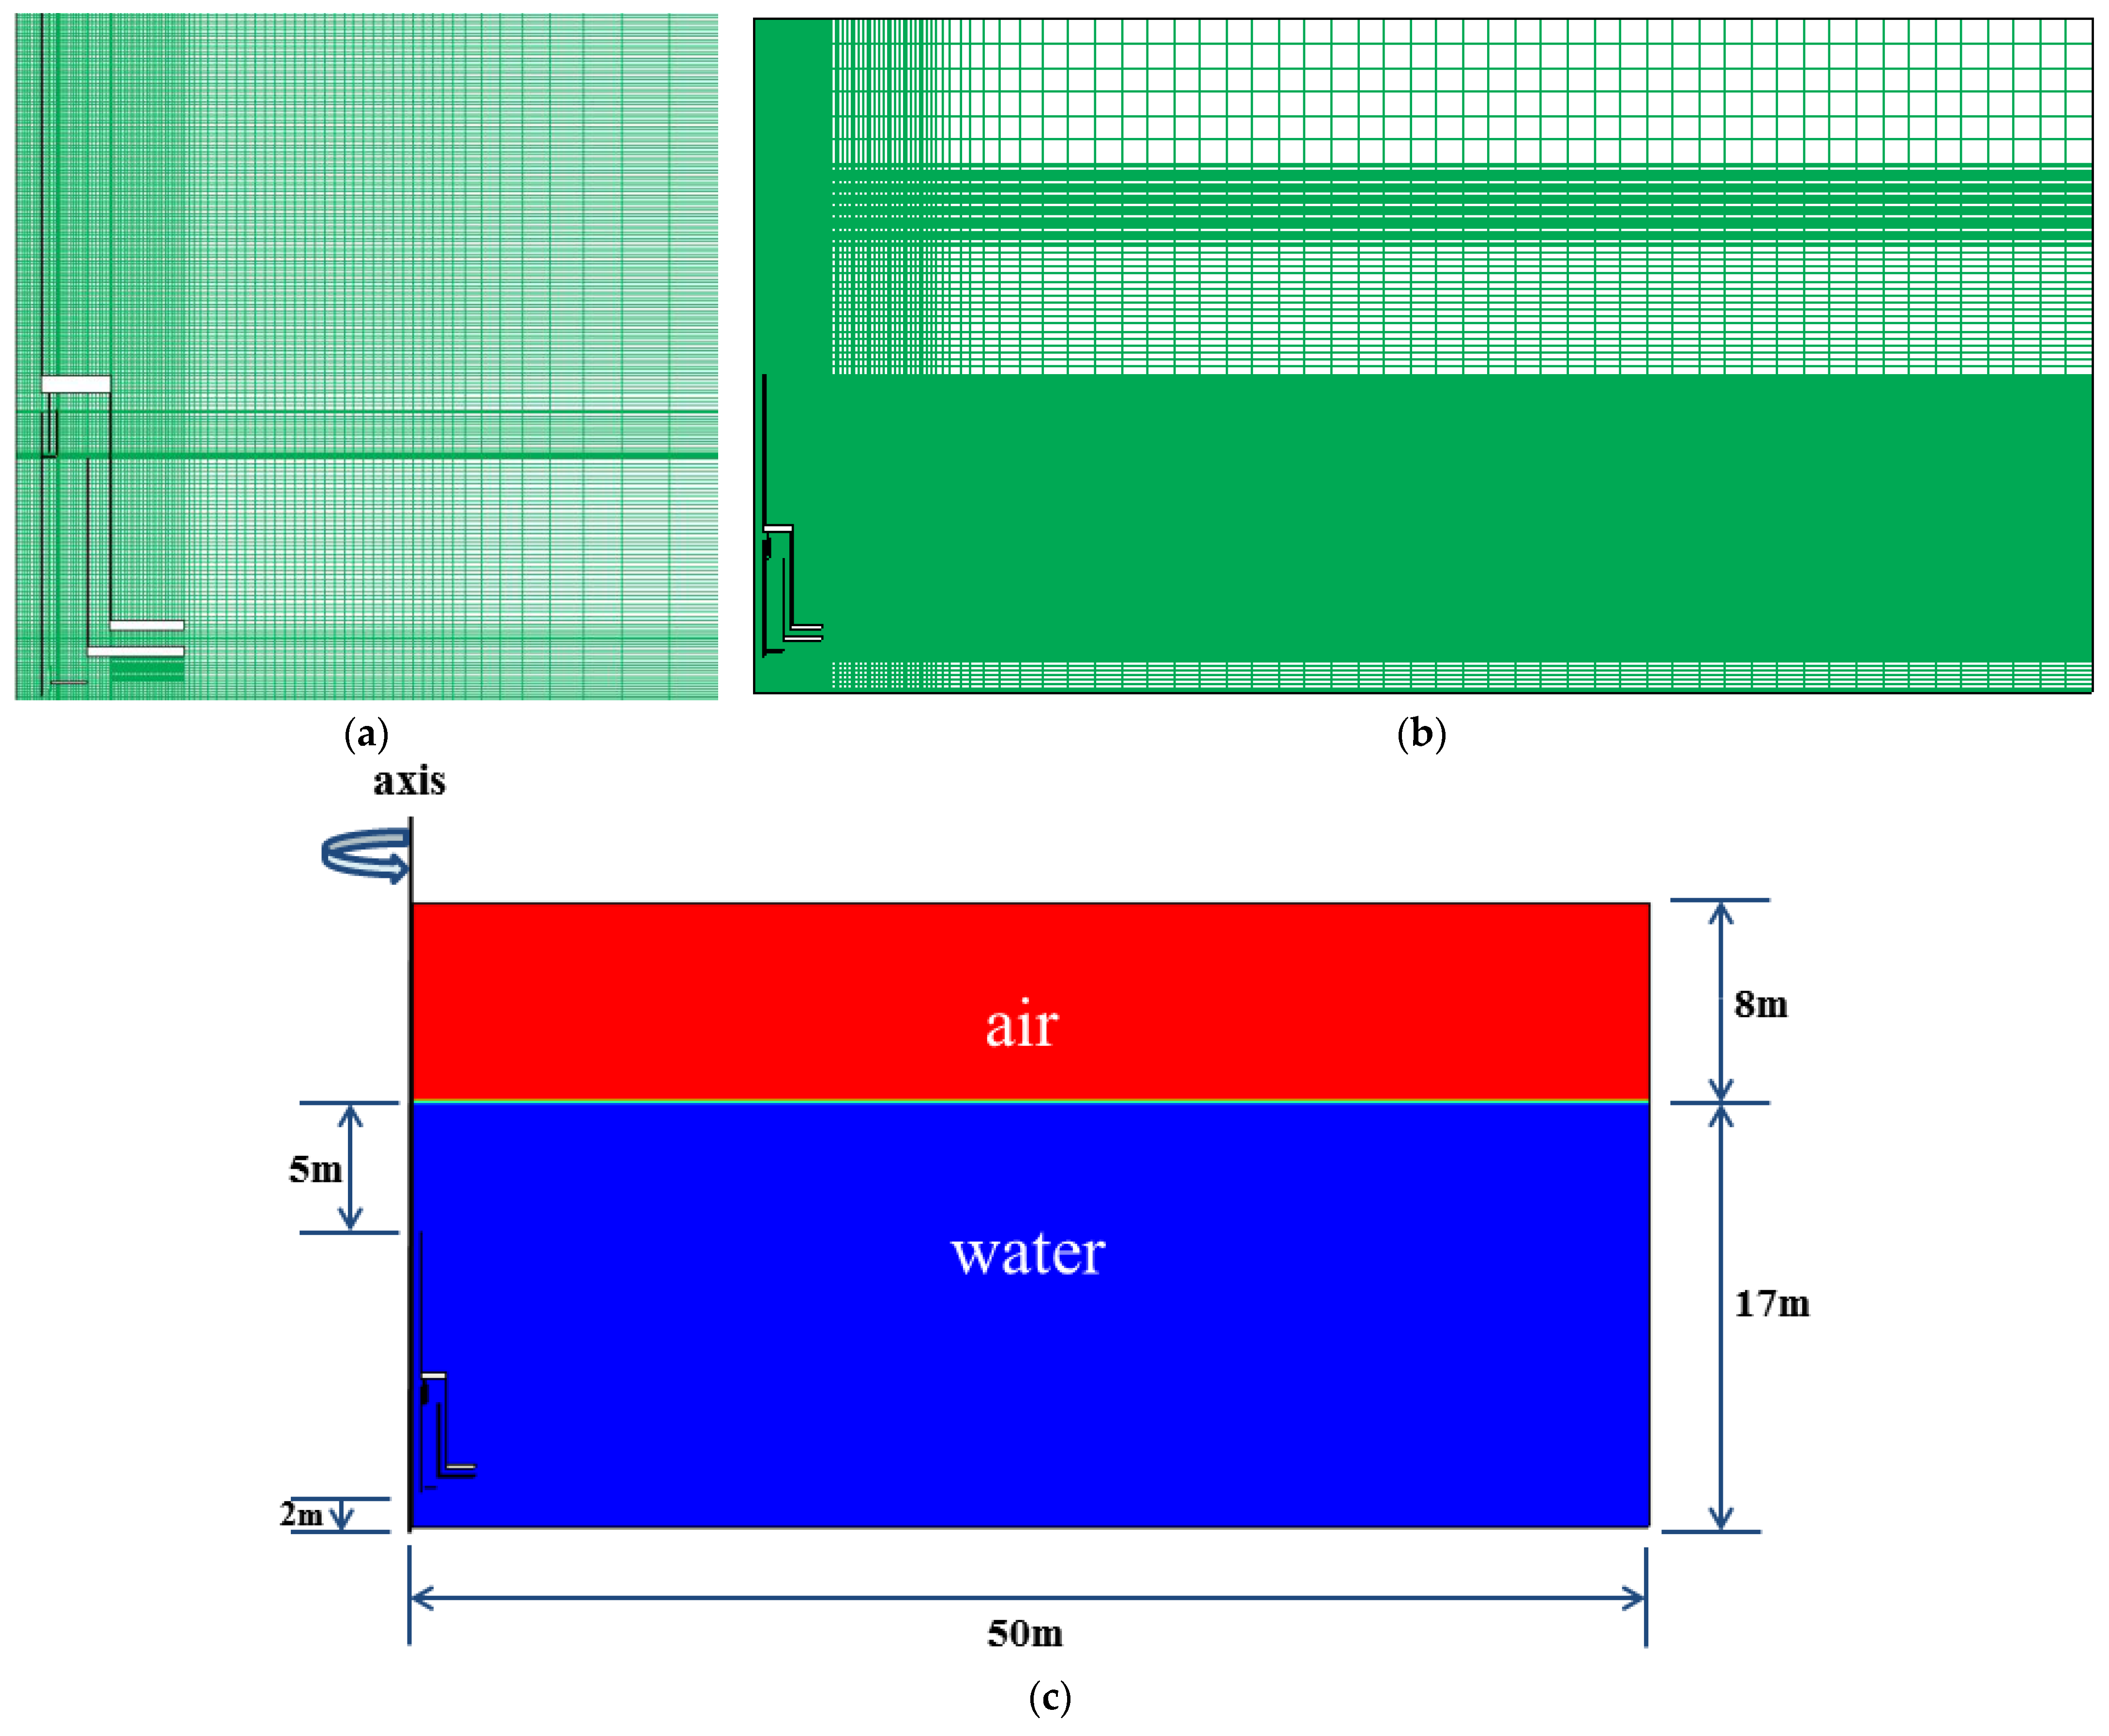
In this study, a simplified calculation model was established based on the WLA system in the Zhoucun Reservoir, as shown in Figure 2. Both the internal and external flows of the aerator were simulated using a 2D axisymmetric swirl model [39].
The investigated reservoir was simplified into a cylindrical computational domain with a radius of 50 m and a height of 25 m. The height of the WLA was 10 m, the distance between the lower end of the ascending tube and the domain bottom was 2 m, the radius of the ascending tube was 0.4 m, and the ascending tube was submerged to a depth of 5 m below the free surface. To simulate the flow details of the air piston inside the WLA, the quadrilateral structured grid was locally refined inside the WLA, and the total number of grids was 4.4 × 10⁴. Figure 2a,b show the local grids and global flow field grid, respectively. The air diffuser was defined as the inlet boundary condition, the upper boundary of the computational domain as the outlet boundary condition, the left side of the domain as the symmetry boundary condition, and the other solid walls as the no-slip wall condition.
The gas and liquid phase regions at the initial time were specified by flow field initialization, as shown in Figure 2c, with the 8 m gas region above the free surface and the 17 m water region below the free surface. The distribution of the gas and liquid phases is represented by the gas–liquid volume fraction, where the red and blue areas represent the gas and liquid phases, respectively.
The standard turbulence model [40] was used to simulate the turbulent flow. The convective terms of the momentum and turbulent equations were discretized using a second-order upwind scheme. A pressure-based implicit solver was applied to solve unsteady equations. The pressure discretization scheme used was PRESTO!, which is well suited for the steep pressure gradients involved in rotating flows and provides improved pressure interpolation in situations where large body forces or strong pressure variations are present, as in swirling flows. The velocity field was calculated using the pressure–velocity coupling method in the PISO format. The volume–fraction equation was solved in an explicit time format.
As shown in Table 1, seven working conditions, including five different air release rates and three different air chamber volumes, were simulated to study the influence of air release rate and air chamber volume on the WLA performance.
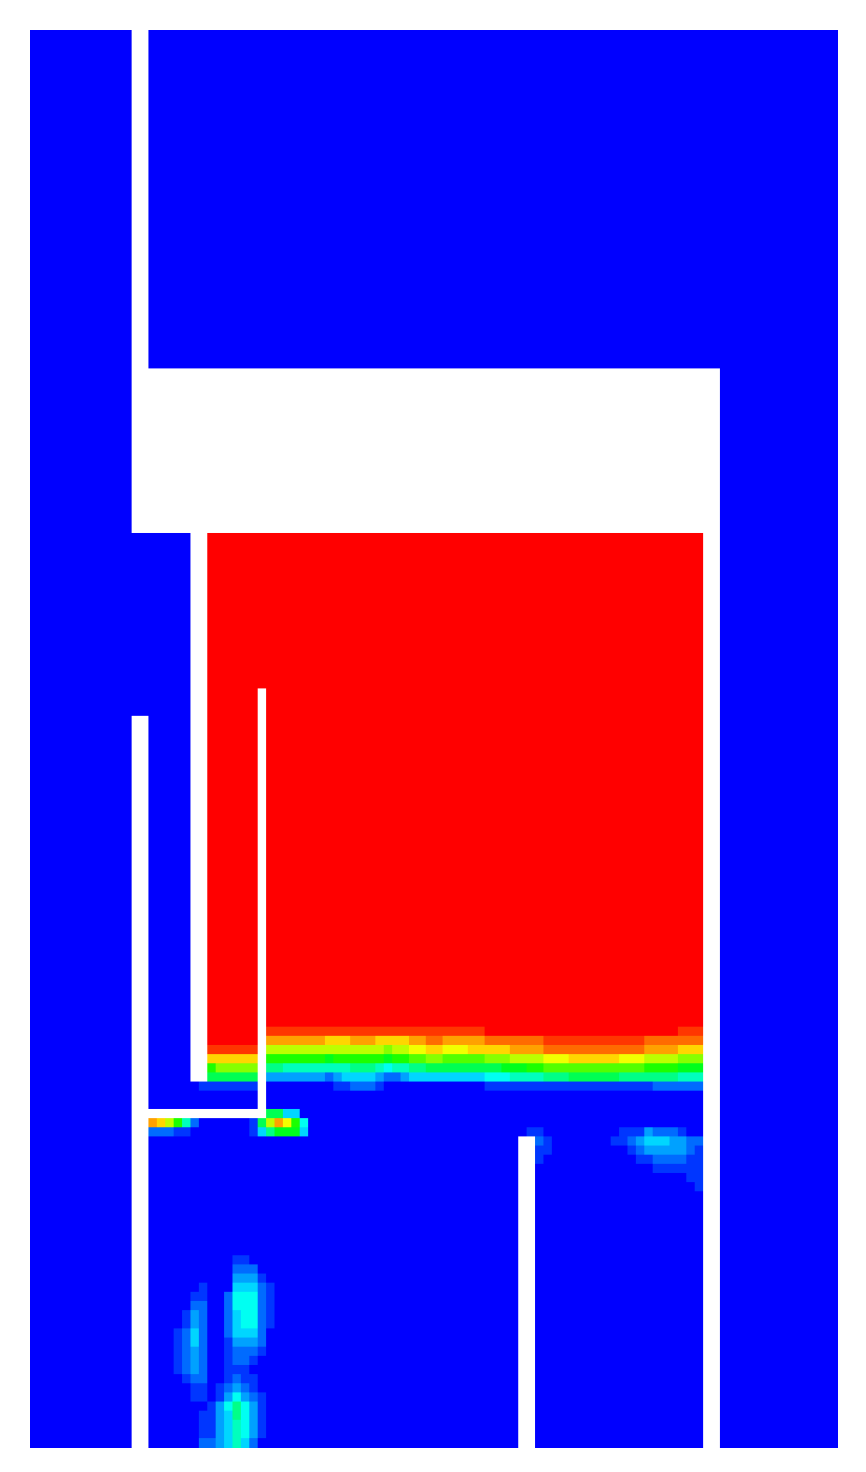
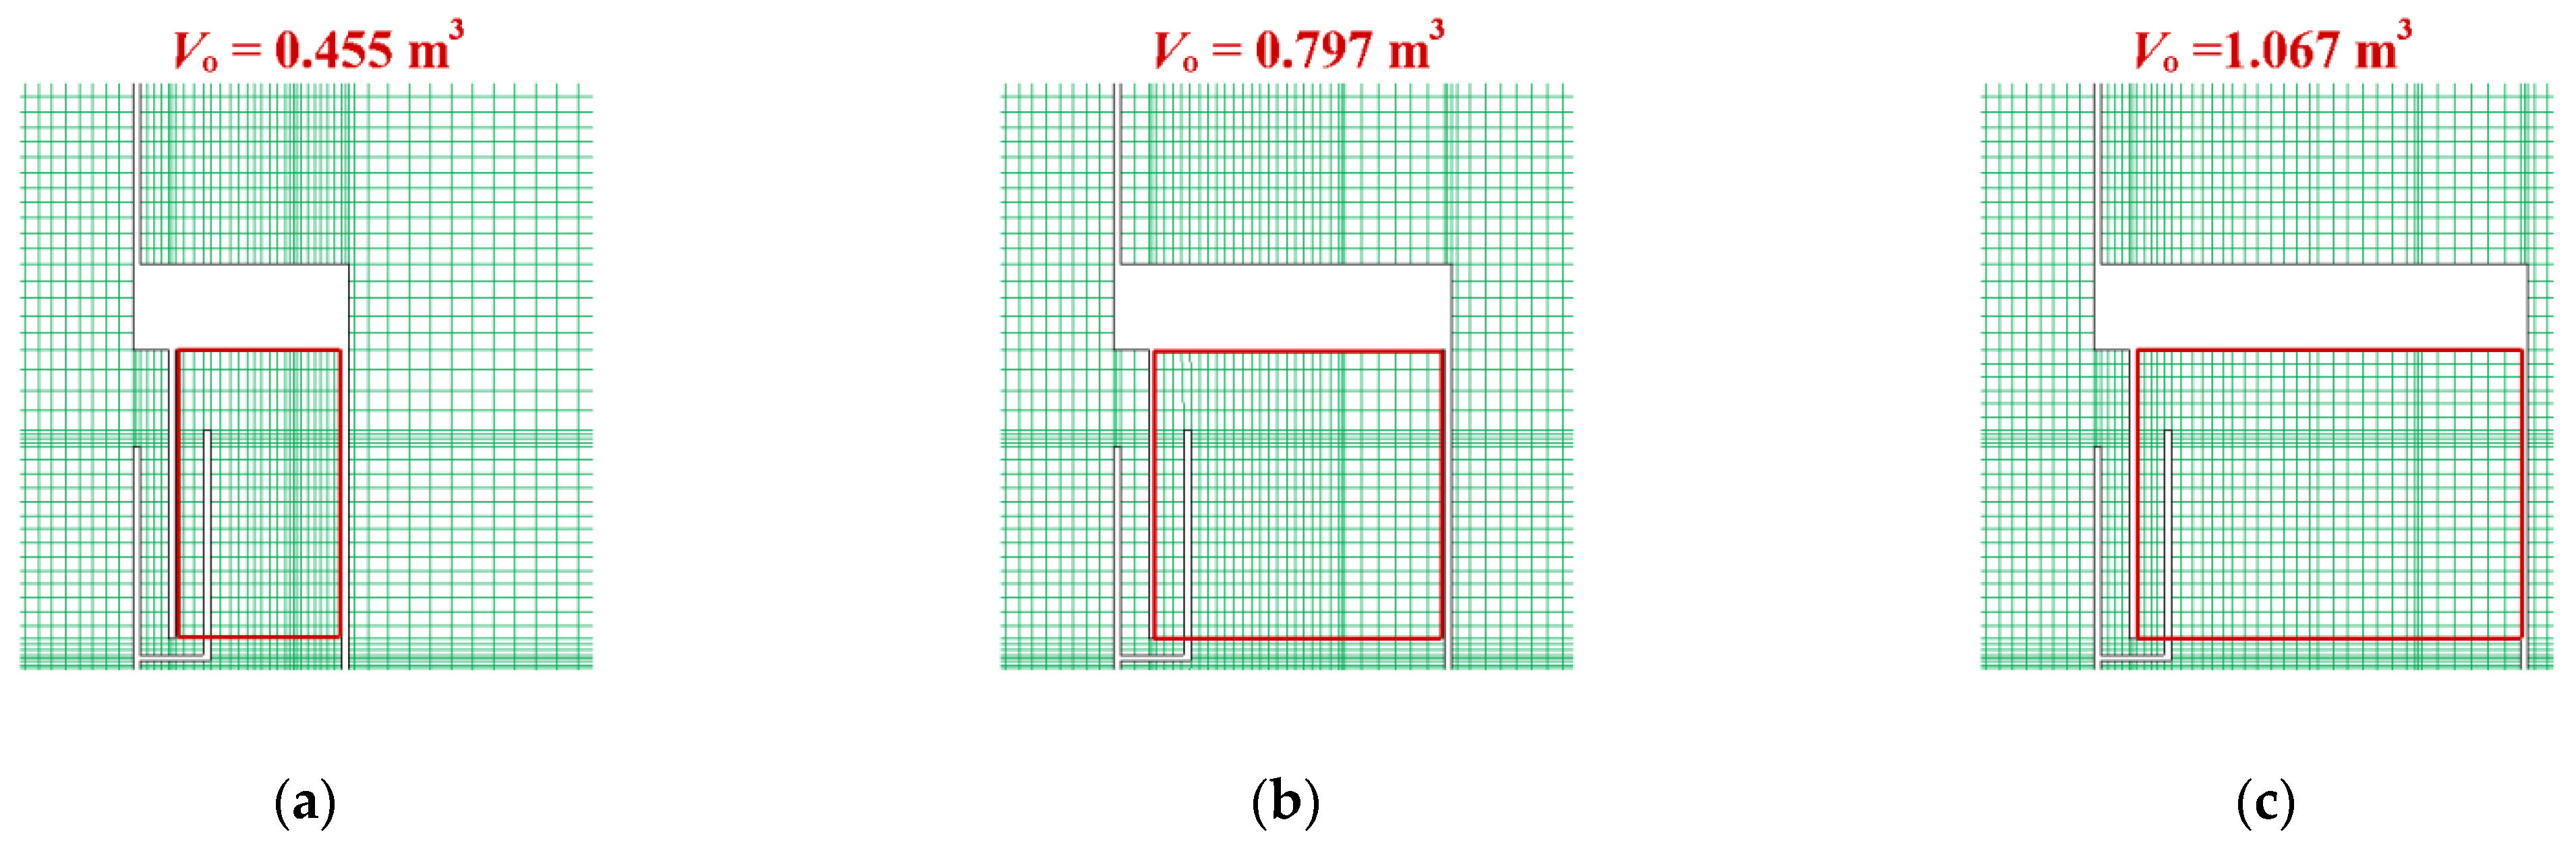
An air chamber full of air is shown by the gas–liquid volume fraction in Figure 3. In this figure, the air volume is equal to the maximum air chamber volume, which is defined as the air chamber volume. The width and height are the two critical sizes of the air chamber. The three computational models are Chamber_1, Chamber_2, and Chamber_3, and the air chamber volume changes with width and volume (in this case, the values are 0.455, 0.797, and 1.067 m3, respectively). To ensure comparability, the computing meshes of the three models used the same topology structure and mesh point distribution, as shown in Figure 4.
2.3. WLA Performance Indices
In this study, the air release rate was used to characterize the air release rate of the air diffuser. The product of the air release rate and the outlet area of the air diffuser is the gas supply per unit time , which is expressed as follows:
The area-averaged velocity of the ascending tube outlet was obtained by averaging the rate at each point of the ascending tube outlet. The product of and the ascending tube outlet cross-sectional area is the water-lifting volume per unit time, which is defined as and expressed as follows:
The ascending tube outlet velocity has an apparent periodicity, and both and change with time. To measure the time-averaged water-lifting performance, the time-averaged water-lifting volume , which is an essential index of the WLA water-lifting performance, is defined as follows:
In the subsequent analysis, the time-averaged velocity of the ascending tube outlet was used to characterize the WLA water-lifting performance. The larger the , the stronger the water-lifting performance. is expressed as follows:
The area-averaged velocity of the deflector plate outlet was obtained by averaging the rate at each point of the deflector plate outlet. The product of and the deflector plate outlet area is the volume of oxygenated water transferred to the deep water body through the deflector plate per unit of time, which is defined as and expressed as follows:
The flow at the outlet of the deflector plate was also unsteady; both and varied with time. The average volume of oxygenated water returned to the deep water body per unit time is an important index for measuring the WLA oxygenation performance in the deep water body, which is defined as and expressed as follows:
In the following discussion, the time-averaged velocity of the deflector plate outlet, , was used to characterize the WLA oxygenation performance. When was larger, more oxygenated water was delivered to the deep water body per unit time, and the WLA oxygenation performance was more robust. In contrast, when was smaller, the WLA oxygenation performance was weaker. is expressed as follows:
3. Results and Discussion
3.1. Numerical Method Verification
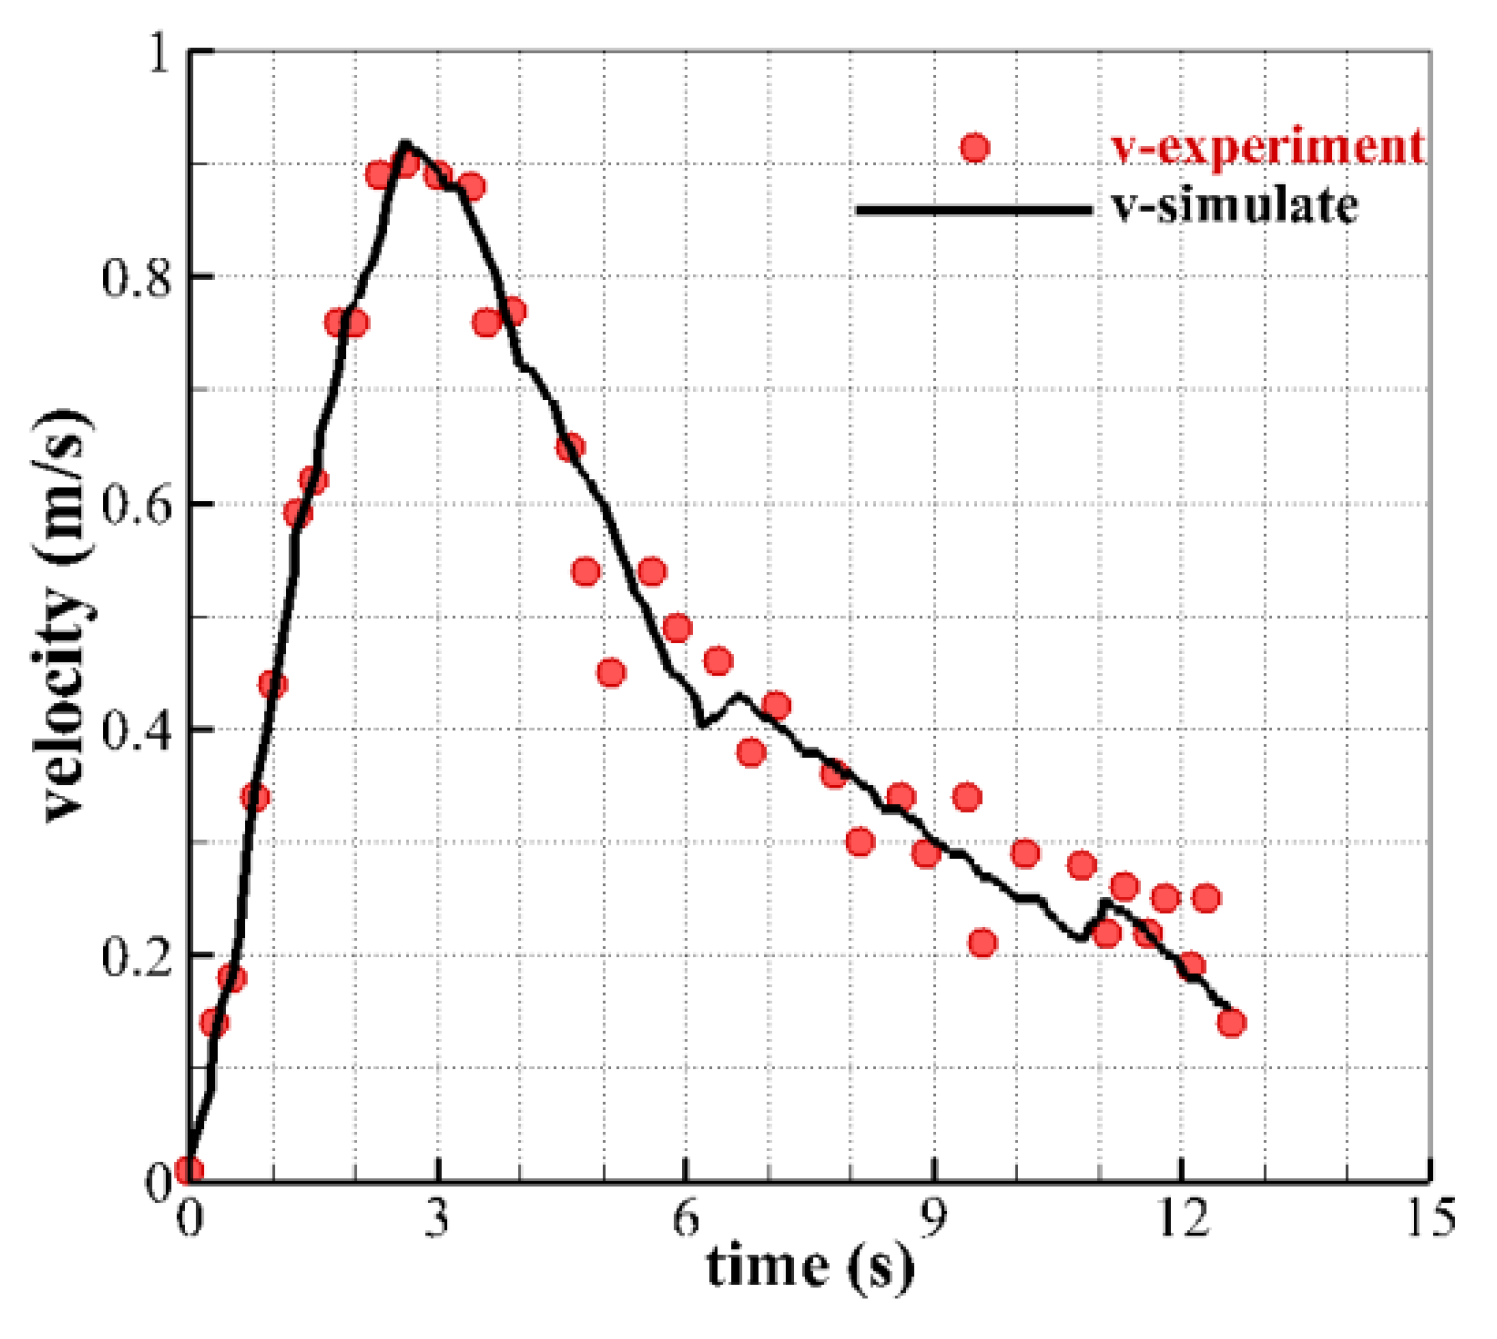
To verify the reliability of the numerical simulation method in this study, the numerical simulation method was compared with the Cong Haibing experiment [16]. The simulation model and boundary conditions were defined the same way as those of the experimental model. The numerical simulation results for the velocity at the ascending tube outlet agreed with the experimental results, as shown in Figure 5, with the mean relative error within 8%, which indicates that the simulation method in this study is reliable.
3.2. Analysis of the Internal Flow of the Water-Lifting Aerator
3.2.1. Analysis of the Air Piston Forming Process
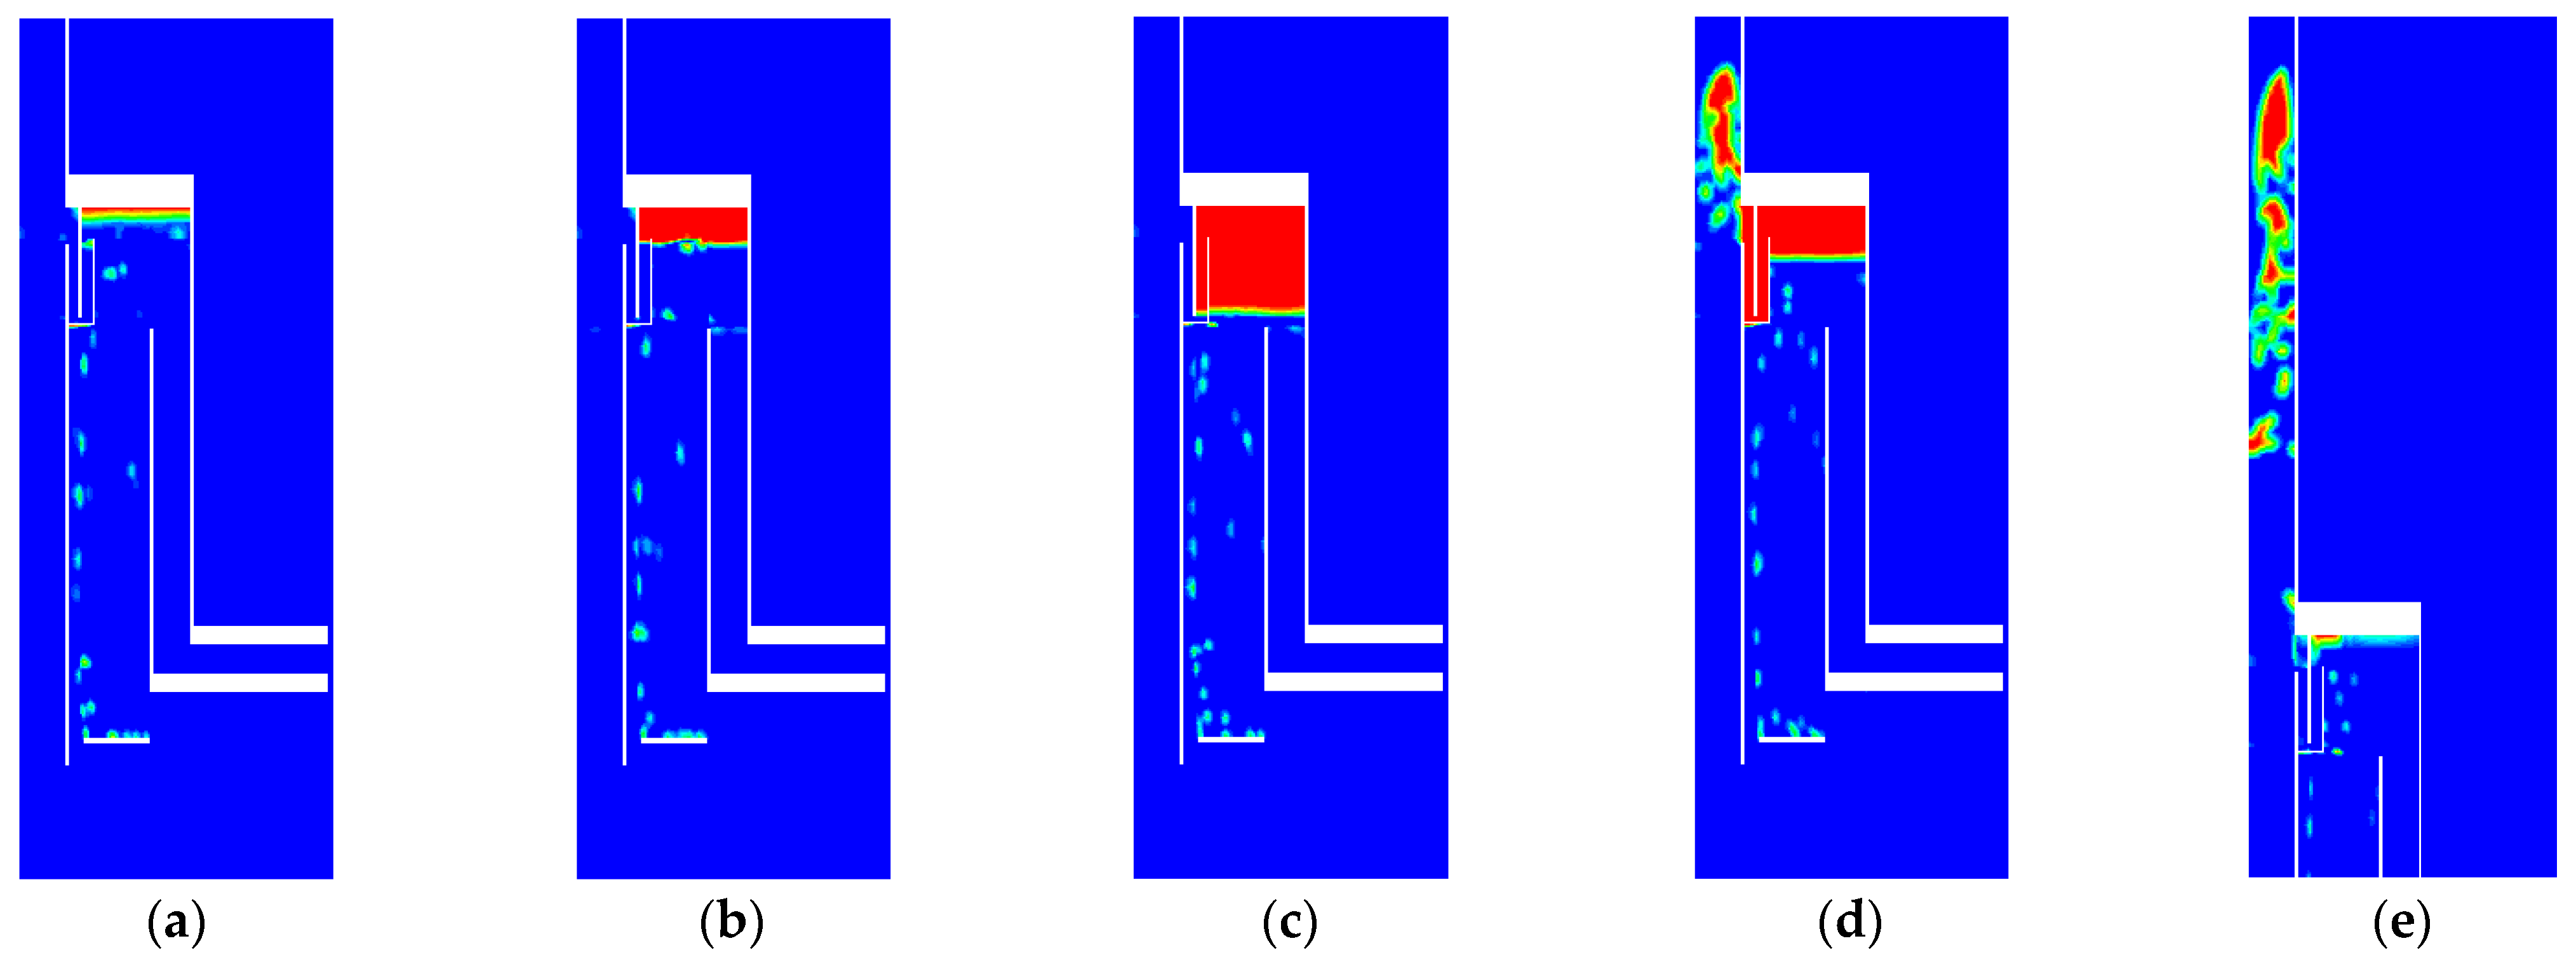
The air piston forming process was analyzed based on Working Condition 1 in Table 1, in which the air chamber volume was 0.797 m3, and the air release rate was 0.1 m/s. Figure 6 shows the different flow stages inside the WLA during different air piston periods. Figure 6a–c show the air bubble collection section, and Figure 6d,e show the generation and release phases of the air piston.
When the WLA was powered on, air bubbles were released from the air diffuser, and they rose through the aeration chamber until most of the air bubbles accumulated in the air chamber. Before the air–water interface dropped to the top edge of the overflow plate, a few air bubbles passed through the air outlet slot and slipped into the ascending tube, as shown in Figure 6a. As the air volume in the air chamber increased, the air–water interface gradually dropped to the top edge of the overflow plate; thus, the water connection between the air chamber and ascending tube was cut off, as shown in Figure 6b. The air bubbles continued to accumulate in the air chamber, and the air–water interface in the air chamber continued to drop. When the air–water interface dropped below the lower edge of the seal plate, the air volume inside the air chamber reached its maximum value, as shown in Figure 6c. After the air–water interface dropped below the lower edge of the seal plate, the force balance of the air volume broke. The buoyancy force difference drove the air in the chamber to exit the seal plate and rapidly pass through the air outlet slot to the ascending tube, as shown in Figure 6d. The air in the air chamber was instantaneously pushed into the ascending tube by the water pressure difference between the two sides. Thus, the air piston formed in the ascending tube and drove the water upward until it was released from the ascending tube outlet into the upper water body, as shown in Figure 6e. Subsequently, air bubbles began to accumulate again in the air chamber, and the flow field underwent the above process.
3.2.2. Velocity Analysis of the WLA Outlet
The WLA possessed two outlets: the ascending tube and deflector plate outlets. To illustrate the water-lifting and bottom water oxygenation effectiveness of the WLA, the area-averaged velocity at the outlet of the ascending tube and deflector plate were analyzed for Working Condition 1.
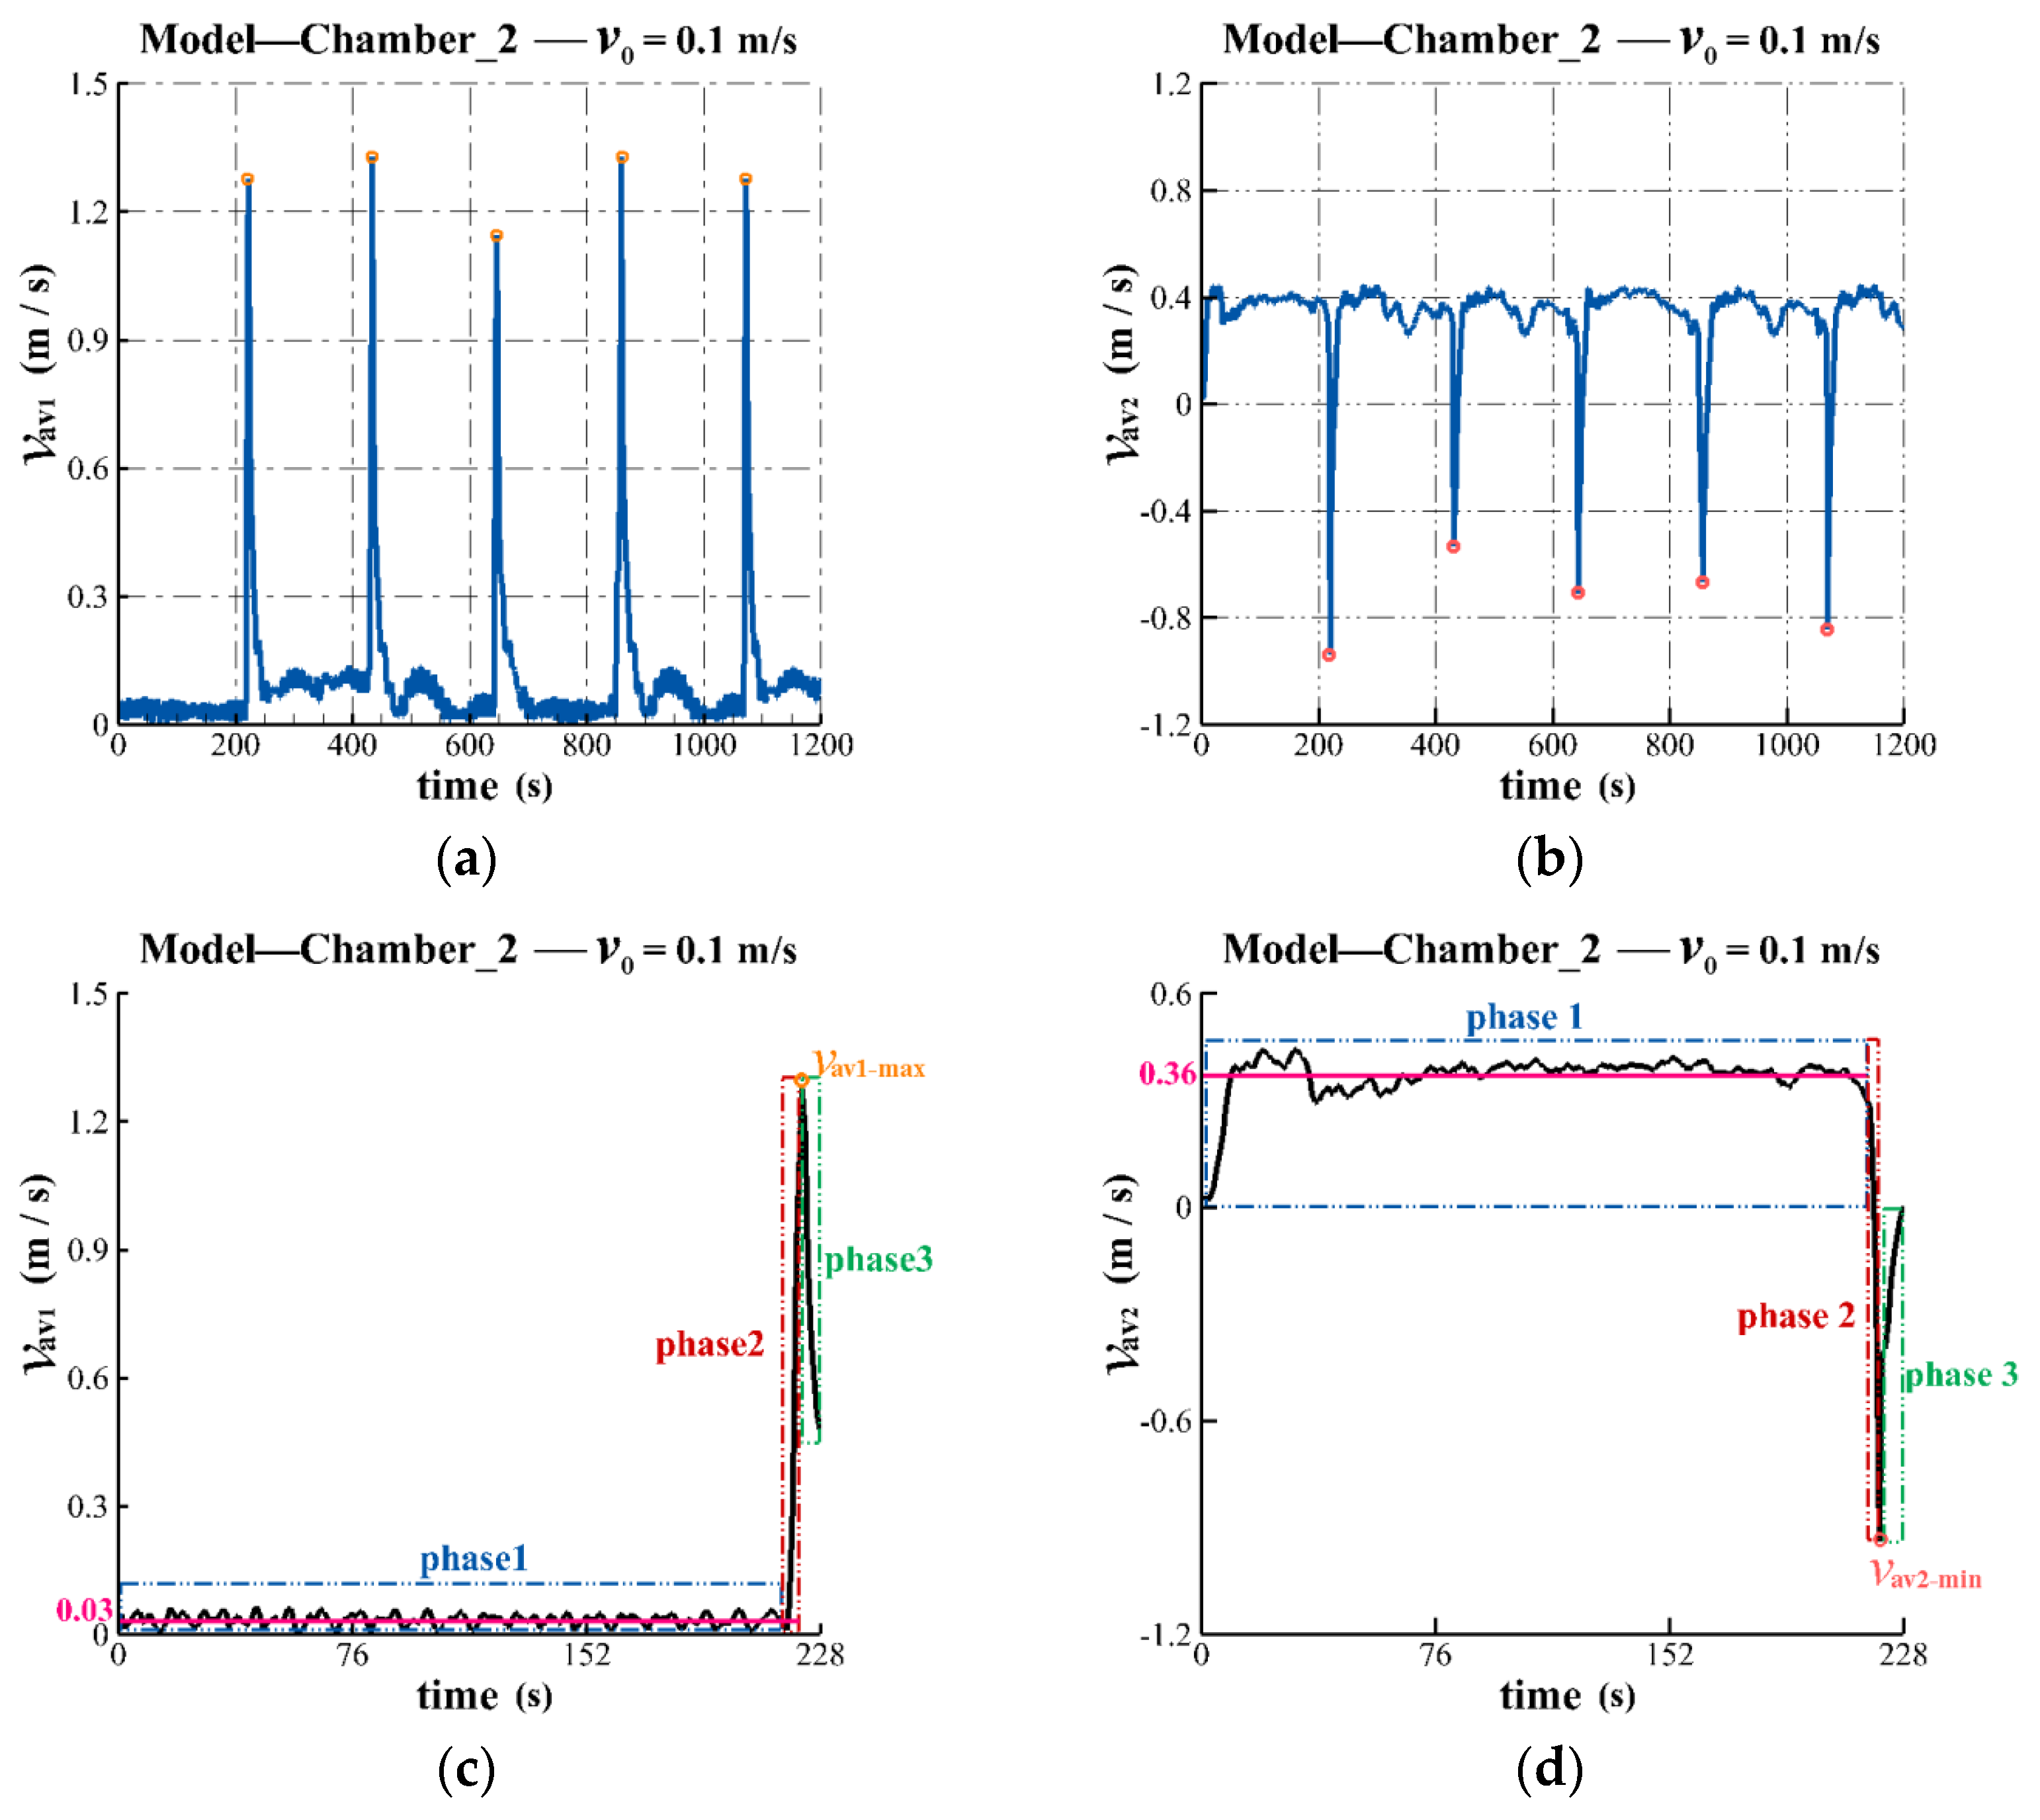
For both the ascending tube outlet and deflector plate outlet velocities, the positive velocity was regarded as outflow, and the negative velocity was regarded as inflow. To analyze the flow characteristic of the two outlets, the area-averaged velocity was calculated from 0 to 1200 s, as shown in Figure 7a,b, where approximately five periods were identified. In each period, the velocity profiles were basically the same, except the velocity peak was slightly different owing to numerical error. To minimize the influence of numerical error and provide better comparability, several velocity quantities were averaged in Section 3.3.
Figure 7c,d show the area-averaged velocities of the two outlets from 0 to 228 s. The flow field simulation showed that the duration of the first period of the air piston motion was approximately 228 s. Detailed research was conducted for the first air piston motion period from 0 to 228 s. The analysis was divided into three phases.
Phase 1: The first phase of the air piston motion period was the air bubble accumulation stage in the air chamber from 0 to 217 s. When the WLA system started, the air bubbles rose to the air chamber continuously, flowed through the air outlet slot, entered the ascending tube, and finally drove the water up to the ascending tube outlet. The velocity of the ascending tube outlet fluctuated at a small value of ~0.03 m/s, as shown in the blue wireframe in Figure 7a, which indicates that the water-lifting performance of the WLA was weak during this period. Meanwhile, the velocity magnitude of the deflector plate outlet increased rapidly and fluctuated at ~0.36 m/s. During this phase, the oxygenated water in the aeration chamber continuously passed through the deflector plate outlet and flowed to the deep water area. The WLA had a strong oxygenation performance in the deep water area during this period, as shown in the blue wireframe in Figure 7b.
Phase 2: The second phase of the air piston motion was the air piston release stage from 217 to 222 s. The air piston formed in the ascending tube accelerated upward, driven by the buoyancy force, moving water up to the ascending tube outlet. When the air piston moved to the ascending tube outlet, the speed reached its maximum . The water-lifting performance was strong during this phase, as shown by the red wireframe in Figure 7a. The water in the aeration and return chambers flowed into the ascending tube quickly, and the water around the deflector plate outlet was immediately sucked into the WLA. The velocity direction at the outlet of the deflector plate changed instantly from outflow to inflow. The velocity of the deflector plate outlet decreased until it reached the minimum negative velocity , which implies that the inflow velocity was at its maximum value. During this stage, the WLA system lost the ability to deliver oxygenated water to the bottom water area, as shown in the red wireframe in Figure 7b.
Phase 3: The third phase of the air piston motion was the flow recovery stage from 222 to 228 s. When the air piston left the ascending tube outlet, the accelerating water-lifting process was complete. The water inside the ascending tube moved upward owing to the inertial force; thus, the outflow velocity gradually decreased to the level of the velocity magnitude before the air piston was released. The water-lifting performance in this phase was progressively reduced to that of the group before the air piston was released, as shown in the green wireframe in Figure 7a. The water in the return chamber gradually stopped flowing into the ascending tube, and the water around the deflector plate outlet gradually stopped flowing inside. In Phase 3, the performance of WLA in delivering oxygenated water to the bottom water slowly increased, as shown in the green wireframe in Figure 7b.
The above analysis was performed in one air piston motion period; at the end of the period, the air bubbles started to accumulate in the air chamber again. The periodic release of the air piston was accompanied by a regular increase and decrease in the velocity at the ascending tube and deflector plate outlets, respectively. As the flow inside the water-lifting aerator satisfied mass conservation, a dynamic equilibrium existed between the velocities of the ascending tube and deflector plate outlets.
During the entire period, the velocity of the ascending tube outlet was positive; therefore, the flow direction of the ascending tube outlet was outward. The bottom water was continuously lifted to the upper water layer by the WLA. From 219 to 227 s, the velocity of the deflector plate outlet was negative; thus, the flow direction of the deflector plate outlet was inward. However, the negative velocity was only sustained for 9 s, and its influence on the overall oxygenation capacity was negligible. In summary, the WLA exhibited water-lifting potential and oxygenation capacity for reservoir water, which can greatly improve the water quality in the reservoir.
3.3. Analysis of Factors Affecting Water-Lifting Performance
3.3.1. Effect of Air Release Rate
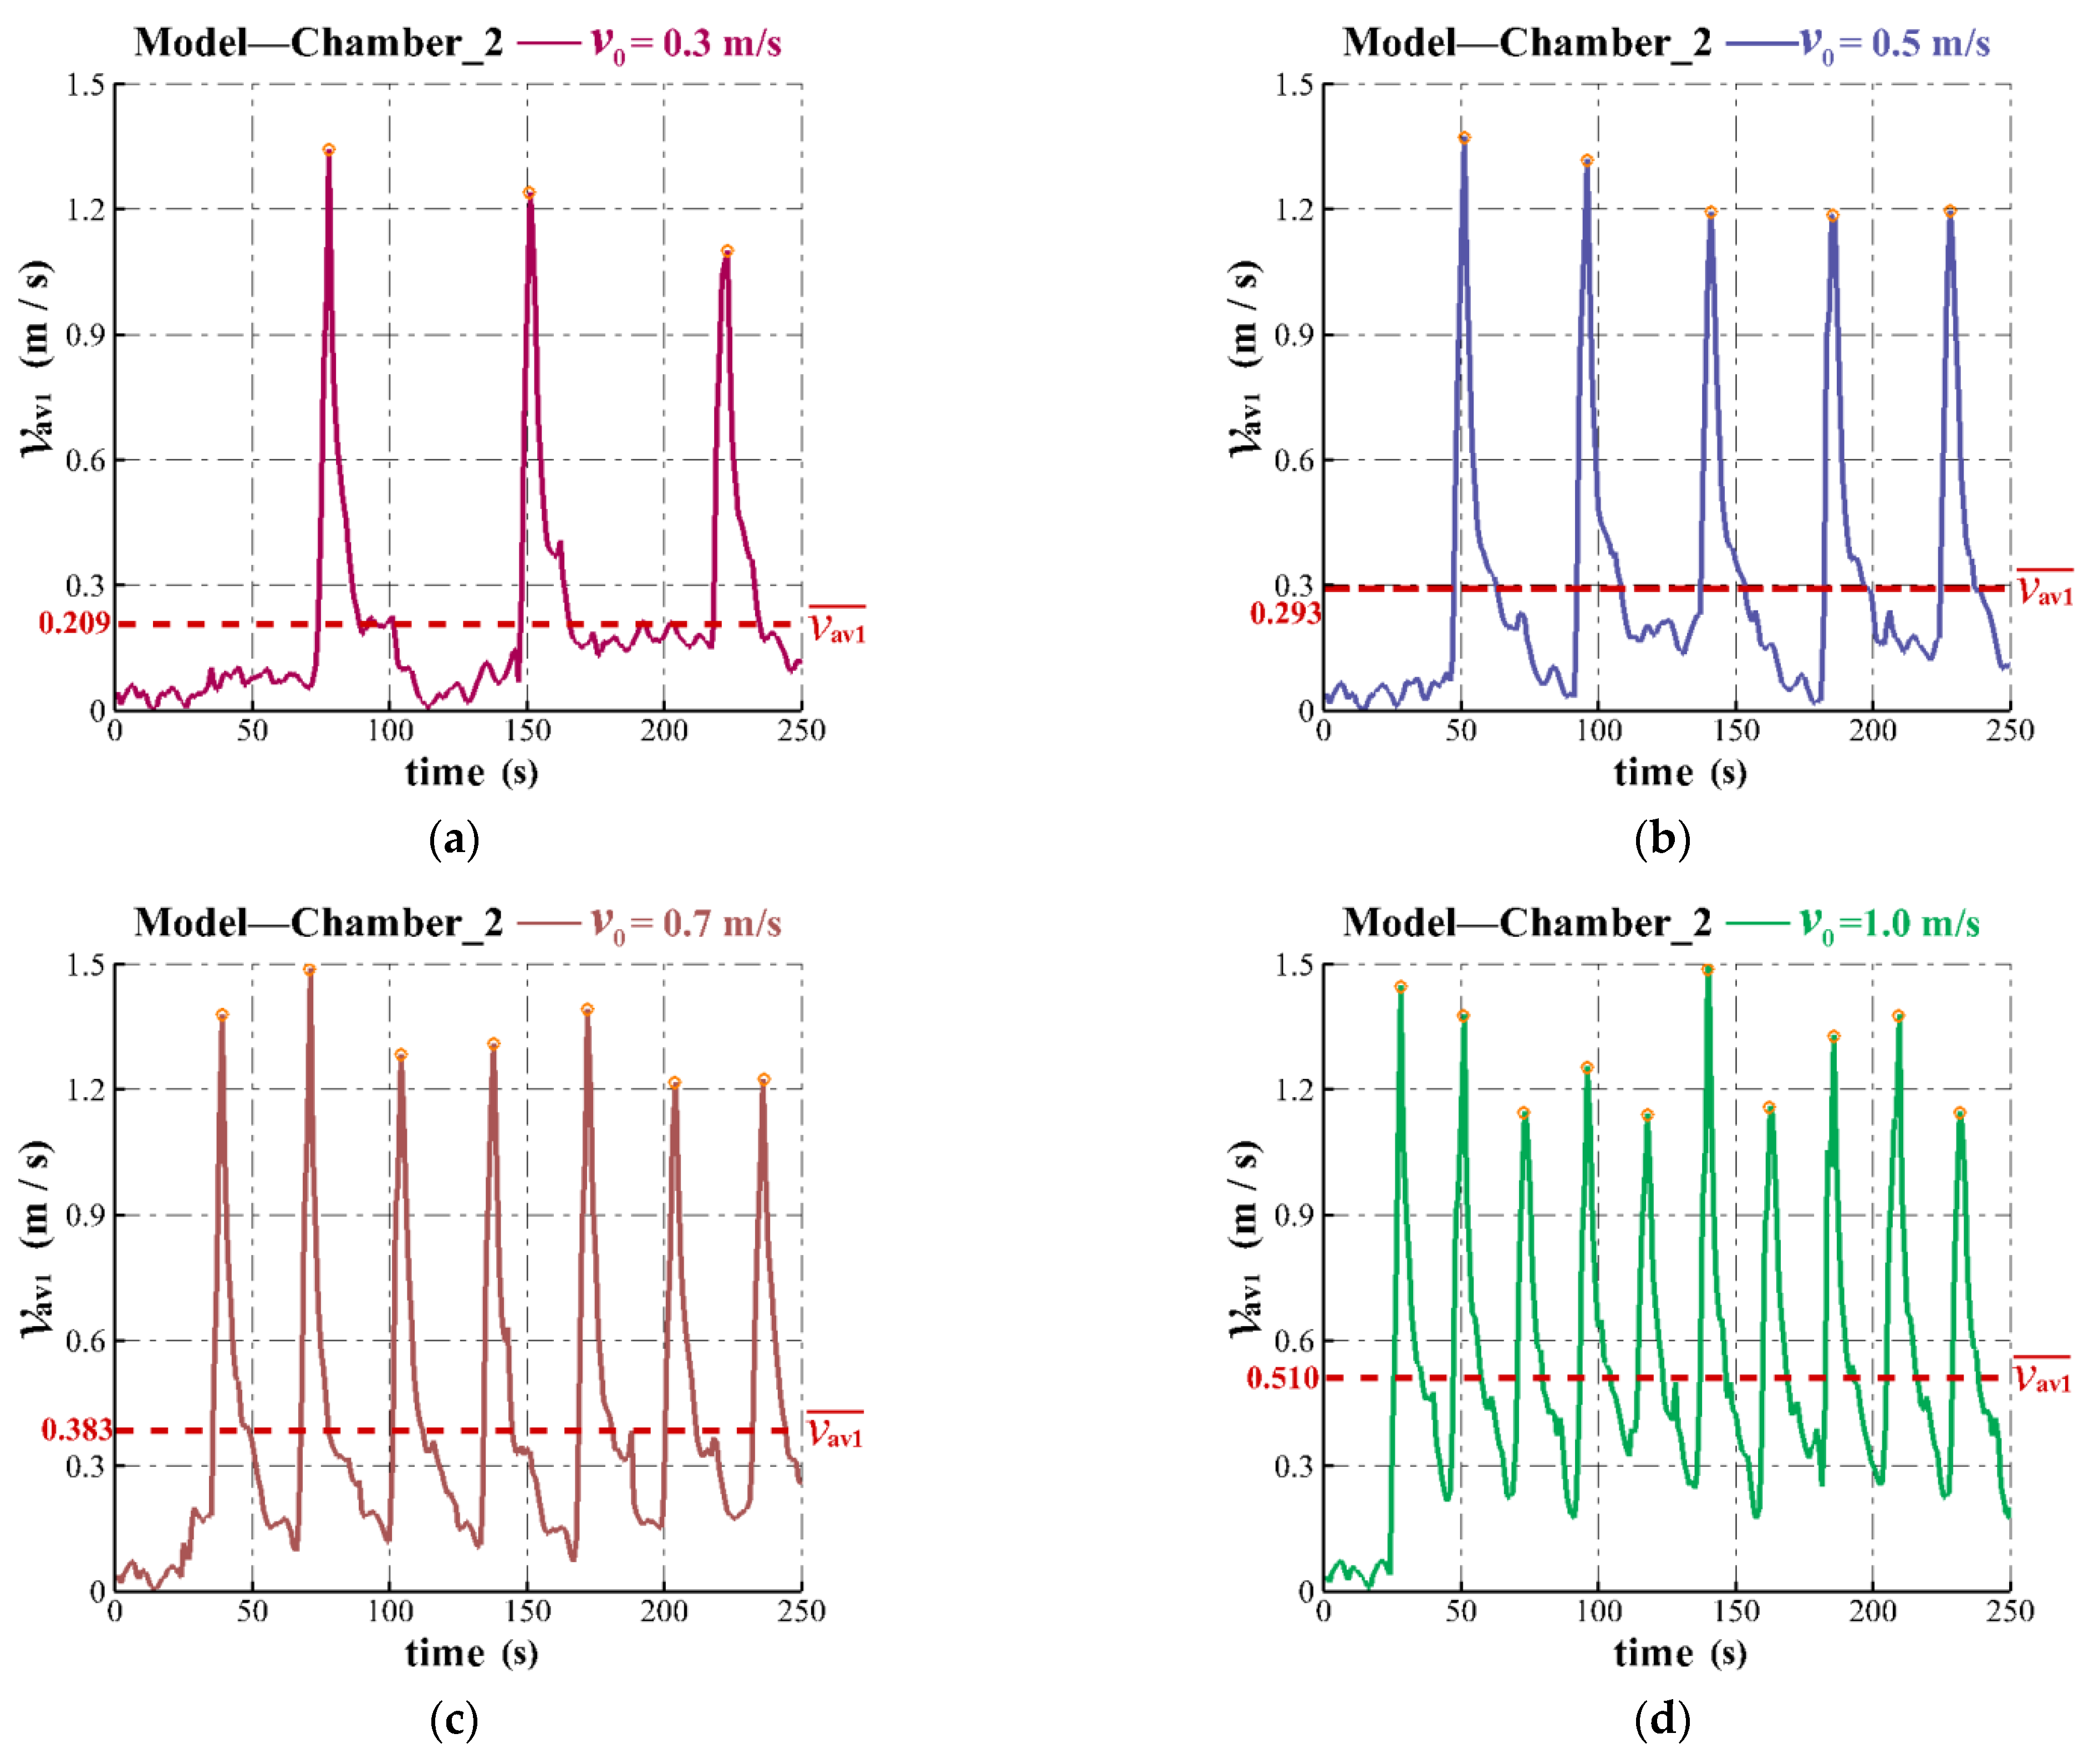
Driven by periodically released air pistons, the water in the WLA flowed out of the ascending tube outlet and then reached the upper water bodies, thus achieving the effect of water-lifting. The computational model Chamber_2 was simulated to analyze the impact of different air release rates on the water-lifting performance of the WLA. The air release rates of Working Conditions 2, 3, 4, and 5 were 0.3, 0.5, 0.7, and 1.0 m/s, respectively, as shown in Table 2. The air piston forming process and the flow pattern in the return chamber under different working conditions were similar to those in Working Condition 1, with the only difference being the magnitude of the flow field quantities, such as the period of air piston motion and the velocity magnitude of the ascending tube outlet.
To analyze the influence of different air release rates on the water-lifting performance, the velocity magnitudes of the ascending tube outlet from 0 to 250 s under Working Conditions 2, 3, 4, and 5 are shown in Figure 8. To qualify the WLA performance under different working conditions, the average air piston motion period and the maximum and time-averaged velocities of the ascending tube outlet were calculated. Therefore, the average air piston period , average maximum velocity of the ascending tube outlet , and time-averaged velocity of the ascending tube outlet were obtained, as shown in Table 2.
As shown in Table 2, Working Conditions 2, 3, 4, and 5 corresponded to air release rates of 0.3, 0.5, 0.7, and 1.0 m/s, respectively, which were converted by several aeration rates used in the WLA system operation. From 0 to 250 s, each working condition had three, five, seven, and ten periods, with average air piston periods of 73, 45, 32, and 23 s, respectively. The increase in the air release rate increased the amount of air bubbles entering the deep water per unit time from the air diffuser; thus, the time required to fill the same air chamber volume was reduced, and the air piston period was shortened.
As the air release rate increased from 0.3 to 1.0 m/s, the average maximum velocity of the ascending tube outlet increased from 1.296 to 1.422 m/s, as shown in Table 2. The time-averaged velocity in the ascending tube outlet increased from 0.209 to 0.510 m/s. Altogether, the increasing air release rate from 0.3 to 1.0 m/s resulted in a faster release of air bubbles from the air diffuser, more gas momentum being transferred to the water, and a larger average maximum velocity of the ascending tube outlet, consequently increasing the water-lifting performance of the WLA.
In conclusion, under the same model conditions, if the air release rate was higher, the time-averaged velocity and average maximum velocity of the ascending tube outlet were also high, and the water-lifting performance of the water-lifting aerator was stronger.
3.3.2. Effect of Air Chamber Volume
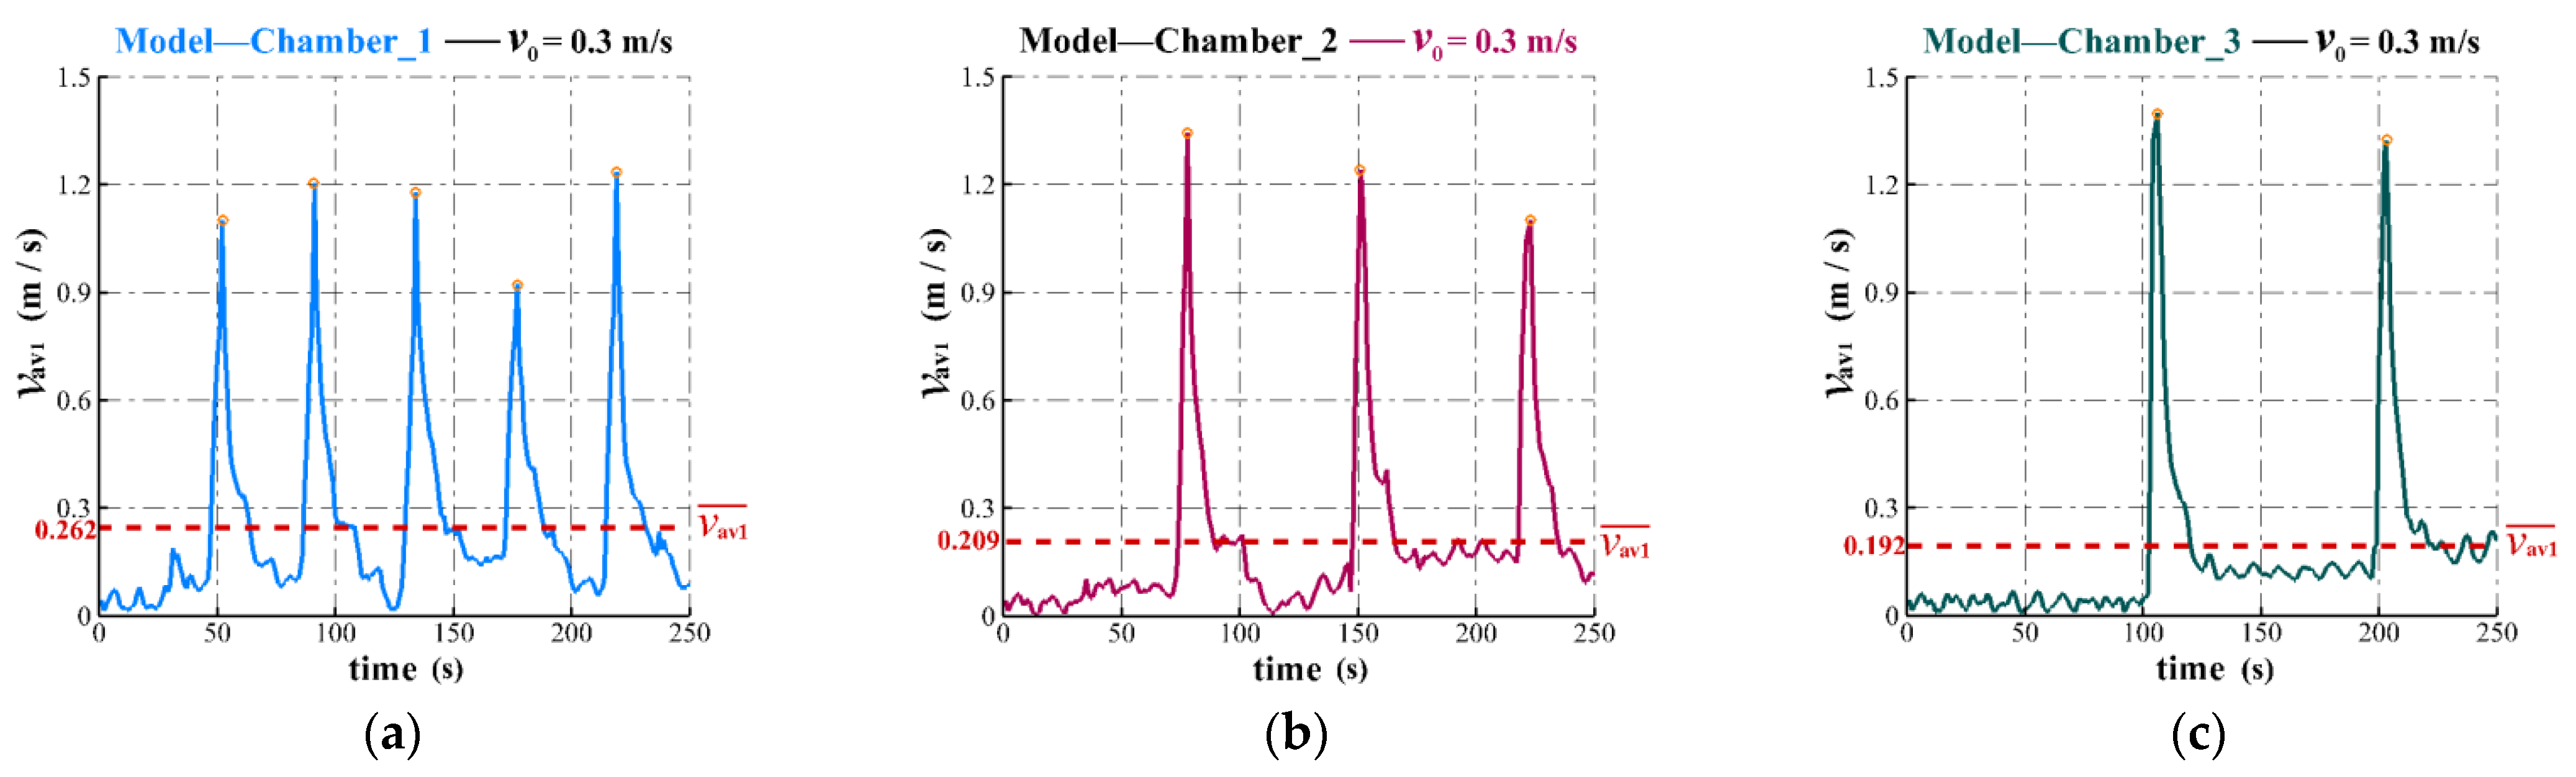
To clarify the influence of air chamber volume on the water-lifting performance, three models, Chamber_1, 2, and 3, with air chamber volumes of 0.455, 0.797, and 1.067 m3, respectively, were simulated and analyzed at the same air release rate. These computational models corresponded to Working Conditions 6, 2, and 7, as shown in Table 1. The unsteady ascending tube outlet velocities for Chamber_1, 2, and 3 are shown in Figure 9. To further analyze the effect of the air chamber volume on the water-lifting performance, the averaged data are listed in Table 3.
From 0 to 250 s, Chamber_1, 2, and 3 had five, three, and two air piston periods, with averages of 41, 73, and 97 s, respectively. An air chamber with a larger volume requires more time for the air to fill it up; thus, a larger air chamber has a larger air piston period and smaller air piston-releasing frequency.
The air chamber volumes of Chamber_1, 2, and 3 were 0.455, 0.797, and 1.067 m3, respectively. Chamber_1 had the smallest air chamber volume, and its ascending tube outlet velocity was characterized by short periods and a low maximum. Chamber_3 had the largest air chamber volume, and its outlet velocity of the ascending tube was characterized by long periods and a high maximum.
The average maximum velocities of the ascending tube outlet for Chamber_1, 2, and 3 were 1.136, 1.296, and 1.333 m/s, respectively, as listed in Table 3. The time-averaged velocities of the ascending tube outlet were 0.262, 0.209, and 0.192 m/s.
Owing to the minor buoyancy produced by the air piston released from Chamber_1, which had the smallest volume of 0.455 m3, the average maximum velocity of the ascending tube outlet was relatively small at 1.136 m/s. The average air piston period of Chamber_1 was the shortest at 41 s, and the duration when the ascending tube outlet velocity was relatively high was longer; therefore, the time-averaged velocity of the ascending tube outlet was larger (0.262 m/s). Conversely, Chamber_3, with the largest volume of 1.067 m3, had the largest average maximum velocity of the ascending tube outlet at 1.333 m/s, the most extended air piston period of 97 s, and the smallest time-averaged velocity of the ascending tube outlet at 0.192 m/s.
The increase in the air chamber volume was accompanied by an increase in the average maximum velocity of the ascending tube outlet and air piston period and a decrease in the time-averaged velocity of the ascending tube outlet. The average maximum velocity of the ascending tube outlet is the maximum velocity at which a single air piston accelerates the water; therefore, it reflects the ability of a single air piston to accelerate the water upwards in the ascending tube. The time-averaged velocity of the ascending tube outlet is the core indicator of the WLA water-lifting performance.
In summary, under the same air release rate conditions, Chamber_1 had a better WLA water-lifting performance than Chamber_2 and Chamber_3.
3.4. Analysis of Factors Affecting Oxygenation Performance
When the WLA system was started, air bubbles rose from the air diffuser to the air chamber to oxygenate the water in the aeration chamber. The oxygen-rich water flowed into the deep water in the reservoir through the outlet of the deflector plate, and the oxygen content of the bottom water increased. Thus, the WLA system oxygenated the deep water in the reservoir. To provide an effective WLA system design, the influence of different air release rates and air chamber volumes on oxygenation performance are discussed in this section.
3.4.1. Effect of Air Release Rate
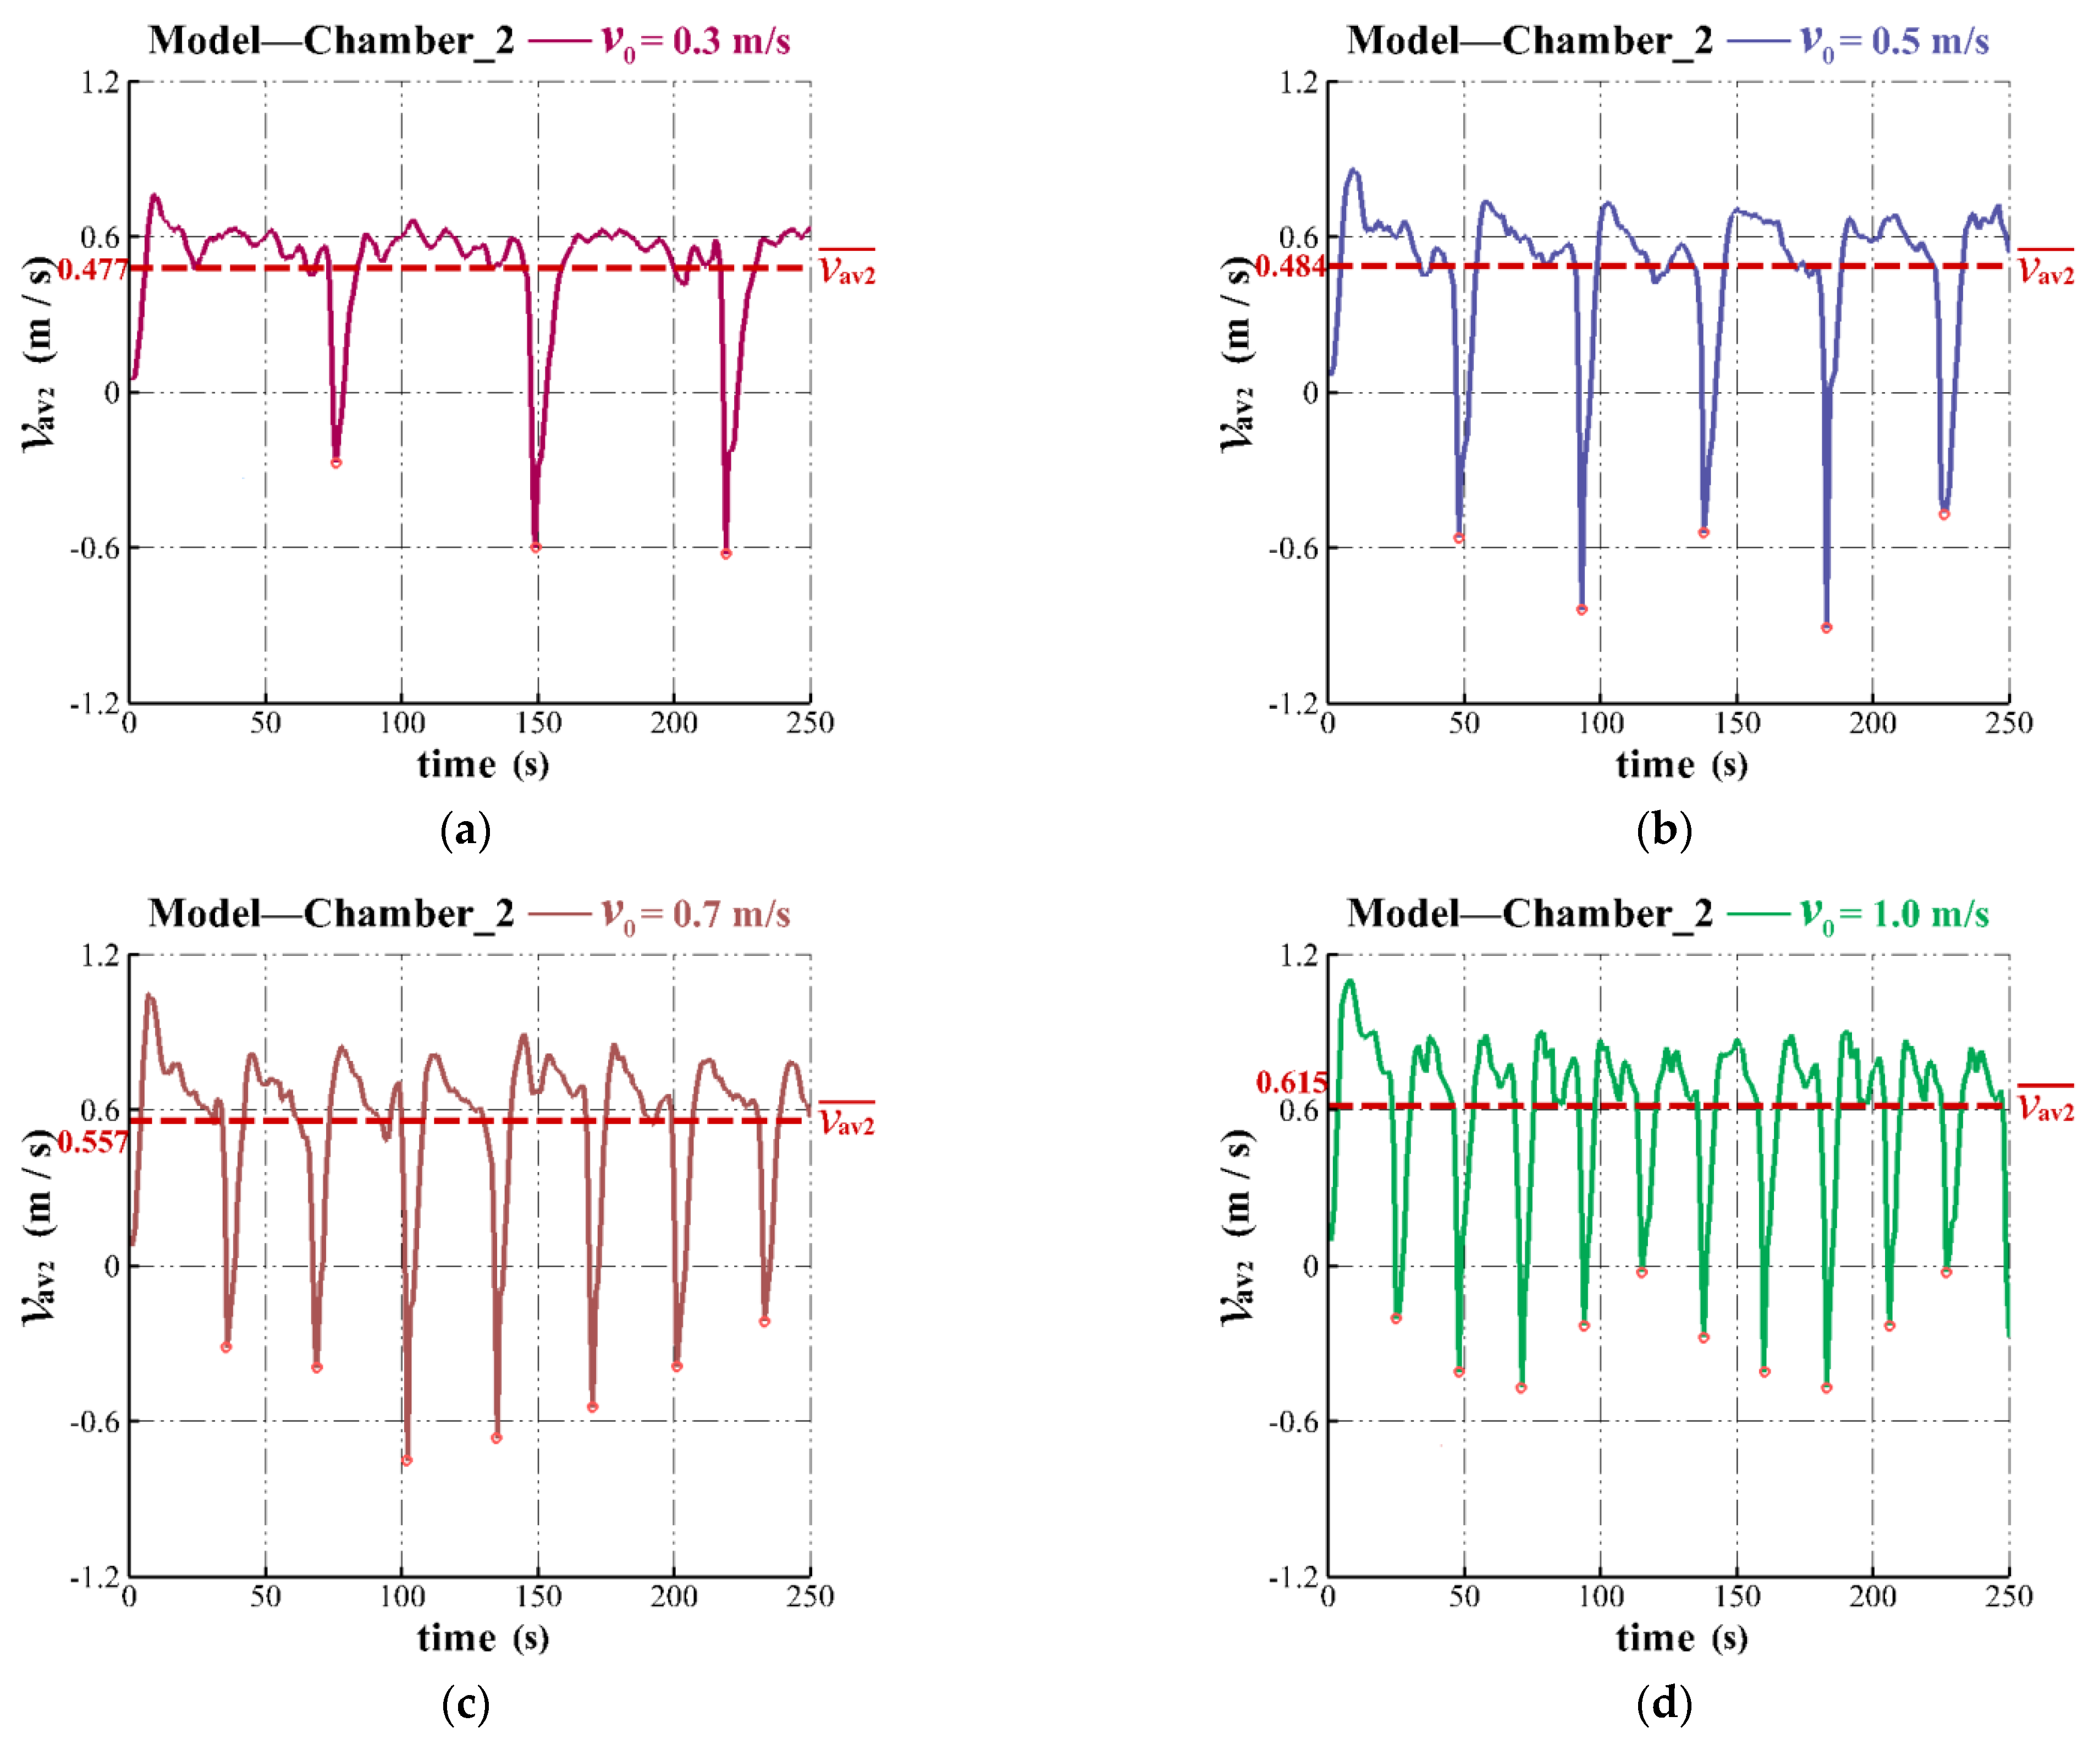
The computational model of Chamber_2 was investigated to analyze the effect of different air release rates on WLA oxygenation performance in deep water in the reservoir. Figure 10 shows the changes in the deflector plate outlet velocity for air release rates of 0.3, 0.5, 0.7, and 1.0 m/s, under Working Conditions 2, 3, 4, and 5, respectively.
To further analyze the influence of air release rate on oxygenation performance, the calculation results were processed using a method similar to that shown in Table 1. The air piston period, minimum velocity of the deflector plate outlet, and velocity of the deflector plate outlet were averaged to obtain the average air piston period, as well as the average minimum and time-averaged velocities of the deflector plate outlet, as shown in Table 4.
As the air release rate increased from 0.3 to 1.0 m/s, the average air piston period decreased from 73 to 23 s, and the average minimum velocity of the deflector plate outlet increased from −0.666 to −0.272 m/s, as shown in Table 4. This implies that the model with an air release rate of 1.0 m/s exhibited the largest inflow velocity. Simultaneously, the time-averaged velocity of the deflector plate outlet increased from 0.477 to 0.615 m/s, which represents the enhancement of the WLA oxygenation performance.
In summary, compared with the other models with different air release rates, the model with an air release rate of 1.0 m/s exhibited the highest time-averaged velocity of the deflector plate outlet and best oxygenation performance pertaining to the deep water body.
3.4.2. Effect of Air Chamber Volume
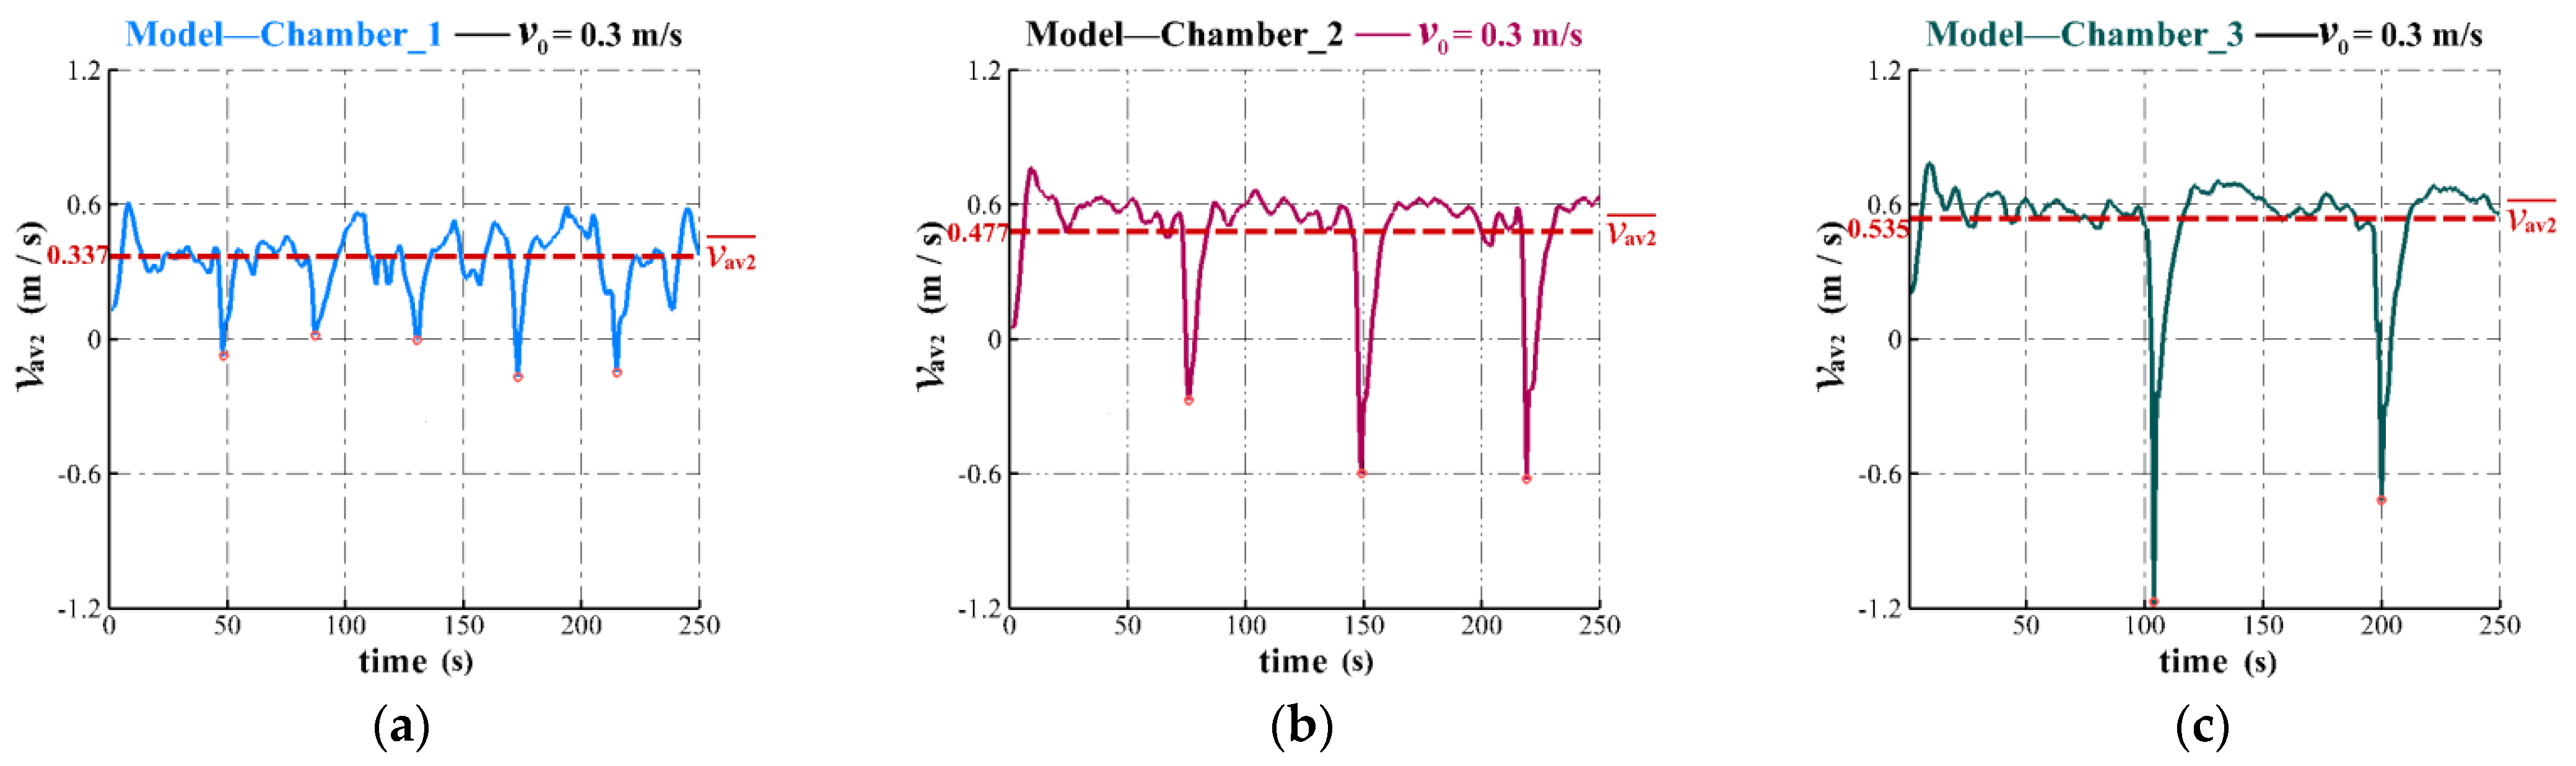
With different air chamber volumes of 0.455, 0.797, and 1.067 m3, the models of Chamber_1, 2, and 3 were used to study the influence of the air chamber volume on the oxygenation performance of the deep water. The deflector plate outlet velocity changes in the three chambers are shown in Figure 11. To further analyze the effect of the air chamber volume on the oxygenation performance of deep water, the calculation results were averaged, as shown in Table 5.
For Chamber_1, 2 and 3, the corresponding average minimum velocities of the deflector plate outlet were −0.100, −0.666, and −0.829 m/s, respectively, as shown in Table 5, indicating that a larger air piston formed by the volume chamber produces more vital suction force in the deflector plate outlet. Simultaneously, the time-averaged velocities of the deflector plate outlet increased from 0.337 to 0.535 m/s, which indicates that the WLA with the biggest air chamber showed the most robust oxygenation performance.
Overall, under the same air release rate conditions, when the air chamber volume was larger, the average air piston period was longer, the time-averaged velocity of the deflector plate outlet was greater, and the oxygenation performance to the deep water of the WLA was stronger. The oxygenation performance of Chamber _3 was the most robust.
3.5. Performance Analysis of Water-Lifting Aerator
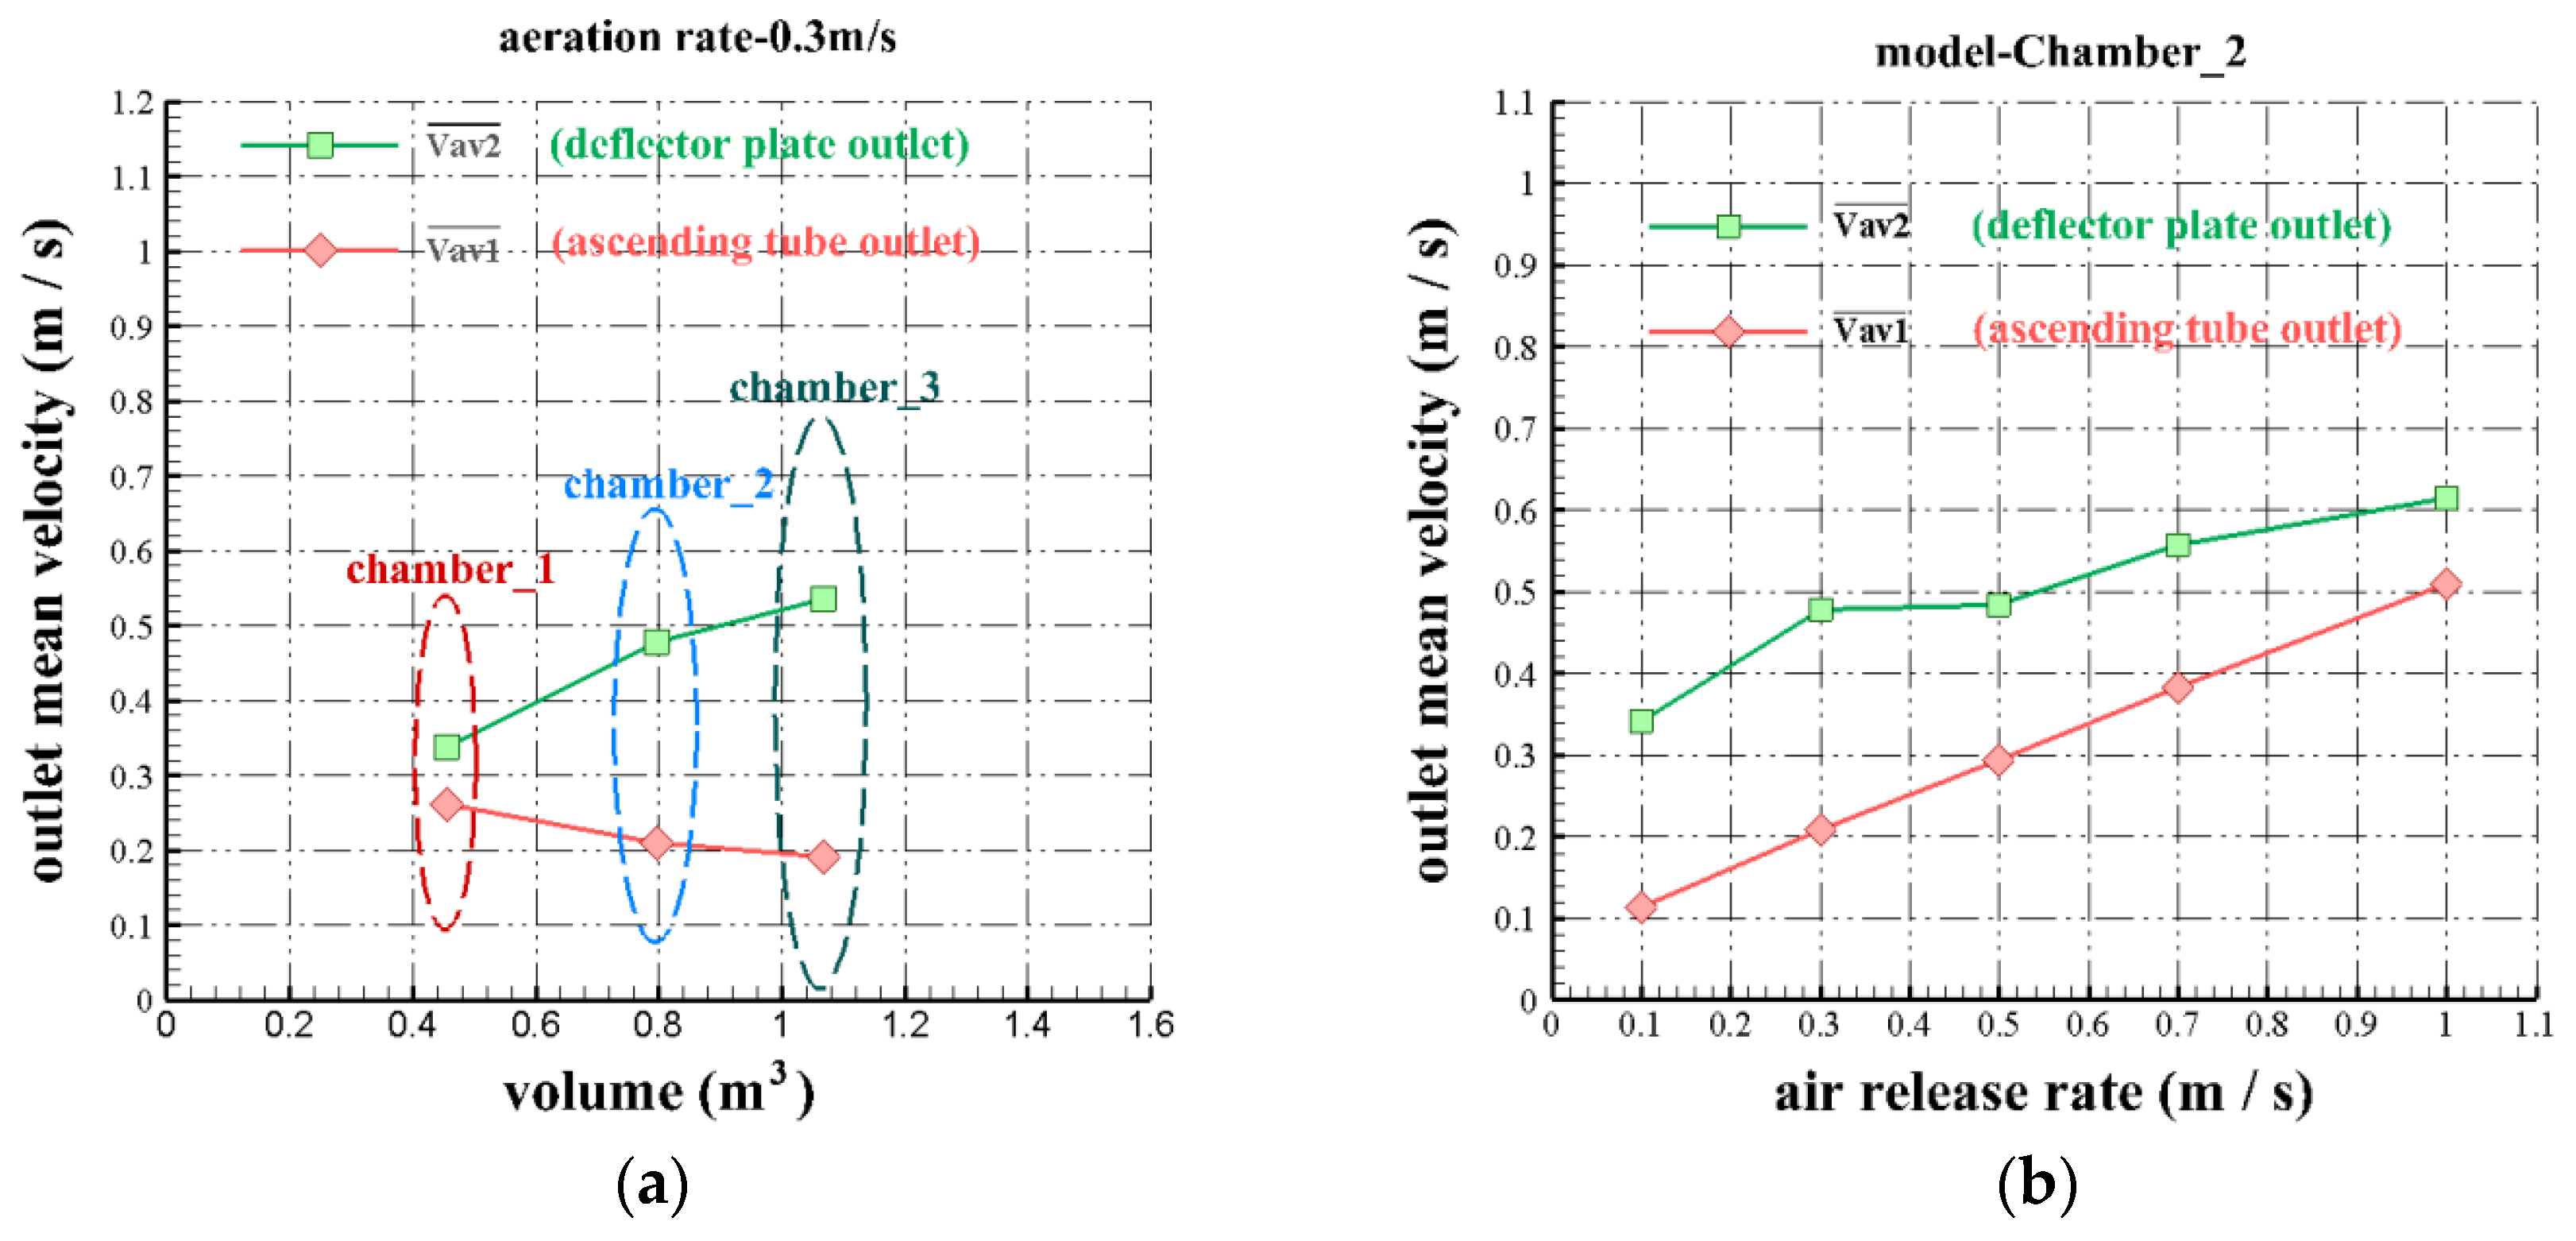
To comprehensively analyze the WLA performance and provide detailed design guidance for researchers and engineers, the previous calculation data were reorganized, as shown in Figure 12.
Figure 12a shows a comparison of the water-lifting and oxygenation performances for Chamber_1, 2, and 3. The time-averaged velocities of the ascending tube and deflector plate outlets correspond to the water-lifting performance and the performance of transporting the oxygenated water to the deep water body. In comparison, Chamber_3, with the largest air chamber volume, exhibited the strongest ability to deliver oxygenated water to the deep water area and the weakest water-lifting performance. Chamber_1, with the lowest air chamber volume, exhibited the lowest ability to deliver oxygenated water to the deep water area and the most robust water-lifting performance. Of the three WLAs, Chamber_2 exhibited moderate performance.
Statistical analysis showed that as the air chamber volume increased, the relative change rate of the time-averaged velocity of the ascending tube outlet decreased by 14%. Simultaneously, the relative change rate of the time-averaged velocity of the deflector plate outlet increased by 27%. The results show that increasing the aeration chamber volume enhanced the bottom oxygenation performance of the WLA but also weakened the water-lifting performance. In practice, the demand of the reservoir for the oxygenation and water-lifting performances of the water-lifting aerator should be weighed to determine a reasonable air chamber volume design.
Figure 12b shows a comparison of the water-lifting and oxygenation performances in the Chamber_2 model with different air release rates. Statistical analysis showed that as the air release rate increased, the relative change rate of the time-averaged velocity of the ascending tube outlet increased by 47%. Additionally, as the air release rate increased, the relative change rate of the time-averaged velocity of the deflector plate outlet increased by 17%. As the air release rate increased, both the water-lifting and oxygenation performances of the Chamber_2 WLA were improved, but the large air release rate increased the operating cost of the WLA system. In the real operation of the WLA system, the air release rate should be determined by combining its operating efficiency and cost.
4. Conclusions
In this study, the VOF model was used to simulate the WLA system in the Zhoucun Reservoir. The detailed flow field inside the WLA was analyzed, and its water-lifting and oxygenation performances were quantitatively studied by varying the air release rate and air chamber volume. The main conclusions can be summarized as follows:
- The calculation results obtained using the VOF method correlated with the experimental results. This demonstrates the feasibility of the methodology and the reliability of the results, indicating that the proposed method can be used to analyze WLA internal flow details.
- By analyzing the detailed process of air bubble accumulation and air piston formation and release inside the WLA, the effects of air piston release on the flow in the ascending tube and deflector plate were discussed, and the mechanisms of water-lifting and oxygenation to deep water were revealed.
- The effects of different air release rates and air chamber volumes on the water-lifting performance of WLA were analyzed. The results show that an increase in the air release rate shortened the air piston period, increased the time-averaged velocity of the ascending tube outlet, and enhanced the water-lifting performance of the WLA. Additionally, increasing the air chamber volume increased the air piston period, reduced the time-averaged velocity of the ascending tube outlet, and weakened the water-lifting performance of the WLA.
- The effects of different air release rates and air chamber volumes on the oxygenation performance of a deep water body were analyzed. The results show that increasing the air release rate shortened the air piston period and increased the time-averaged velocity of the deflector plate outlet, finally enhancing the oxygenation performance of the WLA. Increasing the air chamber volume prolonged the air piston period, increased the time-averaged velocity of the deflector plate outlet, and improved the oxygenation performance of the bottom water.
- The performance of WLAs with different air chamber volumes and air release rates were compared. The results show that as the air chamber volume increased, the oxygenation performance increased at a relative rate of 27%, and the water-lifting performance decreased by 14%. As the air release rate increased, the oxygenation performance increased at a relative rate of 17%, and the water-lifting performance increased by 47%.
In future work, further numerical studies will be performed to investigate the effects of different depths and distances between the air diffuser and the air chamber, which can provide technical support for more parameter optimization design of WLAs and has more significant engineering application value.
Author Contributions
Conceptualization, Z.C. and T.H.; methodology, Z.C. and T.H.; data curation, Z.C.; writing—original draft preparation, Z.C. and T.H.; writing–review and editing, Z.C.; visualization, Z.C.; funding acquisition, T.H. and Z.C. All authors have read and agreed to the published version of the manuscript.
Funding
This research was funded by the National Key Research and Development Program of China (2019YFD1100101); Natural Science Foundation of China (Grant No. 51979217); and Natural Science Special Fund of Xi’an University of Architecture & Technology (ZR21056).
Data Availability Statement
The data that support the findings of this study are available from the corresponding author upon reasonable request.
Acknowledgments
The authors thank the anonymous reviewers for their helpful comments and suggestions.
Conflicts of Interest
The authors declare no conflict of interest.
References
- Vinçon-Leite, B.; Casenave, C. Modelling eutrophication in lake ecosystems: A review. Sci. Total Environ. 2019, 651, 2985–3001. [Google Scholar] [CrossRef] [PubMed]
- Huang, T.L. In-situ control of water pollution and improvement of water quality in water source reservoirs is the primary precondition for the safety of drinking water. Water Wastewater Eng. 2017, 43, 69. [Google Scholar] [CrossRef]
- Li, N.; Li, J.X.; Li, G.W.; Li, Y.; Xi, B.D.; Wu, Y.W.; Li, C.L.; Li, W.; Zhang, L.Y. The eutrophication and its regional heterogeneity in typical lakes of China. Acta Hydrobiol. Sin. 2018, 42, 854–864. [Google Scholar] [CrossRef]
- Yin, H.X.; Wang, Z.K.; Luo, X.Y.; Wang, M.; Guo, Y.; Li, K. The impact of different growth conditions on chemical characteristics of algal organic matter Variation. Water Wastewater Eng. 2019, 45, 134–140. [Google Scholar] [CrossRef]
- Wen, C.C.; Huang, T.L.; Wen, G.; Li, K.; Yang, S.Y.; Zhang, H.H.; Xu, J.; Wang, Z. Controlling phytoplankton blooms in a canyon-shaped drinking water reservoir via artificial and induced natural mixing: Taxonomic versus functional groups. Chemosphere 2022, 287, 131771. [Google Scholar] [CrossRef] [PubMed]
- Chen, S.; Lei, C.; Carey, C.C.; Gantzer, P.A.; Little, J.C. A coupled three-dimensional hydrodynamic model for predicting hypolimnetic oxygenation and epilimnetic mixing in a shallow eutrophic reservoir. Water Resour. Res. 2017, 53, 470–484. [Google Scholar] [CrossRef]
- Bryant, L.D.; Gantzer, P.A.; Little, J.C. Increased sediment oxygen uptake caused by oxygenation-induced hypolimnetic mixing. Water Res. 2011, 45, 3692–3703. [Google Scholar] [CrossRef]
- Munger, Z.W.; Carey, C.C.; Gerling, A.B.; Hamre, K.D.; Doubek, J.P.; Klepatzki, S.D.; McClure, R.P.; Schreiber, M.E. Effectiveness of hypolimnetic oxygenation for preventing accumulation of Fe and Mn in a drinking water reservoir. Water Res. 2016, 106, 1–14. [Google Scholar] [CrossRef] [PubMed]
- Hasan, K.; Alam, K.; Chowdhury, S.A.M. The Use of an aeration system to prevent thermal stratification of water bodies: Pond, lake and water supply reservoir. Appl. Ecol. Environ. Sci. 2014, 2, 1–7. [Google Scholar] [CrossRef] [Green Version]
- Toffolon, M.; Serafini, M. Effects of artificial hypolimnetic oxygenation in a shallow lake. Part 2: Numerical modelling. J. Environ. Manag. 2013, 114, 530–539. [Google Scholar] [CrossRef]
- Zhai, Z.Q.; Huang, T.L.; Chen, F. Application of water-lifting aeration technology in water quality improvement of water diversion reservoir. China Water Wastewater 2022, 38, 31–37. [Google Scholar] [CrossRef]
- Huang, T.L.; Cong, H.B.; Chai, B.B. Source Water Quality Pollution and Control; China Architecture & Building Press: Beijing, China, 2009. [Google Scholar]
- Cong, H.B.; Huang, T.L.; Chai, B.B. A Water-Circulating Aerator: Optimizing structure and predicting water flow rate and oxygen transfer. J. Hydraul. Eng. 2011, 137, 659–667. [Google Scholar] [CrossRef]
- Shi, J.C. Variation of Water Quality and the In-Situ Water Quality Improvement of a Stratified, Source Water Reservoir. Ph.D. Thesis, Xi’an University of Architecture and Technology, Xi’an, China, 2016. [Google Scholar] [CrossRef]
- Chang, Z.Y.; Huang, T.L. Research on the water-lifting performance of water-lifting aerator based on VOF. J. Xi’an Univ. Archit. Technol. 2021, 53, 117–125. [Google Scholar] [CrossRef]
- Cong, H.B.; Huang, T.L.; Miu, J.G.; He, W.J.; Yin, P.J. Study on water improvement function, capacity of lifting water and oxygenation of a water-lifting aerator. Chin. J. Environ. Eng. 2007, 1, 7–13. [Google Scholar] [CrossRef]
- Zhu, W.F. Numerical Simulations on the Periphery Flow Field of Water-Lifting Aerator and the Flow Field of Aeration Chamber. Master’s Thesis, Xi’an University of Architecture and Technology, Xi’an, China, 2008. [Google Scholar] [CrossRef]
- Wang, J.X. Numerical Simulations of Effects of Thermal Stratification and Water Depth on Flow Around Water-Lifting Aerator. Master’s Thesis, Xi’an University of Architecture and Technology, Xi’an, China, 2010. [Google Scholar] [CrossRef]
- Sun, X.; Ye, L.L.; Zhao, W.L.; Huang, T.L.; Cong, H.B. Effect of temperature gradient on algae inhibition by in-situ water-lifting aeration in a stratified reservoir. China Environ. Sci. 2014, 34, 352–358. [Google Scholar]
- Sun, X.; Li, X.; Zhang, M.D.; Huang, T.L.; Liu, W. Comparison of water-lifting aerator type for algae inhibition in stratified source water reservoirs. Ecol. Eng. 2014, 73, 624–634. [Google Scholar] [CrossRef]
- Zhang, M.D. System Optimization of Water-Lifting Aeration in Deep-Water Reservoirs. Master’s Thesis, Xi’an University of Architecture and Technology, Xi’an, China, 2014. [Google Scholar]
- Hu, P.; Liu, L.H.; Wu, L.X.; Fang, Y.Y. Current research progress and trend on fine pore aeration. Environ. Eng. 2015, 33, 58–61. [Google Scholar] [CrossRef]
- He, Y.P. Numerical Simulation Study on the Position Distribution and the Optimization of the Optimization of the Aeration of the Oxidation Trench Thruster. Master’s Thesis, Xi’an University of Technology, Xi’an, China, 2021. [Google Scholar] [CrossRef]
- Zhang, W.L.; Yang, X.M.; Wang, H.L.; Li, Y. Experimental research of oxygenation performance optimization for fine pore aeration system of rivers. Water Resour. Prot. 2022, 38, 154–160. [Google Scholar]
- Amaral, A.; Bellandi, G.; Rehman, U. Towards improved accuracy in modeling aeration efficiency through understanding bubble size distribution dynamics. Water Res. 2018, 131, 346–355. [Google Scholar] [CrossRef]
- Yin, X.F.; Fan, H.T.; Qi, L.; Wang, H.C.; Wei, Y.L.; Jiang, S.Z. Pilot study on influence of airflow rate and diffuser density on oxygenation performance of fine-pore diffuser in air aeration system. Water Pollut. Control 2015, 33, 27–30. [Google Scholar] [CrossRef]
- Liu, X.Y.; Wu, T.; Kang, W.C.; Zhou, X.L.; Bi, X.J. Influence of velocity field distribution on the oxygenation performance of fine bubble aeration in plug-flow reactor. Environ. Sci. Technol. 2020, 43, 12–17. [Google Scholar] [CrossRef]
- Xu, P.; Shan, J.H.; Jin, X.H.; Yu, J.Z.; Sun, Y.; Zhang, J.Z. Performance of impulse-type fine bubble aerator. Chin. J. Environ. Eng. 2015, 9, 4287–4292. [Google Scholar]
- Cheng, X.J.; Xie, Y.N.; Zhu, D.T.; Li, R.; Xie, J. Experiment on effects of microporous diffuser types on aeration oxygenation performance. Trans. Chin. Soc. Agric. Eng. 2017, 33, 226–233. [Google Scholar] [CrossRef]
- Wang, H.B.; Li, C.L.; Qiu, G.M.; Guo, X. Numerical simulation of flow field characteristics in aerated reactor based on VOF. Membr. Sci. Technol. 2016, 36, 70–78. [Google Scholar]
- Gu, Y.J.; Yang, W.D.; Liu, Z.Y.; Luo, Z.G.; Zou, Z.S. Numerical simulation about evolution of bubble wake during bubble rising by VOF method. CIESC J. 2021, 72, 1947–1955. [Google Scholar] [CrossRef]
- Ding, G.D.; Chen, J.Q.; Cai, X.L.; Ye, F.; Li, Z.L.; Ji, Y.P.; Guo, J. Numerical simulation of single bubble breaking behavior in Venturi microbubble generator. Chem. Ind. Eng. Prog. 2020, 39, 2590–2598. [Google Scholar] [CrossRef]
- Zuzio, D.; Orazzo, A.; Estivalèzes, J.-L.; Lagrange, I. A new efficient momentum preserving Level-Set/VOF method for high density and momentum ratio incompressible two-phase flows. J. Comput. Phys. 2020, 410, 109342. [Google Scholar] [CrossRef]
- Wen, H.L.; Yu, C.H.; Sheu, T.W. On the development of LS-assisted VOF method for incompressible interfacial flows. J. Comput. Phys. 2020, 406, 109188. [Google Scholar] [CrossRef]
- Cerqueira, R.F.L.; Paladino, E.E.; Evrard, F.; Denner, F.; van Wachem, B. Multiscale modeling and validation of the flow around Taylor bubbles surrounded with small dispersed bubbles using a coupled VOF-DBM approach. Int. J. Multiph. Flow 2021, 141, 103673. [Google Scholar] [CrossRef]
- Hirt, C.W.; Nichols, B.D. Volume of fluid (VOF) method for the dynamics of free boundaries. J. Comput. Phys. 1981, 39, 201–225. [Google Scholar] [CrossRef]
- Giussani, F.; Piscaglia, F.; Saez-Mischlich, G.; Hèlie, J. A three-phase VOF solver for the simulation of in-nozzle cavitation effects on liquid atomization. J. Comput. Phys. 2020, 406, 109068. [Google Scholar] [CrossRef]
- Brackbill, J.U.; Kothe, D.B.; Zemach, C. A continuum method for modeling surface tension. J. Comput. Phys. 1992, 100, 335–354. [Google Scholar] [CrossRef]
- ANSYS. Ansys Fluent 14.0 Theory Guide; ANSYS Inc.: Pittsburgh, PA, USA, 2011. [Google Scholar]
- Ray, J.; Lefantzi, S.; Arunajatesan, S.; Dechant, L. Bayesian Parameter Estimation of a k-epsilon Model for Accurate Jet-in-Crossflow Simulations. AIAA J. 2016, 54, 2432–2448. [Google Scholar] [CrossRef]
Figure 1.
Water-lifting aerator (WLA) system layout.

Figure 2.
Computational domain grids and volume fraction diagram. (a) Local grid; (b) global flow field grid; and (c) volume fraction.
Figure 2.
Computational domain grids and volume fraction diagram. (a) Local grid; (b) global flow field grid; and (c) volume fraction.

Figure 3.
Full air chamber. The red section indicates air, and the blue section indicates water.

Figure 4.
Comparison of computational models. (a) Chamber_1, (b) Chamber_2, and (c) Chamber_3. The red rectangular wireframe denotes the volume of the air chamber.
Figure 4.
Comparison of computational models. (a) Chamber_1, (b) Chamber_2, and (c) Chamber_3. The red rectangular wireframe denotes the volume of the air chamber.

Figure 5.
Comparison of computational and experimental results of the velocity in the ascending tube.
Figure 5.
Comparison of computational and experimental results of the velocity in the ascending tube.

Figure 6.
Generation process of the air piston inside the water-lifting aerator (WLA). (a) t = 27 s, (b) t = 77 s, (c) t = 214 s, (d) t = 218 s, and (e) t = 220 s.
Figure 6.
Generation process of the air piston inside the water-lifting aerator (WLA). (a) t = 27 s, (b) t = 77 s, (c) t = 214 s, (d) t = 218 s, and (e) t = 220 s.

Figure 7.
Distribution of the velocity in the outlet of the ascending tube and deflector plate for Working Condition 1. Velocity variation diagram for the (a) ascending tube (five cycles) and (b) deflector plate (five cycles). (c) First cycle of the ascending tube and (d) first cycle of the deflector plate.

Figure 8.
Distribution of the velocity in the outlet of the ascending tube for different air release rates of (a) 0.3, (b) 0.5, (c) 0.7, and (d) 1.0 m/s. The orange circles indicate the maximum velocities, and the red dashed lines indicate time-averaged velocities of the ascending tube outlet.
Figure 8.
Distribution of the velocity in the outlet of the ascending tube for different air release rates of (a) 0.3, (b) 0.5, (c) 0.7, and (d) 1.0 m/s. The orange circles indicate the maximum velocities, and the red dashed lines indicate time-averaged velocities of the ascending tube outlet.

Figure 9.
The velocity at the ascending tube outlet for different chamber volumes of (a) 0.455, (b) 0.797, and (c) 1.067 m3. The orange circles indicate the maximum velocities, and the red dashed lines indicate time-averaged velocities of the ascending tube outlet.
Figure 9.
The velocity at the ascending tube outlet for different chamber volumes of (a) 0.455, (b) 0.797, and (c) 1.067 m3. The orange circles indicate the maximum velocities, and the red dashed lines indicate time-averaged velocities of the ascending tube outlet.

Figure 10.
Velocity in the deflector plate outlet for different air release rates of (a) 0.3, (b) 0.5, (c) 0.7, and (d) 1.0 m/s. The pink circles indicate the minimum velocities of the deflector plate outlet, and the red dashed lines indicate time-averaged velocities of deflector plate outlet.
Figure 10.
Velocity in the deflector plate outlet for different air release rates of (a) 0.3, (b) 0.5, (c) 0.7, and (d) 1.0 m/s. The pink circles indicate the minimum velocities of the deflector plate outlet, and the red dashed lines indicate time-averaged velocities of deflector plate outlet.

Figure 11.
Distribution of the velocity in the outlet of the deflector plate for different air chamber volumes of (a) 0.455, (b) 0.797, and (c) 1.067 m3. The pink circles represent the minimum velocities, and the red dashed lines indicate time-averaged velocities of the deflector plate outlet.
Figure 11.
Distribution of the velocity in the outlet of the deflector plate for different air chamber volumes of (a) 0.455, (b) 0.797, and (c) 1.067 m3. The pink circles represent the minimum velocities, and the red dashed lines indicate time-averaged velocities of the deflector plate outlet.

Figure 12.
Comparison diagram of the performance of the WLA. (a) Effect of air chamber volume on WLA performance. (b) Effect of air release rate on WLA performance.
Figure 12.
Comparison diagram of the performance of the WLA. (a) Effect of air chamber volume on WLA performance. (b) Effect of air release rate on WLA performance.


Table 1.
Working conditions.
| Working Condition | Computational Model | Air Chamber Volume (m3) | Air Release Rate (m/s) |
|---|---|---|---|
| Working Condition 1 | Chamber_2 | 0.797 | 0.1 |
| Working Condition 2 | Chamber_2 | 0.797 | 0.3 |
| Working Condition 3 | Chamber_2 | 0.797 | 0.5 |
| Working Condition 4 | Chamber_2 | 0.797 | 0.7 |
| Working Condition 5 | Chamber_2 | 0.797 | 1.0 |
| Working Condition 6 | Chamber_1 | 0.455 | 0.3 |
| Working Condition 2 | Chamber_2 | 0.797 | 0.3 |
| Working Condition 7 | Chamber_3 | 1.067 | 0.3 |
Table 2.
Computational results of the water-lifting performance with different air release rates.
| Working Condition 2 | Working Condition 3 | Working Condition 4 | Working Condition 5 | |
|---|---|---|---|---|
| Air release rate, (m/s) | 0.3 | 0.5 | 0.7 | 1.0 |
| Average air piston period, (s) | 73 | 45 | 32 | 23 |
| Average maximum velocity of the ascending tube outlet, (m/s) | 1.296 | 1.345 | 1.373 | 1.422 |
| Time-averaged velocity of the ascending tube outlet, (m/s) | 0.209 | 0.293 | 0.383 | 0.510 |
Table 3.
Computational results of the water-lifting performance with different air chamber volumes.
| Working Condition 6 (Chamber_1) | Working Condition 2 (Chamber_2) | Working Condition 7 (Chamber_3) | |
|---|---|---|---|
| Air chamber volume, (m3) | 0.455 | 0.797 | 1.067 |
| Average air piston period, (s) | 41 | 73 | 97 |
| Average maximum velocity of the ascending tube outlet, (m/s) | 1.136 | 1.296 | 1.333 |
| Time-averaged velocity of the ascending tube outlet, (m/s) | 0.262 | 0.209 | 0.192 |
Table 4.
Computational results of the oxygenation performance with different air release rates.
| Working Condition 2 | Working Condition 3 | Working Condition 4 | Working Condition 5 | |
|---|---|---|---|---|
| Air release rate, (m/s) | 0.3 | 0.5 | 0.7 | 1.0 |
| Average air piston period, (s) | 73 | 45 | 32 | 23 |
| Average minimum velocity of the deflector plate outlet, (m/s) | −0.666 | −0.650 | −0.440 | −0.272 |
| Time-averaged velocity of the deflector plate outlet, (m/s) | 0.477 | 0.484 | 0.557 | 0.615 |
Table 5.
Computational results of the oxygenation performance with different volumes of the air chamber.
Table 5.
Computational results of the oxygenation performance with different volumes of the air chamber.
| Working Condition 6 (Chamber_1) | Working Condition 2 (Chamber_2) | Working Condition 7 (Chamber_3) | |
|---|---|---|---|
| Air chamber volume, (m3) | 0.455 | 0.797 | 1.067 |
| Average air piston period, (s) | 41 | 73 | 97 |
| Average minimum velocity of the deflector plate outlet, (m/s) | −0.100 | −0.666 | −0.829 |
| Time-averaged velocity of the deflector plate outlet, (m/s) | 0.337 | 0.477 | 0.535 |
Disclaimer/Publisher’s Note: The statements, opinions and data contained in all publications are solely those of the individual author(s) and contributor(s) and not of MDPI and/or the editor(s). MDPI and/or the editor(s) disclaim responsibility for any injury to people or property resulting from any ideas, methods, instructions or products referred to in the content. |
© 2023 by the authors. Licensee MDPI, Basel, Switzerland. This article is an open access article distributed under the terms and conditions of the Creative Commons Attribution (CC BY) license (https://creativecommons.org/licenses/by/4.0/).
Share and Cite
MDPI and ACS Style
Chang, Z.; Huang, T. Analysis of Water-Lifting Aerator Performance Based on the Volume of Fluid Method. Water 2023, 15, 991. https://doi.org/10.3390/w15050991
AMA Style
Chang Z, Huang T. Analysis of Water-Lifting Aerator Performance Based on the Volume of Fluid Method. Water. 2023; 15(5):991. https://doi.org/10.3390/w15050991
Chicago/Turabian StyleChang, Zhiying, and Tinglin Huang. 2023. "Analysis of Water-Lifting Aerator Performance Based on the Volume of Fluid Method" Water 15, no. 5: 991. https://doi.org/10.3390/w15050991
Note that from the first issue of 2016, this journal uses article numbers instead of page numbers. See further details here.