
Historical Drought Events in the Early Years of Qing Dynasty in Shanxi Based on Hydrological Reconstructions

1
Research Center on Flood and Drought Disaster Reduction, China Institute of Water Resources and Hydropower Research, Beijing 100038, China
2
Key Laboratory of Environmental Change and Natural Disaster of Ministry of Education, Beijing Normal University, Beijing 100875, China
*
Authors to whom correspondence should be addressed.
Water 2023, 15(5), 995; https://doi.org/10.3390/w15050995
Submission received: 24 December 2022
/
Revised: 19 February 2023
/
Accepted: 21 February 2023
/
Published: 6 March 2023
(This article belongs to the Special Issue The Interrelationship between Climate Change, Human Activities and Hydrological Processes)
Abstract
:Droughts are serious natural disasters that adversely affect water resources, agriculture, the economy, and the environment. Reconstructing historical drought records is necessary to assess the impact of droughts and their evolution and has become a top priority to support and improve sustainable water management decisions. In this study, we used Shanxi Province as the research area, and meteorological data from the early years of Guangxu in the Qing Dynasty were reconstructed using historical rain and snow records. The Variable Infiltration Capacity (VIC) model is driven by the reconstruction of historical meteorological data. The study area’s monthly runoff and soil water sequence from 1875 to 1879 were simulated, and the hydrology and soil of the ancient historical period were reproduced in the absence of data. The results show the following: (1) The idea of reconstructing hydrological parameters using historical data is feasible and the VIC model can be used to study drought characteristics under specific scenarios. (2) The proportions of areas with runoff depths less than 10 mm throughout Shanxi from 1875 to 1879 were 55%, 48%, 58%, 19%, and 30%. The annual runoff depth in each region from 1875 to 1877 was less than 60 mm. The hydrological drought from 1875 to 1877 was very serious, and the area covered by the drought was relatively large. (3) The annual average soil water content of various regions was stable between 150 and 510 mm from 1875 to 1879. The soil water content had no apparent interannual variation. The area with soil water content less than 180 mm accounted for ratios as high as 31%. This research provides new ideas for ancient drought research and a scientific basis for regional drought prevention, mitigation, and water resources management, and ensures the orderly progress of agricultural production activities.
1. Introduction
Droughts are serious phenomena that adversely affect water resources, agriculture, the economy, and the environment [1,2,3]. They are generally long term and slow climate phenomena caused by insufficient precipitation in an area for months or even years [4]. However, in the context of global warming, droughts have been shown to rapidly evolve [5,6,7]. Since 1970, drought events have become more common worldwide, especially in tropical and subtropical regions [8]. The fifth assessment report of the Intergovernmental Panel on Climate Change (IPCC AR5) comprehensively assessed the changes in drought events and suggested that the changing drought trends should be fully considered [9,10]. Droughts may frequently occur, threatening local societies and agricultural development [11]. In this case, exploring the historical changes in drought is vital to provide references for drought prediction and mitigation [12].
China’s environment and ecosystem are fragile and vulnerable to the negative impacts of climate change [12,13,14,15]. In recent years, China has experienced more frequent extreme weather events, such as heavy rains and drought [16,17,18]. In fact, the continuous changes in climatic conditions have changed the precipitation pattern in most areas of China, especially in northern China [19]. In recent decades, droughts in many areas of northern China have become more frequent and severe [20]. Rapid urbanization and climate change are expected to continue exacerbating China’s water shortage pressure. With the ever-increasing water demand and ever-changing water supply, there is an urgent need to develop sustainable water management strategies [21,22,23].
On this note, we studied a severe drought that occurred during the early years of Guangxu. According to historical records, the longest continuous rainless period lasted for 340 days [24,25]. Accompanying famines, locust plagues, and epidemic diseases frequently occurred, which had serious impacts on the region [26]. Therefore, reconstructing historical drought records is necessary to assess the impact of drought and their evolution and has become a top priority to support and improve sustainable water management decisions [27,28,29]. Calculating and evaluating soil moisture content are the key to the study of drought development [27,30,31]. Research has shown that drought indices based on soil moisture content can effectively reflect changes in drought development [32,33,34]. With the development of terrestrial hydrological models and restrictions on the availability of hydrological measurement data, simulating soil moisture is the key to establishing a long-term soil moisture database [35,36,37,38].
The spatial and temporal distribution of drought and drought monitoring are key issues in the study of drought resistance [39,40,41,42]. Thus, a drought index based on soil moisture has been gradually developed to improve the ability to monitor the spatiotemporal changes in drought [43]. Soil moisture is affected by climate, vegetation, and soil characteristics, and will feed back to vegetation and affect the water supply of vegetation [44,45]. The drought index based on soil moisture can well characterize the water vapor exchange of the underlying surface and its influence on the evolution of drought [46,47]. However, the application of the drought index of soil water content is limited because the large-scale measurement of soil water content is difficult [48,49,50]. Thus, fast and economical remote sensing data, with their expanded spatial coverage, can replace large-scale in situ soil moisture [51]. Many soil moisture products developed based on satellite remote sensing technology provide important references for drought research and are used by many scholars [52].
The Variable Infiltration Capacity (VIC) model is widely used because of its high applicability, good effect, and strong operability [53,54,55,56]. The remarkable characteristics of the VIC model different from other hydrological models include considering crop canopy evaporation and transpiration, and selecting Darcy’s law of saturated and unsaturated soil water movement to describe soil water movement [35]. In the aspect of runoff simulation, both the mechanism of runoff generation by excess infiltration and the mechanism of runoff generation by full storage are considered to realize the grid spatial simulation of runoff [54]. On the basis of water balance, energy balance is also considered [55]. The VIC model can simulate soil water with daily time steps [43]. Andreadis et al. [57] reconstructed the drought history of the North American continent. Wu, Lu, Wen, and Lin [36] reconstructed and analyzed the temporal and spatial changes and characteristics of China’s historical drought from 1951 to 2009. The VIC model has also been successfully applied to the simulation of soil moisture and water flow in the Pearl River Basin [54,58,59]. The soil moisture calculated according to the model can capture the wet and dry conditions of watersheds [2,3].
Using the “rain and snow” data from the Qing Palace archives, this study reconstructed the runoff and soil water sequence in the early years of Guangxu in the Qing Dynasty (1875–1879). On the basis of the long sequence (>20 years) runoff observation data of three main hydrological stations in the Fenhe River Basin in Shanxi Province, the VIC model parameters were corrected. Then, a high-resolution (~10 km) VIC simulation framework suitable for Shanxi Province was constructed. On this basis, the reconstructed monthly precipitation sequence from 1875 to 1879 was downscaled into a continuous daily sequence to drive the VIC hydrological model to reconstruct the monthly runoff and soil water sequence. This research provides a way to study the historical evolution trend of hydrological drought using the reconstructed historical meteorological data based on ancient data. It also provides a scientific basis for regional drought prevention and mitigation and water resources management and helps ensure the orderly progress of agricultural production activities.
2. Data and Methods
2.1. Study Area
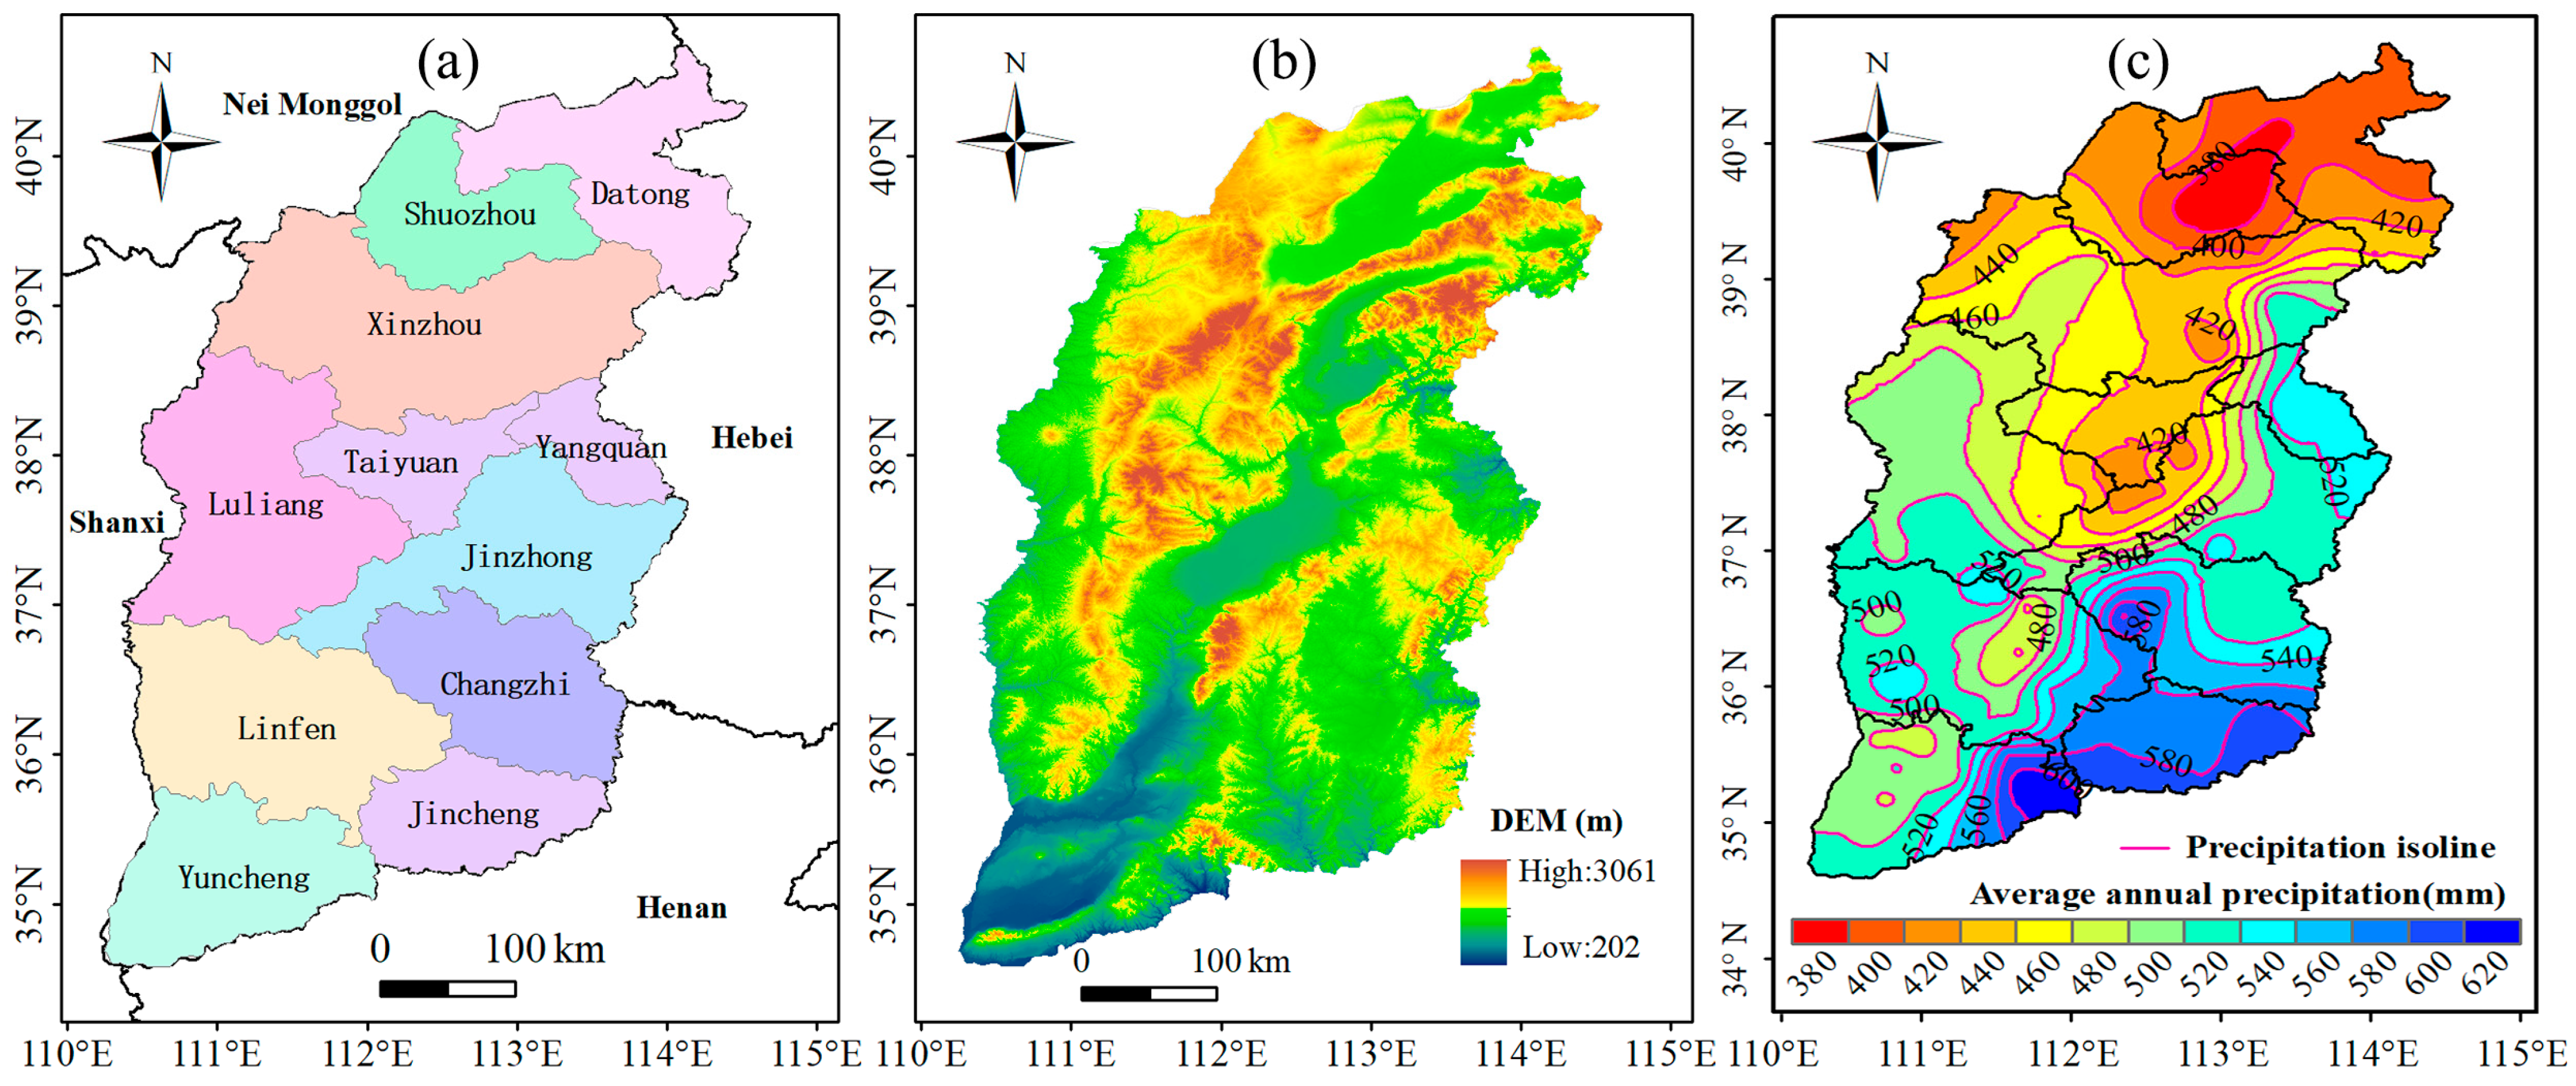
The study area in this paper is Shanxi Province, located in North China. It has 11 prefectures and cities with a total area of 157,000 km2. This area has a complex topography. The northwestern region has many mountainous hills, and the central and southern regions are mostly plains and basins. Mountainous hills account for 80% of the study area. The study area has a temperate continental monsoon climate (with rain and heat at the same time) and less precipitation. The regional average temperature is between 4.2 °C and 14.2 °C, and the annual precipitation is between 360 and 620 mm (Figure 1). The tributaries of the Yellow River and the Haihe River comprise the major tributaries of the study area. The tributaries of the Yellow River mainly include the Fenhe and Qinhe Rivers. The tributaries of the Haihe River include the Sanggan, Zhanghe, and Hutuo Rivers. The overall water resources are relatively scarce, and the main water source is natural precipitation.
Under the influence of special natural conditions and specific social conditions, drought has become the most frequent and serious natural disaster in Shanxi [60]. Therefore, drought prevention and relief have become necessary long-term and arduous tasks to preserve Shanxi’s economic and social development.
2.2. Data
The “Yu–Xue–Fen–Cun” data from the Qing Palace Archives for the Qing Dynas-ty are nationwide observation records of infiltration depth or snow thickness from 1736 to 1911 [14]. These are among the most reliable drought and flood series data for high-resolution reconstruction [9]. The key issue that needs to be solved is quantifying the “Yu–Fen–Cun” into precipitation for the quantitative reconstruction of typical historical drought events [8]. This study simulates historical runoff and soil water data based on historical observation data combined with the VIC model. This method provides an important reference for the study of historical drought events and has broad application prospects. The time range of the rain and snow records from the Qing Dynasty was from the first year of Qianlong (1736 AD) to the third year of Xuantong (1911 AD).
These are considered a kind of intuitive precipitation observation records. This study collected 65 rain and snow record data from the Qing Palace Archives for the Qing Dynasty, including 4522 rain and snow measurement records. The data contain rain and snow measurement records of 95 stations in Shanxi Province from the first to the fifth year of Guangxu (1875–1879). These data came from the Institute of Water Resources History, China Institute of Water Resources, and Hydropower Research. The “Yu–Xue–Fen–Cun” data clearly record the time of successive precipitation at each station in the studied area, the snowfall thickness, and the depth of rainfall soil infiltration in farmland, recorded in inches (1 in. = 3.33 cm). The research data are accurate and highly quantified reliably record time and location. After sorting, the proportion of quantitative records in the “Yu–Fen–Cun” (rain records) files is 94%, and qualitative records account for about 6%; the snowy measures are all quantitative records.
The spatial scope covered the Chinese region. These data recorded infiltration depth and snow depth observations of each precipitation process. The thickness of snow accumulation was also recorded for observation. The observational soil moisture content data came from the National Agricultural Meteorological Monitoring Station of the China Meteorological Administration. The data included soil moisture content data from 14 main observation stations in the study area from 1994 to 2012 (Table 1). Soil moisture content observations were generally from farmlands, and soil observations were obtained on the 8th, 18th, and 28th day of each month. Observations were postponed for 2 to 3 days in case of rain or irrigation during the observation. The data included soil bulk density and field water holding capacity, withering coefficient, and other soil physical parameters, soil weight, and water content of each soil layer (0–10, 10–20, 20–30, 30–40, and 40–50 cm).
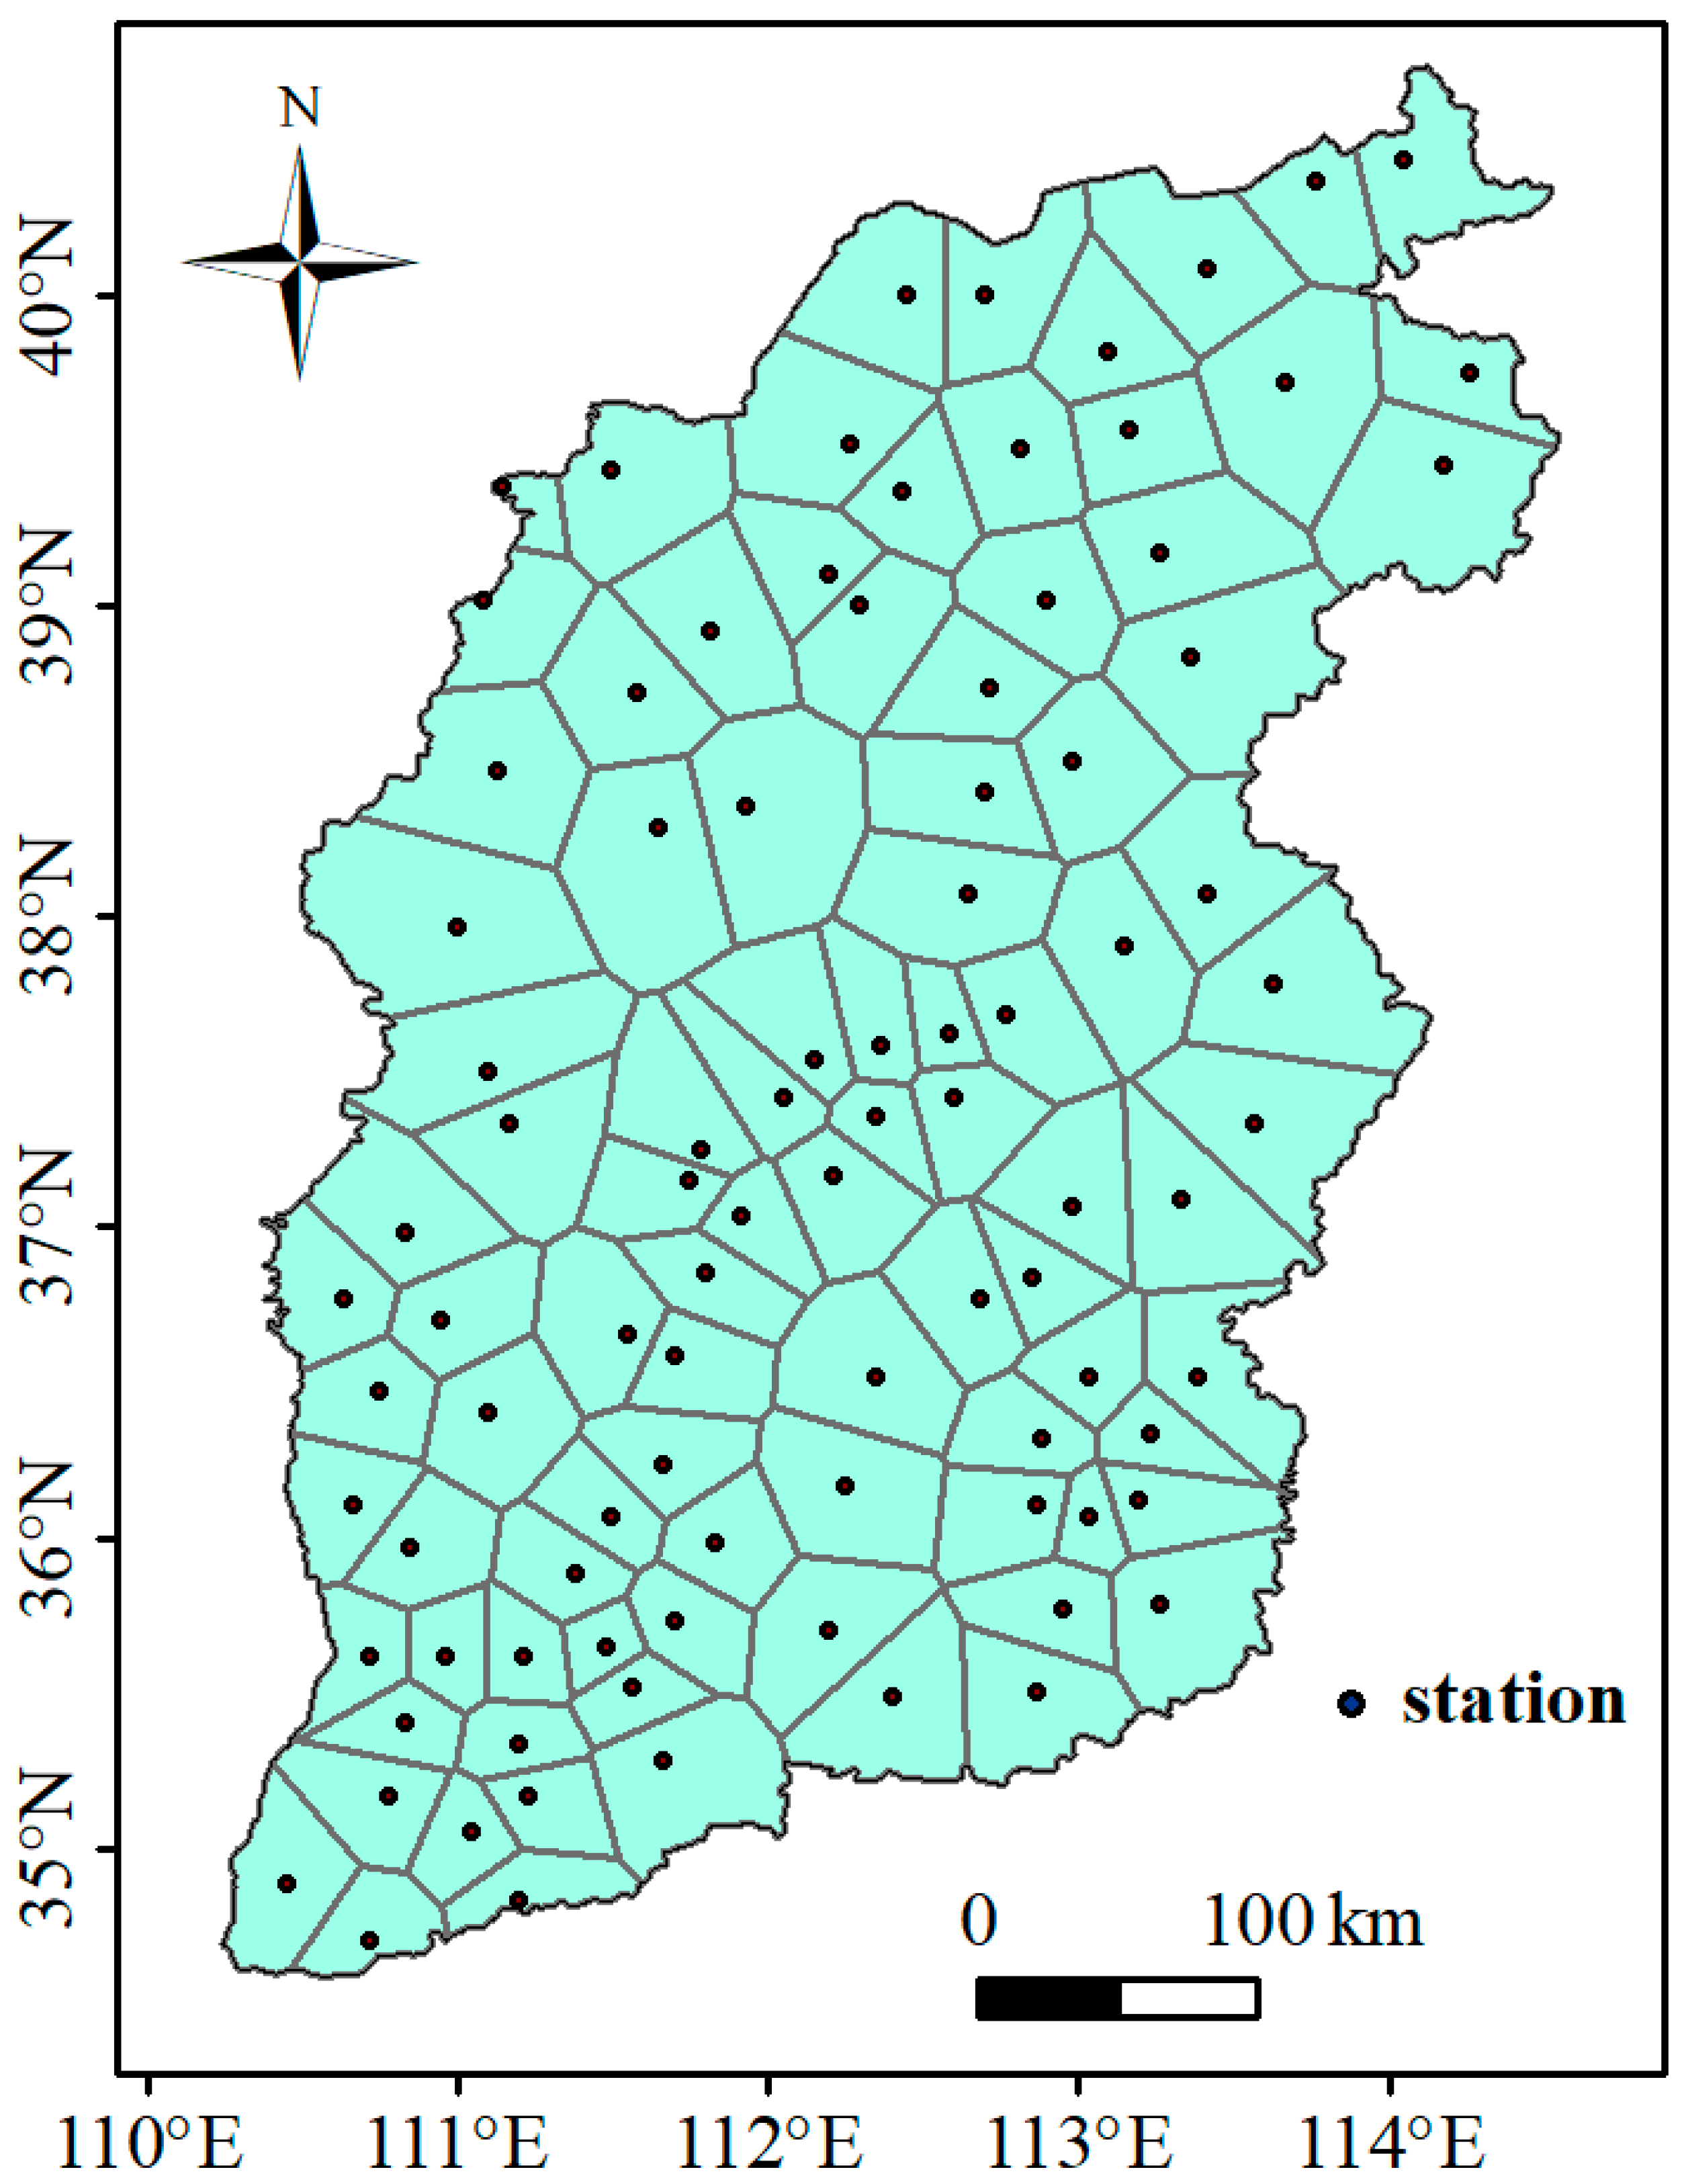
Meteorological data came from the China Meteorological Science Data Sharing Service Network (http://cdc.cma.gov.cn/home.do (accessed on 18 November 2021)). These included the daily rainfall, maximum temperature, and minimum temperature for 95 meteorological stations in Shanxi Province from 1975 to 2014. The wind speed data and the locations of the weather stations were consistent with the reconstruction stations. We used Tyson polygon to replace the weather conditions in the nearby area with the observation data from the meteorological stations. Tyson polygon can consider that the weather conditions in its area are homogeneous, so as to reduce the calculation amount of grid space interpolation. Figure 2 shows the location of the weather stations and the distribution of Tyson’s polygons.
Hydrological data came from the three runoff observation stations of Jingle, Yitang, and Hejin (Table 2) on the main stream of the Fen River, which collected and sorted out monthly natural runoff (i.e., removed the manmade effects of reservoirs and irrigation, among others) at each station in the past years (1981–1999). The three stations served as representative stations in the upper, middle, and lower reaches of the basin, respectively.
In this study, soil vegetation and ground elevation data were mainly used as inputs to the high-resolution VIC simulation framework in Shanxi Province. Among these, soil vegetation data mainly included two parts: soil cover data and soil parameter data (Table 3).
2.3. Method
2.3.1. Runoff and Soil Moisture Reconstruction of Shanxi’s Severe Drought in the Early Years of Guangxu
The reconstructed monthly precipitation series at 95 stations in Shanxi Province from 1875 to 1879 were used as the meteorological driving data of the VIC model to reconstruct the runoff and soil moisture series during the severe drought in Shanxi in the early years of Guangxu. The reconstruction method of the monthly precipitation from 1875 to 1879 at 95 stations in Shanxi Province can be found in our previous research [61]. Since the VIC model requires daily scale precipitation input, processing the reconstructed monthly precipitation sequence daily is necessary. Since the study mainly focused on long-duration drought events, the proportional coefficient method was used to correct the deviation and downscaling of the monthly rainfall from 1875 to 1879 to ensure that the monthly rainfall value after downscaling is not affected. Take the month of year i as an example. The specific steps are as follows:
- Select 1975 as the base year in the period with daily scale meteorological observations, and divide the monthly rainfall of month j in year i by the monthly rainfall in month j of the base year to obtain the rainfall correction coefficient ri, j in year i month j
- Taking the daily rainfall sequence of month j in the base year as the benchmark and multiplying by the correction coefficients ri, j, respectively, the daily rainfall sequence of month j in year i can be obtained. Through the above downscaling method, the daily rainfall sequences of 95 stations in Shanxi Province from 1875 to 1879 were obtained. Combining the latitude and longitude positions and elevation information of each station, the SYMAP method was used to interpolate the rainfall grid. Thereafter, the daily rainfall sequence of each 1/8° grid in Shanxi Province from 1875 to 1879 was obtained.
Due to the lack of relevant historical data, reproducing the temperature and wind speed data from 1875 to 1879 is currently difficult. For this reason, this paper directly selected multiyear average values from 1975 to 1979 as the meteorological driving input required for the model simulation. The monthly runoff and soil moisture series of each 1/8° grid in Shanxi Province from 1875 to 1879 were reconstructed using the downscaling daily meteorological series (rainfall, temperature, and wind speed) from 1875 to 1879 to drive the VIC hydrological model.
2.3.2. VIC Model
The VIC model is a macroscale surface hydrological model that can solve the total balance of water and energy. The VIC model is a grid-based model. It is used to simulate historical and future water volume to help identify drought events.
The VIC model has been used worldwide [36,43,62,63]. The model aggregates weather, land cover, and soil information to simulate long-term to hour-scale runoff, actual evapotranspiration, and soil moisture data [7,61]. The soil moisture calculated by the model can capture the dry and wet conditions of an area [2,3,54,59]. Therefore, the VIC-based simulation is reliable and reasonable for the drought in the study area.
The VIC model mainly comprises an evapotranspiration module, a soil module, and an energy and material balance module. The evapotranspiration module divides the soil into upper and lower soil, which is specifically divided into five layers of soil for independent simulation.
In each calculation grid and simulation step, the VIC model always follows the principle of water balance:
where , P, E, and R represent the time period change of regional water volume, regional time period precipitation, evapotranspiration, and runoff, respectively.
By coupling an independent confluence model, the VIC model converges the simulated runoff in each grid to the outlet of the basin and simulates the flow process of the outlet section. Figure 3 shows a research framework flow chart of this study.
2.3.3. Model Calibration and Validation
Model Input
The input required by the VIC model is divided into two categories. One comprises weather-driven data, such as rainfall, temperature, wind speed, and other variables. The other constitutes DEM ground elevation data and land surface feature data, including soil and vegetation information. In this study, Shanxi Province was divided into 1024 grids with a spatial resolution of 1/8° (12 km) to prepare the land surface parameters and meteorological forcing grid data required by the VIC model.
- (1)
- Meteorological forced input
The meteorological data required for the VIC model simulation mainly include rainfall, minimum, maximum, and average temperature, average wind speed, average water pressure, solar radiation, and average relative humidity. On the basis of the meteorological data from 95 meteorological stations in Shanxi Province from 1975 to 2009, this study used the SYMAP algorithm to interpolate the daily observations of variables such as rainfall, temperature, and wind speed at 95 stations to a grid with a spatial resolution of 1/8°. The interpolation considered the influence of altitude on temperature. So, far, a set of VIC model meteorological forced input data (including rainfall, maximum temperature, minimum temperature, and wind speed) covering the entire territory of Shanxi Province with a spatial resolution of 1/8° was generated. The beginning and ending years are 1975 and 2009, respectively, and the time resolution is on a daily scale.
- (2)
- Land surface parameters
The land surface parameters required by the model mainly include geographic information, land use, topography, and soil parameter data. In this paper, the global DEM data with a resolution of 1 km were resampled to a spatial grid with a spatial resolution of 1/8° to obtain ground elevation information in Shanxi Province. The vegetation data used the 1 km global land cover data from the University of Maryland database. On the basis of the vegetation parameter file of the national VIC model with a resolution of 0.25°, this study used interpolation and other series of processing to obtain the vegetation coverage data and terrain parameters of Shanxi Province 1/8° grid. These parameters are used as a vegetation-type parameter database file required for the model and as a topography parameter file. It should be noted that this research assumed that the vegetation type or land cover in Shanxi Province remained unchanged during the research period (1875–1879). The soil parameters required by the VIC model were derived from the global 5′ soil dataset provided by the Food and Agriculture Organization of the United Nations (FAO). This study processed these data to a 1/8° spatial resolution.
- (3)
- Confluence model input
The data of the confluence module mainly include the regional precipitation unit line, confluence flow direction, and other data. In this study, the flow direction file of the Fenhe River Basin and the effective area ratio file of each 1/8° grid in the basin were extracted and obtained. Since we focused on monthly scale simulation, we directly adopted the default values provided by the model for the flow velocity, flow diffusion coefficient, monthly unit line, and other parameters required by the confluence model; that is, the set flow velocity is 1.5 m/s, and the flow diffusion coefficient is 800 m2/s.
Model Calibration
In this study, the gridded (1/8°) meteorological forcing dataset and land surface parameter data generated from 1975 to 2009 were used to drive the VIC model to obtain the daily sequence of surface and underground runoff for each grid in a specified time period. Three runoff observation stations located in the main stream of the Fen River were selected. The VIC model was calibrated and verified by comparing the observed runoff with the simulated runoff. The calibrated parameters are shown in Table 4.
We selected the natural runoff (i.e., runoff with no manmade effects from reservoirs, irrigation) from the three runoff observation stations of Jingle, Yitang, and Hejin in the Fenhe River Basin for 20 years (1981–2000) to calibrate the model parameters. On the basis of the principle of climate similarity, the parameters of the calibrated area were further used for the uncorrected area, and the model parameters of all 1/8° grids in Shanxi Province were finally determined.
In this study, the optimal combination of parameter simulation values was used to simulate runoff and soil moisture content. Two quantitative statistical indicators, the Naxi efficiency coefficient (Ef) and relative error (Er), were used to evaluate the effect of the model parameter correction. The specific calculation formulas are as follows:
where and refer to the observed and simulated discharge in month i (m3∙s−1), respectively. and refers to the observed and simulated multiyear average flow (m3∙s−1), respectively.
2.3.4. Meteorological Drought Indicator
We chose the soil moisture anomaly percentage (SMAP) and runoff anomaly percentage (RAP) as the diagnostic indicator of drought to characterize the temporal evolution of drought in Shanxi Province during the early years of Guangxu in the Qing Dynasty (1875–1879). SMAP (RAP) was used to characterize the degree of deviation of soil moisture (runoff) in a certain period from the multiyear average, and it can directly reflect the drought caused by the shortage of soil moisture (runoff).
where is the percentage of soil moisture (runoff) anomaly (%), is the soil moisture (runoff) in a certain period (mm), and is the multiyear average of soil moisture (runoff) in the same period (mm). Table 5 shows the drought grades of SMAP and RAP.
3. Results
3.1. Model Applicability Evaluation
Figure 4 shows the comparison of the VIC-simulated and monthly observed runoffs at each site during the calibrate period, with 1981–1990 being the calibrated period. On a multiyear average scale, the relative errors between the VIC-simulated and observed runoff values at the three stations were relatively low: −10.32%, 27.34%, and −2.33% for the Jingle, Yitang, and Hejin stations, respectively. This shows that the multiyear average value of the VIC simulation is very close to the observed value.
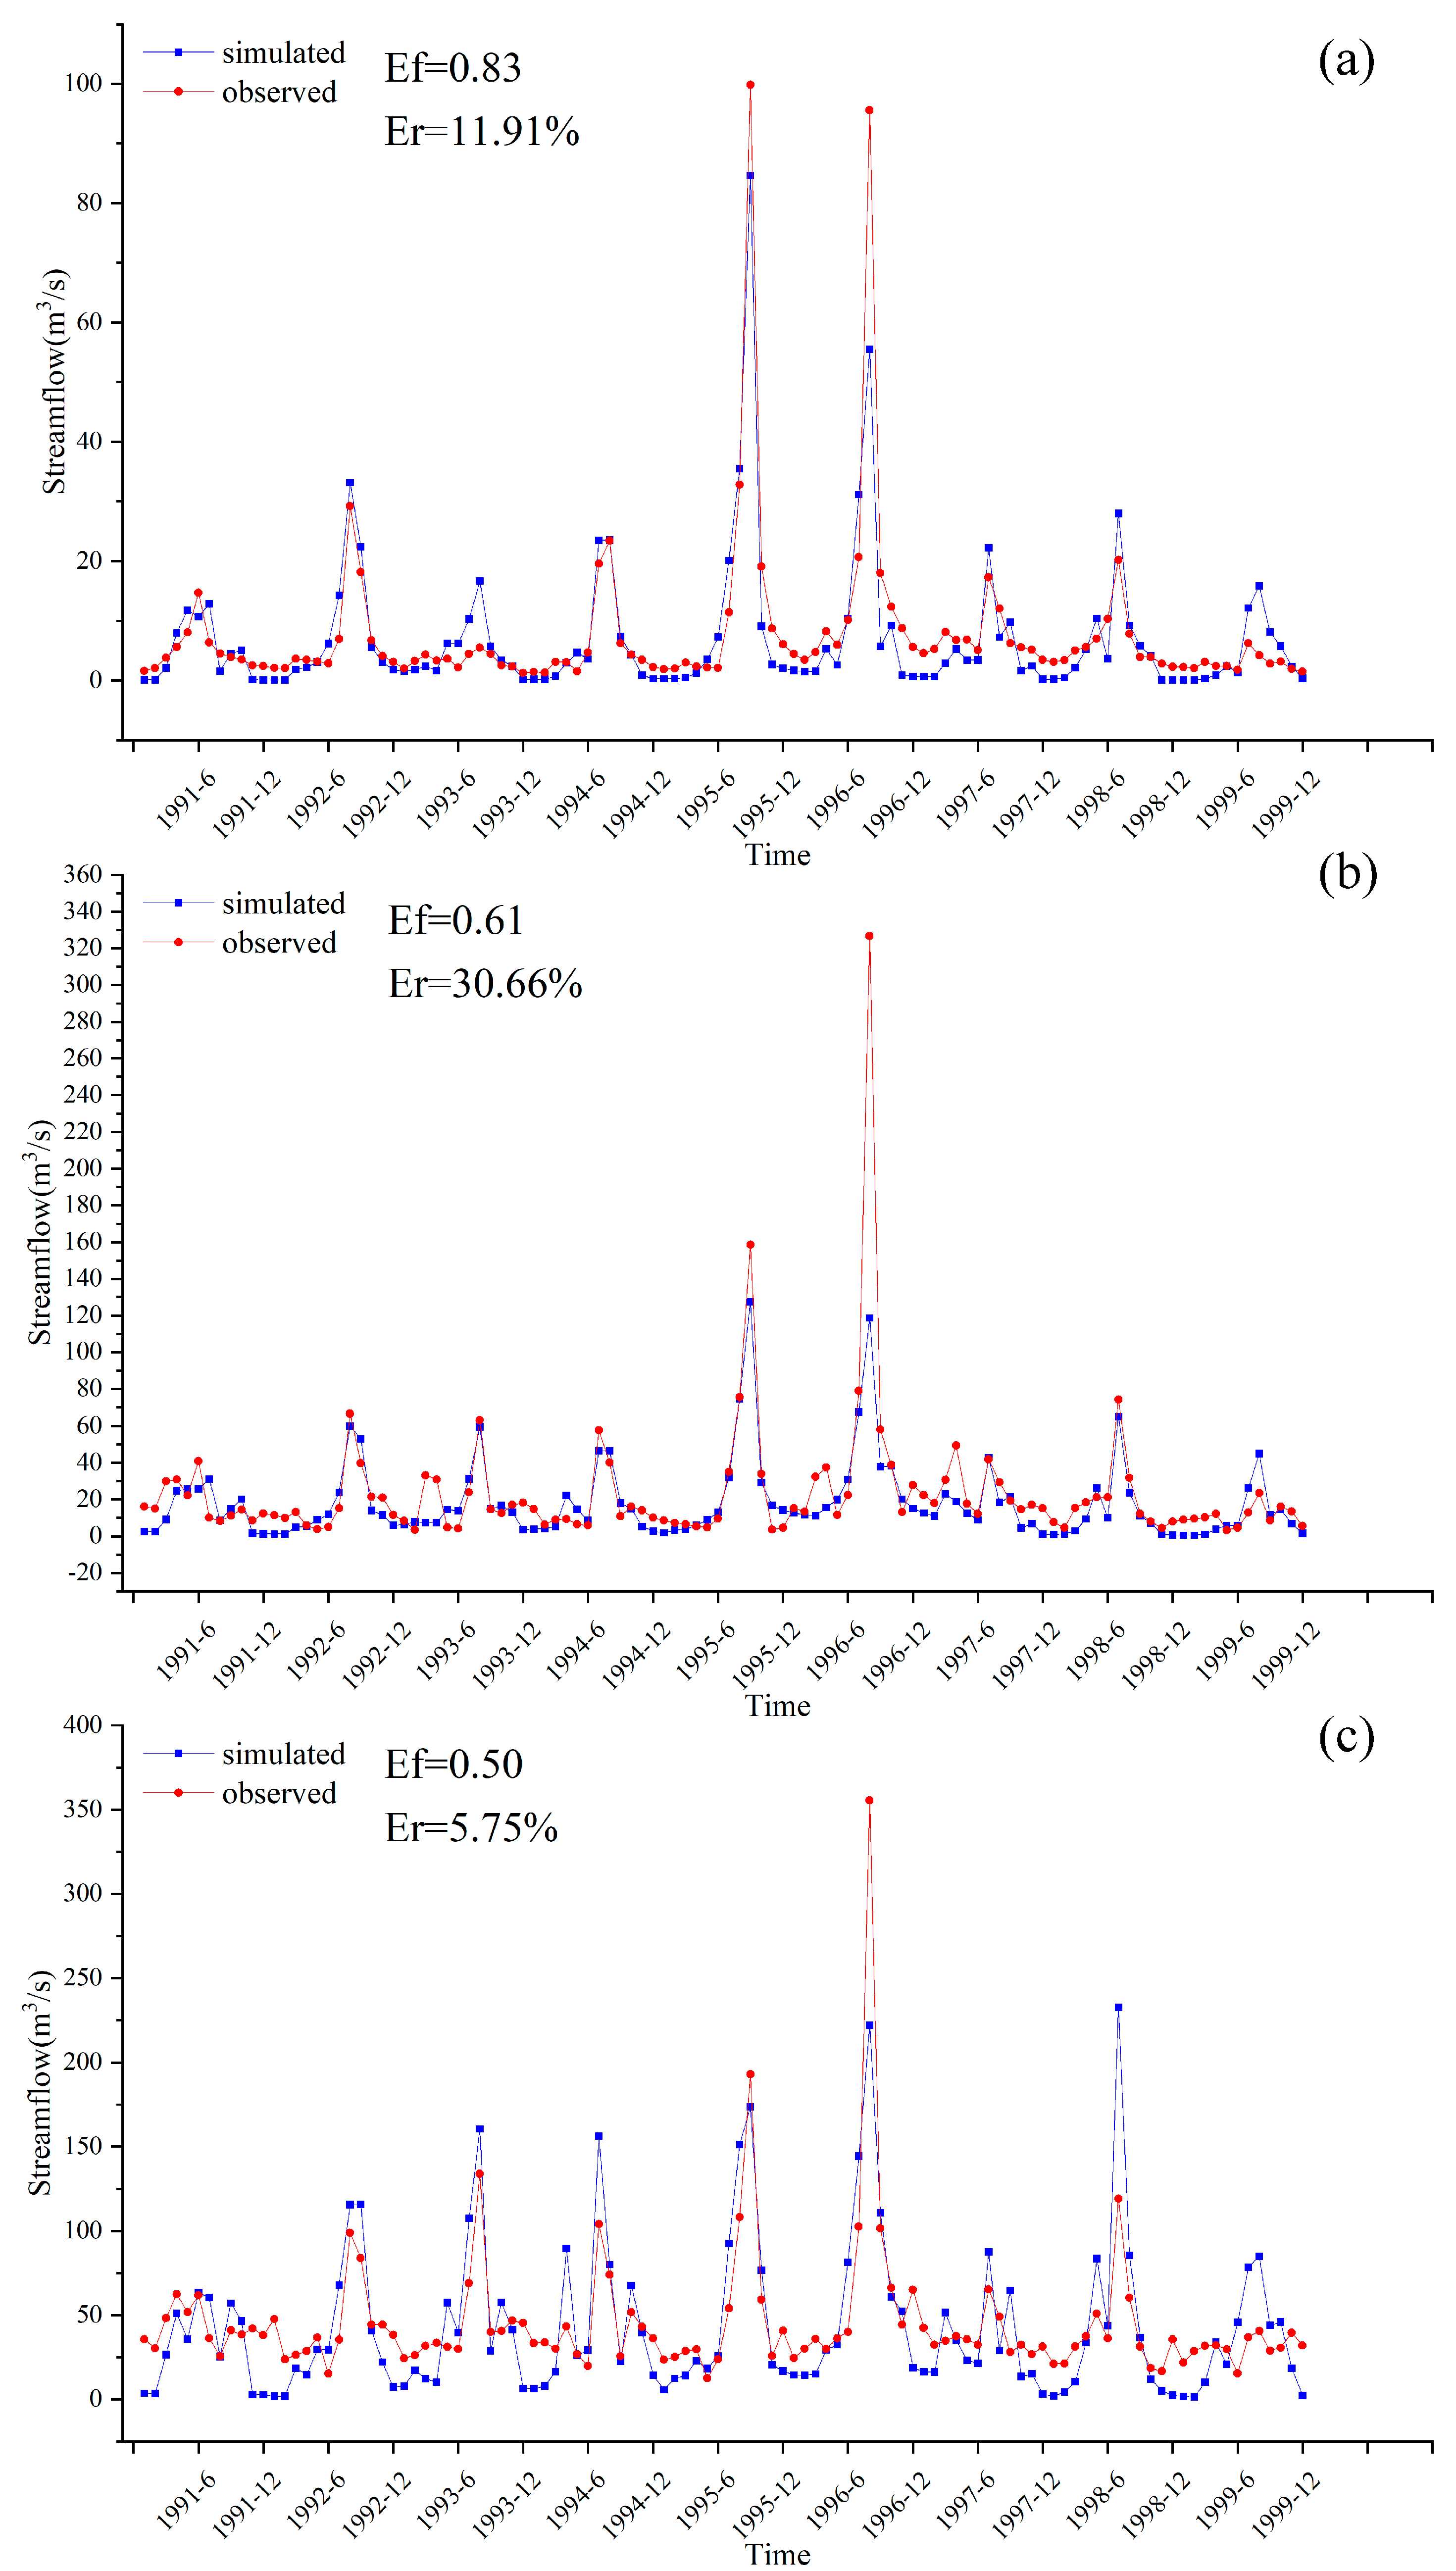
Figure 5 shows the comparison of the VIC-simulated and monthly observed runoff on a multiyear average scale, the relative errors between the simulated and observed values of the VIC runoff at the three stations were all relatively low: 11.91%, 30.66%, and 5.75% for the Jingle, Yitang, and Hejin stations, respectively. This shows that the VIC-simulated multiyear average value is very close to the observed value. This evaluation shows that the corrected VIC model can successfully reproduce the interannual variation and long-term trend of runoff in the Fenhe River Basin and can be used to reconstruct the water cycle process of the Fenhe River Basin.
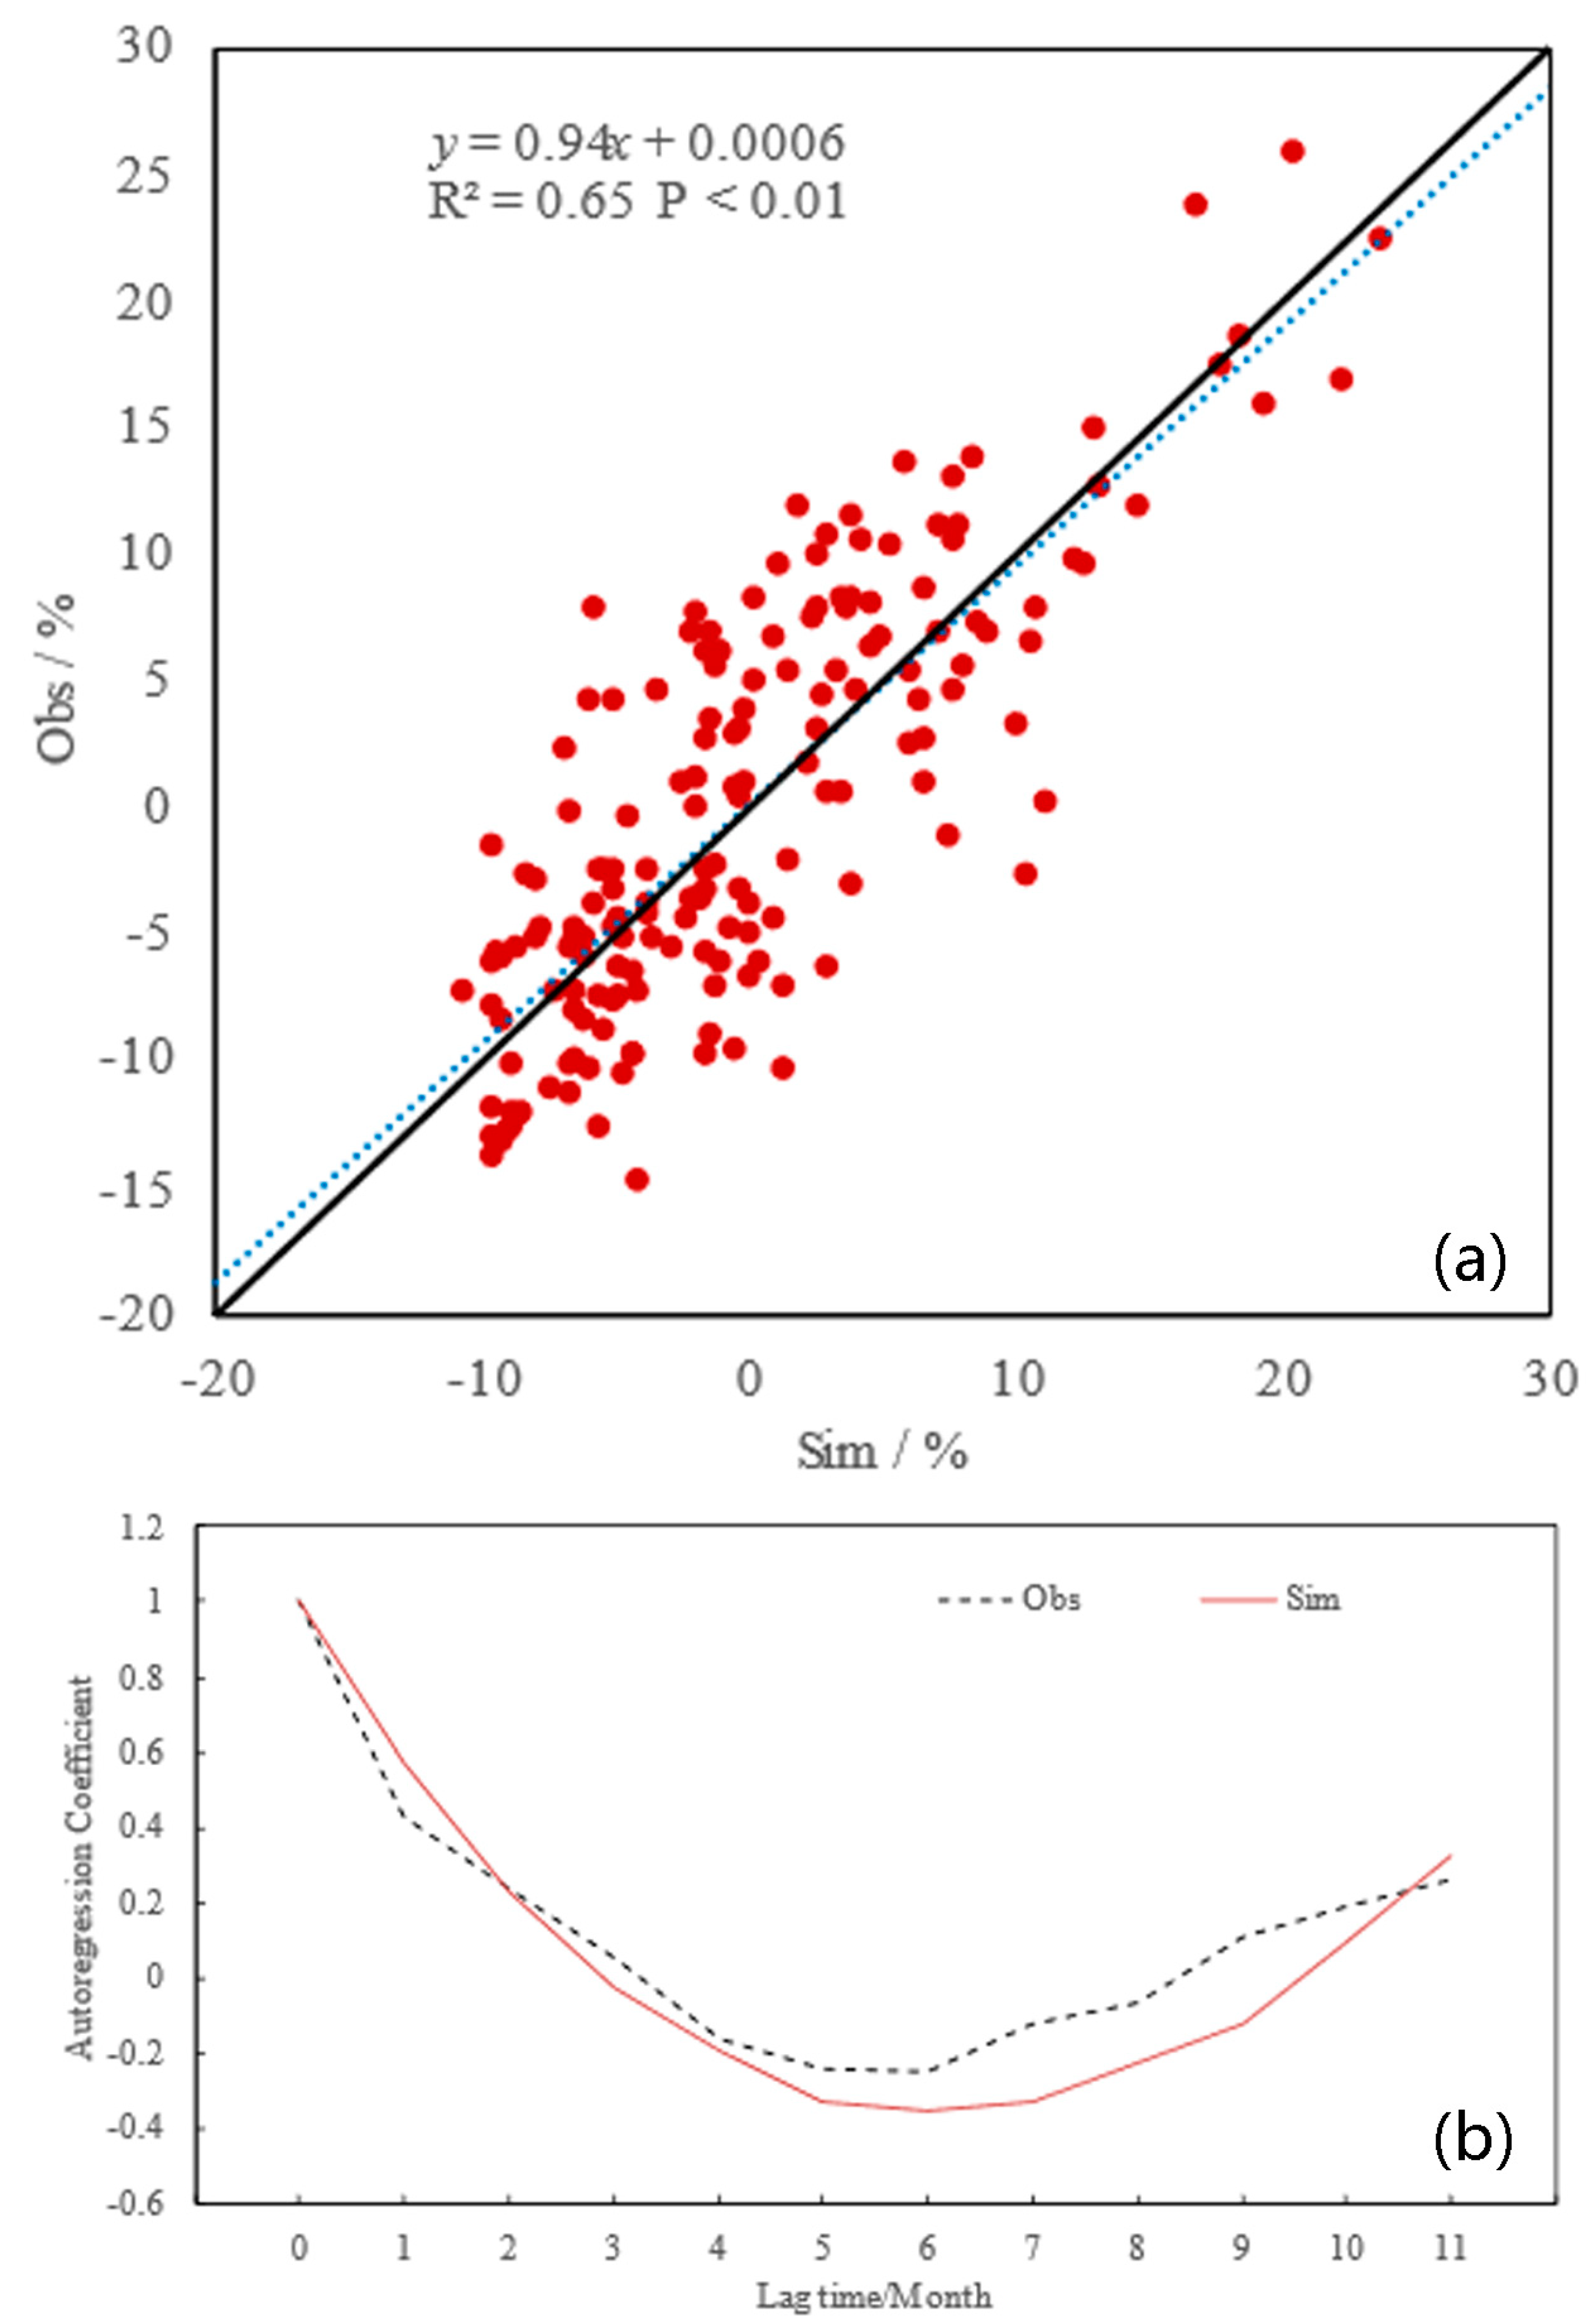
In order to verify the accuracy of the model in simulating soil moisture, model simulations were compared with soil moisture observations. Their average values for each month from January 1994 to December 2009 in the region were calculated to maintain spatial and temporal consistency. Figure 6a shows the comparison of anomaly percentage between model simulations and soil moisture observations at 0~50 cm depths in Shanxi. The scatters in Figure 1 were fitted using linear equations. In this case, the R2 is 0.65 and the p value is less than 0.01, which indicates that the model fits well. The slope and intercept of the linear equation are 0.94 and 0.0006, respectively, demonstrating that the simulated soil moisture has a good agreement with the observed values. Additionally, their autoregressive coefficients from 1 to 12 months show similar trends, that is, they have similar periodicity (Figure 6b). Overall, the verification of the VIC simulations in the soil moisture shows its suitability of application over Shanxi Province.
3.2. Runoff Reconstruction Results
The drought during the early Guangxu years was severe. According to historical records, the longest continuous rainless period lasted for 340 days. The accompanying famines, locust plagues, and epidemic diseases frequently occurred, which seriously affected the region. According to local chronicles, the Yellow River, Fenhe, Huihe, and Luanshui in the southern part of Shanxi all experienced a drastic reduction or even depletion in precipitation during the 3 years of Guangxu. According to Zeng Guoquandi’s August memoir, “Since the beginning of summer in Shanxi Province, the Weihe River has been in a sluggish period of rain and the water in the Weihe River is shallow, and it is more difficult to transport salt.” Although we are talking about the situation of the Weihe River, the Weihe River is relatively close to the southwestern part of Shanxi, which to a certain extent reflects the decrease in surface runoff in the southern part of Shanxi.
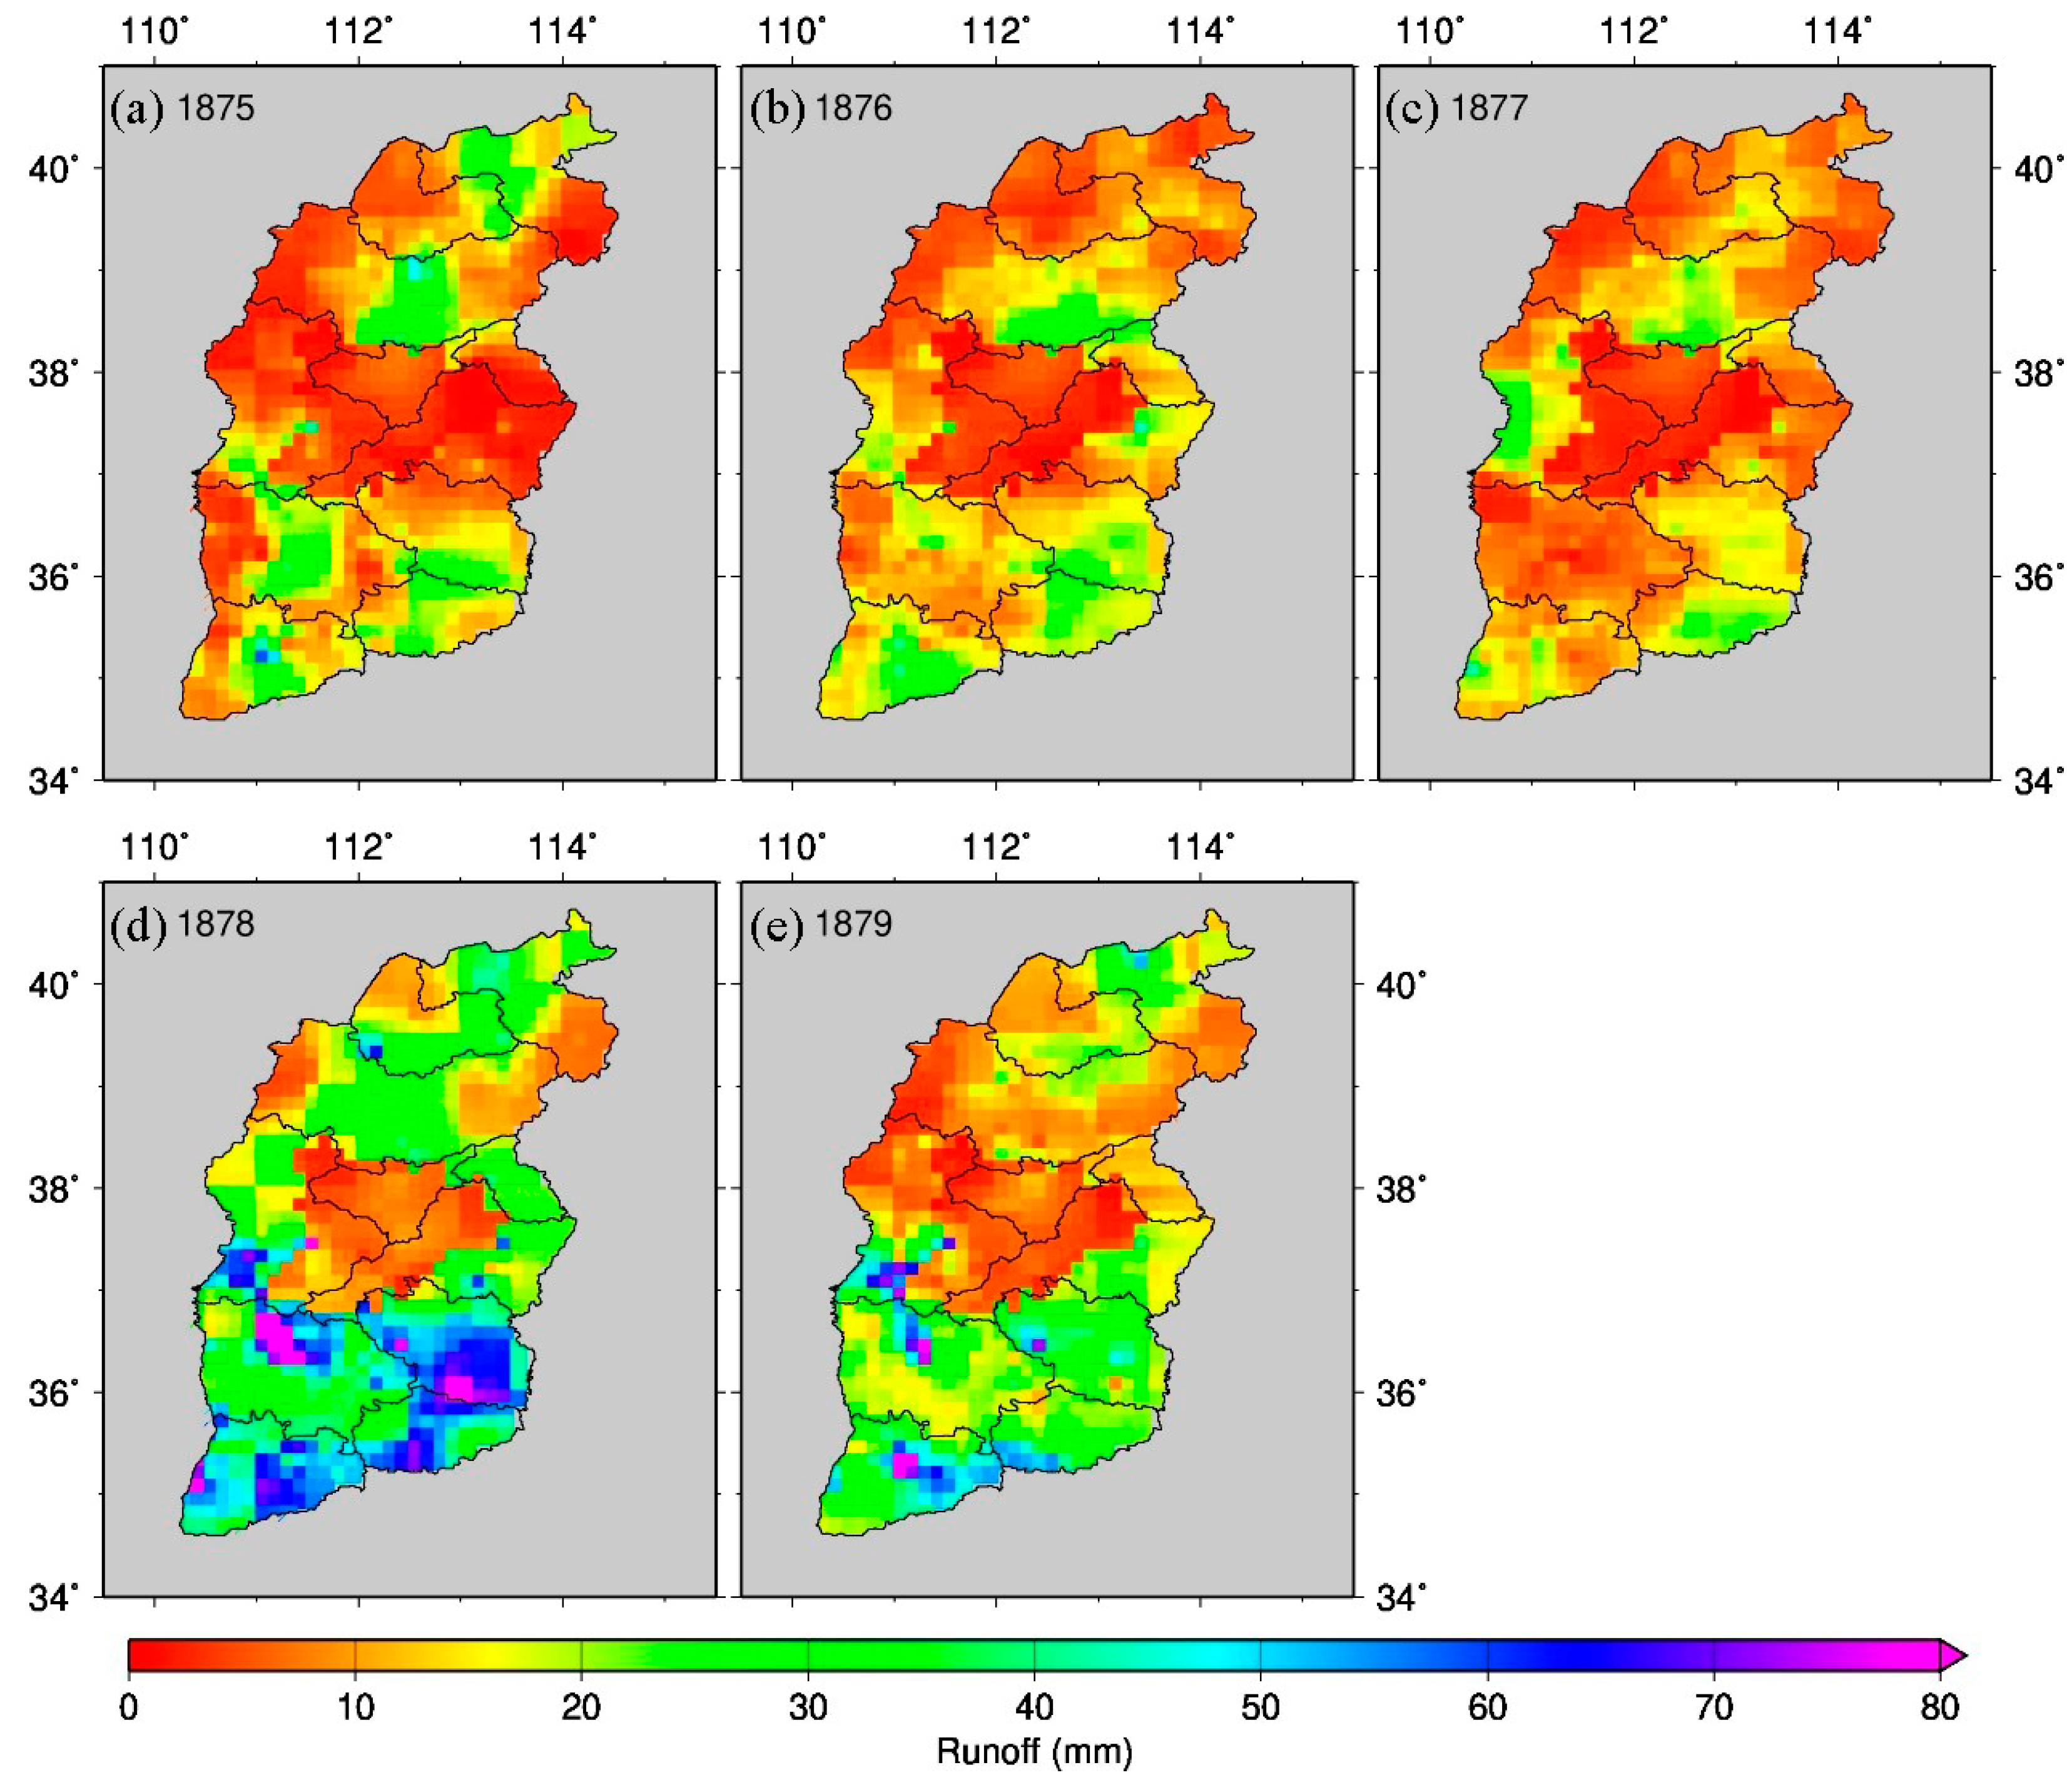
Figure 7 shows the spatial distribution of annual runoff depth in Shanxi Province from 1875 to 1879. Overall, the annual runoff depth in each region from 1875 to 1877 was less than 60 mm. The runoff depth in 1875 was between 0.16 and 58.69 mm. In 1876, it was between 0.41 and 43.47 mm, and in 1877, it was between 0.53 and 41.9 mm. Compared with that from 1875 to 1877, the annual runoff depth increased from 1878 to 1879. The maximum runoff depth in 1878 was 122.42 mm, and that in 1879 was 106.33 mm. With the grid used as a unit, the proportions of areas with runoff depths less than 10 mm are counted year by year. The results show that the proportions of such areas throughout Shanxi from 1875 to 1879 were 55%, 48%, 58%, 19%, and 30%, respectively. From 1878 to 1879, the proportions of areas with runoff depths greater than 60 mm were 8% and 2%, respectively. It can be seen that compared with that in 1878–1879, the hydrological drought in 1875–1877 was more serious, and the area covered by drought was about 30% higher.
In terms of regional averages, during the entire drought from 1875 to 1879, Shanxi’s multiyear average annual runoff depth was only 16.34 mm. The annual average annual runoff depths were 11.38, 11.58, 9.88, 29.79, and 19.10 mm. Spatially, from 1875 to 1879, the runoff depth in the central part of Shanxi Province was less than 10 mm for many consecutive years. From 1875 to 1877, there was no obvious change in the spatial distribution of the runoff depth. In 1878, the runoff depth in other regions was less than 10 mm. The depth significantly increased, and the annual runoff depth in Changzhi in Shanxi Province exceeded 70 mm. Compared with that in 1878, the runoff depth of the whole territory decreased in 1879. The runoff depth in the southern region was significantly greater than that in the northern region, showing obvious large and small spatial patterns in the south and north, respectively.
3.3. Soil Moisture Reconstruction Results
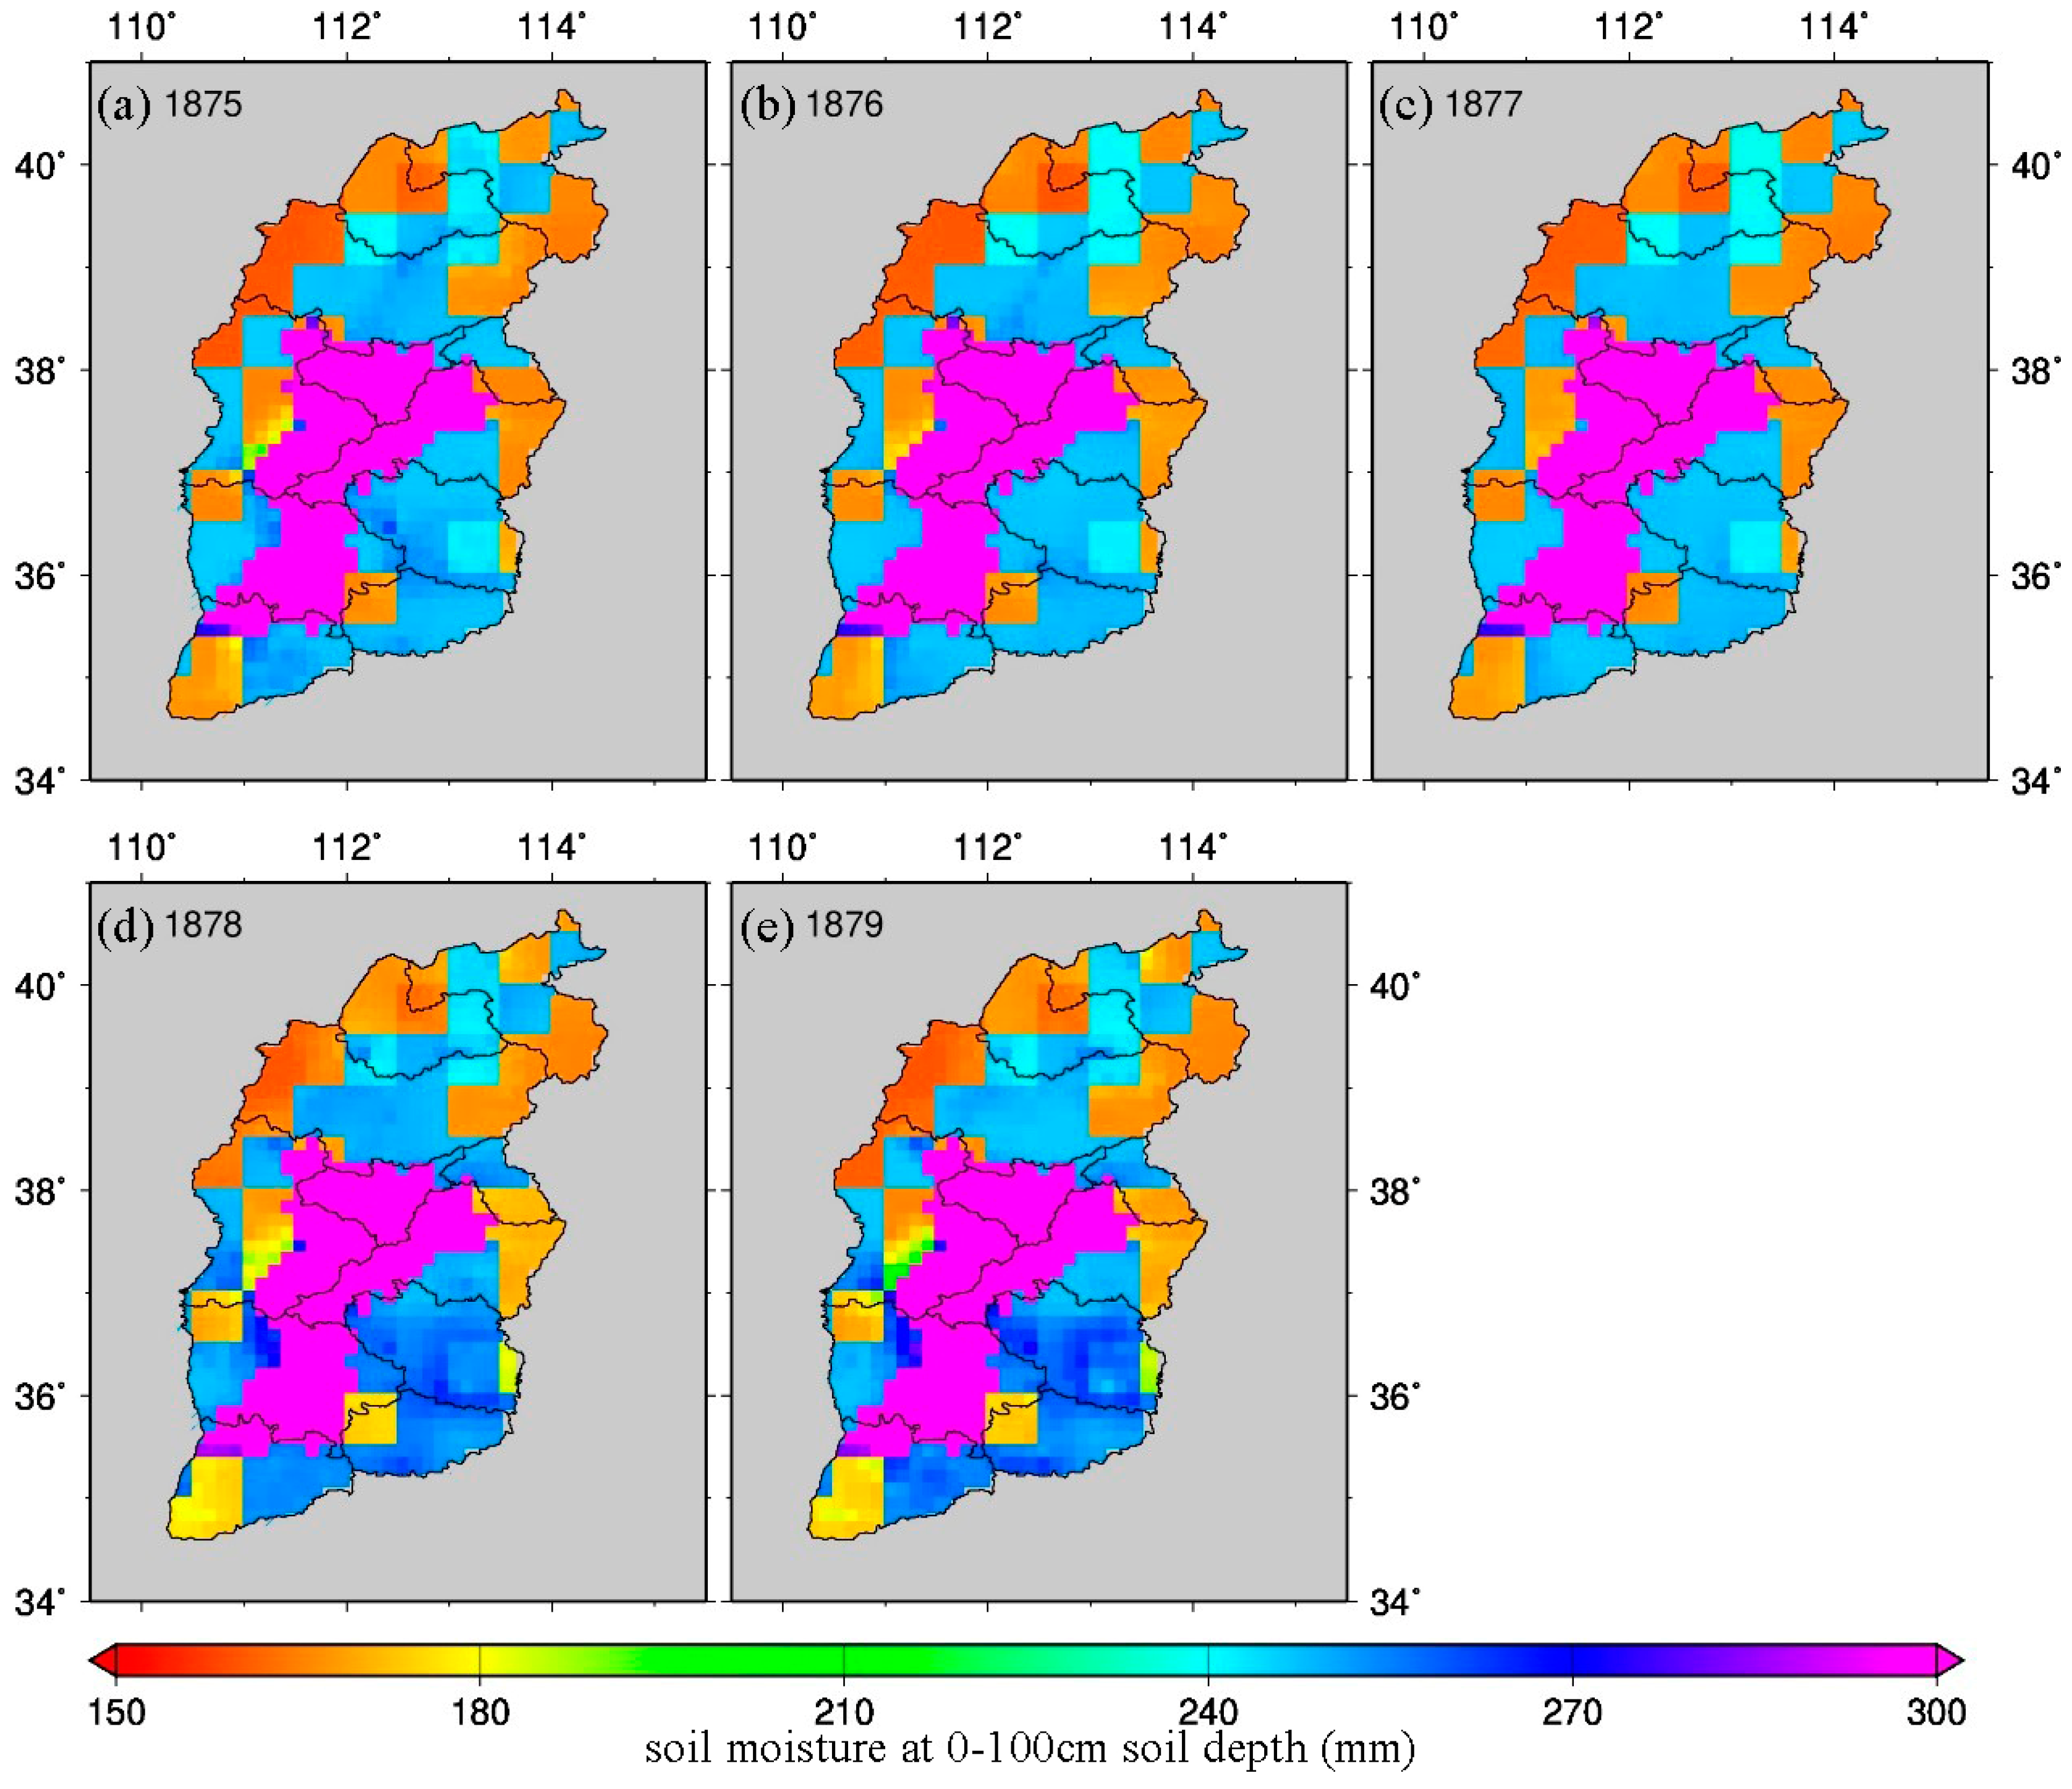
Figure 8 shows the spatial distribution of the average soil moisture content in Shanxi Province from 1875 to 1879. Overall, the various regions’ annual average soil moisture content stabilized between 150 and 510 mm from 1875 to 1879. Among these, the average annual soil moisture contents were from 159.7 to 484.5 mm in 1875, 159.7 to 469.2 mm in 1876, 160.5 to 459.9 mm in 1877, 160 to 484.9 mm in 1878, and 159.7 to 505.6 mm in 1879. The figure shows that the interannual change in soil moisture content from 1875 to 1879 was not noticeable. The distribution of soil moisture content throughout the years gradually decreased from the central area to the surrounding areas. The central region, mainly the upper and middle reaches of the Fenhe River Basin, has soil moisture content greater than 300 mm, accounting for 23% of the entire territory. The area with a soil moisture content of less than 180 mm accounted for 31%.
3.4. SMAP and RPA
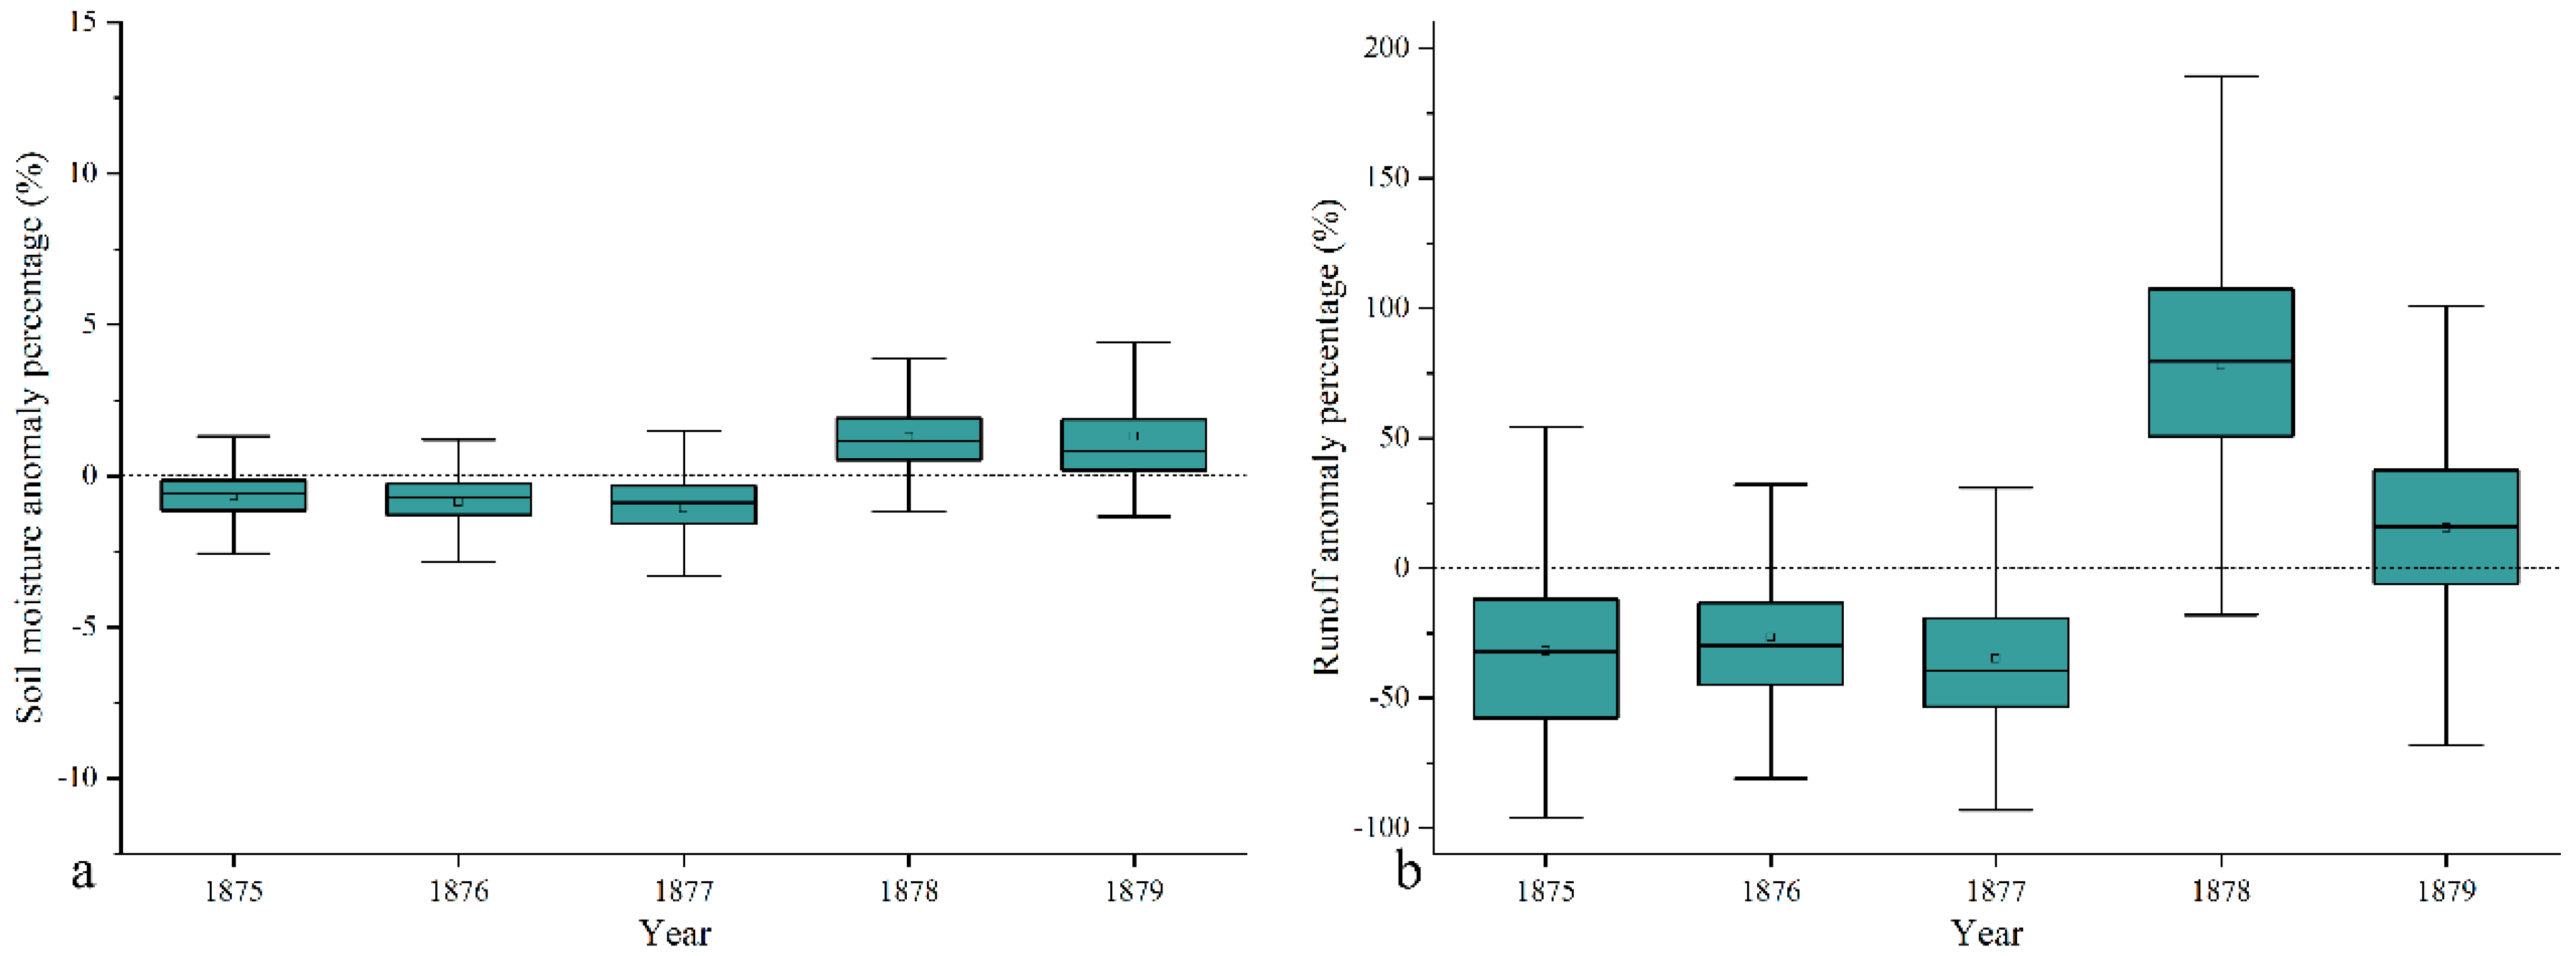
The percentage of soil moisture abnormalities was low in 1875–1877 and higher in 1878–1879 (Figure 9). The first three years were relatively dry years, and the drought eased in the next three years. The overall level is between −5 and 5%.
The percentage of abnormal runoff was similar to the percentage of abnormal rain and soil moisture between 1875–1879, which was low in the first three years and relatively high in the second two years. However, the variation range for the abnormal percentage of runoff is much higher than the abnormal percentage of soil moisture. Especially in 1878, the percentage of runoff anomalies varied from −25 to 200%.
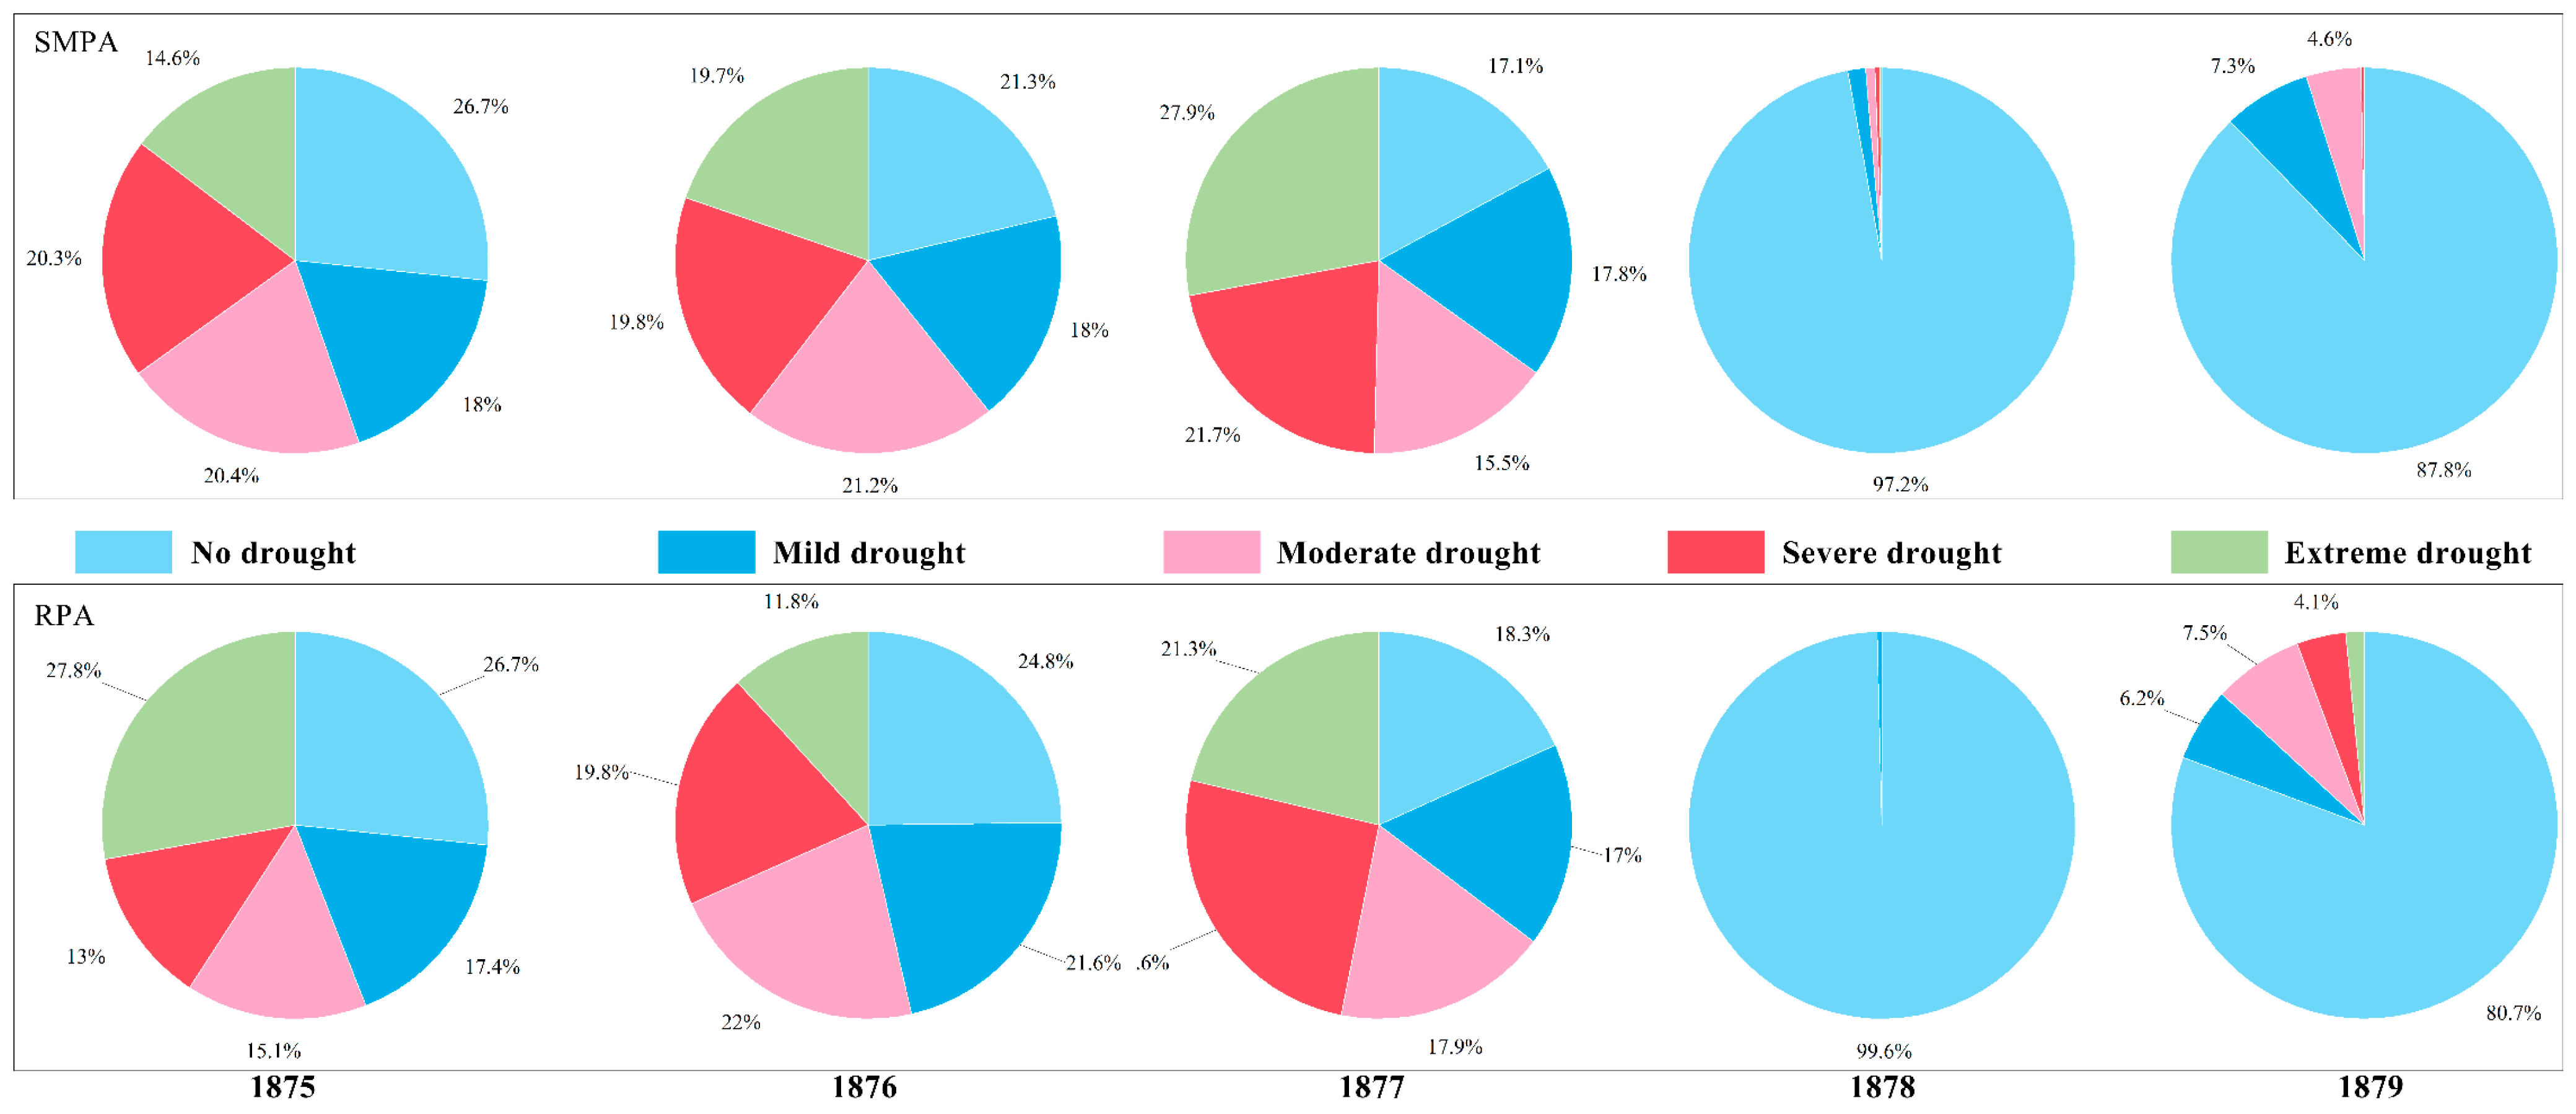
Using the percentage of soil moisture abnormality as a drought indicator, the drought area was relatively high during 1875–1877 (Figure 10). The drought area in the three years was 73.3%, 78.7%, and 82.9%, and the extreme drought area was 14.6%, 19.7%, and 27.9%, respectively. During 1878–1879, the arid area decreased significantly, and the non-arid area accounted for 97.2% and 87.8%, respectively.
Using the percentage of runoff abnormality as a drought indicator, the drought area was also relatively high during 1875–1877. The drought area in the three years was 73.3%, 75.2%, and 81.7%, and the extreme drought area was 27.8%, 11.8%, and 21.3%, respectively. During 1878–1879, the arid area decreased significantly, and the non-arid area accounted for 99.6% and 80.7%, respectively.
In general, the drought was the most severe in 1877, followed by 1876, and the drought relief in 1878 was the highest. In addition, the degree of variation in the runoff drought is higher than that of soil moisture drought, and runoff is more affected by the environment than soil moisture.
4. Discussion
In recent years, with the global climate changing abnormally, more intense local or regional drought disasters frequently occur. In the future, the tendency of seasonal and annual large-scale extreme drought events will increase [7]. However, previous studies have not considered the occurrence and impact of drought events in historical periods [35]. Extreme drought similar to those in the historical period would pose serious threats to food, drinking water, and ecological security if they were to occur in the present, with dire consequences [21].
The “Yu–Xue–Fen–Cun” data from the Qing Palace Archives for the Qing Dynasty are nationwide observation records of infiltration depth or snow thickness from 1736 to 1911 [14]. These are among the most reliable drought and flood series data for high-resolution reconstruction [9]. The key issue that needs to be solved is quantifying the “Yu–Fen–Cun” into precipitation for the quantitative reconstruction of typical historical drought events [8]. This study simulates historical runoff and soil water data based on historical observation data combined with the VIC model. This method provides an important reference for the study of historical drought events and has broad application prospects.
The study of historical climate is a window to predict the future climate. “Yu-Xue-Fen-Cun” data have laid a solid data foundation for reproducing historical climate conditions. We reconstructed the extreme drought in Shanxi Province from 1875 to 1879 based on precious “Yu-Xue-Fen-Cun” data through the methods of intersection of social sciences and natural sciences such as history, hydrology, and disaster studies. Of course, this study also has shortcomings and limitations. In the process of establishing and verifying the model, due to the complexity of the underlying surface, the Ef of the runoff simulated by the Hejin Station during the verification period was only 0.44, and the simulation results were not ideal (Figure 5). However, it is worth noting that the Ef of other sites are all greater than 0.6, which also shows that our method is feasible in the method of simulating historical runoff and soil moisture based on historical observation data combined with the model. In the future, more investment will be needed in the parameter setting process to ensure that the simulation results of each site are satisfactory. In addition, due to the influence of terrain, altitude, vegetation and other factors, many parameters vary from place to place, such as snowfall density, rainfall infiltration coefficient, and soil parameters. Due to limited data, we referred to existing research to set these parameters. Therefore, it may cause errors in the results. However, from an overall point of view, the reconstructed precipitation distribution in Shanxi Province, such as the multiyear precipitation spatial distribution in Shanxi Province, has the characteristics of a dry northwest and humid southeast [20]. Therefore, the reconstructed data are reliable to a certain extent and can reflect historical drought conditions in Shanxi from 1875 to 1875.
Due to the limitation of soil moisture data collection, the soil moisture results of the model have not been verified. The reliability evaluation of the model in this study is mainly based on surface runoff. Our next work will be to complete the collection of soil moisture data as much as possible, and to complete the verification of soil moisture and surface runoff of the VIC model in the future, which is a new direction of efforts in the future.
This study can provide a reliable data basis for current drought assessment and future drought prediction in Shanxi Province, as well as methodological guidance for historical climate reconstruction research based on “Yu-Xue-Fen-Cun” data in different regions of China [64]. In the future, we will further explore the parameter settings of the model through investigations and experiments to obtain more accurate and complete historical climate data. We will also further analyze the changes between the reconstructed historical climate data and the current climate data, as well as its impact on agricultural production, population economy, and other factors. We hope that these studies can make a little contribution to the prediction of future climate change.
5. Conclusions
Since 1970, drought events have become more common worldwide, especially in tropical and subtropical regions (IPCC, 2007). Drought may frequently occur, threatening local society and agricultural development [39]. In this case, exploring the historical changes in droughts is essential to provide references for drought prediction and mitigation. Using the rain and snow records of the Qing Dynasty, this study reconstructed the runoff and soil moisture series in the early years of Guangxu in the Qing Dynasty (1875–1879). On the basis of the long sequence (>20 years) runoff observation data of three major hydrological stations in the Fenhe River Basin in Shanxi Province, the parameters of the VIC model were corrected, and a high-resolution (~10 km) VIC simulation framework suitable for Shanxi Province was constructed. On this basis, the reconstructed monthly precipitation sequence from 1875 to 1879 was downscaled into a continuous daily sequence to drive the VIC hydrological model to reconstruct the monthly runoff and soil moisture series from 1875 to 1879 in Shanxi Province.
The spatial analysis shows that from 1875 to 1879, the proportions of areas with runoff depths less than 10 mm in Shanxi were 55%, 48%, 58%, 19%, and 30%, respectively. From 1875 to 1877, the annual runoff depths in all regions were less than 60 mm. The drought was more serious in 1877 and covered a large area. Overall, the annual average soil moisture content of various regions from 1875 to 1879 was stable between 150 and 510 mm, and the interannual variation in soil moisture content was not evident. The distribution of soil moisture content throughout the years gradually decreased from the central area to the surrounding area. The area with soil moisture content less than 180 mm accounted for as high as 31% of the total area.
By combining hydrological models and historical records such as the rain and snow records of the Qing Dynasty, we proved the possibility of reconstructing historical drought events. This provides a feasible means for the quantitative monitoring of historical drought events and a reference for future assessment of drought impacts.
Author Contributions
Y.Q.: Methodology, Formal analysis, Data curation, Writing—Original draft preparation; X.Z.: Formal analysis, Software, Resources, Software; J.Z.: Formal analysis, Validation, Investigation; Z.L.: Formal analysis, Validation; J.L.: Conceptualization, Writing—Reviewing and Editing, Supervision, Project administration, Funding acquisition. All authors have read and agreed to the published version of the manuscript.
Funding
The authors thank the national key research and development program funded project (2021YFC3000203), the Ministry of Water Resources’ flood and drought disaster prevention strategy research talent innovation team project (WH0145B042021), and the National Natural Science Foundation of China (42001039) for financial support.
Institutional Review Board Statement
Not applicable.
Data Availability Statement
The data that support the findings of this study are available from the corresponding author upon reasonable request.
Acknowledgments
The author thanks the editors and anonymous reviewers for their efforts and help, which has greatly improved the quality of this article.
Conflicts of Interest
The authors declare no conflict of interest.
References
- Allen, C.D.; Macalady, A.K.; Chenchouni, H.; Bachelet, D.; McDowell, N.; Vennetier, M.; Kitzberger, T.; Rigling, A.; Breshears, D.D.; Hogg, E.H.; et al. A global overview of drought and heat-induced tree mortality reveals emerging climate change risks for forests. For. Ecol. Manag. 2010, 259, 660–684. [Google Scholar] [CrossRef] [Green Version]
- Andreadis, K.M.; Clark, E.A.; Wood, A.W.; Hamlet, A.F.; Lettenmaier, D.P. Twentieth-century drought in the conterminous United States. J. Hydrometeorol. 2005, 6, 985–1001. [Google Scholar] [CrossRef]
- Chen, H.; Sun, J. Changes in Drought Characteristics over China Using the Standardized Precipitation Evapotranspiration Index. J. Clim. 2015, 28, 5430–5447. [Google Scholar] [CrossRef]
- Cook, B.I.; Ault, T.R.; Smerdon, J.E. Unprecedented 21st century drought risk in the American Southwest and Central Plains. Sci. Adv. 2015, 1, e1400082. [Google Scholar] [CrossRef] [Green Version]
- Cristi, F.; Fierro, V.; Suarez, F.; Munoz, J.F.; Hausner, M.B. A TDR-waveform approach to estimate soil water content in electrically conductive soils. Comput. Electron. Agric. 2016, 121, 160–168. [Google Scholar] [CrossRef]
- Dai, A. Drought under global warming: A review. WIREs Clim. Change 2011, 2, 45–65. [Google Scholar] [CrossRef] [Green Version]
- Feng, S.; Qiu, J.; Crow, W.T.; Mo, X.; Liu, S.; Wang, S.; Gao, L.; Wang, X.; Chen, S. Improved estimation of vegetation water content and its impact on L-band soil moisture retrieval over cropland. J. Hydrol. 2023, 617, 129015. [Google Scholar] [CrossRef]
- Ge, Q.; Zheng, J.; Tian, Y.; Wu, W.; Fang, X.; Wang, W.-C. Coherence of climatic reconstruction from historical documents in China by different studies. Int. J. Climatol. 2008, 28, 1007–1024. [Google Scholar] [CrossRef]
- Ge, Q.S.; Zheng, J.Y.; Hao, Z.X.; Liu, Y.; Li, M.Q. Recent advances on reconstruction of climate and extreme events in China for the past 2000 years. J. Geogr. Sci. 2016, 26, 827–854. [Google Scholar] [CrossRef] [Green Version]
- Ghasemloo, N.; Matkan, A.A.; Alimohammadi, A.; Aghighi, H.; Mirbagheri, B. Estimating the Agricultural Farm Soil Moisture Using Spectral Indices of Landsat 8, and Sentinel-1, and Artificial Neural Networks. J. Geovisualization Spat. Anal. 2022, 6, 19. [Google Scholar] [CrossRef]
- Guo, P.; Zhao, X.; Shi, J.; Huang, J.; Tang, J.; Zhang, R.; Chen, J.; Wang, Q.; Zeng, J. The influence of temperature and precipitation on the vegetation dynamics of the tropical island of Hainan. Theor. Appl. Climatol. 2021, 143, 429–445. [Google Scholar] [CrossRef]
- Hao, Z.; Chen, S.; Li, Z.; Yu, Z.; Shao, Q.; Yuan, F.; Shi, F. Quantitative assessment of the impacts of irrigation on surface water fluxes in the Tarim River, China. Hydrol. Res. 2015, 46, 996–1007. [Google Scholar] [CrossRef]
- Hao, Z.; Yu, Y.; Ge, Q.; Zheng, J. Reconstruction of high-resolution climate data over China from rainfall and snowfall records in the Qing Dynasty. Wiley Interdiscip. Rev. Clim. Change 2018, 9, e517. [Google Scholar] [CrossRef]
- Hao, Z.X.; Zheng, J.Y.; Ge, Q.S. Precipitation cycles in the middle and lower reaches of the Yellow River (1736–2000). J. Geogr. Sci. 2008, 18, 17–25. [Google Scholar] [CrossRef]
- Kadupitiya, H.K.; Madushan, R.N.D.; Gunawardhane, D.; Sirisena, D.; Rathnayake, U.; Dissanayaka, D.; Ariyaratne, M.; Marambe, B.; Suriyagoda, L. Mapping Productivity-related Spatial Characteristics in Rice-based Cropping Systems in Sri Lanka. J. Geovisualization Spat. Anal. 2022, 6, 26. [Google Scholar] [CrossRef]
- Kim, E.-S. Simulation of Daily Soil Moisture Content and Reconstruction of Drought Events from the Early 20th Century in Seoul, Korea, using a Hydrological Simulation Model, BROOK. J. Ecol. Environ. 2010, 33, 47–57. [Google Scholar] [CrossRef] [Green Version]
- Leng, S.; Huete, A.; Cleverly, J.; Gao, S.; Yu, Q.; Meng, X.; Qi, J.; Zhang, R.; Wang, Q. Assessing the Impact of Extreme Droughts on Dryland Vegetation by Multi-Satellite Solar-Induced Chlorophyll Fluorescence. Remote Sens. 2022, 14, 1581. [Google Scholar] [CrossRef]
- Leng, S.; Huete, A.; Cleverly, J.; Yu, Q.; Zhang, R.; Wang, Q. Spatiotemporal Variations of Dryland Vegetation Phenology Revealed by Satellite-Observed Fluorescence and Greenness across the North Australian Tropical Transect. Remote Sens. 2022, 14, 2985. [Google Scholar] [CrossRef]
- Li, M.; Ma, Z. Soil moisture drought detection and multi-temporal variability across China. Sci. China-Earth Sci. 2015, 58, 1798–1813. [Google Scholar] [CrossRef]
- Li, W.; Hou, M.; Chen, H.; Chen, X. Study on drought trend in south China based on standardized precipitation evapotranspiration index. J. Nat. Disasters 2012, 21, 84–90. [Google Scholar]
- Li, Z.; Lv, J.; Qu, Y.; Zhang, W.; Ma, Z.; Ma, M. Reconstruction and analysis of the extreme drought event in Shanxi Province in early years of Emperor Guangxu of the Qing Dynasty. J. China Inst. Water Resour. Hydropower Res. 2019, 17, 459–469. [Google Scholar]
- Liang, X.; Lettenmaier, D.P.; Wood, E.F.; Burges, S.J. A simple hydrologically based model of land-surface water and energy fluxes for general-circulation models. J. Geophys. Res. Atmos. 1994, 99, 14415–14428. [Google Scholar] [CrossRef]
- Liu, X.; Luo, Y.; Yang, T.; Liang, K.; Zhang, M.; Liu, C. Investigation of the probability of concurrent drought events between the water source and destination regions of China’s water diversion project. Geophys. Res. Lett. 2015, 42, 8424–8431. [Google Scholar] [CrossRef]
- Ma, M.; Ren, L.; Singh, V.P.; Yuan, F.; Chen, L.; Yang, X.; Liu, Y. Hydrologic model-based Palmer indices for drought characterization in the Yellow River basin, China. Stoch. Environ. Res. Risk Assess. 2016, 30, 1401–1420. [Google Scholar] [CrossRef]
- Mao, Y.; Wu, Z.; He, H.; Lu, G.; Xu, H.; Lin, Q. Spatio-temporal analysis of drought in a typical plain region based on the soil moisture anomaly percentage index. Sci. Total Environ. 2017, 576, 752–765. [Google Scholar] [CrossRef]
- Niu, J. Precipitation in the Pearl River basin, South China: Scaling, regional patterns, and influence of large-scale climate anomalies. Stoch. Environ. Res. Risk Assess. 2013, 27, 1253–1268. [Google Scholar] [CrossRef]
- Niu, J.; Chen, J. A wavelet perspective on variabilities of hydrological processes in conjunction with geomorphic analysis over the Pearl River basin in South China. J. Hydrol. 2016, 542, 392–409. [Google Scholar] [CrossRef]
- Niu, J.; Chen, J.; Sun, L. Exploration of drought evolution using numerical simulations over the Xijiang (West River) basin in South China. J. Hydrol. 2015, 526, 68–77. [Google Scholar] [CrossRef]
- Otkin, J.A.; Shafer, M.; Svoboda, M.; Wardlow, B.; Anderson, M.C.; Hain, C.; Basara, J. Facilitating the Use of Drought Early Warning Information through Interactions with Agricultural Stakeholders. Bull. Am. Meteorol. Soc. 2015, 96, 1073–1078. [Google Scholar] [CrossRef]
- Qiu, J.; Crow, W.T.; Wang, S.; Dong, J.; Li, Y.; Garcia, M.; Shangguan, W. Microwave-based soil moisture improves estimates of vegetation response to drought in China. Sci. Total Environ. 2022, 849, 157535. [Google Scholar] [CrossRef]
- Qiu, J.; Dong, J.; Crow, W.T.; Zhang, X.; Reichle, R.H.; De Lannoy, G.J.M. The benefit of brightness temperature assimilation for the SMAP Level-4 surface and root-zone soil moisture analysis. Hydrol. Earth Syst. Sci. 2021, 25, 1569–1586. [Google Scholar] [CrossRef]
- Rajsekhar, D.; Singh, V.P.; Mishra, A.K. Multivariate drought index: An information theory based approach for integrated drought assessment. J. Hydrol. 2015, 526, 164–182. [Google Scholar] [CrossRef]
- Scaini, A.; Sanchez, N.; Vicente-Serrano, S.M.; Martinez-Fernandez, J. SMOS-derived soil moisture anomalies and drought indices: A comparative analysis using in situ measurements. Hydrol. Process. 2015, 29, 373–383. [Google Scholar] [CrossRef]
- Sehgal, V.; Sridhar, V.; Tyagi, A. Stratified drought analysis using a stochastic ensemble of simulated and in-situ soil moisture observations. J. Hydrol. 2017, 545, 226–250. [Google Scholar] [CrossRef] [Green Version]
- Shi, H.; Zhou, Z.; Liu, L.; Liu, S. A global perspective on propagation from meteorological drought to hydrological drought during 1902–2014. Atmos. Res. 2022, 280, 106441. [Google Scholar] [CrossRef]
- Stephen, H.; Ahmad, S.; Piechota, T.C.; Tang, C. Relating surface backscatter response from TRMM precipitation radar to soil moisture: Results over a semi-arid region. Hydrol. Earth Syst. Sci. 2010, 14, 193–204. [Google Scholar] [CrossRef] [Green Version]
- Tan, H.; Cai, R.; Chen, J.; Huang, R. Decadal winter drought in Southwest China since the late 1990s and its atmospheric teleconnection. Int. J. Climatol. 2017, 37, 455–467. [Google Scholar] [CrossRef]
- Wang, A.; Lettenmaier, D.P.; Sheffield, J. Soil Moisture Drought in China, 1950–2006. J. Clim. 2011, 24, 3257–3271. [Google Scholar] [CrossRef]
- Wang, G.; Zhang, J.; Pagano, T.C.; Xu, Y.; Bao, Z.; Liu, Y.; Jin, J.; Liu, C.; Song, X.; Wan, S. Simulating the hydrological responses to climate change of the Xiang River basin, China. Theor. Appl. Climatol. 2016, 124, 769–779. [Google Scholar] [CrossRef]
- Wang, H.; Rogers, J.C.; Munroe, D.K. Commonly Used Drought Indices as Indicators of Soil Moisture in China. J. Hydrometeorol. 2015, 16, 1397–1408. [Google Scholar] [CrossRef]
- Wang, L.; Yuan, X.; Xie, Z.; Wu, P.; Li, Y. Increasing flash droughts over China during the recent global warming hiatus. Sci. Rep. 2016, 6, 30571. [Google Scholar] [CrossRef] [PubMed] [Green Version]
- Wang, Q.; Qi, J.; Li, J.; Cole, J.; Waldhoff, S.T.; Zhang, X. Nitrate loading projection is sensitive to freeze-thaw cycle representation. Water Res. 2020, 186, 116355. [Google Scholar] [CrossRef] [PubMed]
- Wang, Q.; Qi, J.; Qiu, H.; Li, J.; Cole, J.; Waldhoff, S.; Zhang, X. Pronounced Increases in Future Soil Erosion and Sediment Deposition as Influenced by Freeze–Thaw Cycles in the Upper Mississippi River Basin. Environ. Sci. Technol. 2021, 55, 9905–9915. [Google Scholar] [CrossRef] [PubMed]
- Wang, Q.; Qi, J.; Wu, H.; Zeng, Y.; Shui, W.; Zeng, J.; Zhang, X. Freeze-Thaw cycle representation alters response of watershed hydrology to future climate change. CATENA 2020, 195, 104767. [Google Scholar] [CrossRef]
- Wang, Q.; Zeng, J.; Leng, S.; Fan, B.; Tang, J.; Jiang, C.; Huang, Y.; Zhang, Q.; Qu, Y.; Wang, W.; et al. The effects of air temperature and precipitation on the net primary productivity in China during the early 21st century. Front. Earth Sci. 2018, 12, 818–833. [Google Scholar] [CrossRef]
- Wang, Q.; Zeng, J.; Qi, J.; Zhang, X.; Zeng, Y.; Shui, W.; Xu, Z.; Zhang, R.; Wu, X.; Cong, J. A multi-scale daily SPEI dataset for drought characterization at observation stations over mainland China from 1961 to 2018. Earth Syst. Sci. Data 2021, 13, 331–341. [Google Scholar] [CrossRef]
- Wang, Q.; Zhang, R.; Qi, J.; Zeng, J.; Wu, J.; Shui, W.; Wu, X.; Li, J. An improved daily standardized precipitation index dataset for mainland China from 1961 to 2018. Sci. Data 2022, 9, 124. [Google Scholar] [CrossRef] [PubMed]
- Wang, Z.; Li, J.; Lai, C.; Wang, R.Y.; Chen, X.; Lian, Y. Drying tendency dominating the global grain production area. Glob. Food Secur. Agric. Policy Econ. Environ. 2018, 16, 138–149. [Google Scholar] [CrossRef]
- Wang, Z.; Zhong, R.; Lai, C.; Zeng, Z.; Lian, Y.; Bai, X. Climate change enhances the severity and variability of drought in the Pearl River Basin in South China in the 21st century. Agric. For. Meteorol. 2018, 249, 149–162. [Google Scholar] [CrossRef]
- Wu, X.; Zhang, R.; Bento, V.A.; Leng, S.; Qi, J.; Zeng, J.; Wang, Q. The Effect of Drought on Vegetation Gross Primary Productivity under Different Vegetation Types across China from 2001 to 2020. Remote Sens. 2022, 14, 4658. [Google Scholar] [CrossRef]
- Wu, Z.; Lu, G.; Wen, L.; Lin, C.A.; Zhang, J.; Yang, Y. Thirty-five year (1971–2005) simulation of daily soil moisture using the variable infiltration capacity model over China. Atmos. Ocean. 2007, 45, 37–45. [Google Scholar] [CrossRef]
- Wu, Z.; Lu, G.; Zhang, J.; Yang, Y. Simulation of Daily Soil Moisture Using VIC Model. Sci. Geogr. Sin. 2007, 27, 359–364. [Google Scholar]
- Wu, Z.; Qiu, J.; Crow, W.T.; Wang, D.; Wang, Z.; Zhang, X. Investigating the Efficacy of the SMAP Downscaled Soil Moisture Product for Drought Monitoring Based on Information Theory. IEEE J. Sel. Top. Appl. Earth Obs. Remote Sens. 2022, 15, 1604–1616. [Google Scholar] [CrossRef]
- Wu, Z.Y.; Lu, G.H.; Wen, L.; Lin, C.A. Reconstructing and analyzing China’s fifty-nine year (1951–2009) drought history using hydrological model simulation. Hydrol. Earth Syst. Sci. 2011, 15, 2881–2894. [Google Scholar] [CrossRef] [Green Version]
- Xu, K.; Yang, D.; Yang, H.; Li, Z.; Qin, Y.; Shen, Y. Spatio-temporal variation of drought in China during 1961–2012: A climatic perspective. J. Hydrol. 2015, 526, 253–264. [Google Scholar] [CrossRef]
- Yan, J.-H.; Liu, H.-L.; Hao, Z.-X.; Zhang, X.-Z.; Zheng, J.-Y. Climate extremes revealed by Chinese historical documents over the middle and lower reaches of the Yangtze River in winter 1620. Adv. Clim. Change Res. 2014, 5, 118–122. [Google Scholar] [CrossRef]
- Yao, N.; Li, Y.; Lei, T.; Peng, L. Drought evolution, severity and trends in mainland China over 1961–2013. Sci. Total Environ. 2018, 616, 73–89. [Google Scholar] [CrossRef]
- Zeng, J.; Zhang, R.; Lin, Y.; Wu, X.; Tang, J.; Guo, P.; Li, J.; Wang, Q. Drought frequency characteristics of China, 1981-2019, based on the vegetation health index. Clim. Res. 2020, 81, 131–147. [Google Scholar] [CrossRef]
- Zeng, J.; Zhang, R.; Qu, Y.; Bento, V.A.; Zhou, T.; Lin, Y.; Wu, X.; Qi, J.; Shui, W.; Wang, Q. Improving the drought monitoring capability of VHI at the global scale via ensemble indices for various vegetation types from 2001 to 2018. Weather. Clim. Extrem. 2022, 35, 100412. [Google Scholar] [CrossRef]
- Zeng, J.; Zhang, R.; Tang, J.; Liang, J.; Li, J.; Zeng, Y.; Li, Y.; Zhang, Q.; Shui, W.; Wang, Q. Ecological sustainability assessment of the carbon footprint in Fujian Province, southeast China. Front. Earth Sci. 2021, 15, 12–22. [Google Scholar] [CrossRef]
- Zhang, R.; Bento, V.A.; Qi, J.; Xu, F.; Wu, J.; Qiu, J.; Li, J.; Shui, W.; Wang, Q. The first high spatial resolution multi-scale daily SPI and SPEI raster dataset for drought monitoring and evaluating over China from 1979 to 2018. Big Earth Data 2023. [Google Scholar] [CrossRef]
- Zhang, R.; Qi, J.; Leng, S.; Wang, Q. Long-Term Vegetation Phenology Changes and Responses to Preseason Temperature and Precipitation in Northern China. Remote Sens. 2022, 14, 1396. [Google Scholar] [CrossRef]
- Zhang, X.-Z.; Ge, Q.-S.; Fang, X.-Q.; Zheng, J.-Y.; Fei, J. Precipitation variations in Beijing during 1860–1897 AD revealed by daily weather records from the Weng Tong-He Diary. Int. J. Climatol. 2013, 33, 568–576. [Google Scholar] [CrossRef]
- Zheng, J.Y.; Hao, Z.X.; Ge, Q.S. Variation of precipitation for the last 300 years over the middle and lower reaches of the Yellow River. Sci. China Ser. D Earth Sci. 2005, 48, 2182–2193. [Google Scholar] [CrossRef]
Figure 1.
Overview of the study area. (a) Location, (b) elevation, and (c) precipitation.

Figure 2.
The locations of weather stations and the distribution of Tyson’s polygons.

Figure 3.
Research framework flow chart.

Figure 4.
Regular comparison of the Variable Infiltration Capacity (VIC)-simulated and observed monthly runoff sequence rates at each hydrological station. (a) Jingle, (b) Yitang, (c) Hejin.
Figure 4.
Regular comparison of the Variable Infiltration Capacity (VIC)-simulated and observed monthly runoff sequence rates at each hydrological station. (a) Jingle, (b) Yitang, (c) Hejin.

Figure 5.
Comparison of the Variable Infiltration Capacity (VIC)-simulated and observed monthly runoff sequences at each hydrological station during the verification period. (a) Jingle, (b) Yitang, (c) Hejin.
Figure 5.
Comparison of the Variable Infiltration Capacity (VIC)-simulated and observed monthly runoff sequences at each hydrological station during the verification period. (a) Jingle, (b) Yitang, (c) Hejin.

Figure 6.
Accuracy evaluation of soil moisture simulation. (a) Comparison of anomaly percentage between observed and simulated soil moisture at 0~50cm depth, (b) Autoregressive coefficients of observed and simulated soil moisture series from January 1994 to December 2009.
Figure 6.
Accuracy evaluation of soil moisture simulation. (a) Comparison of anomaly percentage between observed and simulated soil moisture at 0~50cm depth, (b) Autoregressive coefficients of observed and simulated soil moisture series from January 1994 to December 2009.

Figure 7.
Reconstructed annual runoff distribution in Shanxi Province from 1875 to 1879. (a) 1875 year. (b) 1876 year. (c) 1877 year. (d) 1878 year. (e) 1879 year.
Figure 7.
Reconstructed annual runoff distribution in Shanxi Province from 1875 to 1879. (a) 1875 year. (b) 1876 year. (c) 1877 year. (d) 1878 year. (e) 1879 year.

Figure 8.
Reconstructed distribution of annual average soil moisture content in Shanxi Province from 1875 to 1879. (a) 1875 year. (b) 1876 year. (c) 1877 year. (d) 1878 year. (e) 1879 year.
Figure 8.
Reconstructed distribution of annual average soil moisture content in Shanxi Province from 1875 to 1879. (a) 1875 year. (b) 1876 year. (c) 1877 year. (d) 1878 year. (e) 1879 year.

Figure 9.
Soil moisture and runoff abnormal percentage in Shanxi Province from 1875 to 1879. (a) Soil moisture anomaly percentage (%). (b) Runoff anomaly percentage (%).
Figure 9.
Soil moisture and runoff abnormal percentage in Shanxi Province from 1875 to 1879. (a) Soil moisture anomaly percentage (%). (b) Runoff anomaly percentage (%).

Figure 10.
The proportion of different degrees of drought in Shanxi Province from 1875 to 1879.


Table 1.
The 14 soil moisture observation stations in Shanxi Province.
| Number | Station Number | Name | Longitude (°) | Latitude (°) |
|---|---|---|---|---|
| 1 | 53564 | Hequ | 111.15 | 39.38 |
| 2 | 53594 | Lingqiu | 114.18 | 39.45 |
| 3 | 53674 | Xizhou | 112.70 | 38.42 |
| 4 | 53769 | Fenyang | 111.78 | 37.25 |
| 5 | 53775 | Taigu | 112.53 | 37.43 |
| 6 | 53783 | Xiyang | 113.70 | 37.60 |
| 7 | 53853 | Xixian | 110.95 | 36.70 |
| 8 | 53863 | Jiexiu | 111.92 | 37.03 |
| 9 | 53868 | Linfen | 111.50 | 36.07 |
| 10 | 53877 | Anze | 112.25 | 36.17 |
| 11 | 53882 | Changzhi | 113.07 | 36.05 |
| 12 | 53956 | Wanrong | 110.83 | 35.40 |
| 13 | 53959 | Yuncheng | 111.02 | 35.03 |
| 14 | 53976 | Jincheng | 112.83 | 35.52 |
Table 2.
Hydrological monitoring stations in the study area.
| Name | Longitude (°) | Latitude (°) | Area (km2) |
|---|---|---|---|
| Jingle | 111.92 | 38.34 | 2799 |
| Yitang | 111.83 | 37 | 23,945 |
| Hejin | 110.80 | 35.57 | 38,728 |
Table 3.
DEM and soil data.
| Data Type | Data Sources | Name | Resolution |
|---|---|---|---|
| Digital elevation (DEM) | United States Geological Survey (USGS) | HyDRO1K digital elevation data | 1 km |
| Soil cover data | University of Maryland land cover dataset | Global land cover dataset | 1 km |
| Soil parameter data | Food and Agriculture Organization of the United Nations (FAO) | Global 5′ soil dataset | 9 km |
Table 4.
List of calibrated and verified variable permeability (VIC) model parameters.
| Parameter | Description |
|---|---|
| binf | Variable infiltration capacity curve parameters |
| d2 | Upper soil depth |
| d3 | Bottom soil depth |
| Dsmax | Maximum base flow in the bottom soil |
| Ds | The proportion of Dsmax when the base flow nonlinearly increases |
| Ws | The ratio of the maximum moisture content of the bottom soil |
Table 5.
The drought grades of SMAP and RAP.
| Number | Grade | SMAP | RAP |
|---|---|---|---|
| 1 | No drought | −0.18 < SMAP | −13 < RPA |
| 2 | Mild drought | −0.18 < SMAP ≤ −0.49 | −13 < RPA ≤ −28 |
| 3 | Moderate drought | −0.49 < SMAP ≤ −0.88 | −28 < RPA ≤ −41 |
| 4 | Severe drought | −0.88 < SMAP ≤ −1.47 | −41 < RPA ≤ −55 |
| 5 | Extreme drought | SMAP ≤ −1.47 | RPA ≤ −55 |
Disclaimer/Publisher’s Note: The statements, opinions and data contained in all publications are solely those of the individual author(s) and contributor(s) and not of MDPI and/or the editor(s). MDPI and/or the editor(s) disclaim responsibility for any injury to people or property resulting from any ideas, methods, instructions or products referred to in the content. |
© 2023 by the authors. Licensee MDPI, Basel, Switzerland. This article is an open access article distributed under the terms and conditions of the Creative Commons Attribution (CC BY) license (https://creativecommons.org/licenses/by/4.0/).
Share and Cite
MDPI and ACS Style
Qu, Y.; Zhang, X.; Zeng, J.; Li, Z.; Lv, J. Historical Drought Events in the Early Years of Qing Dynasty in Shanxi Based on Hydrological Reconstructions. Water 2023, 15, 995. https://doi.org/10.3390/w15050995
AMA Style
Qu Y, Zhang X, Zeng J, Li Z, Lv J. Historical Drought Events in the Early Years of Qing Dynasty in Shanxi Based on Hydrological Reconstructions. Water. 2023; 15(5):995. https://doi.org/10.3390/w15050995
Chicago/Turabian StyleQu, Yanping, Xuejun Zhang, Jingyu Zeng, Zhe Li, and Juan Lv. 2023. "Historical Drought Events in the Early Years of Qing Dynasty in Shanxi Based on Hydrological Reconstructions" Water 15, no. 5: 995. https://doi.org/10.3390/w15050995
Note that from the first issue of 2016, this journal uses article numbers instead of page numbers. See further details here.