
Hard-Bottom Polychaetes Exposed to Multiple Human Pressure along the Mediterranean Coast of Egypt
by
 , , , and
Rasha Hamdy
1,
Noha Elebiary
2 ,
,
Faiza Abdel Naby
2,
Jacopo Borghese
3,*,
Mohamed Dorgham
1,
Amira Hamdan
1 and
Luigi Musco
3,4
1
Oceanography Department, Faculty of Science, Alexandria University, Alexandria 21511, Egypt
2
National Institute of Oceanography & Fisheries, NIOF, Alexandria 21511, Egypt
3
Department of Biological and Environmental Sciences and Technologies, University of Salento, 73100 Lecce, Italy
4
Consorzio Nazionale Interuniversitario per le Scienze del Mare—CoNISMa, 00196 Rome, Italy
*
Author to whom correspondence should be addressed.
Water 2023, 15(5), 997; https://doi.org/10.3390/w15050997
Submission received: 9 February 2023
/
Revised: 27 February 2023
/
Accepted: 4 March 2023
/
Published: 6 March 2023
(This article belongs to the Special Issue Implementation of Biodiversity and Ecosystem Services in Marine Ecosystem Management, Volume II)
Abstract
:The complex mixture of anthropogenic pressure determines the impact on the marine biota, hampering the ecosystem’s functioning. The coast of Alexandria, Egypt, experiences multiple human pressure, including sewage discharge, engineering activities (urbanization) for armoring purposes, and beach nourishment. Hard-bottom polychaete assemblages are demonstrated to reflect coastal areas’ environmental status, though their use in monitoring programs is uncommon. The sensitivity of hard-bottom polychaete assemblages in depicting variations in environmental conditions of two sites exposed to the discharge of polluted water and three sites exposed to urbanization was analyzed. The high spatial and temporal variation in species abundance and diversity probably hid differences among the assemblages exposed to the two forms of pressure while highlighting differences among sites exposed to the same impact form. In addition, changes in the algal substrate probably influenced the observed pattern. Temporal variation of salinity and differences in biological oxygen demand (BOD) and the organic matter appeared to indirectly affect polychaete abundance and diversity by favoring tolerant algal taxa such as Ulva sp. Contrary to what was expected, assemblage variation due to site-specific environmental features accounted for more than the variations due to the two forms of human pressure in shaping differences among polychaete assemblages.
1. Introduction
Human activities threaten the marine environments altering biodiversity and ecological quality, thus potentially endangering the provision of goods and services provided [1,2,3]; among these, urban, agricultural, and industrial development in coastal areas alter the marine environment by the discharge of nutrients and contaminants at sea with consequent habitat degradation [4,5,6,7]. Such a complex mixture of anthropogenic pressure determines the impact on the biota of the affected habitats and the physical-chemical conditions of the environment, thus hampering the ecosystem functioning [8]. Furthermore, among threats to the marine environment, sewage discharge, as well as the discharge of waters from industrial and agricultural activities, alter regimes of water temperature, salinity, and concentration of nutrients and pollutants that directly or indirectly affect biological assemblages on both soft bottoms and rocky shores [9,10,11,12,13,14,15,16,17,18].
Anthropized areas are often subjected to engineering modification of the coastline, often associated with coastal defense interventions and artificial nourishment to mitigate coastal erosion or recreational purposes [19]. Such activities often determine changes in current regimes and sedimentation rates that may directly affect marine habitats, especially the rocky shores, and their associated assemblages since sediments accumulating on rigid substrates can cause burial and scour, thereby changing the physical and biological features of the affected habitat [20].
The Mediterranean Sea is listed among the most threatened world seas [21] due to the intense use of its coastal area and historical overexploitation of the marine environments [22,23]. An analysis of the coastal benthic ecosystems based on indicators used within the framework of several EU Directives for the marine environment revealed some differences among Mediterranean basins [24]. The northwestern sectors show better ecological status than the southern and western areas. However, the same study indicates a generalized lack of information from the south-eastern Mediterranean coasts and the need for transnational cooperation to extend data coverage to poorly studied regions [24]. In the south-eastern Mediterranean Sea, the coast of Alexandria in Egypt appears particularly affected by anthropization [25]. It extends for about 35 km and is subjected to several forms of human pressure, including sewage discharge and engineering activities for the widening of the coastal road that determined the dumping and thousands of concrete blocks for armoring purposes, as well as nourishment of beaches for countering coastal erosion [25].
Annelid polychaetes include more than 11,000 valid species [26] thriving in all marine environments, especially in benthic habitats, where they are often the dominant component of the macrofaunal community in terms of species richness, density, and biomass [27,28,29,30,31]. They exhibit straightforward morphological variability reflecting their adaptation to various environmental conditions, from hard to soft bottom habitats, and including both sensitive and tolerant species throughout gradients from pristine to heavily disturbed environments [32,33,34,35]. For this reason, polychaete assemblages are considered effective bioindicators in depicting the environmental status of an area based on variation in their abundance, diversity, and species composition, reflecting changes in the whole macrobenthic community [32,33,35]. That is especially true for soft-bottom polychaete assemblages routinely analyzed in benthic monitoring programs and other dominant macrobenthic groups [36,37,38]. Although diversity and distribution of hard-bottom polychaete assemblages have been intensively studied in the past [25,31,39,40,41,42,43,44,45,46,47,48], their use in monitoring programs is uncommon [49], probably due to the difficulty of quantitative sampling and comparison across different substrates [50]. Hard-bottom polychaetes assemblages are spatially highly variable alongshore and along bathymetric gradients; they are also strongly related to multiple biological and physical-chemical variables, such as substrate type, sedimentation rate, salinity, organic load, and algal cover [25,31,48]. The tridimensional structure of macroalgal thalli provides habitat complexity that influences polychaete diversity and abundance [25,31,41,47,48,51,52].
During the last decades, contrary to other regions of the southern Mediterranean coastline, hard-bottom polychaetes from the Egyptian Mediterranean coast of Alexandria have been frequently studied to provide insights into their diversity and spatial-temporal variation in assemblages [25,53,54,55,56]. For instance, Dorgham et al. (2014) [25] described the hard-bottom polychaete assemblages of the Alexandria coast, suggesting that the heterogeneity of their spatial-temporal distribution could be driven by variations in algal cover and human pressure, possibly causing an anthropogenic impact on assemblages. Notably, variation in some areas’ assemblages revealed eutrophication’s potential role of eutrophication in determining hard-bottom assemblage structure in parts of the coast. At the same time, the rest of the shoreline, where outfall discharge has ceased since 1992, was affected by a high degree of urbanization and engineering activities, including the enlargement of the coastal route and actions aimed at reducing coastal erosion, such as beach nourishment and coastal armoring.
In this paper, we analyze the sensitivity of hard-bottom polychaete assemblages in depicting variation in environmental conditions in a heavily anthropized area subjected to multiple human pressure. Specifically, this study aimed to analyze the spatial-temporal variation of hard-bottom polychaete assemblages exposed to two different forms of disturbance affecting the coastal area of Alexandria (Egypt), namely (i) the discharge of water enriched with nutrients, organic waste, and pollutants, and (ii) urbanization due to the deployment of artificial structures and beach nourishment actions that are known to cause anthropogenic changes in coastal ecosystems [20,57]. Therefore, the main aim is to test the sensitivity of hard-bottom polychaetes assemblages in depicting environmental changes driven by different forms of human pressure.
2. Materials and Methods
2.1. Study Area
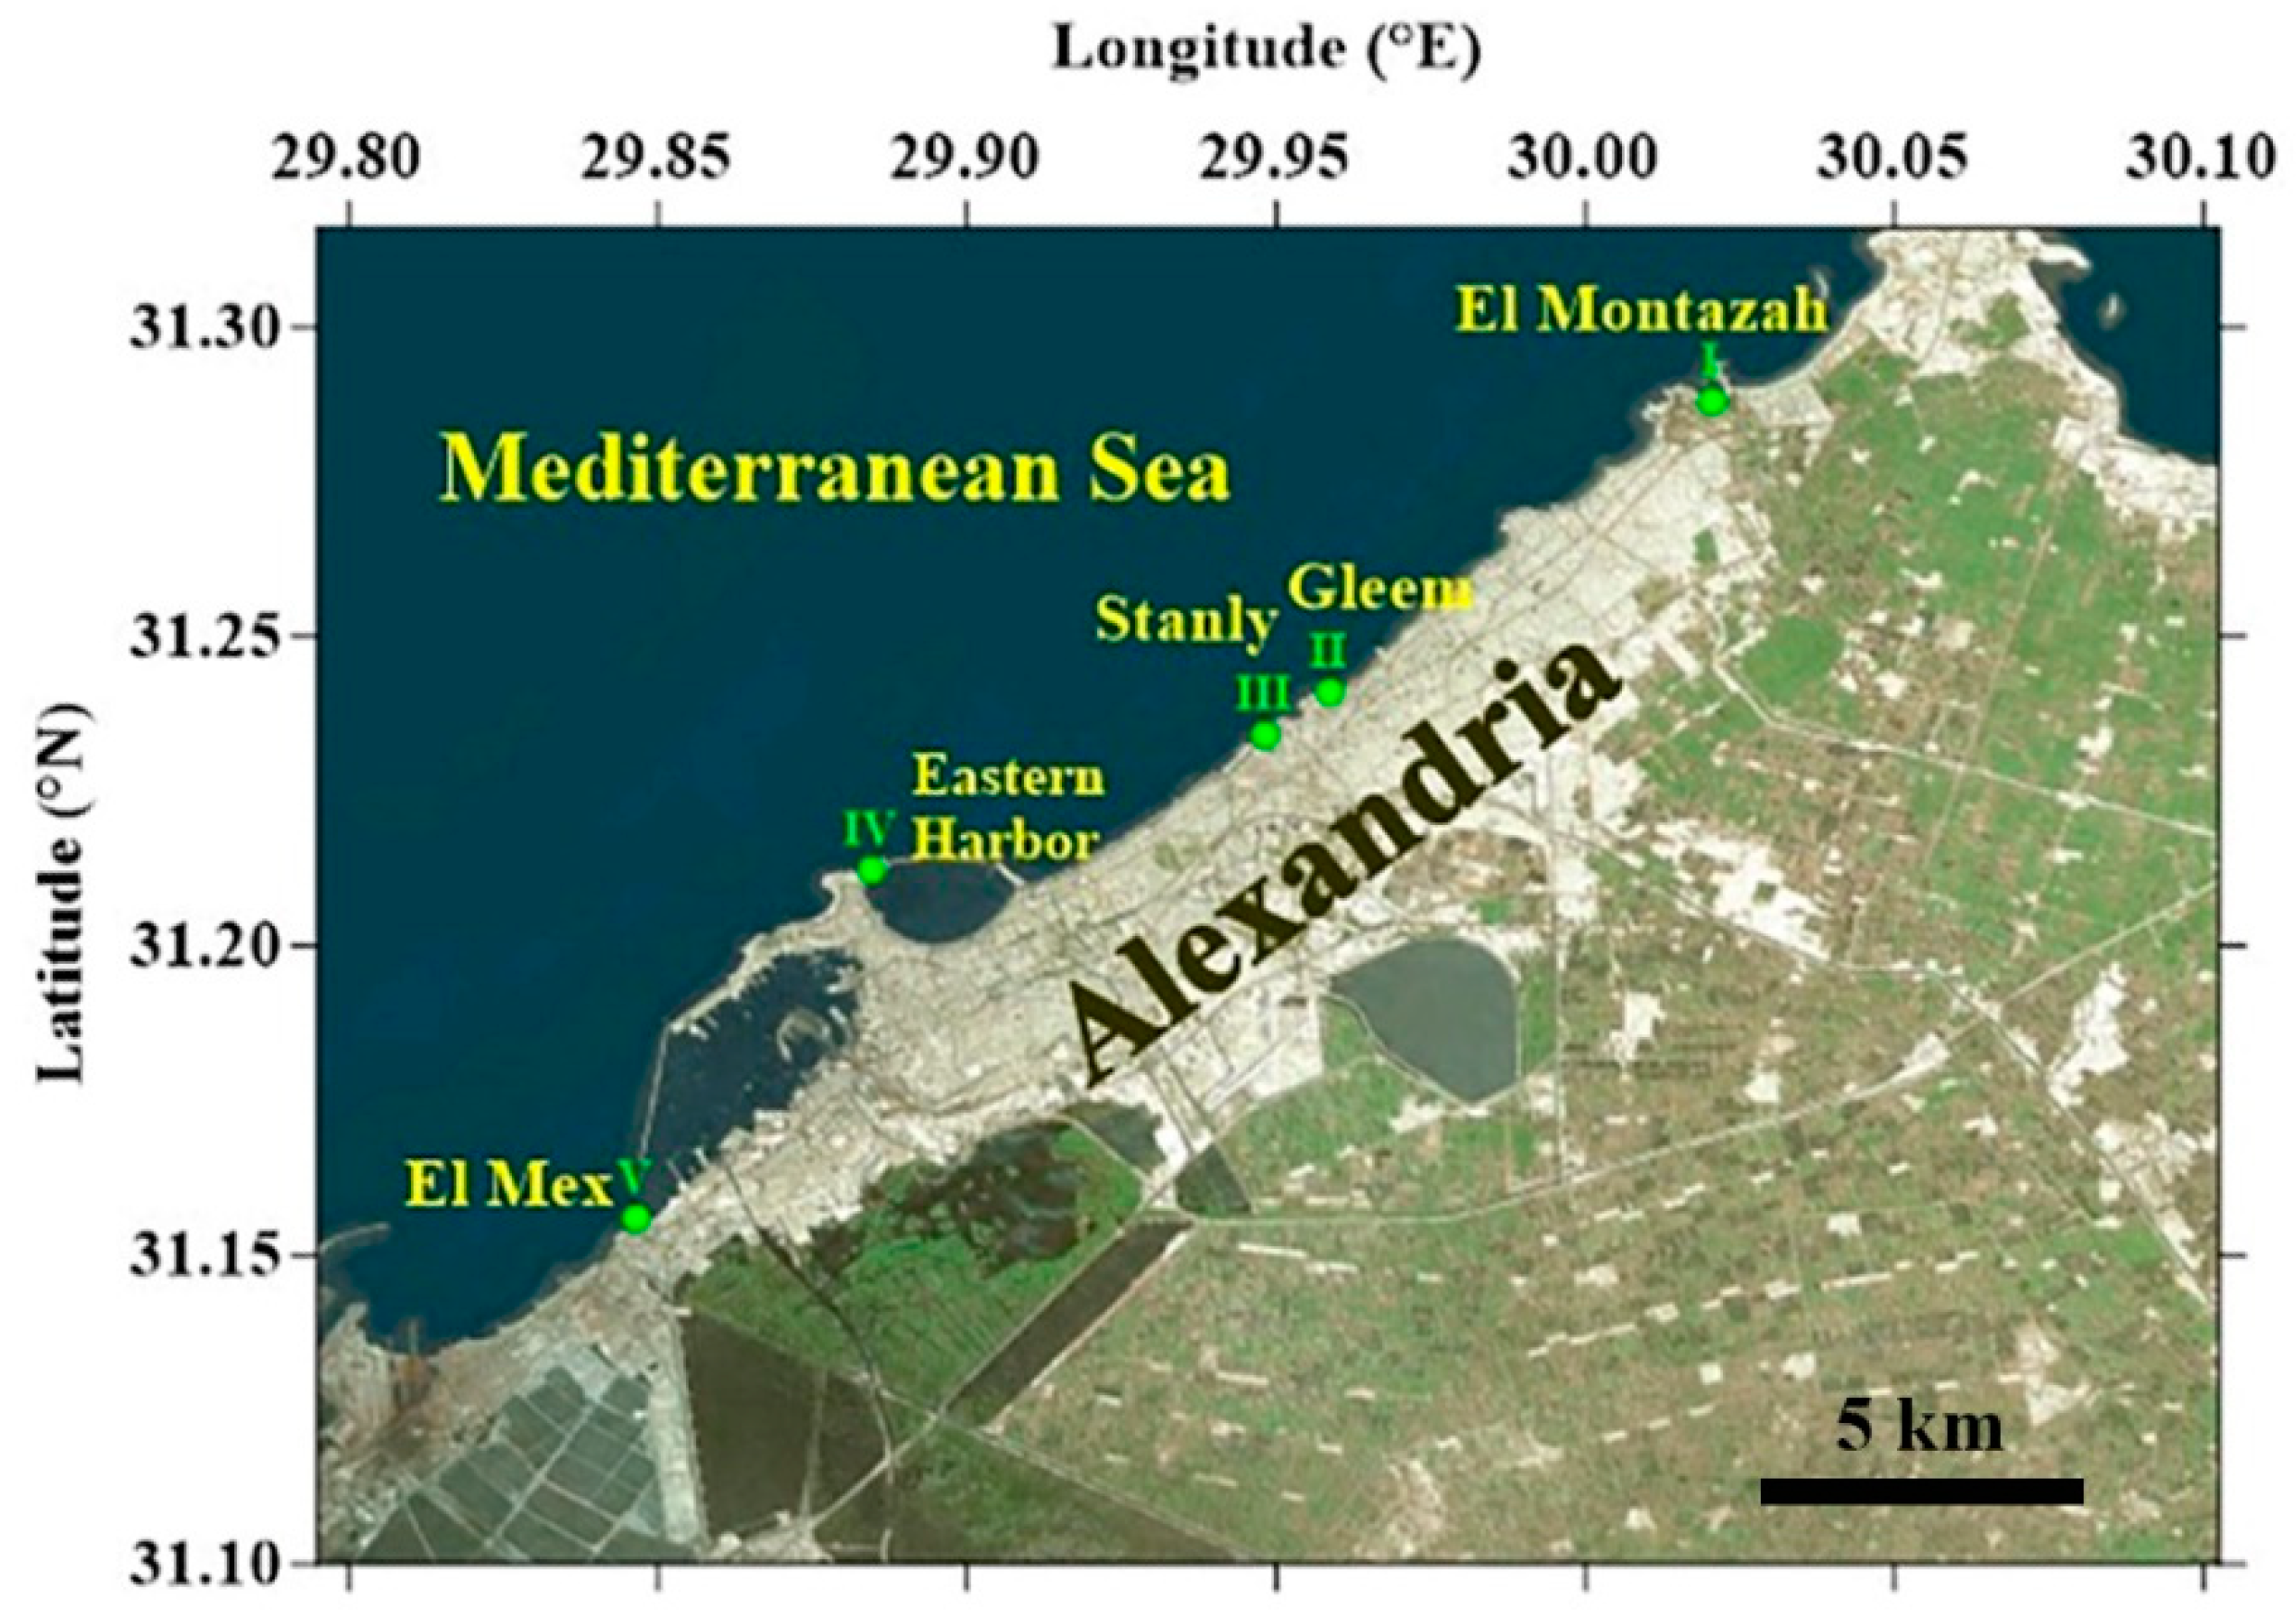
The study area extends from El Mex Bay to El Montazah along the Alexandria coast (Figure 1).
The widening of the coastal road of Alexandria more than two decades ago caused fundamental changes in the morphology and the topography of the coastal zone. In addition, it provided new habitats, including hard substrates for the benthic communities, such as concrete blocks along the coast and inside the sea, to protect the coastline from erosion.
2.2. Sampling Sites
The present study was conducted bimonthly from August 2018 to June 2019 at five sites (Figure 1). Three sites (El Montazah, Gleem, and Stanly) suffer from urbanization (UR) and engineering coastal management; the other two sites (El Mex and Eastern Harbor) experience the discharge (DI) of water enriched with nutrients and organic waste of urban and agricultural origin. More specifically, the five sites can be specified as follows:
El Montazah (EM): The hard substrate was represented by great concrete blocks existing beside a cement wall of about 25 m long and 3 m in height. The concrete blocks were covered mainly with the mussel Brachidontes pharaonis mixed with the red algae Corallina sp and, to a lesser extent, by the green algae Ulva sp. In addition, a few other algae were scarcely observed, like the brown algae Petalonia sp. and the red algae Pyropia sp. and Amphiroa sp.
Gleem (GL): This is a swimming area surrounded by a concrete wall of about 50 m long, 2 m in height, and sheltered by many concrete blocks, while the area appears as a semi-closed sheltered basin. The concrete blocks were covered mainly with the red algae Corallina sp. and, to a lesser extent, other red algae and specimens of B. pharaonis.
Stanly (ST): This is a semicircular bay laying under the Stanly Bridge with a recreational beach protected by a concrete wall of 1 m height, while the bottom was sandy with scattered natural rocky patches. The concrete wall and the bottom rocks were mainly covered with the black bivalve, B. pharaonis, the red algae Corallina sp., and sometimes the green algae Ulva sp. Other algal species were rarely observed, such as the red algae Amphiroa sp. and Jania sp. and the brown algae Colpomenia sp.
Eastern Harbor (EH): This is a semi-closed shallow basin in the central part of the Alexandria coast. The site is highly eutrophic because it is indirectly affected by a mixture of municipal and agricultural wastes from Lake Mariout. The hard bottom is represented by a group of concrete blocks covered by the black bivalve B. pharaonis mixed with the red alga Corallina sp. and a small amount of the green algae Ulva sp.
El Mex (MX): This comprises a large rocky area over the sea surface surrounded by the sandy bottom. This site is directly subjected to polluted terrestrial effluents through the Umoum Drain. The hard substrate is mainly covered by the green alga Ulva sp., the red algae Corallina sp., Pterocladia sp., and the black bivalve B. pharaonis, especially in spring.
2.3. Environmental Variables
Environmental variables, including water temperature, salinity, dissolved oxygen, BOD, pH, and organic matter content in sediment, were measured at all sampling sites. The temperature and pH of the surface water were measured in situ by a portable digital pH meter (Milwaukee 102 pH/Temp Meter). Salinity was measured in the laboratory by STD (YSI professional series). Dissolved oxygen was determined according to the Winkler method [58]. For BOD measurement, three oxygen bottles were carefully filled with seawater at each site, covered with aluminum foil, and left in the laboratory for five days. After that, the BOD was fixed by 1 mm of manganous sulfate followed by 1 mm of alkaline iodide reagents; subsequently, the bottles were vigorously shaken, and the dissolved oxygen was measured.
Measurement of the organic matter (OM) content was performed according to Walkley and Black (1934) [59]. Briefly, a certain weight of sediment was placed in a 500 mL conical flask containing 10 mL of K2Cr2O7. After shaking, 20 mL of concentrated H2SO4 was carefully added. The flask was left for 30 min. Then, an aliquot of 10 mL of H3PO4 was added to the flask, followed by 100 mL of distilled water. The flask was shaken vigorously. Subsequently, ten drops of diphenylamine indicator were inserted into the flask, turning the solution violet. The resulting solution was titrated against ferrous ammonium sulfate solution until the appearance of bright green color. A blank titration was also conducted in the same way without sediment samples. The total organic matter was calculated using the following equation:
where T is the total organic matter, and S is the blank value, which was determined experimentally in the laboratory to be 22.
2.4. Collection of Biotic Samples
The biota thriving on the hard bottoms were collected by scratching off the substrate and collecting all the organisms within a metal rectangle frame of 25 cm × 40 cm. The samples were collected in three replicates and transferred to plastic jars containing 7% MgCl2 to narcotize the fauna for easy sorting. After about one hour, a few drops of neutralized formalin were added. In the laboratory, the samples were washed with tap water and passed through a piece of zooplankton net of 100 µm mesh size to collect the small size fauna. The polychaetes were identified at the lowest taxonomic level possible. The abundance of each polychaete species was expressed as individuals/m2.
The percent cover of the habitat-forming species (including algae and sessile invertebrates) within a 25 cm × 40 cm rectangular frame subdivided into 20 rectangles, 5 cm × 10 cm each. First, a score from 0 to 5% was given to each sub-rectangle. Then, the percentage cover of each taxon was obtained by summing over the entire set of sub-rectangles.
2.5. Statistical Analysis
The number of polychaete species and the number of individuals per replicate were calculated using the DIVERSE routine, whereas the species richness and the evenness were calculated using Margalef’s index and Pielou’s index, respectively.
PERMANOVA (permutational multivariate analysis of variance) based on the Bray-Curtis similarity matrix was performed to analyze the spatial-temporal patterns of polychaete assemblages concerning three factors: “Impact” (IM), two levels (urbanized, water discharge) fixed, “site” (SI), five levels (EM, GL, ST, EH, MX) random, and “time” (TI), six levels random. Each term in the analyses was tested using 9999 random permutations of the appropriate units. In addition, the distance-based test for homogeneity of multivariate dispersions (PERMDISP) was also performed.
Following the same design, ANOVAs (analyses of variance) of the number of species, individuals, species richness (Margalef), and evenness (Pielou) were performed based on the Euclidean distance matrices using the PERMANOVA routine as indicated by Anderson and colleagues [60].
The canonical analysis of principal coordinates (CAP) [61] was performed to assess the variation in polychaete assemblages and to visualize correlations of environmental variables and algal cover with the canonical axes.
All the analyses were performed using the PRIMER v6 software, including the PERMANOVA+ add-on package [60].
3. Results
3.1. Environmental Variables
Table 1 shows the physical-chemical values measured at five sampling sites. The temperature reached around 29 °C in August at all sites and dropped to 14.6 °C at EH in February. Bimonthly pH fluctuations were minimal, while salinity at MX showed wider fluctuations compared to the other sites, reaching the lowest value of 27.44 ppt during October. DO show low annual variation at MX and comparatively wide variations at the other sites. EM, GL, and MX revealed a narrow range of BOD values, and as a similar trend was found for the OM, with an extensive range between the maximum and minimum values found at EH.
3.2. Benthic Cover
The benthic cover was mainly dominated by algae and bivalves, including the alien bivalve Brachidontes pharaonis. Among green algae, Ulva sp. was present at all sites and particularly dominant at MX, while red algae were mainly represented by species of the genera Jania, Amphiroa, and Corallina, with the latter being relatively abundant at all sites and dominant at GL (Table 2).
3.3. Community Structure and Univariate Indexes
The hard substrate polychaete comprised 98 species belonging to 25 families. Syllidae, with 25 species, ranked first among families, followed by Spionidae (9), Nereididae (8), Cirratulidae (7), and Serpulidae (7). Five species accounted for 59% of the total count, namely Syllis columbretensis (17%), Kirkegaardia dorsobranchialis (13%), Syllis armillaris (13%), S. prolifera (8%), and Pseudonereis anomala (8%) (Table 3).
The number of polychaete species and their abundance varied among sites and sampling times (Figure 2). The highest numbers of species and individuals were observed in April at all the sampling sites except for MX, which clearly showed the lowest values for the above response variables (Figure 2). Between the two sites exposed to water discharge, EH always hosted a more significant number of species and individuals compared to MX, while no regularities were observed when the three sites exposed to urbanization (EM, GL, ST) were compared (Figure 2); the same pattern was observed as far as the species richness (Margalef) is concerned. Considering the two sites exposed to water discharge, Pielou’s evenness index was higher during the initial phases of the sampling campaign at EH concerning MX, while it appeared higher in this last site at the end of the sampling period. Regarding the other three sites, the highest values were observed at ST during February and GL during December, which were consistently lower at EM.
3.4. Statistical Analyses
The ANOVAs testing difference in species number (Table 4 A), abundance (Table 4 B), and species richness (Margalef) (Table 4 C) of hard-bottom polychaete assemblages revealed significant differences among sites and among sampling times, but no differences between the two forms of impact. As far as the test for the evenness (Pielou) is concerned (Table 4 D), the significance of the interaction term SI(IM)×TI indicated no clear pattern with the difference between the two forms of impact, which depending on the sampling time and the relative variation of the sites nested.
As for the univariate test for the evenness (Pielou), PERMANOVA revealed the significance of the interaction term SI(IM)×TI, indicating no apparent pattern, with the difference between the two forms of impact, which depended on the sampling time and the relative variation of the nested sites (Table 5).
The pairwise comparison for the term SI(IM) × TI for pairs of levels of the factor site (SI) within levels of the factors time (TI) and impact (IM) (Table 6) revealed a high degree of variation. Mainly, assemblages sampled at EH and MX were always significantly different from each other, apart from December, while the three sites nesting within the level of urbanization of the factor impact revealed a complex pattern, with EM always different from GL apart from February. Furthermore, the same site’s (EM) results differ from ST apart from August, February, and July. Also, GL differs from ST in October, December, April, and July but not in August and February.
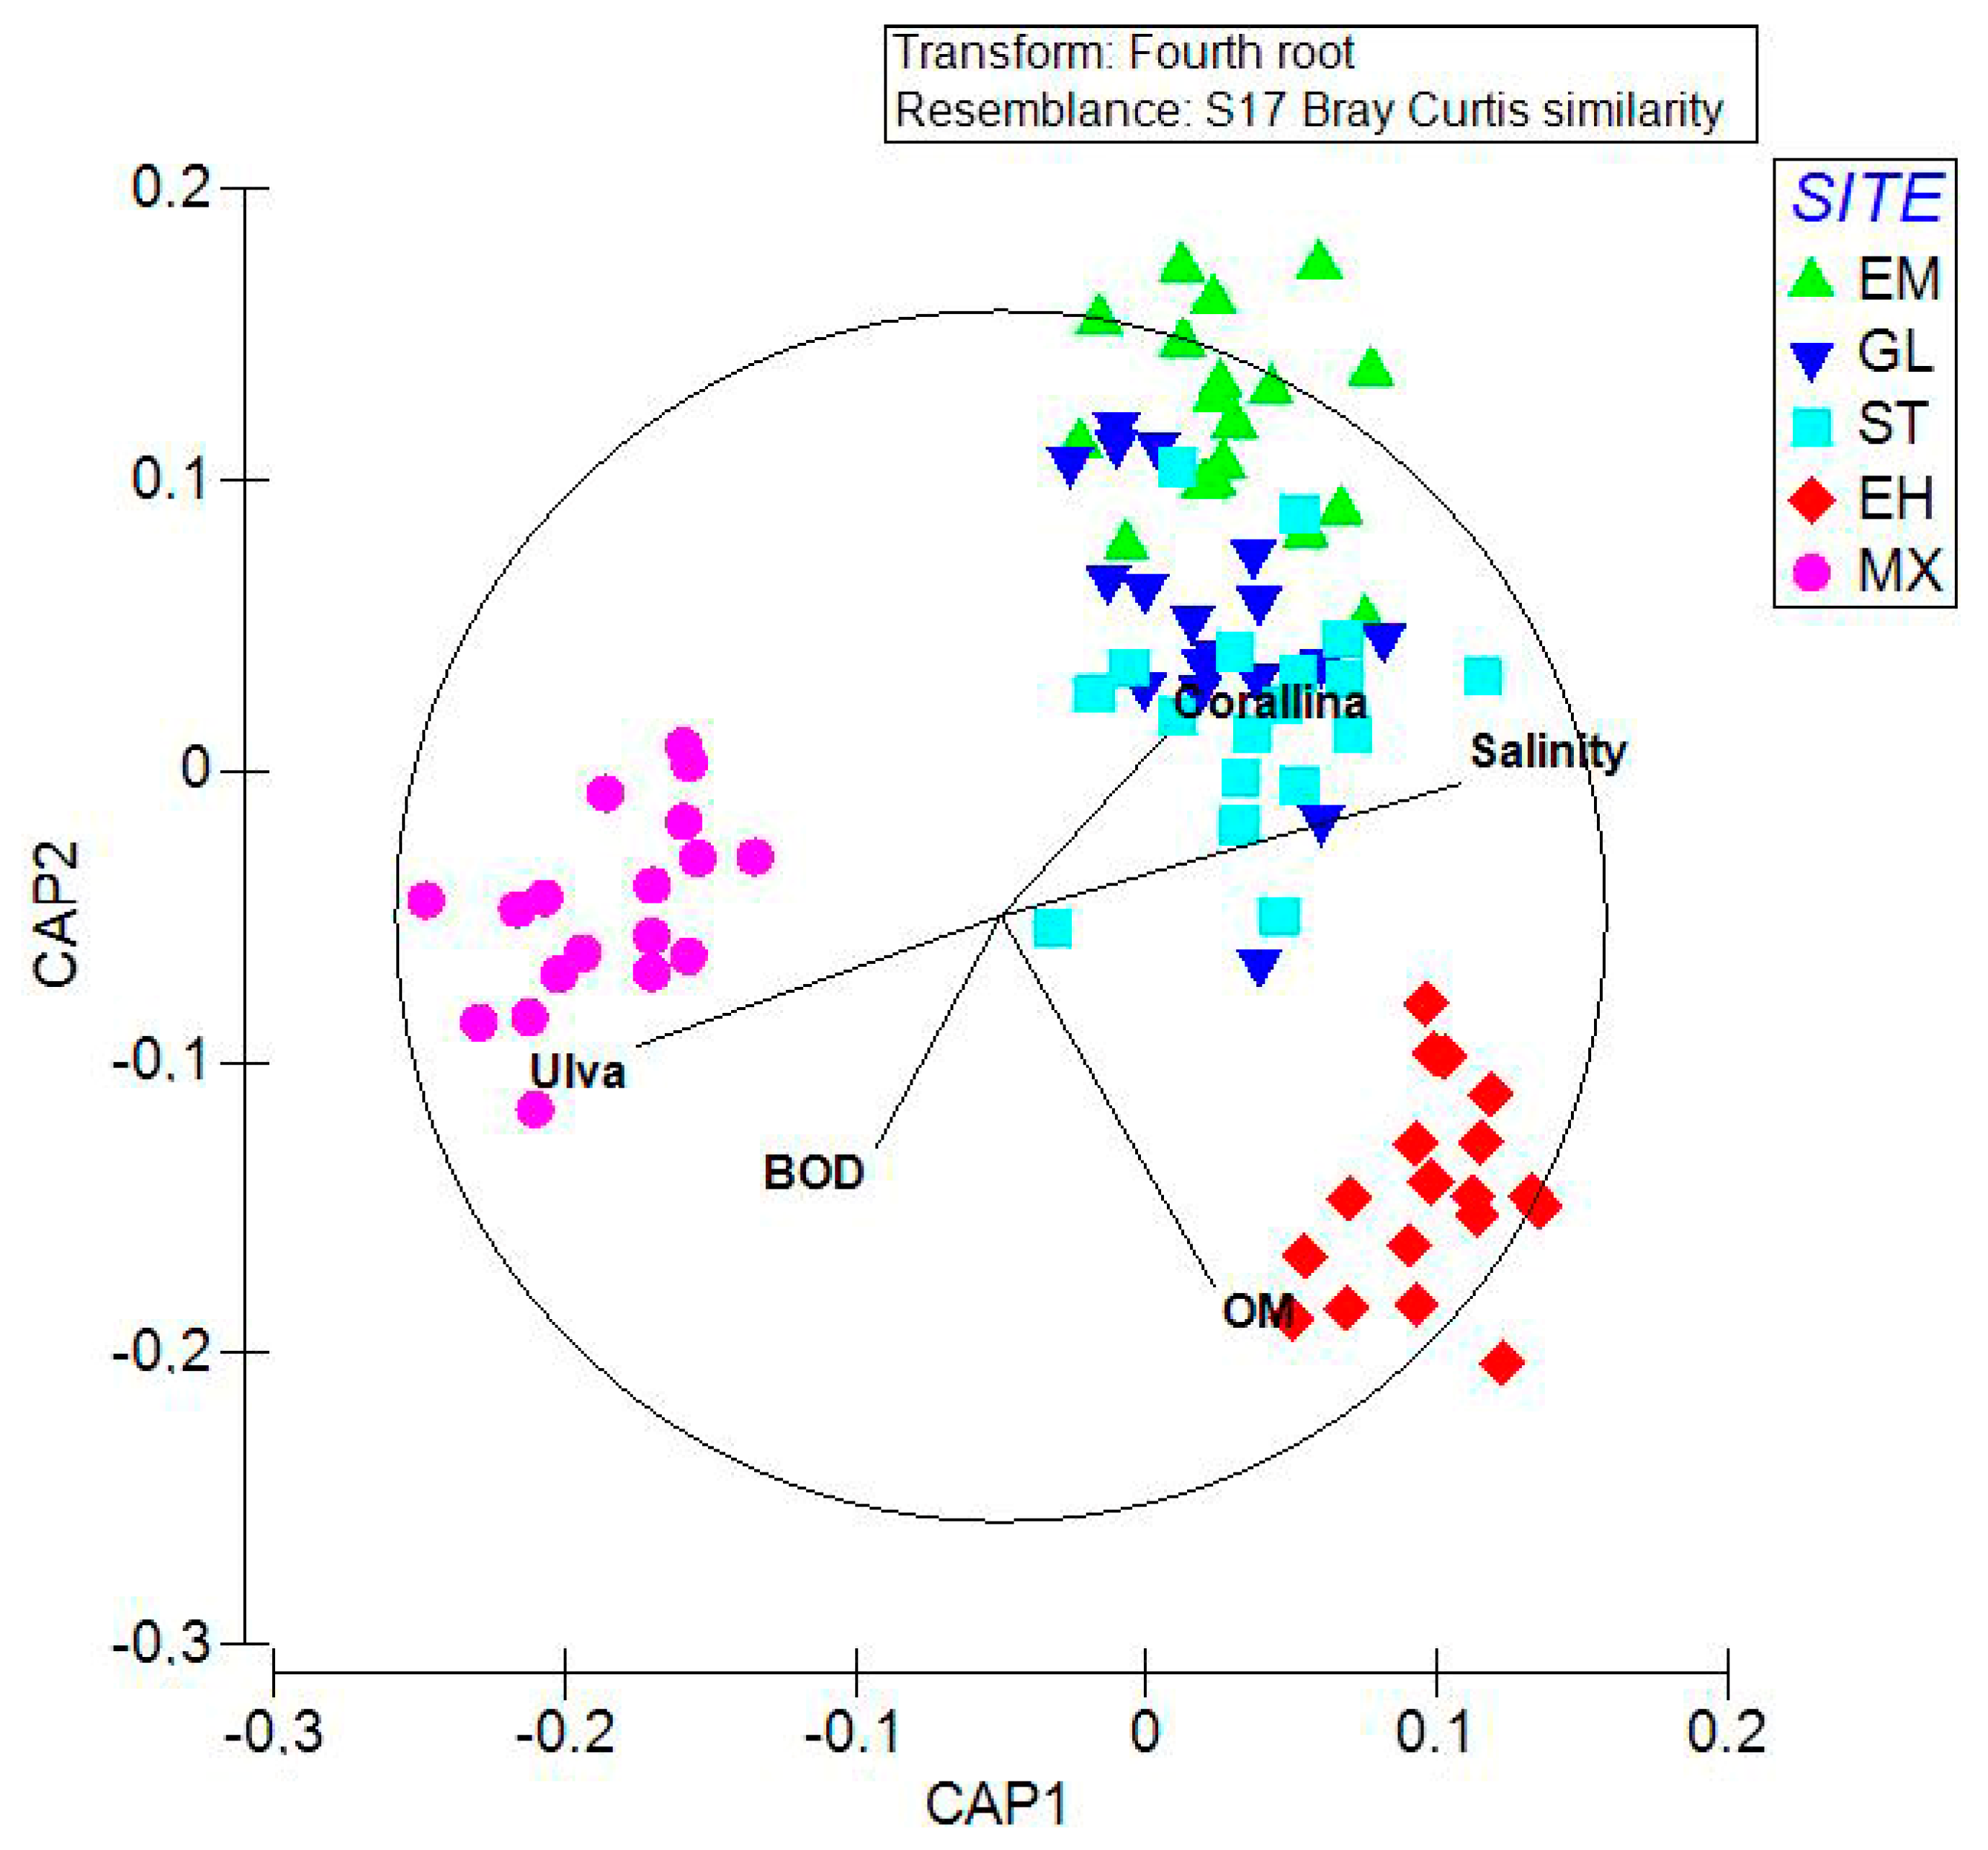
CAP indicated an unclear separation among the three groups of replicates representing the sites affected by urbanization during the entire sampling period (EM, GL, ST), while the other two sites exposed to water discharge (EH, MX) appeared separated from each other as well as from the other three sites (Figure 3). CAP allocation success was 95.56%. The first and second canonical axes had a high canonical correlation with the multivariate assemblages (CAP1 δ2 = 0.9162; CAP2 δ2 = 0.8595). After using a 0.4 Pearson correlation cut-off for lower contributions, five variables, namely Corallina and Ulva among algae, organic matter (OM), salinity, and biochemical oxygen demand (BOD) among chemical-physical variables, they have appeared correlated with the canonical axes. The separation along CAP1 between MX and the other sites was directly related to the abundance of Ulva and BOD, while it was indirectly related to salinity and the abundance of Corallina. Meanwhile, the separation of EH along CAP2 was related to organic matter and BOD.
4. Discussion
The first merit of this paper is the addition of 22 new polychaete species to the list of polychaetes of the Alexandria coast, including seven spionid species (Dipolydora armata, Dipolydora giardia, Polydora cornuta, Prionospio lighti, Pseudopolydora antennata, Pseudopolydora paucibranchiata, and Spio blakei), seven syllid species (Exogone africana, Perkinsyllis anophthalma, Syllides convolutus, Syllis armillaris, S. columbretensis, S. rosea, and Trypanosyllis sanmartini), five cirratulid species (Caulleriella alata, C. cristata, Cirriformia tentaculata, C. filigera, and Ctenodrilus serratus) and four dorvilleid species (Dorvillea similis, Ophryotrocha cf. adherens, Pettiboneia urciensis, and Protodorvillea kefersteini). It is worth mentioning that some of the most abundant species recorded by the present study, like K. heterochaeta, E. complanata, S. columbretensis, S. prolifera, S. armillaris, A. bichaeta, D. similis, C. filigera, and P. anophthalma, were not observed during the previous extensive survey of the Alexandria coast during 2014 [25]. On the other hand, the syllid species S. schulzi that was dominant in 2014 was not recorded during the present study [25]. The above findings suggest that the Alexandria coast may have experienced relevant environmental changes during the last decade.
The polychaete assemblages of the Alexandria coast are characterized by significant spatial and temporal variations in species abundance and diversity and by the massive presence of a bulk of species in the study area, including S. columbretensis, S. armillaris, and S. prolifera. In addition, other species played an important role in characterizing each site, e.g., Kirkegaardia heterochaeta, P. anomala, and S. pulvinata characterized EM, C. filigera was abundant at GL, K. heterochaeta, C. filigera, D. similis, P. anomala, N. laevigata, and A. bichaeta characterized ST, A. bichaeta and H. elegans where relevant at EH, while at MX H. elegans dominated the assemblage with S. columbretensis, S. armillaris, and S. prolifera.
It is worth mentioning that several species were restricted to MX and/or EH, possibly indicating their tolerance to the stressed condition characterizing both sites. Among these were A. succinea, L. medusa, S. clavata, P. anophthalma, M. prolifera, B. pusilla, D. giardia, D. coeca, S. triqueter, H. operculata, H. elegans, L. clava, N. rubiginosa, L. perkinsi, S. rudolphi, O. adherens, C. tentaculata, C. alata, C. capitata, and B. vincenti. On the other hand, P. pictus, N. laevigata, S. armatus, C. filigera, A. bichaeta, K. heterochaeta, D. similis, O. pallidus, and S. variegata were relatively abundant at all sites, but they were less abundant or completely disappeared at MX, possibly revealing the susceptibility of these species to environmental features characterizing this last site.
Overall, the high degree of variation observed is probably responsible for there being no apparent difference among the assemblages exposed to the two forms of impact, as demonstrated by the multivariate tests. Moreover, variation among sites exposed to the same form of impact appeared significantly high, with the assemblages of the three urbanized sites being similar to each other only in February, while the assemblages of the two sites exposed to water discharge (MX and EH) always appearing significantly different from each other apart from December.
Hard-bottom polychaete assemblages’ abundance and diversity are influenced by the algal cover [62] since the structure of algal thalli is known to affect the composition and abundance of the associated fauna [63,64]. Thus, algal species with complex thalli, such as the red algae Corallina sp., and Jania rubens, could be suitable habitats for polychaetes [25,31], contrary to algal species with a lower structural complexity like the green algae Ulva sp. and Enteromorpha sp., and the brown algae Petalonia sp. and Colpomenia sinuosa [31]. In the present study, the relationship between the algal cover and polychaete assemblages seemed consistent with these observations. The red algae Corallina sp. and Jania sp. usually host higher diversity and density of polychaetes than the green algae Ulva sp. and Enteromorpha sp. Hence, the dominance of green algae throughout the year at MX may explain this site’s low diversity and abundance values and its separation from the other sites, as shown by CAP2. Notably, MX experienced the most significant salinity variation throughout the study period. Such variation was associated with the high BOD, indicating that MX results are particularly suitable for tolerant algal taxa, such as Ulva sp.
In contrast, red algae, such as Corallina sp., may suffer from environmental conditions being considered less tolerant than the former [16]. Under these circumstances, variation in polychaete assemblages would be the secondary effect of variation in environmental features determining changes in the substrate. It is worth mentioning that the second site experiencing water discharge appeared quite distant from the three urbanized sites but also distant from MX. In this last case, the large variation in BOD and higher organic load (OM) may represent factors directly influencing the polychaete assemblage structure, as suggested by the CAP analysis. The observed difference in chemical-physical variables such as salinity, OM, and BOD between MX and EH, suggested that the polluted terrestrial effluents through Umoum Drain, affecting the MX site, determined a form of impact on assemblages not comparable with the water discharge characterizing EH, with polychaete assemblages responding in different ways in the two sites.
High variation in polychaete assemblages’ abundance and diversity is expected in shallow subtidal hard-bottom habitats like those herein analyzed [31,48,65]. In this research, univariate indices revealed significant differences among sites and sampling times but no differences in assemblages based on the experienced form of human pressure. The results of the multivariate analyses could not evidence any clear pattern among sites, times, and forms of anthropogenic stress. Only CAP demonstrated differentiation between sites based on the stress to which they were subjected. Nonetheless, the observed variation in polychaete assemblages between MX and EH shows that the two sites may experience conditions distinct from those initially expected. The algal cover also mirrors evidence of a difference between these two sites and the environmental variables observed.
Our results did not allow the identification of multivariate or univariate patterns of polychaete assemblages that could overwhelm the local variability. However, assemblages of areas exposed to multiple forms of human impact often reveal spatial-temporal distribution patterns driven by the sampling site’s local features [18,66,67].
In conclusion, contrary to what was observed in other studies where polychaete assemblages appeared helpful to describe areas exposed to different levels of human impact [46]. The herein analyzed hard-bottom polychaete assemblages were revealed to be highly sensitive to variation in local environmental features to a level that impedes the observation of clear patterns among sites exposed to different forms of human impact. In a study analyzing soft bottom assemblages, the use of a synthetic index, such as the AZTI’s multivariate-AMBI (M-AMBI), was influential in detecting environmental amelioration of an impacted site that was masked by the high degree of spatial, temporal variation between the impacted and control sites when the assemblages’ variation was analyzed [68]. However, the use of AMBI is not recommended for analyzing hard-bottom macrofaunal assemblages [69]; in fact, the quality status of rocky shores is routinely determined by other methods involving the analysis of algal assemblages (i.e., CARLIT), which appear more effective in clearly describing the ecological quality status of an area [16].
Author Contributions
Conceptualization, M.D.; Data curation, N.E., J.B. and L.M.; Formal analysis, M.D. and L.M.; Investigation, N.E. and M.D.; Methodology, L.M.; Resources, N.E.; Supervision, R.H., F.A.N., M.D. and A.H.; Validation, R.H., N.E. and F.A.N.; Writing—original draft, J.B. and L.M.; Writing—review & editing, R.H., F.A.N., M.D. and A.H. All authors have read and agreed to the published version of the manuscript.
Funding
This research received no external funding.
Data Availability Statement
Data Available at Taxonomy and Biodiversity of Aquatic Biota Lab, Marine Environment 413 Division, National Institute of Oceanography and Fisheries (Alexandria Branch).
Conflicts of Interest
The authors declare no conflict of interest.
References
- Myers, R.A.; Worm, B. Rapid worldwide depletion of predatory fish communities. Nature 2003, 423, 280–283. [Google Scholar] [CrossRef] [PubMed]
- Lotze, H.K.; Lenihan, H.S.; Bourque, B.J.; Bradbury, R.H.; Cooke, R.G.; Kay, M.C.; Kidwell, S.M.; Kirby, M.X.; Peterson, C.H.; Jackson, J.B. Depletion, degradation, and recovery potential of estuaries and coastal seas. Science 2006, 312, 1806–1809. [Google Scholar] [CrossRef] [PubMed]
- Halpern, B.S.; Walbridge, S.; Selkoe, K.A.; Kappel, C.V.; Micheli, F.; D’Agrosa Bruno, J.F.; Casey, K.S.; Ebert, C.; Fox, H.E.; Fujita, R. A global map of human impact on marine ecosystems. Science 2008, 319, 948–952. [Google Scholar] [CrossRef] [Green Version]
- Vitousek, P.M.; Aber, J.D.; Howarth, R.W.; Likens, G.E.; Matson, P.A.; Schindler, D.W.; Schlesinger, W.H.; Tilman, D.G. Human alteration of the global nitrogen cycle: Sources and consequences. Ecol. Appl. 1997, 7, 737–750. [Google Scholar] [CrossRef] [Green Version]
- Agardy, T. Global marine conservation policy versus site-level implementation. Mar. Ecol. Prog. Ser. 2005, 300, 242–248. [Google Scholar] [CrossRef]
- Spalding, M.D.; Ruffo, S.; Lacambra, C.; Meliane, I.; Hale, L.Z.; Shepard, C.C.; Beck, M.W. The role of ecosystems in coastal protection: Adapting to climate change and coastal hazards. Ocean. Coast. Manag. 2014, 90, 50–57. [Google Scholar] [CrossRef]
- Neumann, B.; Vafeidis, A.T.; Zimmermann, J.; Nicholls, R.J. Future coastal population growth and exposure to sea-level rise and coastal flooding-a global assessment. PLoS ONE 2015, 10, e0118571. [Google Scholar] [CrossRef] [Green Version]
- Halpern, B.S.; Selkoe, K.A.; Micheli, F.; Kappel, C.V. Evaluating and ranking the vulnerability of global marine ecosystems to anthropogenic threats. Conserv. Biol. 2007, 21, 1301–1315. [Google Scholar] [CrossRef]
- Fairweather, P.G. Sewage and the biota on seashores: Assessment of impact in relation to natural variability. Environ. Monit. Assess. 1990, 14, 197–210. [Google Scholar] [CrossRef]
- Otway, N.M.; Gray, C.A.; Craig, J.R.; McVea, T.A.; Ling, J.E. Assessing the impacts of deepwater sewage outfalls on spatially-and temporally-variable marine communities. Mar. Environ. Res. 1996, 41, 45–71. [Google Scholar] [CrossRef]
- Guidetti, P.; Terlizzi, A.; Fraschetti, S.; Boero, F. Changes in Mediterranean rocky-reef fish assemblages exposed to sewage pollution. Mar. Ecol. Prog. Ser. 2003, 253, 269–278. [Google Scholar] [CrossRef]
- Smith, A.K.; Ajani, P.A.; Roberts, D.E. Spatial and temporal variation in fish assemblages exposed to sewage and implications for management. Mar. Environ. Res. 1999, 47, 241–260. [Google Scholar] [CrossRef]
- Balestri, E.; Benedetti-Cecchi, L.; Lardicci, C. Variability in patterns of growth and morphology of Posidonia oceanica exposed to urban and industrial wastes: Contrasts with two reference locations. J. Exp. Mar. Biol. Ecol. 2004, 308, 1–21. [Google Scholar] [CrossRef]
- Terlizzi, A.; Scuderi, D.; Fraschetti, S.; Anderson, M.J. Quantifying effects of pollution on biodiversity: A case study of highly diverse molluscan assemblages in the Mediterranean. Mar. Biol. 2005, 148, 293–305. [Google Scholar] [CrossRef]
- Terlizzi, A.; Benedetti-Cecchi, L.; Bevilacqua, S.; Fraschetti, S.; Guidetti, P.; Anderson, M.J. Multivariate and univariate asymmetrical analyses in environmental impact assessment: A case study of Mediterranean subtidal sessile assemblages. Mar. Ecol. Prog. Ser. 2005, 289, 27–42. [Google Scholar] [CrossRef] [Green Version]
- Ballesteros, E.; Torras, X.; Pinedo, S.; García, M.; Mangialajo, L.; De Torres, M. A new methodology based on littoral community cartography dominated by macroalgae for the implementation of the European Water Framework Directive. Mar. Pollut. Bull. 2007, 55, 172–180. [Google Scholar] [CrossRef] [PubMed]
- Korajkic, A. Discrimination of Human and Non-Human Sources of Pollution in Gulf of Mexico Waters by Microbial Source Tracking Methods and the Investigation of the Influence of Environmental Factors on Escherichia coli Survival. Ph.D. Thesis, University of South Florida, Tampa, FL, USA, 2010. [Google Scholar]
- Bertocci, I.; Dell’Anno, A.; Musco, L.; Gambi, C.; Saggiomo, V.; Cannavacciuolo, M.; Lo Martire, M.; Passarelli, A.; Zazo, G.; Danovaro, R. Multiple human pressures in coastal habitats: Variation of meiofaunal assemblages associated with sewage discharge in a post-industrial area. Sci. Total Environ. 2019, 655, 1218–1231. [Google Scholar] [CrossRef]
- Hanson, H.; Brampton, A.; Capobianco, M.; Dette, H.H.; Hamm, L.; Laustrup, C.; Lechuga, A.; Spanhoff, R. Beach nourishment projects, practices, and objectives—A European overview. Coast. Eng. 2002, 47, 81–111. [Google Scholar] [CrossRef]
- Airoldi, L. The Effects of Sedimentation on Rocky Coast Assemblages. In Oceanography and Marine Biology, An Annual Review; CRC Press: Boca Raton, FL, USA, 2003; Volume 41, pp. 169–171. [Google Scholar]
- Costello, M.J.; Coll, M.; Danovaro, R.; Halpin, P.; Ojaveer, H.; Miloslavich, P. A census of marine biodiversity knowledge, resources, and future challenges. PLoS ONE 2010, 5, e12110. [Google Scholar] [CrossRef] [Green Version]
- Coll, M.; Piroddi, C.; Albouy, C.; Ben Rais Lasram, F.; Cheung, W.W.; Christensen, V.; Karpouzi, V.S.; Guilhaumon, F.; Mouillot, D.; Paleczny, M.; et al. The Mediterranean Sea under siege: Spatial overlap between marine biodiversity, cumulative threats and marine reserves. Glob. Ecol. Biogeogr. 2012, 21, 465–480. [Google Scholar] [CrossRef]
- Micheli, F.; Halpern, B.S.; Walbridge, S.; Ciriaco, S.; Ferretti, F.; Fraschetti, S.; Lewison, R.; NyKjaer, R.; Rosenberg, A.A. Cumulative human impacts on Mediterranean and Black Sea marine ecosystems: Assessing current pressures and opportunities. PLoS ONE 2013, 8, e79889. [Google Scholar] [CrossRef] [Green Version]
- Bevilacqua, S.; Katsanevakis, S.; Micheli, F.; Sala, E.; Rilov, G.; Sarà, G.; Malak, D.A.; Abdulla, A.; Gerovasileiou, V.; Gissi, E.; et al. The status of coastal benthic ecosystems in the Mediterranean Sea: Evidence from ecological indicators. Front. Mar. Sci. 2020, 7, 475. [Google Scholar] [CrossRef]
- Dorgham, M.M.; Hamdy, R.; El Rashidy, H.H.; Atta, M.M.; Musco, L. Distribution patterns of shallow water polychaetes (Annelida) along the Alexandria coast, Egypt (eastern Mediterranean). Mediterr. Mar. Sci. 2014, 15, 635–649. [Google Scholar] [CrossRef] [Green Version]
- Pamungkas, J.; Glasby, C.J.; Read, G.B.; Wilson, S.P.; Costello, M.J. Progress and perspectives in the discovery of polychaete worms (Annelida) of the world. Helgol. Mar. Res. 2019, 73, 4. [Google Scholar] [CrossRef]
- Grassle, J.F.; Maciolek, N.J. Deep-sea species richness: Regional and local diversity estimates from quantitative bottom samples. Am. Nat. 1992, 139, 313–341. [Google Scholar] [CrossRef]
- Ward, T.J.; Hutchings, P.A. Effects of trace metals on infaunal species composition in polluted intertidal and subtidal marine sediments near a lead smelter, Spencer Gulf, South Australia. Mar. Ecol. Prog. Ser. 1996, 135, 123–135. [Google Scholar] [CrossRef] [Green Version]
- Arvanitidis, C.; Bellan, G.; Drakopoulos, P.; Valavanis, V.; Dounas, C.; Koukouras, A.; Eleftheriou, A. Seascape biodiversity patterns along the Mediterranean and the Black Sea: Lessons from the biogeography of benthic polychaetes. Mar. Ecol. Prog. Ser. 2002, 244, 139–152. [Google Scholar] [CrossRef]
- Bellan-Santini, D.; Ruffo, S. Biogeography of benthic marine amphipods in Mediterranean Sea. Biogeogr.–J. Integr. Biogeogr. 2003, 24, 273–292. [Google Scholar] [CrossRef] [Green Version]
- Musco, L. Ecology and diversity of Mediterranean hard-bottom Syllidae (Annelida): A community-level approach. Mar. Ecol. Prog. Ser. 2012, 461, 107–119. [Google Scholar] [CrossRef] [Green Version]
- Olsgard, F.; Somerfield, P.J. Surrogates in marine benthic investigations-which taxonomic unit to target? J. Aquat. Ecosyst. Stress Recovery 2000, 7, 25–42. [Google Scholar] [CrossRef]
- Giangrande, A.; Licciano, M.; Musco, L. Polychaetes as environmental indicators revisited. Mar. Pollut. Bull. 2005, 50, 1153–1162. [Google Scholar] [CrossRef]
- Musco, L.; Mikac, B.; Tataranni, M.; Giangrande, A.; Terlizzi, A. The use of coarser taxonomy in the detection of long-term changes in polychaete assemblages. Mar. Environ. Res. 2011, 71, 131–138. [Google Scholar] [CrossRef] [Green Version]
- Dauvin, J.C.; Andrade, H.; de-la-Ossa-Carretero, J.A.; Del-Pilar-Ruso, Y.; Riera, R. Polychaete/amphipod ratios: An approach to validating simple benthic indicators. Ecol. Indic. 2016, 63, 89–99. [Google Scholar] [CrossRef] [Green Version]
- Borja, A.; Franco, J.; Pérez, V. A marine biotic index to establish the ecological quality of soft-bottom benthos within European estuarine and coastal environments. Mar. Pollut. Bull. 2000, 40, 1100–1114. [Google Scholar] [CrossRef]
- Borja, A.; Franco, J.; Valencia, V.; Bald, J.; Muxika, I.; Belzunce, M.J.; Solaun, O. Implementation of the European water framework directive from the Basque country (northern Spain): A methodological approach. Mar. Pollut. Bull. 2004, 48, 209–218. [Google Scholar] [CrossRef]
- Borja, A.; Miles, A.; Occhipinti-Ambrogi, A.; Berg, T. Current status of macroinvertebrate methods used for assessing the quality of European marine waters: Implementing the Water Framework Directive. Hydrobiologia 2009, 633, 181–196. [Google Scholar] [CrossRef]
- Sarda, R. Polychaete communities related to plant covering in the mediolittoral and infralittoral zones of the Balearic Islands (Western Mediterranean). Mar. Ecol. 1991, 12, 341–360. [Google Scholar] [CrossRef]
- Lopez, E.; Vieitez, J.M. Polychaete assemblages on non-encrusting infralittoral algae from the Chafarinas Islands (SW Mediterranean). Cah. Biol. Mar. 1999, 40, 375–384. [Google Scholar]
- Tena, J.; Capaccioni-Azzati, R.; Torres-Gavila, F.J.; García-Carrascosa, A.M. Polychaetes associated with different facies of the photophilic algal community in the Chafarinas archipelago (SW Mediterranean). Bull. Mar. Sci. 2000, 67, 55–72. [Google Scholar]
- Fraschetti, S.; Giangrande, A.; Terlizzi, A.; Miglietta, M.; Della Tommasa, L.; Boero, F. Spatio-temporal variation of hydroids and polychaetes associated with Cystoseira amentacea (Fucales: Phaeophyceae). Mar. Biol. 2002, 140, 949–957. [Google Scholar] [CrossRef]
- Giangrande, A.; Delos, A.L.; Fraschetti, S.; Musco, L.; Licciano, M.; Terlizzi, A. Polychaete assemblages along a rocky shore on the South Adriatic coast (Mediterranean Sea): Patterns of spatial distribution. Mar. Biol. 2003, 143, 1109–1116. [Google Scholar] [CrossRef]
- Cinar, M.E.; Gonlugur-Demirci, G. Polychaete assemblages on shallow-water benthic habitats along the Sinop Peninsula (Black Sea, Turkey). Cah. Biol. Mar. 2005, 46, 253. [Google Scholar]
- Serrano, A.; Preciado, I. Environmental factors structuring polychaete communities in shallow rocky habitats: Role of physical stress versus habitat complexity. Helgol. Mar. Res. 2007, 61, 17–29. [Google Scholar] [CrossRef] [Green Version]
- Musco, L.; Terlizzi, A.; Licciano, M.; Giangrande, A. Taxonomic structure and the effectiveness of surrogates in environmental monitoring: A lesson from polychaetes. Mar. Ecol. Prog. Ser. 2009, 383, 199–210. [Google Scholar] [CrossRef] [Green Version]
- Gambi, M.C.; Musco, L.; Giangrande, A.; Badalamenti, F.; Micheli, F.; Kroeker, K.J. Distribution and functional traits of polychaetes in a CO2 vent system: Winners and losers among closely related species. Mar. Ecol. Prog. Ser. 2016, 550, 121–134. [Google Scholar] [CrossRef] [Green Version]
- Mikac, B.; Licciano, M.; Jaklin, A.; Iveša, L.; Giangrande, A.; Musco, L. Diversity and distribution patterns of hard bottom polychaete assemblages in the North Adriatic Sea (Mediterranean). Diversity 2020, 12, 408. [Google Scholar] [CrossRef]
- Bellan, G. Relationship of pollution to rocky substratum polychaetes on the French Mediterranean coast. Mar. Pollut. Bull. 1980, 11, 318–321. [Google Scholar] [CrossRef]
- Giangrande, A.; Delos, A.L.; Musco, L.; Licciano, M.; Pierri, C. Polychaete assemblages of rocky shore along the South Adriatic coast (Mediterranean Sea). Cah. Biol. Mar. 2004, 45, 85–96. [Google Scholar]
- Abbiati, M.; Bianchi, C.N.; Castelli, A. Polychaete vertical zonation along a littoral cliff in the western Mediterranean. Mar. Ecol. 1987, 8, 33–48. [Google Scholar] [CrossRef]
- Giangrande, A. Polychaete zonation and its relation to algal distribution down a vertical cliff in the western Mediterranean (Italy): A structural analysis. J. Exp. Mar. Biol. Ecol. 1988, 120, 263–276. [Google Scholar] [CrossRef]
- Abd-Elnaby, F.A.; San Martín, G. Eusyllinae, Anoplosyllinae, and Exogoninae (Polychaeta: Syllidae) for the Mediterranean Coasts of Egypt, together the description of one new species. Life Sci. J. 2010, 4, 132–139. [Google Scholar]
- Abd-Elnaby, F.A.; Martin, G.S. Syllinae (Syllidae: Polychaeta) from the Mediterranean coast of Egypt with the description of two new species. Mediterr. Mar. Sci. 2011, 12, 43–52. [Google Scholar] [CrossRef] [Green Version]
- Dorgham, M.M.; Hamdy, R.; El-Rashidy, H.H.; Atta, M.M. First records of polychaetes new to Egyptian Mediterranean waters. Oceanologia 2013, 55, 235–267. [Google Scholar] [CrossRef] [Green Version]
- Hamdy, E.R.; Dorgham, M.M. Macrofauna associated with a recently described bryozoan species in the Eastern Harbour of Alexandria, Egypt. Mediterr. Mar. Sci. 2019, 20, 248–259. [Google Scholar] [CrossRef] [Green Version]
- Bulleri, F.; Chapman, M.G. The introduction of coastal infrastructure as a driver of change in marine environments. J. Appl. Ecol. 2010, 47, 26–35. [Google Scholar] [CrossRef]
- Strickland, J.D.H.; Parsons, T.R. A Practical Handbook of Seawater Analysis, 2nd ed.; Fisheries Research Board of Canada: Ottawa, ON, Canada, 1972; p. 310. [Google Scholar] [CrossRef]
- Walkley, A.; Black, I.A. Armstrong. An examination of the Degtjareff method for determining soil organic matter, and a proposed modification of the chromic acid titration method. Soil Sci. 1934, 37, 29–38. [Google Scholar] [CrossRef]
- Anderson, M.J.; Gorley, R.N.; Clarke, R.K. Permanova+ for Primer: Guide to Software and Statistical Methods; Primer-E Ltd.: Auckland, New Zealand, 2008. [Google Scholar]
- Anderson, M.J.; Willis, T.J. Canonical analysis of principal coordinates: A useful method of constrained ordination for ecology. Ecology 2003, 84, 511–525. [Google Scholar] [CrossRef]
- Antoniadou, C.; Chintiroglou, C. Biodiversity of zoobenthic hard-substrate sublittoral communities in the Eastern Mediterranean (North Aegean Sea). Estuar. Coast. Shelf Sci. 2005, 62, 637–653. [Google Scholar] [CrossRef]
- Jones, E.; Thornber, C.S. Effects of habitat-modifying invasive macroalgae on epiphytic algal communities. Mar. Ecol. Prog. Ser. 2010, 400, 87–100. [Google Scholar] [CrossRef]
- Cacabelos, E.; Olabarria, C.; Incera, M.; Troncoso, J.S. Effects of habitat structure and tidal height on epifaunal assemblages associated with macroalgae. Estuar. Coast. Shelf Sci. 2010, 89, 43–52. [Google Scholar] [CrossRef]
- Musco, L.; Franzitta, G.; Colletti, A.; Savinelli, B.; Lo Martire, M.; Corinaldesi, C. Feasibility of the Sabellarid Reef Habitat Restoration. Front. Mar. Sci. 2022, 9, 349. [Google Scholar] [CrossRef]
- Terlizzi, A.; Fraschetti, S.; Guidetti, P.; Boero, F. The effects of sewage discharge on shallow hard substrate sessile assemblages. Mar. Pollut. Bull. 2002, 44, 544–550. [Google Scholar] [CrossRef]
- Piazzi, L.; Balata, D.; Cinelli, F.; Benedetti-Cecchi, L. Patterns of spatial variability in epiphytes of Posidonia oceanica: Differences between a disturbed and two reference locations. Aquat. Bot. 2004, 79, 345–356. [Google Scholar] [CrossRef]
- Borghese, J.; Musco, L.; Arduini, D.; Tamburello, L.; Del Pasqua, M.; Giangrande, A. A Comparative Approach to Detect Macrobenthic Response to the Conversion of an Inshore Mariculture Plant into an IMTA System in the Mar Grande of Taranto (Mediterranean Sea, Italy). Water 2023, 15, 68. [Google Scholar] [CrossRef]
- Borja, A.; Muxika, I. Guidelines for the use of AMBI (AZTI’s Marine Biotic Index) in the assessment of the benthic ecological quality. Mar. Pollut. Bull. 2005, 7, 787–789. [Google Scholar] [CrossRef]
Figure 1.
The sampling sites are along the Alexandria coast. El Mex (MX); Eastern Harbor- (EH); Gleem (GL); Stanly (ST); El Montazah (EM).
Figure 1.
The sampling sites are along the Alexandria coast. El Mex (MX); Eastern Harbor- (EH); Gleem (GL); Stanly (ST); El Montazah (EM).

Figure 2.
Average (±SE) number of species, abundance (individuals/m2), species richness (Margalef), and evenness (Pielou) bimonthly analyzed at each sampling site. Green bars were sites exposed to water discharge (EH, MX); light blue bars were sites exposed to urbanization (EM, GL, ST).
Figure 2.
Average (±SE) number of species, abundance (individuals/m2), species richness (Margalef), and evenness (Pielou) bimonthly analyzed at each sampling site. Green bars were sites exposed to water discharge (EH, MX); light blue bars were sites exposed to urbanization (EM, GL, ST).

Figure 3.
Canonical analysis of the principal coordinates (CAP). Correlation (Pearson) of the environmental variables, including algal cover, with the canonical axes is also reported. BOD, biochemical oxygen demand; OM, organic matter.
Figure 3.
Canonical analysis of the principal coordinates (CAP). Correlation (Pearson) of the environmental variables, including algal cover, with the canonical axes is also reported. BOD, biochemical oxygen demand; OM, organic matter.


Table 1.
The table shows the minimum (Min), maximum (Max), mean (Av), and standard deviation (SD) of the values of the physical-chemical variables at the sampling sites. Whereas T—temperature (°C); S—Salinity(ppt); DO—dissolved oxygen (mg/L); BOD—biochemical oxygen demand (mg/L); OM- organic matter (%).
| EM | GL | ST | EH | MX | ||||||
|---|---|---|---|---|---|---|---|---|---|---|
| Min | Max | Min | Max | Min | Max | Min | Max | Min | Max | |
| T | 18.30 | 29.7 | 14.80 | 29.90 | 14.90 | 29.20 | 14.60 | 28.80 | 15.40 | 29.50 |
| pH | 7.85 | 8.00 | 7.76 | 8.10 | 7.63 | 8.30 | 7.53 | 8.20 | 7.30 | 8.26 |
| S | 37.64 | 39.91 | 36.46 | 39.82 | 36.49 | 39.75 | 36.50 | 38.36 | 27.44 | 36.04 |
| DO | 0.41 | 8.47 | 7.98 | 15.30 | 6.19 | 13.68 | 3.58 | 19.28 | 5.21 | 7.49 |
| BOD | 0.41 | 1.63 | 0.32 | 2.28 | 0.57 | 11.40 | 0.32 | 15.45 | 4.07 | 6.76 |
| OM | 0.40 | 1.74 | 0.20 | 3.13 | 0.40 | 1.25 | 2.66 | 5.00 | 0.60 | 1.81 |
| Av | SD | Av | SD | Av | SD | Av | SD | Av | SD | |
| T | 22.33 | ±5.22 | 22.52 | ±5.36 | 22.67 | ±5.04 | 22.50 | 5.43 | 22.15 | 5.17 |
| pH | 7.90 | ±0.07 | 7.87 | ±0.12 | 7.85 | ±0.23 | 7.80 | 0.21 | 7.78 | 0.38 |
| S | 38.19 | ±0.99 | 37.47 | ±1.19 | 37.95 | ±1.26 | 37.68 | 0.92 | 31.26 | 3.48 |
| DO | 5.82 | ±2.92 | 9.47 | ±2.70 | 8.98 | ±2.35 | 8.56 | 5.15 | 6.76 | 0.95 |
| BOD | 1.09 | ±0.54 | 1.18 | ±0.79 | 2.79 | ±3.99 | 3.24 | 5.62 | 4.44 | 1.75 |
| OM | 0.88 | ±0.54 | 1.02 | ±1.02 | 0.78 | ±0.26 | 3.31 | 0.81 | 1.09 | 0.47 |
Table 2.
The table shows the percent of the cover of sessile invertebrates and algae at the five sampling sites. * Av—mean; SE—standard error.
Table 2.
The table shows the percent of the cover of sessile invertebrates and algae at the five sampling sites. * Av—mean; SE—standard error.
| EM | GL | ST | EH | MX | ||||||
|---|---|---|---|---|---|---|---|---|---|---|
| Av * | SE * | Av | SE | Av | SE | Av | SE | Av | SE | |
| Cladophora sp. | 0.39 | ±0.66 | 0.06 | ±0.14 | 0.50 | ±0.77 | ||||
| Ulva sp. | 10.50 | ±11.59 | 3.39 | ±5.93 | 25.22 | ±22.06 | 13.89 | ±4.57 | 68.67 | ±20.11 |
| Enteromorpha sp. | 2.78 | ±6.80 | ||||||||
| Petalonia sp. | 0.33 | ±0.69 | 0.06 | ±0.14 | 5.83 | ±8.18 | ||||
| Colpomenia sp. | 0.06 | ±0.14 | 0.61 | ±0.74 | ||||||
| Amphiroa sp. | 2.83 | ±2.51 | 0.11 | ±0.27 | 8.17 | ±10.78 | 2.33 | ±3.72 | 0.11 | ±0.19 |
| Corallina sp. | 31.44 | ±21.60 | 77.06 | ±14.53 | 38.72 | ±17.92 | 28.89 | ±22.57 | 9.83 | ±16.42 |
| Jania sp. | 0.78 | ±1.37 | 8.78 | ±6.59 | 0.11 | ±0.19 | 5.56 | ±9.54 | 0.72 | ±0.99 |
| Griffithsia sp. | 0.17 | ±0.30 | ||||||||
| Pyropia sp. | 0.39 | ±0.72 | ||||||||
| Pterocladia sp. | 5.83 | ±12.22 | 8.06 | ±13.62 | ||||||
| Brachidontes pharaonis | 23.06 | ±21.33 | 6.61 | ±8.78 | 13.33 | ±17.71 | 2.22 | ±3.17 | ||
| Other bivalves | 27.44 | ±21.12 | 4.83 | ±4.91 | 20.44 | ±17.23 | 34.33 | ±18.01 | 1.94 | ±2.21 |
| Balanus sp. | 1.67 | ±2.21 | 1.11 | ±2.11 | ||||||
| Bryozoa | 0.83 | ±1.03 | ||||||||
Table 3.
The table shows the list of the polychaete species collected at sampling sites with an indication of abundance values.
Table 3.
The table shows the list of the polychaete species collected at sampling sites with an indication of abundance values.
| Species | EM | GL | ST | EH | MX | Tot | Tot |
|---|---|---|---|---|---|---|---|
| ind/m2 | ind/m2 | ind/m2 | ind/m2 | ind/m2 | ind/m2 | % | |
| Syllis columbretensis (Campoy, 1982) | 56,390 | 31,920 | 7710 | 23,750 | 14,790 | 134,560 | 17.468 |
| Kirkegaardia heterochaeta (Laubier, 1961) | 41,600 | 780 | 57,490 | 700 | 30 | 100,600 | 13.06 |
| Syllis armillaris (O.F. Müller, 1776) | 7760 | 2220 | 21,740 | 64,610 | 3600 | 99,930 | 12.973 |
| Syllis prolifera (Krohn, 1852) | 1400 | 6350 | 13,270 | 32,850 | 11,190 | 65,060 | 8.4458 |
| Pseudonereis anomala (Gravier, 1899) | 36,980 | 4720 | 11,890 | 5470 | 3380 | 62,440 | 8.1057 |
| Naineris laevigata (Grube, 1855) | 1480 | 4040 | 19,150 | 5170 | 0 | 29,840 | 3.8737 |
| Syllis pulvinata (Langerhans, 1881) | 27,640 | 100 | 1110 | 130 | 0 | 28,980 | 3.7621 |
| Cirriformia filigera (Delle Chiaje, 1828) | 840 | 13,090 | 10,540 | 3050 | 720 | 28,240 | 3.666 |
| Syllis variegata (Grube, 1860) | 5880 | 7320 | 6560 | 7070 | 10 | 26,840 | 3.4843 |
| Amphicorina bichaeta (Capa & López, 2004) | 100 | 230 | 9050 | 14,500 | 10 | 23,890 | 3.1013 |
| Hydroides elegans (Haswell, 1883) | 560 | 620 | 250 | 9040 | 4190 | 14,660 | 1.9031 |
| Platynereis insolita (Gravier, 1899) | 7510 | 5700 | 1100 | 230 | 80 | 14,620 | 1.8979 |
| Eurythoe complanata (Pallas, 1766) | 13,430 | 10 | 0 | 30 | 0 | 13,470 | 1.7486 |
| Dorvillea similis (Crossland, 1924) | 300 | 2510 | 9240 | 10 | 0 | 12,060 | 1.5656 |
| Salvatoria clavata (Claparède, 1863) | 270 | 1560 | 1880 | 4890 | 1190 | 9790 | 1.2709 |
| Branchiomaldane vincenti (Langerhans, 1881) | 40 | 2820 | 2640 | 3420 | 0 | 8920 | 1.158 |
| Polyophthalmus pictus (Dujardin, 1839) | 1100 | 1330 | 3860 | 2350 | 60 | 8700 | 1.1294 |
| Dipolydora coeca (Örsted, 1843) | 790 | 790 | 190 | 5340 | 140 | 7250 | 0.9412 |
| Scyphoproctus cf. armatus (Fauvel, 1929) | 1790 | 2150 | 950 | 2040 | 10 | 6940 | 0.9009 |
| Spirobranchus triqueter (Linnaeus, 1758) | 1610 | 70 | 330 | 4020 | 400 | 6430 | 0.8347 |
| Linopherus canariensis (Langerhans, 1881) | 3700 | 120 | 1390 | 1110 | 0 | 6320 | 0.8204 |
| Oxydromus pallidus (Claparède, 1864) | 3360 | 300 | 850 | 1520 | 10 | 6040 | 0.7841 |
| Perkinsyllis anophthalma (Capaccioni & San Martín, 1990) | 80 | 250 | 0 | 4320 | 0 | 4650 | 0.6036 |
| Chrysopetalum debile (Grube, 1855) | 260 | 2090 | 1320 | 480 | 0 | 4150 | 0.5387 |
| Caulleriella cf. cristata (Blake, 1996) | 560 | 640 | 600 | 1800 | 0 | 3600 | 0.4673 |
| Branchiosyllis exilis (Gravier, 1900) | 560 | 2090 | 140 | 530 | 0 | 3320 | 0.431 |
| Loimia medusa (Savigny, 1822) | 210 | 0 | 930 | 2020 | 20 | 3180 | 0.4128 |
| Dipolydora armata (Langerhans, 1880) | 0 | 280 | 2300 | 0 | 10 | 2590 | 0.3362 |
| Alitta succinea (Leuckart, 1847) | 580 | 250 | 270 | 250 | 890 | 2240 | 0.2908 |
| Odontosyllis fulgurans (Audouin & Milne Edwards, 1833) | 290 | 1120 | 430 | 340 | 0 | 2180 | 0.283 |
| Caulleriella alata (Southern, 1914) | 20 | 0 | 100 | 1840 | 0 | 1960 | 0.2544 |
| Syllis gracilis (Grube, 1840) | 50 | 220 | 960 | 20 | 470 | 1720 | 0.2233 |
| Brania arminii (Langerhans, 1881) | 60 | 30 | 1400 | 120 | 30 | 1640 | 0.2129 |
| Lumbrineris perkinsi (Carrera-Parra, 2001) | 510 | 10 | 360 | 730 | 0 | 1610 | 0.209 |
| Dodecaceria concharum (Örsted, 1843) | 140 | 910 | 230 | 100 | 70 | 1450 | 0.1882 |
| Opisthosyllis brunnea (Langerhans, 1879) | 550 | 550 | 290 | 0 | 0 | 1390 | 0.1804 |
| Myrianida prolifera (O.F. Müller, 1788) | 10 | 10 | 30 | 1310 | 10 | 1370 | 0.1778 |
| Cirriformia tentaculata (Montagu, 1808) | 0 | 600 | 30 | 720 | 0 | 1350 | 0.1753 |
| Hydroides operculata (Treadwell, 1929) | 260 | 0 | 240 | 780 | 40 | 1320 | 0.1714 |
| Capitella capitata (Fabricius, 1780) | 30 | 20 | 210 | 990 | 10 | 1260 | 0.1636 |
| Exogone africana (Hartmann-Schröder, 1974) | 20 | 430 | 230 | 390 | 10 | 1080 | 0.1402 |
| Lepidonotus clava (Montagu, 1808) | 30 | 30 | 110 | 830 | 0 | 1000 | 0.1298 |
| Trypanosyllis sanmartini (Çinar, 2007) | 0 | 10 | 10 | 920 | 0 | 940 | 0.122 |
| Thelepus setosus (Quatrefages, 1866) | 10 | 440 | 300 | 170 | 0 | 920 | 0.1194 |
| Dipolydora giardi (Mesnil, 1893) | 140 | 120 | 10 | 560 | 0 | 830 | 0.1077 |
| Lysidice unicornis (Grube, 1840) | 310 | 60 | 340 | 60 | 10 | 780 | 0.1013 |
| Boccardia polybranchia (Haswell, 1885) | 0 | 720 | 60 | 0 | 0 | 780 | 0.1013 |
| Nereiphylla rubiginosa (de Saint-Joseph, 1888) | 70 | 50 | 70 | 400 | 0 | 590 | 0.0766 |
| Schistomeringos rudolphi (Delle Chiaje, 1828) | 10 | 0 | 0 | 550 | 0 | 560 | 0.0727 |
| Ctenodrilus serratus (Schmidt, 1857) | 0 | 0 | 460 | 0 | 90 | 550 | 0.0714 |
| Brania pusilla (Dujardin, 1851) | 10 | 0 | 50 | 440 | 0 | 500 | 0.0649 |
| Syllidia armata (Quatrefages, 1866) | 210 | 0 | 30 | 200 | 0 | 440 | 0.0571 |
| Pseudopolydora antennata (Claparède, 1869) | 110 | 90 | 70 | 170 | 0 | 440 | 0.0571 |
| Myrianida convoluta (Cognetti, 1953) | 0 | 10 | 40 | 290 | 30 | 370 | 0.048 |
| Scoletoma laurentiana (Grube, 1863) | 90 | 10 | 50 | 210 | 0 | 360 | 0.0467 |
| Eumida sanguinea (Örsted, 1843) | 60 | 50 | 120 | 130 | 0 | 360 | 0.0467 |
| Spirorbis sp. | 10 | 0 | 0 | 310 | 0 | 320 | 0.0415 |
| Haplosyllis spongicola (Grube, 1855) | 10 | 0 | 230 | 70 | 0 | 310 | 0.0402 |
| Syllides convolutes (Webster & Benedict, 1884) | 0 | 0 | 60 | 170 | 10 | 240 | 0.0312 |
| Ophryotrocha cf. adherens (Paavo, Bailey-Brock & Akesson, 2000) | 0 | 30 | 0 | 180 | 0 | 210 | 0.0273 |
| Serpula hartmanae (Reish, 1968) | 10 | 0 | 70 | 120 | 0 | 200 | 0.026 |
| Nereis splendida (Grube, 1840) | 0 | 0 | 0 | 100 | 80 | 180 | 0.0234 |
| Sabellaria spinulosa (Leuckart, 1849) | 110 | 20 | 30 | 10 | 0 | 170 | 0.0221 |
| Sphaerosyllis hystrix (Claparède, 1863) | 40 | 0 | 120 | 0 | 0 | 160 | 0.0208 |
| Branchiomma bairdi (McIntosh, 1885) | 0 | 30 | 90 | 30 | 0 | 150 | 0.0195 |
| Armandia casuarina (Moreira & Parapar, 2017) | 0 | 20 | 0 | 110 | 0 | 130 | 0.0169 |
| Amphiglena mediterranea (Leydig, 1851) | 0 | 0 | 110 | 10 | 0 | 120 | 0.0156 |
| Marphysa sanguinea (Montagu, 1813) | 10 | 0 | 10 | 90 | 0 | 110 | 0.0143 |
| Mesochaetopterus sagittarius (Claparède, 1870) | 0 | 0 | 90 | 0 | 0 | 90 | 0.0117 |
| Trypanosyllis zebra (Grube, 1860) | 0 | 20 | 50 | 10 | 0 | 80 | 0.0104 |
| Capitella minima (Langerhans, 1880) | 0 | 20 | 50 | 0 | 0 | 70 | 0.0091 |
| Oxydromus agilis (Ehlers, 1864) | 30 | 0 | 0 | 30 | 0 | 60 | 0.0078 |
| Spirobranchus tetraceros (Schmarda, 1861) | 0 | 0 | 0 | 60 | 0 | 60 | 0.0078 |
| Pionosyllis sp. | 10 | 0 | 20 | 30 | 0 | 60 | 0.0078 |
| Neanthes acuminata (Ehlers, 1868) | 0 | 0 | 0 | 50 | 0 | 50 | 0.0065 |
| Arabella iricolor (Montagu, 1804) | 40 | 0 | 10 | 0 | 0 | 50 | 0.0065 |
| Halla parthenopeia (Delle Chiaje, 1828) | 20 | 0 | 10 | 20 | 0 | 50 | 0.0065 |
| Vermiliopsis infundibulum (Philippi, 1844) | 0 | 0 | 40 | 10 | 0 | 50 | 0.0065 |
| Leodice antennata Savigny in (Lamarck, 1818) | 30 | 0 | 10 | 0 | 0 | 40 | 0.0052 |
| Pharyngocirrus goodrichi (Jouin-Toulmond & Gambi, 2007) | 10 | 0 | 10 | 20 | 0 | 40 | 0.0052 |
| Prionospio lighti (Maciolek, 1985) | 0 | 0 | 0 | 40 | 0 | 40 | 0.0052 |
| Pettiboneia urciensis (Campoy & San Martín, 1980) | 0 | 0 | 0 | 30 | 0 | 30 | 0.0039 |
| Leodice miurai (Carrera-Parra & Salazar-Vallejo, 1998) | 20 | 0 | 0 | 0 | 0 | 20 | 0.0026 |
| Perinereis cultrifera (Grube, 1840) | 20 | 0 | 0 | 0 | 0 | 20 | 0.0026 |
| Phyllodoce longifrons (Ben-Eliahu, 1972) | 20 | 0 | 0 | 0 | 0 | 20 | 0.0026 |
| Aphrogenia sp. | 0 | 10 | 0 | 0 | 0 | 10 | 0.0013 |
| Protodorvillea cf. kefersteini (McIntosh, 1869) | 0 | 0 | 10 | 0 | 0 | 10 | 0.0013 |
| Podarkeopsis capensis (Day, 1963) | 0 | 0 | 0 | 10 | 0 | 10 | 0.0013 |
| Leonnates decipiens (Fauvel, 1929) | 0 | 10 | 0 | 0 | 0 | 10 | 0.0013 |
| Platynereis dumerilii (Audouin & Milne Edwards, 1833) | 10 | 0 | 0 | 0 | 0 | 10 | 0.0013 |
| Subadyte cf. pellucida (Ehlers, 1864) | 0 | 0 | 10 | 0 | 0 | 10 | 0.0013 |
| Claudrilus helgolandicus (von Nordheim, 1983) | 10 | 0 | 0 | 0 | 0 | 10 | 0.0013 |
| Polydora cornuta (Bosc, 1802) | 0 | 0 | 0 | 10 | 0 | 10 | 0.0013 |
| Pseudopolydora paucibranchiata (Okuda, 1937) | 0 | 0 | 10 | 0 | 0 | 10 | 0.0013 |
| Spio blakei (Maciolek, 1990) | 0 | 0 | 0 | 10 | 0 | 10 | 0.0013 |
| Salvatoria limbata (Claparède, 1868) | 10 | 0 | 0 | 0 | 0 | 10 | 0.0013 |
| Syllis sp. | 0 | 0 | 0 | 10 | 0 | 10 | 0.0013 |
| Syllis rosea (Langerhans, 1879) | 0 | 0 | 0 | 0 | 10 | 10 | 0.0013 |
Table 4.
The ANOVAs testing difference in species number (A), abundance (B), species richness (Margalef) (C), and evenness (Pielou) (D) in hard-bottom polychaete assemblages in the study areaPer each test, the result of the PERMDISP is also provided. IM, impact; SI, site; TI, time. Significant p-values are given in italics. MS, mean squares; Pseudo-F, statistic; P(perm), probability calculated by permutations; unique perms, unique permutations. 9999 permutations were used.
| A | Source | df | MS | Pseudo-F | P(perm) | Unique perms |
|---|---|---|---|---|---|---|
| IM | 1 | 514.31 | 0.3036 | 0.9270 | 9956 | |
| TI | 5 | 472.78 | 5.6613 | 0.0037 | 9964 | |
| SI(IM) | 3 | 1883.30 | 22.5510 | 0.0001 | 9955 | |
| IM×TI | 5 | 85.94 | 1.0291 | 0.4407 | 9954 | |
| SI(IM)×TI | 15 | 83.51 | 1.6247 | 0.0906 | 9932 | |
| Res | 60 | 51.40 | ||||
| Total | 89 | |||||
| PERMDISP F1,88 19.539; P(perm) 0.0001 | ||||||
| B | IM | 1 | 135070000 | 0.5047 | 0.7746 | 9943 |
| TI | 5 | 530420000 | 3.9392 | 0.0225 | 9945 | |
| SI(IM) | 3 | 432760000 | 3.2139 | 0.0481 | 9949 | |
| IM×TI | 5 | 101640000 | 0.7549 | 0.6033 | 9947 | |
| SI(IM)×TI | 15 | 134650000 | 1.7747 | 0.0521 | 9907 | |
| Res | 60 | 75875000 | ||||
| Total | 89 | |||||
| PERMDISP F1,88 0.58742; P(perm) 0.6196 | ||||||
| C | IM | 1 | 5.8163 | 0.33693 | 0.9091 | 9949 |
| TI | 5 | 3.3201 | 5.6279 | 0.0038 | 9963 | |
| SI(IM) | 3 | 18.4000 | 31.1900 | 0.0001 | 9953 | |
| IM×TI | 5 | 0.6140 | 1.0407 | 0.4260 | 9943 | |
| SI(IM)×TI | 15 | 0.5899 | 1.1899 | 0.3049 | 9918 | |
| Res | 60 | 0.4958 | ||||
| Total | 89 | |||||
| PERMDISP F1,88 23.886; P(perm) 0.0001 | ||||||
| D | IM | 1 | 0.043 | 0.6513 | 0.6582 | 9951 |
| TI | 5 | 0.015 | 0.6865 | 0.6366 | 9945 | |
| SI(IM) | 3 | 0.084 | 3.7603 | 0.0331 | 9952 | |
| IM×TI | 5 | 0.017 | 0.7655 | 0.5967 | 9963 | |
| SI(IM)×TI | 15 | 0.022 | 2.0388 | 0.028 | 9926 | |
| Res | 60 | 0.011 | ||||
| Total | 89 | |||||
| PERMDISP F1,88 0.55745; P(perm) 0.4741 | ||||||
Table 5.
The table shows PERMANOVA. Analysis of spatial-temporal variation in hard-bottom polychaete assemblages in the study area IM, impact; SI, site; TI, time. Significant p-values are given in italics. MS, mean squares; Pseudo-F, statistic; P(perm) probability calculated by permutations; unique perms, unique permutations. Data square-root transformed. 9999 permutations were used.
| Source | df | MS | Pseudo-F | P(perm) | Unique Perms |
|---|---|---|---|---|---|
| IM | 1 | 16,170 | 1.219 | 0.2509 | 9910 |
| TI | 5 | 3480 | 2.0459 | 0.0003 | 9872 |
| SI(IM) | 3 | 12,745 | 7.4927 | 0.0001 | 9930 |
| IM × TI | 5 | 1915.2 | 1.126 | 0.2661 | 9873 |
| SI(IM) × TI | 15 | 1701 | 2.2651 | 0.0001 | 9794 |
| Res | 60 | 750.95 | |||
| Total | 89 | ||||
| PERMDISP F1,88 9.0908; P(perm) 0.0085 | |||||
Table 6.
The PERMANOVA pairwise test for pairs of levels of factor “site” within levels of the factor “impact” per each level of the factor “time”. Due to the low number of unique permutations, significance was calculated using Montecarlo (MC) sampling.
Table 6.
The PERMANOVA pairwise test for pairs of levels of factor “site” within levels of the factor “impact” per each level of the factor “time”. Due to the low number of unique permutations, significance was calculated using Montecarlo (MC) sampling.
| August | October | December | February | April | July | |||||||
|---|---|---|---|---|---|---|---|---|---|---|---|---|
| t | P(MC*) | t | P(MC) | T | P(MC) | t | P(MC) | t | P(MC) | t | P(MC) | |
| Within level ‘UR’ of factor ‘IM’ | ||||||||||||
| EM, GL | 1.9619 | 0.0488 | 3.2624 | 0.0069 | 2.116 | 0.0295 | 1.4134 | 0.188 | 2.8186 | 0.0075 | 2.3494 | 0.0165 |
| EM, ST | 1.3533 | 0.1852 | 2.9314 | 0.0064 | 2.8485 | 0.0109 | 0.90941 | 0.457 | 2.7358 | 0.0123 | 1.9353 | 0.0537 |
| GL, ST | 1.7026 | 0.0695 | 2.7167 | 0.0093 | 3.1222 | 0.0084 | 1.6249 | 0.1225 | 2.0335 | 0.0309 | 1.9586 | 0.0465 |
| Within level ‘DI’ of factor ‘IM’ | ||||||||||||
| EH, MX | 3.2934 | 0.0058 | 3.5489 | 0.0048 | 1.6908 | 0.0771 | 2.2494 | 0.0217 | 3.4577 | 0.0041 | 2.6893 | 0.01 |
Disclaimer/Publisher’s Note: The statements, opinions and data contained in all publications are solely those of the individual author(s) and contributor(s) and not of MDPI and/or the editor(s). MDPI and/or the editor(s) disclaim responsibility for any injury to people or property resulting from any ideas, methods, instructions or products referred to in the content. |
© 2023 by the authors. Licensee MDPI, Basel, Switzerland. This article is an open access article distributed under the terms and conditions of the Creative Commons Attribution (CC BY) license (https://creativecommons.org/licenses/by/4.0/).
Share and Cite
MDPI and ACS Style
Hamdy, R.; Elebiary, N.; Naby, F.A.; Borghese, J.; Dorgham, M.; Hamdan, A.; Musco, L. Hard-Bottom Polychaetes Exposed to Multiple Human Pressure along the Mediterranean Coast of Egypt. Water 2023, 15, 997. https://doi.org/10.3390/w15050997
AMA Style
Hamdy R, Elebiary N, Naby FA, Borghese J, Dorgham M, Hamdan A, Musco L. Hard-Bottom Polychaetes Exposed to Multiple Human Pressure along the Mediterranean Coast of Egypt. Water. 2023; 15(5):997. https://doi.org/10.3390/w15050997
Chicago/Turabian StyleHamdy, Rasha, Noha Elebiary, Faiza Abdel Naby, Jacopo Borghese, Mohamed Dorgham, Amira Hamdan, and Luigi Musco. 2023. "Hard-Bottom Polychaetes Exposed to Multiple Human Pressure along the Mediterranean Coast of Egypt" Water 15, no. 5: 997. https://doi.org/10.3390/w15050997
Note that from the first issue of 2016, this journal uses article numbers instead of page numbers. See further details here.