Article

Contamination of Water and Sediments of Harike Wetland with Phthalate Esters and Associated Risk Assessment

1
Department of Botanical and Environmental Sciences, Guru Nanak Dev University, Amritsar 143005, India
2
Department of Applied Biological Chemistry, Graduate School of Agricultural and Life Sciences, The University of Tokyo, Yoyoi, Bunkyo-ku, Tokyo 113-8654, Japan
3
Academy of Biology and Biotechnology, Southern Federal University, 344006 Rostov-on-Don, Russia
*
Author to whom correspondence should be addressed.
Water 2023, 15(6), 1009; https://doi.org/10.3390/w15061009
Submission received: 7 February 2023 / Revised: 26 February 2023 / Accepted: 1 March 2023 / Published: 7 March 2023

Abstract

:
Phthalate esters (PEs) are esters that are used as plasticizers and are widely known for their contamination and toxicological effects on various environmental matrices. The present study is designed to observe the co-occurrence of phthalate esters and their ecotoxicological and human health risk assessments on Harike wetland, Ramsar, a site recognized globally, is the largest freshwater wetland in Northern India. During the winter, summer, and monsoon seasons, samples of the water and sediments were collected. These samples were then analyzed for ubiquitously detected seven PEs as per the literature survey using ultra-high performance liquid chromatography. According to the results, the total PEs content in the water sample ranged from 31.5 to 95.6 mg/L, whereas in the sediments it ranged from 35.1 to 345.2 mg/100 g dw. Prominent levels of PEs in water and sediments from the Harike wetland were discovered when compared to studies from different parts of the world. Based on drinking water consumption there is a potentially high risk of PEs especially benzyl butyl phthalate and dibutyl phthalate. Further, as per the US Environmental Protection Agency, chronic values of PEs levels in water and sediments are expected to possess a threat to sensitive organisms present in freshwater ecosystems. As far, as this is a detailed study that described the levels and ecotoxicological risks of PEs and is an important reference for the protection of aquatic organisms in the Harike wetland.

1. Introduction

Phthalate esters (PEs) are used in various formulations for the manufacture of plastic products, used as plasticizers to increase their flexibility, transparency, durability, and longevity [1,2,3]. In the last few decades, the production of PEs has immensely increased due to the excessive demand for various plastic materials [4,5]. According to a report in 2019, from years 1975 to 2011, the production of phthalates has been raised from 1.8 to 8 million tons [6]. They are synthesized in massive amounts for use in cosmetics and personal care products including perfumes, hair spray, soap, shampoo, nail polish, skin moisturizers, vinyl toys, shower curtains, wallpapers, food packing, and plastic wraps and hence, their prolonged exposure lead to harmful effects on human and wildlife [6,7]. As phthalates are not covalently bound to the polymeric matrix, therefore, these are directly released via leaching, migration, and abrasion into the air, water, and soil because of their semi-volatile nature [8]. However, PEs accumulate in the aquatic environment because they are continuously released into the environment through various channels, including wastewater discharge, air transportation/deposition, and discarding plastic polymers. Hence, PEs easily migrate into various aquatic organisms and further these PEs can cause several adverse effects such as neurotoxicity, genotoxicity, immunotoxicity, development toxicity, metabolic toxicity, etc. [9,10,11].
According to reports, the most dominant phthalate ester species in freshwater environments are dibutyl phthalate (DBP), di(2-ethylhexyl) phthalate (DEHP), diethyl phthalate (DEP) and dimethyl phthalate (DMP) [12]. The detected concentrations of PEs in water and sediments ranged from 0.47 to 118.25 μg/L and 0.001–56.17 mg/kg, respectively [13]. Some PEs are recognized as endocrine-disrupting chemicals (EDCs), which frequently have adverse effects on organisms and ecosystems, according to epidemiological and toxicological research. According to the United States Environmental Protection Agency (USEPA) and European Union (EU), benzyl butyl phthalate (BBP), dibutyl phthalate (DBP), di (2-ethylhexyl) phthalate (DEHP), diethyl phthalate (DEP), dimethyl phthalate (DMP), and di-n-octyl phthalate (DnOP), are listed as priority pollutants. Also, in Chinese waters due to their high potential effects, these phthalates are classified as carcinogenic, mutagenic, and teratogenic [3,14]. Moreover, various ecotoxicological studies have shown reasonable effects on aquatic life because of the presence of phthalates in these environments. Most contaminants are insoluble in water therefore; sediments present in waterbodies act as depositories for these contaminants [15,16]. A study reported that the eggs of Medaka fish were exposed to DEHP which resulted in decreased body weight and increased mortality [17]. Recent findings reveal that exposure to DBP, BBP, DEP, etc. causes alteration in gamete quality, gene expression, and hormonal effects in various species of fish [18,19]. Toxic effects of DHPP and DIDP, show that alterations in swimming behavior and biochemical activities of zebrafish were also reported [20]. As PEs has hydrophobic property, therefore they tend to adsorb on suspended particulate matter present at bottom of freshwater ecosystems. Hence, sediments provide significant information for understanding the origin and routes of a pollutant in aquatic environments [21]. Although, through the processes of re-suspension or upwelling, sediment may serve as a pollution sink and reservoir for pollutants in the aquatic system [22]. Further, the harmful effects of phthalates include reproductive toxicity in humans and animals; they can cause infertility and reproductive problems in males so commonly known as “endocrine disruptors”. Continuous exposure to phthalates may cause serious health issues such as altered semen quality, premature breast development, shortened gestation, fertility, testicular dysgenesis, childhood social impairment, obesity, asthma, breast cancer, birth defects, etc. [23,24].
Studies have also explained these compounds’ effects on the various receptors (insulin receptor, aryl hydrocarbon receptor, and androgen receptor) and other cellular targets [25]. By interacting with hormone receptors in the body, PEs disrupt the reproductive system, hence altering embryonic growth and development. According to a report, the effect on embryo development can lead to retardation in growth and abnormality of organs in an offspring [26]. Toys and childcare articles which include DEHP, DBP, and BBP have been banned in the United States, Europe, and Canada. According to reports, 16.2% mass of PEs has been detected in Indian toys. However, data on PEs production in India is not available, but the major raw material of PEs i.e., phthalic anhydride consumption during 2012–2013 was 225,262 metric tons [27,28]. For PEs in drinking water, World Health Organization and USEPA have established guidelines. Moreover, Maximum Contaminant Level (MCL), Environmental Quality Standards (EQS), Minor Adverse Effect Concentration (MAEC), and Environmental Risk Limit (ERL) are some quality criteria applied for PEs to prevent the humans, environment, and aquatic species [5].
The largest freshwater wetland in Northern India is the Harike wetland. It is an internationally recognized Ramsar site, located between Amritsar, Ferozepur, Jalandhar and Kapurthala districts of Punjab and majorly fed by the Beas and Sutlej rivers [29,30]. It has been reported 360 species of birds, 7 species of turtles, 4 species of snakes, 6 taxa of amphibians, 16 taxa of fishes, 189 taxa of invertebrates, and 38 taxa of plants occur at Harike [31,32]. According to various studies, the water quality of the wetland is deteriorating rapidly because of extensive discharge of effluents from industries, agricultural and waste runoff. Although pesticides, heavy metals, etc., contamination and risk assessments have been well-studied in these biological matrices, contamination by phthalates esters is not fully understood for this selected area [33,34]. Hence the main objectives of this study were to (i) study the occurrence of phthalates in water and sediments and (ii) report the toxicological risk evaluation to various organisms of the Harike wetland. Further, this study was performed for the first time in Northern India and will act as a preliminary for understanding environmental safety.

2. Materials and Methods

2.1. Chemicals and Reagents

BBP (CAS: 85-68-7, purity: 98%), DAP (CAS: 131-17-9, purity: 99%), DBP (CAS: 84-74-7, purity: 99%), DEP (CAS: 84-66-2, purity: 99%), DMP (CAS:131-11-3, purity: 98%), DPP (CAS: 84-62-8, purity: 99%), DcHP (CAS: 84-61-7, purity: ≥99%) were purchased from HiMedia Laboratories Pvt. Ltd., Mumbai (India) and all other solvents were of HPLC grade.

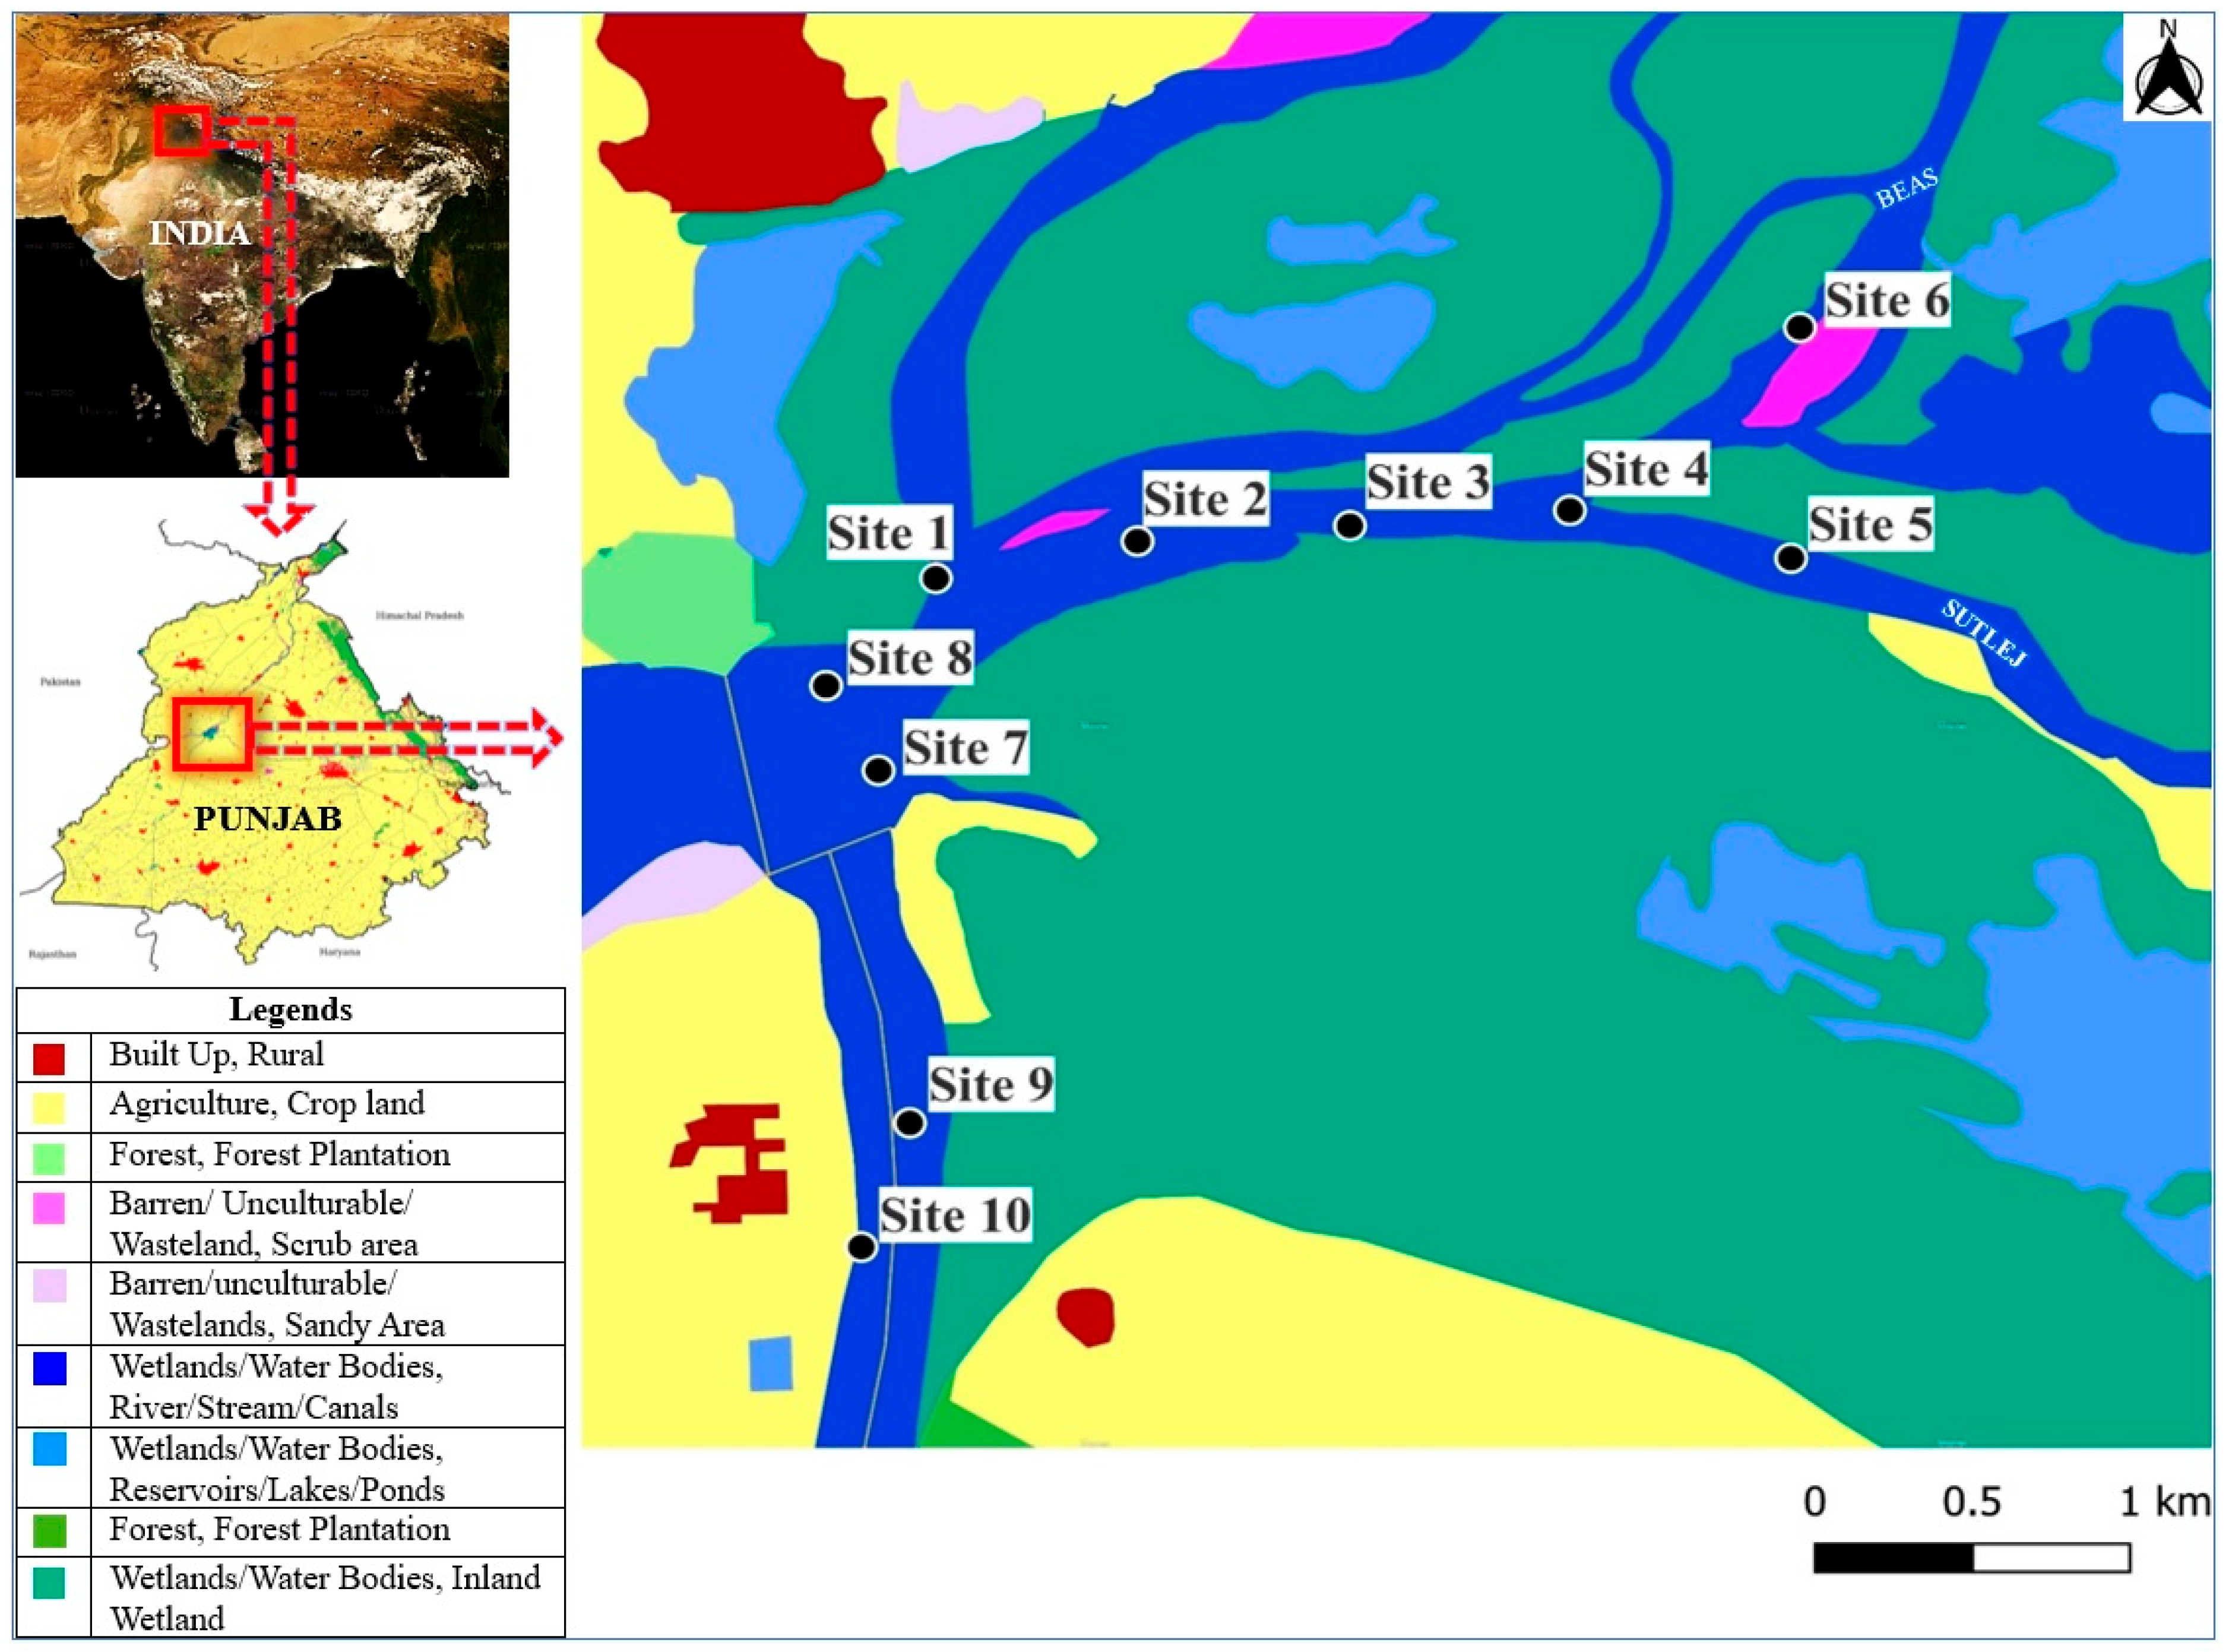
2.2. Study Area and Sample Collection

The wetland subjected to this study, the Harike wetland, originates at the confluence of the two major rivers of the state of Punjab i.e., Sutlej and Beas. An area of 41 km2 is covered by this wetland which majorly serves tremendously rich biodiversity [35]. The water (n = 10) and sediment (n = 10) samples were collected during three seasons i.e., winter (January 2021), summer (April 2021), and monsoon (August 2021). The sampling includes 10 sites given in the map (Figure 1) covering the major parts of the Harike wetland (Table 1). The surface water samples were collected using amber glass bottles prewashed with detergent, ultrapure water, and sample water. While grab samples of sediments were collected using clean glass jars. To prevent plastic contamination, no plastic products were used during sampling and analysis. The collected samples were immediately transferred to the laboratory and stored at 4 °C (water samples) and −20 °C (sediment samples). The samples were extracted within a week.

2.3. Water Sample Extraction

For the extraction of phthalates from water, the liquid-phase extraction method was used with some modifications [36]. A separatory funnel was used in which 100 mL of the sample was added in which a mixture of 20 mL dichloromethane and methanol (1:1) was added and after shaking vigorously for 3 min the supernatant was collected. The extract was allowed to evaporate using a rotary evaporator. Repeat the same extraction procedure thrice. Then the extracts were filtered through a 0.22 µm membrane and analyzed using UHPLC by re-dissolving in acetonitrile [37].

2.4. Sediment Sample Extraction

The sediment samples were air-dried at a moderate temperature without any plastic contamination. Then samples were sieved through a 0.22 mm sieve to prepare a homogenized mixture. The extraction was done using acetone and hexane solvents and then kept in an ultrasonic bath for 20 min. After sonication, the extract was allowed to settle, and the upper layer was separated very carefully and then reduced using a rotary evaporator to 1.0 mL. The collected sample was dissolved in acetonitrile and filtered through a 0.22 µm filter membrane and then transferred for UHPLC analysis [38].

2.5. Instrumental Conditions

Phthalate analysis was carried out using ultra-high-performance liquid chromatography (UHPLC) system purchased from Shimadzu Corporation (Kyoto, Japan). The system consisted of a degasser (DGU-20A5), solvent mixing unit (LC-30AD), autosampler (SIL-30AC), column oven (CTO-10AS VP), PDA detector (SPD_M20A) and system controller (CBM-20A). The system was coupled with a C18 HPLC column having dimensions of 250 × 4.6 mm and pore size 5 µm. The method was prepared according to ICH, 2005 guidelines for the seven phthalates viz. BBP (benzyl butyl phthalate), DAP (diallyl phthalate), DBP (Dibutyl phthalate), DEP (diethyl phthalate), DMP (dimethyl phthalate), DPP (diphenyl phthalate), DcHP (dicyclohexyl phthalate). The stock solution of phthalates at the concentration of 500 mg/L was prepared using acetonitrile. The working solutions were prepared by serial dilution from stock solutions. The operating conditions of UHPLC and chromatogram of phthalates were in Table S1 and Figure S1, respectively.

2.6. Risk Assessment

2.6.1. Human Health

The health risks of phthalates and their exposure levels to the local population were calculated by Equation (1) [39].
AE = (Cw × IR × EF × ED)/(BW × AT)
where AE (mg/kg BW/day) is the contaminant exposure to adults through ingestion of drinking water, Cw (mg/L) represents the concentration of phthalates in drinking water, IR (ingestion rate) is the daily water intake in a litre (2.5 for an adult; 1 for children); EF (exposure frequency) is assumed as a number of days’ exposure in a year (365); ED is the exposure duration; BW is the average body weight (70 kg for adult; 10 kg for children) and AT is the averaging time i.e., ED × 365 days.
To estimate non-carcinogenic risk, hazard quotient (HQ) was calculated by given Equation (2)
HQ = AE/RfD
where RfD represents individual phthalate reference doses as given in USEPA (2013). The RfD for DEP, DBP, DMP and BBP were 800, 100, 200, 20, 10 and 10 mg/kg/day, respectively. To evaluate the overall non-carcinogenic risk posed by all phthalates, hazard index (HI) was calculated as given in Equation (3). Whereas HI > 1 indicates the probability of adverse health effects [1,40].
HI = HQ1 + HQ2 +…………+ HQn

2.6.2. Freshwater and Sediment

Aquatic risk assessment was estimated as per Formula (4) given as risk quotient (RQ) is the ratio between measured environmental concentration (MEC) and predicted no effect concentration (PNEC) of aquatic life [41,42,43].
RQ = MECwater/sed/PNECwater/sed
PNECwater = EC50 or LC50/Assessment Factor
PNECsed = (0.783 + (0.0217 × Koc) × PNECwater
Log Koc = 0.00028 + (0.983 × Log Kow)
where MEC is regarded as the maximum concentration of phthalate in water in µg/L and PNEC is the value of lowest chronic toxicity which was calculated by using ECOSAR v2.2 and applying an assessment factor of 10 for blue green algae, daphnia, and fish. For sediments, measured sediment concentration was calculated using Equations (6) and (7) for the risk assessment of phthalates [44,45,46].

2.7. Statistical Analyses

Means ± standard deviation (S.D.) were calculated and a two-way analysis of variance (ANOVA) was performed. The differences (p ≤ 0.05) among means were compared by the honestly significant difference (HSD) using Tukey’s multiple comparison test using SPSS version 16.0 (Inc., Chicago, IL, USA).

3. Results

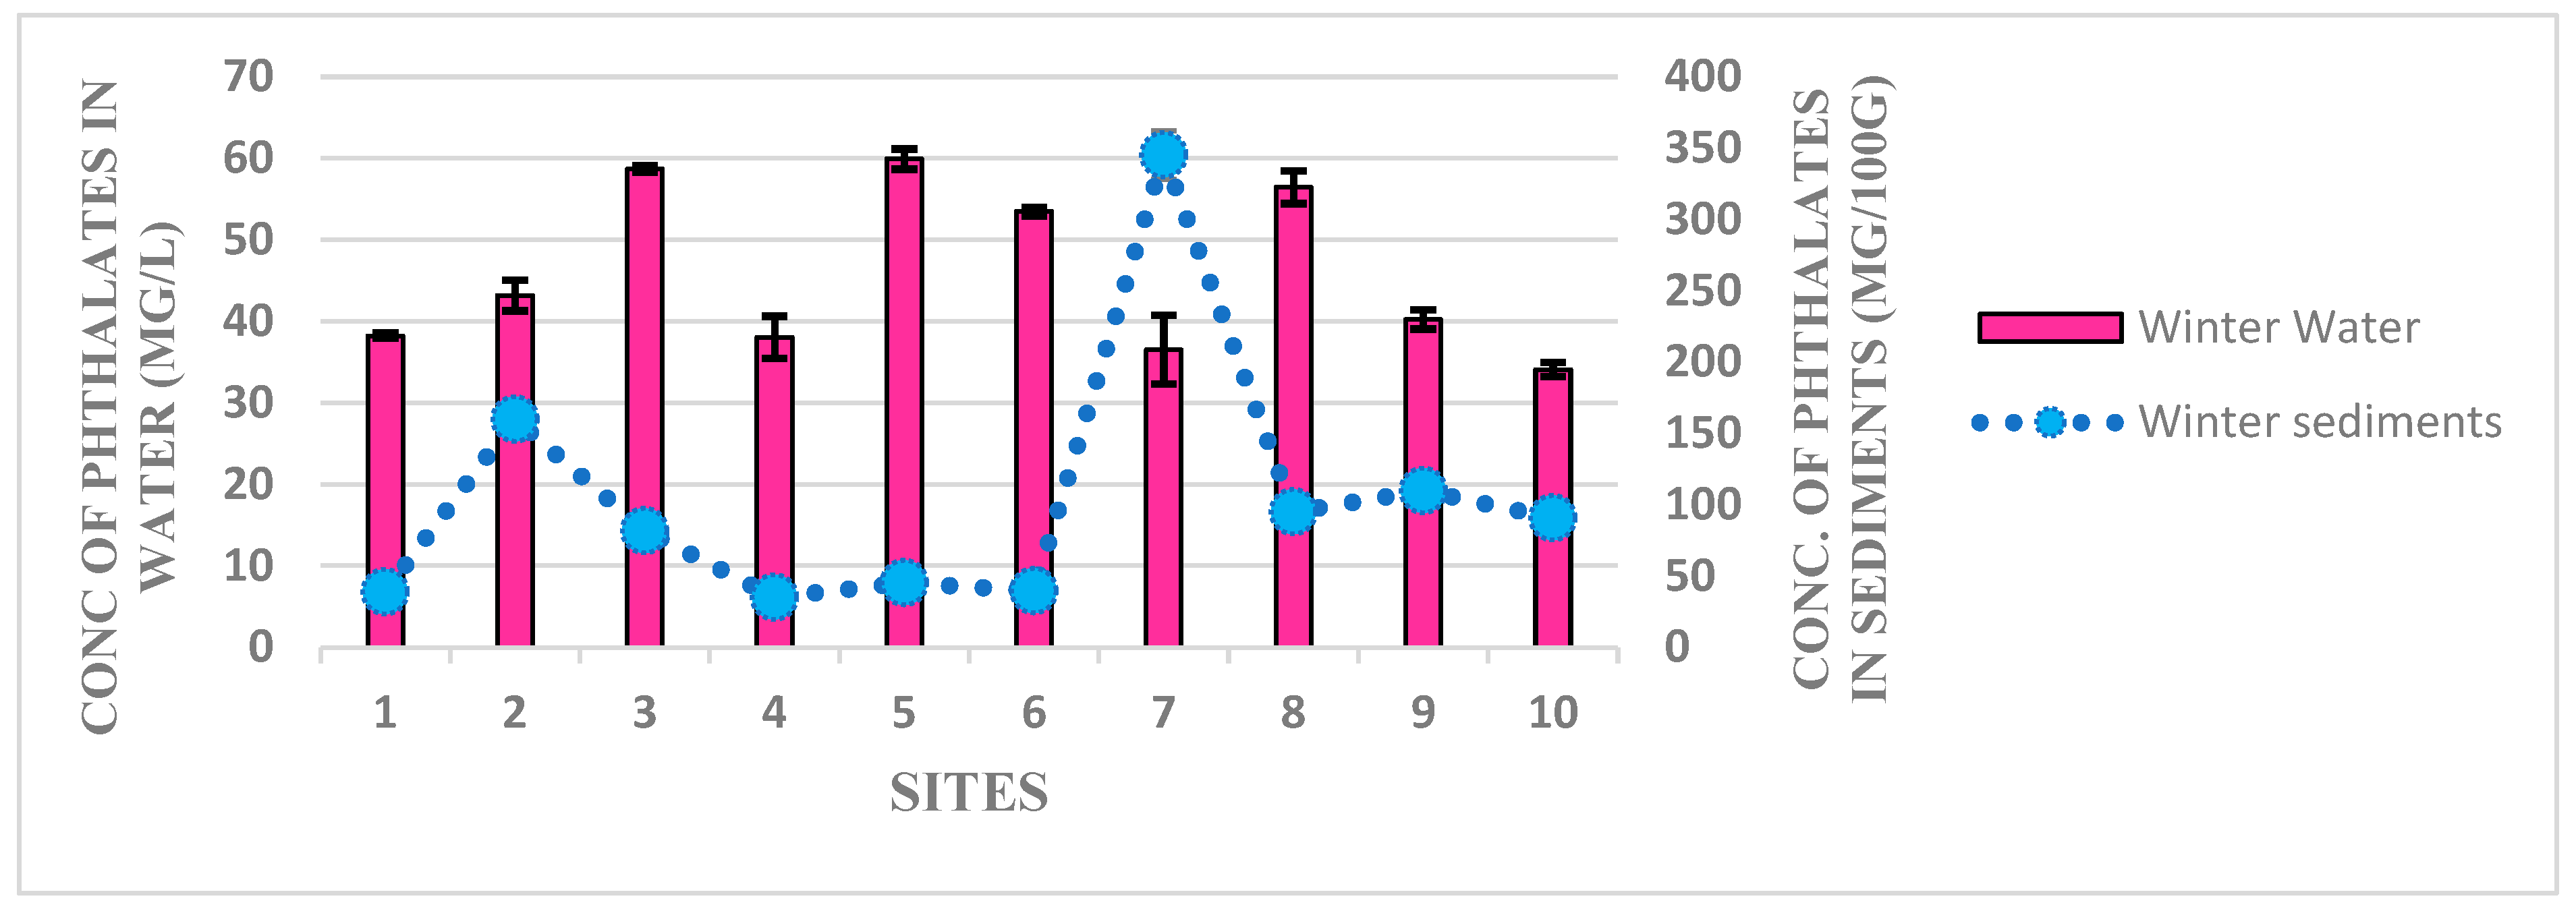
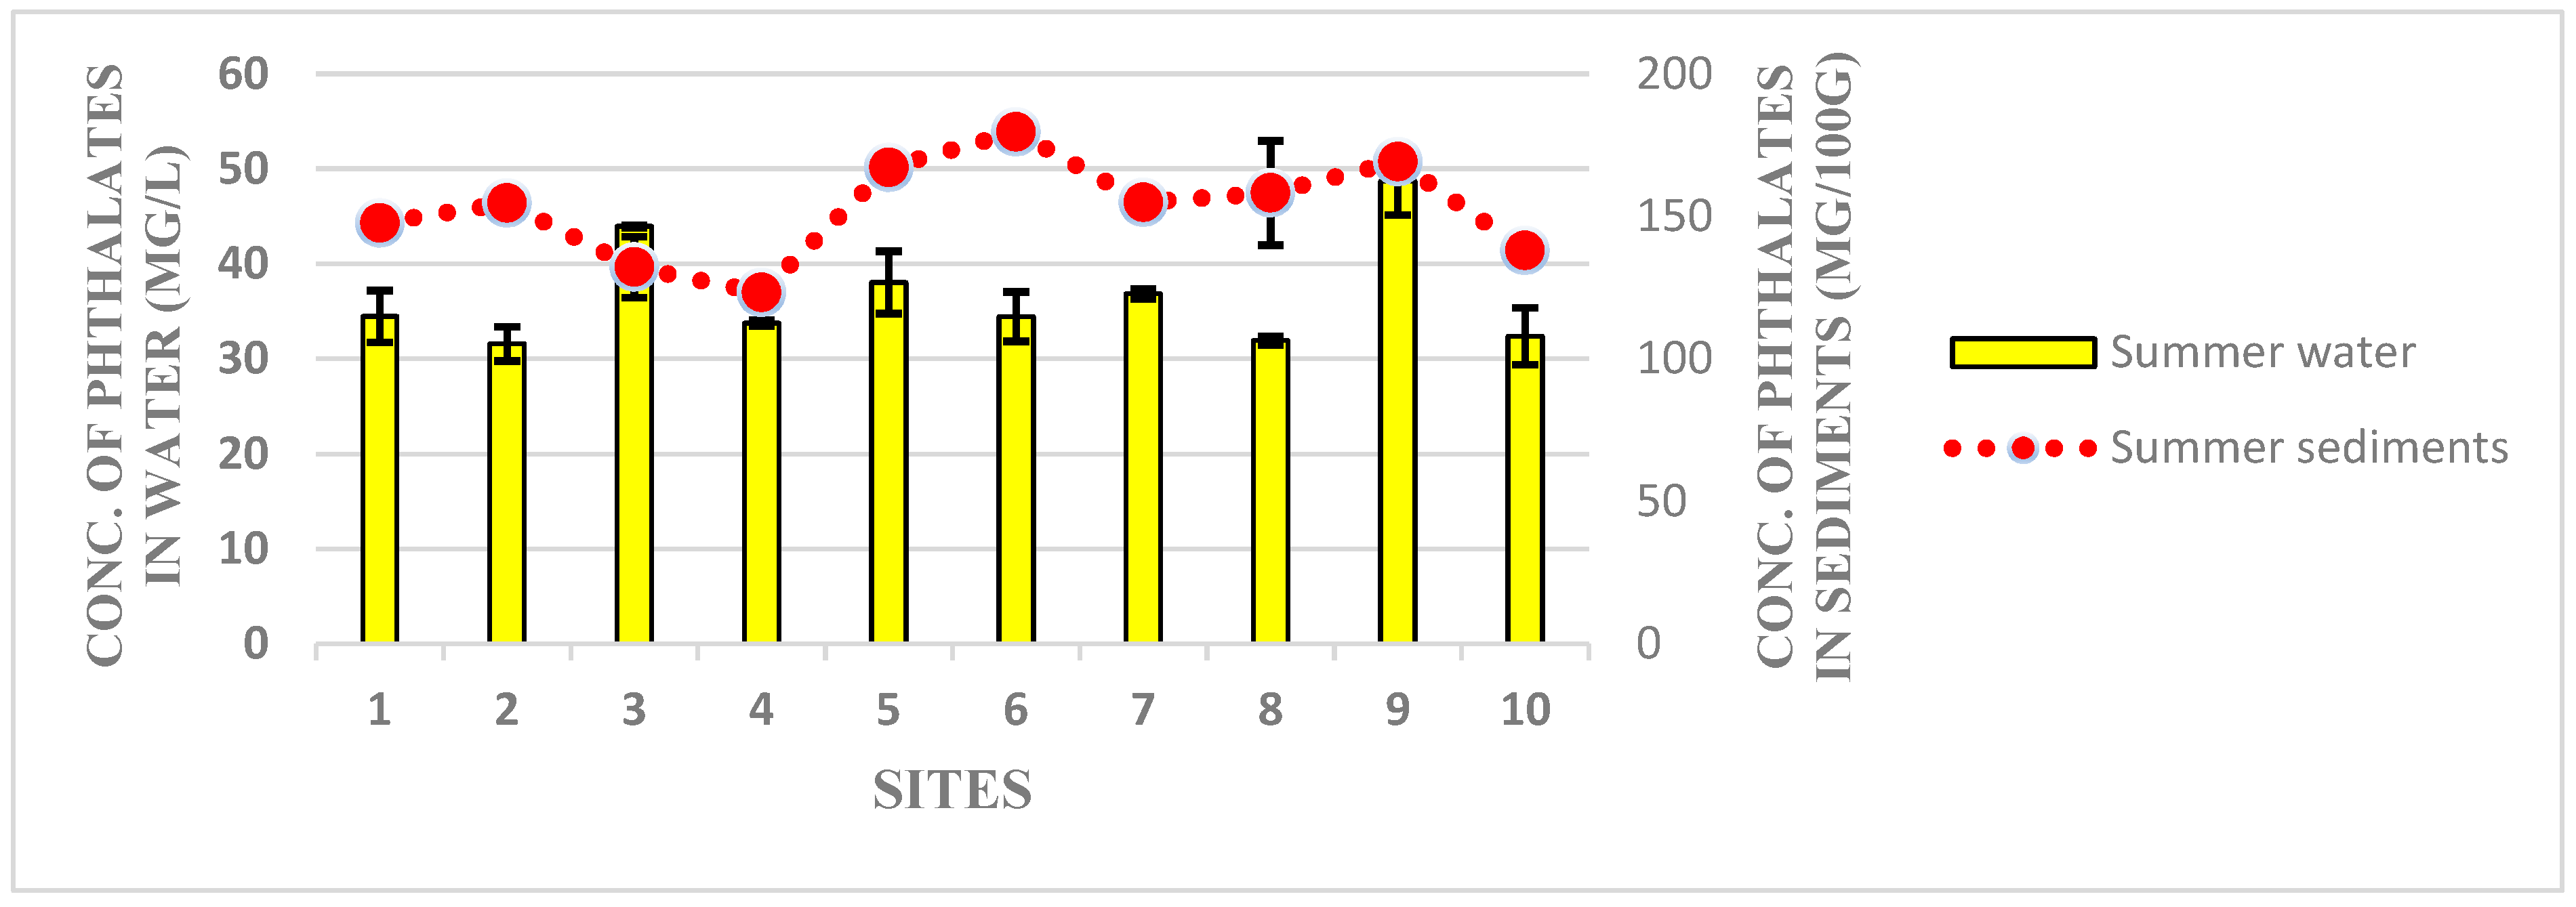
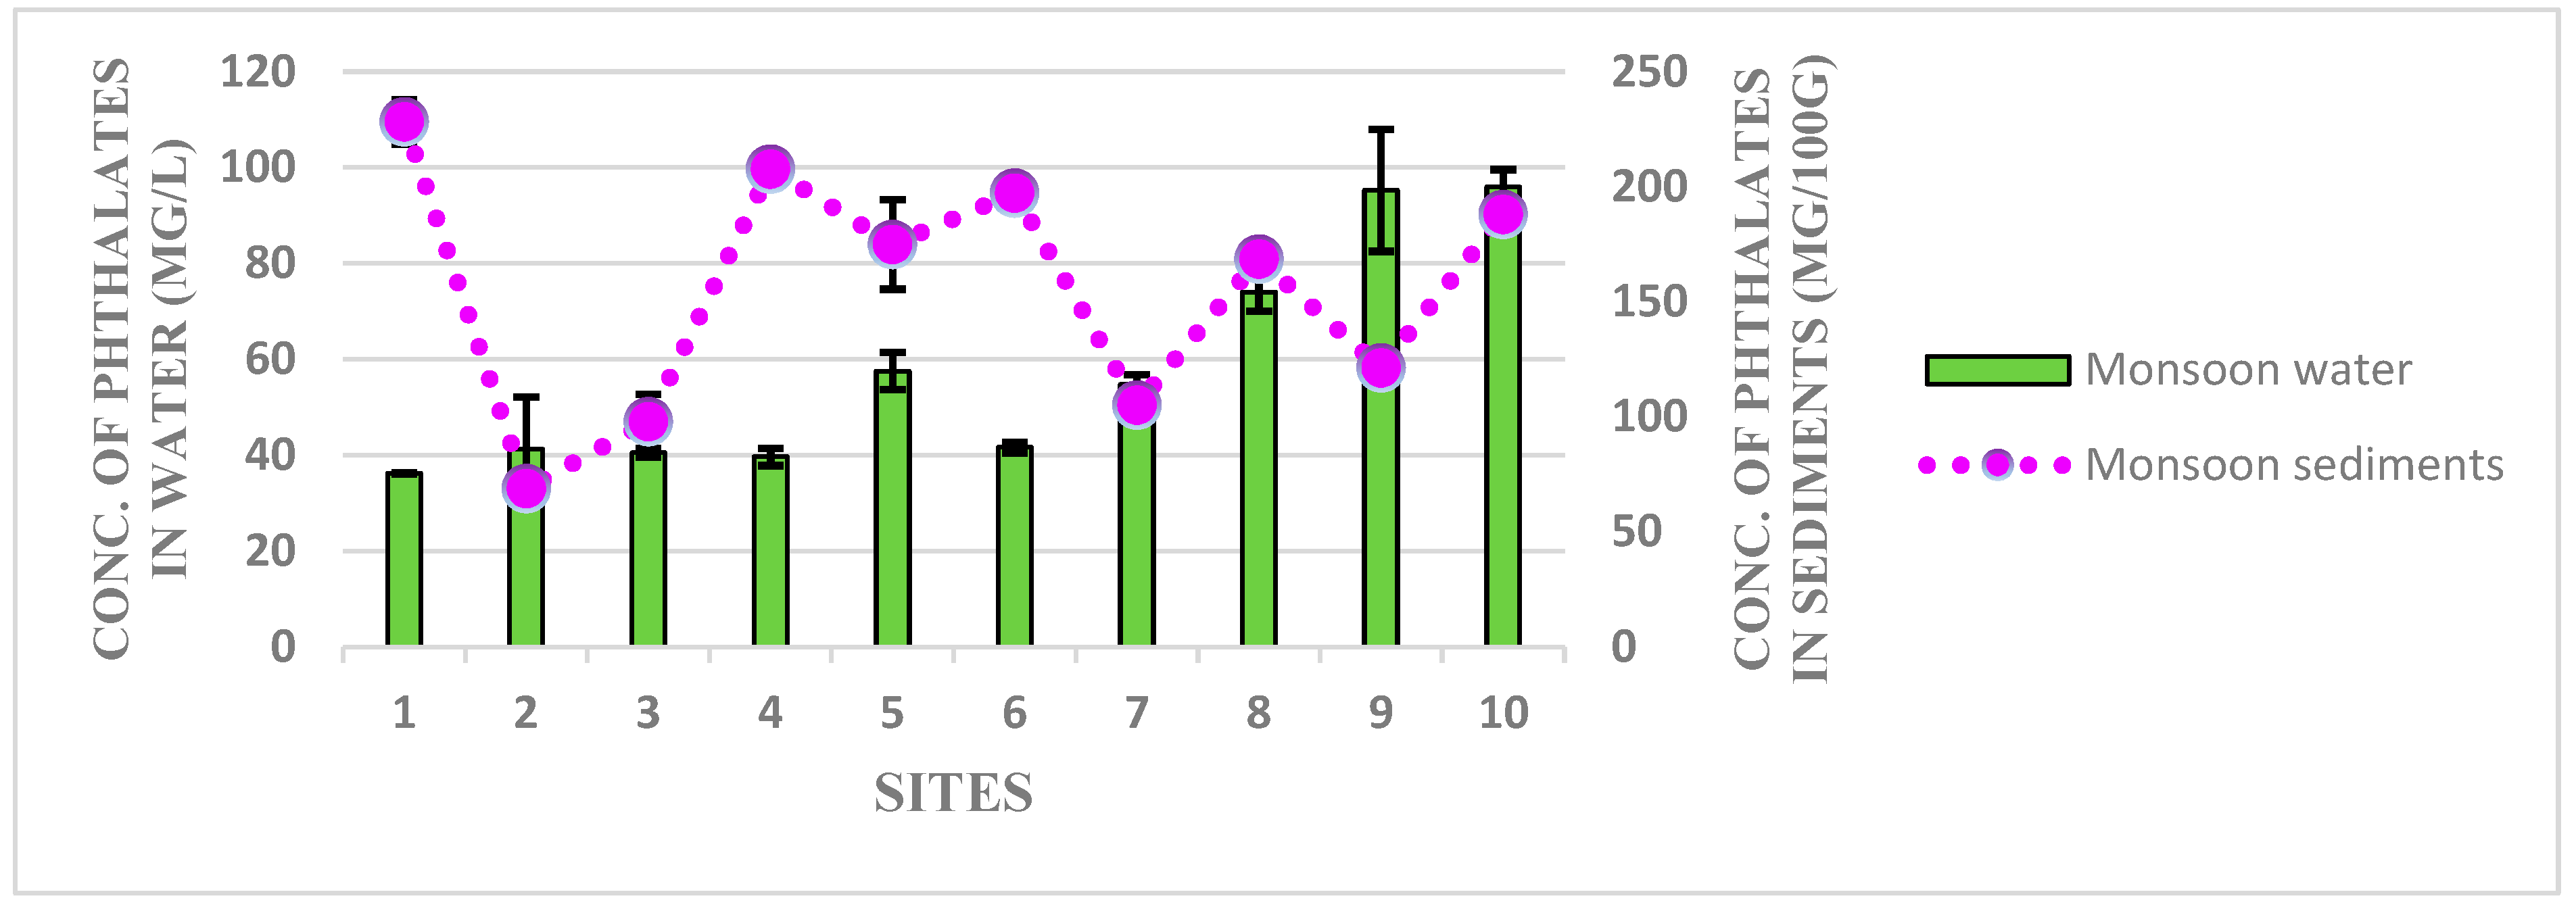
3.1. Detection of Phthalates Esters in Water and Sediment Samples of Harike Wetland

In the past few decades, contamination of plasticizers in different environments such as freshwater, drinking water, wastewater, etc. have been investigated and seeking high attention therefore, Harike wetland from Punjab, India was selected, and phthalates were measured for seasonal variation. The detected concentration of different phthalates (mean ± standard deviation) in water and sediments are given in Tables S2–S15. However, it is observed that seasonal variation between all seven phthalates showed a statistical significance at level p ≤ 0.001. The given results indicated that almost every selected phthalate was present in each site except DcHP was the least detected. The first sampling was done in the winter season, water samples indicate the most contaminated site was 8th followed by 3rd, 4th, and 5th. But in sediments highest detection of phthalates occurred in site 7th. During summer season sampling, the detection of phthalates maximum occurred in site 3rd followed by 8th, 1st, and 9th for water samples, and for sediments samples site 6th followed by 2nd, 8th, 5th, and 7th detected maximum phthalates concentration. In the monsoon season, maximum phthalate concentration was observed in sites 9th and 10th followed by 8th for water samples, and for sediments, site 6th followed by 7th, 5th and 1st were contaminated with phthalates. Among three seasons, the maximum concentration of DMP, DEP, DAP, DPP, BBP, DBP, and DcHP in water was observed in monsoon i.e., 4.498 ± 1.289 mg/L; 6.857 ± 0.883 mg/L; 22.386 ± 1.55 mg/L; 9.763 ± 1.059 mg/L; 26.758 ± 0.955 mg/L; 9.793 ± 0.009 mg/L and 23.973 ± 1.236 mg/L at sites 9th, 8th, 9th, 9th, 10th, 10th and 10th respectively. In sediments, the maximum concentration of DMP, DEP, DAP and DBP were observed in the summer season i.e., 17.29 ± 0.25 mg/100 g dw; 14.67 ± 1.79 mg/100 g dw; 82.874 ± 0.21 mg/100 g dw and 63.25 ± 0.13 mg/100 g dw, respectively. The concentration of DPP and BPP were maximum in the winter season i.e., 117.7 ± 11.09 mg/100 g dw; 83.08 ± 0.95 mg/100 g dw and DcHP was found to be maximum in the rainy season i.e., 40.22 ± 1.19 mg/100 g dw respectively. Overall phthalate concentration was also detected which depicts that in the winter season, the maximum concentration of phthalates was found in site 5th for water samples and site 7th for sediment samples. Similarly, for the summer season highest concentrations were found to be on site 9th and 6th for water and sediments respectively. In monsoon, season results analysed that the highest concentration of phthalates was detected at site 10th for water and site 1st for sediment samples. The concentration of phthalates measured in this study was compared with other freshwater bodies around the globe are shown in Table S16. The results predicted that the concentration of phthalates is extremely higher than the other reports of India. A study in the year 2002 briefly reported the ecological health status of wetlands in Punjab, he specifically stated that urbanization, agricultural activities, and industrial pollution possesses a high threat to the wetland [35]. Moreover, widespread of water hyacinth, fishing and poaching have been reported as other remarkable threats. The growth of water hyacinth weed indicates the mixing of sewage and industrial waste disposal to rivers, Sutlej and Beas. Indian River system has been deteriorating for almost five decades because of the discharge of polluted water into the natural aquatic ecosystems. The water environment of various countries has shown the overall pollution level of phthalates. Studies have shown that the pollution of PEs in Brazil and India is also possessing serious concern as these developing nations do not have any control or prevention rules on PEs usage. In Brazil, Paranoa Lake content of DEP was found to be 248.65 μg/L which is less than the present study and DBP content in the groundwater of India is as high as 207.78 μg/L [47]. According to the EU’s environmental quality standards, America, India, Korea, Iran, Spain, Israel, Kuwait, France, and the Netherlands have shown that the concentration of DEHP is exceeding 1.3 μg/L for aquatic environments [48]. Figure S2 illustrates the concentration of phthalates found all over the world which depicts that China detects the maximum amount of PEs [49]. According to a report, the concentration of DBP and DEHP in surface water and drinking water in China is more than the permissible standards which may lead to potentially causing high ecological risks to the aquatic ecosystems [50]. In India, the first-ever study on the freshwater ecosystem was conducted on the Kaveri River, India which outlines base data for the study of phthalates [1]. He stated that the occurrence of phthalates is ubiquitously in the water and sediments of the Kaveri River with high detections of DEHP, DEP, and DBP. Recent studies have shown the presence of phthalates in three rivers of southern India i.e., Kaveri, Vellar and Thamiraparani Rivers. The authors concluded that the amount of phthalates present in the Kaveri River showed 10 to 500 times higher concentration than in the previous study. Further, from previous contrast, he concluded that elevation in the concentration of DBP and DiBP indicates extensively high use of plasticizers [1,51].
The concentration of PEs in sediments analysed by comparing from the literature available all over the world (Table S17). Due to higher octanol-water partition coefficient the concentration of DcHP is higher. Several studies have established that the most prevalent PEs in sediments of freshwater bodies is DEHP and DBP [52]. However, in this study, the most predominant PEs in this freshwater body are DPP (117.7 ± 11.09 mg/100 g dw) followed by BBP (83.08 ± 0.8 mg/100 g dw) and DBP (63.23 ± 0.13 mg/100 g dw). Seasonal variations of PEs concentration and composition are shown in Figure 2, Figure 3 and Figure 4. The PEs concentrations were highest in the summer season and lowest in the winter season. Among, all the sites during winter maximum concentration of PEs were found in site 7th, summer season site 6th and monsoon season site 1st. Further, the results predicted that almost every phthalate was detected on each site during all the sampling. This reflects that phthalates are widely used in India for the manufacturing of various products, although PEs are strongly adsorbed in sediments due to higher Kow values [51,52]. A study in Asan Lake in Korea reported the presence of PEs in water, sediments, air, and fish out of which 14 PEs were detected. In sediments, the concentration of DEHP (2056 μg/kg dw) was predominant followed by DBP (73.6 μg/kg dw), because log Kow value of compounds detected in sediments is positively correlated indicating that the higher the Kow value, the more compounds were adsorbed to the sediment. While seasonal variations depicted that the concentration of PEs in the summer season was highest with a mean concentration 2356 ± 2450 μg/kg dw and the lowest concentration was reported in the spring season 1874 ± 2359 μg/kg dw. Furthermore, the study strongly suggests that DEHP is the most used phthalate in Korea [53]. A study on Anzali wetland, North Iran reported that the concentration of six major phthalates (DMP, DEP, DBP, BEHP, BBP and DnOP) ranged between 4.18 to 20.71 mg/kg dw [6]. On the northern border of Belgium and France, a study was conducted in which sediments of 15 rivers were taken, all were surrounded by industrial areas. Results showed that the concentration of six phthalates was in between 1090 to 11,890 μg/kg [14]. The distribution of seven phthalates (DMP, DEP, DBP, BBP, DAP, DCHP, DPP) was previously studied in freshwater bodies and sediments of different countries. The level of phthalates in lakes and rivers of China ranges from 0.006 µg/L to 23 µg/L. The data showed that the DMP, DEP and DBP have mostly detectable in freshwater bodies while BBP and DAP concentrations are least detectable. In rivers of China like Xi river, Pu river and Jiulong river DMP concentrations were found to be the highest that is 1.34–21.1 µg/L, 0.296–23 µg/L and 0.034 to 0.15 µg/L among all the other phthalate esters respectively [13,54]. DPP and DCHP are not detectable or not performed in the water bodies of many countries. In India, the concentration level of DCHP is detectable at 0.015 to 58.3 µg/L and 0.001 to 3.08 µg/L in Vellar and Thamiraparani rivers respectively [51]. Similarly, on the other hand, the concentration of phthalate esters in sediments has shown that DMP, DEP and DBP were highly detected. A high concentration level of DBP that is 0.21 to 15.63 mg/kg dw was detected in the Sembrong river sediment of Malaysia [55]. The concentration level of DAP, DCHP and DAP were least detected in most of the sediments. In the Indian river sediment, Thamiraparani the concentration level of DCHP was highest among all the other phthalates is 0.001–2.635 µg/kg dw [51].

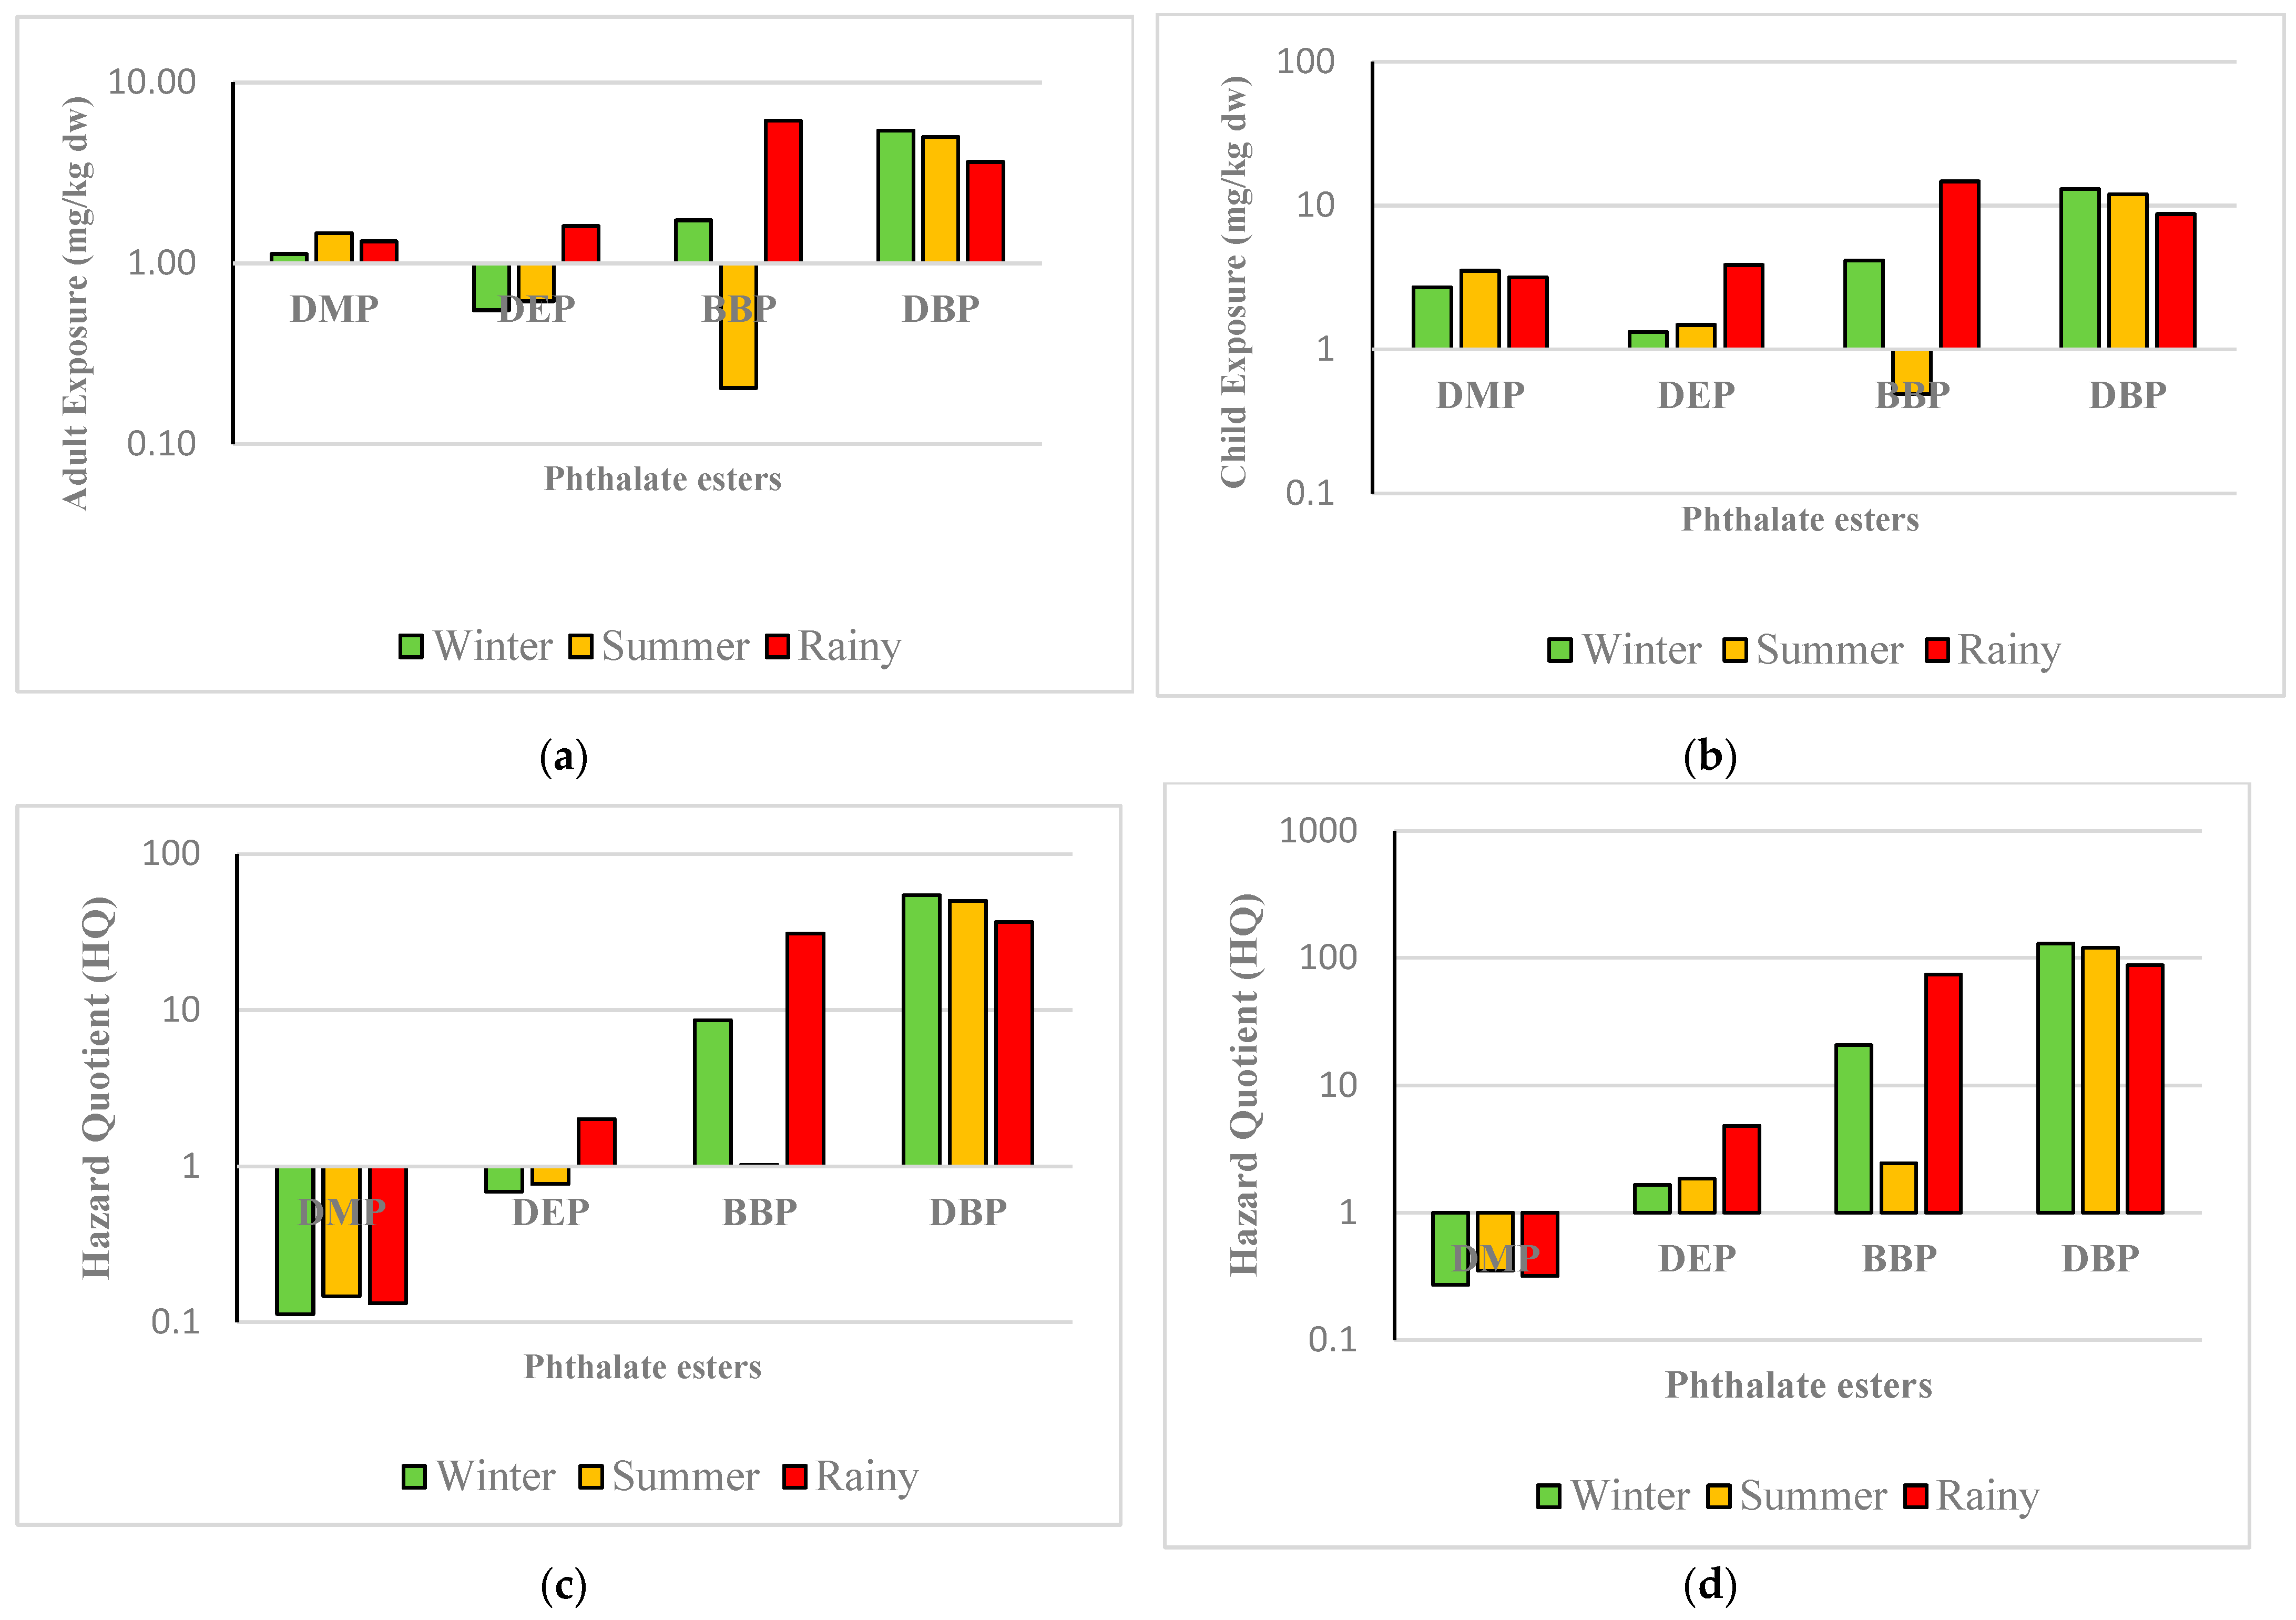
3.2. Human Heath Drinking Water Risk Assessment

In India, nearly 75% of sewage and wastewater are dumped straight into streams, where these rivers are utilized as a source of drinking water. It is crucial to understand the river’s water quality [56,57]. In India, there is typically limited research on the evaluation of the danger to human health posed by emerging contaminants (ECs) in rivers. Based on human exposure to the PEs and their residues in water, the drinking water risk assessment was evaluated. Exposure Index (adult and children) and hazard quotient for phthalates were reviewed for the first time in North India to determine the effects on human health. The maximum estimated exposure for humans was seen in BBP followed by DBP. The value detected for Exposure Index (adults and children) for BBP is 6.142 mg/kg bw/day and 14.742 mg/kg bw/day respectively (Figure 5a,b). The similarly calculated value for DBP in adults and children is 5.422 mg/kg bw/day and 13.013 mg/kg bw/day respectively, as shown in Table 2. Further, the health quotient (HQ) and health exposure below unity indicate no significant risk of phthalates from the consumption of Harike wetland water. As reported by various researchers that the water of Harike wetland is deteriorating very rapidly and is severely contaminated [58]. Generally, if a value of HQ > 1 signifies highly negative health effects can occur while consuming that water therefore, further monitoring and evaluation should be suggested. Under Safe Drinking Water Act according to USEPA (2012), the maximum contamination level (MCL) for DEHP is 0.006 mg/L but the concentration found in the Harike wetland water was 100 to 500 times more than the given permissible level (Table 3; Figure 5c,d) [36,59].

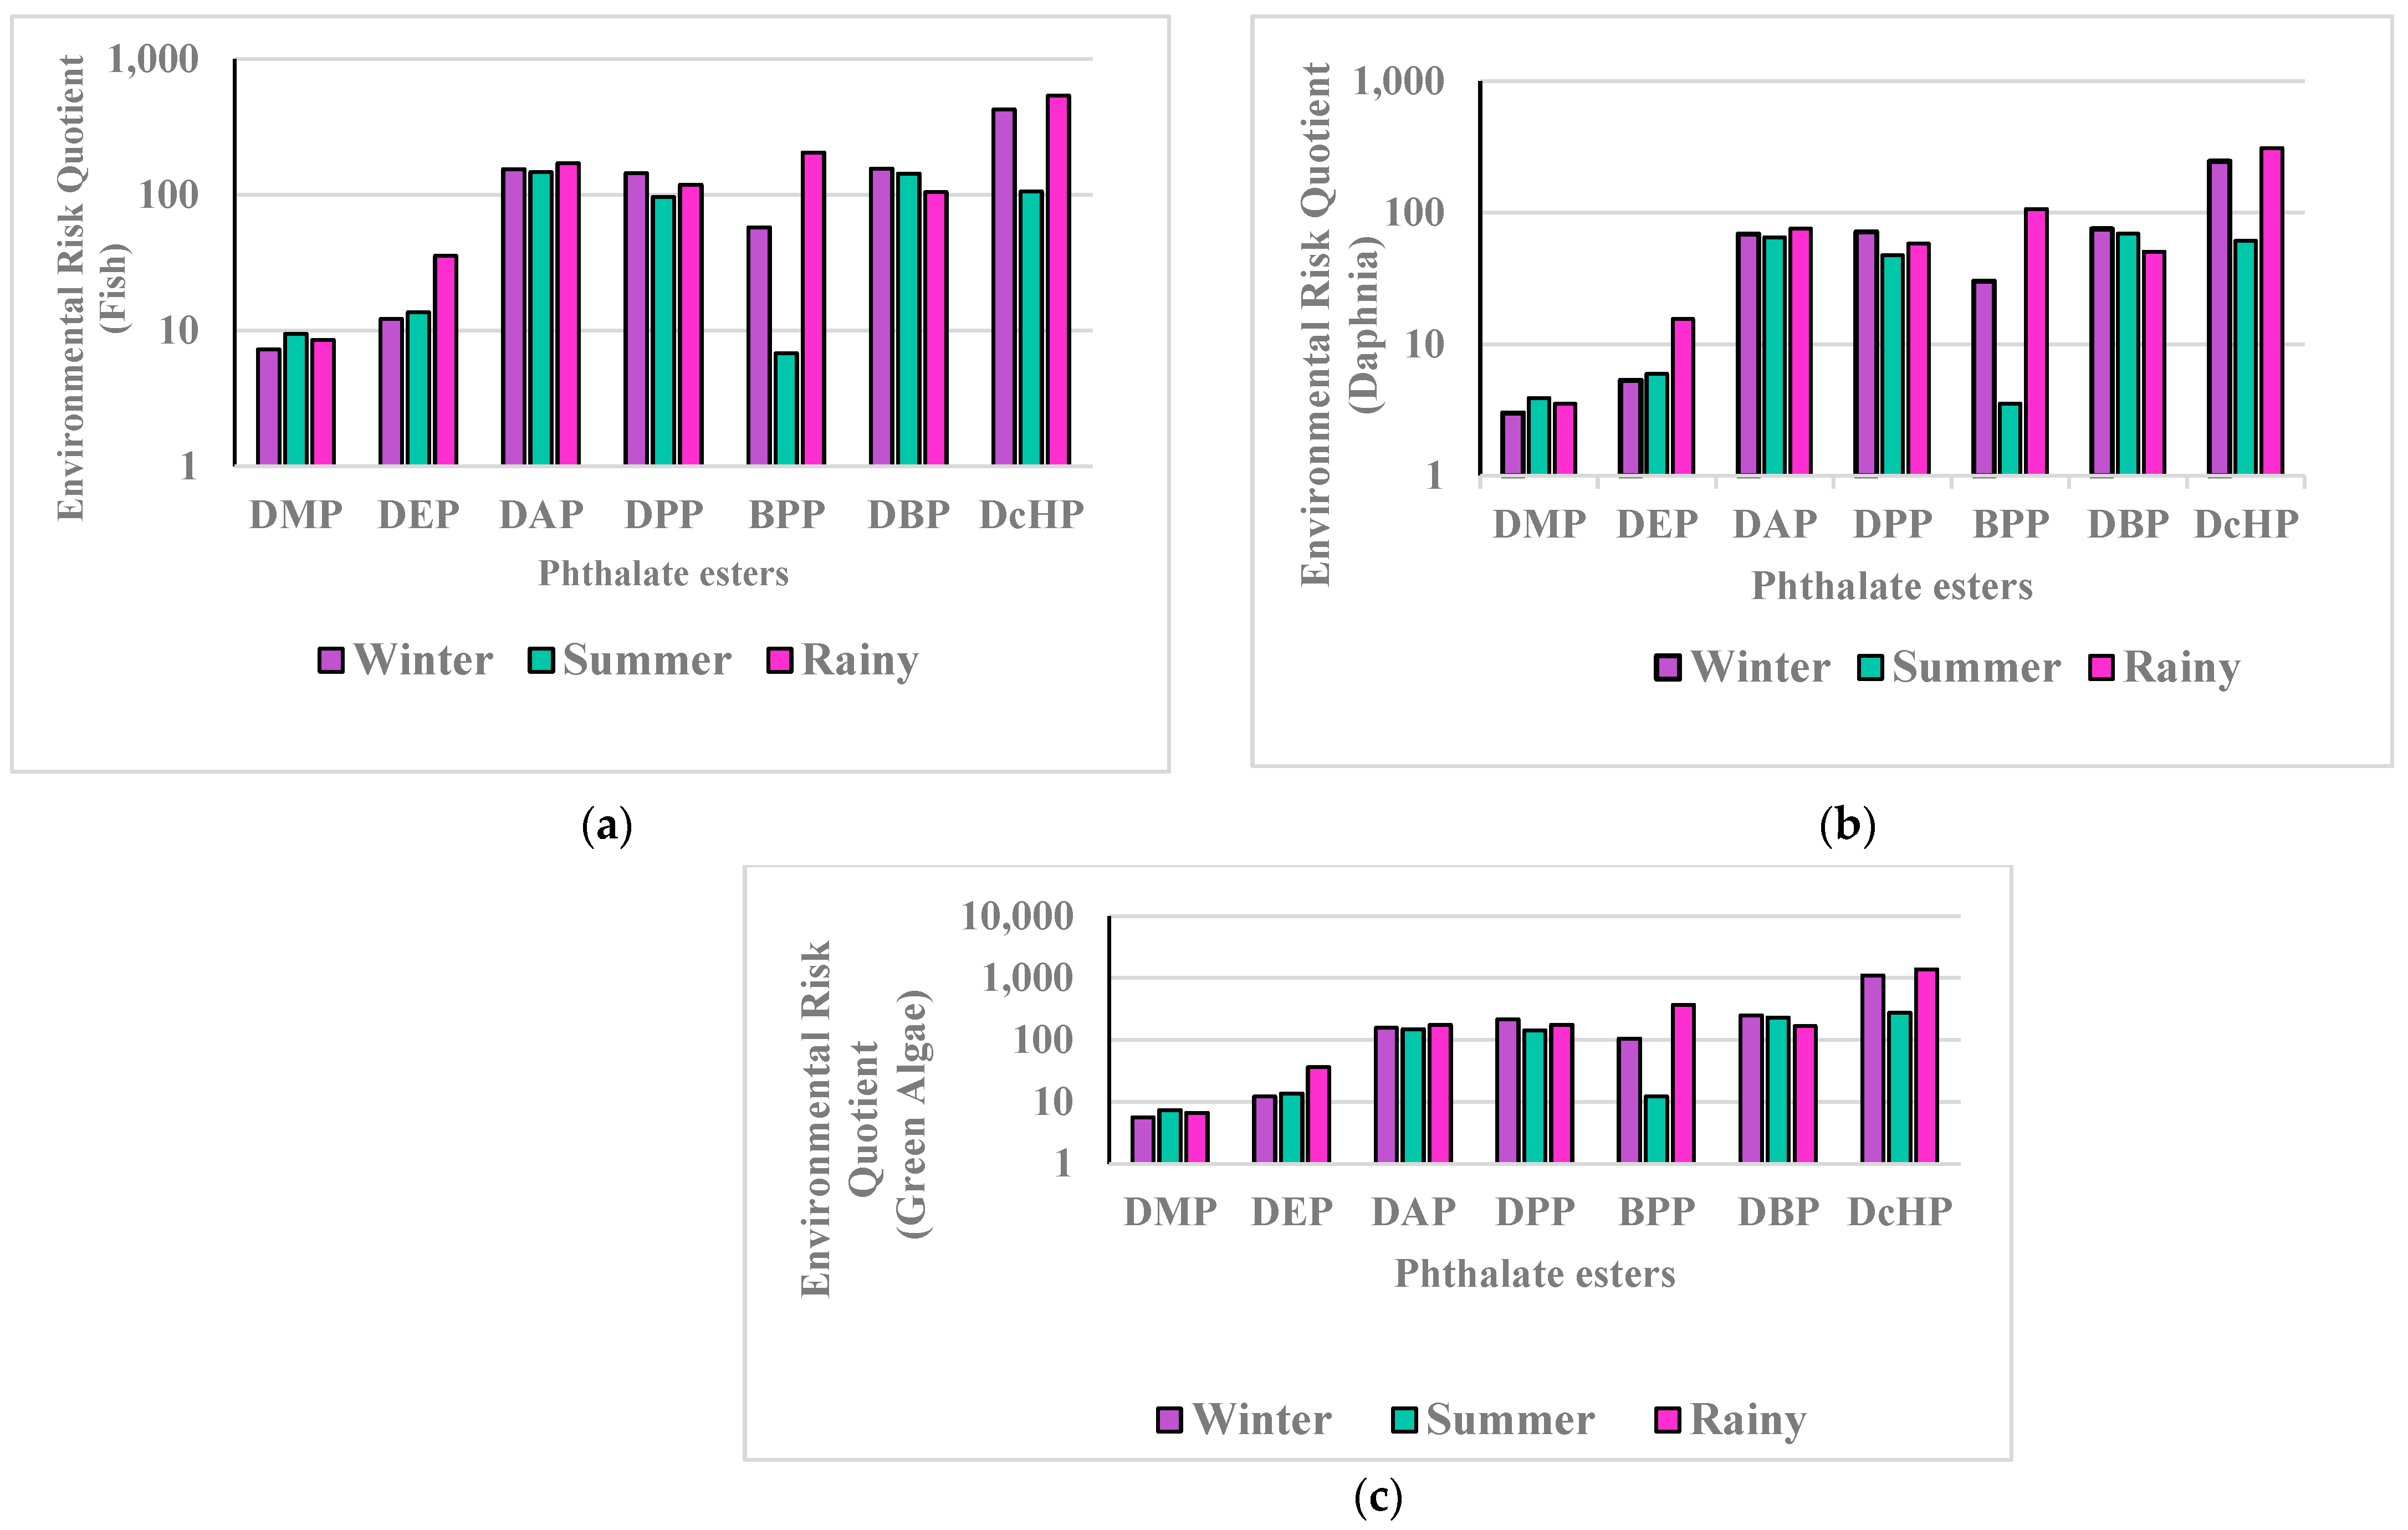
3.3. Environmental Risk Assessment

i.
Aquatic Risk Assessment
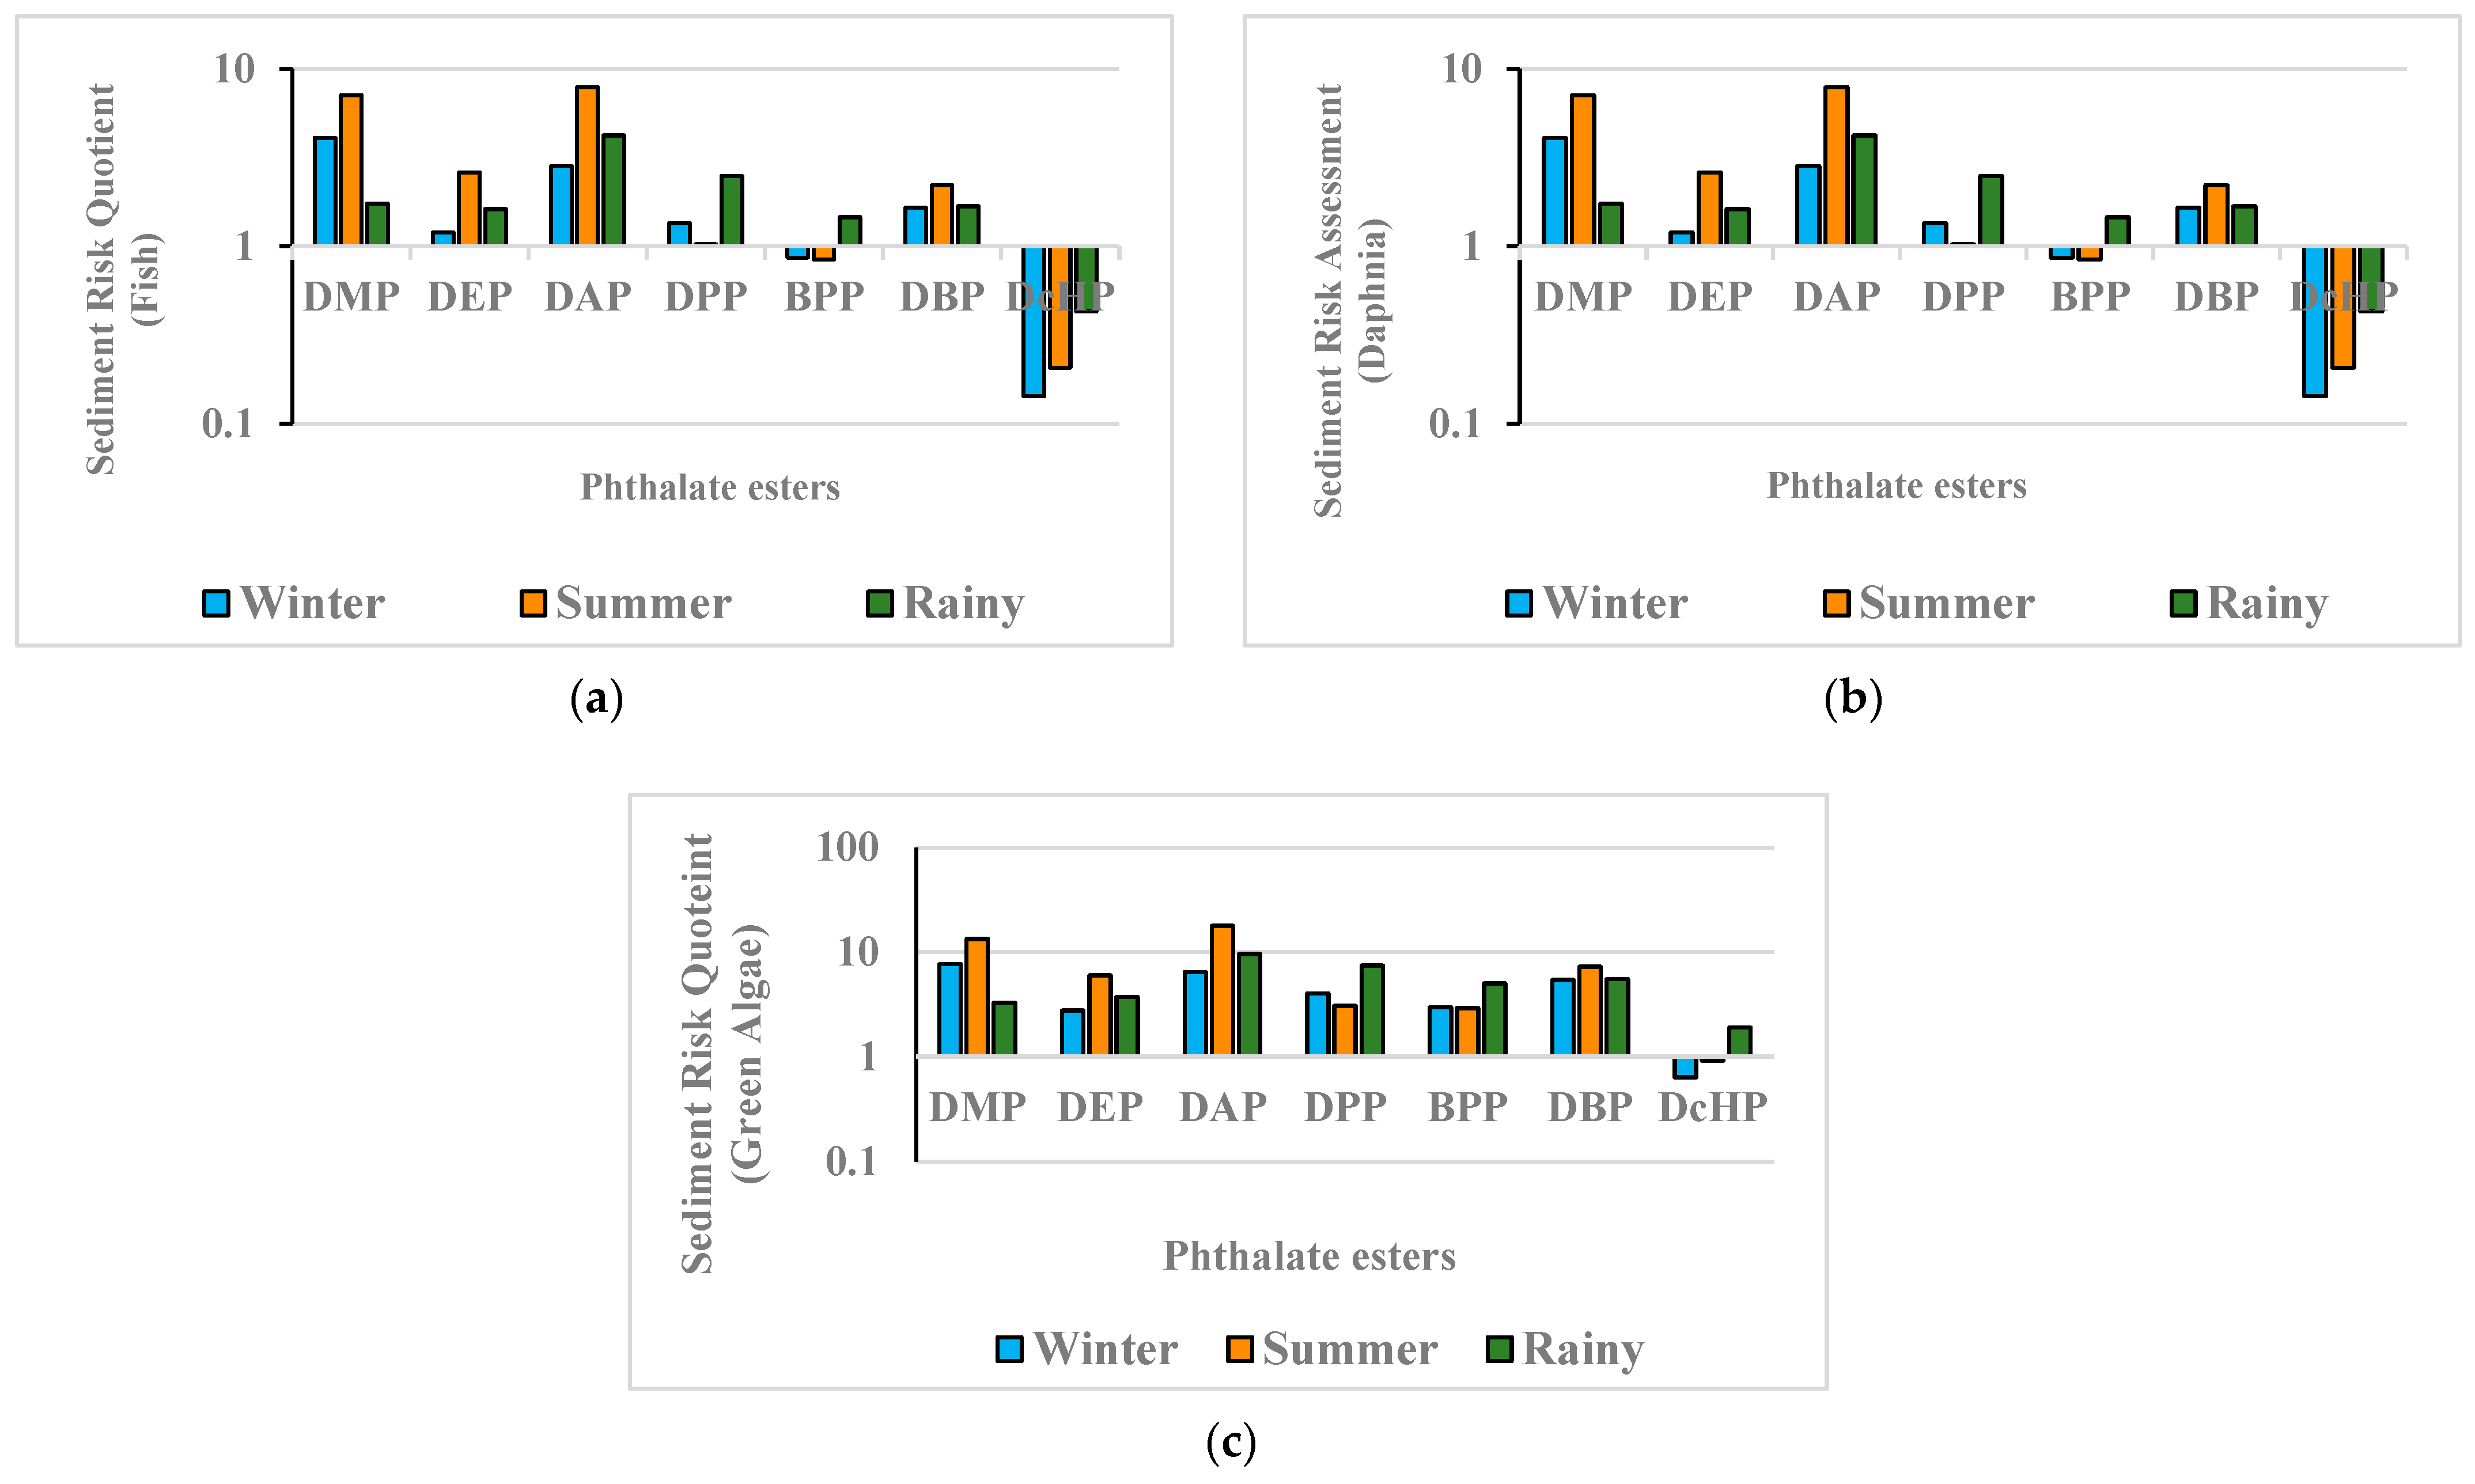
A wide variety of PEs from anthropogenic sources are present in aquatic ecosystems such as rivers, dams, lakes, and wetlands that are found in or pass through agricultural, industrial, residential, and urban environments. Most PEs entering the water environment have extremely low volatility due to their high octanol-water partition (Kow/logKow25) (1.61–9.46) and low vapor pressures (Pa25) (1.84–0.263), allowing them to easily migrate into various water bodies and enter aquatic organisms [60,61]. PEs come into direct contact with aquatic organisms when they enter the aquatic ecosystem. Aquatic organisms demonstrated a tendency to ingest PEs, thus leading to phthalates’ biomagnification at the different trophic levels of the aquatic ecosystem. Phthalates can interfere with aquatic organisms’ ability to reproduce, grow, and interfere with their genetic ability because they are bio-accumulative. Further, studies have reported that PEs are linked to endocrine-disrupting effects in diverse species of fish and mammals [62,63]. For this study, risk assessment is an important factor that analyzed the health conditions of inhabitant organisms of the freshwater ecosystems. The results depicted are given in following Table 4. Further, detected results reflect that the maximum risk quotient was found in the following order DcHP > BBP > DAP > DBP > DPP > DEP > DMP. However, RQ values for all the PEs were > 1 in the Harike wetland revealing that all detected phthalate esters are ubiquitously found in the water body and possesses a high threat to algae, crustaceans, and fish. The maximum RQ value detected for DMP was found in the summer season in all trophic levels. DEP, BBP and DcHP were found maximum during rainy seasons in all trophic levels as given in Figure 6a–c. RQ values detected for DAP, DBP and DPP showed maximum during the winter season in fishes, daphnia and green algae (Figure 6a–c).
ii.
Sediment Risk Assessment
The sediment risk assessment was performed by equilibrium partition method (EPM) for PNECsed calculation using EPA 1996; ECHA 2008; ECHA 2013 guidelines. The result of this study showed the following order DAP > DMP > DEP > DBP > DPP > BPP > DcHP for sediment risk assessment (Table 5). This predicted that these PEs have potential ecological risks to living creatures of the wetland habitat as shown in Figure 7a–c. As India is a developing country the estimated risk values are potentially higher than the limits suggested by U.S. Environmental Protection Agency (2013). Further, there is less environmental threat by PEs at present as compared to water, but there can be an increase in the concentration of plasticizers if the use of plastics in India leads to indiscriminate in the future and cause environmental problems. The RQs for PEs were>1 for fish species of Harike wetland. Hence, PEs is ubiquitous in our environments, and prolonged exposure to this pollutant can lead to feasible health effects in fishes, crustaceans, and other macro and micro fauna of freshwater ecosystems.

4. Discussion

The concentration of DMP, DEP, DBP, BBP, DPP, DAP, and DcHP observed in the study was higher (100–500 times) than the freshwater ecosystems reported all over the world. In France, a study was conducted on the Rhone River plume, where the detection of various phthalates (>615.1 ng/L) was reported which was very low compared to this study [64]. Moreover, DMP, DEP, DBP, and BBP quantified in the present study were about to have 99.9% greater magnitude than the rivers from all over the world i.e., Selangor River, Malaysia; Xi River, Pu River, Huai River from China; Chaohu and Shichachai lakes from China; Kaveri River, Sunderban wetland, Ganges River, Vellar River and Thamiraparani river from India given in Table S16. Further, the elevation in the concentration of DBP and DiBP in river water of India is because of the extensive use of plasticizers and high production volume chemicals like BPA. The measured value of DAP in the wetland was comparable with Yellow River and Shichachai lake, China which was not at all close to the detected value. The value of DcHP was observed in the Vellar and Thamiraparani rivers of India and was detected for the first time but in the present study, DcHP was also found which was very high than the compared literature [51]. A similar, trend was observed in sediment samples. The detected values showed a 99.9% higher concentration level of phthalate esters in samples of Harike wetland as compared to Sembrong River, Malaysia; Qiantang River sediments; Yellow River delta; and Qixinghe wetland of China; Vellar, Kaveri and Thamiraparani rivers of India. Although the water concentration represents the most recent source of phthalates, the sediment pattern shows how phthalates have accumulated and persisted over time. Studies have shown that the accumulation of phthalate esters in sediments in recent years has increased phthalate contamination in freshwater ecosystems [51]. Further, as reported by, Guo and his co-workers, metabolites of DEP (49%) and DEHP (32%) are mainly key contributors to phthalate exposure, further, they described that the Indian population is the second highest for phthalate exposure among several other countries except for China [65]. Further, studies have shown that 1 µM concentration of BBP and DBP is responsible for the induction of migration, invasion, proliferation, and tumor, while other studies revealed that in northern Mexico women patients were positively correlated with breast cancer [66,67]. Ecotoxicological reports that in India 100 μg/L concentration of DEHP and other phthalates can cause immense damage to the defense mechanism and haemocytes of a Macrobrachium rosenbergii (freshwater prawn) [68]. Moreover, the concentration of DEP and DBP higher than 50 μg/L, induces alteration immune-related gene in Zebrafish and cause oxidative stress and aberration in embryos of fish [69,70]. As stated by, European Commission, 2006 DEHP, DcHP, and DBP were identified as Category IB Chemicals that can cause reproductive toxicity, etc. Throughout the various countries, China has the highest pollution level of PEs in the water environment. As China is the world’s largest PEs producer and doesn’t have any prevention or control on pollution [49]. In China, Lake Xuanwu in Jiangsu Province has shown a total concentration of PEs exceeding 1000 μg/L, followed by Rivers in Shanxi Province and Hubei Province have also high concentrations of nearly 237.89 μg/L and 91.04 μg/L. Results showed particularly, DEHP and DBP are the main contributors in every water body in the concentration of PEs [71,72]. Severely increasing demand for PEs and their products would worsen the aquatic ecosystem with a high level of PEs pollution. Hence, it is essential to know the concentration of PEs in the aquatic environment and toxicological parameters for the accurate detection of the aquatic risk environment.

5. Conclusions

Phthalates were consistently detected in the Harike wetland in this study. Also, it was observed that phthalate esters were present in every environmental matrix from the Harike wetland, indicating their distribution. The most detected PEs in water were DBP, DMP, DEP, and DAP, whereas BBP was predominantly found in sediments. Moreover, the study reveals that the consumption of PEs contaminated water for various activities from household uses to irrigation applications could act as a potentially high risk for the locals. Additionally, sediment and aquatic risk analyses showed that PEs could be dangerous for specific aquatic organisms in the present ecosystem. Total phthalate concentration from site 10th (water) and site 7th (sediment) was found maximal. Although the government has created pertinent rules and regulations banning the discharge of home and industrial sewage, it has only partially succeeded in reducing the pollution caused by additives. However, numerous environmental media would still be affected by the plastic additives that are readily released from plastic items to environmental components (such as water, sediment and atmosphere, etc.). In addition, this study is providing baseline data for the government, which showed that these emerging pollutants merited scientific attention owing to their potential risks to ecosystems and human health.

Supplementary Materials

The following supporting information can be downloaded at: https://www.mdpi.com/article/10.3390/w15061009/s1, Figure S1: UHPLC chromatogram of phthalates standard showing DMP, DEP, DAP, DPP, BBP, DBP and DcHPtitle; Figure S2: World map showing maximum exposure concentration of PEs in rivers, lakes and seas in some countries (μg/L). Table S1: QA/QC parameters for phthalates extraction and analysis; Tables S2–S15: Phthalate ester (PEs) content in water and sediment collected samples; Tables S16 and S17: Concentration of phthalate esters (PEs) in water and sediment samples as reported in literatures.

Author Contributions

Conceptualization and Methodology were contributed by R.K. (Rajinder Kaur); experiment performing was contributed by G.C., A.J. and P.R.; writing—the original draft was contributed by G.C.; analysis of result—G.C., A.K., R.K. (Rajinder Kaur); writing—review, and editing was contributed by G.C., A.K., V.D.R., S.M., T.M., R.K. (Rajanbir Kaur) and R.K. (Rajinder Kaur). All authors have read and agreed to the published version of the manuscript.

Funding

This research received no external funding.

Data Availability Statement

The authors confirm that the data supporting the findings of this study are available within the article and its Supplementary Materials.

Acknowledgments

The authors would like to thank the Department of Botanical and Environmental Sciences and Centre of Emerging Life Sciences, Guru Nanak Dev University, Amritsar for providing the necessary facilities. We also like to acknowledge UGC, New Delhi for the instrumentation facility provided under UGC-DRS V (Grant No. F4-13/2015/DRS-II (SAP-II)), DST-PURSE, CPEPA, RUSA 2.0 scheme. Further, the authors are grateful to the Department of Forests and Wildlife Preservation, the Government of Punjab and the Department of Harike Wildlife Sanctuary.

Conflicts of Interest

All authors agree to publish this manuscript. There is no conflict of interest.

References

  1. Selvaraj, K.K.; Sundaramoorthy, G.; Ravichandran, P.K.; Girijan, G.K.; Sampath, S.; Ramaswamy, B.R. Phthalate esters in water and sediments of the Kaveri River, India: Environmental levels and ecotoxicological evaluations. Environ. Geochem. Health 2015, 37, 83–96. [Google Scholar] [CrossRef] [PubMed]
  2. Chakraborty, P.; Shappell, N.W.; Mukhopadhyay, M.; Onanong, S.; Rex, K.R.; Snow, D. Surveillance of plasticizers, bisphenol A, steroids and caffeine in surface water of River Ganga and Sundarban wetland along the Bay of Bengal: Occurrence, sources, estrogenicity screening and ecotoxicological risk assessment. Water Res. 2021, 190, 116668. [Google Scholar] [CrossRef]
  3. Ogunwole, G.A.; Saliu, J.K.; Osuala, F.I. Seasonal Occurrences and Risk Assessment of Phthalate Esters in Sediment, Water and Biota of Two Sub-Saharan Rivers. Bull. Environ. Contam. Toxicol. 2021, 106, 832–838. [Google Scholar] [CrossRef] [PubMed]
  4. Meng, X.Z.; Wang, Y.; Xiang, N.; Chen, L.; Liu, Z.G.; Wu, B. Flow of sewage sludge-borne phthalate esters (PAEs) from human release to human intake: Implication for risk assessment of sludge applied to soil. Sci. Total Environ. 2014, 476, 242–249. [Google Scholar] [CrossRef]
  5. Net, S.; Delmont, A.; Sempéré, R.; Paluselli, A.; Baghdad, O. Occurrence, fate, behavior and ecotoxicological state of phthalates in different environmental matrices. Environ. Sci. Technol. 2015, 49, 4019–4035. [Google Scholar] [CrossRef] [PubMed]
  6. Shariati, S.; Pourbabaee, A.A.; Alikhani, H.A.; Rezaei, K.A. Assessment of phthalic acid esters pollution in Anzali wetland, north of Iran. Int. J. Environ. Sci. Technol. 2019, 16, 7025–7036. [Google Scholar] [CrossRef]
  7. National Institutes of Health. National Library of Medicine. Tox Town, Phthalates. 2006. Available online: https://www.ncbi.nlm.nih.gov/pmc/articles/PMC1480516/ (accessed on 2 February 2006).
  8. Ternes, T.A.; Meisenheimer, M.; Mcdowell, D.; Brauch, H.J.; Brigitte, H.G.; Preuss, G.; William, U.; Zulei-Seibert, N. Removal of Pharmaceuticals during Drinking Water Treatment. Environ. Sci. Technol. 2002, 36, 3855–3863. [Google Scholar] [CrossRef]
  9. Mondal, S.; Mukherjee, S. Long-term dietary administration of diethyl phthalate triggers loss of insulin sensitivity in two key insulin target tissues of mice. Hum. Exp. Toxicol. 2020, 39, 984–993. [Google Scholar] [CrossRef]
  10. Xu, S.; Zhang, H.; Pao, P.C.; Lee, A.; Wang, J.; Chan, Y.S.; Chen, X. Exposure to phthalates impaired neurodevelopment through estrogenic effects and induced DNA damage in neurons. Aquat. Toxicol. 2020, 222, 105469. [Google Scholar] [CrossRef]
  11. Li, J.; Wang, Z.; Wang, Q.; Guo, L.; Wang, C.; Wang, Z. Construction of Hypercrosslinked Polymers for High-Performance Solid Phase Microextraction of Phthalate Esters from Water Samples. J. Chromatogr. 2021, 1641, 461972. [Google Scholar] [CrossRef]
  12. Gao, X.; Li, J.; Wang, X.; Zhou, J.; Fan, B.; Li, W.; Liu, Z. Exposure and ecological risk of phthalate esters in the Taihu Lake basin, China. Ecotoxicol. Environ. Safe 2019, 171, 564–570. [Google Scholar] [CrossRef]
  13. Li, R.; Liang, J.; Duan, H.; Gong, Z. Spatial distribution and seasonal variation of phthalate esters in the Jiulong River estuary, Southeast China. Mar. Pollut. Bull. 2017, 122, 38–46. [Google Scholar] [CrossRef] [PubMed]
  14. Net, S.; Rabodonirina, S.; Sghaier, R.B.; Dumoulin, D.; Chbib, C.; Tlili, I.; Ouddane, B. Distribution of phthalates, pesticides and drug residues in the dissolved, particulate and sedimentary phases from transboundary rivers (France–Belgium). Sci. Total Environ. 2015, 521–522, 152–159. [Google Scholar] [CrossRef]
  15. Petrovic, M.; Eljarrat, E.; Lopez de Alda, M.J.; Barcelo, D. Analysis and environmental levels of endocrinedisrupting compounds in freshwater sediments. Trends Analyt. Chem. 2001, 20, 637–648. [Google Scholar] [CrossRef]
  16. Oehlmann, J.; Schulte-Oehlmann, U.; Kloas, W.; Jagnytsch, O.; Lutz, I.; Kusk, K.O. A critical analysis of the biological impacts of plasticizers on wildlife. Philos. Trans. R. Soc. Lond. B Biol. Sci. 2009, 364, 2047–2062. [Google Scholar] [CrossRef] [Green Version]
  17. Chikae, M.; Ikeda, R.; Hatano, Y.; Hasan, Q.; Morita, Y.; Tamiya, E. Effects of bis (2-ethylhexyl) phthalate, γ-hexachlorocyclohexane, and 17β-estradiol on the fry stage of medaka (Oryzias latipes). Environ. Toxicol. Pharmacol. 2004, 18, 9–12. [Google Scholar] [CrossRef]
  18. Latif, M.; Faheem, M. Study of Oxidative Stress and Histo-Biochemical Biomarkers of Diethyl Phthalate Induced Toxicity in a Cultureable Fish, Labeo rohita. Pak. Vet. J. 2020, 40, 2. [Google Scholar] [CrossRef]
  19. Bisai, K.; Pati, M.K.; Behera, B.K. Hazards of phthalate exposure on fish reproduction—A review. South Asian J. Exp. Biol. 2022, 12, 184–191. [Google Scholar] [CrossRef]
  20. Poopal, R.K.; Zhang, J.; Zhao, R.; Ramesh, M.; Ren, Z. Biochemical and behavior effects induced by diheptyl phthalate (DHpP) and Diisodecyl phthalate (DIDP) exposed to zebrafish. Chemosphere 2020, 252, 126498. [Google Scholar] [CrossRef]
  21. Moon, H.B.; Yoon, S.P.; Jung, R.H.; Choi, M. Wastewater treatment plants (WWTPs) as a source of sediment contamination by toxic organic pollutants and fecal sterols in a semi-enclosed bay in Korea. Chemosphere 2008, 73, 880–889. [Google Scholar] [CrossRef] [PubMed]
  22. Chen, C.F.; Chen, C.W.; Ju, Y.R.; Dong, C.D. Determination and assessment of phthalate esters content in sediments from Kaohsiung Harbor, Taiwan. Mar. Pollut. Bull. 2017, 124, 767–774. [Google Scholar] [CrossRef] [PubMed]
  23. Colon, I.; Caro, D.; Bourdony, C.J.; Rosario, O. Identification of phthalate esters in the serum of young Puerto Rican girls with premature breast development. Environ. Health Perspect. 2000, 108, 895–900. [Google Scholar] [CrossRef] [Green Version]
  24. Casals-Casas, C.; Desvergne, B. Endocrine Disruptors: From Endocrine to Metabolic Disruption. Annu. Rev. Physiol. 2011, 73, 135–162. [Google Scholar] [CrossRef] [Green Version]
  25. Kruger, T.; Long, M.; Bonefeld-Jørgensen, E.C. Plastic components affect the activation of the aryl hydrocarbon and the androgen receptor. Toxicology 2008, 246, 112–123. [Google Scholar] [CrossRef]
  26. Gao, C.J.; Kannan, K. Phthalates, bisphenols, parabens, and triclocarban in feminine hygiene products from the United States and their implications for human exposure. Environ. Int. 2020, 136, 105465. [Google Scholar] [CrossRef]
  27. Johnson, S.; Saikia, N.; Sahu, R. Phthalates in toys available in Indian market. Bull. Environ. Contam. Toxicol. 2011, 86, 621–626. [Google Scholar] [CrossRef]
  28. DGOS. Final Findings of PAN Review. Directorate General of Safeguards, Customs and Central Excise, Government of India. 2013. Available online: http://www.dgsafeguards.gov.in/newversion/Final%20findings%20of%20pan%20review.pdf (accessed on 20 December 2013).
  29. Singh, S.; Bhardwaj, A.; Verma, V.K. Remote sensing and GIS based analysis of temporal land use/land cover and water quality changes in Harike wetland ecosystem, Punjab, Insdia. J. Environ. Manag. 2020, 262, 110355. [Google Scholar] [CrossRef] [PubMed]
  30. Brraich, O.S.; Jangu, S. Evaluation of water quality pollution indices for heavy metal contamination monitoring in the water of Harike Wetland (Ramsar Site), India. Int. J. Sci. Res. 2015, 5, 1–6. [Google Scholar]
  31. Sarkar, A.; Jain, S.K. Using Remote Sensing data to study wetland dynamics–A case study of Harike Wetland. In Proceedings of the Taal2007: The 12th World Lake Conference, Kusatsu, Japan, 28 October–2 November 2007; Volume 680, p. 684. [Google Scholar]
  32. Tiwana, N.S.; Jerath, N.; Saxena, S.K.; Sharma, V. 69-Conservation and Management of Wetlands in Punjab-Challenges & Opportunities. In Proceedings of the National Seminar on Conservation and Restoration of Lakes (CAROL-08), Nagpur, India, 16–17 October 2008. [Google Scholar]
  33. Kaur, J.; Chaudhary, A.; Kaur, R.; Arora, S. Assessment of mutagenic, genotoxic, and cytotoxic potential of water samples of Harike wetland: A Ramsar site in India using different ex vivo biological systems. Ecotoxicology 2014, 23, 967–977. [Google Scholar] [CrossRef]
  34. Kaur, H.; Datta, S.N.; Hassan, S.S.; Bedi, J.S.; Ajeet, S. Assessment of heavy metal concentration in water, sediment and fish flesh at Harike wetland-a Ramsar site, India. J. Exp. Zool. India 2019, 22, 375–381. [Google Scholar]
  35. Ladhar, S.S. Status of ecological health of wetlands in Punjab, India. Aquat. Ecosyst. Health Manag. 2002, 5, 457–465. [Google Scholar] [CrossRef]
  36. Wu, B.; Zhang, Y.; Zhang, X.; Cheng, S. Health risk from exposure of organic pollutants through drinking water consumption in Nanjing, China. Bull. Environ. Contam. Toxicol. 2010, 84, 46–50. [Google Scholar] [CrossRef] [PubMed]
  37. Kaur, R.; Kumari, A.; Sharma, G.; Singh, D.; Kaur, R. Biodegradation of endocrine disrupting chemicals benzyl butyl phthalate and dimethyl phthalate by Bacillus marisflavi RR014. J. Appl. Microbiol. 2021, 131, 1274–1288. [Google Scholar] [CrossRef] [PubMed]
  38. Kumari, A.; Arora, S.; Kaur, R. Comparative cytotoxic and genotoxic potential of benzyl-butyl phthalate and di-n-butyl phthalate using Allium cepa assay. Energy Ecol. Environ. 2021, 6, 244–257. [Google Scholar] [CrossRef]
  39. USEPA. Risk Assessment Guidance for Superfund Volume I Human Health Evaluation Manual (Part A). EPA/540/1-89/ 002. Office of Emergency and Remedial Response; U.S. Environmental Protection Agency: Washington, DC, USA, 1989. Available online: http://www.epa.gov/oswer/riskassessment/ragsa/pdf/rags-vol1-pta_complete.pdf (accessed on 20 December 2013).
  40. Selvaraj, K.K.; Murugasamy, M.; Nikhil, N.P.; Elaiyaraja, A.; Sampath, S.; Krishnamoorthi, V.; Ramaswamy, B.R. Investigation of distribution, sources and flux of perfluorinated compounds in major southern Indian rivers and their risk assessment. Chemosphere 2021, 277, 130228. [Google Scholar] [CrossRef]
  41. United States. Hazardous Site Control Division, United States. Environmental Protection Agency. Office of Solid Waste & Emergency Response. Soil Screening Guidance: User’s Guide. United States, Environmental Protection Agency, Office of Solid Waste and Emergency Response. Available online: https://archive.epa.gov/region9/superfund/web/pdf/ssg_nonrad_technical-2.pdf (accessed on May 1996).
  42. USEPA. Freshwater and Marine Sediment Screening Benchmark Values. 2006. Available online: http://www.epa.gov/reg3hwmd/risk/eco/index.htm (accessed on 20 December 2013).
  43. ECHA. Guidance on Information Requirements and Chemical Safety Assessment—Chapter R.10: Characterisation of Dose [Concentration]-Response for Environment; European Chemicals Agency: Helsinki, Finland, 2008. Available online: http://echa.europa.eu/documents/10162/13632/information_requirements_r10_en.pdf (accessed on May 2008).
  44. USEPA. Ecological Structure Activity Relationships (ECOSAR) Class Program, Version 1.11. 2011. Available online: http://www.epa.gov/oppt/newchems/tools/21ecosar.htm (accessed on 12 September 2013).
  45. Ramaswamy, B.R.; Shanmugam, G.; Velu, G.; Rengarajan, B.; Larsson, D.G. GC–MS analysis and ecotoxicological risk assessment of triclosan, carbamazepine and parabens in Indian rivers. J. Hazard. Mater. 2011, 186, 1586–1593. [Google Scholar] [CrossRef] [PubMed]
  46. Shanmugam, G.; Sampath, S.; Selvaraj, K.K.; Larsson, D.J.; Ramaswamy, B.R. Non-steroidal anti-inflammatory drugs in Indian rivers. Environ. Sci. Pollut. Res. 2014, 21, 921–931. [Google Scholar] [CrossRef]
  47. Gao, D.W.; Li, Z.; Wang, H.; Liang, H. An overview of phthalate acid ester pollution in China over the last decade: Environmental occurrence and human exposure. Sci. Total Environ. 2018, 645, 1400–1409. [Google Scholar] [CrossRef]
  48. Zhou, L.J.; Zhang, Q.; Shi, L.L. The formulation methods of priority water pollutants and environmental quality standards in the EU and their reference significance to China. Environ. Monit. Forewarn. 2019, 11, 1–9. [Google Scholar] [CrossRef]
  49. Zang, Y.; Jiao, Y.; Li, Z.; Tao, Y.; Yang, Y. Hazards of phthalates (PAEs) exposure: A review of aquatic animal toxicology studies. Sci. Total Environ. 2021, 771, 145418. [Google Scholar] [CrossRef] [PubMed]
  50. He, W.; Qin, N.; Kong, X.Z.; Liu, W.X.; He, Q.S.; Wang, Q.M.; Xu, F.L. Water quality benchmarking (WQB) and priority control screening (PCS) of persistent toxic substances (PTSs) in China: Necessity, method and a case study. Sci. Total Environ. 2014, 472, 1108–1120. [Google Scholar] [CrossRef] [PubMed]
  51. Elaiyaraja, A.; Mayilsamy, M.; Vimalkumar, K.; Nikhil, N.P.; Noorani, P.M.; Bommuraj, V.; Rajendran, R.B. Aquatic and human health risk assessment of Humanogenic Emerging Contaminants (HECs), Phthalate Esters from the Indian Rivers. Chemosphere 2022, 306, 135624. [Google Scholar] [CrossRef] [PubMed]
  52. Zhang, L.; Liu, J.; Liu, H.; Wan, G.; Zhang, S. The occurrence and ecological risk assessment of phthalate esters (PAEs) in urban aquatic environments of China. Ecotoxicology 2015, 24, 967–984. [Google Scholar] [CrossRef]
  53. Lee, Y.M.; Lee, J.E.; Choe, W.; Kim, T.; Lee, J.Y.; Kho, Y.; Zoh, K.D. Distribution of phthalate esters in air, water, sediments, and fish in the Asan Lake of Korea. Environ. Int. 2019, 126, 635–643. [Google Scholar] [CrossRef]
  54. Zhao, X.; Shen, J.M.; Zhang, H.; Li, X.; Chen, Z.L.; Wang, X.C. The occurrence and spatial distribution of phthalate esters (PAEs) in the Lanzhou section of the Yellow River. Environ. Sci. Pollut. Res. 2020, 27, 19724–19735. [Google Scholar] [CrossRef] [PubMed]
  55. Muhamad, A.; Karim, A.T.A.; Zakaria, N.F.; Rapok, K.J.A. Determination of phthalate ester compounds in Sembrong river sediment. J. Techno-Soc. 2016, 8, 2. [Google Scholar]
  56. CPCB. River Stretches for Restoration for Water Quality. 2015. Available online: https://cpcb.nic.in/annual-report.php (accessed on February 2015).
  57. Subedi, B.; Balakrishna, K.; Sinha, R.K.; Yamashita, N.; Balasubramanian, V.G.; Kannan, K. Mass loading and removal of pharmaceuticals and personal care products, including psychoactive and illicit drugs and artificial sweeteners, in five sewage treatment plants in India. J. Environ. Chem. Eng. 2015, 3, 2882–2891. [Google Scholar] [CrossRef]
  58. Kumar, V.; Sharma, A.; Kumar, R.; Bhardwaj, R.; Kumar Thukral, A.; Rodrigo-Comino, J. Assessment of heavy-metal pollution in three different Indian water bodies by combination of multivariate analysis and water pollution indices. Hum. Ecol. Risk Assess. 2020, 26, 1–16. [Google Scholar] [CrossRef]
  59. USEPA. Phthalates Action Plan. 2012. Available online: http://www.epa.gov/oppt/existingchemicals/pubs/actionplans/phthalates_actionplan_revised_2012-03-14.pdf (accessed on 20 December 2013).
  60. Ai, S.; Gao, X.; Wang, X.; Li, J.; Fan, B.; Zhao, S. Exposure and Tiered Ecological Risk Assessment of Phthalate Esters in the Surface Water of Poyang Lake, China. Chemosphere 2021, 262, 127864. [Google Scholar] [CrossRef] [PubMed]
  61. Baloyi, N.D.; Tekere, M.; Maphangwa, K.W.; Masindi, V. Insights into the prevalence and impacts of phthalate esters in aquatic ecosystems. Front. Environ. Sci. 2021, 9, 684190. [Google Scholar] [CrossRef]
  62. Harris, G.A.; Henttu, P.; Parker, M.G.; Sumpter, J.P. The estrogenic activity of phthalate esters in vitro. Environ. Health Perspect. 1997, 105, 802–811. [Google Scholar] [CrossRef]
  63. Ramzi, A.; Gireeshkumar, T.R.; Rahman, K.H.; Balachandran, K.K.; Shameem, K.; Chacko, J.; Chandramohanakumar, N. Phthalic acid esters—A grave ecological hazard in Cochin estuary, India. Mar. Pollut. Bull. 2020, 152, 110899. [Google Scholar] [CrossRef]
  64. Paluselli, A.; Aminot, Y.; Galgani, F.; Net, S.; Sempere, R. Occurrence of phthalate acid esters (PAEs) in the northwestern Mediterranean Sea and the Rhone River. Prog. Oceanogr. 2018, 163, 221–231. [Google Scholar] [CrossRef] [Green Version]
  65. Guo, Y.; Alomirah, H.; Cho, H.-S.; Minh, T.B.; Mohd, M.A.; Nakata, H. Occurrence of phthalate metabolites in human urine from several Asian countries. Environ. Sci. Technol. 2011, 45, 3138–3144. [Google Scholar] [CrossRef]
  66. López-Carrillo, L.; Hernández-Ramírez, R.U.; Calafat, A.M.; Torres-Sánchez, L.; Galván-Portillo, M.; Needham, L.L.; Cebrián, M.E. Exposure to phthalates and breast cancer risk in northern Mexico. Environ. Health Perspect. 2010, 118, 539–544. [Google Scholar] [CrossRef]
  67. Hsieh, T.H.; Tsai, C.F.; Hsu, C.Y.; Kuo, P.L.; Lee, J.N.; Chai, C.Y. Phthalates induce proliferation and invasiveness of estrogen receptor-negative breast cancer through the AhR/HDAC6/c-Myc signaling pathway. FASEB J. 2012, 26, 778–787. [Google Scholar] [CrossRef] [Green Version]
  68. Sung, H.H.; Kao, W.Y.; Su, Y.J. Effects and toxicity of phthalate esters to hemocytes of giant freshwater prawn, Macrobrachium rosenbergii. Aquat. Toxicol. 2003, 64, 25–37. [Google Scholar] [CrossRef]
  69. Xu, H.; Shao, X.; Zhang, Z.; Zou, Y.; Wu, X.; Yang, L. Oxidative stress and immune related gene expression following exposure to di-n-butyl phthalate and diethyl phthalate in zebrafish embryos. Ecotoxicol. Environ. Saf. 2013, 93, 39–44. [Google Scholar] [CrossRef] [PubMed]
  70. Chen, W.L.; Sung, H.H. The toxic effect of phthalate esters on immune responses of giant freshwater prawn (Macrobrachium rosenbergii) via oral treatment. Aquat. Toxicol. 2005, 74, 160–171. [Google Scholar] [CrossRef] [PubMed]
  71. Chen, H.; Zhang, Z.; Zhang, L.; Tian, F.; Tang, Z.; Cai, W.; Jia, X. Effects of di-n-butyl phthalate on gills-and liver-specific EROD activities and CYP1A levels in juvenile red snapper (Lutjanus argentimaculatus). Comp. Biochem. Physiol. 2020, 232, 108757. [Google Scholar] [CrossRef] [PubMed]
  72. Wang, Y.; Zhu, H.; Kannan, K. A review of biomonitoring of phthalate exposures. Toxics 2019, 7, 21. [Google Scholar] [CrossRef] [PubMed] [Green Version]
Figure 1. Study area map with sampling locations of the Harike wetland, Punjab, India. Source: https://bhuvan.nrsc.gov.in/home/index.php# (accessed on: 15 January 2021).
Water 15 01009 g001
Figure 2. Phthalate distribution in the winter season of water (bar plot) and sediments (line) of Harike wetland.
Water 15 01009 g002
Figure 3. Phthalate distribution in the summer season of water (bar plot) and sediments (line) of Harike wetland.
Water 15 01009 g003
Figure 4. Phthalate distribution in the monsoon season of water (bar plot) and sediments (line) of Harike wetland.
Water 15 01009 g004
Figure 5. (a) Graph showing the exposure of phthalates in Exposure Index (adults) in mg/kg dw; (b) Graph showing the exposure of phthalates in Exposure Index (children) in mg/kg dw; (c) Adult Hazard quotient (HQ) for phthalates in Harike wetland, India; (d) Children Hazard quotient (HQ) for phthalates in Harike wetland, India.
Water 15 01009 g005
Figure 6. Aquatic risk assessment (a) Exposure of phthalate esters in fish of water samples for different seasons; (b) Exposure of phthalate esters in daphnia of water samples for different seasons; (c) Exposure of phthalate esters in green algae of water samples for different seasons.
Water 15 01009 g006
Figure 7. Aquatic risk assessment (a) Exposure of phthalates in fish of sediment samples for different seasons; (b) Exposure of phthalates in daphnia of sediment samples for different seasons; (c) Exposure of phthalates in green algae of sediment samples for different seasons.
Water 15 01009 g007
Table 1. Sampling location at Harike wetland with coordinates.
S. No.Site CodeLatitudeLongitudeLocation
1131°09′04″ N74°57′02″ EForest head station Harike wetland
2231°08′59″ N74°57′13″ EConfluence point 1
3331°09′05″ N74°57′49″ EConfluence point 2
4431°09′09″ N74°58′20″ EConfluence point 3
5531°09′04″ N74°58′45″ ESutlej River
6631°09′21″ N74°58′39″ EBeas River
7731°08′38″ N74°56′58″ ENear Gurudwara Nanaksar Sahib
8831°08′44″ N74°56′52″ ENear Harike Barrage
9931°08′02″ N74°56′56″ ERajasthan Feeder
101031°07′57″ N74°57′01″ EFerozpur Feeder
Table 2. Adult and child exposure of phthalates in water samples of Harike wetland.
Phthalate EstersWinterSummerRainy
AdultChildAdultChildAdultChild
DMP(mg/kg dw)1.1252.7011.4653.5161.3233.175
DEP(mg/kg dw)0.5491.3190.6161.4771.6073.855
BBP(mg/kg dw)1.7304.1530.2050.4896.14314.741
DBP(mg/kg dw)5.42213.0144.99911.9993.6398.735
Table 3. Human health risk assessment of phthalates in water samples of Harike wetland.
Phthalate EstersWinterSummerRainy
AdultChildAdultChildAdultChild
DMP0.1130.2700.1460.3520.1330.318
DEP0.6871.6490.7691.8472.0084.819
BBP8.65420.7681.0212.44930.71173.706
DBP54.224130.13849.997119.99336.39487.346
Table 4. Aquatic risk assessment of phthalate esters in water for fish; daphnia and green algae.
Phthalate EstersWinter SeasonSummer SeasonRainy Season
FishDaphniaGreen AlgaeFishDaphniaGreen AlgaeFishDaphniaGreen Algae
DMP7.223.045.659.43.917.358.483.536.64
DEP12.115.3212.2213.565.9613.6835.3715.5535.69
DAP154.2568.62155.67146.0464.97147.39169.8575.57171.43
DPP143.6771.15211.9495.9247.50141.50117.5758.22173.43
BPP57.4430.09103.316.783.5512.19203.88106.82366.69
DBP155.1175.22246.94143.0169.36227.69104.150.48165.74
DcHP422.7245.171089.65105.361.08271.45534.42309.961377.59
Table 5. Sediment risk assessment of phthalate esters in water for fish; daphnia and green algae.
PhthalateWinter SeasonSummer SeasonRainy Season
FishDaphniaGreen AlgaeFishDaphniaGreen AlgaeFishDaphniaGreen Algae
DMP9.804.087.6716.997.0713.304.181.743.27
DEP2.721.192.755.922.595.973.681.623.71
DAP6.342.826.4017.667.8617.829.484.229.56
DPP2.721.354.022.071.033.055.022.497.39
BPP2.050.862.962.010.842.893.471.464.99
DBP4.241.655.405.692.217.254.331.685.52
DcHP0.250.140.630.360.210.910.740.431.89
Disclaimer/Publisher’s Note: The statements, opinions and data contained in all publications are solely those of the individual author(s) and contributor(s) and not of MDPI and/or the editor(s). MDPI and/or the editor(s) disclaim responsibility for any injury to people or property resulting from any ideas, methods, instructions or products referred to in the content.

