
Role of Gypsum in Conserving Soil Moisture Macronutrients Uptake and Improving Wheat Yield in the Rainfed Area
1
Guangdong Engineering and Technology Center for Environmental Pollution Prevention and Control in Agricultural Producing Areas, College of Resources and Environment, Zhongkai University of Agriculture and Engineering, Guangzhou 510225, China
2
Institute of Soil and Environmental Sciences, PMAS-Arid Agriculture University Rawalpindi, Rawalpindi 46000, Pakistan
*
Author to whom correspondence should be addressed.
Water 2023, 15(6), 1011; https://doi.org/10.3390/w15061011
Submission received: 7 February 2023
/
Revised: 26 February 2023
/
Accepted: 1 March 2023
/
Published: 7 March 2023
(This article belongs to the Special Issue Efficient Utilization and Conservation of Agricultural Water and Soil Resources)
Abstract
:Agricultural rainfed areas of Pakistan have been facing several issues in recent years, e.g., soil erosion, nutrient runoff, and soil dependency on rainfall for crop growth. Wheat is considered a major staple crop in Pakistan. The main concern in these regions is to conserve soil moisture as the crop depends on the moisture obtained by rainfall. Gypsum is considered one of the best moisture conservers, especially for rainfed areas. Hence, this study was initiated (1) to explore the effects of gypsum on soil moisture conservation and (2) to reveal the effects of gypsum on soil macronutrients, sulfur (S), calcium (Ca), nitrogen (N), phosphorus (P), and potassium (K) uptake, and, eventually, wheat yield. The study was conducted from July 2014 to April 2015 in the rainfed Pothohar region of Pakistan. The recommended mineral fertilizers (N120P80K60) along with the following gypsum treatments: T1 = gypsum @ 0 Mg ha−1 (0 kg plot−1), T2 = gypsum @ 1 Mg ha−1 (0.6 kg plot−1), T3 = gypsum @ 3 Mg ha−1 (1.8 kg plot−1), and T4 = gypsum @ 4 Mg ha−1 (2.4 kg plot−1) were applied. The Chakwal-50 wheat variety was sown, followed by gypsum application. The maximum moisture was recorded under the soil of treatment T4 each month. The soil moisture was conserved up to 21% (surface) and 23% (sub-surface) in January and February 2015, respectively, with a 4 Mg ha−1 gypsum application. The highest nitrogen (N, 448.68 kg ha−1), phosphorus (P, 50.6 kg ha−1), potassium (K, 185.7 Kg ha−1), sulfur (S, 9.75 kg ha−1), and calcium (Ca, 35.5 kg ha−1) uptake values were observed in treatment with a 3 Mg ha−1 gypsum application (p < 0.05). The mean values of the grain yield ranged between 1903.4 (T1) and 2387.2 (T4) kg ha−1. Compared with the yield under T1, the grain yields under treatment T2, T3, and T4 were increased by 11%, 24%, and 25%, respectively. The straw yield ranged between 2446 and 2767 kg ha−1. There was no noticeable impact of gypsum application rates on the straw yield of the wheat crop (p > 0.05). Overall, treatment T3 was found to be optimal for conserving soil moisture, a better nutrient uptake, and, ultimately, the wheat crop yield with less input cost.
1. Introduction
Agricultural rainfed areas of Pakistan experience severe problems, e.g., moisture stress, nutrient deficiency, soil erosion, soil crusting, and uneven topography [1]. Wheat is among the key crops of this area, covering a large cultivated area of Punjab province. Among the key issues, soil moisture is of vital importance as crop growth is associated with it [2]. The wheat crop accounts for 13.1% of agriculture and 2.8% of gross domestic product (GDP) [3]. The wheat cultivation area of Pakistan is about 200 million hectares; in Punjab, it stretches up to 16.68 million hectares, and around 10% of the total wheat crop in Punjab province is under the rainfed area. The average wheat yield during the study period was 3300 kg ha−1, while in the rainfed area, it was around 1800 kg ha−1, indicating a significant difference between provisional and regional rainfed yields. Despite the fact that surface soil water (runoff) could be responsible for fertile soil loss [4], water has remained the most vital element along with the soil nutrients for better crop growth. The wise choice would be to conserve the available soil moisture. To better sustain agriculture in this region, water conservation is crucial, as the mean annual rainfall ranges between 400 and 1400 mm [5]. Loss of rainfall water creates a severe shortage of soil moisture for the crop, leading to nutrient loss and, ultimately, yield reduction. The main issue is determining the methods to preserve rainwater following substantial precipitation. Because of topography and climate, the rainfed Pothohar area is vulnerable to soil, nutrients, and moisture loss [6]. Generally, the distribution of precipitation is quite unpredictable in this area; usually, the rainy season lasts from July to September of each year, accounting for two-thirds of the total rainfall. To better utilize the rainwater over a more extended period and obtain an adequate yield, the wheat crop is sown in mid-November. To resolve the issue of water insecurity, some solution or amendment must be undertaken. The primary factors affecting moisture retention are soil type, soil organic matter (SOM), and agronomic strategies, including mulching and zero-tillage.
The soils of the Pothohar plateau region are classified as alkaline and calcareous soils [7]. Soils with high salts (primarily sodium concentration) often face the sealing effect, more runoff, and less soil moisture permeability [8]. Due to an excessive salt (sodium) concentration above the soil surface, the soil sealing could causes low water infiltration and high structural instability after the raindrop impact [9]. In this phenomenon, the role of %clay is vital as it aids in soil crusting. In the rainfed Pothohar area, due to less rainfall, more evapotranspiration, and high concentrations of salts on the soil surface, the land undergoes severe soil crusting, reducing water infiltration and, eventually, reduced crop productivity [10]. Most studies on this issue have revealed that different chemicals improve soil moisture levels by reducing the sealing/crusting effect caused by high electrolyte (sodium) concentrations, improving crop yields [11]. Still, due to the lack of the proper implementation of chemicals, these have not fulfilled the economic rationales of the target end users [12]. Due to a dependency on rainfall and huge rainfall-water loss in the rainfed Pothohar area, the main concern is to conserve monsoon rainwater. The main goal should be to conserve monsoon rainwater. The monsoon rainwater could be preserved by reducing the sealing effect, reducing runoff, and creating more infiltration by adopting different economic techniques. Gypsum is considered one of the best agents for dealing with moisture conservation, soil crusting, and the balancing of electrolyte concentrations [13]. The Gypsum application is recommended for controlling surface runoff, increasing crop yield, and reducing significant nutrient losses in sloppy lands [14]. Several organic and chemical soil amendments are currently available in the market, which aid in moisture conservation and may improve the physicochemical properties of the soil [15].
Gypsum is one of the agents that reduce a soil’s pH up to 0.36 and 0.16 points by applying gypsum with compost at the ratio of 5:1 and with 2 Mg ha−1 of gypsum solely, respectively, which eventually helps plant nutrient availability [16,17]. The application of gypsum improves the available sulfur level in the soil [18]. Sulfur deficiency in the plant causes a decline in the yield, and the produced quality is badly affected [19]. Through this, many individual small clay particles bind together to create larger particles. Because of its common availability, accessibility, and cost-effectiveness, gypsum has been used to cure saline-affected soils and reclaim the soil structure [20]. Through this, many individual small clay particles bind together to obtain larger particles. Because it is the most common mineral source, and because of it accessibility and cost-effectiveness, gypsum is used to cure saline-affected soils and to reclaim the soil structure [21]. Soil crusting is one of the significant problems of cultivated soils [22]. Calcium in gypsum helps to minimize soil crusting, erosion, and runoff [23]. Gypsum is considered an amendment to improve the uptake of plant nutrients, especially macronutrients [24]. Gypsum also serves as a calcium- and sulfur-based fertilizer for plants [25]. Gypsum has another useful trait observed in the soil environment: when one nutrient increases, it decreases the content of the other soil nutrient; this phenomenon is called an antagonistic mechanism. For example, an increase in calcium level results in a high NH+4 concentration in the soil solution, which can influence nutrient availability and plant growth [26].
In 2022, few studies summarized the effects of gypsum application on soil conservation and wheat yield. Two studies suggested no change in the wheat yield by applying gypsum up to @ 8 Mg ha−1 [27,28]. Ehsan et al. [29] suggested a significant increase in the wheat yield by applying 2.5 Mg ha−1 of gypsum. Another study also indicated a significant increase in the agronomic and yield parameters by applying 75% or 25 Mg ha−1 of gypsum [30]. Ayesha et al. [31] revealed gypsum as the best-suited option among the other organic amendments to improve soil characteristics as a whole and the wheat yield specifically. Various other studies also indicated the positive impact of gypsum on soil characteristics and the wheat yield [32,33,34]. Overall, these studies revealed a significant increase in the grain wheat yield by a 2.5 to 8 tons ha−1 gypsum application. Despite the fact that several studies have worked on similar aspects of gypsum as the current study, this study is novel because of several aspects. This study summarizes the effect of gypsum on moisture, the macro-nutrient uptake, and the wheat yield. Another positive aspect of this study is the use of the wheat variety Chakwal-50, which is considered a resistant wheat variety for the Pothohar region. The Chakwal region is considered the hub of Pothohar and a critical region for wheat growth, another potentially novel aspect of this study. Overall, this study is practical, particularly for the Pothohar’s Chakwal region.
Along with the soil treatment, soil amendments, including gypsum, adequately improve the crop yield (up to 41%) by improving the soil’s physicochemical properties, including water and nutrient availability [35]. Gypsum is a valuable amendment for sulfur-deficient soils because it contains sulfur in sulfate form, which is available for plants [36]. Considering the importance of gypsum, this study was initiated with the following objectives: to assess (1) the effect of gypsum on the soil moisture content in the rainfed area and (2) the effect of gypsum on soil macronutrient uptake in wheat crops and, eventually, the yield of wheat crop.
2. Material and Methods
2.1. Design of the Research Study
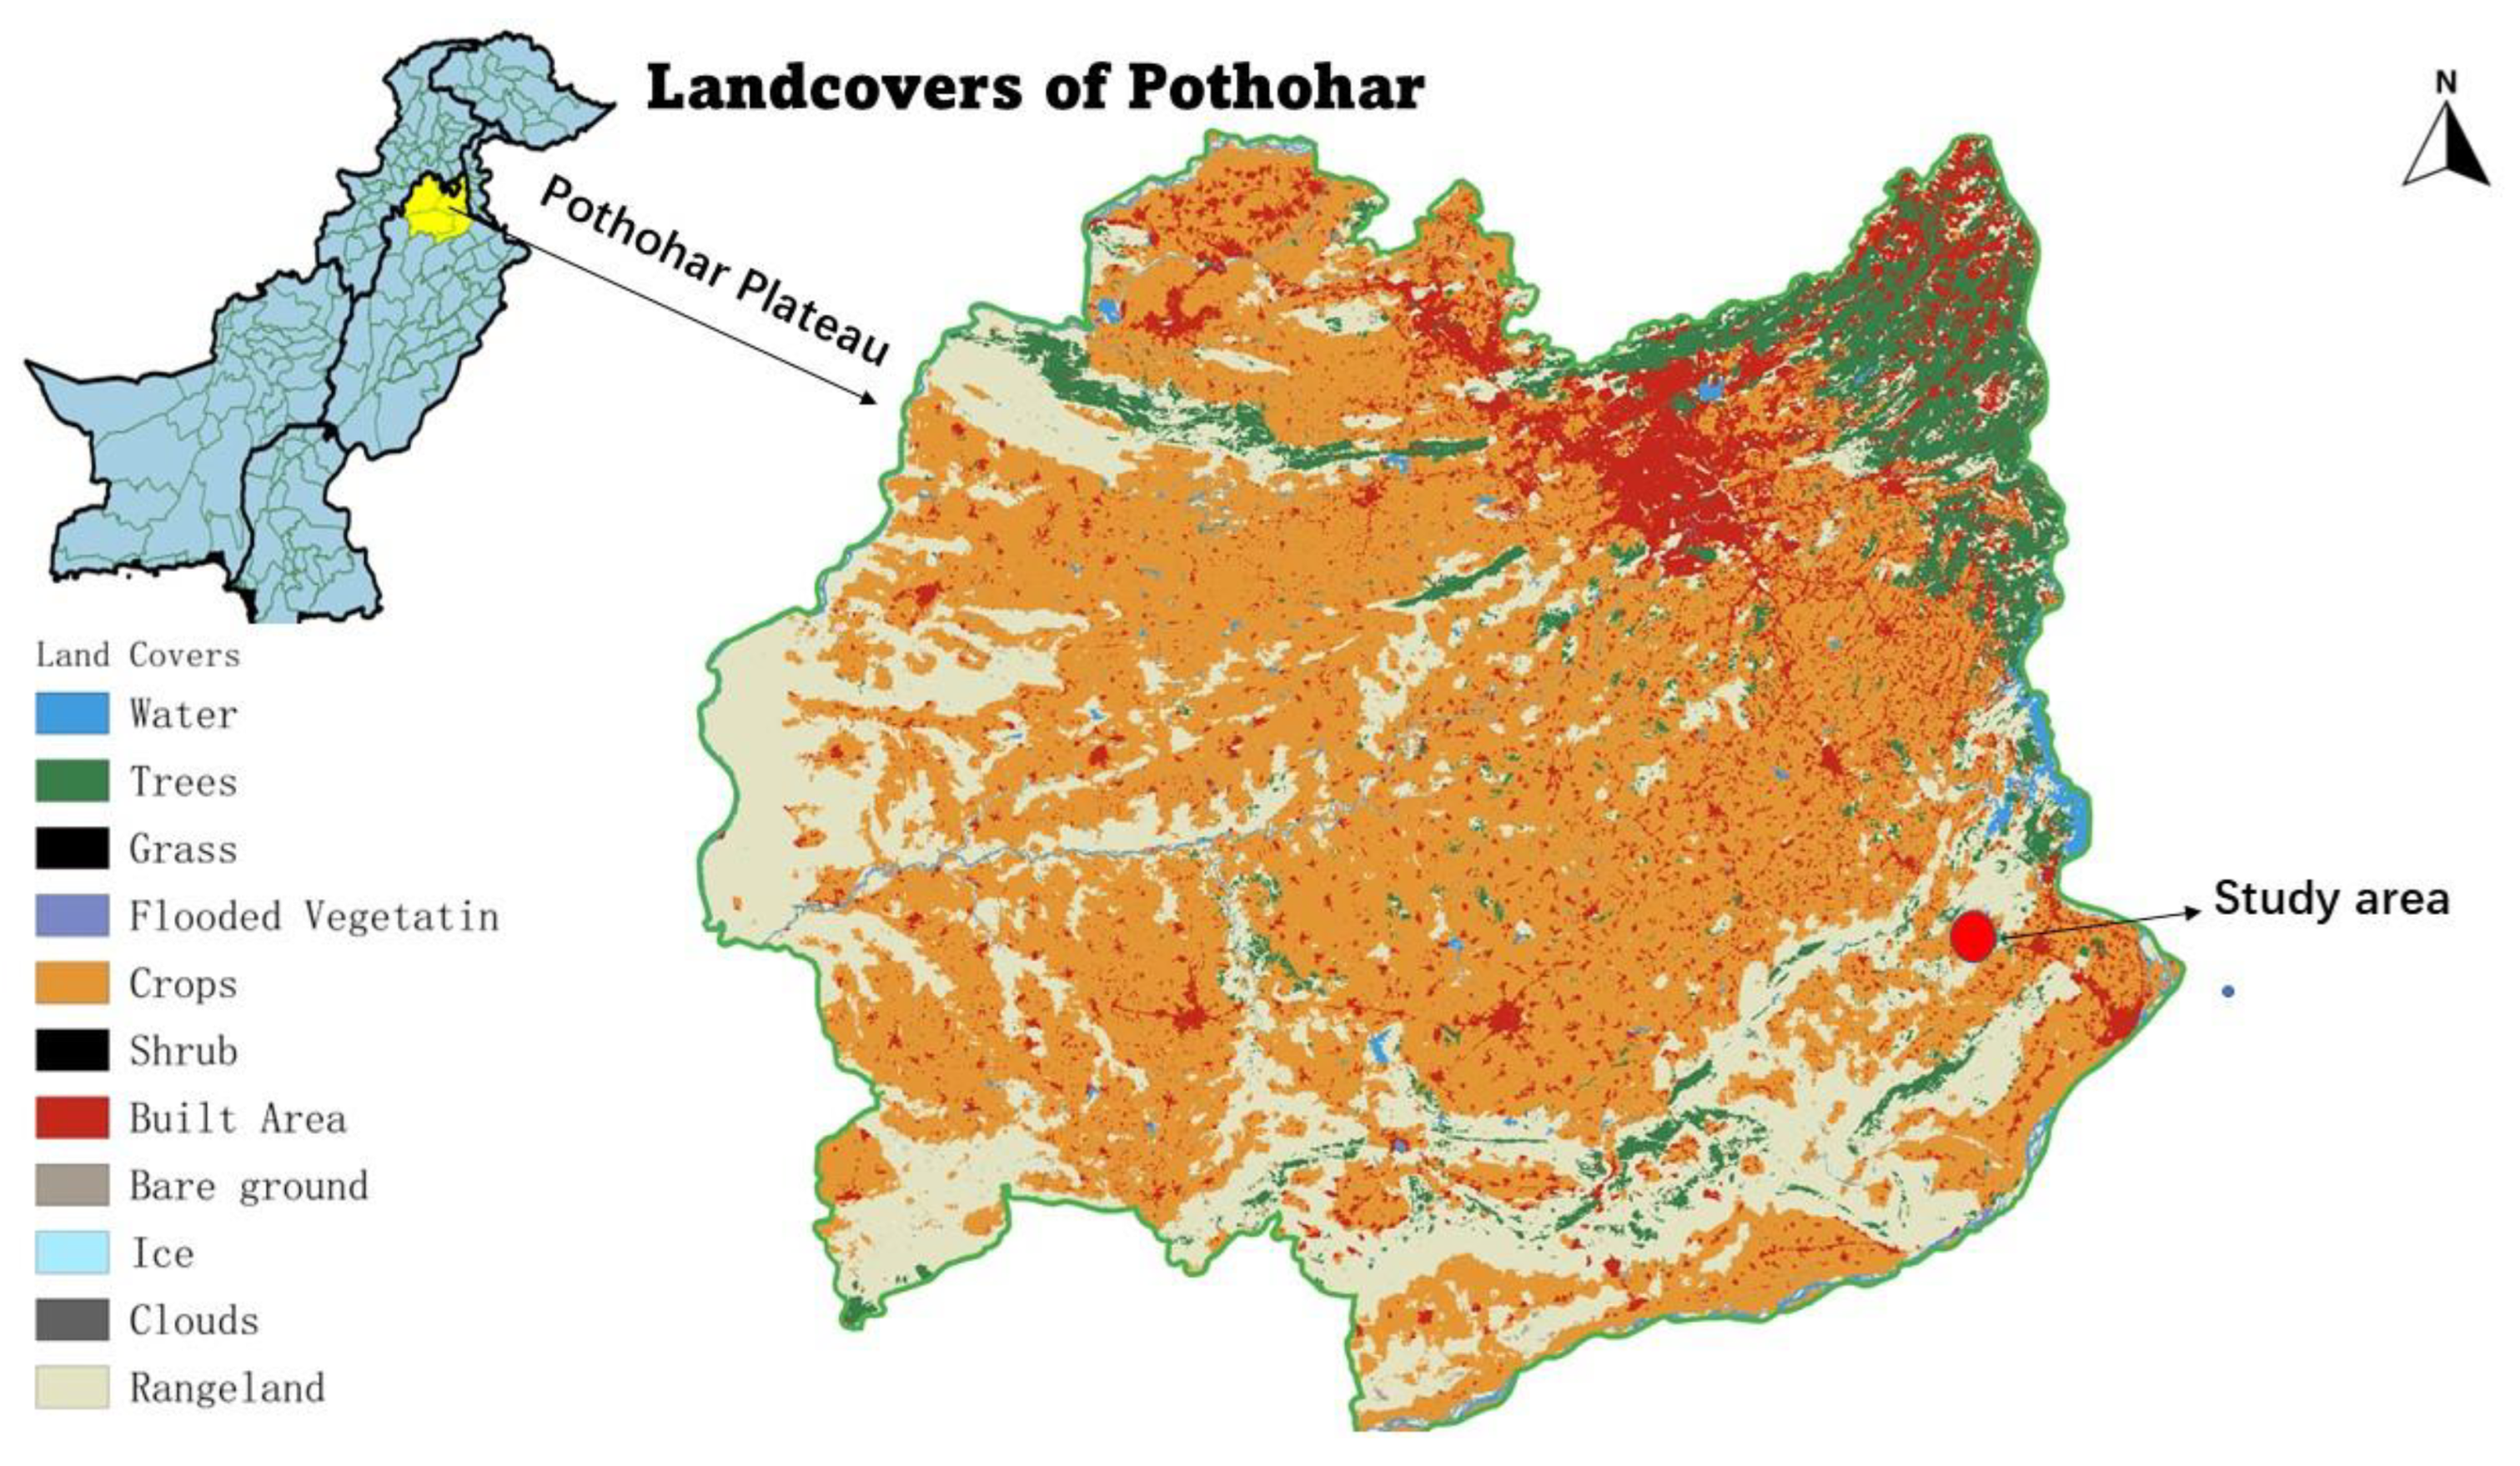
This study was executed during the monsoon season, from July 2014 to April 2015, in Pakistan’s rainfed Pothohar region with a latitude of 32°10–34°9 N and longitude of 71°10–73°55 E (Figure 1). The dominant soil order in the studies area was Alfisol. The details regarding the soil characteristics of the study area are described in Section 2.2. Along with the recommended mineral fertilizer doses, there were four gypsum treatments: T1 = gypsum @ 0 Mg ha−1 (0 kg plot−1), T2 = gypsum @ 1 Mg ha−1 (0.6 kg plot−1), T3 = gypsum @ 3 Mg ha−1 (1.8 kg plot−1), and T4 = gypsum @ 4 Mg ha−1 (2.4 kg plot−1). Four replications were used in the study. Randomized complete block design (RCBD) was used with a plot dimension of 3 m long by 2 m wide. The row-to-row and plant-to-plant spacing was 20 cm and 5 cm, respectively. Following the initial rainy season in mid-July, extensive plowing was carried out using a deep plow. Soon after, gypsum was spread across the fields at the recommended rates. In the Pothohar region, three wheat sowing methods were used as follows: (1) flat (spreading of wheat seed before cultivation), (2) rides technique (plantation of ridges with a 65 cm row-to-row distance), and (3) bedding (a heightened bed with 5–6 wheat rows) [37]. However, in the current study, we used a flat-modified method. After the gypsum application, the field was left fallow until the end of October 2014; after that, the seeds of a local variety (Chakwal-50) were planted using a Rabi drill (locally designed) in different blocks @ a 125 kg ha−1 seed rate. It was convenient and more efficient than the traditional methods. A locally designed drill machine was used for the mineral fertilizer (NPK) basal dose application, and N, P, and K were applied at the rate of 120–80–60 kg ha−1, respectively. Among the fertilizers, urea, DAP (diammonium phosphate), and MOP (muriate of potash) were used for the N, P, and K sources, respectively.
2.2. Basic Soil Properties of the Study Area
For a basic soil characteristic assessment of the study area, 3 random soil samples were collected using a core sampler (a 2.54 cm width), up to a 15 cm depth. This was undertaken, across the field, before the gypsum application. The collected soil was kept at room temperature and passed through a sieve with a diameter of <2 mm to remove weeds and straw. The sieved soil samples were analyzed before applying gypsum to determine the general soil characteristics. The soil texture was determined by the sieved pipette-based hydrometric method; this method calculates the number of primary particles based on their settling rate in the soil solution [38]. In the hydrometric method, the clay particles were measured by pipette; later, the sand proportions were calculated by sieve (<2 mm). Following the clay sieving, the dry weight of the primary particles was calculated. Based on the amount of sand and clay, the silt particles were determined. To determine the organic matter (SOM), Walkley’s wet oxidation test was used [39], in which chromate was used to oxidize the organic matter of the soil. Later, the left chromate was calculated at a 600 nm wavelength in the spectrophotometer. The available soil phosphorus (P) was measured by Olsen’s method [40], which is best suited for calcareous soils.
For measuring the available soil P, hydrogen carbonate and other ions were used in sodium bicarbonate solution, which formed calcium carbonate and increased the phosphorus solubility. In the end, the ppm concentration was converted to the soil’s concentration of P. The soil’s extractable potassium (K) was determined by shaking, mixing 500 mL of water within the vessel, adding acetic acid, and adding ammonium hydroxide. Then, the solution was centrifuged for ten minutes, and the supernatant was removed for further analysis in a volumetric flask. Finally, atomic absorption was used [41]. The soil sulfur (S) was determined by the turbidimetric method [42]. First, 25 mL of 0.15% calcium chloride in 5 g of air-dried soil were taken and shaken for 30 min. Then, 10 mL of extract were taken. Later, 5 to 10 mL of soil extract were taken and diluted to 20–30 mL with distilled water, plus 2–3 mL of 2 N sodium hydroxide (NaOH) solution. The extractable material was titrated with EDTA until the color changed to indigo. The soil calcium content was measured by the EDTA method [43] using HNO3, leaving it overnight and transferring the supernatant ash solution to a 2000 rpm centrifuge. Later the titration was performed with EDTA until the color turned to a bluish color. The Kjeldahl method was used to determine the nitrogen content of the soil. In this method, the digestion of soil was conducted with sulphuric acid at high temperatures (300–400 °C); sulphuric acid oxidizes the carbon and sulfur. The amount of ammonium ion was measured by acid-based (HCL mostly) titration [44]. The basic physicochemical characteristic of the soil are displayed in Table 1. The soil pH and electrical conductivity (EC) were 7.89 and 1.22 dS m−1, respectively. With 32% sand, 40% silt, and 27% clay, the soil had a sandy clay loam texture. The findings demonstrated that the soils of this region were phosphorus (P) deficient, as their range was <7 mg kg−1. The soil possessed lower OM (0.73%) than the minimum recommended range of 1.29% for productive soils. The soil sulfur, exchangeable calcium, and nitrate nitrogen were 3.8, 563, and 5.2 mg kg−1, respectively.
2.3. Soil Physicochemical Analysis Post Gypsum Application
To assess the effect of different gypsum application rates (0, 1, 3, and 4 Mg ha−1) on the soil moisture content, soil samples were collected on days 105, 136, 168, 186, and 221 from 2 different depths (0–25 cm and 25–50 cm). Samples were taken by weighing 10 g of fresh soil and then oven-drying the samples at 105 °C for 24 h. Then, the samples were removed and weighed again [45]. The moisture content was calculated using the formula:
For electrical conductivity, 50 g of air-dried soil was taken in a plastic beaker with 50 mL of distilled water to prepare a soil-saturated paste, which was then left for 30 min. The soil extract was taken from the soil-saturated paste. The electrical conductivity (EC) was calculated with the aid of an EC meter [46]. For the measurement of the soil pH, about 50 g of air-dried soil were placed in a plastic beaker, and distilled water was added slowly until a saturated paste was formed. The suspension was stirred every 10 min and the pH meter was calibrated for further processing. Later, an electrode was inserted (about 3 cm deep) in the suspension, and the soil pH was recorded [47].
2.4. Plant Analysis
For plant nutrient uptake analysis, plant samples were collected at two wheat development stages: (a) the booting stage and (b) ripening stage from a 0.5 m2 area from the three central rows of each plot. Plant samples were taken to the laboratory for a basic impurities cleaning treatment. For dry ashing, one gram of oven-dried plant material was taken in porcelain crucibles and shifted to a muffle furnace. The temperature was increased gradually up to 550 °C. After the completion of the ashing process, 5 mL, 2 M, of hydrochloric acid (HCl) were added to the solution. Later, the solution was diluted with distilled water up to 5a 0 mL volume and the filtrate was passed through Whatman No. 42 filter paper. The samples were used for the determination of calcium and sulfur [48]. In total, 1 g of plant material with 10 mL (2:1 ratio) of nitric acid-per-chloric acid were taken in a 100 mL Pyrex digestion tube. A U-shaped glass rod on the mouth of the tube permits the exit of volatile vapors. The temperature was increased slowly until the liquid was colorless. The temperature was raised to 235 °C. After complete digestion, a volume was made with distilled water up to 50 mL. Samples were used for nitrogen (N), phosphorous (P), and potassium (K) determination. For straw and grain analysis, wet digestion was carried out. Then, the nitrogen of the grain and straw samples were analyzed through Kjeldahl, a method using a catalyst, sulfuric acid, boric acid, and this solution [49]. After being subjected to dry ashing, nutrients such as potassium, phosphorus, calcium, and sulfur of wheat grain and straw were determined by a flame photometer, spectrophotometer, and atomic absorption spectrophotometer [50]. The uptake of sulfur, calcium, nitrogen, phosphorus, and potassium in the wheat crop was calculated by using the following formula:
Nutrient uptake = concentration in plant × biological yield
2.5. Wheat Yield
At the plant emerging stage, we considered how to select the appropriate plants in each block, and further healthy plants were chosen from each treatment for authentic and appropriate results (GOST ISO No. 22030-2009). The wheat crop was harvested manually; for biological and grain yield calculation, samples were collected (at 13% moisture) from 3 random locations of each plot using a quadrant (0.5 m long and 0.5 m wide). After the grain calculation was completed using the quadrant method, the complete harvesting of the plots was performed. Following the harvesting phase, the crop was sun-dried and then threshed separately. Shredding was done to determine the quantity of the grain and biomass yield. While calculating the grain yield and biomass yield, the dry weight was used as the baseline. The grains from each plot were then converted to kilograms per acre (kg ha−1). The quantity necessary to substantiate grains was subtracted from the overall biological yield to calculate the biomass yield.
2.6. Statistical Analysis
The results from the field experiment were statistically evaluated by the experimental designs using a computer-based program: Statistics 8.1. The study was carried out in a randomized complete block design (RCBD). The treatments’ mean values were evaluated based on an analysis of variance (ANOVA). To better evaluate the actual reason for differences in the origin between replicates, the results were compared using the least significant difference (LSD) test at a significance level of 5% by the posthoc test. For graphs, Origin 9.0 software was used.
3. Results
3.1. Wheather Conditions and Soil Moisture
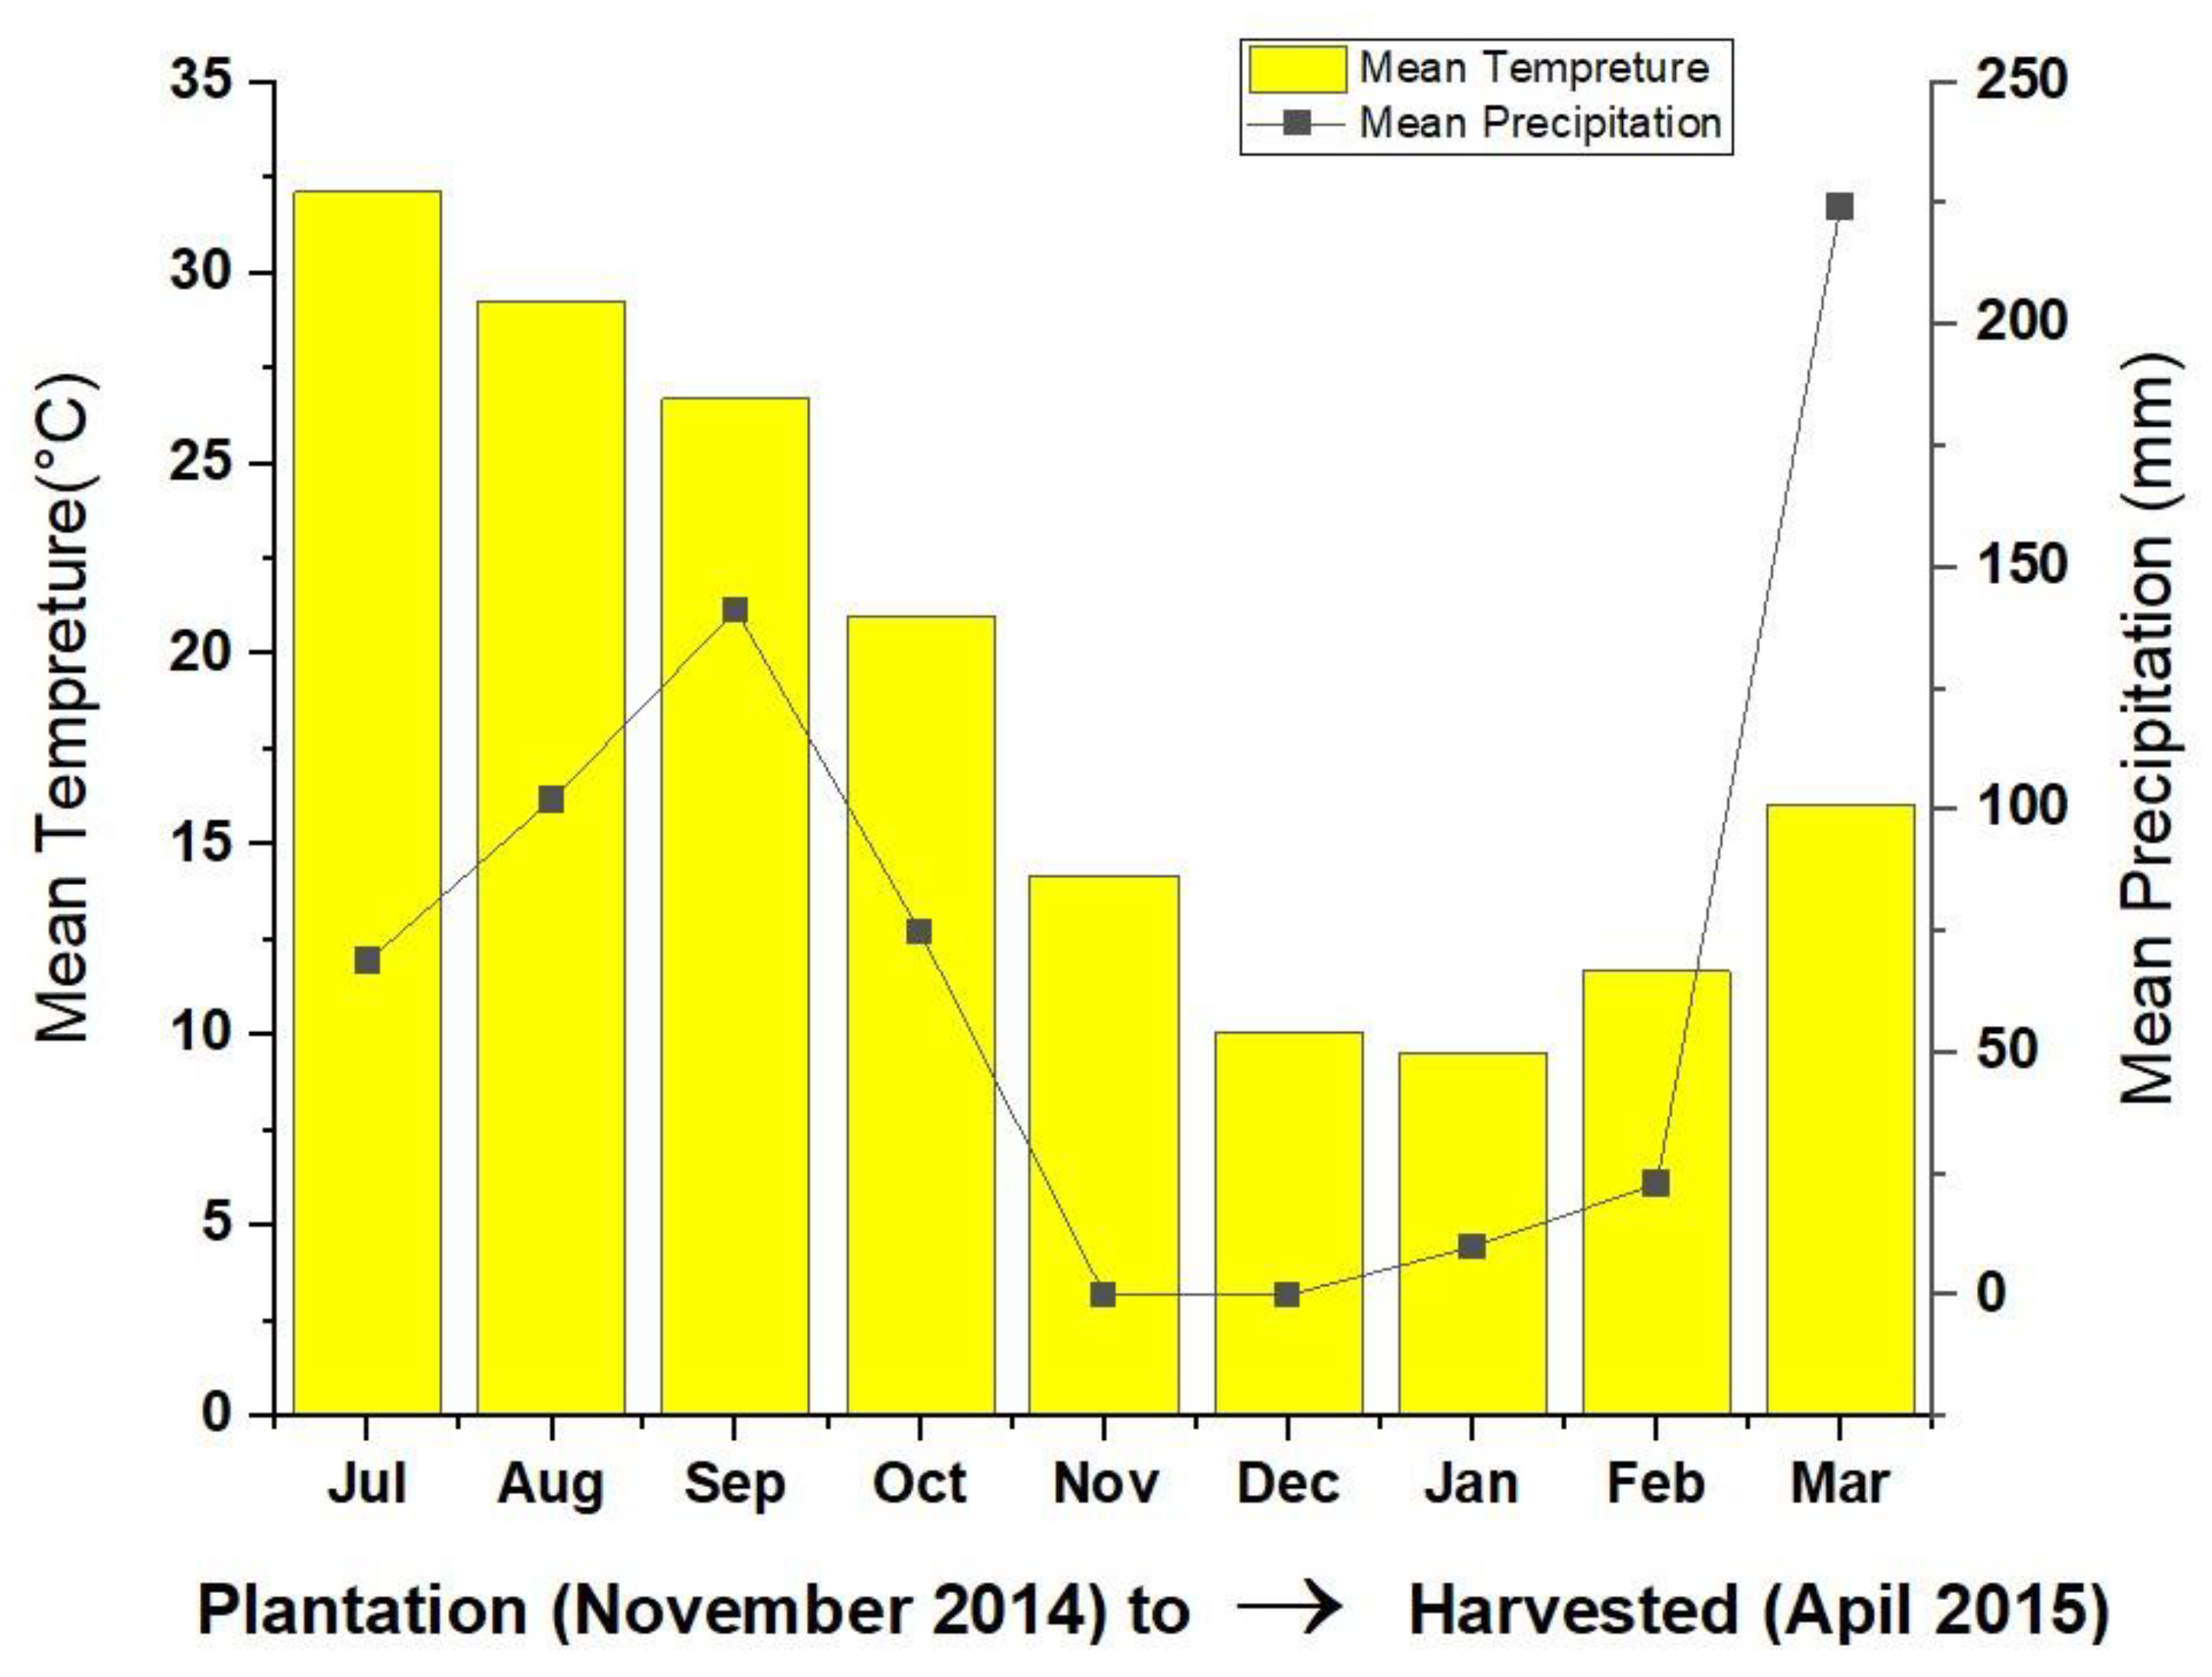
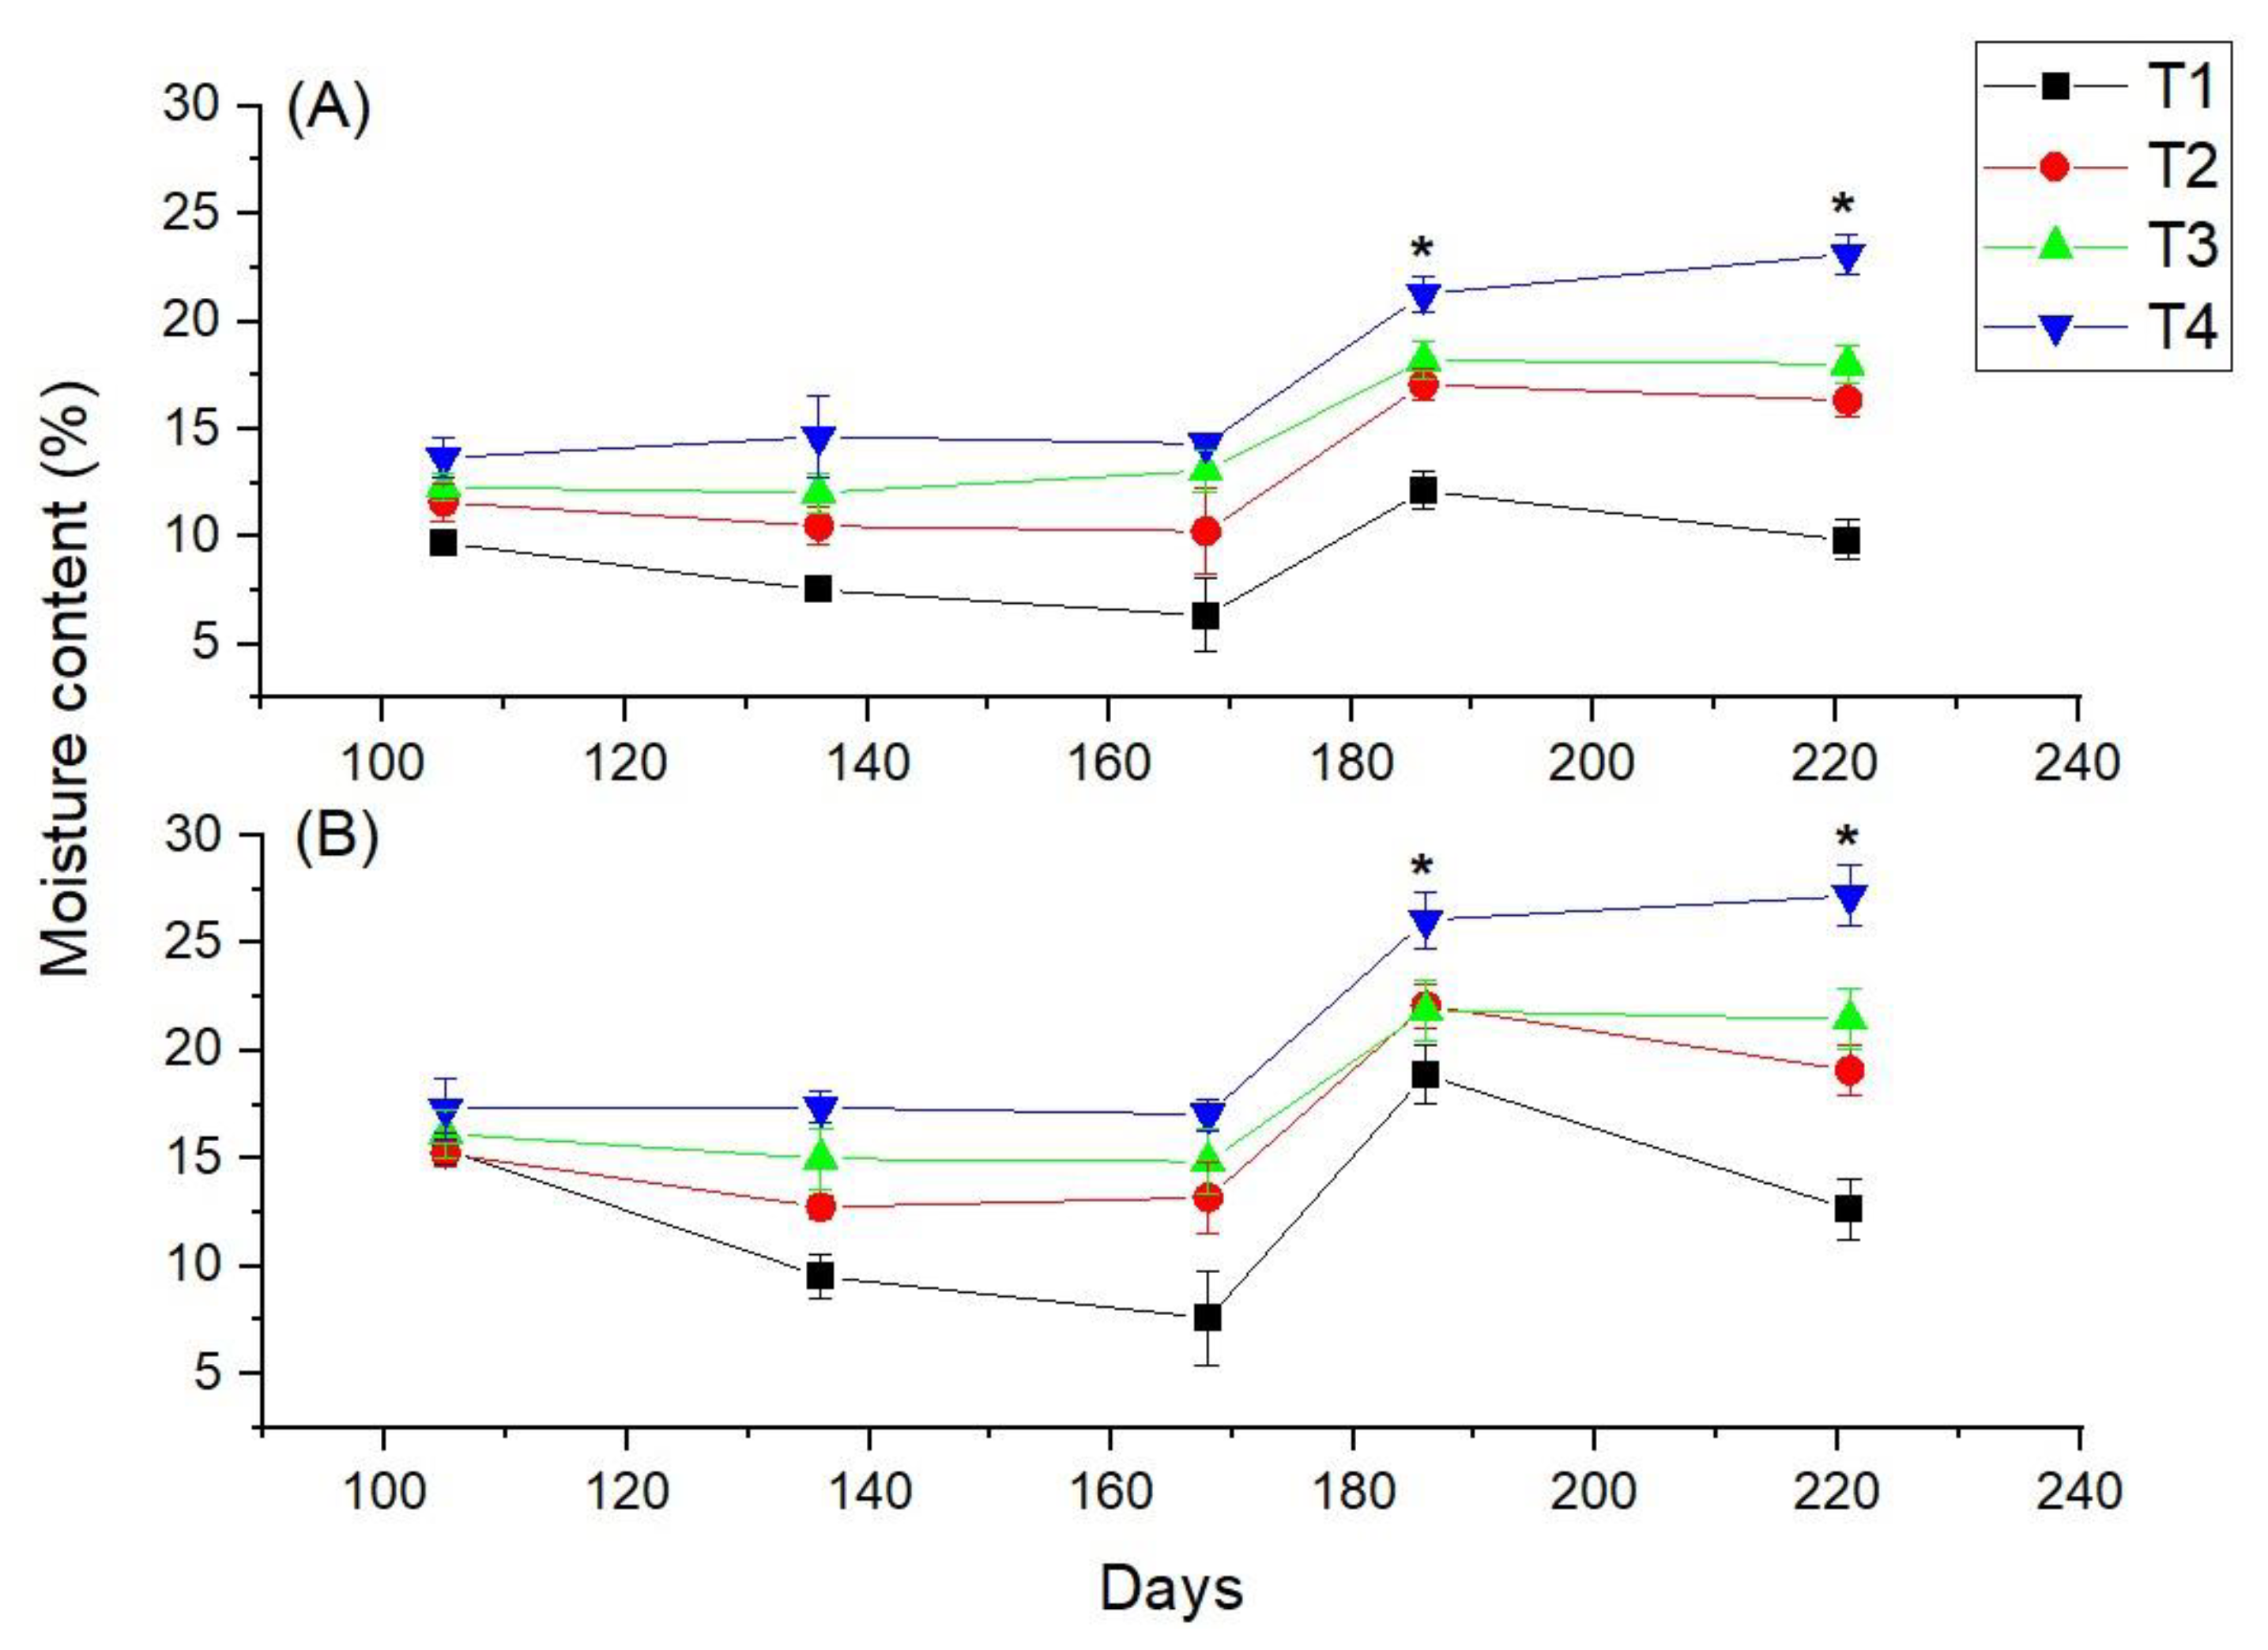
The mean monthly rainfall and average temperature values are shown in Figure 2. The mean rainfall was 75 mm in October 2014. This was a higher value than those observed in all other months except March 2015 (224 mm). Maximum mean temperatures of 26.8 °C, 24.3 °C, 19.5 °C, 16.9 °C, 18 °C, and 22.5 °C were observed, while the recorded minimum mean temperatures were 15.2 °C, 4.1 °C, 0.7 °C, 2.2 °C, 5.3 °C, and 9.6 °C in October, November, December, January, February, and March, respectively. The moisture content of the soil after the gypsum application is shown in Figure 3. After 105 days of gypsum application, the moisture content levels of the soils under treatment did not significantly differ (p > 0.05). The levels ranged between 9.7% and 13.2% and 13.7% and 18.02% for surface and subsurface soils, respectively. A sharp peak in the soil moisture content was observed after 185 days of gypsum application for all the treatments. The control (T1) showed a significantly low moisture content; the lowest (5.4%) was recorded after 167 days of gypsum application on surface soil. Overall, the moisture content levels for all three gypsum treatments were significantly higher than in the soil with zero gypsum (T1) application (p < 0.05). The moisture content of the subsurface soil was significantly higher than the surface soil (p < 0.05). After 185 days of gypsum application, treatment T4 showed the highest moisture content (p < 0.05) of all the treatments in the surface and subsurface soil samples (p < 0.05).
3.2. Soil pH and EC
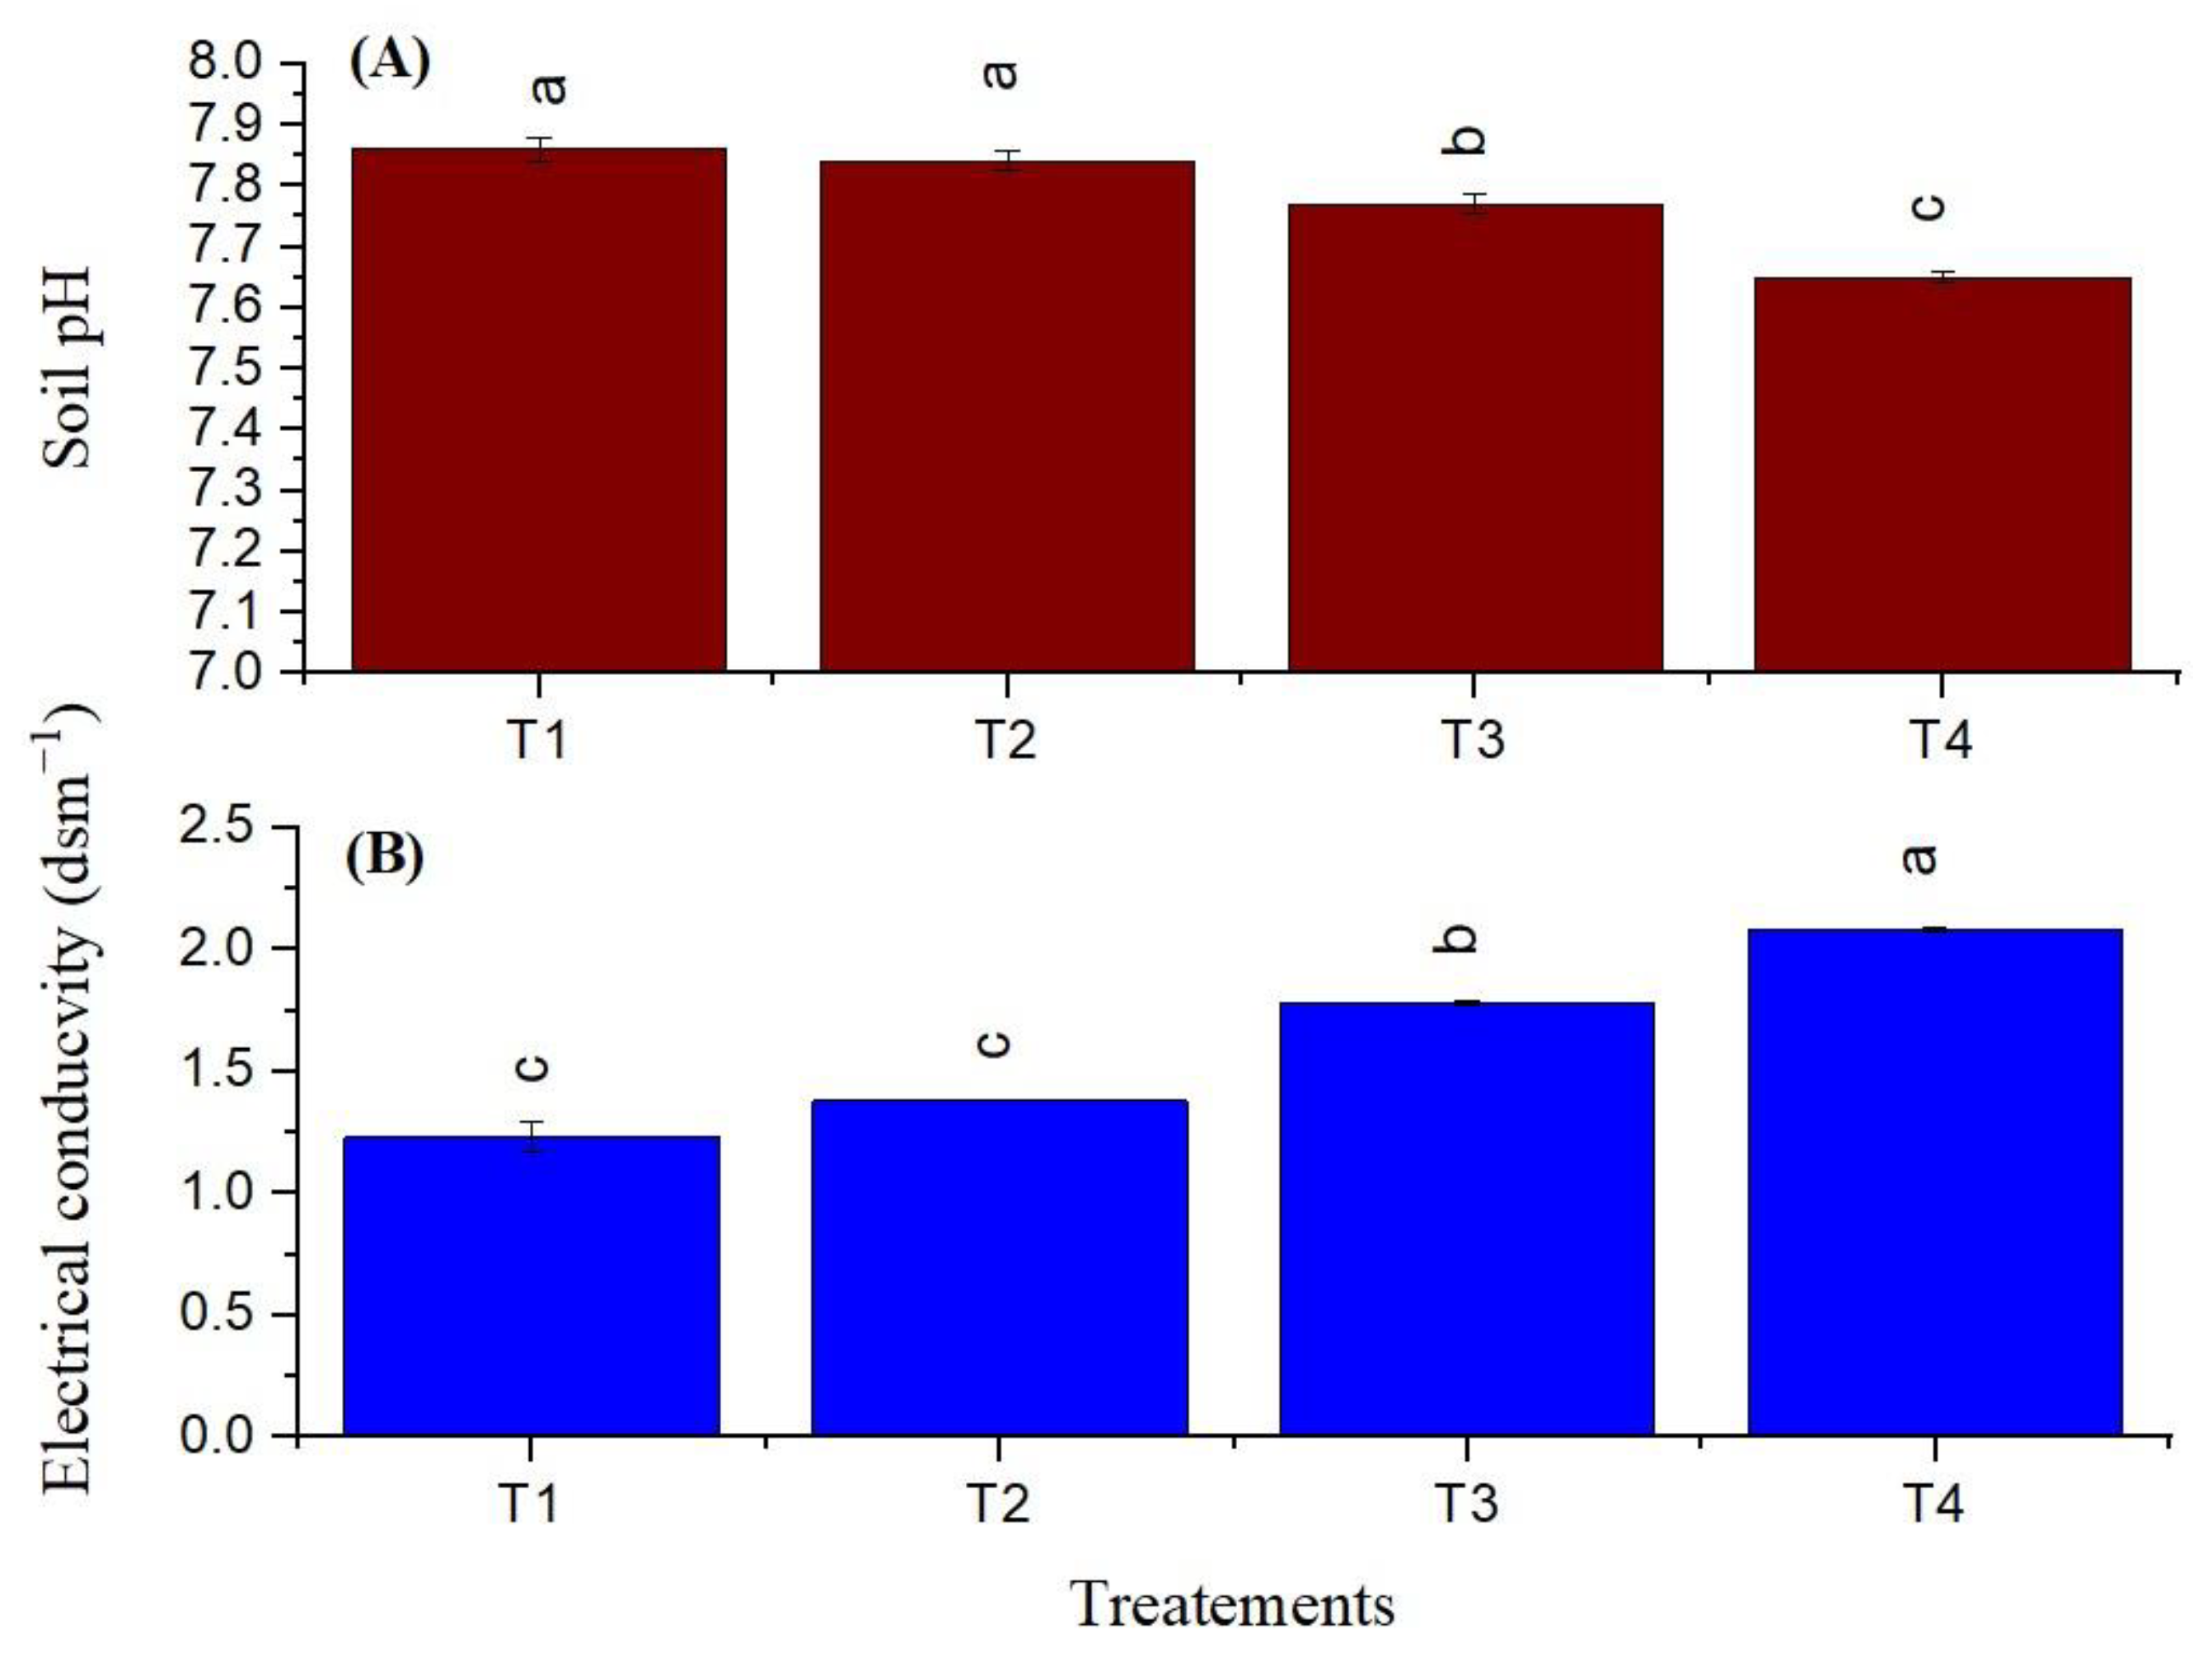
The pH values ranged between 7.63 and 7.86 under all 5 gypsum treatments. The pHs for the treatments T3 and T4 were significantly lower (p < 0.05) than those for the control (Figure 4A). The most substantial influence of gypsum was observed on soil pH with a 4 Mg ha−1 application rate. The gypsum treatment seemed to have a significant impact on the salt concentration of the soil. The soil’s electrical conductivity ranged from 1.23 (T1, control) to 2.08 dS m−1 (T4).
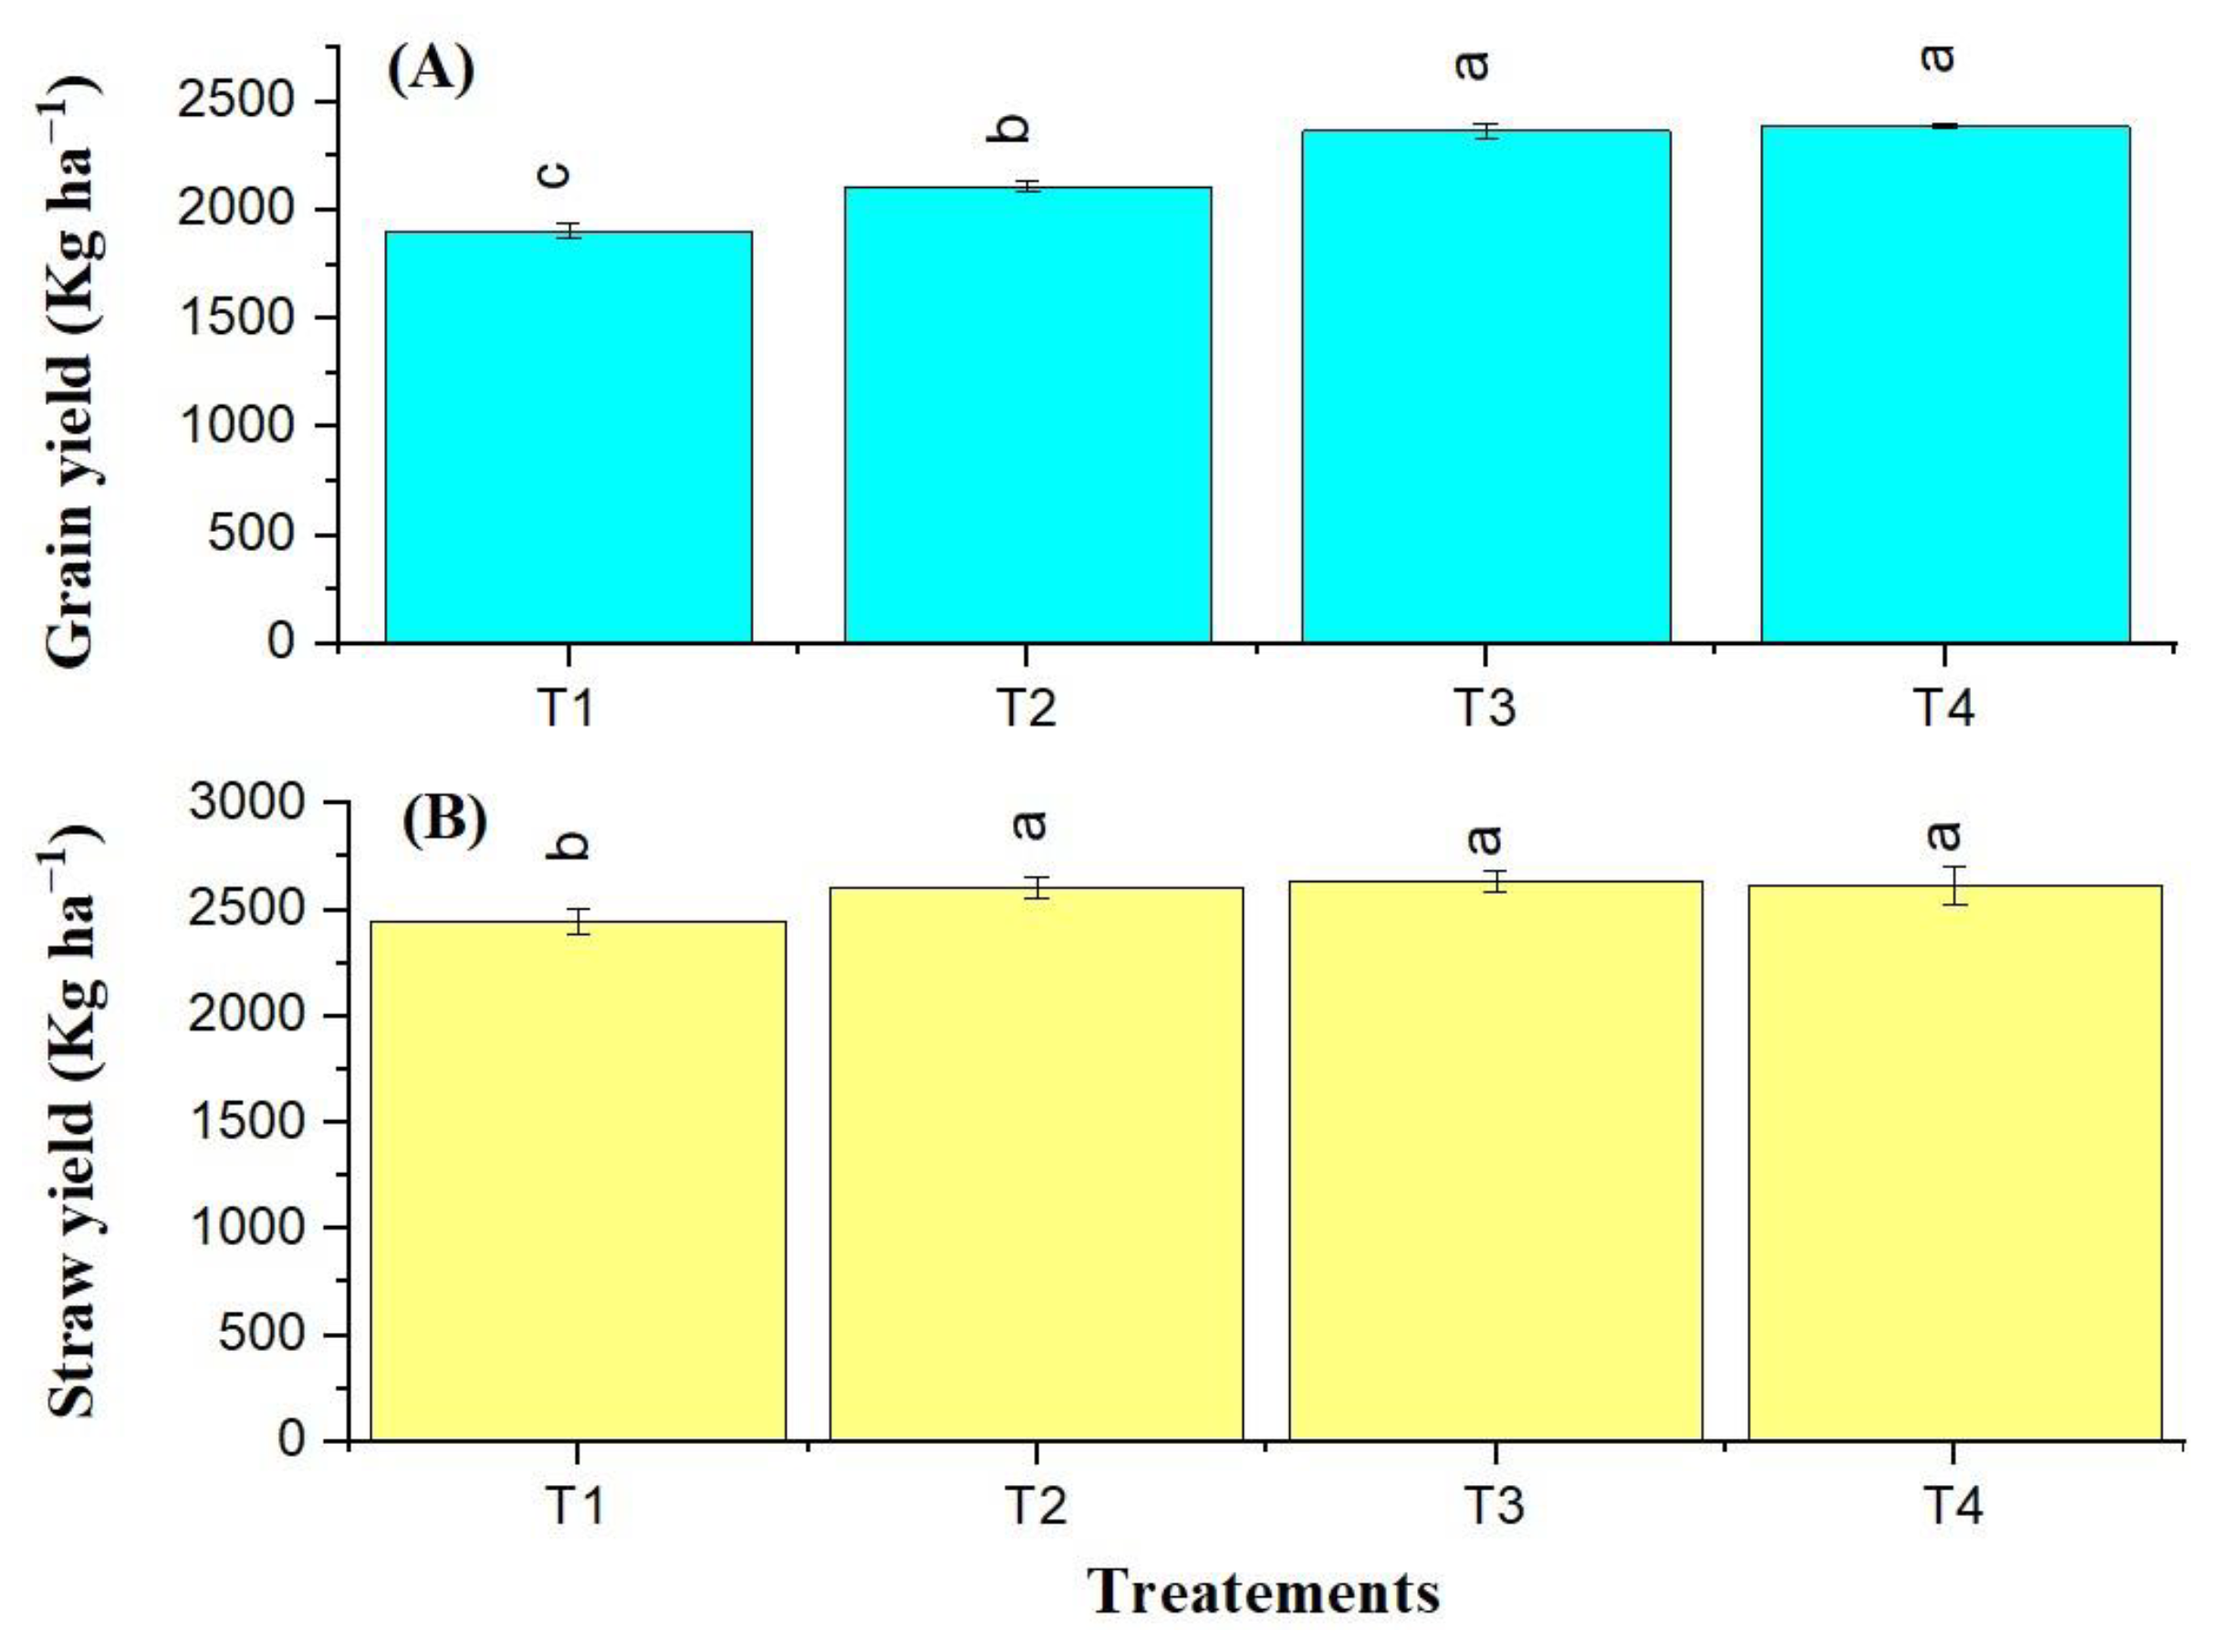
3.3. Wheat Yield and Soil Moisture
The average wheat yield varied between 1903.4 and 2387.2 kg/ha−1 (Figure 5A). A significant increase (24 and 25%) in grain yield was recorded after a 3 Mg/ha−1 and 4 Mg/ha−1 gypsum application. The lowest yield (1903.4 kg ha−1) was observed with no gypsum application treatment (T1), while the maximum (2387.2 kg ha−1) was found under the 3 Mg ha−1 (T4) gypsum application. There was no significant difference (p > 0.05) in the grain yield between gypsum treatments T3 and T4, but their yield was significantly higher than the yields of T2 and the control groups (p < 0.05). The average straw yield ranged from 2445 to 2633 kg ha−1 for all 4 treatments (Figure 5B). No prominent effects of gypsum were found on the straw yield, as there were no significant differences (p > 0.05) in the straw yield among all the treatments.
3.4. Nutrient Uptake
The results of the soil nutrient uptake affected by the gypsum application are presented in Table 2. A significant increase in calcium was observed through different gypsum rates (p < 0.05). The mean calcium content ranged between 65.2 and 112.3 kg ha−1; the highest was detected in the treatment with the 4 Mg ha−1 gypsum application, while the lowest uptake was 65.2 kg ha−1. The sulfate sulfur uptake influenced by the gypsum application in the wheat crop is presented in Table 2. The sulfate sulfur uptake values ranged from 32.2 to 60.1 kg ha−1. The highest uptake was observed through the 4 Mg ha−1 gypsum application, while the minimum uptake of sulfate sulfur was in the control with no gypsum application. There was no significant difference in sulfate sulfur uptake between 3 and 4 Mg ha−1 (p > 0.05).
The nitrogen content was highest (189 kg ha−1) in the crop under the highest gypsum application rate (T4), while the lowest N content (121.8 kg ha−1) was recorded under treatment with no gypsum application (T1). The nitrogen uptake ranged from 121.8 to 189.4 kg ha−1 under all 4 treatments. The phosphorus uptake ranged from 28.6 to 58.2 kg ha−1 in wheat crops through different gypsum application levels. The highest phosphorus uptake was 58.2 kg ha−1 through the 4 Mg ha−1 gypsum application; the lowest phosphorus uptake (25.6 kg ha−1) was observed under the control. The highest potassium uptake in the wheat crop was 202.2 Kg ha−1 with the 4 Mg ha−1 gypsum application, while the minimum potassium uptake was (130.5 Kg ha−1) under T1. There was no significant difference in K uptake between treatment T3 and T4 (p > 0.05).
4. Discussion
4.1. Effect of Gypsum on Soil Moisture Conservation in Rainfed Areas
This study showed a significant temporal increase in the soil moisture content with the gypsum application; these findings were similar to those reported by Rahina et al. [51]. Visual results revealed that there was no crusting in the gypsum-applied plots; this could be because of sodium (Na+) leaching due to a replacement by calcium [52]. Soil crusting is a serious problem, especially in the rainfed area, as it reduces water infiltration and increases surface soil and water runoff. Reduced crusting in the studied plots may be because gypsum improves soil crusting and increases water infiltration [53]. Overall, there was an increase of 14% in the moisture content by the 4 Mg ha−1 gypsum application to the treatment with no gypsum application (T1). These results were lower than the findings obtained by Obaid et al. [17], who reported a 41% soil moisture conservation through gypsum application in a study in the Pothohar region. Soluble calcium improves the soil aggregate stability, porosity, and infiltration rate while reducing the crusting effect. Gypsum has the ability to restrain clay dispersion as specific and soil aggregate stability generally. The reduction in the amount of crusting through gypsum is evident in several studies [54,55]. This is due to the fact that it increases the soil porosity, loosens the soil, decreases the bulk density, decreases the soil electrolytes concentration, and replaces the Na+ with Ca+2. In general, several studies emphasize the role of gypsum in the structural stability. By conserving the soil structure, a gypsum application improves the soil–water infiltration rate and reduces runoff and evapotranspiration; hence, eventually conserving the soil moisture underneath [56]. Gypsum also improves soil moisture conservation by improving the porosity of the soil; the said porosity improved due to the calcium content of the gypsum applied, and the flocculation and aggregation property of gypsum aids in the overall soil moisture conservation [54].
Gypsum, as an amendment, can improve water infiltration, and by improving the infiltration rate, applied water enters the soil with less duration, eventually assisting in soil moisture conservation [57]. There was little rainfall during the October and November months of 2014 at the study site; however, the conserved moisture of the previous month showed a beneficial effect on wheat germination and initial growth. This might be due to the fact that the pre-monsoon (in July) application of gypsum improved the moisture contents of the soil under rainfed conditions [58]. The most effective moisture conservation was observed in the subsurface compared to the surface profile. This subsurface moisture conservation was because gypsum improves hydraulic conductivity and water infiltration [59]; water percolates quickly and is eventually stored in the subsurface area. The other reason for high subsurface moisture could be that at the surface soil level, there is more evapotranspiration than subsurface soil, which contributes to the low moisture content at the topsoil. The high% moisture storage at the subsurface soil layer could also be attributed to high tillage practices at the surface (plow layer) soil level. Hence, more water accumulates at the subsurface soil layer (FAO).
4.2. Effect of Gypsum on Macronutrient Uptake in the Wheat Crop
In this study, the increase in the nutrient uptake by gypsum application was attributed to improved soil physicochemical properties [23]. Gypsum consists of calcium (19%) and sulfur (23%) readily soluble in the soil–water mixture. The abundance of these two macronutrients aids in the availability and uptake of other macronutrients [60]. The soil pH is vital in nutrient availability and crop yield. The results of this study showed a decrease in the soil pH with the 3 and 4 Mg ha−1 gypsum application, which might be due to a high calcium concentration [29], which replaces sodium as sodium leaches down with water. The amount of gypsum to stabilize the soil depends on the amount of sodium, %clay, and clay type. Subsequent to moisture conservation and macronutrient uptake by gypsum application, a significant increase (24% and 25%) in the grain yield was recorded by the 3 Mg ha−1 of gypsum application. These results were similar to the findings of a recent study in the Pothohar region [61]. There was no significant difference in the grain yield under 3 and 4 Mg ha−1; however, considering the input cost and benefit ratio, we can conclude that the 3 Mg ha−1 (T3) treatment was best suited for the wheat crop with a double dipping effect. Our results suggested no impact of gypsum on the straw yield, which might be due to the fact that gypsum is the source of calcium and sulfur nutrients responsible for grain development [35].
In contrast, nitrogen is responsible for the straw yield, which was applied (as urea and DAP) equally in all plots. Based on our findings, we recommend using gypsum along with green manure and other carbon amendments for a better resource utilization and output. We also recommend using stubble/mulches to increase water permeability and prevent surface crusting and soil and water loss. The solubility of gypsum is slow; the effect is also evident for another year [61]. As such, any gypsum-based study should be conducted for at least two growing seasons.
5. Conclusions
It was hypothesized that gypsum aids in improving moisture conservation, nutrient uptake, and, eventually, the wheat grain yield; our results confirmed this hypothesis. Compared with the control treatment (T1), significant effects (p < 0.05) were observed for all of the gypsum doses (1, 3, and 4 Mg ha−1) for moisture conservation, nutrient absorption, and, ultimately, wheat production in the rainfed areas of Pakistan. At the surface and subsurface soil layers, maximum moisture (24% and 27%) was conserved through the 4 Mg ha−1 application. Overall, subsurface soil showed a higher moisture content than the surface profile. Compared with no gypsum application plot (T1), the grain yield of plots under the 3 and 4 Mg ha−1 gypsum application was 24% and 25% increased, respectively. No significant effect of gypsum doses on the straw yield was revealed in this study (p > 0.05), which might be due to the fact that calcium and sulfur are considered to improve the grain content rather than the straw yield. Overall, it was observed that out of four treatments, the T3 (3 Mg ha−1 gypsum application) was best suited for improving the crop yield and had the most advantageous input cost–benefit ratio. The current study has some limitations. First, (1) this study was based on only one growing season. Additionally, (2) the sodium content, which is the primary component of any soil crusting and moisture-based study, was not measured. Based on our assessment, we were able to provide some recommendations for the future. For soil amendment-based studies, (1) data should be collected for at least two growing seasons and (2) mulches along with gypsum should be used for a better conservation of soil, nutrients, and moisture.
Author Contributions
Conceptualization, F.A.; Methodology, F.A.; Software, F.A.; Validation, R.F.; Investigation, F.A.; Resources, T.S. and R.F.; Data curation, F.A.; Writing—original draft, F.A.; Writing—review & editing, F.A., R.F. and M.A.; Visualization, R.F.; Supervision, T.S.; Project administration, R.F. All authors have read and agreed to the published version of the manuscript.
Funding
This research was supported by the National Natural Science Foundation of China (42177299).
Institutional Review Board Statement
Not applicable.
Informed Consent Statement
Not applicable.
Data Availability Statement
Not applicable.
Conflicts of Interest
The authors declare no conflict of interest.
References
- Sumner, M.E.; Miller, W.P. Soil Crusting in Relation to Global Soil Degradation. Am. J. Altern. Agric. 1992, 7, 56–62. [Google Scholar] [CrossRef]
- Tongde, C.; Abbas, F.; Juying, J.; Ijaz, S.S.; Shoshan, A.; Ansar, M.; Hussain, Q.; Azad, M.N.; Ahmad, A. Investigation of Soil Erosion in Pothohar Plateau of Pakistan. Pak. J. Agric. Res. 2021, 34, 362–371. [Google Scholar] [CrossRef]
- GOP. Wheat: Economic Survey of Pakistan, 2014–2015. Ministry of Food, Agriculture and Livestock, Agriculture & Livestock Division (Economic Wing); Government of Pakistan: Islamabad, Pakistan, 2015. [Google Scholar]
- Abbas, F.; Zhu, Z.; An, S. Evaluating Aggregate Stability of Soils under Different Plant Species in Ziwuling Mountain Area Using Three Renowned Methods. Catena 2021, 207, 105616. [Google Scholar] [CrossRef]
- Fatima, B.; ul Hasan, F.; Choudhary, M.A. Cost Benefit/Effectiveness Analysis of Climate Change Adaptation in Potohar Region by Building Rainwater Harvesting Dams. In Proceedings of the 2019 Portland International Conference on Management of Engineering and Technology (PICMET), Portland, OR, USA, 25–29 August 2019; pp. 1–7. [Google Scholar]
- Siddiqui, S.; Safi, M.W.A.; Tariq, A.; Rehman, N.U.; Haider, S.W. GIS Based Universal Soil Erosion Estimation in District Chakwal Punjab, Pakistan. Int. J. Econ. Environ. Geol. 2020, 11, 30–36. [Google Scholar] [CrossRef]
- Rafique, E.; Rashid, A.; Ryan, J.; Bhatti, A.U. Zinc Deficiency in Rainfed Wheat in Pakistan: Magnitude, Spatial Variability, Management, and Plant Analysis Diagnostic Norms. Commun. Soil Sci. Plant Anal. 2006, 37, 181–197. [Google Scholar] [CrossRef]
- Zewd, I.; Siban, M. The Effects of Alkalinity on Physical and Chemical Properties of Soil. J. Plant Biol. Agric. Sci. 2021, 3, 1–5. [Google Scholar]
- Rengasamy, P.; Greene, R.; Ford, G.W.; Mehanni, A.H. Identification of Dispersive Behavior and the Management of Red-Brown Earths. Aust. J. Soil Res. 1984, 22, 413–431. [Google Scholar] [CrossRef]
- Sparks, D.L. Environmental Soil Chemistry: An Overview, 2nd ed.; Sparks, D.L., Ed.; Academic Press: Cambridge, MA, USA, 2003; pp. 1–42. ISBN 978-0-12-656446-4. [Google Scholar]
- Bello, S.K.; Alayafi, A.H.; AL-Solaimani, S.G.; Abo-Elyousr, K.A.M. Mitigating Soil Salinity Stress with Gypsum and Bio-Organic Amendments: A Review. Agronomy 2021, 11, 1735. [Google Scholar] [CrossRef]
- Liao, R.K.; Yang, P.L.; Ren, S.M.; Yi, H.; Zhou, B.; Zhou, Z. Effects of Typical Chemical Agents on Prevention of Non-Point-Source (NPS) Pollution in a Sloping Orchard. In Proceedings of the Advanced Materials Research; Trans Tech Publ: Schwyz, Switzerland, 2012; Volume 550, pp. 1168–1172. [Google Scholar]
- Fabrícia, A.; Ramos, S. Energia Ultrassônica Associada A Estabilidade De Agregados De Um Latossolo Sob Sistemas De Manejo; Revista Agrarian: Dourados, MS, Brasil, 2016. [Google Scholar]
- Kumar, A.; Saha, A. Effect of Polyacrylamide and Gypsum on Surface Runoff, Sediment Yield and Nutrient Losses from Steep Slopes. Agric. Water Manag. 2011, 98, 999–1004. [Google Scholar] [CrossRef]
- Schiavon, M.; Leinauer, B.; Serena, M.; Maier, B.; Sallenave, R. Plant Growth Regulator and Soil Surfactants’ Effects on Saline and Deficit Irrigated Warm-season Grasses: I. Turf Quality and Soil Moisture. Crop Sci. 2014, 54, 2815–2826. [Google Scholar] [CrossRef] [Green Version]
- Abdel-Fattah, M.K. Role of Gypsum and Compost in Reclaiming Saline-Sodic Soils. J. Agric. Vet. Sci. 2012, 1, 30–38. [Google Scholar] [CrossRef]
- Rehman, O.U.; Rashid, M.; Alvi, S.; Kausar, R.; Khalid, R.; Iqbal, T. Prospects of Using Gypsum to Conserve Water and Improve Wheat Yield in Rainfed Aridisols. Biol. Sci. PJSIR 2013, 56, 11–17. [Google Scholar] [CrossRef]
- Zhang, D.; Du, G.; Chen, D.; Shi, G.; Rao, W.; Li, X.; Jiang, Y.; Liu, S.; Wang, D. Effect of Elemental Sulfur and Gypsum Application on the Bioavailability and Redistribution of Cadmium during Rice Growth. Sci. Total Environ. 2019, 657, 1460–1467. [Google Scholar] [CrossRef] [PubMed]
- Fismes, J.; Vong, P.C.; Guckert, A.; Frossard, E. Influence of Sulfur on Apparent N-Use Efficiency, Yield and Quality of Oilseed Rape (Brassica napus L.) Grown on a Calcareous Soil. Eur. J. Agron. 2000, 12, 127–141. [Google Scholar] [CrossRef]
- Wu, R.; Boyd, C.E. Evaluation of Calcium Sulfate for Use in Aquaculture Ponds. Progress. Fish-Cult. 1990, 52, 26–31. [Google Scholar] [CrossRef]
- Amezketa, E.; Lafarga, R.A.; Pérez, P.; Bercero, A. Techniques for Controlling Soil Crusting and Its Effect on Corn Emergence and Production. Span. J. Agric. Res. 2003, 1, 101–110. [Google Scholar] [CrossRef] [Green Version]
- Pagliai, M.; Vignozzi, N.; Pellegrini, S. Soil Structure and the Effect of Management Practices. Soil Tillage Res. 2004, 79, 131–143. [Google Scholar] [CrossRef]
- Rashmi, I.; Mina, B.L.; Kuldeep, K.; Ali, S.; Kumar, A.; Kala, S.; Singh, R.K. Gypsum-an Inexpensive, Effective Sulphur Source with Multitude Impact on Oilseed Production and Soil Quality—A Review. Agric. Rev. 2018, 39, 218–225. [Google Scholar]
- Dale Ritchey, K.; Feldhake, C.M.; Clark, R.B.; De Sousa, D.M.G. Improved Water and Nutrient Uptake from Subsurface Layers of Gypsum-amended Soils. Agric. Util. Urban Ind. By-Prod. 1995, 58, 157–181. [Google Scholar]
- Rao, S.S.; Shaktawat, M.S. Response of Organic Manure, Phosphorus and Gypsum to Nutrient Content and Uptake by Groundnut (Arachis hypogaea L.). Agropedology 2005, 15, 100–106. [Google Scholar]
- Kiani, S.; Malakouti, M.J.; Tabatabaei, S.J.; Kafi, M. Influence of Different NH4+/NO3- Ratios and Calcium Levels on Growth, Nutrients Concentration, and Quality of Rose Flower. Iran. J. Soil Res. 2009, 23, 23–33. [Google Scholar] [CrossRef]
- Eckert, D.J.; Martins, A.P.; Vian, A.L.; Pesini, G.; Alves, L.A.; Flores, J.P.M.; Filippi, D.; Tiecher, T.L.; Fink, J.R.; Bredemeier, C.; et al. Single Superphosphate Replacing Agricultural Gypsum: Short-Term Effect on Grain Yield and Soil Chemical Properties in Subtropical Soils under No-Tillage. Arch. Agron. Soil Sci. 2022, 1–17. [Google Scholar] [CrossRef]
- Uddin, S.; Williams, S.W.; Aslam, N.; Fang, Y.; Parvin, S.; Rust, J.; van Zwieten, L.; Armstrong, R.; Tavakkoli, E. Ameliorating Alkaline Dispersive Subsoils with Organic Amendments: Are Productivity Responses Due to Nutrition or Improved Soil Structure? Plant Soil 2022, 480, 227–244. [Google Scholar] [CrossRef]
- Tavakkoli, E.; Uddin, S.; Rengasamy, P.; McDonald, G.K. Field Applications of Gypsum Reduce pH and Improve Soil C in Highly Alkaline Soils in Southern Australia’s Dryland Cropping Region. Soil Use Manag. 2022, 38, 466–477. [Google Scholar] [CrossRef]
- Agered, Y.E. Bimrew Sendekie Belay Effects of Gypsum and Filter Cake on Saline-Sodic Soil and Yield and Yield Components of Wheat (Triticum Aestivum) at Amibara Area, Central Rift Valley, Ethiopia. Ph.D. Thesis, Haramaya University, Haramaya, Ethiopia, 2022. Available online: http://publication.eiar.gov.et:8080/xmlui/handle/123456789/3699 (accessed on 31 January 2023).
- Abdul Qadir, A.; Murtaza, G.; Zia-ur-Rehman, M.; Waraich, E.A. Application of Gypsum or Sulfuric Acid Improves Physiological Traits and Nutritional Status of Rice in Calcareous Saline-Sodic Soils. J. Soil Sci. Plant Nutr. 2022, 22, 1846–1858. [Google Scholar] [CrossRef]
- Singh, Y.P.; Arora, S.; Mishra, V.K.; Bhardwaj, A.K. Regaining the Agricultural Potential of Sodic Soils and Improved Smallholder Food Security through Integration of Gypsum, Pressmud and Salt Tolerant Varieties. Agroecol. Sustain. Food Syst. 2022, 46, 410–431. [Google Scholar] [CrossRef]
- Jha, S.K.; Mishra, V.K.; Damodaran, T.; Singh, A.K.; Singh, Y.P.; Sharma, D.K. Does Conservation Tillage on Partially Reclaimed Sodic Soil Restore Land Degradation by Influencing Boron Dynamics, Bioavailability for Plant’s Uptake and Nutritional Security? Land Degrad. Dev. 2022, 33, 1260–1268. [Google Scholar] [CrossRef]
- Aboelsoud, H.M.; AbdelRahman, M.A.E.; Kheir, A.M.S.; Eid, M.S.M.; Ammar, K.A.; Khalifa, T.H.; Scopa, A. Quantitative Estimation of Saline-Soil Amelioration Using Remote-Sensing Indices in Arid Land for Better Management. Land 2022, 11, 1041. [Google Scholar] [CrossRef]
- Dawar, K.; Khalil, Z.; Mian, I.A.; Khan, B.; Ali, S.; Rahi, A.A.; Tahir, M.S.; Ahmed, N.; Fahad, S.; Danish, S. Effects of Farmyard Manure and Different Phosphorus Inorganic Fertilizer Application Rates on Wheat Cultivation in Phosphorus-Deficient Soil. Sustainability 2022, 14, 9030. [Google Scholar] [CrossRef]
- Shamim, A.H.M.; Khan, M.H.R.; Akae, T. The Effectiveness of Sulfidic Materials as a Source of Sulfur Fertilizer for the Production of Rice in Two Sulfur Deficient Soils. Sonklanakarin J. Sci. Technol. 2010, 32, 643. [Google Scholar]
- Asif, M.; Akbar, G.; Khan, S.H.; Islam, Z.; Kalwar, S.A. Effect of sowing methods on wheat production in Potohar, Pakistan. Pak. J. Agric. Agric. Eng. Vet. Sci 2019, 35, 98–104. [Google Scholar]
- Day, P.R. Particle Fractionation and Particle-size Analysis. Methods Soil Anal. Part 1 Phys. Mineral. Prop. Incl. Stat. Meas. Sampl. 1965, 9, 545–567. [Google Scholar]
- Walkley, A.; Black, I.A. An Examination of the Degtjareff Method for Determining Soil Organic Matter, and a Proposed Modification of the Chromic Acid Titration Method. Soil Sci. 1934, 37, 29–38. [Google Scholar] [CrossRef]
- Olsen, S.R. Estimation of Available Phosphorus in Soils by Extraction with Sodium Bicarbonate; US Department of Agriculture: Washington, DC, USA, 1954. [Google Scholar]
- Warncke, D.; Brown, J.R. Potassium and Other Basic Cations. In Recommended Chemical Soil Test Procedures for the North Central Region; Missouri Agricultural Experiment Station: Columbia, MO, USA, 2011; Volume 1001, pp. 31–33. [Google Scholar]
- Hart, M.G.R. A Turbidimetric Method for Determining Elemental Sulphur. Analyst 1961, 86, 472–475. [Google Scholar] [CrossRef]
- Barrows, H.L.; Simpson, E.C. An EDTA Method for the Direct Routine Determination of Calcium and Magnesium in Soils and Plant Tissue. Soil Sci. Soc. Am. J. 1962, 26, 443–445. [Google Scholar] [CrossRef]
- Bremner, J.M. Determination of Nitrogen in Soil by the Kjeldahl Method. J. Agric. Sci. 1960, 55, 11–33. [Google Scholar] [CrossRef]
- Sparks, D.L.; Page, A.L.; Helmke, P.A.; Loeppert, R.H. Methods of Soil Analysis, Part 3: Chemical Methods; John Wiley & Sons: Hoboken, NJ, USA, 2020; Volume 14, ISBN 0891188258. [Google Scholar]
- Corwin, D.L.; Rhoades, J.D. An Improved Technique for Determining Soil Electrical Conductivity-depth Relations from above-Ground Electromagnetic Measurements. Soil Sci. Soc. Am. J. 1982, 46, 517–520. [Google Scholar] [CrossRef]
- Thomas, G.W. Soil PH and Soil Acidity. Methods Soil Anal. Part 1996, 3, 475–490. [Google Scholar]
- Chapman, H.D.; Pratt, P.F. Methods of Analysis for Soils, Plants and Waters. Soil Sci. 1962, 93, 68. [Google Scholar] [CrossRef] [Green Version]
- Rashid, A. Mapping Zinc Fertility Of Soils Using Indicator Plants And Soil Analyses (Seed, Geostatistics, Hawaii, Colorado); University of Hawai’i: Manoa, HI, USA, 1986; ISBN 9798641510521. [Google Scholar]
- Winkleman, G.E.; Amin, R.; Rice, W.A.; Tahir, M.B. Methods Manual Soil Laboratory; BARD Project; PARC: Islamabad, Pakistan, 1990. [Google Scholar]
- Rahina, K.; Muhammad, I.A.; Muhammad, I.C.; Ayesha, M.; Abdur, R.Z.; Basharat, A. Soil Moisture Retention and Rainfed Wheat Yield Variations by the Addition of Gypsum and Green Manure. J. Soil Sci. Environ. Manag. 2020, 11, 6–16. [Google Scholar] [CrossRef]
- Qadir, M.; Steffens, D.; Yan, F.; Schubert, S. Sodium Removal from a Calcareous Saline–Sodic Soil through Leaching and Plant Uptake during Phytoremediation. Land Degrad. Dev. 2003, 14, 301–307. [Google Scholar] [CrossRef]
- Amezketa, E.; Aragües, R.; Carranza, R.; Urgel, B. Macro- and Micro-Aggregate Stability of Soils Determined by a Combination of Wet-Sieving and Laser-Ray Diffraction. Span. J. Agric. Res. 2003, 1, 83. [Google Scholar] [CrossRef] [Green Version]
- Borselli, L.; Biancalani, R.; Giordani, C.; Carnicelli, S.; Ferrari, G.A. Effect of Gypsum on Seedling Emergence in a Kaolinitic Crusting Soil. Soil Technol. 1996, 9, 71–81. [Google Scholar] [CrossRef]
- Almajmaie, A.; Hardie, M.; Acuna, T.; Birch, C. Can Soil Crusting Be Reduced through Application of Gypsum, Organic Waste, and Phosphoric Acid? J. Soil Water Conserv. 2017, 72, 597–606. [Google Scholar] [CrossRef]
- Morin, J.; van Winkel, J. The Effect of Raindrop Impact and Sheet Erosion on Infiltration Rate and Crust Formation. Soil Sci. Soc. Am. J. 1996, 60, 1223–1227. [Google Scholar] [CrossRef]
- Hamza, M.A.; Anderson, W.K. Soil Compaction in Cropping Systems: A Review of the Nature, Causes and Possible Solutions. Soil Tillage Res. 2005, 82, 121–145. [Google Scholar] [CrossRef]
- Singh, Y.P.; Singh, S.; Dubey, S.K. Frequency of Deep Tillage and Residual Sodium Carbonate Neutralization of Sodic Water on Soil Properties, Yield and Quality of Clusterbean and Wheat Grown in a Sequence. Agric. Res. 2013, 2, 367–374. [Google Scholar] [CrossRef] [Green Version]
- Hamza, M.A.; Anderson, W.K. Responses of Soil Properties and Grain Yields to Deep Ripping and Gypsum Application in a Compacted Loamy Sand Soil Contrasted with a Sandy Clay Loam Soil in Western Australia. Aust. J. Agric. Res. 2003, 54, 273–282. [Google Scholar] [CrossRef]
- Pema, K.G.; Nagabovanalli, P.B.; Prabhudev, D.; Shruthi; Lingappa, M.; Hamsa, N.; Shrenivas, A. Comparison of Slag-Based Gypsum with Commercial Gypsum as a Nutrient Source on Soil Properties, Nutrient Uptake and Yield of Rice (Oryza sativa L.) under Aerobic and Wetland Conditions. Arch. Agron. Soil Sci. 2022, 1–16. [Google Scholar] [CrossRef]
- Umair, A.; Nadeem, M.; Bashir, K.; Hussain, K.; Naseem, W. Response of Wheat to Gypsum Application at Farmers Fields in Rainfed Pothwar. Biol. Sci. PJSIR 2018, 61, 68–71. [Google Scholar] [CrossRef]
Figure 1.
Land cover map of the rainfed Pothohar region of Pakistan.

Figure 2.
Mean temperature and precipitation of the study site.

Figure 3.
Effect of gypsum treatments on moisture conservation from 105 to 221 days of gypsum application at (A) 0–25 cm and (B) 25–50 cm soil depth. The symbol (*) represents the significant difference among the different treatments at the p value < 0.05.
Figure 3.
Effect of gypsum treatments on moisture conservation from 105 to 221 days of gypsum application at (A) 0–25 cm and (B) 25–50 cm soil depth. The symbol (*) represents the significant difference among the different treatments at the p value < 0.05.

Figure 4.
Effect of gypsum treatments on the (A) soil pH and (B) soil electrical conductivity (EC). These values of soil pH and EC are for the soil with 0–15 cm of depth. Different lowercase letters indicated the significant difference between treatments at p < 0.05.
Figure 4.
Effect of gypsum treatments on the (A) soil pH and (B) soil electrical conductivity (EC). These values of soil pH and EC are for the soil with 0–15 cm of depth. Different lowercase letters indicated the significant difference between treatments at p < 0.05.

Figure 5.
Effect of gypsum treatments on the (A) grain yield and (B) straw yield. Different lowercase letters indicated the significant difference between treatments at p < 0.05.
Figure 5.
Effect of gypsum treatments on the (A) grain yield and (B) straw yield. Different lowercase letters indicated the significant difference between treatments at p < 0.05.


Table 1.
Physicochemical characteristics of soil pre-gypsum application.
| Soil Parameters | Unit | Value |
|---|---|---|
| Texture | Sandy clay loam | |
| pH | 7.89 + 0.05 | |
| EC | dS m−1 | 1.22 + 0.13 |
| Soil organic matter | % | 0.73 + 0.02 |
| Available phosphorus | mg kg−1 | 6.2 + 0.89 |
| Extractable potassium | ˶ | 103 + 4.5 |
| Sulphate sulfur | ˶ | 3.8 + 0.7 |
| Exchangeable calcium | ˶ | 563 + 17 |
| Nitrate nitrogen | ˶ | 5.2 + 0.7 |
Table 2.
Macronutrients uptake of plants affected by different gypsum application rates.
| Gypsum Rates (Mg ha−1) | Ca Uptake (kg ha−1) | S Uptake (kg ha−1) | N Uptake (kg ha−1) | P Uptake (kg ha−1) | K Uptake (kg ha−1) |
|---|---|---|---|---|---|
| 0 | 65.0 ± 1.32 d | 32.2 ± 0.21 d | 121.8 ± 3.50 c | 28.6 ± 1.62 c | 130.52 ± 2.40 d |
| 1 | 92.3 ± 2.53 c | 48.3 ± 0.90 c | 127.2 ± 5.93 c | 42.4 ± 0.91 b | 163.23 ± 7.69 c |
| 3 | 105.2 ± 1.36 b | 55.3 ± 0.63 b | 182.52 ±1.46 b | 58.2 ± 2.89 a | 181.19 ± 2.92 b |
| 4 | 112.3 ± 1.93 a | 60.2 ± 0.48 a | 189.40 ± 1.50 a | 42.5 ± 1.71 b | 202.21 ± 5.57 a |
| F value | 444.37 | 115.86 | 383.45 | 194.46 | 2330.24 |
Notes: Ca—plant calcium; S—plant sulfur; N—plant nitrogen; P—plant phosphorus; k—plant potassium. Letters (a–d) represents the significant difference between the nutrients uptake of soils under different gypsum application, at p < 0.05.
Disclaimer/Publisher’s Note: The statements, opinions and data contained in all publications are solely those of the individual author(s) and contributor(s) and not of MDPI and/or the editor(s). MDPI and/or the editor(s) disclaim responsibility for any injury to people or property resulting from any ideas, methods, instructions or products referred to in the content. |
© 2023 by the authors. Licensee MDPI, Basel, Switzerland. This article is an open access article distributed under the terms and conditions of the Creative Commons Attribution (CC BY) license (https://creativecommons.org/licenses/by/4.0/).
Share and Cite
MDPI and ACS Style
Abbas, F.; Siddique, T.; Fan, R.; Azeem, M. Role of Gypsum in Conserving Soil Moisture Macronutrients Uptake and Improving Wheat Yield in the Rainfed Area. Water 2023, 15, 1011. https://doi.org/10.3390/w15061011
AMA Style
Abbas F, Siddique T, Fan R, Azeem M. Role of Gypsum in Conserving Soil Moisture Macronutrients Uptake and Improving Wheat Yield in the Rainfed Area. Water. 2023; 15(6):1011. https://doi.org/10.3390/w15061011
Chicago/Turabian StyleAbbas, Fakher, Tariq Siddique, Ruqin Fan, and Muhammad Azeem. 2023. "Role of Gypsum in Conserving Soil Moisture Macronutrients Uptake and Improving Wheat Yield in the Rainfed Area" Water 15, no. 6: 1011. https://doi.org/10.3390/w15061011
Note that from the first issue of 2016, this journal uses article numbers instead of page numbers. See further details here.