

Estimation of Lake Storage Based on the Surrounding Topography around the Lake from the SRTM DEM

School of Geo-Science and Technology, Zhengzhou University, Zhengzhou 450001, China
*
Author to whom correspondence should be addressed.
Water 2023, 15(6), 1015; https://doi.org/10.3390/w15061015
Submission received: 28 December 2022
/
Revised: 3 March 2023
/
Accepted: 6 March 2023
/
Published: 7 March 2023
(This article belongs to the Special Issue Limnology under Climate-Driven Regime Shifts: Impacts on Water Balance, Dynamics, Physico-Chemical Properties and Ecology)
Abstract
:The estimation of lake depth and water storage is crucial for water resource management in inland waters. In previous studies, lake water storage estimation required in situ bathymetry data; however, the high cost of fieldwork prevented the extension of this method to all lakes. This study aims to solve this problem by studying how to estimate lake water storage without using bathymetric data. According to the similarity between the topography surrounding the lake and the underwater topography, we present an approach to estimate the lake water storage. The principle of the method is to extend the surrounding terrain into the underwater area to establish an underwater model. In this study, six lakes of the Tibetan Plateau were selected, and the results showed that the average R2 between the estimated and measured water depths of the six lakes was about 0.76. Among them, the estimated water depth of Taiyang Lake (maximum depth of 61.57 m) had the largest deviation from the measured water depth, with an RMSE (root mean square error) of 19.77 m, while the estimated water depth of Bangda Co (maximum depth of 41.04 m) had the best result, with an RMSE of 7.83 m. The relative errors of all water storage estimations were less than 20%. The lake with the best accuracy was Zigetang Co (measured water storage of 39.6 Gt), and the estimated water storage was 42.2 Gt, with a relative error of 6.57%. The lake with the worst accuracy was Taiyang Lake (measured water storage of 31.94 Gt), and the estimated water storage was 36.47 Gt, with a relative error of 14.18%. This study provides an effective method for lake depth estimation and improves the ability to monitor changes in lake storage, especially for lakes with harsh environments or in remote areas.
1. Introduction
Lakes account for 87% of the world’s fresh water and are an important water resource, as well as part of the water cycle [1,2]. As sentinels of climate change, lakes have the function of regulating river runoff, providing water, and improving the regional ecological environment [3,4]. As components of the hydrosphere, lakes can respond to changing regional climate conditions [5]. Since 2000, the global lake has shown obvious spatial heterogeneity, with more than 70% of lake levels rising [6]. Large-scale rising water levels were exhibited in the Tibetan Plateau, the Amazon River basin, and high-latitude regions of the northern hemisphere. At the same time, large-scale water levels in California, Southeast Asia, and eastern South America have declined [7]. One area where lakes have experienced rapid changes in recent decades is the Tibetan Plateau [8]. Due to glacier melting, precipitation enhancement, and the rise in global temperatures, the total area of lakes in the Tibetan Plateau was 4.1 × 10⁴ km2 in 2000 to 5.0 × 10⁴ km2 in 2018. The total lake area has increased by about 23% [8,9]. Accurate estimation of lake bathymetry and water storage can provide an understanding of the balance between rainfall and evaporation, as well as the interaction between surface water and groundwater [10,11], and can provide an important basis for hydrodynamic modeling [12] and water quality assessment [13].
As the main parameter of lake morphometry, lake depth determines the water storage capacity of a lake [14,15]. The traditional method of measuring the underwater topography of lakes is to use sonar sensors installed on board for bathymetry, but this method is so costly that it is impossible to cover all lakes [16]. The Tibetan Plateau region has many lakes, but their remote location and harsh climate make large-scale lake bathymetry difficult to achieve [17]. Airborne lidar is a method that uses a laser to penetrate water bodies for bathymetry [18]. Still, the disadvantage of this method is that the limitation of water turbidity makes the maximum measured depth only two to three times the Secchi depth [19], making airborne lidar measurements only possible in medium-depth lakes and shallow waters such as rivers [20]. Recently, a study has been proposed that would combine remote sensing images and altimetric satellite data to estimate lake depth [21,22]. This method corresponds to the water area extracted from a long time series of remote sensing images to the elevation measured by elevation satellites. Lake depth can be deduced from the relationship between area and elevation [23,24]. However, this method is more applicable to medium depth lakes, and it is difficult to obtain satisfactory results for deeper lakes.
Some modeling approaches have been proposed to overcome this difficulty by estimating the lake’s water depth based on the exposed topography around the lake [25,26]. The similarity of the volume–area relationship was exploited to simulate the rise and fall of lake levels by selecting river valleys similar to lakes as virtual reservoirs [27]. However, lake morphology varies, and it is nearly impossible to identify similar river valleys for all lakes. Other studies calculated the average depth of the lake by analyzing the relationship between lake depth and topographic information (slope, slope direction, etc.). Global lakes with a surface area of at least 10 ha were estimated based on the average depth and area [27]. This method is suitable for large-scale bathymetry estimation, but the model results are poorly suited to ensuring good continuity, and fail to consider the possible local deviations for individual lakes. To deal with the shortcomings of this method, Zhu et al. developed a water recession method (WRM) to overcome the problem of complex topographic discontinuities at lake boundaries [28]. As for a single lake, the linear extrapolation of the slope of the surrounding terrain follows a simple method, where the underwater topography is determined by the intersection of all extrapolation lines of the lake, and then the accuracy is improved by combining the altimetric data with water level and area data [29,30]. However, this method has not been proven to be suitable for all lakes and cannot provide an estimated lake depth [31]. Recent studies have developed two methods, the skeleton-based interpolation method and the machine learning method, to estimate lake bathymetry using a small amount of measured data combined with the topography around the lake [32], which can effectively estimate the lake bathymetry results. In summary, most methods require a large amount of satellite data or measured data when predicting lake bathymetry using the topography around the lake [33,34], and few methods can estimate lake bathymetry without measured data or using only a small amount of data. In general, most bathymetric estimation methods require large amounts of satellite data or measured data, while for the remaining methods that do not use measured data, it is difficult to provide accurate bathymetric estimates. Therefore, a new method for estimating lake bathymetry needs to be proposed that enables the modeling of underwater lake topography, even without measurement data.
In this study, we aim to propose a method for estimating lake depth and water storage using only topographic data around the lake instead of measured data. The advantage of this method over other methods is that it can provide a complete underwater terrain model. This method can reduce the cost of field survey lakes, especially in remote areas and harsh environments such as the Tibetan Plateau. In this study, six lakes on the Tibetan Plateau for which measured data were available were selected to evaluate the performance of our developed method. The accuracy of water depth and water storage predictions was evaluated, and the influence of different model parameters on the prediction accuracy was analyzed.
2. Study Sites and Datasets
2.1. Study Sites
There are about 1600 lakes larger than 1 km2 on the Tibetan Plateau, covering a total area of about 5 × 10⁴ km2 [35]. Due to the region’s sparsely populated and harsh environment, bathymetric data for most lakes are lacking, making it difficult to obtain information on the water storage of lakes on a large scale. In this study, six lakes with available bathymetric data on the Tibetan Plateau were selected, and bathymetric data were obtained from field measurements by shipborne bathymetric instruments. Basic information about the six lakes is shown in Table 1. The areas of these lakes ranged from 78.77 km2 to 479.63 km2, and the maximum water depths ranged from 41.04 m to 151.35 m.
2.2. Data Source
In this study, in situ bathymetry data were applied to verify the accuracy of this method. Considering that the method is applicable to lakes with regular shapes, six lakes with regular shapes and in situ bathymetry data were selected as the subjects of this study. Bathymetric data were converted into contour lines to obtain underwater topographic maps of the lakes. Figure 1 shows the approximate locations and basic shapes of the six lakes, which were mainly located in the northwestern and southern regions of the Tibetan Plateau and varied in shape from gourd-shaped and elliptical to long, narrow, and irregular.
In addition to the measured bathymetry data, DEM (Digital Elevation Model) data on the exposed topography surrounding the lake were deployed to extract lake level data and spatial prediction. Among all the open-access DEMs, SRTM DEM (Shuttle Radar Topography Mission Digital Elevation Model) was chosen owing to its two advantages [36]. Firstly, most of the Tibetan Plateau lakes expanded rapidly after 2000, and the SRTM DEM produced in February 2000 shows more of the area around the lakes. Secondly, SRTM DEM has been proven to have a low error rate and few cavity areas in the Tibetan Plateau region [37,38].
3. Methodology
3.1. Basic Principle
The developed method for estimating the lake bathymetry in this study was based on the assumption that the underwater topography of a lake is an extension of the surrounding topography [39]. When the lake level rises, the exposed areas around the lake’s shoreline are transformed into underwater areas; conversely, when the lake level decreases, the underwater areas around the lake’s shoreline are transformed into exposed areas. Therefore, the topographic parameters of the exposed areas around the lake can be used to predict the underwater topography of the lake. However, modern lakes have accumulated sediment at the bottom of the lake due to years of sedimentation, which gives most modern lakes a bowl structure [40], and the uncertainty of the sediment layer’s thickness makes it very difficult to estimate the water depth. The question of how to solve the influence of sediment layers on lake depth estimation still poses a challenge, especially for deep lakes. In this study, for the sake of model simplicity, we have assumed a low importance of sedimentation in the considered lakes compared to general morphometry, so sedimentation was neglected as a factor for lake depth.
This study aims to determine the underwater topography without using bathymetric data. A method was designed to estimate the lake water depth and storage using the surrounding topography. The principle of this method is to estimate the lake depth based on the continuity between the underwater areas of the lake and the surrounding exposed areas. The detailed steps of this method are described below.
3.2. Specific Steps
The underwater topography modeling approach is based on extending the topographic information of the area around the lake to the underwater areas of the lake. In previous studies, lake interpolation and extrapolation have been used to estimate lake depth [41]. The method consists of the following three steps.
3.2.1. Step 1: Estimate the Maximum Water Depth of the Lake
The first step is to estimate the maximum water depth of the lake to provide constraints for predicting the depth of the lake. The principle of this step is to assume that the underwater area of the lake is a regular lake basin, such as a conical lake basin or a cup-shaped lake basin, where the underwater topography of the lake could be considered as a continuation of the topography above the lake surface. Therefore, by constructing a functional relationship between the elevation above the water surface and the area of the lake, the functional relationship between the water depth below the water surface and the corresponding water surface area can be deduced. Firstly, SRTM DEM was used to extract lake level data for the year 2000, as well as to calculate the plane elevation corresponding to each 1 m of elevation between the 2000 water surface elevation and 5 m above the water level. Then, the function equation of area versus elevation was deduced. Only two cases, a conical lake basin and a cup-shaped lake basin, were considered in this study, and the maximum depth was calculated by substituting the area as zero into the equation. According to the calculation results for the six lakes, the relevance between the plane area and the elevation gradually decreases in the area of 5 m above the lake surface, which leads to the estimated maximum depth of the lake being smaller than the measured value (R2 < 0.8), so an area of 5 m above the lake’s surface was selected as the limit in this study. The following equation is the functional relationship between the elevation above the lake surface and the area, using Longmu Co as an example, and the relationship is strongly linear (R2 = 0.999).
where is the area in km2 and is the elevation in m. The results of the maximum water depth estimation of the six lakes are shown in Table 2. The results show that this method could roughly estimate the maximum depth of the lake. The relative error between the estimated maximum and measured water depth is about 10%.
3.2.2. Step 2: Selection of Underwater Interpolation Routes for Lakes
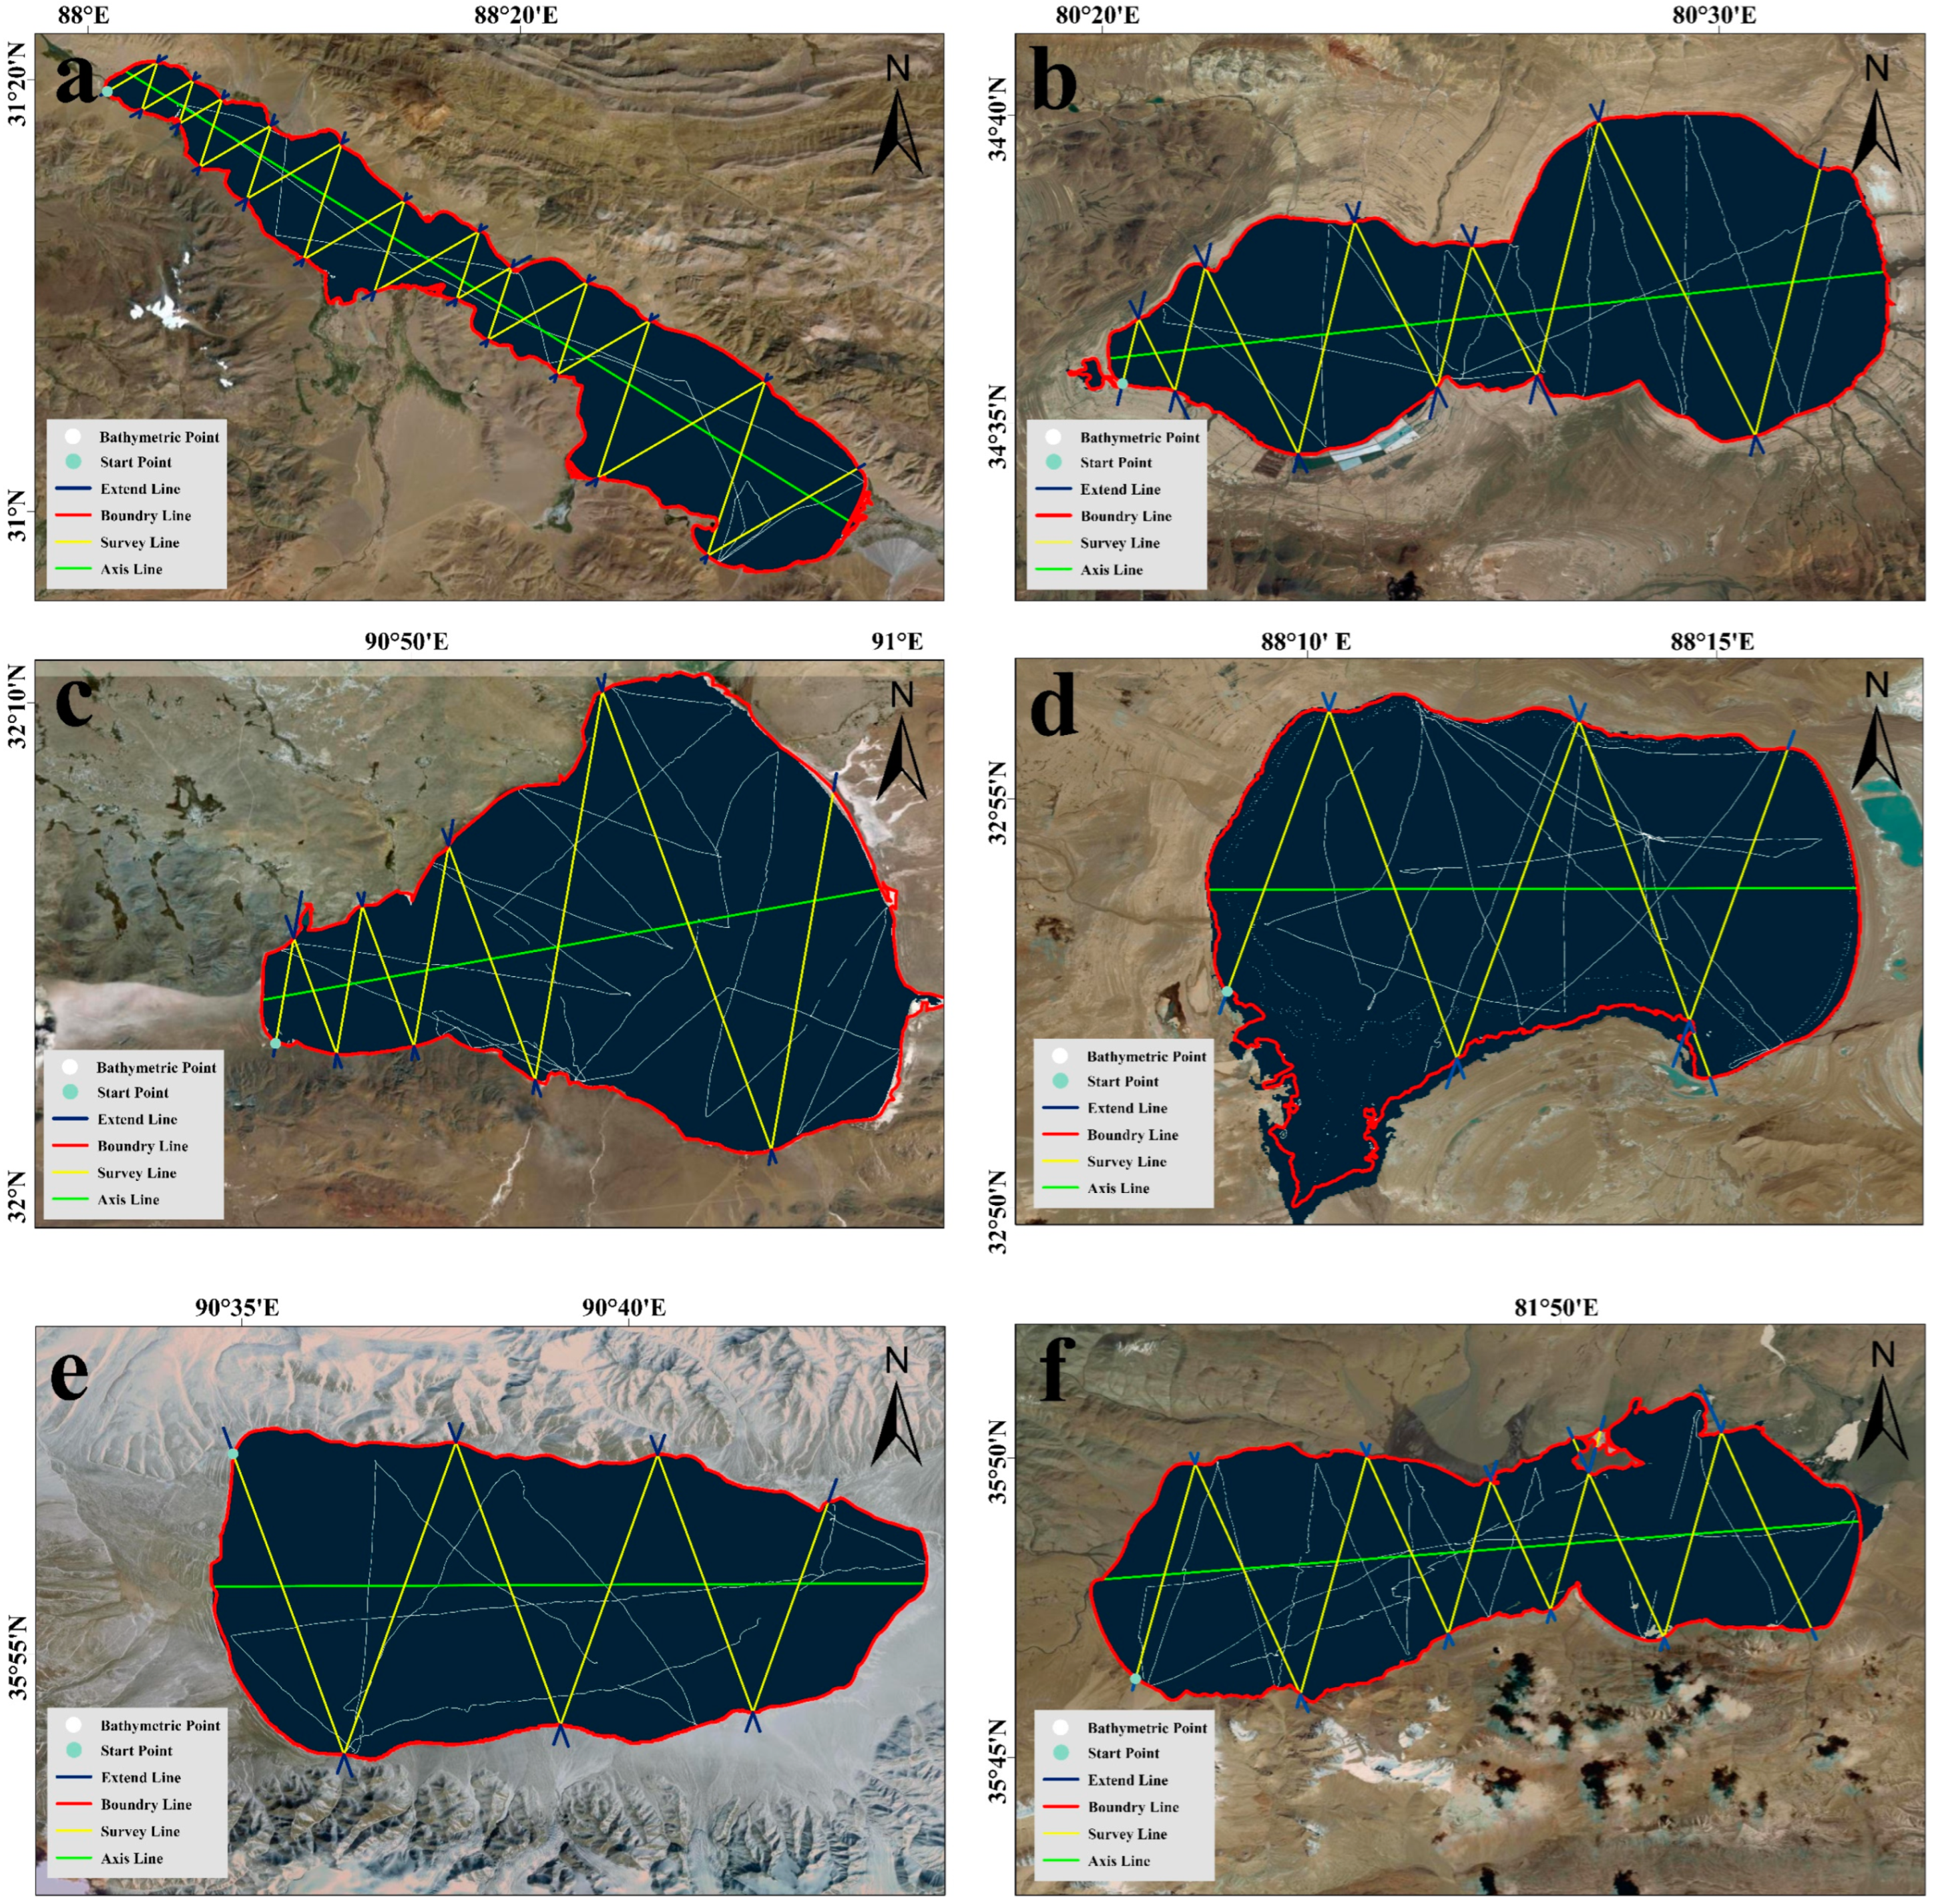
The second step is to determine the underwater interpolation route based on the geometric features of the lake. Firstly, a centerline was established across the lake’s main axis according to the lake’s shape, and the endpoints of the centerline were used to locate the initial position of the interpolation route. From the initial point, the interpolation route was extended at an angle towards the lakeshore until it intersected it, then reversed to continue in a zigzag pattern, repeating until it could no longer continue. Finally, all interpolation routes were extended to both sides until they intersected the buffer boundary. Compared to the dense survey routes used in previous studies, this method relies on the continuity between the shore area and the underwater area to estimate the depth of the survey routes, so there is no need to use instruments in the field to obtain bathymetric data, which results in significant cost savings. This method involves two parameters: the fixed inclination angle and the buffer size. The fixed inclination was initially set to 40°, and the buffer size was set to 500 m in this study. The initial points, centerlines, interpolation route locations, and measured bathymetry data for the six lake interpolation routes are shown in Figure 2.
3.2.3. Step 3: Estimation of the Water Depth at the Underwater Interpolation Route Pixel Point
The third step is to estimate the depth of the pixel points within the lake area. We assumed that the underwater topography of the lake consists of a conical lake basin or a cup-shaped lake basin, so the polynomial of the pixels was established to calculate the depth of the pixel points within the lake area based on the elevation of the pixel within the buffer zone. Due to the interpolation line being tilted at a certain angle from the centerline, the number of pixels on the extension line in the buffer zone on either side of the lake could not be made consistent. To solve this problem, the extra pixels were removed until the number of pixels on either side was equal. However, this method is easily affected by the slope of the surrounding area, and the slope discontinuity may cause the estimated pixel depth to be much higher than the measured depth. The predicted values exceeding the maximum water depth of the lake were truncated when estimating the water depth of pixel points in the inundation area. Meanwhile, the error was reduced by eliminating the pixel points more than 100 m above the lake surface.
3.3. Evaluation Indicators
After obtaining the elevations of all underwater interpolated pixel points, the underwater DEM of the lake was constructed by a topography-to-raster interpolation method in combination with the elevations of the lake boundary points. The measured bathymetry data were used to verify the accuracy of the method in estimating the lake bathymetry, and 1000 bathymetry points were randomly selected as the validation data. The mean absolute error (MAE) and root mean square error (RMSE) were selected to assess the accuracy of the bathymetry estimation. In addition to assessing the bathymetry estimation, the relative percentage error was also selected as an indicator to assess the estimated total lake storage accuracy, which was defined as the bias between the storage obtained from the measured and estimated water depths.
where n is the number of sampling points, x is the estimated bathymetry value, and y is the measured elevation value.
4. Results and Discussions
4.1. Evaluate the Accuracy of Lake Bathymetry and Storage Estimation
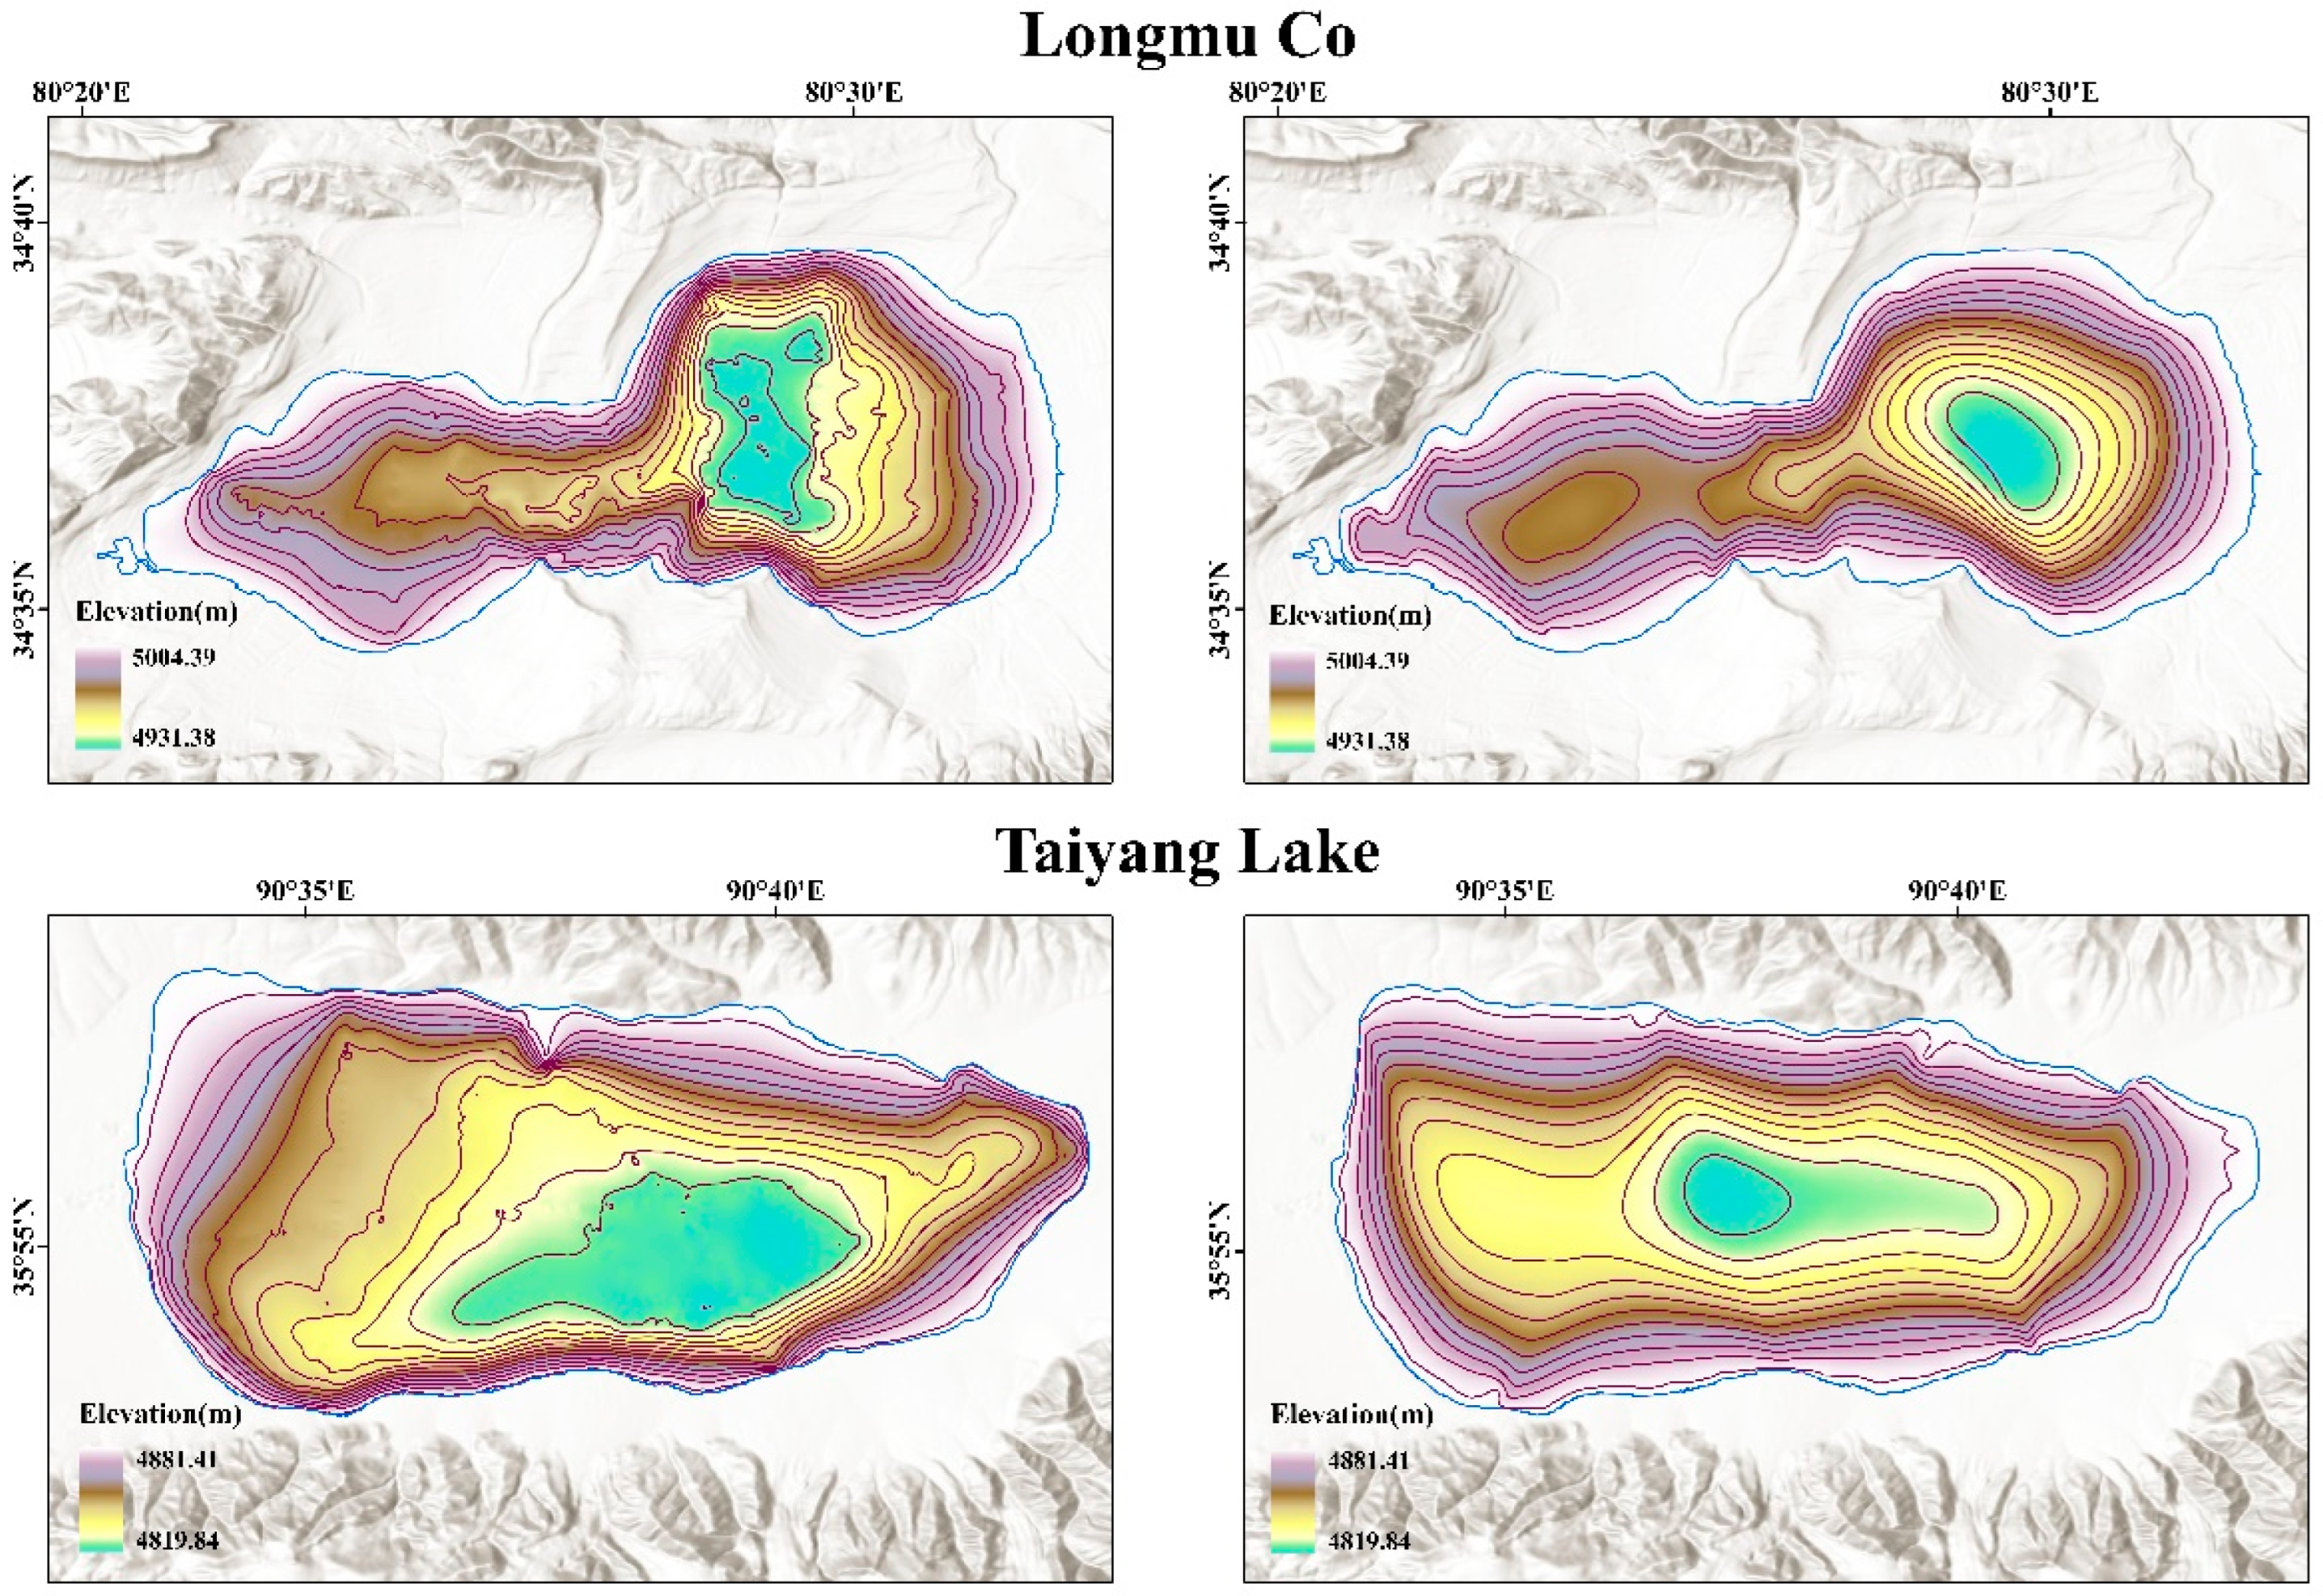
The accuracies of the estimated lake bathymetry were evaluated by our developed method in this section. We selected Longmu Co and Taiyang Lake, which are representative of the six lakes, to analyze the differences between the estimated water depth data and the measured water depth data (Figure 3). As this method predicted the depth of the underwater pixels using polynomials, the underwater terrain constructed from the estimated water depth data was smoother than the measured terrain, and the estimated underwater terrain lacked some details. Between the two lakes, the estimated underwater terrain of Longmu Co was closer to the measured terrain, and most of the estimated bathymetry results of other lakes were similar to Longmu Co. Two lakes, however, were exceptions: Taiyang Lake and Zigetang Co. Their estimated underwater topographies differed significantly from the measured topography. This can be mainly attributed to the fact that the polynomial fitting used in this method was unable to fully consider the complexity of the measured terrain. The choice of interpolation route for this study was determined by the inclination and did not consider the influence of the surrounding topography on the estimation.
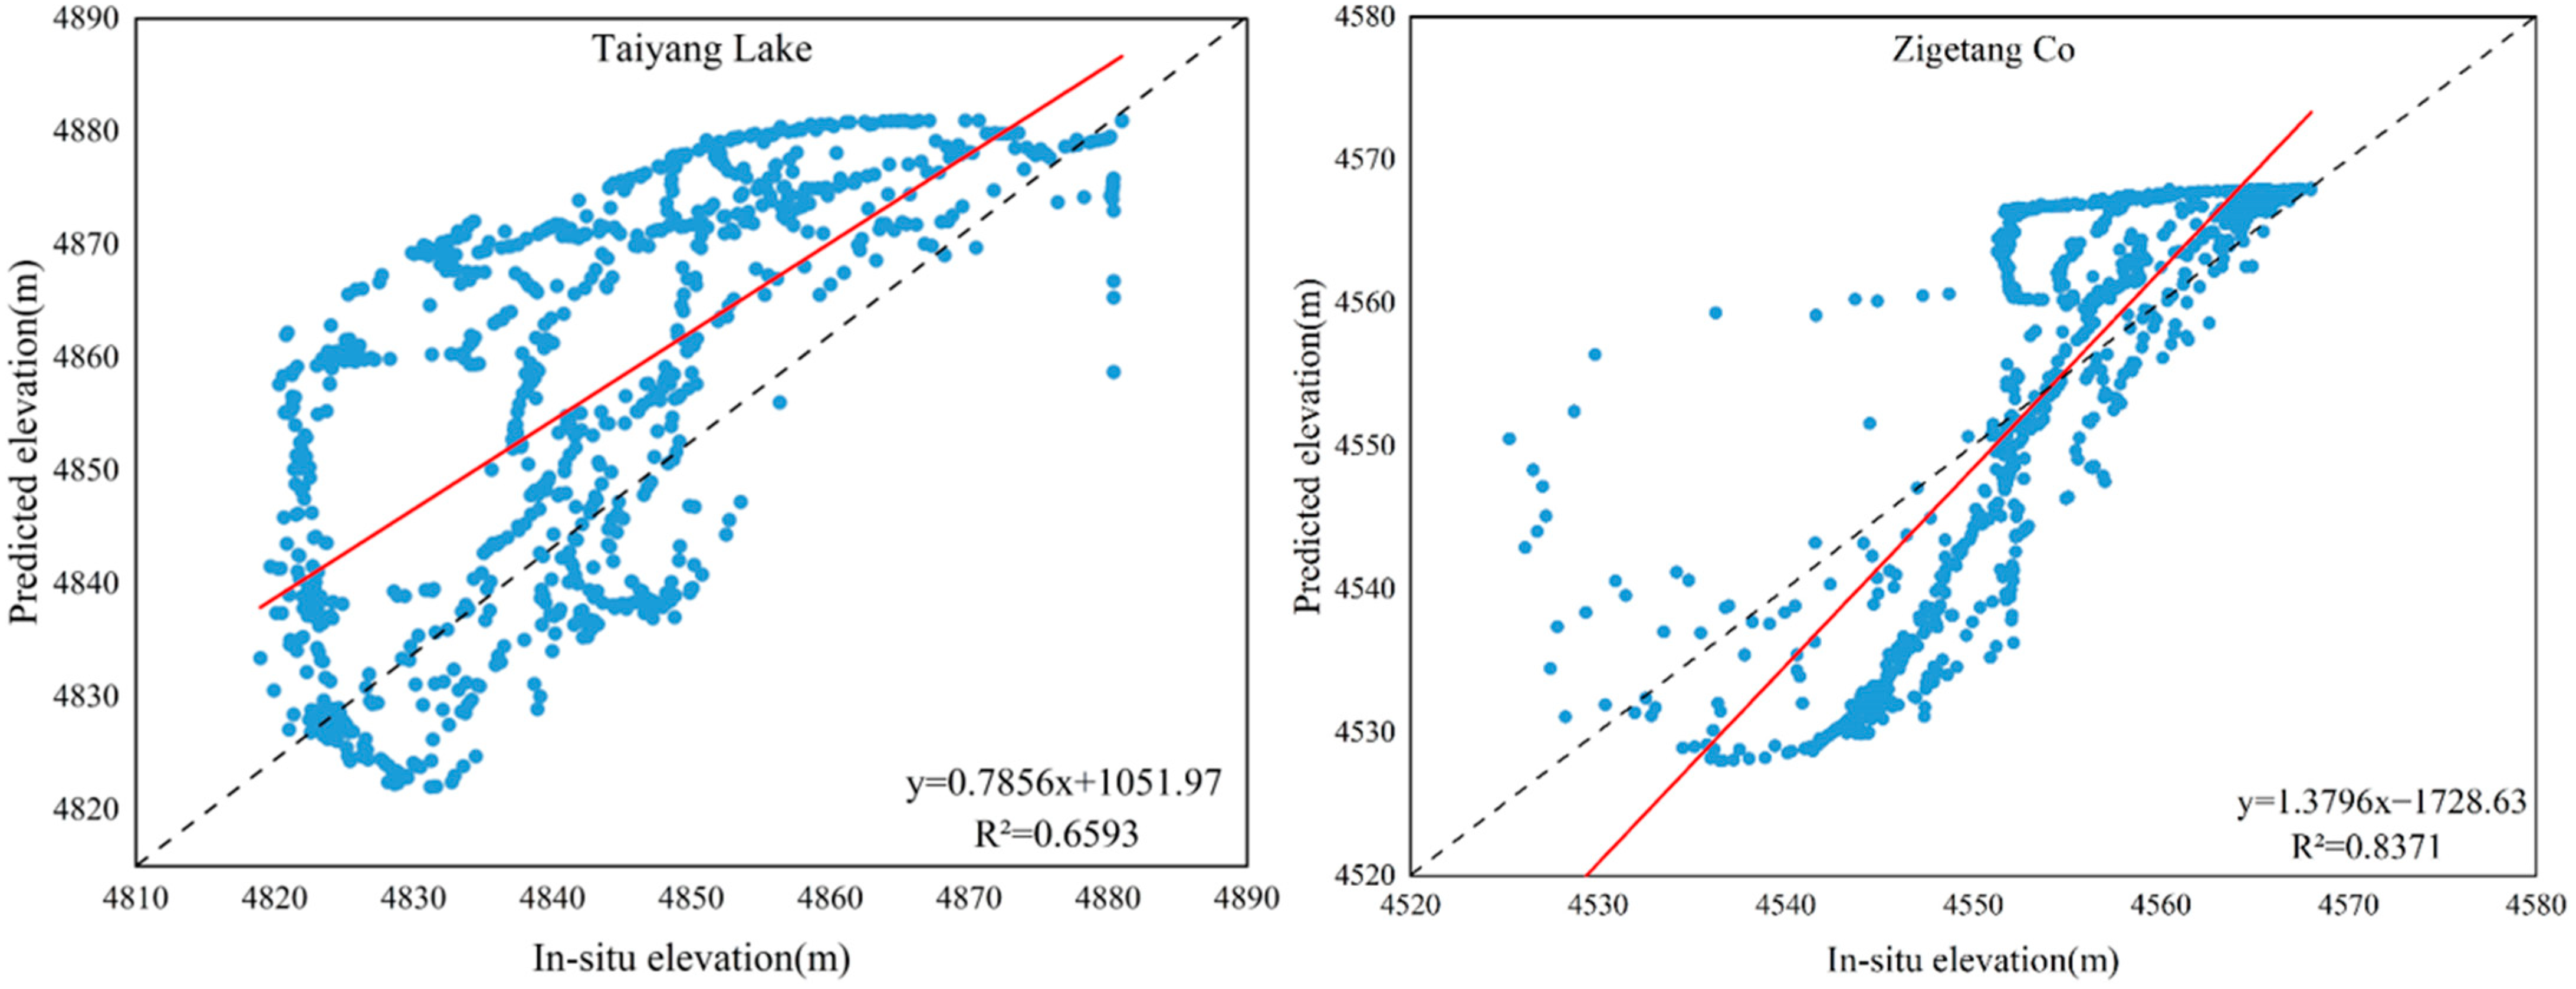
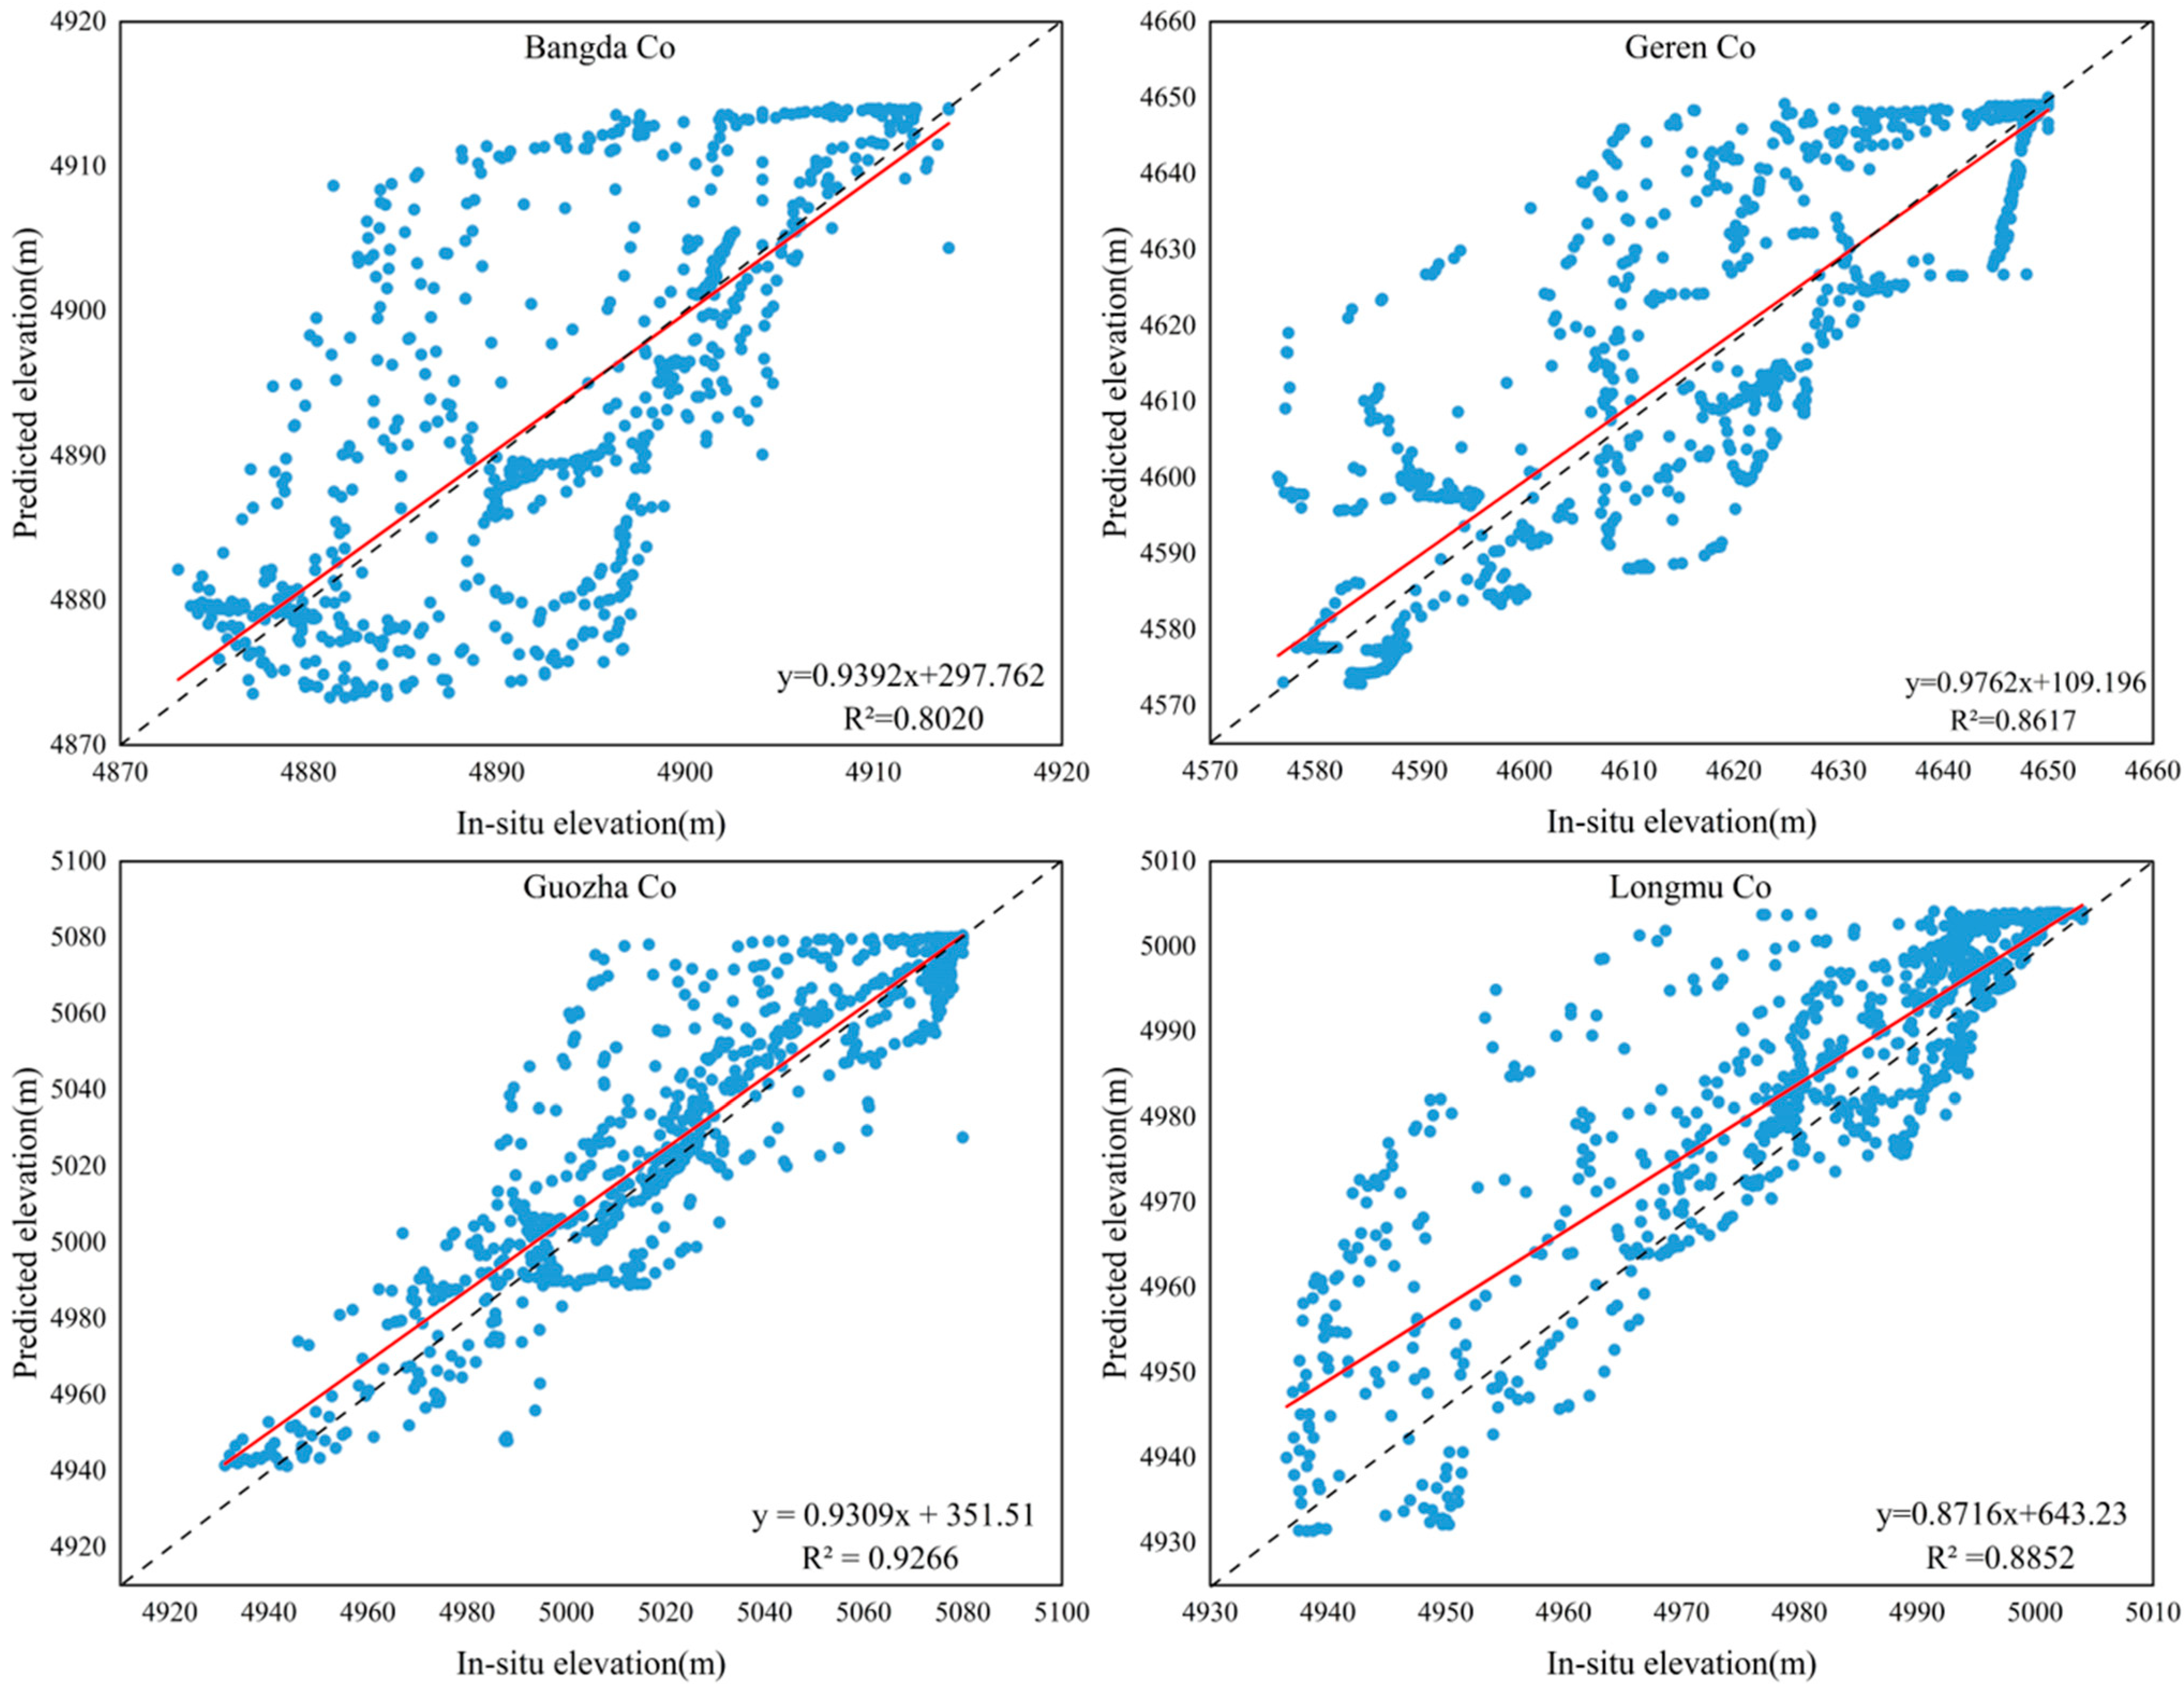
Linear regression was used to further analyze the deviation between the measured and estimated water depth. The formula in the lower right corner of the figure is the linear regression equation of the in situ elevation and the predicted elevation (Figure 4). In this study, 1000 sample points were randomly selected for analysis of the linear relationship between the measured water depth and the estimated water depth in order to judge the accuracy of prediction results. Due to the influence of excessive slope near the lakeshore, the estimated water depth of Taiyang Lake deviated greatly from the prediction; the R2 values of the other five lakes were all greater than 0.8; and the R2 of Guozha Co, with the highest correlation, even reached 0.93. The measured water depth showed a correlation with the estimated water depth. The deviation between the two is mainly reflected in the fact that the estimated water depth was, at some points, greater than the measured depth, especially near the deepest part of the lake.
The MAE and RMSE values of the estimated water depth of the six lakes were calculated to evaluate the accuracy of the predicted results (Table 3). Generally speaking, regarding water depth estimation, the MAE and RMSE values of Taiyang Lake reached 16.17 m and 19.77 m, which were the worst among the six lakes. The estimated water depths of the other five lakes were in good agreement with the measured water depths, among which the MAE and RMSE values of Longmu Co, Zigetang Co, and Bangda Co were all less than 10 m. The MAE and RMSE values of the other two lakes, Geren Co and Guozha Co, fell between 10 and 16 m. By comparing the maximum water depth, MAE, and RMSE values of the lakes, it was found that the accuracy of water depth estimation of the lakes was inversely proportional to the maximum water depth of the lakes. This may be due to the slope of the underwater terrain gradually becoming less correlated with the slope of the area around the lake as the depth increases. For example, the maximum water depth of Guozha Co is more than 140 m, the deepest among the six lakes; its MAE and RMSE values are the highest; and the water depth estimation results were the worst, except for Taiyang Lake. The complex configuration of the underwater terrain and years of sedimentation have caused the estimated water depths in the deeper areas to vary considerably from the measured water depths. In contrast, for other lakes, such as Longmu Co and Bangda Co, the water depth estimation accuracy for the two lakes was relatively high, with MAE and RMSE values both within 10 m. The measured water depth method based on the underwater route proposed in this paper is more applicable to naturally occurring lakes with smooth slopes and regular shapes. The applicability is difficult to judge for other specially formed lakes, such as glacial lakes.
In addition, the accuracy and applicability of this method in the estimation of lake water storage were evaluated by using the relative error between the estimated and measured water storage. As shown in Table 3, the relative errors in estimated water storage of the six lakes were all less than 20%, among which the relative error of Zigetang Co was the minimum of 6.57%, and that of Taiyang Lake was the maximum of 14.18%. The estimation accuracy of lakes with small water storage capacities was generally higher. The relative error of Geren Co and Guozha Co, which have greater overall water storage, can also be kept within 15%. Through the analysis of the relationship between the measured water storage and the relative error, it can be seen that the relative error increases with the increase in the measured water storage; this is consistent with the results of the estimated bathymetry. In contrast to the previous conclusions, despite the increase in the relative error, the relative error of the estimation of Geren Co, which has the largest measured water storage, remained within 15%. This indicates that even for some lakes with high water storage, this method can provide acceptable underwater topography models. This method is suitable for medium-depth lakes with regular shapes, das the underwater topography of medium-depth lakes has better continuity with the surrounding terrain, and the estimated depth is in better agreement with the measured depth.
4.2. Influence of Different Parameters on the Accuracy of Bathymetry Estimation
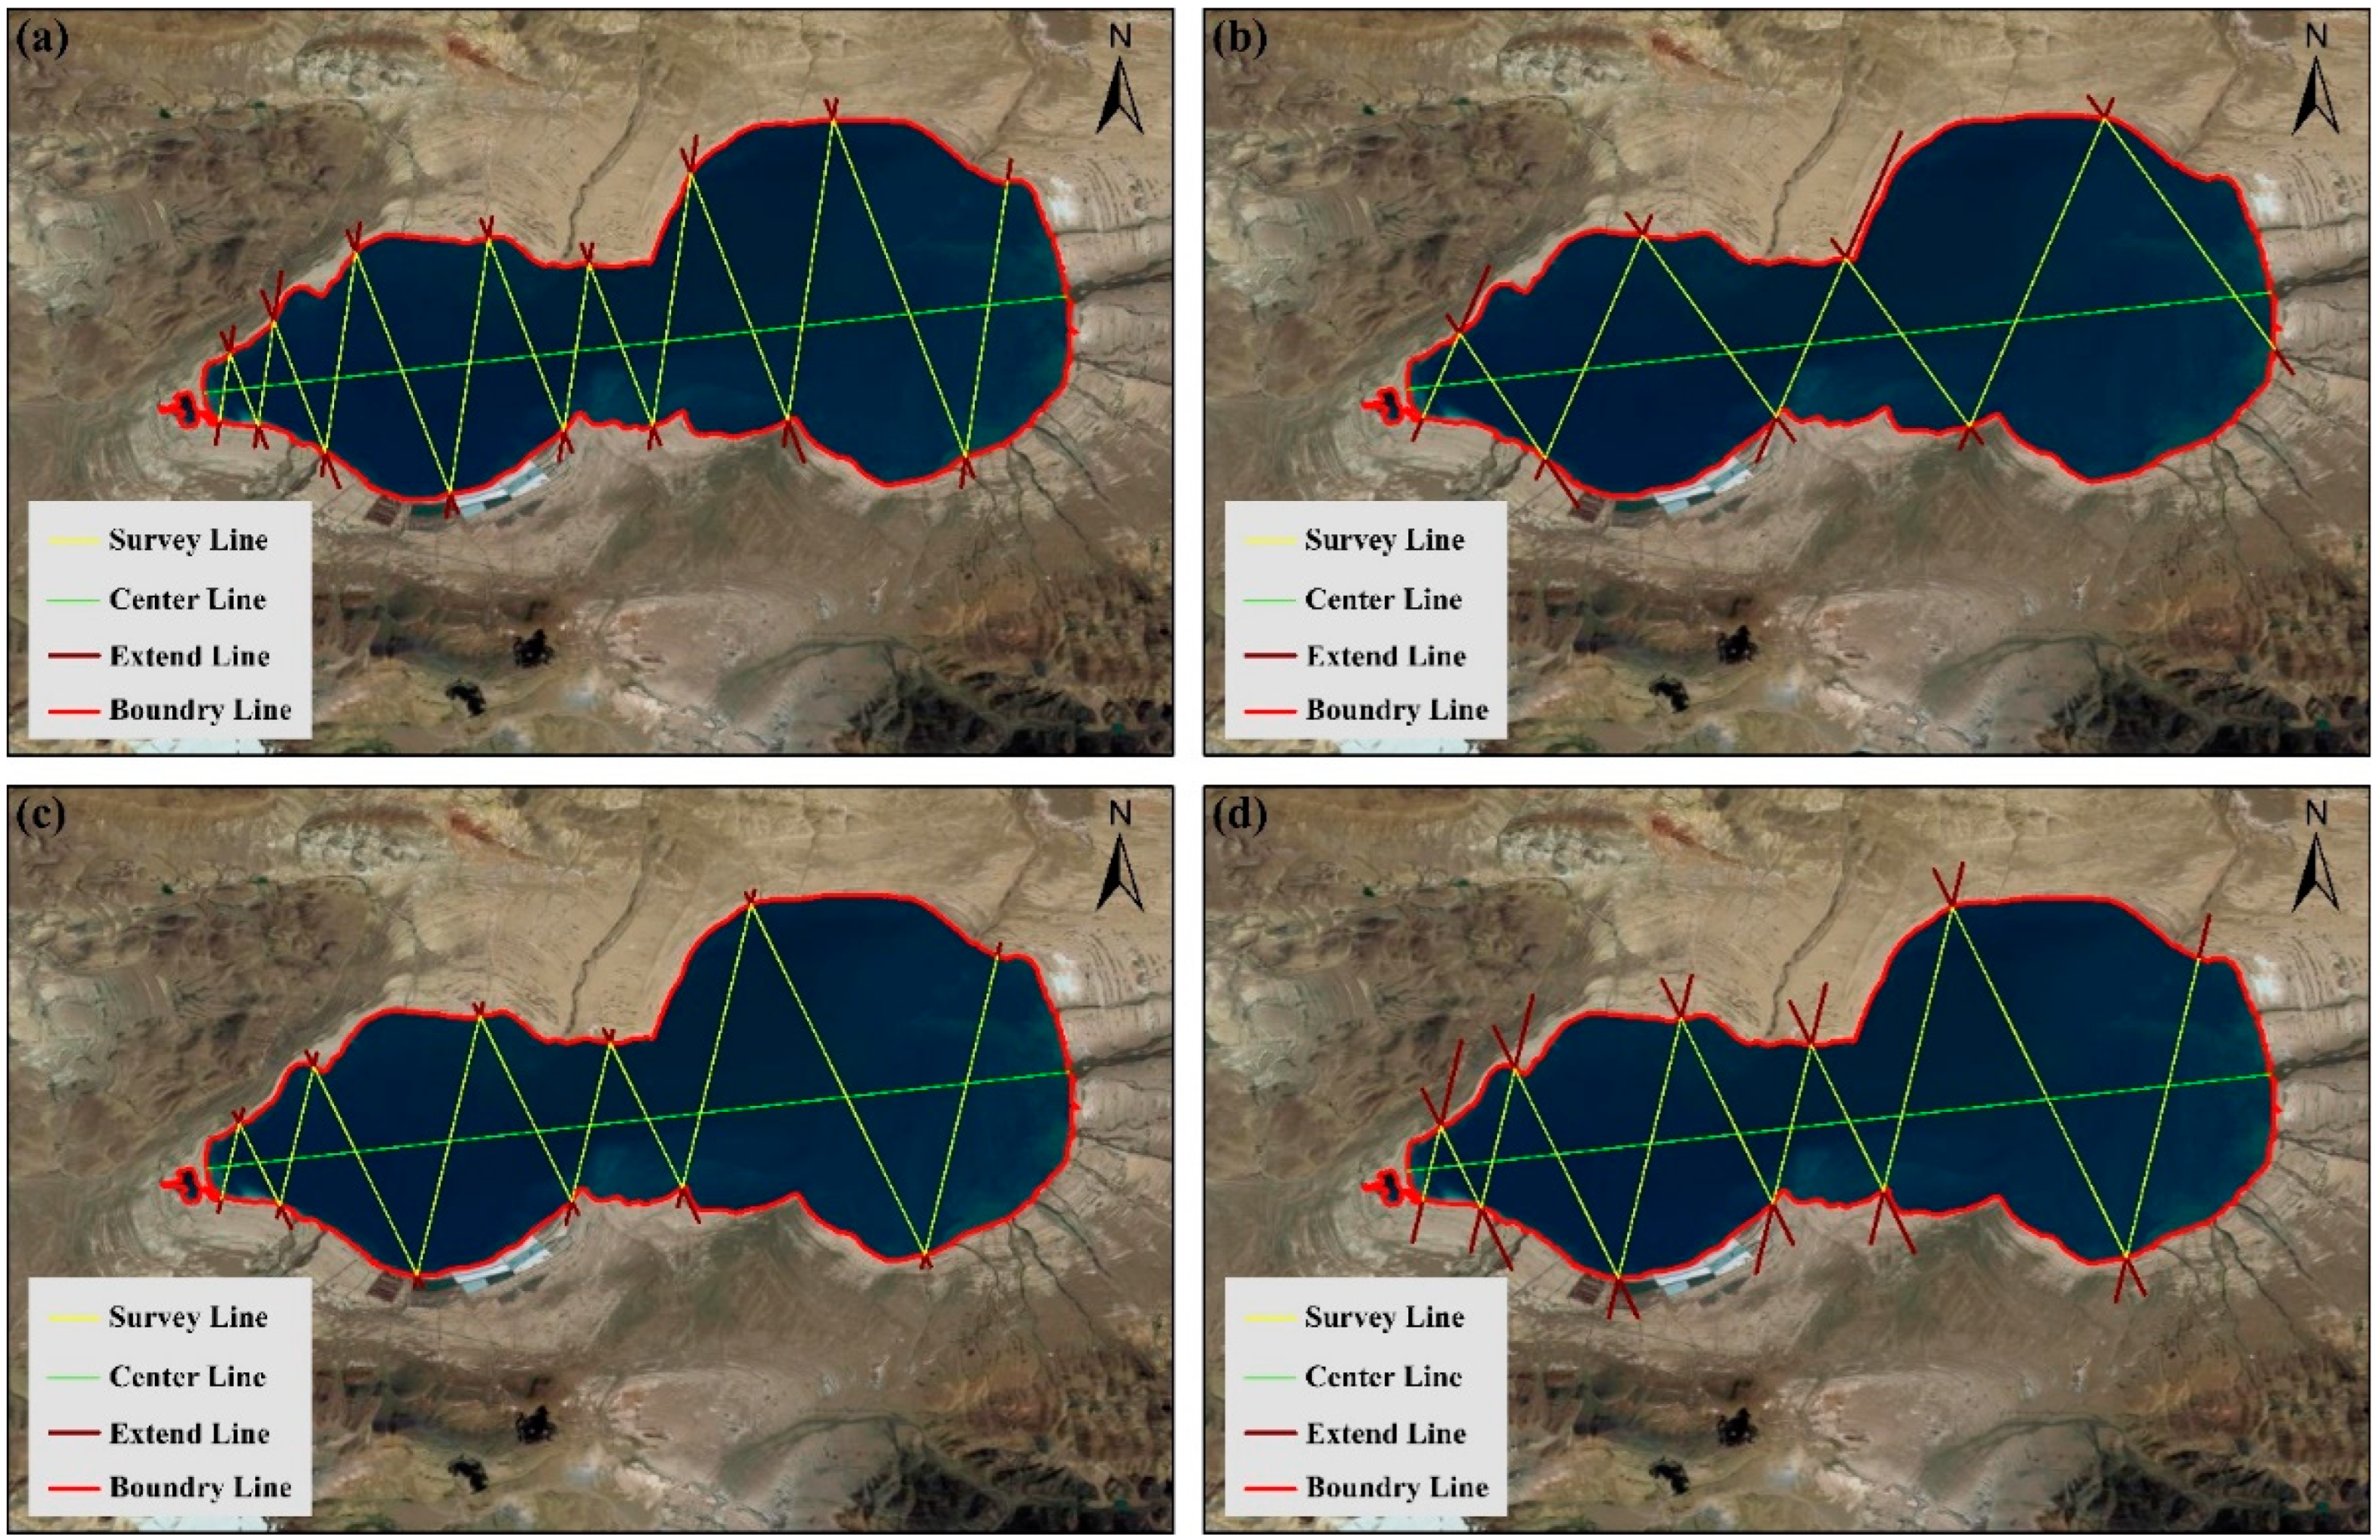
As described above, the interpolation process of the method contains two parameters: the buffer distance and the fixed inclination of the interpolated route to the centerline. The buffer distance determines the scope of the terrain around the lake used for depth interpolation, while the fixed inclination determines the sparsity of the underwater route [32]. The previous results of this study were obtained with a 500 m buffer zone and a parameter of 40° fixed inclination. The influence of the parameters on the simulation of the underwater topography was evaluated based on the generation of estimated water depths with different combinations of parameters. The buffer zone was chosen to range from 300 m to 1 km. The inclination angle was fixed from 30° to 60° to analyze the influences of different parameters on the results of the estimated water storage (Figure 5).
The results show that this method depends on the topography around the lakes; the buffer sizes significantly impact the depth estimation (Table 4). When the 1000 m buffer zone was selected for water storage estimation, the accuracy of the results for three lakes (Zigetang Co, Bangda Co, and Geren Co) were improved, while that of the results for the other three lakes were unsatisfactory, and the relative error of Longmu Co was much higher than 20%, reaching 28.87%. On the contrary, when a 500 m buffer zone was selected for estimation, the accuracy of the estimation for Taiyang Lake was greatly improved to 8.14% due to a reduction in the influence of the higher slope on the area far from the lakeshore, but the deviation of the estimated water storage from the measured water storage in several other lakes became larger. This may be because the depth of some lakes is estimated to be influenced by the topography of nearby high mountains and alluvial fans. The complexity of the underwater topography and the topography around the lakeshore make it difficult to improve the accuracy of water estimation using the size of the buffer zone. The relative error of this method is close to that of other methods, within 20%. The advantage of this method is that it can provide full coverage underwater terrain models [42,43].
The estimation results of different fixed angles are shown in Table 5. Most lakes showed a significant improvement in estimated storage at a 30° fixed inclination, which may be due to the increase in the number of interpolation points at smaller dip angles, resulting in a more accurate simulated underwater terrain. However, due to the narrow and long shape of the lake in Geren Co and the fact that a section of the lake’s bank is close to a cliff, the underwater interpolation route was denser when the inclination was small, which made the estimation of the water depth more susceptible to the influence of the excessive slope. The relative error of the water storage estimates increased from 12.81% to 18.01% when the inclination angle was reduced from 60° to 30°. However, at 60° inclination, errors in the water quantity estimation of most lakes increased. The relative error of the Geren Co water quantity estimation remained unchanged, but the accuracy was severely reduced. The relative error of other lakes also increased by about 2–10%, and the relative error in the water storage estimation of Longmu Co increased from 8.89% to 17.06%, nearly doubling. Unlike other methods that do not use measured data, this method can provide acceptable estimates of water depth (R2 > 0.7) and water reserves (relative error < 20%) [44,45]. In general, except for individual lakes, increasing the number of pixel points can improve the accuracy of lake depth estimation, including increasing the buffer area and decreasing the dip size, but it does not mean that the accuracy can be improved indefinitely. As the inclination decreases, the interpolation routes become denser, which may lead to more susceptibility to topographic undulations and bring about more uncertainty regarding the bathymetry estimation. Since this method overestimates compared to the bathymetry estimation, decreasing the inclination angle could effectively reduce the predicted bathymetry and improve the accuracy.
5. Conclusions
In this study, we propose a method to estimate lake depth that does not require estimated data. The basic principle of this method is to assume that the surrounding area above the lake’s surface has similar topographic features to the area below the lake’s surface. This method estimates the water depth by extending the topography around the lake to that below the water.
Six typical lakes located on the Tibetan Plateau were selected for use in this study to evaluate the accuracy of the method. The method’s estimations of the storage and depth of the lakes were, in general, consistent with the measured data. The results showed that the method was able to provide an acceptable underwater topography model of the lake with an average R2 of 0.8. In terms of water estimation, the deviation of the estimated water storage in all six lakes was less than 20%, confirming the usability of the method for bathymetry estimation. Since this method relies entirely on the topography around the lake for bathymetry estimation, it is more suitable for naturally occurring and smooth-slope lakes rather than specially formed lakes, such as glacial lakes. This study provides an effective method for lake depth estimation, especially in remote areas similar to the Tibetan Plateau. Lakes in remote areas are subject to minimal human intervention and can visually reflect local climate change [46,47].
In subsequent research, we will develop more aspects of the study to explore the effect of different DEM resolutions on the estimation results, as well as to analyze the applicability of the method to lakes with different topographical features.
Author Contributions
All authors listed have contributed substantially to the manuscript to be included as authors. Conceptualization, B.Q.; methodology, Y.X.; software, Y.X. and G.W.; validation, Y.X. and H.Z.; formal analysis, Y.X.; investigation: B.Q.; resources, Y.X. and G.W.; data curation, Y.X. and J.W.; writing—original draft preparation, Y.X.; writing—review and editing, Y.X., B.Q. and J.W.; visualization, Y.X.; supervision, H.Z.; project administration: B.Q.; funding acquisition, B.Q. All authors have read and agreed to the published version of the manuscript.
Funding
This work is supported by the Second Tibetan Plateau Scientific Expedition and Research (2019QZKK0202) and the National Natural Science Foundation of China (NSFC project 41901078).
Data Availability Statement
The data are not publicly available due to the data in this paper were also used in the writing of other paper.
Conflicts of Interest
The authors declare no conflict of interest.
References
- Tranvik, L.J.; Downing, J.A.; Cotner, J.B.; Cotner, J.B.; Loiselle, S.A.; Striegl, R.G.; Ballatore, T.J.; Dillon, P.; Finlay, K.; Fortino, K.; et al. Lakes and Reservoirs as Regulators of Carbon Cycling and Climate. Limnol. Oceanogr. 2009, 54, 2298–2314. [Google Scholar] [CrossRef] [Green Version]
- Downing, J.A.; Prairie, Y.T.; Cole, J.J.; Duarte, C.M.; Tranvik, L.J.; Striegl, R.G.; McDowell, W.H.; Kortelainen, P.; Caraco, N.F.; Melack, J.M.; et al. The global abundance and size distribution of lakes, ponds, and impoundments. Limnol. Oceanogr. 2006, 51, 2388–2397. [Google Scholar] [CrossRef] [Green Version]
- Verpoorter, C.; Kutser, T.; Seekell, D.A.; Tranvik, L.J. A global inventory of lakes based on high-resolution satellite imagery. Geophys. Res. Lett. 2014, 41, 6396–6402. [Google Scholar] [CrossRef]
- Woolway, R.I.; Kraemer, B.M.; Lenters, J.D.; Merchant, C.J.; O’Reilly, C.M.; Sharma, S. Global lake responses to climate change. Nat. Rev. Earth Environ. 2020, 1, 388–403. [Google Scholar] [CrossRef]
- Yang, K.; Ye, B.; Zhou, D.; Merchant, C.J.; O’Reilly, C.M.; Sharma, S. Response of hydrological cycle to recent climate changes in the Tibetan Plateau. Clim. Chang. 2011, 109, 517–534. [Google Scholar] [CrossRef]
- Xu, N.; Ma, Y.; Wei, Z.; Wu, B.; Foken, T.; Qin, J.; Zhou, Z. Satellite observed recent rising water levels of global lakes and reservoirs. Environ. Res. Lett. 2022, 17, 74013. [Google Scholar] [CrossRef]
- Ma, Y.; Xu, N.; Zhang, W.; Wang, X.H.; Sun, J.; Feng, X.; Sun, Y. Increasing Water Levels of Global Lakes Between 2003 and 2009. IEEE Geosci. Remote Sens. 2020, 17, 187–191. [Google Scholar] [CrossRef]
- Zhang, G.; Ran, Y.; Wan, W.; Luo, W.; Chen, W.; Xu, F.; Li, X. 100 years of lake evolution over the Qinghai–Tibet Plateau. Earth Syst. Sci. Data 2021, 13, 3951–3966. [Google Scholar] [CrossRef]
- Zhang, G.; Luo, W.; Chen, W.; Zheng, G. A robust but variable lake expansion on the Tibetan Plateau. Sci. Bull. 2019, 64, 1306–1309. [Google Scholar] [CrossRef] [Green Version]
- Zhang, G.; Yao, T.; Piao, S.; Bolch, T.; Xie, H.; Chen, D.; Gao, Y.; O’Reilly, C.M.; Shum, C.K.; Yang, K.; et al. Extensive and drastically different alpine lake changes on Asia’s high plateaus during the past four decades. Geophys. Res. Lett. 2017, 44, 252–260. [Google Scholar] [CrossRef] [Green Version]
- Medina, C.; Gomez-Enri, J.; Alonso, J.J.; Bolch, T.; Xie, H.; Chen, D.; Gao, Y.; O’Reilly, C.M.; Shum, C.K.; Yang, K.; et al. Water volume variations in Lake Izabal (Guatemala) from in situ measurements and ENVISAT Radar Altimeter (RA-2) and Advanced Synthetic Aperture Radar (ASAR) data products. J. Hydrol. 2010, 382, 34–48. [Google Scholar] [CrossRef]
- Dargahi, B.; Setegn, S.G. Combined 3D hydrodynamic and watershed modelling of Lake Tana, Ethiopia. J. Hydrol. 2011, 398, 44–64. [Google Scholar] [CrossRef]
- Yao, J.; Wang, G.; Wang, L.; Zhang, X.; Wang, P. Assessing the spatiotemporal variability of lake water quality using A novel multidimensional shape—Position similarity cloud model. J. Hydrol. 2021, 599, 126379. [Google Scholar] [CrossRef]
- Qiao, B.; Ju, J.; Zhu, L.; Chen, H.; Kai, J.; Kou, Q. Improve the Accuracy of Water Storage Estimation—A Case Study from Two Lakes in the Hohxil Region of North Tibetan Plateau. Remote Sens. 2021, 13, 293. [Google Scholar] [CrossRef]
- Cael, B.B.; Heathcote, A.J.; Seekell, D.A. The volume and mean depth of Earth’s lakes. Geophys. Res. Lett. 2017, 44, 209–218. [Google Scholar] [CrossRef]
- Qiao, B.; Zhu, L.; Wang, J.; Ju, J.; Ma, Q.; Liu, C. Estimation of lake water storage and changes based on bathymetric data and altimetry data and the association with climate change in the central Tibetan Plateau. J. Hydrol. 2019, 578, 124052. [Google Scholar] [CrossRef]
- Zhu, L.; Jin, J.; Liu, X.; Tian, L.; Zhang, Q. Simulations of the Impact of Lakes on Local and Regional Climate Over the Tibetan Plateau. Atmos. Ocean 2018, 56, 230–239. [Google Scholar] [CrossRef]
- Filina, I.Y.; Blankenship, D.D.; Thoma, M.; Lukin, V.V.; Masolov, V.N.; Sen, M.K. New 3D bathymetry and sediment distribution in Lake Vostok: Implication for pre-glacial origin and numerical modeling of the internal processes within the lake. Earth Planet Sci. Lett. 2008, 276, 106–114. [Google Scholar] [CrossRef]
- Bandini, F.; Olesen, D.; Jakobsen, J.; Kittel, C.M.M.; Wang, S.; Garcia, M.; Bauer-Gottwein, P. Technical note: Bathymetry observations of inland water bodies using a tethered single-beam sonar controlled by an unmanned aerial vehicle. Hydrol. Earth Syst. Sci. 2018, 22, 4165–4181. [Google Scholar] [CrossRef] [Green Version]
- Shaker, A.; Yan, W.Y.; LaRocque, P.E. Automatic land-water classification using multispectral airborne LiDAR data for near-shore and river environments. Isprs J. Photogramm. 2019, 152, 94–108. [Google Scholar] [CrossRef]
- Zhou, J.; Wang, L.; Zhang, Y.; Guo, Y.; Li, X.; Liu, W. Exploring the water storage changes in the largest lake (Selin Co) over the Tibetan Plateau during 2003–2012 from a basin-wide hydrological modeling. Water Resour. Res. 2015, 51, 8060–8086. [Google Scholar] [CrossRef] [Green Version]
- Li, Y.; Gao, H.; Jasinski, M.F.; Zhang, S.; Stoll, J.D. Deriving High-Resolution Reservoir Bathymetry from ICESat-2 Prototype Photon-Counting Lidar and Landsat Imagery. IEEE Trans. Geosci. Remote 2019, 57, 7883–7893. [Google Scholar] [CrossRef]
- Li, Y.; Gao, H.; Zhao, G.; Tseng, K.-H. A high-resolution bathymetry dataset for global reservoirs using multi-source satellite imagery and altimetry. Remote Sens. Environ. 2020, 244, 111831. [Google Scholar] [CrossRef]
- Heathcote, A.J.; Del Giorgio, P.A.; Prairie, Y.T. Predicting bathymetric features of lakes from the topography of their surrounding landscape. Can. J. Fish Aquat. Sci. 2015, 72, 643–650. [Google Scholar] [CrossRef]
- Ma, Y.; Xu, N.; Sun, J.; Wang, X.H.; Yang, F.; Li, S. Estimating water levels and volumes of lakes dated back to the 1980s using Landsat imagery and photon-counting lidar datasets. Remote Sens. Environ. 2019, 232, 111287. [Google Scholar] [CrossRef]
- Chen, T.; Song, C.; Zhan, P.; Yao, J.; Li, Y.; Zhu, J. Remote sensing estimation of the flood storage capacity of basin-scale lakes and reservoirs at high spatial and temporal resolutions. Sci. Total Environ. 2022, 807, 150772. [Google Scholar] [CrossRef]
- van Bemmelen, C.W.T.; Mann, M.; de Ridder, M.P.; Rutten, M.M.; van de Giesen, N.C. Determining water reservoir characteristics with global elevation data. Geophys. Res. Lett. 2016, 43, 11278–11286. [Google Scholar] [CrossRef] [Green Version]
- Zhu, S.; Liu, B.; Wan, W.; Xie, H.; Fang, Y.; Chen, X.; Li, H.; Fang, W.; Zhang, G.; Tao, M.; et al. A New Digital Lake Bathymetry Model Using the Step-Wise Water Recession Method to Generate 3D Lake Bathymetric Maps Based on DEMs. Water 2019, 11, 1151. [Google Scholar] [CrossRef] [Green Version]
- Armon, M.; Dente, E.; Shmilovitz, Y.; Mushkin, A.; Cohen, T.J.; Morin, E.; Enzel, Y. Determining Bathymetry of Shallow and Ephemeral Desert Lakes Using Satellite Imagery and Altimetry. Geophys. Res. Lett. 2020, 47, e2020GL087367. [Google Scholar] [CrossRef]
- Li, Y.; Gao, H.; Allen, G.H.; Zhang, Z. Constructing Reservoir Area–Volume–Elevation Curve from TanDEM-X DEM Data. IEEE J.-Stars 2021, 14, 2249–2257. [Google Scholar] [CrossRef]
- Getirana, A.; Jung, H.C.; Tseng, K. Deriving three dimensional reservoir bathymetry from multi-satellite datasets. Remote Sens. Environ. 2018, 217, 366–374. [Google Scholar] [CrossRef]
- Liu, K.; Song, C.Q. Modeling lake bathymetry and water storage from DEM data constrained by limited underwater surveys. J. Hydrol. 2022, 604, 127260. [Google Scholar] [CrossRef]
- Weekley, D.; Li, X. Maximizing Multi-Decadal Water Surface Elevation Estimates With Landsat Imagery and Elevation/Bathymetry Datasets. Water Resour. Res. 2022, 58, e2021WR029680. [Google Scholar] [CrossRef]
- Hollister, J.; Milstead, W.B. Using GIS to estimate lake volume from limited data. Lake Reserv. Manag. 2010, 26, 194–199. [Google Scholar] [CrossRef] [Green Version]
- Zhang, G.; Yao, T.; Chen, W.; Zheng, G.; Shum, C.; Yang, K.; Piao, S.; Sheng, Y.; Yi, S.; Li, J.; et al. Regional differences of lake evolution across China during 1960s–2015 and its natural and anthropogenic causes. Remote Sens. Environ. 2019, 221, 386–404. [Google Scholar] [CrossRef]
- Qiao, B.J.; Zhu, L.P.; Yang, R.M. Temporal-spatial differences in lake water storage changes and their links to climate change throughout the Tibetan Plateau. Remote Sens. Environ. 2019, 222, 232–243. [Google Scholar] [CrossRef]
- Zhang, G.; Bolch, T.; Chen, W.; Crétaux, J.-F. Comprehensive estimation of lake volume changes on the Tibetan Plateau during 1976–2019 and basin-wide glacier contribution. Sci. Total Environ. 2021, 772, 145463. [Google Scholar] [CrossRef]
- Yang, R.; Zhu, L.; Wang, J.; Ju, J.; Ma, Q.; Turner, F.; Guo, Y. Spatiotemporal variations in volume of closed lakes on the Tibetan Plateau and their climatic responses from 1976 to 2013. Clim. Chang. 2017, 140, 621–633. [Google Scholar] [CrossRef]
- Xiong, L.; Tang, G.; Yang, X.; Li, F. Geomorphology-oriented digital terrain analysis: Progress and perspectives. J. Geogr. Sci. 2021, 31, 456–476. [Google Scholar] [CrossRef]
- Messager, M.L.; Lehner, B.; Grill, G.; Schmitt, O. Estimating the volume and age of water stored in global lakes using a geo-statistical approach. Nat. Commun. 2016, 7, 13603. [Google Scholar] [CrossRef]
- Tseng, K.; Shum, C.K.; Kim, J.; Wang, X.; Zhu, K.; Cheng, X. Integrating Landsat Imageries and Digital Elevation Models to Infer Water Level Change in Hoover Dam. IEEE J.-Stars 2016, 9, 1696–1709. [Google Scholar] [CrossRef]
- Xu, N.; Ma, Y.; Zhou, H.; Zhang, W.; Zhang, Z.; Wang, X.H. A Method to Derive Bathymetry for Dynamic Water Bodies Using ICESat-2 and GSWD Data Sets. IEEE Geosci. Remote S. 2022, 19, 1500305. [Google Scholar] [CrossRef]
- Tan, Z.; Melack, J.; Li, Y.; X Liu, X.; Chen, B.; Zhang, Q. Estimation of water volume in ungauged, dynamic floodplain lakes. Environ. Res. Lett. 2020, 15, 54021. [Google Scholar] [CrossRef]
- Lu, S.; Ouyang, N.; Wu, B.; Wei, Y.; Tesemma, Z. Lake water volume calculation with time series remote-sensing images. Int. J. Remote Sens. 2013, 34, 7962–7973. [Google Scholar] [CrossRef]
- Sobek, S.; Nisell, J.; Fölster, J. Predicting the depth and volume of lakes from map-derived parameters. Inland Waters 2011, 1, 177–184. [Google Scholar] [CrossRef]
- Jiang, L.; Nielsen, K.; Andersen, O.B.; Bauer-Gottwein, P. Monitoring recent lake level variations on the Tibetan Plateau using CryoSat-2 SARIn mode data. J. Hydrol. 2017, 544, 109–124. [Google Scholar] [CrossRef] [Green Version]
- Dai, Y.; Wang, L.; Yao, T.; Li, X.; Zhu, L.; Zhang, X. Observed and Simulated Lake Effect Precipitation Over the Tibetan Plateau: An Initial Study at Nam Co Lake. J. Geophys. Res. Atmos. 2018, 123, 6746–6759. [Google Scholar] [CrossRef]
Figure 1.
Spatial distribution and general shape of the six lakes selected for this study. (a) Longmu Co. (b) Guozha Co. (c) Bangda Co. (d) Geren Co. (e) Taiyang Lake. (f) Zigetang Co.
Figure 1.
Spatial distribution and general shape of the six lakes selected for this study. (a) Longmu Co. (b) Guozha Co. (c) Bangda Co. (d) Geren Co. (e) Taiyang Lake. (f) Zigetang Co.

Figure 2.
Interpolation routes, centerlines, initial points, and measured bathymetry data for the six lakes. (a) Geren Co. (b) Longmu Co. (c) Zigetang Co. (d) Bangda Co. (e) Taiyang Lake. (f) Guozha Co.
Figure 2.
Interpolation routes, centerlines, initial points, and measured bathymetry data for the six lakes. (a) Geren Co. (b) Longmu Co. (c) Zigetang Co. (d) Bangda Co. (e) Taiyang Lake. (f) Guozha Co.

Figure 3.
The measured underwater topographic maps and the estimated bathymetry results of two lakes, Longmu Co and Taiyang Lake. (Measured data on the left and estimated data on the right).
Figure 3.
The measured underwater topographic maps and the estimated bathymetry results of two lakes, Longmu Co and Taiyang Lake. (Measured data on the left and estimated data on the right).

Figure 4.
A linear relationship between in situ bathymetry data and estimated bathymetry data.


Figure 5.
Underwater interpolation routes for different parameters of the method. (a) interpolation route with an inclination of 30°; (b) interpolation route with an inclination of 60°; (c) interpolation route with a buffer of 300 m; (d) interpolation route with a buffer of 1000 m.
Figure 5.
Underwater interpolation routes for different parameters of the method. (a) interpolation route with an inclination of 30°; (b) interpolation route with an inclination of 60°; (c) interpolation route with a buffer of 300 m; (d) interpolation route with a buffer of 1000 m.


Table 1.
The basic information about the selected lakes.
| Lake Name | Latitude | Longitude | Area (km2) | Elevation (m) | Maximum Depth (m) |
|---|---|---|---|---|---|
| Longmu Co | 34.61 | 80.46 | 107.96 | 5004.5 | 67.89 |
| Geren Co | 31.12 | 88.34 | 479.63 | 4650.43 | 78.53 |
| Guozha Co | 35.02 | 81.07 | 246.27 | 5082.53 | 151.35 |
| Zigetang Co | 32.08 | 90.86 | 238.32 | 4568.27 | 44.02 |
| Taiyang Lake | 35.93 | 90.63 | 100.22 | 4881.41 | 61.57 |
| Bangda Co | 34.94 | 81.56 | 154.73 | 4914.13 | 41.04 |
Table 2.
Results of estimated and measured maximum water depths of the six lakes (m).
| Longmu Co | Geren Co | Guozha Co | Zigetang Co | Taiyang Lake | Bangda Co | |
|---|---|---|---|---|---|---|
| Estimated | 67.89 | 78.53 | 151.35 | 44.02 | 61.57 | 41.04 |
| Measured | 76.85 | 87.23 | 138.72 | 40.05 | 64.48 | 36.87 |
| Relative Error | 11.66% | 9.97% | 9.10% | 9.91% | 4.51% | 11.31% |
Table 3.
MAE and RMSE values of water depth and water storage estimation results of six lakes.
| Lake Name | MAE/m | RMSE/m | Measured Storage/Gt | Estimated Storage/Gt | Relative Error |
|---|---|---|---|---|---|
| Longmu Co | 6.62 | 9.63 | 28.13 | 25.63 | 8.89% |
| Geren Co | 10.59 | 13.57 | 133.15 | 150.21 | 12.81% |
| Guozha Co | 10.49 | 15.76 | 149.04 | 134.39 | 9.83% |
| Zigetang Co | 6.94 | 8.48 | 39.60 | 42.20 | 6.57% |
| Taiyang Lake | 16.07 | 19.77 | 31.94 | 36.47 | 14.18% |
| Bangda Co | 5.36 | 7.83 | 26.44 | 24.55 | 7.15% |
Table 4.
The relative errors of water storage under different buffer zones in 6 lakes.
| 300 m | 500 m | 1000 m | |
|---|---|---|---|
| Longmu Co | 25.16 (10.56%) | 25.63 (8.89%) | 36.25 (28.87%) |
| Geren Co | 158.80 (19.26%) | 150.21 (12.81%) | 144.35 (8.41%) |
| Guozha Co | 137.28 (7.89%) | 134.39 (9.83%) | 125.91 (15.52%) |
| Zigetang Co | 45.39 (14.62%) | 43.15 (8.98%) | 41.40 (4.55%) |
| Taiyang Lake | 29.34 (8.14%) | 36.47 (14.18%) | 37.50 (17.41%) |
| Bangda Co | 21.97 (16.91%) | 24.55 (8.49%) | 27.37 (3.52%) |
Table 5.
Relative error of water storage in 6 lakes at different inclination angles.
| 30° | 40° | 60° | |
|---|---|---|---|
| Longmu Co | 25.06 (10.91%) | 25.63 (8.89%) | 23.33 (17.06) |
| Geren Co | 157.13 (18.01%) | 150.21 (12.81%) | 116.65 (12.39%) |
| Guozha Co | 156.53 (5.03%) | 134.39 (9.83%) | 130.81 (12.23%) |
| Zigetang Co | 35.60 (10.10%) | 43.15 (8.98%) | 31.24 (21.11%) |
| Taiyang Lake | 29.51 (7.61%) | 36.47 (14.18%) | 38.79 (21.45%) |
| Bangda Co | 25.71 (2.76%) | 24.55 (8.49%) | 23.70 (10.36%) |
Disclaimer/Publisher’s Note: The statements, opinions and data contained in all publications are solely those of the individual author(s) and contributor(s) and not of MDPI and/or the editor(s). MDPI and/or the editor(s) disclaim responsibility for any injury to people or property resulting from any ideas, methods, instructions or products referred to in the content. |
© 2023 by the authors. Licensee MDPI, Basel, Switzerland. This article is an open access article distributed under the terms and conditions of the Creative Commons Attribution (CC BY) license (https://creativecommons.org/licenses/by/4.0/).
Share and Cite
MDPI and ACS Style
Xiao, Y.; Wang, G.; Zhao, H.; Wang, J.; Qiao, B. Estimation of Lake Storage Based on the Surrounding Topography around the Lake from the SRTM DEM. Water 2023, 15, 1015. https://doi.org/10.3390/w15061015
AMA Style
Xiao Y, Wang G, Zhao H, Wang J, Qiao B. Estimation of Lake Storage Based on the Surrounding Topography around the Lake from the SRTM DEM. Water. 2023; 15(6):1015. https://doi.org/10.3390/w15061015
Chicago/Turabian StyleXiao, Yi, Guofeng Wang, Huihui Zhao, Jizheng Wang, and Baojin Qiao. 2023. "Estimation of Lake Storage Based on the Surrounding Topography around the Lake from the SRTM DEM" Water 15, no. 6: 1015. https://doi.org/10.3390/w15061015
Note that from the first issue of 2016, this journal uses article numbers instead of page numbers. See further details here.