
Spatio-Temporal Evolution and Propagation of Meteoro-Hydrological Drought in Yalong River Basin
by
Kui Zhu
1,2,
Yang Xu
1,3,*,
Fan Lu
3,*,
Xueying Sun
1,
Mingxing Gao
2,
Xuhang Han
2,
Dongsheng Li
2 and
Ming Jiang
3 1
School of Resources and Earth Science, China University of Mining and Technology, Xuzhou 221116, China
2
College of Geology and Mining Engineering, Xinjiang University, Urumqi 830047, China
3
State Key Laboratory of Simulation and Regulation of Water Cycle in River Basin, China Institute of Water Resources and Hydropower Research, Beijing 100038, China
*
Authors to whom correspondence should be addressed.
Water 2023, 15(6), 1025; https://doi.org/10.3390/w15061025
Submission received: 30 December 2022
/
Revised: 17 February 2023
/
Accepted: 24 February 2023
/
Published: 8 March 2023
(This article belongs to the Special Issue Vulnerability of Mountainous Water Resources and Hydrological Regimes)
Abstract
:Based on the meteorological and hydrological data of the Yalong River Basin from 1960 to 2019, meteorological and hydrological droughts were analyzed using the standardized precipitation evapotranspiration index (SPEI) and standardized runoff index (SRI); then, the spatio-temporal evolution and propagation characteristics of the droughts were studied on multiple time scales. The results showed that, firstly, on the annual scale, the frequencies of meteorological and hydrological droughts in the basin were 28.3% and 34.0%, respectively, in the past 60 years. From upstream to downstream, the longer the alternating period of dry and wet periods, the more significant the frequency of droughts. Secondly, on a seasonal scale, the frequency of meteorological droughts is high in autumn, and the frequency of hydrological drought is high in autumn and winter. The frequency of drought in different seasons decreases from the upper reaches to the lower reaches of the basin. Thirdly, on a monthly scale, the severe and exceptional meteorological drought frequencies are high from March to May, and the severe and exceptional hydrological drought frequencies are high in January, March, October, and December. The frequency of hydrological droughts is much higher than that of meteorological droughts, especially with respect to severe and exceptional drought. Meteorological and hydrological droughts spread in the same period without lag, but they tend to expand. The propagation time of drought is short in summer and autumn, but long in spring and winter. The conclusions can serve as a decision-making basis for the water diversion planning of the west route of China’s South-to-North Water Diversion Project and the cascade hydropower operation of the basin.
1. Introduction
Drought is one of the most widespread natural disasters in China. Drought has limited the development of the economy in west China. Among the total losses caused by various natural hazards, losses caused by meteorological hazards accounts for about 85%, and about 50% of them are caused by drought [1]. Therefore, identifying the characteristics of drought is critical for improving its management and prediction. Droughts can be classified into four categories: meteorological drought, hydrological drought, agricultural drought, and socioeconomic drought. They represent water shortages due to imbalances in the water supply and the demand for meteorological, runoff, crop, and socioeconomic needs [2,3]. The propagation of such water deficit signals between different types of drought is known as drought propagation [4,5,6]. It has been suggested that meteorological drought due to precipitation deficit is generally the first stage, which evolves and ends quickly [7]. Precipitation deficit and increasing evaporation demand evolve into hydrological drought through the propagation of the hydrologic cycle. An further research on drought propagation can provide valuable information to improve the accuracy of drought prediction, and studies on drought propagation through the drought index have been widely carried out at regional and global scales [8,9,10]. Some scholars have calculated drought response times and functional relationships of the drought characteristics using methods such as linear fitting to characterize the trigger thresholds or critical conditions of the propagation of meteorological drought to hydrological drought in watersheds [11,12,13]. The authors suggested that the drought index responds to drought events with different sensitivity depending on the time scale, which in turn leads to different propagation thresholds [14]. However, current studies on drought propagation have not given enough attention to drought propagation in different seasons. Different indicators are used to characterize and analyze drought characteristics. The Palmer Drought Severity Index (PDSI), standardized precipitation index (SPI), and SPEI are usually used for meteorological drought indications, whereas the SRI is usually used for hydrological drought indication [15].
Meteorological cause is one of the main factors that leads to drought. The PDSI index takes many meteorological elements into consideration, such as precipitation, evapotranspiration, runoff, etc., so that the PDSI index can reflect the influence of these factors to the later drought elements; the PDSI index measures well on monthly scales [16]. The SPI is easily calculated with a flexible time scale, and its standardized index is comparable across time scales and regions. The SPI index can describe the drought caused by the precipitation deficit well, but it only considers the regional water supply factor, ignoring the demand for surface water [17]. The SPEI index has the advantages of both the PDSI and SPI indices. Temperature change led by climate is crucial to regional drought levels. The SPEI index has a great performance in the condition of climate change because it takes the temperature-sensitive nature of evapotranspiration and includes multi-scale and multi-spatial comparison in its consideration [18]. The SPEI is widely utilized. Zhang, QF used the SPEI index to describe extreme wet and dry changes in the Chinese mainland under climate scenarios. In the Himalayas, the SPEI describes drought much better than the descriptions provided by precipitation or temperature [19]. Ndayiragije, JM quantified and characterized the drought events in the northern part of Burundi using the SPEI and SPI and compared the two indices [20].
Regarding improving the accuracy of drought forecasting, information from an in-depth investigation on drought propagation may help. The propagation from meteorological drought to hydrological drought is mainly based on the theoretical basis about the water balance and energy balance in the hydrological cycle. At present, scholars mainly study drought propagation through models and data calculations. It is widely practiced to investigate drought propagation by using drought indices at regional and global scales, where the correlation analysis is always one of the key methods. The propagation time of droughts can be determined by analyzing the synchrony between different types of droughts. For example, in the Jinghe Basin, the response time of meteorological and hydrological droughts was approximately 4 months on average, as identified by Zhao et al. [21]. Meteorological drought was closely correlated with hydrological drought, and the propagation time significantly varied with the season. Based on this theory, Li et al. pointed out the direction of improvement [22]. Huang et al. suggested a seasonal pattern of propagation time and a positive correlation between meteorological and hydrological droughts [23]. A model for the response relationship of drought propagation was developed by Wu et al., and the critical conditions for the propagation of meteorological drought to hydrological drought must be derived to operate this model [24]. J. Lorenzo-Lacruz et al. determined that it is also effective for determining the optimal time scale for monitoring hydrological drought by correlating the SPI index with the SRI index [25]. The propagation of meteorological drought to hydrological drought is mostly examined by computing the overall lag time of the precipitation and runoff series and by calculating the overall drought propagation time of the basin. However, it has been indicated that the propagation time is influenced by the precipitation and evaporation in different seasons and the seasonality of the climate. Therefore, the propagation of meteorological drought to hydrological drought may differ from one season to another, and the drought propagation time should be separately studied for different seasons.
The Yalong River Basin, situated in the southwest region of China, has abundant hydropower resources. It is an important energy base for the diversion of electricity from the western to the eastern regions, is an important part of the Western Development Strategy, and serves as a water source area for the western route of China’s South–North Water Transfer Project. Moreover, the Yalong River Basin is a sensitive area for climate change and has a great elevation difference and wide latitudinal span. Many scholars have investigated the long-term series of climatic dry and wet variability at the scale of the Yalong River Basin [26,27], but few studies have been conducted on its hydrological droughts. Based on the meteorological and hydrologic data from 1960 to 2019, the SPEI and SRI indices were used to characterize the meteorological and hydrological droughts, respectively. Then, the drought frequency in the basin was analyzed from interannual, four-season, and monthly time scales, and the responses of hydrological drought to meteorological drought and seasonal propagation characteristics were explored. In this way, the research can provide a basis for decision-making in inter-basin water transfer planning and terrace hydropower scheduling.
2. Data and Methods
2.1. Study Area
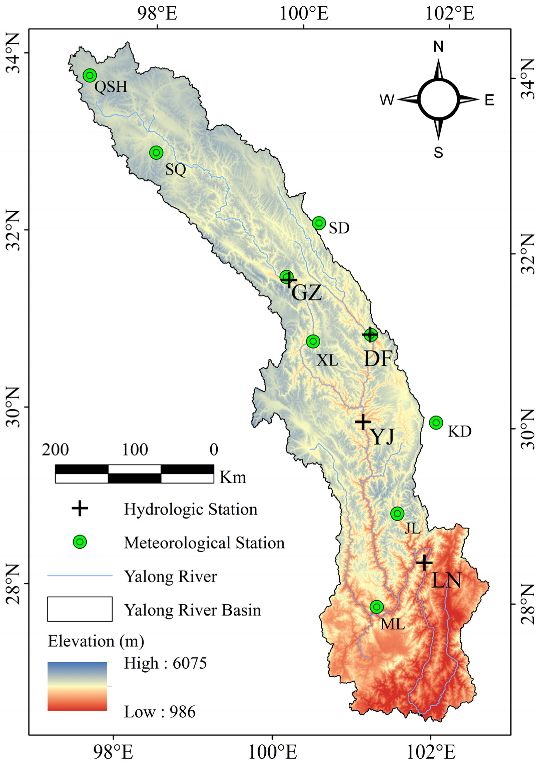
As the largest tributary of the Jinsha River, the Yalong River Basin (hereinafter referred to as YLB) is located between 96°52′–102°48′ E and 26°32′–33°58′ N in the eastern part of the Qinghai–Tibet Plateau and the western part of the Sichuan Province. The YLB is a north–south strip with a plume-like pattern of water systems, with a total trunk stream length of 1571 km, basin area of 136,000 km2, and average annual flow rate of 1860 m3/s at the estuary. The climate of the basin is very complex. The northern part of the basin is in a continental climate region, and it is cold and dry, with no distinct changes in the seasons; the central and southern parts of the basin are in a subtropical climate region and are rainy and hot during the same period with sufficient precipitation, and the temperature decreases with the increase in altitude. In this paper, four hydrological stations were selected in the study area, and the control basins of these stations were named as Ganzi Basin (GZB), Daofu Basin (DFB), Yajiang Basin (YJB), and Luning Basin (LNB) (Figure 1). The GZB and DFB stations are located in the upper reaches of the YLB, the YJB is in the middle reaches of the YLB, and the LNB is in the lower reaches of the YLB.
2.2. Data
The meteorological data were obtained from the China Meteorological Data Network (http://data.cma.cn, accessed on 23 September 2021). Wind speed, air temperature, daily precipitation, hours of sunshine, and relative humidity data from 1960 to 2019 were selected from nine stations in the control basin, and the average values of meteorological elements in each control basin were calculated using Thiessen polygons. Runoff data were obtained from the Yangtze River Basin Hydrological Yearbook. The monthly runoff data of four hydrological stations, GZ, DF, YJ, and LN from 1960 to 2019 were used. The Jinping Level 1 Hydropower Station, which is located upstream of the LN station, is the controlling hydropower station in the downstream section of the trunk of the YLB, with a watershed area of 103,000 km2 above the dam site. The hydropower station started to retain water at the end of 2012, resulting in a sudden drop of runoff data at LN in 2013. Therefore, only the runoff data before 2012 were used to maintain data consistency.
2.3. Methods
2.3.1. Drought Index
As a drought index based on the principle of water balance, SPEI uses the Penman–Monteith equation to calculate the potential evapotranspiration and then calculates the difference between daily precipitation and potential evapotranspiration as the moisture gain/loss, replacing the simple precipitation as the input condition, as follows:
where i represents a specific day, Pi represents the daily precipitation (mm), and PETi represents the potential evapotranspiration (mm). A cumulative series of water gain/loss at different time scales was established:
where k is the time scale (d), 31, 61, 91, …, 365 days, respectively; n denotes a day in a sum of a long time series plus the previous d (1 time scale) days of the series. The Di data series were normalized to calculate the SPEI for each value. The log-logistic distribution model was used to fit the standard normalization to derive the SPEI for different time scales (months). The drought categories in the study area were classified according to the SPEI classification criteria established by the China Meteorological Administration [28], as shown in Table 1.
Di = Pi − PETi
The standardized runoff index (SRI), as an evaluation index of hydrological drought, is calculated using the Γ distribution probability to describe the change in precipitation, the biased probability distribution of precipitation normal normalized treatment, and finally using the standardized precipitation cumulative frequency distribution to divide the drought grade, which is the same as that of the SPEI [29].
The drought index periodically varies at different time scales, and the number of drought events identified varies, including the duration and intensity of drought, which presents different characteristics of variability [30]. In this study, the variations of interannual, seasonal, and monthly drought characteristics of the YLB were analyzed on the scales of 12 months, 3 months, and 1 month, respectively. The duration ranging from June to May of the following year was defined as a hydrological year, and the seasonal division was based on the climatic characteristics of the study area.
2.3.2. Indexes for Drought Evaluation
In this paper, drought intensity, drought frequency, drought lag, and propagation time were adopted to evaluate drought. Drought intensity is used to evaluate the severity of a single drought, and the drought intensity within a certain duration is generally expressed by the drought index value. The greater the absolute value of the drought index, the higher the intensity of the drought and the more severe it is. Drought frequency was used to evaluate the frequency of drought in the study area, which was defined as the ratio of the number of years of drought to the total number of years of meteorological or hydrological data in the study area. The drought frequency of different levels is calculated from the number of years when different levels of drought occur. For example, the frequency of mild drought is calculated by dividing the number of years of mild drought by the total number of years of data.
Drought lag means that hydrological drought generally lags behind meteorological drought. The propagation time of meteoro-hydrological drought is the number of months of lag corresponding to the maximum correlation coefficient between the drought index series with different lag periods set [14,31]. Take the following steps to calculate the lag months or propagation time.:
- (1)
- Calculate the SPEI on the time scale of 1–12 months (SPEI1, SPEI2, …, SPEI12);
- (2)
- Calculate the 1-month time scale SRI (SRI1);
- (3)
- Use the Spearman correlation test to analyze SPEI1, SPEI2, …, SPEI12, and SRI1;
- (4)
- Among the obtained correlation coefficients, the SPEIk-SRI1 sequence with the best correlation coefficient is further selected to analyze the propagation time of meteorological drought to hydrological drought, and 13 groups of lag time are set, which are 0, 1, 2, 3, …, 12 months. The results will show that the correlation coefficient is the highest when the lag time is n months, and the lag time is the drought propagation time of the basin.
The time scale of SPEI corresponding to the SPEIk and SRI1 sequence with the largest correlation coefficient is the propagation time of each month. The propagation time of the season is the average propagation time for three months of the same season.
3. Results and Discussion
3.1. Spatial and Temporal Evolution of Drought at Different Time Scales
3.1.1. The Annual Scale
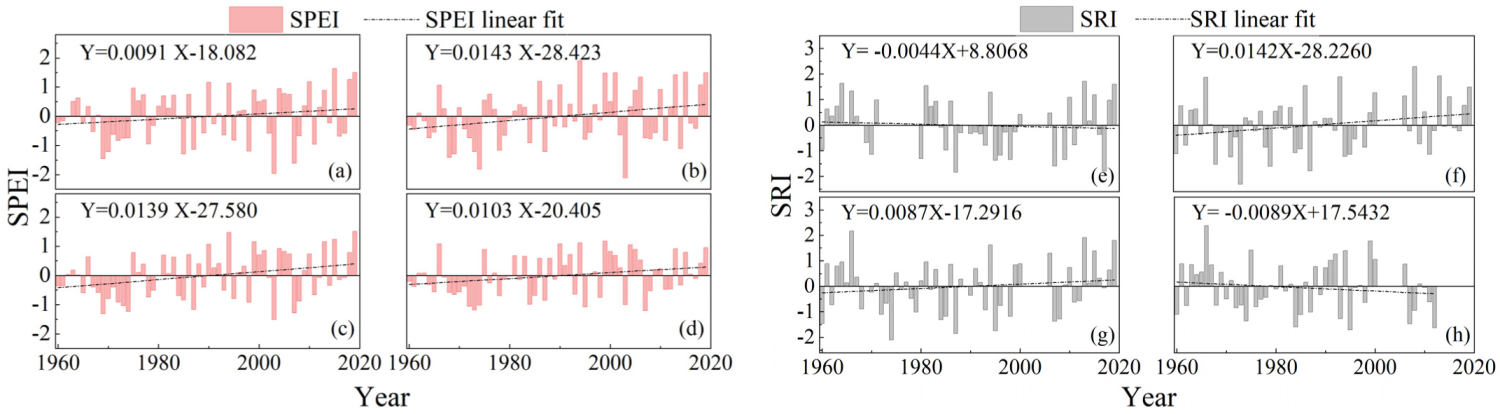
Table 2 shows the interannual drought frequencies of the control basins upstream of the four hydrological stations from 1960 to 2019. According to the drought classification criteria, the frequency of meteorological drought at LNB reached 28.3%, with an 18.3% frequency of mild drought and 10% frequency of moderate drought. Figure 2a–d presents the interannual variation characteristics of SPEI for the YLB. The drought index has an upward trend, even though it shows some fluctuations. Three consecutive mild droughts occurred from 1968 to 1970 and from 1972 to 1974, and two consecutive drought events occurred from 1984 to 1985 and from 2007 to 2008, respectively. The minimum SPEI index value appeared in 2007 with a drought intensity of 1.21, which is a moderate drought year. The SPEI index values shows significant fluctuations, increasing at a rate of 0.103/10a, which indicated a reduction in the meteorological drought of the YLB and validated the conclusion that the surface of the YLB was slightly wetted [16]. The drought frequencies of the meteorological stations of the YLB ranged from 31.6% to 36.8%, while the frequencies of severe and exceptional drought ranged from 5.3% to 8.8%, with no significant differences. From upstream to downstream, the frequencies of meteorological drought gradually decreased in the four control basins. The droughts in the sub-basins occurred in almost the same years, including a severe drought in 2003 in the GZB and YJB and an exceptional drought in the DFB. The basins also exhibited generally consistent characteristics of wet and dry changes. However, compared with the upstream basins, the average fluctuation cycle of the five-year sliding period of the SPEI values was longer in the YJB and LNB, and the alternation of wetness and dryness was more significant, with YJB completing wet and dry alternation every 12–14 years and LNB completing the alternation at an even longer interval.
Figure 2e–h shows the interannual variation of the SRI in the YLB. The frequency of hydrological drought in the YJB reached 34.0%, including 3.8% for severe drought and 1.9% for exceptional drought. Three consecutive mild droughts occurred from 1972 to 1974, and two consecutive drought events occurred from 1976 to 1977, from 1984 to 1985, from 2007 to 2008, and from 2012 to 2013, respectively. The minimum value of SRI appeared in 1974 with a drought intensity of 2.09, which is an exceptional drought event. The drought intensity of YJ decreased year by year, and the SRI value increased at a rate of 0.087/10 a. Compared with meteorological drought, hydrological drought is less mitigated and the drought situation is more severe. From upstream to downstream, the number of drought years identified by hydrological stations increased, and the frequency of hydrological drought that occurred from GZ to LN sequentially increased. Among them, DF (1973) and YJ (1974) each had one exceptional drought event.
3.1.2. The Seasonal Scale
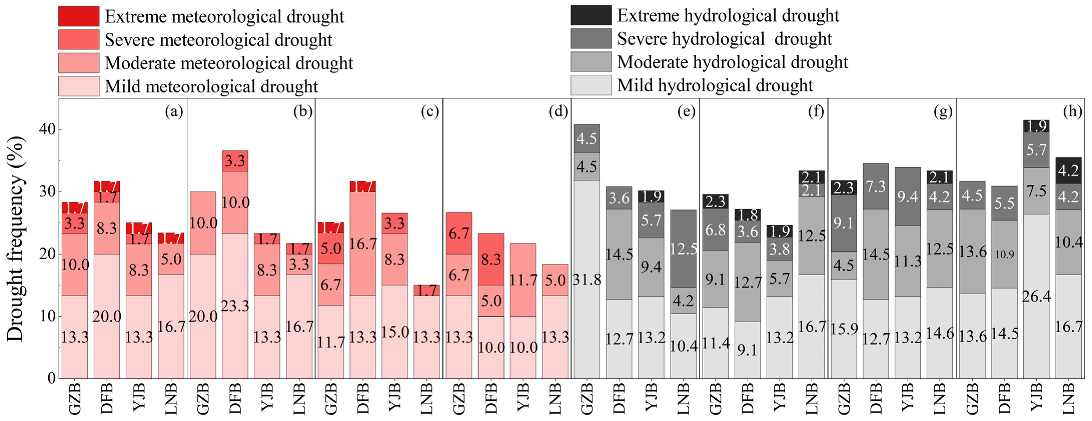
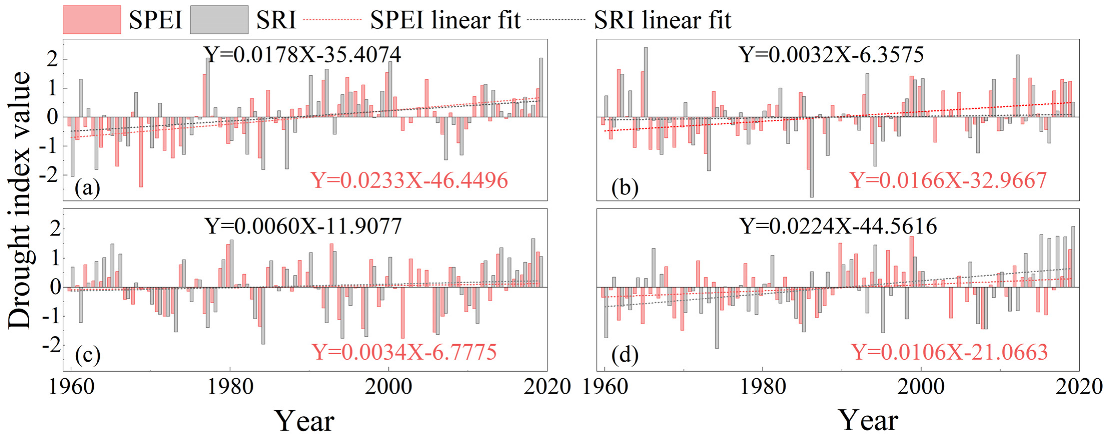
Figure 3 and Figure 4 show the drought frequency in different seasons from 1960 to 2019 in the YLB. Temporally, the frequency of meteorological drought in the study basin varied little between the four seasons, with percentages of 23.3%, 21.7%, 26.7%, and 21.7%, respectively. The frequency of meteorological drought was higher in autumn, and the frequency of severe drought and exceptional drought was 1.8% in spring; no exceptional drought events occurred in summer and autumn, and the frequency of severe drought was 1.8% and 3.5%, respectively. No severe drought or exceptional drought events occurred in winter. Figure 5 shows the interannual variation of drought intensity in different seasons in the YJB. After calculation, we found that the dry and wet characteristics of the four basins were basically the same, so we adopted the YJB as the representative for the analysis. Severe and exceptional drought occurred in four seasons in 1966 (severe drought in spring), 1969 (exceptional drought in spring), 1986 (severe drought in summer), and 2002 and 2006 (severe drought in autumn). The meteorological drought also decreased at different rates in all seasons, with the highest rate of drought mitigation in spring (0.233/10a) and the lowest rate in autumn (0.034/10a). Spatially, the highest drought frequency was found at Shiqu Station, with mild and moderate droughts predominating in spring and moderate and exceptional drought at frequencies of up to 14% in winter. In summer, the drought frequency varied little among stations, and the frequency sequentially decreased from the upstream to the downstream stations. In autumn, severe and exceptional droughts occurred in the GZB and its upstream stations with high frequency, while mild and moderate droughts occurred in the downstream stations with high frequency; so, drought frequency was high. The plot of drought frequency in the basin in all seasons also shows that the meteorological drought occurred in the upper reaches with high frequency, which should be emphasized.
The frequency of hydrological drought was higher than that of meteorological drought in all four seasons, at 30.2%, 24.5%, 34.0%, and 41.5%, respectively. The frequency of hydrological drought in the basin was high in autumn and winter. The frequency of mild drought was 13.2% in spring, summer, and autumn, and it was 26.4% in winter. The frequencies of severe drought ranged from 3.8% to 9.4% in all four seasons. The average frequencies of exceptional drought were 1.9% in the four season (Figure 4). Similar to meteorological drought, severe and exceptional hydrological droughts occurred in different years in each of the four seasons, but the number of years of severe and exceptional drought was 2.4 times that of meteorology drought. The variation rates of hydrological drought intensity differed among the four seasons, with higher mitigation rates for droughts in spring and winter. Spatially, the drought frequency was below 40% in all seasons in all stations except for GZ (40.8%) in spring and YJ (41.5%) in winter. From upstream to downstream, the drought frequencies of the hydrology stations sequentially decreased, but severe drought and exceptional drought were more frequent in YJ and LN, with frequencies of 7.6% and 12.5%, respectively.
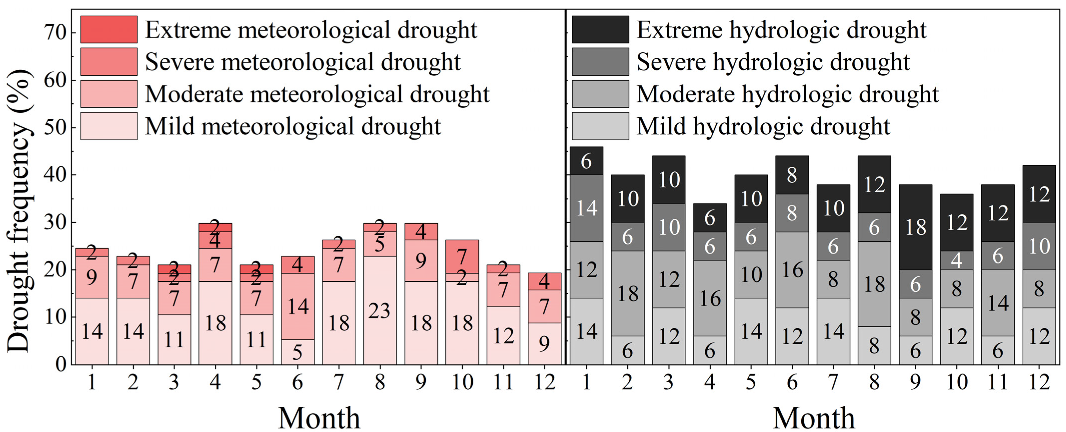
3.1.3. The Monthly Scale
Due to the uneven distribution of precipitation, temperature, and wind speed within the year, the distribution of drought is regional and complicated, and the frequency of drought events varies from month to month. Most areas are prone to mild and moderate droughts, while severe and exceptional droughts are less frequent. Figure 5 reflects the monthly variation characteristics of drought frequency from 1960 to 2019 in YJB. Meteorologically, the frequency was as high as 57% for mild drought, 30% for moderate drought, and 13% for severe and exceptional droughts. The lowest drought frequency was 19.3% in December. The drought frequency reached 29.8% in April, August, and September, but exceptional drought events only occurred from March to May. The frequencies of severe drought and exceptional drought fluctuate as a result of the simultaneous rainy and hot periods and the distinct wet and dry seasons in YLB. Before April, the dry and cold high-altitude westerly winds carry less water vapor and the drought have not yet completely receded. After April, the humid southwest monsoon pushes northward. From then until October, the YLB received abundant precipitation. Thus the frequency of severe and extreme droughts has decreased.
The frequencies of hydrological drought were much higher than those of meteorological drought in each month, with percentages of 25%, 31%, 18%, and 26% for the frequencies of mild, moderate, severe, and exceptional droughts, respectively. Compared with meteorological drought, hydrologic mild drought was less frequent and severe drought and exceptional drought were more frequent. The frequencies of severe drought and exceptional drought were more than 20% in January, March, October, and December, indicating that the western Sichuan plateau is prone to spring and winter droughts.
3.2. Analysis of Drought Propagation Characteristics
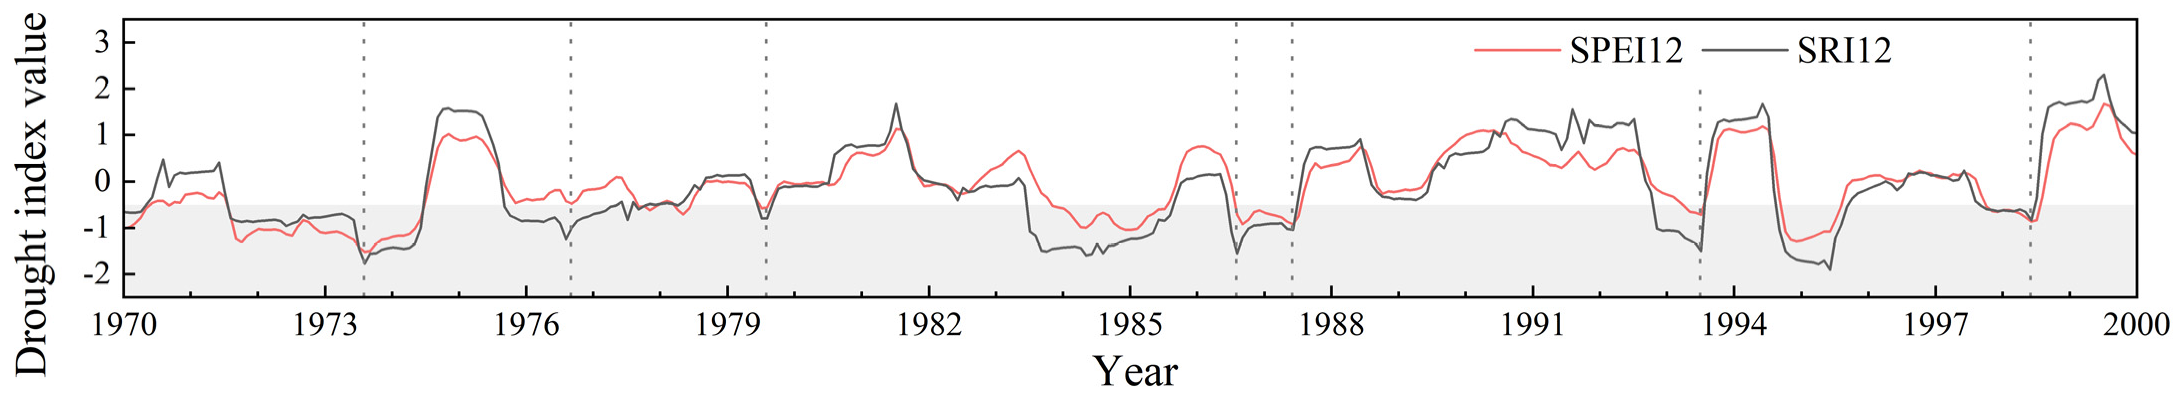
The meteorological drought is generally the first stage of drought development, followed by hydrological drought. To further investigate the propagation pattern of meteorological and hydrological droughts, a correlation analysis of the SPEI (at different time scales) and SRI were performed using Spearman’s correlation test. All of the correlation coefficients passed the significance test of p = 0.01. As shown in Table 3, the correlation between meteorological and hydrological drought indexes increased with increasing time scale, and the most significant correlation was found at the 12-month scale. The time scale is accumulated monthly, from the same period to twelve months. Calculate the correlation coefficient for SPEI2 and SRI2 sequences. It was found that the maximum correlation coefficient appeared in the contemporaneous series. A comparison of the SPEI12 and SRI12 series of LNB from 1970 to 2000 revealed that the SPEI values and SRI values changed in the same way over time, and the minima of the SRI and SPEI were both found at the same period, with an error of less than 1 month (Figure 6). From 1972 to 1973, the intensity of meteorological drought was stronger than that of hydrological drought, and after 1973, the intensity of hydrological drought was basically greater than that of meteorological drought. Although there was no significant lag in the process of drought propagation, it did expand, which explains the inconsistency of the frequencies of meteorological and hydrological drought among months as mentioned in the above section.
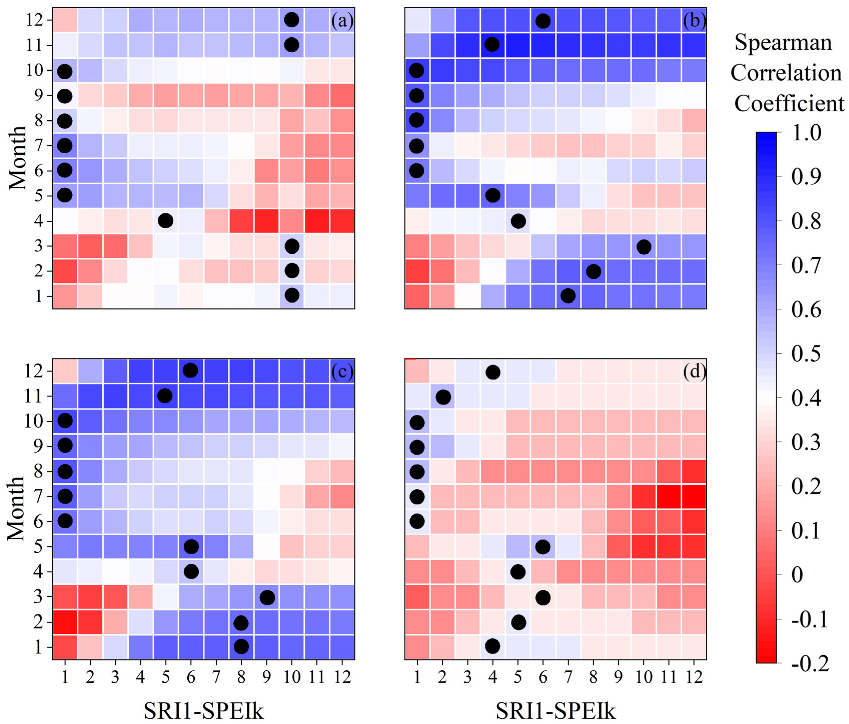
Figure 7 presents the correlation coefficients between the SPEI values at different time scales and SRI values at a 1-month time scale for the control basins above the YL. The x-axis represents the SPEI on the time scale from 1 to 12 months, and the y-axis represents different months. The figure shows that the time of drought propagation varied in each month of the year, and the intensity of the correlations between meteorological and hydrological droughts varied from month to month. Among them, the meteorological and hydrological droughts were closely related in summer and autumn, with the shortest propagation time occurring from June to October (1 month). The propagation time in autumn was 4 months, 2 months, 2 months, and 1 month for GZB, DFB, YLB, and LNB, respectively. During summer and autumn in the YLB, strong evapotranspiration and vegetation transpiration increased water consumption in agricultural production. The change of runoff is mainly dependent on precipitation, and meteorological drought is more likely to cause hydrological drought. Therefore, the response of summer runoff to precipitation is often faster than that of other seasons. However, precipitation has less influence on runoff due to the low temperature in winter and spring. Runoff is mainly from groundwater and snow melt, which makes the relationship between meteorological drought and hydrological drought less close. It is evident that the response of hydrological drought to meteorological drought became faster and that the drought propagation time became shorter from upstream to downstream.
4. Discussion
4.1. Selection of Meteorological Drought Index
In our research, the SPEI was selected for a comparative analysis characterizing the meteorological drought events in the YLB; the PSDI was not selected because it could not characterize multiple time scales. Compared with the SPEI, the SPI takes precipitation as a meteorological element into consideration without accounting for the influence of evapotranspiration; the SPEI also describes the extreme values more prominently (Figure 8). An analysis of the meteorological droughts of the basin at different time scales between 1960 and 2020 revealed that the variation trends of the SPI and SPEI were largely consistent, so the SPEI is enough for the meteorological drought analysis. The evapotranspiration data were derived from the Penman–Monteith equation using temperature, wind speed, relative humidity, and sunshine duration from the measured stations. To some extent, the SPEI provides a more comprehensive description of the meteorological conditions in the YLB compared with the SPI because SPI only applies precipitation data. Zhang has previously described the spatial distribution of autumn drought trends in China from 1961 to 2014 using the SPI and SPEI indices. The differences between SPI and SPEI were analyzed in characterizing those trends in China. When calculating the spatial distribution of potential evapotranspiration trends, the author observed that the potential evapotranspiration of the YLB could not be neglected and that the YLB had a significant drying trend in autumn [32]. By comparing the spatial distribution of the P and D trends, it was also found that the trends of these two variables have roughly similar spatial distribution. Moreover, it has been shown that the precipitation and evapotranspiration vary in different seasons, given that the potential evapotranspiration could facilitate the analysis of seasonal drought propagation. Therefore, in this paper, the SPEI was chosen to describe the evolutionary trend of the meteorological drought in the YLB.
4.2. The Impact of Drought Transmission in the Watershed on Hydropower Generation
The analysis of meteorological drought at the annual scale in the paper showed that in the upper, middle, and lower reaches of the Yalong River, the meteorological drought was more frequent in the upper reaches as represented by GZB and DFB, slightly less frequent in the middle reaches as represented by YJB, and the least frequent in the lower reaches as represented by LNB. On the other hand, the hydrological drought was the most frequent in the lower reaches, followed by the middle reaches and the upper reaches. It can also be seen that the meteorological and hydrological droughts propagated faster in the lower reaches. The YLB’s main stream has a theoretical hydro energy reserve of 22 million kW, which is developed in 21 cascades, including 10 cascade hydropower stations in the upper reaches and 6 cascade hydropower stations in the middle reaches. The current development of hydro energy resources is concentrated on the lower reaches of the river, and the planned five cascade hydropower stations have been largely completed. It is of great significance to pay attention to the drought propagation in the basin for the hydroelectric power project in the basin.
There is a solid basis for quantifying the propagation time through the correlation between meteorological and hydrological droughts. However, it should be noted that one of the major factors affecting the accuracy of drought propagation time is the identification level of drought events. The identification level depends on the classification criteria of drought, while the change of the classification criteria may affect the drought frequency and thus the propagation of drought. In this study, hydrological drought was defined using the same classification criteria as meteorological drought. The same criteria were adopted, and certain findings were derived. Drought can be more accurately identified by using different classification criteria for different regions. Any linkage between meteorological and hydrological droughts may be highly influenced by the characteristics of the basin and local climate, and drought propagation time would be affected by changes in land use and land area covered, especially regarding the number of forests or pastures [33,34,35,36]. Moreover, human activities altered the storage function and runoff generation and confluence of rivers and groundwater systems, thus directly leading to the propagation from meteorological drought to hydrological drought. There is an approximately 67.7% degree of influence that is caused by human activities on the occurrence of hydrological drought. Extant studies have indicated that the meteorology, underlying surface, and human activities all significantly influence the time of drought propagation [37].
However, this study mainly analyzed the propagation time of meteorological and hydrological droughts under natural conditions, neglecting the influence of human activities; thus, it is incompatible with the reality of the location. An in-depth investigation should be subsequently performed.
5. Conclusions
Using the data from nine surface meteorological stations and four hydrological stations in the YLB from 1960 to 2019, we analyzed the interannual, seasonal, and monthly drought frequencies based on the SPEI and SRI values. Moreover, we explored the propagation properties of meteorological and hydrological droughts. The main conclusions were as follows:
The frequencies of meteorological and hydrological drought in the YLB in the past 60 years were 28.3% and 34.0%, respectively. Only mild drought and moderate drought occurred for meteorological drought, but four types of drought occurred for hydrological drought. Two or three continuous years of successive drought events occurred in both the meteorology and hydrology dimensions. The SPEI and SRI values increased at a rate of 0.103/10a and 0.087/10a, respectively, indicating that both meteorological and hydrological droughts were mitigated. However, the rate of the hydrological drought slows down less than that of the meteorological drought. From upstream to downstream, the dry–wet cycle lengthens and the wet–dry alternation significantly increased, however, the drought frequency decreased.
On the seasonal scale, the frequencies of meteorological drought in the four seasons of the YJB were 23.3%, 21.7%, 26.7%, and 21.7%, respectively, and the frequencies of hydrological drought were 30.2%, 24.5%, 34.0%, and 41.5%, respectively. The frequency of meteorological drought was high in autumn, and hydrological drought was high in autumn and winter. The frequency of drought was high in the upper reaches of the basin. On a monthly scale, severe and exceptional meteorological droughts were more likely to occur from March to May, and severe and exceptional hydrological droughts were more likely to occur in January, March, October, and December. During the year, the frequency of hydrological drought was much higher than that of meteorological drought, and even severe drought and exceptional drought occurred.
The meteorological and hydrological droughts in the YLB propagate during the same period, and the drought did not significantly lag in the process of propagation but instead expanded. The meteorological and hydrological droughts of the basin in summer and autumn were closely related. The duration of drought propagation was the shortest (only 1 month) in the rainy season from June to October. From upstream to downstream, the response of hydrological drought to meteorological drought became faster, and the drought propagation time became shorter.
Author Contributions
Conceptualization, K.Z. and Y.X.; methodology, Y.X. and F.L.; software, Y.X. and M.J.; validation, Y.X., M.G. and X.H.; data curation, Y.X., D.L. and X.S.; writing—original draft preparation, Y.X.; writing—review and editing, K.Z., F.L. and Y.X.; visualization, Y.X.; funding acquisition, K.Z. and F.L. All authors have read and agreed to the published version of the manuscript.
Funding
This research study was financially supported by the Second Tibetan Plateau Scientific Expedition and Research Program (STEP) (Grant No. 2019QZKK0207), the National Natural Science Foundation of China (No. 52279029 and U2240201) and the Natural Science Foundation of Xinjiang Uygur Autonomous Region (No. 2022D01C41).
Conflicts of Interest
The authors declare no conflict of interest.
References
- Obasi, P.G. WMO’s Role in the International Decade for Natural Disaster Reduction. Bull. Am. Meteorol. Soc. 1994, 9, 1655–1661. [Google Scholar] [CrossRef]
- Wilhite, D.A.; Glantz, M.H. Understanding the drought phenomenon: The Role of Definitions. Water Int. 1985, 10, 111–120. [Google Scholar] [CrossRef] [Green Version]
- Yao, F. Combination of multi-sensor remote sensing data for drought monitoring over Southwest China. Int. J. Appl. Earth Obs. Geoinf. 2015, 35, 270–283. [Google Scholar]
- Gu, L.; Chen, J.; Yin, J.B.; Guo, Q.; Wang, H.M.; Zhou, J.Z. Risk propagation from meteorological to hydrological droughts in achanging climate for main catchments in China. Adv. Water Sci. 2021, 32, 321–333. [Google Scholar]
- Wu, J.F.; Chen, X.W.; Love, C.A.; Yao, H.X.; Chen, H.X.; AghaKouchak, A. Determination of water required to recover from hydrological drought: Perspective from drought propagation and non-standardized indices. J. Hydrol. 2021, 590, 125227. [Google Scholar] [CrossRef]
- Eltahir, E.A.B.; Yeh, P.J.F. On the asymmetric response of aquifer water level to floods and droughts in Illinois. Water Resour. Res. 1999, 4, 1199–1217. [Google Scholar] [CrossRef] [Green Version]
- Yuan, X.; Zhang, M.; Wang, L.Y.; Zhou, T. Understanding and seasonal forecasting of hydrological drought in the Anthropocene. Hydrol. Earth Syst. Sci. Discuss. 2017, 21, 5477–5492. [Google Scholar] [CrossRef] [Green Version]
- Alena, G.; Pedro, L.B.C.; Vinicius, B.P.C.; AghaKouchak, A. Spatial and temporal patterns of propagation from meteorological to hydrological droughts in Brazil. J. Hydrol. 2021, 603, 126902. [Google Scholar]
- Li, Y.; Xi, J.; Zhang, C.; Wang, G.Q.; Huang, Q.; Guan, T.S.; Lu, J.; Zhou, H.C. Impact of climate change on the spatio-temporal characteristics of meteorological and hydrological drought over the Lancang-Mekong River basin. Adv. Water Sci. 2021, 32, 508–519. [Google Scholar]
- Liu, W.L.; Zhu, S.N.; Liu, L.N.; Wan, Y.F.; Huang, Y.P. Temporal and Spatial Characteristics of Drought and Its Relationship with ENSO in Poyang Lake Basin Based on SPEI from 1958 to 2018. China Rural Water Hydropower 2020, 450, 116–123+128. [Google Scholar]
- Zhang, X.; Xu, Y.; Hao, F.H.; Hao, Z.C. Characteristics and risk analysis of drought propagation from meteorological drought to hydrological drought in Luanhe River Basin. J. Hydraul. Eng. 2022, 53, 165–175. [Google Scholar]
- Li, Q.F.; He, P.F.; He, Y.C.; Han, X.Y.; Zeng, T.S.; Lu, G.B.; Wang, H.J. Investigation to the relation between meteorological drought and hydrological drought in the upper Shaying River Basin using wavelet analysis. Atmos. Res. 2019, 234, 104743. [Google Scholar] [CrossRef]
- Shi, P.; Tang, H.; Qu, S.M.; Wen, T.; Zhao, L.L.; Li, Q.F. Propagation from meteorological drought to hydrological drought in Southwest China. Water Resour. Prot. 2023, 39, 49–56. [Google Scholar]
- Wu, J.F.; Chen, X.H.; Yao, H.X.; Zhang, D.J. Multi-timescale assessment of propagation thresholds from meteorological to hydrological drought. Sci. Total Environ. 2021, 765, 144232. [Google Scholar] [CrossRef]
- Sun, Z.L.; Zhu, X.F.; Pan, Y.Z.; Zhang, J.S.; Liu, X.F. Drought evaluation using the GRACE terrestrial water storage deficit over the Yangtze River Basin, China. Sci. Total Environ. 2018, 634, 727–738. [Google Scholar] [CrossRef]
- Dai, A. Characteristics and trends in various forms of the Palmer Drought Severity Index during 1900–2008. J. Geophys. Res.-Atmos. 2011, 116, 0148–0227. [Google Scholar] [CrossRef] [Green Version]
- Mckee, T.B.; Doesken, N.J.; Kleist, J. The relationship of drought frequency and duration to time scales. In Proceedings of the 8th Conference on Applied Climatology, Anaheim, CA, USA, 17–22 January 1993; American Meteorological Society: Boston, MA, USA, 1993. [Google Scholar]
- Zhang, Q.F. Impacts of Different Socioeconomic Development Levels on Extremely Wet/Dry Events in Mainland China. Water 2022, 14, 3950. [Google Scholar] [CrossRef]
- Rupesh, D. Is tree ring chronology of blue pine (Pinus wallichiana A. B. Jackson) prospective for summer drought reconstruction in the Western Himalaya? J. Asian Earth Sci. 2022, 229, 105142. [Google Scholar] [CrossRef]
- Ndayiragije, J.M. Assessment of Two Drought Indices to Quantify and Characterize Drought Incidents. Atmosphere 2022, 13, 1882. [Google Scholar] [CrossRef]
- Zhao, L.; Lyu, A.; Wu, J.J. Impact of meteorological drought on streamflow drought in Jinghe River basinof China. Chin. Geogr. Sci. 2014, 24, 694–705. [Google Scholar] [CrossRef]
- Huang, S.Z.; Li, P.; Huang, Q. The propagation from meteorological to hydrological drought and its potential influence factors. J. Hydrol. 2017, 547, 184–195. [Google Scholar] [CrossRef]
- Wu, J.F.; Chen, X.W.; Gao, L. Response of hydrological drought to meteorological drought and its critical conditions. Catastrophology 2017, 32, 199–204. [Google Scholar]
- Lorenzo-Lacruz, J.; Vicente-Serrano, S.M.; Gonzalez-Hidalgo, J.C. Hydrological drought response to meteorological drought in the Iberian Peninsula. Clim. Res. 2013, 58, 117–131. [Google Scholar] [CrossRef] [Green Version]
- Wei, R.; Liu, J.; Li, S.J. Attribution analysis of runoff variation in the upper-middle reaches of Yalong River. Resour. Environ. Yangtze Basin 2020, 29, 1643–1652. [Google Scholar]
- Huang, K. Study on Climate Extreme Change and Runoff Response of Yalong River Basin under the Background of Climate Change; China Three Gorges University: Yichang, China, 2020. [Google Scholar]
- China Meteorological Administration. Grades of Meteorological Drought. Available online: https://openstd.samr.gov.cn/bzgk/gb/newGbInfo?hcno=D2281945A96E8185F67EDC9E7A698049 (accessed on 29 December 2022).
- Shukla, S.; Wood, A.W. Use of a standardized runoff index for characterizing hydrologic drought. Geophys. Res. Lett. 2008, 35, 226–236. [Google Scholar] [CrossRef] [Green Version]
- Xu, Y.R.; Lu, F.; Xie, Z.B.; Zhu, K.; Song, X.Y. Characteristics and responses of hydrological and meteorological drought in Chaobai River Basin. Agric. Res. Arid. Areas 2019, 37, 220–228. [Google Scholar]
- Wu, H.M.; Lyu, A.F.; Zhang, W.X. Response of hydrologic drought to meteorological drought in the Bayin River basin. South-North Water Transf. Water Sci. Technol. 2022, 20, 459–467. [Google Scholar]
- Zhang, X.Y. Detection and Attribution of Autumn Drought in China Based on SPI and SPEI; Nanjing University of Information Science & Technology: Nanjing, China, 2022. [Google Scholar] [CrossRef]
- Wang, Z.X.; Mu, Z.X.; Zhou, Y.L. Applicability analysis of different hydrological drought indices in the western mountainous areas of the Tianshan Mountains. Water Resour. Power 2020, 38, 16–19,82. [Google Scholar]
- Li, L.P.; Lu, T.S.; Liu, M.C. Hydrological drought characteristics of the Shiyang River Basin based on standardized flow index (SDI). Chin. Desert 2020, 40, 24–33. [Google Scholar]
- Van, L.; Wanders, N.; Tallaksen, L.M. Hydrological drought across the world: Impact of climate and physical catchment structure. Hydrol. Earth Syst. Sci. 2013, 17, 1715–1732. [Google Scholar]
- Wu, J.W.; Miao, C.Y.; Zheng, H. Meteorological and hydrological drought on the Loess Plateau, China: Evolutionary characteristics, impact, and propagation. J. Geophys. Res. Atmos. 2018, 123, 11569–11584. [Google Scholar] [CrossRef]
- Wang, W.; Wang, J.S.; Tao, Y.Y. Research on the impact of human activities on the formation and development of hydrological droughts. Hydrology 2020, 40, 1–8. [Google Scholar]
- Zhang, L.; Zhu, Z.Z.; Wang, H.M. Analysis of the characteristics and influencing factors of hydrological drought evolution in the Xilin River Basin. J. Soil Water Conserv. 2020, 34, 178–184,192. [Google Scholar]
Figure 1.
Distribution of the water system and stations in the YLB.

Figure 2.
Interannual variation of the SPEI (a–d) and SRI (e–h) in the YLB from 1960 to 2019, including GZB (a,e), DFB (b,f), YJB (c,g), and LNB (d,h).
Figure 2.
Interannual variation of the SPEI (a–d) and SRI (e–h) in the YLB from 1960 to 2019, including GZB (a,e), DFB (b,f), YJB (c,g), and LNB (d,h).

Figure 3.
Drought frequency in different seasons in the YLB from 1960 to 2019; (a–d) indicate meteorological drought, while (e–h) indicate hydrological drought; spring (a,e), summer (b,f), autumn (c,g), and winter (d,h).
Figure 3.
Drought frequency in different seasons in the YLB from 1960 to 2019; (a–d) indicate meteorological drought, while (e–h) indicate hydrological drought; spring (a,e), summer (b,f), autumn (c,g), and winter (d,h).

Figure 4.
Interannual variation of drought intensity in different seasons in the YJB from 1960 to 2019. (a–d) indicate spring, summer, fall, and winter, respectively.
Figure 4.
Interannual variation of drought intensity in different seasons in the YJB from 1960 to 2019. (a–d) indicate spring, summer, fall, and winter, respectively.

Figure 5.
Monthly variation of drought frequency in the YJB from 1960 to 2019.

Figure 6.
Comparison curve of SPEI12 and SRI12 in the same period in the LNB. Drought events (drought index value < −0.5) are shown as gray areas.
Figure 6.
Comparison curve of SPEI12 and SRI12 in the same period in the LNB. Drought events (drought index value < −0.5) are shown as gray areas.

Figure 7.
Correlation coefficient plot between SPEIk and SRI1. (a–d) Indicates the four sub-basins of GZB, DFB, YLB, and LNB. The black dots indicate the monthly scale with the highest correlation coefficient.
Figure 7.
Correlation coefficient plot between SPEIk and SRI1. (a–d) Indicates the four sub-basins of GZB, DFB, YLB, and LNB. The black dots indicate the monthly scale with the highest correlation coefficient.

Figure 8.
Comparison of the SPI with the SPEI.


Table 1.
Drought classification of the SPEI.
| Category | Wet | No Drought | Mild Drought | Moderate Drought | Severe Drought | Exceptional Drought |
|---|---|---|---|---|---|---|
| SPEI | (0.5, +∞) | (−0.5, 0.5] | (−1.0, −0.5] | (−1.5, −1.0] | (−2.0, −1.5] | (−∞, −2.0] |
Table 2.
Interannual drought frequency in the YLB from 1960 to 2019.
| Basin | Meteorological Drought Frequency/% | ||||
|---|---|---|---|---|---|
| Drought | Mild Drought | Moderate Drought | Severe Drought | Exceptional Drought | |
| GZB | 35.0 | 23.3 | 8.3 | 3.3 | 0.0 |
| DFB | 33.3 | 20.0 | 10.0 | 1.7 | 1.7 |
| YJB | 31.7 | 21.7 | 8.3 | 1.7 | 0.0 |
| LNB | 28.3 | 18.3 | 10.0 | 0.0 | 0.0 |
| Basin | Hydrological DroughtFrequency/% | ||||
| Drought | Mild Drought | Moderate Drought | Severe Drought | Exceptional Drought | |
| GZB | 31.8 | 11.4 | 13.6 | 6.8 | 0.0 |
| DFB | 29.1 | 10.9 | 10.9 | 5.5 | 1.8 |
| YJB | 34.0 | 13.2 | 15.1 | 3.8 | 1.9 |
| LNB | 39.6 | 20.8 | 12.5 | 6.3 | 0.0 |
Table 3.
Correlation between the SPEI and SRI at different time scales and meteorological-hydrological lag time correlation in the YLB.
Table 3.
Correlation between the SPEI and SRI at different time scales and meteorological-hydrological lag time correlation in the YLB.
| Basin | SPEI and SRI at Different Time Scales | Number of Months Lagged | |||||||
|---|---|---|---|---|---|---|---|---|---|
| 1 | 3 | 6 | 9 | 12 | 0 | 1 | 2 | 3 | |
| GZB | 0.494 ** | 0.610 ** | 0.698 ** | 0.740 ** | 0.756 ** | 0.756 ** | 0.727 ** | 0.662 ** | 0.576 ** |
| DFB | 0.401 ** | 0.490 ** | 0.569 ** | 0.575 ** | 0.569 ** | 0.569 ** | 0.565 ** | 0.530 ** | 0.474 ** |
| YJB | 0.488 ** | 0.613 ** | 0.780 ** | 0.834 ** | 0.837 ** | 0.837 ** | 0.819 ** | 0.755 ** | 0.665 ** |
| LNB | 0.474 ** | 0.589 ** | 0.749 ** | 0.808 ** | 0.821 ** | 0.821 ** | 0.818 ** | 0.761 ** | 0.672 ** |
| Basin | Number of Months Lagged | ||||||||
| 4 | 5 | 6 | 7 | 8 | 9 | 10 | 11 | 12 | |
| GZB | 0.489 ** | 0.406 ** | 0.323 ** | 0.243 ** | 0.163 ** | 0.08 | −0.003 | −0.081 | −0.144 ** |
| DFB | 0.419 ** | 0.368 ** | 0.320 ** | 0.275 ** | 0.230 ** | 0.183 ** | 0.133 ** | 0.089 * | 0.06 |
| YJB | 0.575 ** | 0.491 ** | 0.408 ** | 0.327 ** | 0.246 ** | 0.165 ** | 0.089 * | 0.017 | −0.044 |
| LNB | 0.581 ** | 0.492 ** | 0.405 ** | 0.320 ** | 0.235 ** | 0.153 ** | 0.077 | 0.009 | −0.048 |
Notes: ** indicates a significant correlation at the 0.01 level (two-tailed); * indicates a significant correlation at the 0.05 level (two-tailed).
Disclaimer/Publisher’s Note: The statements, opinions and data contained in all publications are solely those of the individual author(s) and contributor(s) and not of MDPI and/or the editor(s). MDPI and/or the editor(s) disclaim responsibility for any injury to people or property resulting from any ideas, methods, instructions or products referred to in the content. |
© 2023 by the authors. Licensee MDPI, Basel, Switzerland. This article is an open access article distributed under the terms and conditions of the Creative Commons Attribution (CC BY) license (https://creativecommons.org/licenses/by/4.0/).
Share and Cite
MDPI and ACS Style
Zhu, K.; Xu, Y.; Lu, F.; Sun, X.; Gao, M.; Han, X.; Li, D.; Jiang, M. Spatio-Temporal Evolution and Propagation of Meteoro-Hydrological Drought in Yalong River Basin. Water 2023, 15, 1025. https://doi.org/10.3390/w15061025
AMA Style
Zhu K, Xu Y, Lu F, Sun X, Gao M, Han X, Li D, Jiang M. Spatio-Temporal Evolution and Propagation of Meteoro-Hydrological Drought in Yalong River Basin. Water. 2023; 15(6):1025. https://doi.org/10.3390/w15061025
Chicago/Turabian StyleZhu, Kui, Yang Xu, Fan Lu, Xueying Sun, Mingxing Gao, Xuhang Han, Dongsheng Li, and Ming Jiang. 2023. "Spatio-Temporal Evolution and Propagation of Meteoro-Hydrological Drought in Yalong River Basin" Water 15, no. 6: 1025. https://doi.org/10.3390/w15061025
Note that from the first issue of 2016, this journal uses article numbers instead of page numbers. See further details here.