
An Expanded Interpretive Structural Modeling Analysis of the Barriers to Integrated Flood Risk Management Adaptation in Metro Manila
1
Department of Civil Engineering, University of Santo Tomas, España Blvd, Sampaloc, Manila 1008, Metro Manila, Philippines
2
Department of Civil and Environmental Engineering, Tokyo Metropolitan University, 1-1 Minami-Osawa, Hachioji, Tokyo 192-0397, Japan
3
Woodfields Consultants, Inc., 153 Kamias Road Extension, Kamias 1102, Kamias Rd, Diliman, Quezon City 1102, Metro Manila, Philippines
*
Authors to whom correspondence should be addressed.
Water 2023, 15(6), 1029; https://doi.org/10.3390/w15061029
Submission received: 27 November 2022
/
Revised: 20 February 2023
/
Accepted: 2 March 2023
/
Published: 8 March 2023
(This article belongs to the Special Issue Urban Water-Related Problems)
Abstract
:The implementation of integrated flood risk management (IFRM) is still in its infancy in both developed and developing countries, yet some countries have already encountered barriers to IFRM adaptation. The interrelationships between these barriers need to be determined and analyzed systematically, as such an analysis is the groundwork for decision-making when devising solutions to overcome the barriers. Interpretive Structural Modeling (ISM) is a popular and systematic method for analyzing the interrelationship between variables in broad study areas. This study applies the proposed expanded ISM (Ex-ISM) approach to comprehensively analyze the interrelationships between the barriers to IFRM in Metro Manila. Ex-ISM enhances conventional ISM in that the symbolism is modified to explicitly show the contextual interrelationships, the step for hierarchy assignment is simplified, and the diagram shows all of the interrelationships that allow a comprehensive analysis. The results obtained using the Ex-ISM method do not deviate from those yielded by the conventional ISM method, but the Ex-ISM method allows an easy assignment of hierarchy, and it shows not only the direct but also the indirect interrelationships to provide a comprehensive analysis of the relationships between the barriers.
1. Introduction
Integrated flood risk management (IFRM) has been increasingly implemented in many developed and developing countries because the traditional approach to flood control and prevention using structural measures or hard engineering interventions fails to cope with the residual risks brought on by extreme weather events [1]. IFRM is a relatively modern approach that includes non-structural measures, not only structural measures, the non-structural measures being those that do not require any physical construction but use policy, knowledge, and practice to reduce flood risks and impacts, in particular through policies and laws, public awareness-raising, training, and education [2]. IFRM prioritizes more non-structural measures as it aims to proactively manage flood risks by “keeping people away from water” rather than “keeping water away from people” [3]. So far, most research on IFRM heavily concentrates on the hydrological and hydraulic processes.
Among the megacities in Asia, Metro Manila, the Philippines’ center of political and economic activities, is considered to be the most at risk of climate impacts, mainly due to its exposure to tropical cyclones [4]. Flooding has been the most frequent natural disaster and a major cause of destruction in Metro Manila, in which the most disastrous flooding in the last decades was brought by Typhoon Ketsana in September 2009 [5]. In the Philippines, an IFRM Master Plan was established in 2012 after the onslaught of Typhoon Ketsana. The transition to IFRM from traditional flood protection, however, had been difficult due to the critical issues or obstacles identified as “barriers” that hindered a smooth adaption to this approach. Therefore, identifying the barriers to IFRM adaptation is an essential task so that decision-makers and practitioners can devise an appropriate, realistic course of action and propose the required policy changes to overcome them.
In developed countries, the identified barriers are mostly related to governance and include issues such as political opposition, economic tensions, fragmented governance structures, and weak enforcement of building restrictions [1,6,7,8,9,10]. Meanwhile, the research on barriers to IFRM adaptation in developing countries remains limited to almost no studies except for authors’ previous study [5]. We have identified barriers to IFRM in Metro Manila, and it is found that they are multifaceted and numerous, and some are unique and are expected to be more severe and alarming than those found in developed countries [5].
After identifying the barriers to IFRM adaptation, understanding their interrelationships is also crucial, since barriers are often interrelated with one another as they can alleviate, augment, reinforce, or trigger one another [11]. A systematic analysis of barrier interrelationships is imperative so that decision-makers can make a rational assessment rather than an intuitive judgment when devising a plan to overcome the barriers. However, the interrelationships between the barriers to IFRM adaptation have not been analyzed yet, and there is no universally accepted framework within which such barriers are analyzed, as far as the authors know.
One systematic approach that can be used for barrier analysis is the Interpretive Structural Modeling (ISM) method. The ISM method is popular for analyzing the interrelationships among issues, concerns, or variables in a complex problem. It offers to translate ill-articulated variables in a problem into a structural diagram that shows the contextual, direct interrelationships and the hierarchy among the variables. The advantages of this method compared to other methods such as structural equation modeling (SEM), the Delphi method, or the Analytic Hierarchy Process (AHP) include to following: (1) no requirement for large or statistical datasets, whereas SEM requires a priori statistical data [12], (2) fewer required experts, as even an individual can apply this method, whereas SEM and the Delphi method gather data from a large number of experts/respondents [13], and (3) the display of both the interrelation and the hierarchy (ranking) of the variables, whereas the Delphi Method and AHP only shows the ranking [14,15]. These advantages have contributed to its popularity in broad areas of study, such as systems engineering [16], waste management [11,17], supplier selection [18,19], supply chain flexibility [20,21], and knowledge management [22], among others. However, the ISM method has not yet been applied to the barriers related to natural hazards and disaster risk reduction management, such as IFRM. Consequently, we tried to apply the ISM method in order to analyze the interrelationships between the barriers to IFRM adaptation in Metro Manila for the first time, using the conventional ISM method with some modifications [5].
Since the development of ISM in the 1970s, there have been only minor modifications or improvements to this method, and most studies have only applied the original ISM method. Sushil [23,24] proposed three modifications in ISM, and the first two modifications led to the modified approach called Total ISM (TISM). Sushil [23,24] proposed (1) the interpretation of the links (arrows) in the ISM diagram using an interpretative matrix to explain “why” or “how” the interrelationship exists, (2) the inclusion of significant indirect interrelationships in the ISM diagram, and (3) the use of a simultaneous pairwise comparison and transitivity check to lessen the efforts for these repetitive tasks. Despite these modifications, the numerical representations of the four types of contextual relationships in ISM do not explicitly represent the active and passive interrelations because of the use of binary values (0 and 1), which may intuitively indicate the non-existence or existence of a relationship. In addition, identifying the hierarchy among the variables is a very tedious task, especially when the number of variables considered becomes higher due to repetitive tasks in a step. For these reasons, we believe there is a need to modify some of the steps in ISM so that analyzing the results of the interrelationships between the barriers to IFRM adaptation, especially for developing countries, can become intuitive, straightforward, and comprehensive. Hence, this study proposes an expanded ISM (Ex-ISM) approach that enhances some of the steps in conventional ISM.
The primary objective of this study is to intuitively and easily determine the comprehensive interrelationships among the barriers to IFRM adaptation in Metro Manila using the proposed Ex-ISM method. The following sections describe the barriers to IFRM adaptation in Metro Manila and the proposed Ex-ISM method; elaborate on the application of the proposed method to the barriers to IFRM adaptation in Metro Manila; present the results and compare them with the results given by the conventional method; and give the conclusions.
2. Materials and Methods
2.1. Barriers to IFRM Adaptation in Metro Manila
We conducted a literature review to identify the barriers to IFRM adaptation in Metro Manila. Journal articles, books, and reports published in the last two decades that discuss issues in flood management in Metro Manila were used to identify the barriers to IFRM adaptation in Metro Manila. The reviewed articles related to Metro Manila’s flood problem include 15 internationally published papers; 2 locally published papers in the Philippines; 3 project reports from the Department of Public Works and Highways (DPWH) completed in 2000, 2004, and 2013; and 2 books that feature case studies from Metro Manila. The barriers to IFRM adaptation in Metro Manila were noted if they are recurring issues concerning flood management or are cited at least once in the literature.
As for the investigation’s results, 12 barriers to IFRM adaptation in Metro Manila were identified and are shown in Table 1 with their descriptions, and these were categorized into three categories: governance, social, and technological resources. The barriers identified are relatively numerous, and some are unique to developed countries because of the socio-economic conditions of a developing country.
The barriers presented in Table 1 are time-dependent and may vary for each location. However, in this study, the identified barriers in Table 1 are given condition as materials for both conventional and expanded ISM. Both approaches only deal with the interrelationships among the given barriers, so they do not deal with the temporal and spatial issues among them. The temporal and spatial issues will be considered in detail before applying in the ISM methods. In this study, under the same given condition for both conventional and expanded ISM, we attempted to compare how Ex-ISM is different from conventional ISM.
2.2. Expanded Interpretive Structural Modeling (Ex-ISM)
Warfield developed ISM in the 1970s [25,26]. ISM is a structural modeling method that determines the interrelations between variables in complex issues or systems. ISM transforms unclear and poorly articulated variables into a structural model or diagram by employing discrete mathematics and elementary graph theory so that theoretical, conceptual, and computational leverage is efficiently exploited [20]. This method’s output is a diagram showing interrelationships through directed links or arrows and the hierarchy between variables. This ISM diagram aids users, decision-makers, or practitioners in visualizing, interpreting, and understanding the variables, which can help them devise solutions to the problem [27,28].
This study proposes an expanded ISM (Ex-ISM) method, which enhances the numerical representation of the four contextual relations by expanding them from binary to trinary values (0, 1, and −1). The trinary values can express active and passive interrelations using 1 and −1, respectively. Expanded Boolean multiplication and addition operations are introduced so that ISM can accommodate the calculation of trinary values. The proposed Ex-ISM method further simplifies the tedious, repetitive tasks involved in assigning the hierarchy (levels), and it aims to present comprehensive interrelationships among the barriers by showing the indirect interrelationships, not only the direct ones, in the ISM diagram. Indirect interrelationships indicates that, between two barriers with a direct interrelationship, there may be another barrier that can be influenced by the two.
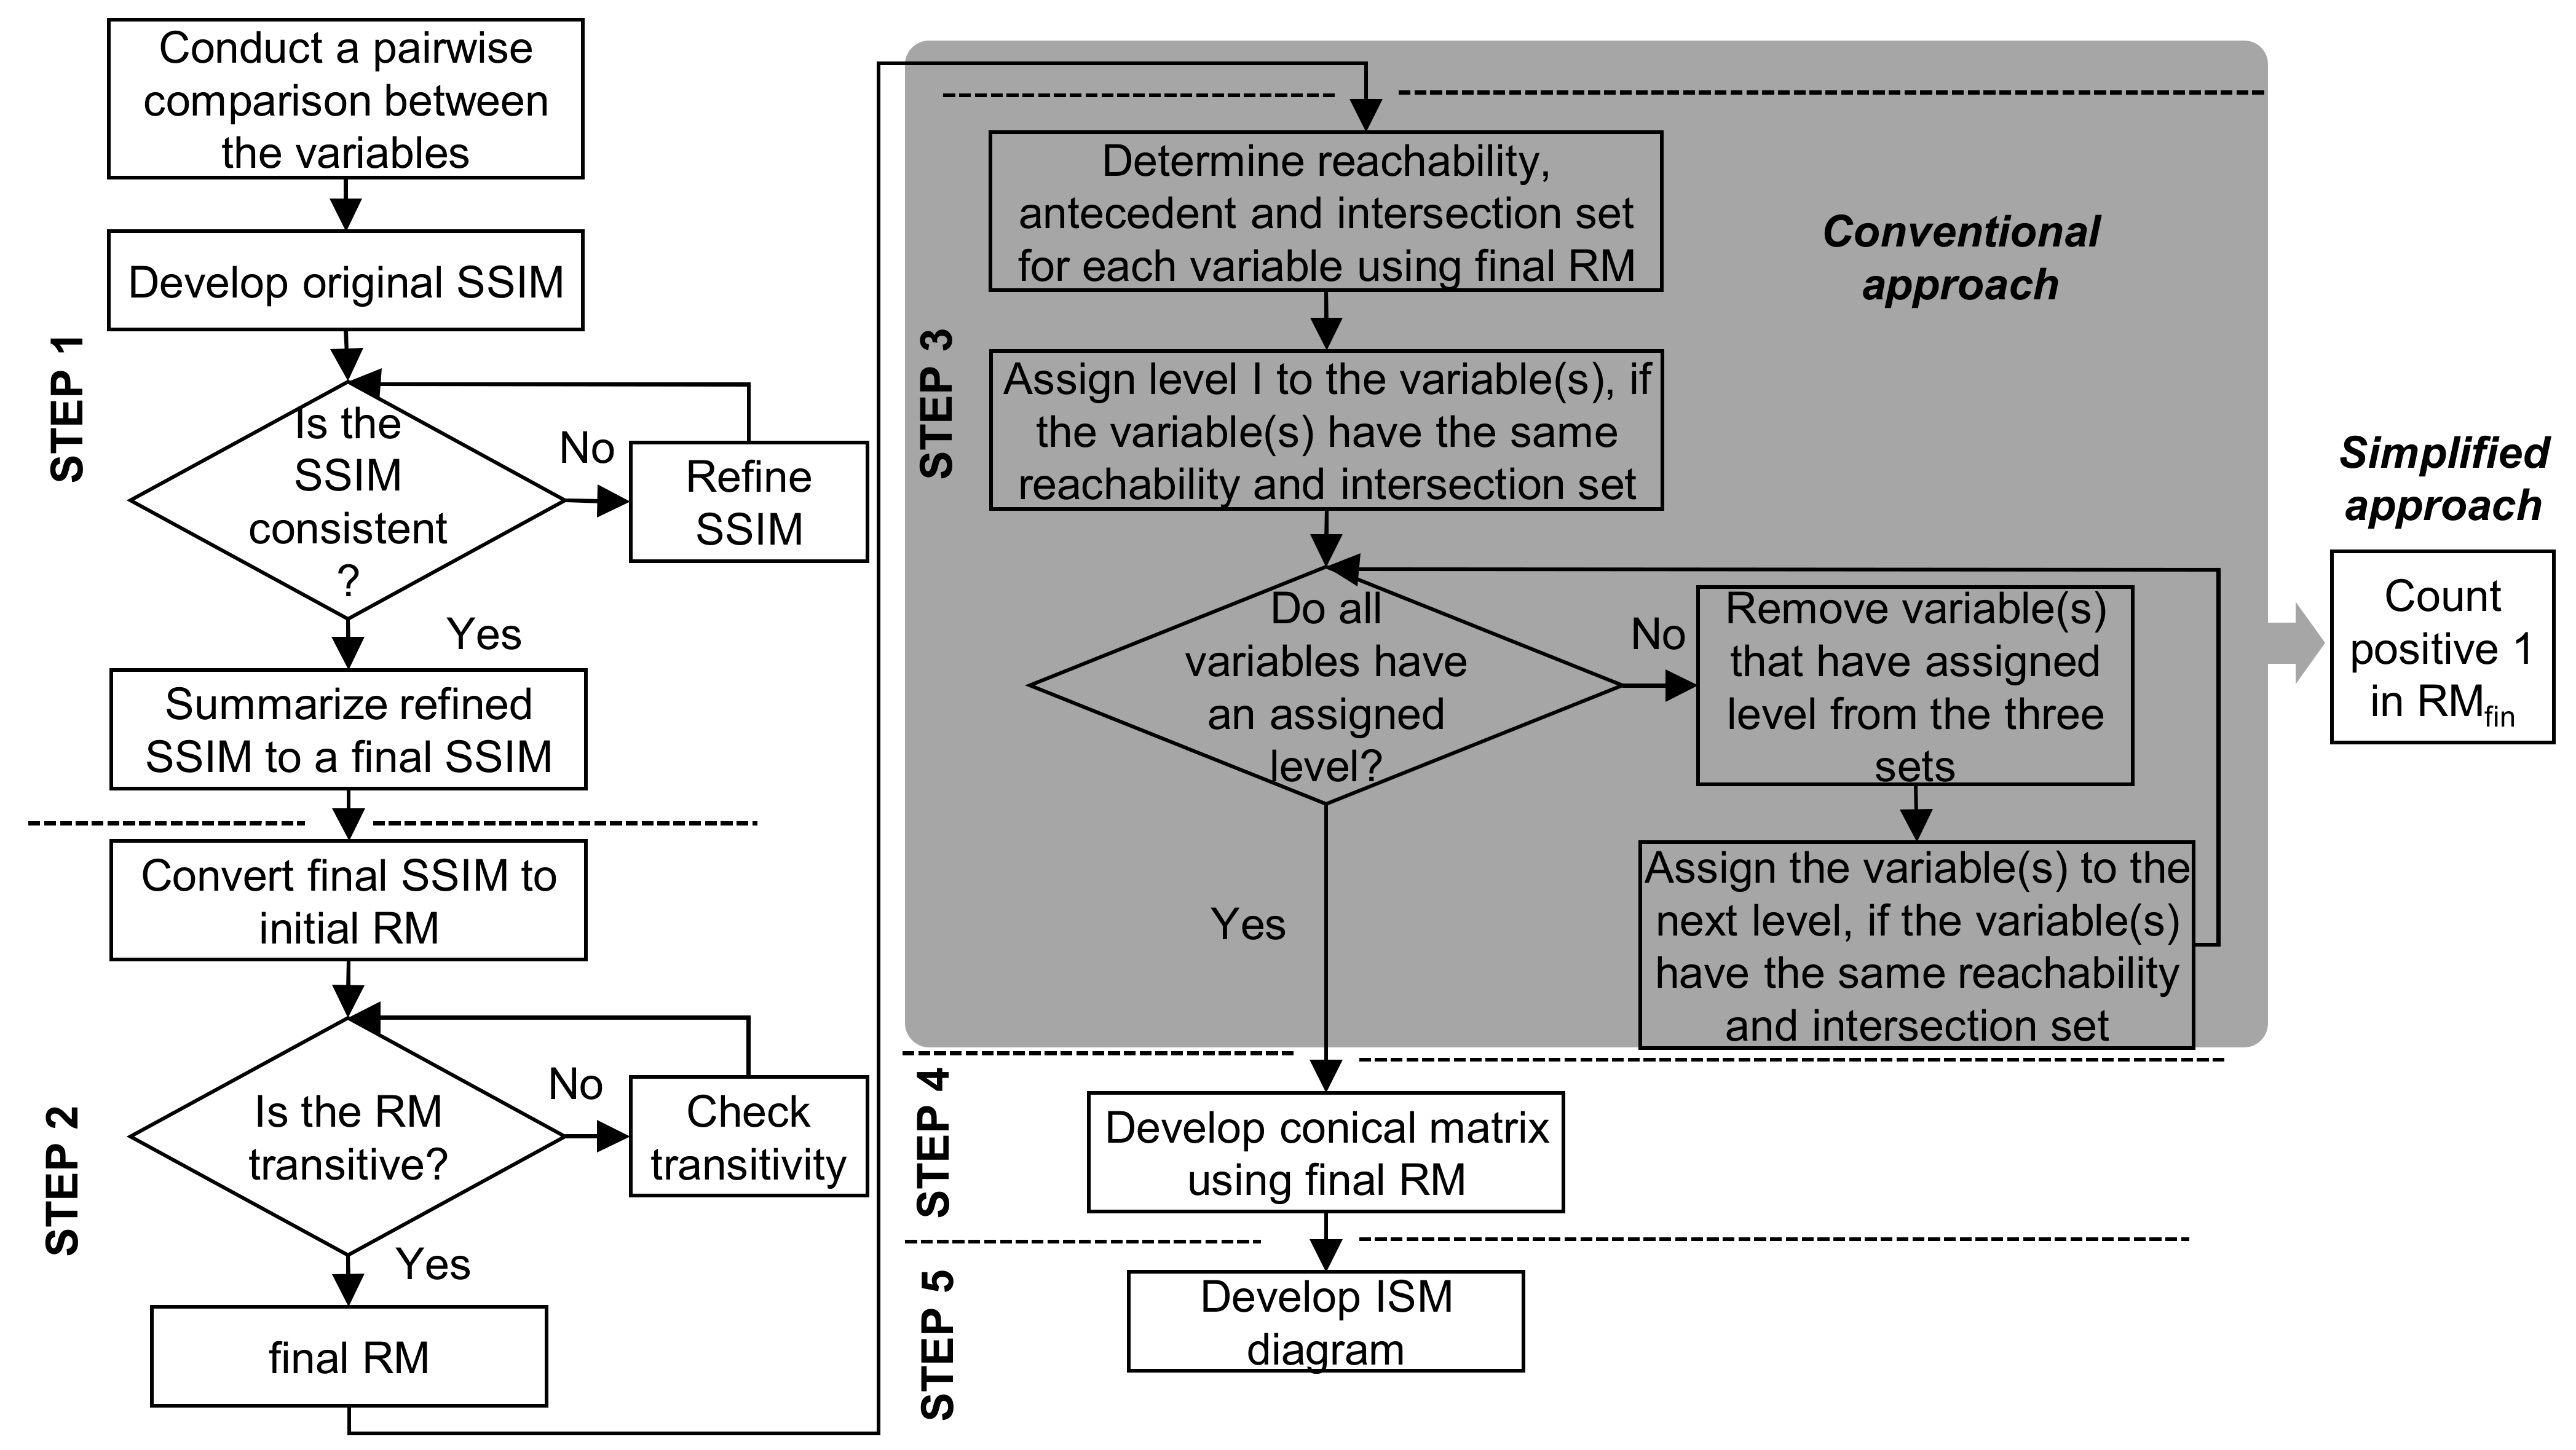
Fundamentally, conventional ISM has five steps [29], as shown in Figure 1. In the proposed Ex-ISM approach, Step 1 and Step 2 are expanded, and Step 3 is simplified, as depicted in Figure 1. The succeeding paragraphs discuss in detail the expansion and simplification proposed in this study.
2.2.1. Step 1—Developing a Structural Self-Interaction Matrix (SSIM)
Pairwise comparisons between the identified variables are conducted first to develop the SSIM. The pairwise comparisons can be conducted individually or in a group, so ISM is often considered a group learning tool [30]. A contextual relationship of the “leads to” or “influences” type must be chosen for the pairwise comparison [29]. In this study, only five experts were asked to establish the SSIM because it is extremely difficult to find experts with overarching experience in flood control and management in Metro Manila. The 5 identified experts have more than 20 years of experience and are members of the mandated national government agency in charge of flood control planning and implementation in the Philippines.
There are four types of interrelations based on the chosen contextual relationship for the pairwise comparison, and four symbols represent these interrelations. In the conventional ISM approach, the four symbols are V, A, X, and O, and these symbols are used to fill up only the upper triangular half of the SSIM.
In this study, we changed the conventional symbolisms to provide meaningful representations in the SSIM, and we also propose to fill up all of the cells of the SSIM (except the diagonal, which is kept blank) with the new symbols in the Ex-ISM method. The following are the new symbols used in Ex-ISM, which are based on the “influencing” type of contextual relation:
- The letter “V” is replaced with the symbol “+”, which denotes that variable i influences variable j and j does not influence i.
- The letter “A” is replaced with “-”, which denotes that variable i is influenced by variable j and j is not influenced by i.
- The letter “X” is replaced with the symbol “±” or “∓”, which means that variable i and variable j influence each other.
- The letter “O” is replaced with the symbol “0”, which means that variable i and variable j are independent of one another.
- To fill up the lower triangular half of the SSIM, the corresponding passive pairwise comparison SSIM(j, i) of the active SSIM(i, j) is filled with the corresponding passive symbolism, i.e., if SSIM(i, j) = + or −, then SSIM(j, i)= − or +.
After eliciting the input of the five experts, an original SSIM is established and checked for consistency, wherein consistency is considered a tally with a majority (three of the more common responses in this study). For any inconsistent tally in the original SSIM, we asked the experts to reconsider the relation in the pairwise comparison. After checking the consistency, the resulting SSIM is referred to as the refined SSIM. The refined SSIM is further summarized as the final SSIM by considering the majority response. This approach addresses the handling of inconsistent data due to the experts’ inference. The final SSIM is the only input for the following ISM method.
2.2.2. Step 2—Developing a Reachability Matrix (RM)
In this step, the final SSIM in Step 1 is transformed into an initial reachability matrix (RMinit). The RMinit in conventional ISM is a binary-valued matrix in which the values consist only of “1” and “0” to represent “an influence” and “no influence” relations between variables i and j, respectively. The rules to convert the SSIM to the RMinit in the conventional approach are as follows:
- If SSIM(i, j) = V, then RMinit(i, j) = 1 and RMinit(j, i) = 0.
- If SSIM(i, j) = A, then RMinit(i, j) = 0 and RMinit(j, i) = 1.
- If SSIM(i, j) = X, then RMinit(i, j) = 1 and RMinit(j, i) = 1.
- If SSIM(i, j) = O, then RMinit(i, j) = 0 and RMinit(j, i) = 0.
- For the diagonal element SSIM(i, i), RMinit(i, i) = 1.
On the other hand, the proposed Ex-ISM method utilizes a trinary-valued matrix (1, −1, and 0) to explicitly represent the four types of interrelations between variables i and j. The following rules are introduced to convert the SSIM to RMinit:
- If the SSIM(i, j) is “+”, then RMinit(i, j) is 1 and RMinit(j, i) is −1.
- If the SSIM(i, j) is “−”, then RMinit(i, j) is −1 and RMinit(j, i) is 1.
- If the SSIM(i, j) is “±” or “∓”, then RMinit(i, j) is ±1 or ∓1.
- If the SSIM(i, j) is “0”, then RMinit(i, j) is 0.
- For the blank diagonal element SSIM(i, i), RMinit(i, i) = ±1.
This new rule not only simplifies the transformation of the SSIM to RMinit but also retains the interrelations from the SSIM and explicitly represents the active and passive interrelations between variables i and j using 1 and −1 values, respectively. Subsequently, a transitivity check is conducted iteratively in the RMinit to derive the final RM (RMfin). The transitive relations in the RMfin suggest an indirect relation between variables i and j. The conventional way to conduct the transitivity check is expressed by the following equation [31]:
where k denotes the powers. Equation (1) is calculated using matrix Boolean multiplication and addition operations. All transitive relations, i.e., 0 in RMinit(i, j) that changed into 1 in RMfin(i, j), are conventionally denoted by one “*” in the RMfin.
On the other hand, the RMinit in the Ex-ISM approach is a trinary-valued matrix, so the conventional approach to the transitivity check is not applicable. To cope with this, we propose an expanded Boolean multiplication and addition for Ex-ISM, shown in Table 2, to calculate the −1 values. Firstly, the RMinit is deconstructed into two matrices, +RMinit and −RMinit. The following are the rules to derive these matrices:
- If RMinit(i, j) has a positive sign, then +RMinit(i, j) = 1; otherwise +RMinit(i, j) = 0.
- If RMinit(i, j) has a negative sign, then −RMinit(i, j) = −1; otherwise −RMinit(i, j) = 0.
Then, the transitivity check for +RMinit and −RMinit is expressed using the following equations:
These two matrices are calculated using the expanded Boolean multiplication and addition in Table 2. The matrix operation for +RMinit in Equation (2) is the same as that in Equation 1, because it is a binary matrix. Thus, +RMfin is the same RMfin as the conventional approach. In the Ex-ISM approach, the transitive or indirect relations are represented by multiple “*” to distinctly indicate the number of iterations for the transitive relations, whereas only one “*” is indicated in the conventional approach. Finally, in this step, the obtained +RMfin and −RMfin are combined using the expanded Boolean addition operation in Table 2 to derive the RMfin. For multi-signed 1 (±1 or ∓1) in Table 2, the upper sign corresponds to the original relation in the RMinit, while the lower sign corresponds to a transitive or indirect relation in the RMfin.
2.2.3. Step 3—Assigning Levels for Each Variable
The conventional approach to assigning levels to each variable is one of the most tedious steps in ISM, and it is incredibly taxing when the number of variables becomes larger. The shaded part of Figure 1 shows the conventional ISM flowchart for Step 3. Following is the description of the flowchart. Three sets for each variable i are first determined using the RMfin: the “reachability set”, which consists of those variables that it influences and itself (when variable j = 1 within its row i); the “antecedent set”, which consists of those variables that influence it and itself (when variable i = 1 within its column j); and the “intersection set”, which consists of the intersection between the reachability and antecedent sets. To assign the levels, variables with the same reachability and intersection sets are assigned to level I, and these level I variables are eliminated from the three sets to result in new reachability, antecedent, and intersection sets. Then, this process is carried out recursively until all variables are assigned to a corresponding level.
In the Ex-ISM method, we propose to simplify this step. Using the RMfin given by the Ex-ISM method, the positive values, i.e., 1, are counted at each row of the variable i. The counted value responds to the level for variable i. The highest level assigned to variable i is the total number of variables considered for the analysis, while the lowest is 1. The levels derived from the proposed Ex-ISM method have the same order as in the conventional ISM method, but the magnitude of the levels is also considered.
2.2.4. Step 4—Developing a Conical Matrix (CM)
Using the RMfin and the assigned levels, a CM is derived by rearranging RMfin according to the levels across the rows and columns. The CM is conventionally arranged in an ascending order of the levels across the rows and columns, but we changed the arrangement into a descending order in the Ex-ISM method so that the ISM diagram can be constructed according to the modified schematic described in the next step.
2.2.5. Step 5—Developing the ISM Diagram
The ISM diagram is drawn using the CM. The ISM diagram is a kind of directed graph (or digraph) that shows a set of interconnected variables representing an interrelation while also showing its hierarchy. In the conventional approach, only the direct interrelations between the variables are shown in the ISM diagram, while indirect interrelations are disregarded. The direct interrelations are represented by 1 in CM(i, j), while the indirect ones have “*” attached to the 1. To construct the ISM diagram conventionally, an arrow is drawn from variable i to j if CM(i, j) = 1, and the variables are arranged in ascending levels from top to bottom.
By contrast, we also show the indirect interrelations in the ISM diagram of the Ex-ISM method, because indirect interrelations may cause an underlying ripple effect or chains of reactions to other variables [32]. A separate diagram for this is constructed similarly to the diagram for the direct relations. In addition, descending levels are adopted to arrange the ISM diagram in the Ex-ISM approach. This rearrangement depicts the ISM diagram in a pyramid schematic, where the highest-level variables (most influential) are placed at the top, while the lowest-level variables (least influential) are placed at the bottom. In this way, the hierarchy among the variables is consistently depicted in the ISM diagram.
The ISM diagram in the Ex-ISM method shows the direct interrelationships as those having a solid line arrow drawn from variable i to variable j if CM(i, j) has a positive sign. As for the ISM diagram that shows the indirect interrelationships, an arrow is drawn from variable i to variable j if CM(i, j) has a positive sign with “*”. The arrows are formatted into varying broken lines or line types for “*”, “**”, “***”, and so on to distinguish them, which was not done in the conventional approach.
3. Results and Discussion
The direct and indirect interrelationships between identified barriers to IFRM adaptation in Metro Manila were established using the Ex-ISM method. The results given by the Ex-ISM method are presented in the succeeding paragraphs, while the conventional ISM results are shown in Appendix A.
For Step 1, the pairwise comparison between the 12 barriers was derived from the 5 experts engaged, and this is shown in Table 3 and called the refined SSIM. There are five symbols in the refined SSIM, which correspond to each expert’s inference regarding the pairwise comparison. For example, in refined SSIM(1, 2), there are four “+” symbols, indicating that four experts inferred that barrier G1 influences barrier G2, while only a single “-“ symbol indicates that one expert inferred that G1 is influenced by G2. This refined SSIM was already checked for any inconsistency, so a majority response from the five experts can be derived to come up with the final SSIM shown in Table 4. Contrary to the conventional SSIM in Appendix A, Table A1, the final SSIM of the Ex-ISM method in Table 4 is completely filled with the new symbols (+, −, ±, and ∓) that show the active and passive interrelations explicitly. For example, the SSIM(1,2) in Table 4 is “+”, so SSIM(2, 1) is “−”, which means that barrier G1 influences barrier G2 and barrier G2 is influenced by barrier G1, respectively.
For Step 2, the final SSIM is transformed to RMinit, as shown in Table 5. The transformation of the final SSIM to RMinit was more effortless with Ex-ISM than with the conventional ISM method, because the SSIM of Ex-ISM is already filled with the new symbols. The trinary values in Table 5 also retain the active and passive relations from the SSIM, e.g., RMinit(1, 2) = 1 indicates that barrier G1 influences barrier G2, while RMinit(2, 1) = −1 indicates that barrier G2 is influenced by barrier G1. In contrast, the binary values used in the conventional RMinit, shown in Appendix A, Table A2, represent RMinit(2, 1) as “0”, which does not distinguish whether there is an “influenced by” or a “no” relation. Then, the RMinit of the Ex-ISM method is first deconstructed into positive and negative initial reachability matrices (+RMinit and −RMinit) before the transitivity check.
The +RMinit and −RMinit are just the same as the positive and negative parts in Table 5 when deconstructed, and these are operated on using the proposed expanded Boolean multiplication operation for the Ex-ISM method in Table 2 to check the transitivity and derive the final positive and negative reachability matrices (+RMfin and −RMfin) in Table 6 and Table 7, respectively. The +RMfin (Table 6) and −RMfin (Table 7) were combined according to the proposed expanded Boolean addition in Table 2, which resulted in the RMfin shown in Table 8. The number of “*” indicates the iterations for the transitive or indirect relations, whereas only one “*” is indicated in the conventional approach, as shown in Table A3.
The results show that some barriers to IFRM adaptation have indirect interrelations up to the third degree. Those values in Table 8 with “*”, “**”, and “***” signifies indirect relations to the first, second, and third degree for barriers i and j, respectively. For multi-signed (±1 or ∓1) indirect relations, the upper sign signifies the original sign in the RMinit, while the lower sign signifies a transitive or indirect interrelation in the RMfin. In addition, there are three barrier interrelations (RMfin = (4, 8), (8, 10) (10, 11) in Table 8) that become multi-signed after the transitivity check. Such details are not specified in the conventional ISM shown in Appendix A, Table A3.
For Step 3, the assignment of the levels for each barrier is much simpler in the Ex-ISM method than in the conventional one, where a recursive process is necessary. We used the RMfin in Table 8 to determine the levels by just counting the positive 1s in the rows for each barrier. The counted values are assigned as the levels in the Ex-ISM method, which are shown in the last column of Table 8. The tedious conventional process, in which nine iterations were performed to assign a level for each barrier, is presented in Appendix A, Table A4, Table A5, Table A6, Table A7 and Table A8.
For Step 4, the levels and RMfin in Table 8 are rearranged in descending order across the columns and rows to derive the CM in Table 9, whereas an ascending order is adopted in the conventional approach shown in Appendix A, Table A9.
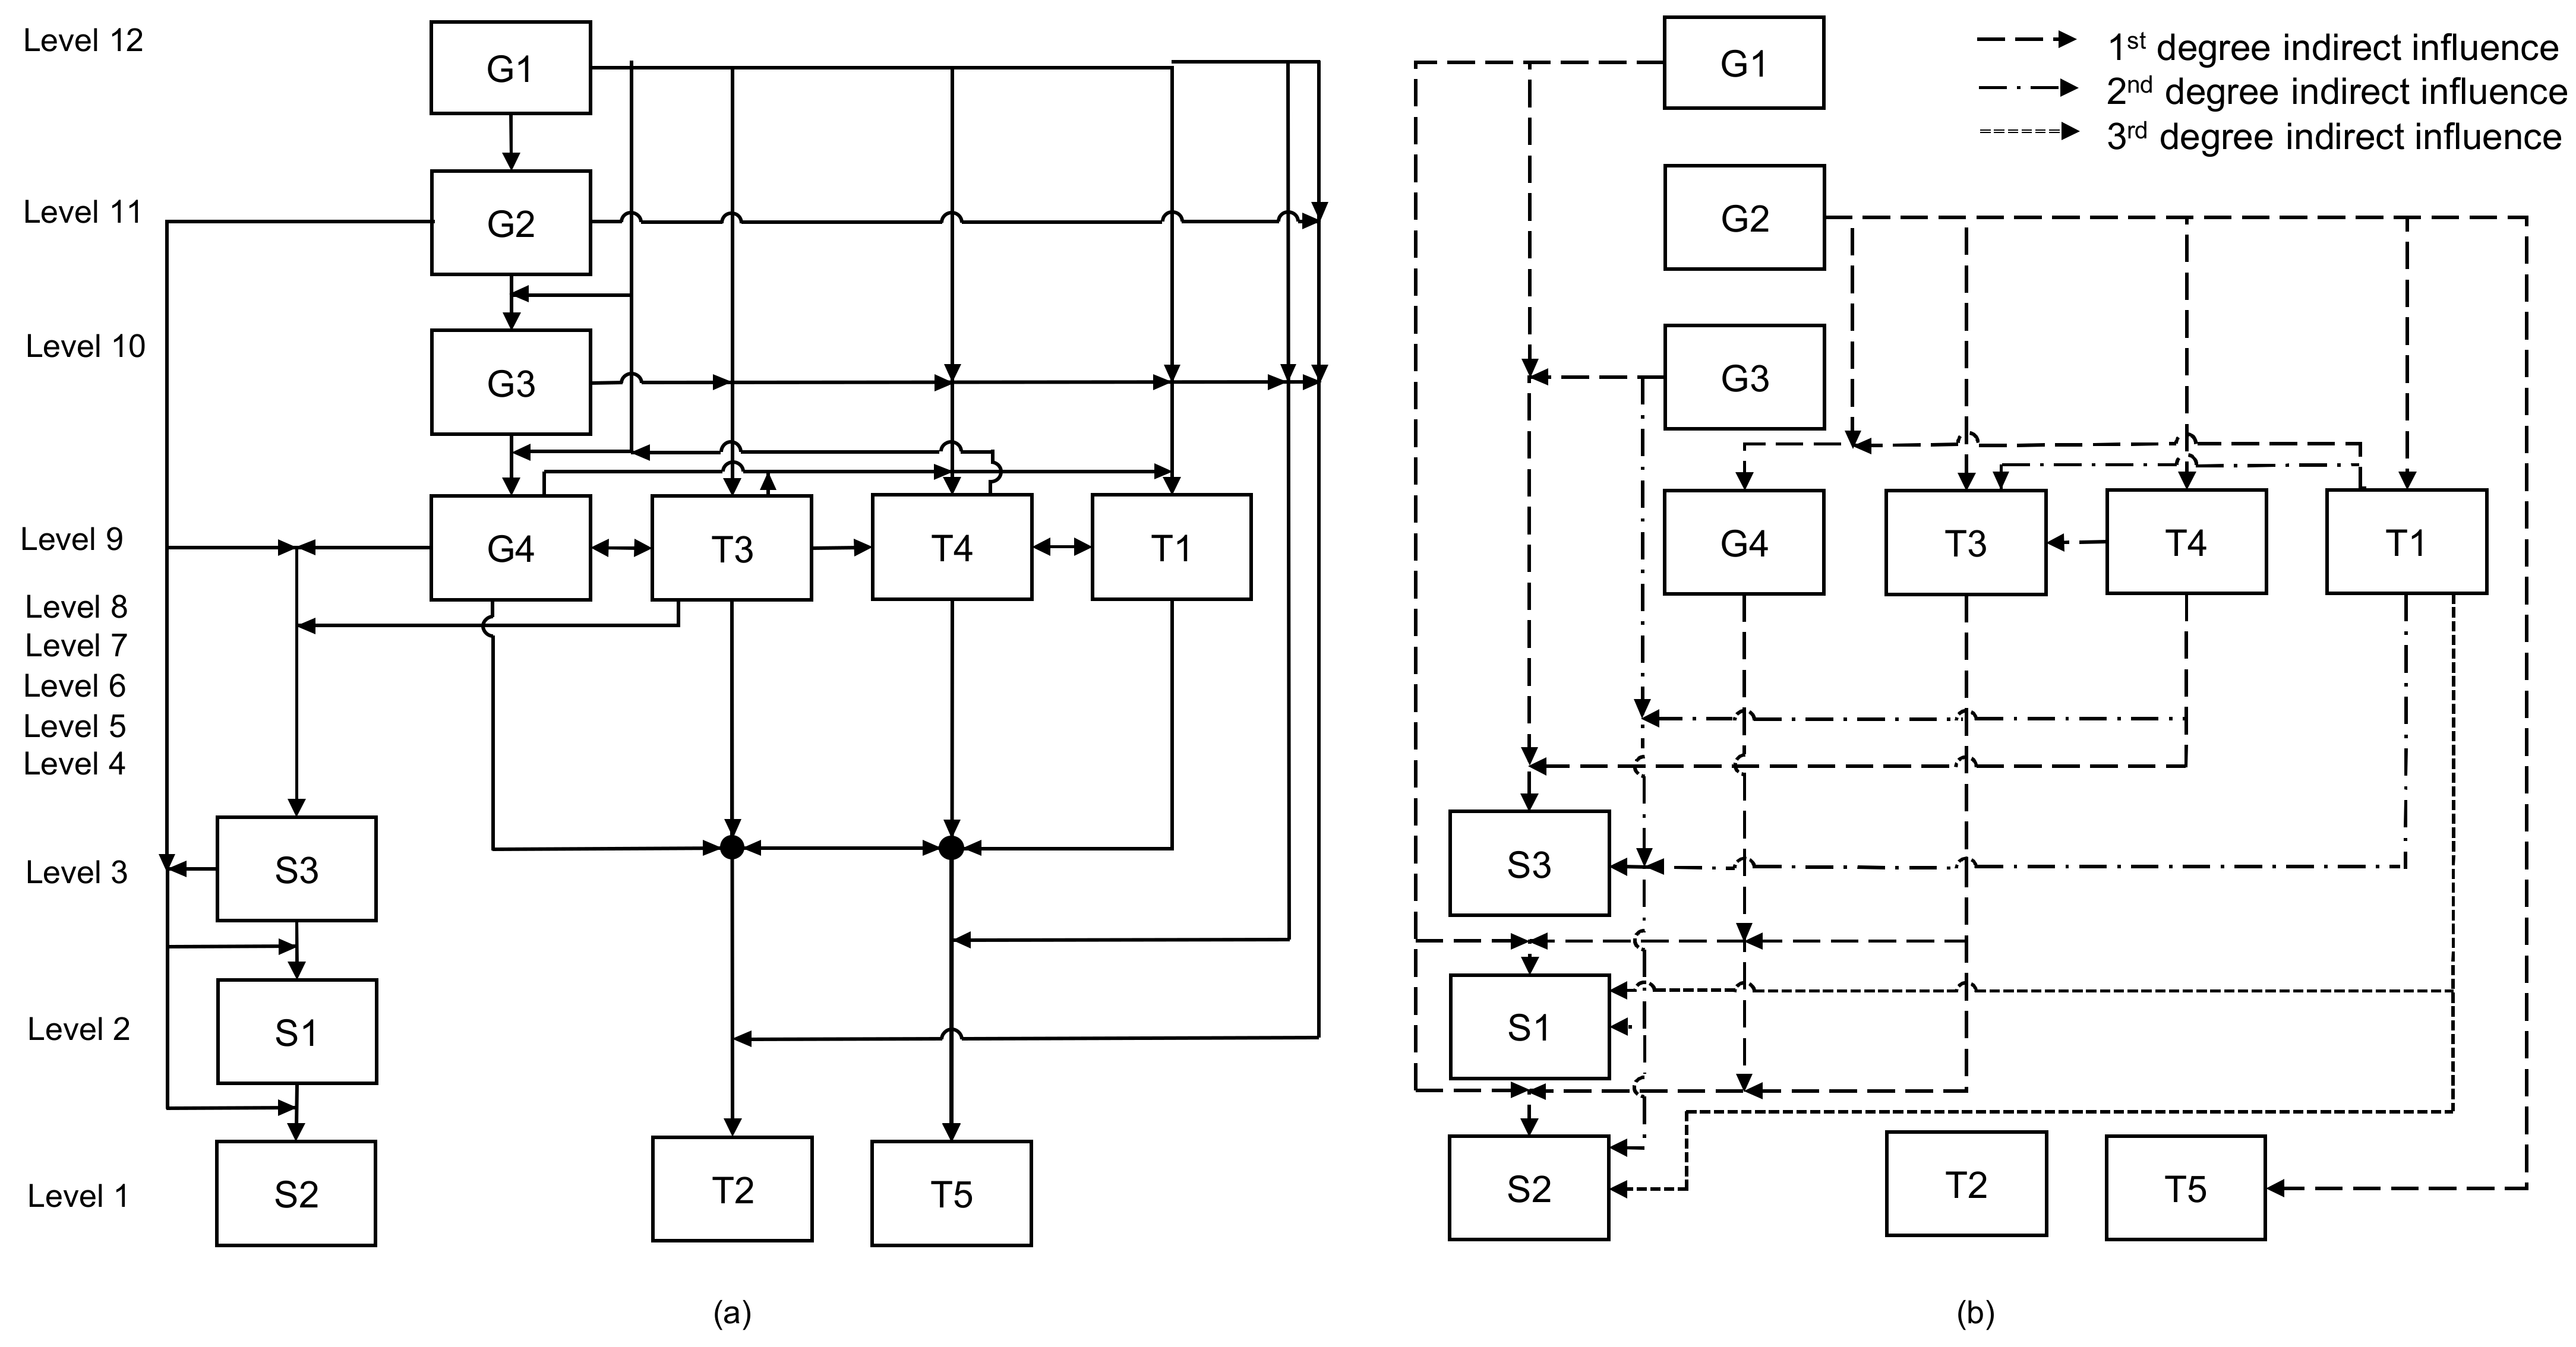
Finally, for Step 5, the CM in Table 9 is used to draw the ISM diagram. Figure 2 shows two ISM diagrams, i.e., Figure 2a,b shows the direct and indirect interrelationships, respectively. The conventional ISM diagram disregards the indirect interrelationships, but showing indirect relations may provide a comprehensive analysis of the variables’ underlying chains of influence. The pyramid schematic in the Ex-ISM method is the opposite of the conventional one. The ISM diagrams in Figure 2 show a noticeable gap between the upper (Level 9~12) and lower (Level 1~3) level barriers, which is not possible in the conventional ISM diagram because it only shows the order of the levels, not the magnitude. The gap in the hierarchy shown by the redefined magnitude of the levels in the Ex-ISM method may imply that the barriers at the upper level have an unforeseen impact or influence on the lower-level barriers.
From Figure 2, the most influential barrier to IFRM adaptation in Metro Manila is G1 (Lack of sole organizing body). This may imply that the establishment or assignment of a lead agency in IFRM that supports planning, implementation, operations, and maintenance has to be carried out, since there are currently too many key players in flood risk management in Metro Manila. The second most influential barrier is G2 (Lack of coordination), which directly influences G4 (Lack of flood control measures) and all of the social barriers. The ISM diagrams in Figure 2 also reveal that G4 (Lack of flood control measures), T1 (Lack of data processing systems), T3 (Lack of experts), and T4 (Lack of data processing system) are directly influencing each other, and that these are directly influenced by G3 (Lack of funding) and G1. On the other hand, the least influential barriers are those related to the social category (S2—poor solid waste management) and the technological category (T2—Sparse data and limited access and T5—Deterioration of flood control structures).
In Figure 2a, we recognize that the social barriers (S1~S3) are mainly influenced by barrier G2, which we have regarded as the key to overcoming the social barriers. However, the indirect interrelationships in Figure 2b show that the barriers in the social category are further influenced indirectly to the first and second degrees by the other barriers in the governance (G1, G3, and G4) category, and to the first–third degrees by level 9 technological resource issues (T1, T3, and T4).
Studies in developed countries [33,34,35] have suggested that collaborative governance and technology-based tools can help enhance social learning by understanding people’s interests and values in regard to IFRM. However, overcoming the social barriers in Metro Manila may be more complicated due to several interrelations of indirect influence. Overcoming them will require strong political will, a large amount of financial support, and science-based evidence and technological capabilities, which are inherently lacking in many developing countries. These indirect interrelations may imply that overcoming the social barriers necessitates improving other barriers in the governance and technological resource categories, not only barrier G2.
In the same way, barriers in the technological category are mainly influenced by G1 and G3. The barriers in this category are also indirectly influenced in the first degree by barrier G2. The results suggest that barrier G2 also plays a significant role in overcoming the technological resource barriers in Metro Manila, but the context may differ in developed countries. Effective risk communication in many developed countries emphasizes the translation of risks from scientists to practitioners, decision-makers, and laypeople to articulate risks, forecasts, warnings, or even uncertainties that can aid decision-making and social learning [36,37,38]. However, Metro Manila’s technological capabilities are far behind those of developed countries, as is the case in many developing countries, so there is no operational flood forecasting and warning system in Metro Manila [39]. The role of communication in overcoming the technological barriers in Metro Manila may suggest that solutions must come from the practitioners, the decision-makers, or those who hold government positions, since they can stimulate an increase in funding for technological improvement in flood management. Thus, overcoming technological barriers necessitates political will, communication, and funding, as expressed by the direct and indirect interrelationships of barriers G1, G2, and G3 in Figure 2.
Uncertainty is a crucial issue, and this is inherent in the data and modeling techniques in flood risk management [40], flood defense engineering [41], and decision-making [41,42]. However, the ISM approach (including both the conventional and the expanded ISM methods) does not deal with any uncertainty once the input matrix, i.e., the final SSIM that is automatically constructed from the Refined SSIM, is determined. In other words, once the Refined SSIM is constructed, ISM is a deterministic and systematic method that can only show the interrelationships between the barriers. In this paper, the Refined SSIM is treated as the given condition for both conventional and expanded ISM, and we focus on showing the usefulness of the Ex-ISM approach compared to conventional ISM.
On the other hand, we agree that the data gathered for both the Ex-ISM and conventional ISM approaches, i.e., the identified barriers to IFRM adaptation and the contextual interrelationships in the SSIM based on the experts’ judgment, are inherently uncertain. The experts’ judgments in the SSIM has inherent uncertainties because they are based on how experts perceive flood risk, so, in this paper, the experts’ judgments in the SSIM were iteratively checked in order to construct a Refined SSIM with less uncertainty. Nevertheless, if data inputs with less uncertainty are available, the Ex-ISM method can be used to systematically determine the barriers’ interrelationships and their hierarchy through the ISM diagrams for the direct and indirect relationships.
The Ex-ISM and the conventional ISM approach do not deal with systems failure and temporal variability among the barriers, as they only show the interrelationships between variables. Nevertheless, the results of the Ex-ISM method provide a comprehensive analysis by showing both the direct and indirect interrelationships between the barriers in the ISM diagrams. Those barriers recognized as being most influential have been further emphasized through the redefined magnitudes of the hierarchical levels. This may give additional direction to the decision-makers regarding which barriers must be eliminated first and foremost. The diagram showing the direct and indirect interrelationships can help decision-makers and stakeholders visualize and understand the complex interrelationships among the barriers, since the barriers are only abstract concepts. Thus, the ISM diagram can be used as a tool when devising a plan to overcome the barriers. This analysis of the barriers’ interrelationships may lead to an effective plan for transitioning to IFRM, especially for Metro Manila, since the identified barriers have impeded the transition [43].
4. Conclusions
Identifying and analyzing the interrelationships between the barriers to IFRM adaption is crucial before and during the implementation of IFRM in both developed and developing countries. These tasks are necessary but are not widely performed. Therefore, this study attempts to conduct a comprehensive analysis of the barriers to IFRM adaptation in Metro Manila, Philippines, by applying a proposed Ex-ISM method for barrier interpretation.
The proposed Ex-ISM method is an enhancement of conventional ISM, and it aims to (1) utilize trinary values to explicitly represent the active and passive interrelations between the variables by introducing both 1 and −1 in the reachability matrices; (2) introduce an expanded Boolean multiplication and addition to accommodate the calculation of the trinary values; (3) simplify the repetitive and tedious task of assigning the levels for each variable; and (4) provide comprehensive interrelations in the ISM diagram by showing not only the direct interrelations but also the indirect interrelations.
Because Ex-ISM contains conventional ISM, the limitations of conventional ISM are still inherent in Ex-ISM. Both methods heavily depend on experts’ judgment to create the final SSIM as the input for any ISM approach. The handling of experts’ inferences that may have inconsistencies has still not been standardized for the ISM approach. In this study, however, inconsistencies were dealt with by having multiple pairwise comparison iterations with the experts engaged. Once the final SSIM is created, the following procedures are systematically and automatically calculated according to the ISM methods of interest.
The Ex-ISM method was applied to 12 identified barriers to IFRM adaptation in Metro Manila. The results from the Ex-ISM method did not deviate from the results obtained using the conventional ISM approach, but the proposed Ex-ISM method provided enhanced results through the trinary values in the reachability matrices. Furthermore, the ISM diagrams that show both the direct and indirect influence interrelationships provided a deeper understanding of the barriers. Therefore, the Ex-ISM method, which shows the indirect interrelationships, presents a comprehensive analysis of the interrelationships between the barriers to IFRM. The hierarchy is also emphasized by the magnitude of the levels, not only the order, which may imply the underlying impacts of upper-level barriers on the lower-level barriers.
The most influential barriers to IFRM that were identified belong to the governance category, and their interrelations with the other barriers were comprehensively analyzed in this study. The indirect relationships are also interpreted, emphasizing that their influence on the other barriers needs to be considered as well when devising a strategic plan to overcome said barriers and implement IFRM. Indirect relations are equally important as direct relations, as the former are the ripple effect of the latter.
Overall, the study’s results presented comprehensive interrelations between the barriers to IFRM. Also, the proposed Ex-ISM application is less tedious, and the results were enhanced and were more comprehensive compared to the conventional ISM method.
Author Contributions
Conceptualization: J.M.M. and A.K.; Methodology: J.M.M. and A.K.; formal analysis and investigation: J.M.M. and A.K.; Data curation: J.M.M. and R.M.; Writing—original draft preparation: J.M.M. and A.K.; Writing—review and editing J.M.M., A.K. and R.M.; Supervision, A.K. and R.M. All authors have read and agreed to the published version of the manuscript.
Funding
This research was conducted through the support of “Tokyo Human Resources Fund for City Diplomacy” and “Advanced Research Network Enhancement Program” by the Tokyo Metropolitan Government.
Institutional Review Board Statement
Not applicable.
Informed Consent Statement
Not applicable.
Data Availability Statement
Not applicable.
Acknowledgments
The authors wish to express their sincerest gratitude to Yuuto Yokota of Nippon Shuppan Hanbai, Inc. and Hideo Amaguchi of Tokyo Metropolitan University for their utmost support and assistance in developing the proposed Ex-ISM approach.
Conflicts of Interest
The authors declare no conflict of interest.
Appendix A
The results obtained using conventional ISM for the SSIM, Initial RM, and Final RM, the level partitioning iterations, and the CM are presented in the succeeding tables.

Table A1.
Structural Self-Interaction Matrix (SSIM) (Conventional Method).
| i | j | 1 | 2 | 3 | 4 | 5 | 6 | 7 | 8 | 9 | 10 | 11 | 12 |
|---|---|---|---|---|---|---|---|---|---|---|---|---|---|
| Barrier | G1 | G2 | G3 | G4 | S1 | S2 | S3 | T1 | T2 | T3 | T4 | T5 | |
| 1 | G1 | V | V | V | O | O | O | V | V | V | V | V | |
| 2 | G2 | V | O | V | V | V | O | V | O | O | O | ||
| 3 | G3 | V | O | O | O | V | V | V | V | V | |||
| 4 | G4 | O | O | V | V | V | X | X | V | ||||
| 5 | S1 | V | A | O | O | O | O | O | |||||
| 6 | S2 | A | O | O | O | O | O | ||||||
| 7 | S3 | O | O | A | O | O | |||||||
| 8 | T1 | V | A | X | V | ||||||||
| 9 | T2 | A | A | O | |||||||||
| 10 | T3 | V | V | ||||||||||
| 11 | T4 | V | |||||||||||
| 12 | T5 |
Table A2.
Initial Reachability Matrix (RMinit) (Conventional Method).
| i | j | 1 | 2 | 3 | 4 | 5 | 6 | 7 | 8 | 9 | 10 | 11 | 12 |
|---|---|---|---|---|---|---|---|---|---|---|---|---|---|
| Barrier | G1 | G2 | G3 | G4 | S1 | S2 | S3 | T1 | T2 | T3 | T4 | T5 | |
| 1 | G1 | 1 | 1 | 1 | 1 | 0 | 0 | 0 | 1 | 1 | 1 | 1 | 1 |
| 2 | G2 | 0 | 1 | 1 | 0 | 1 | 1 | 1 | 0 | 1 | 0 | 0 | 0 |
| 3 | G3 | 0 | 0 | 1 | 1 | 0 | 0 | 0 | 1 | 1 | 1 | 1 | 1 |
| 4 | G4 | 0 | 0 | 0 | 1 | 0 | 0 | 1 | 1 | 1 | 1 | 1 | 1 |
| 5 | S1 | 0 | 0 | 0 | 0 | 1 | 1 | 0 | 0 | 0 | 0 | 0 | 0 |
| 6 | S2 | 0 | 0 | 0 | 0 | 0 | 1 | 0 | 0 | 0 | 0 | 0 | 0 |
| 7 | S3 | 0 | 0 | 0 | 0 | 1 | 1 | 1 | 0 | 0 | 0 | 0 | 0 |
| 8 | T1 | 0 | 0 | 0 | 0 | 0 | 0 | 0 | 1 | 1 | 0 | 1 | 1 |
| 9 | T2 | 0 | 0 | 0 | 0 | 0 | 0 | 0 | 0 | 1 | 0 | 0 | 0 |
| 10 | T3 | 0 | 0 | 0 | 1 | 0 | 0 | 1 | 1 | 1 | 1 | 1 | 1 |
| 11 | T4 | 0 | 0 | 0 | 1 | 0 | 0 | 0 | 1 | 1 | 0 | 1 | 1 |
| 12 | T5 | 0 | 0 | 0 | 0 | 0 | 0 | 0 | 0 | 0 | 0 | 0 | 1 |
Table A3.
Final Reachability Matrix (RMfin) (Conventional Method).
| i | j | 1 | 2 | 3 | 4 | 5 | 6 | 7 | 8 | 9 | 10 | 11 | 12 |
|---|---|---|---|---|---|---|---|---|---|---|---|---|---|
| Barrier | G1 | G2 | G3 | G4 | S1 | S2 | S3 | T1 | T2 | T3 | T4 | T5 | |
| 1 | G1 | 1 | 1 | 1 | 1 | 1 * | 1 * | 1 * | 1 | 1 | 1 | 1 | 1 |
| 2 | G2 | 0 | 1 | 1 | 1 * | 1 | 1 | 1 | 1 * | 1 | 1 * | 1 * | 1 * |
| 3 | G3 | 0 | 0 | 1 | 1 | 1 * | 1 * | 1 * | 1 | 1 | 1 | 1 | 1 |
| 4 | G4 | 0 | 0 | 0 | 1 | 1 * | 1 * | 1 | 1 | 1 | 1 | 1 | 1 |
| 5 | S1 | 0 | 0 | 0 | 0 | 1 | 1 | 0 | 0 | 0 | 0 | 0 | 0 |
| 6 | S2 | 0 | 0 | 0 | 0 | 0 | 1 | 0 | 0 | 0 | 0 | 0 | 0 |
| 7 | S3 | 0 | 0 | 0 | 0 | 1 | 1 | 1 | 0 | 0 | 0 | 0 | 0 |
| 8 | T1 | 0 | 0 | 0 | 1 * | 1 * | 1 * | 1 * | 1 | 1 | 1 * | 1 | 1 |
| 9 | T2 | 0 | 0 | 0 | 0 | 0 | 0 | 0 | 0 | 1 | 0 | 0 | 0 |
| 10 | T3 | 0 | 0 | 0 | 1 | 1 * | 1 * | 1 | 1 | 1 | 1 | 1 | 1 |
| 11 | T4 | 0 | 0 | 0 | 1 | 1 * | 1 * | 1 * | 1 | 1 | 1 * | 1 | 1 |
| 12 | T5 | 0 | 0 | 0 | 0 | 0 | 0 | 0 | 0 | 0 | 0 | 0 | 1 |
Table A4.
Level Partitioning (Conventional Method)—1st Iteration.
| Barrier | Reachability Set | Antecedent Set | Intersection Set | Level |
|---|---|---|---|---|
| 1 | 1.2.3.4.5.6.7.8.9.10.11.12 | 1 | 1 | |
| 2 | 2.3.4.5.6.7.8.9.10.11.12 | 1.2 | 2 | |
| 3 | 3.4.5.6.7.8.9.10.11.12 | 1.2.3 | 3 | |
| 4 | 4.5.6.7.8.9.10.11.12 | 1.2.3.4.8.10.11 | 4.8.10.11 | |
| 5 | 5.6 | 1.2.3.4.5.7.8.10.11 | 5 | |
| 6 | 6 | 1.2.3.4.5.6.7.8.10.11 | 6 | I |
| 7 | 5.6.7 | 1.2.3.4.7.8.10.11 | 7 | |
| 8 | 4.5.6.7.8.9.10.11.12 | 1.2.3.4.8.10.11 | 4.8.10.11 | |
| 9 | 9 | 1.2.3.4.8.9.10.11 | 9 | I |
| 10 | 4.5.6.7.8.9.10.11.12 | 1.2.3.4.8.10.11 | 4.8.10.11 | |
| 11 | 4.5.6.7.8.9.10.11.12 | 1.2.3.4.8.10.11 | 4.8.10.11 | |
| 12 | 12 | 1.2.3.4.8.10.11.12 | 12 | I |
Table A5.
Level Partitioning (Conventional Method)—2nd Iteration.
| Barrier | Reachability Set | Antecedent Set | Intersection Set | Level |
|---|---|---|---|---|
| 1 | 1.2.3.4.5.7.8.10.11 | 1 | 1 | |
| 2 | 2.3.4.5.7.8.10.11 | 1.2 | 2 | |
| 3 | 3.4.5.7.8.10.11 | 1.2.3 | 3 | |
| 4 | 4.5.7.8.10.11 | 1.2.3.4.8.10.11 | 4.8.10.11 | |
| 5 | 5 | 1.2.3.4.5.7.8.10.11 | 5 | II |
| 7 | 5.7 | 1.2.3.4.7.8.10.11 | 7 | |
| 8 | 4.5.7.8.10.11 | 1.2.3.4.8.10.11 | 4.8.10.11 | |
| 10 | 4.5.7.8.10.11 | 1.2.3.4.8.10.11 | 4.8.10.11 | |
| 11 | 4.5.7.8.10.11 | 1.2.3.4.8.10.11 | 4.8.10.11 |
Table A6.
Level Partitioning—3rd Iteration.
| Barrier | Reachability Set | Antecedent Set | Intersection Set | Level |
|---|---|---|---|---|
| 1 | 1.2.3.4.7.8.10.11 | 1 | 1 | |
| 2 | 2.3.4.7.8.10.11 | 1.2 | 2 | |
| 3 | 3.4.7.8.10.11 | 1.2.3 | 3 | |
| 4 | 4.7.8.10.11 | 1.2.3.4.8.10.11 | 4.8.10.11 | |
| 7 | 7 | 1.2.3.4.7.8.10.11 | 7 | III |
| 8 | 4.7.8.10.11 | 1.2.3.4.8.10.11 | 4.8.10.11 | |
| 10 | 4.7.8.10.11 | 1.2.3.4.8.10.11 | 4.8.10.11 | |
| 11 | 4.7.8.10.11 | 1.2.3.4.8.10.11 | 4.8.10.11 |
Table A7.
Level Partitioning (Conventional Method)—4th Iteration.
| Barrier | Reachability Set | Antecedent Set | Intersection | Level |
|---|---|---|---|---|
| 1 | 1.2.3.4.8.10.11 | 1 | 1 | |
| 2 | 2.3.4.8.10.11 | 1.2 | 2 | |
| 3 | 3.4.8.10.11 | 1.2.3 | 3 | |
| 4 | 4.8.10.11 | 1.2.3.4.8.10.11 | 4.8.10.11 | IV |
| 8 | 4.8.10.11 | 1.2.3.4.8.10.11 | 4.8.10.11 | IV |
| 10 | 4.8.10.11 | 1.2.3.4.8.10.11 | 4.8.10.11 | IV |
| 11 | 4.8.10.11 | 1.2.3.4.8.10.11 | 4.8.10.11 | IV |
Table A8.
Level Partitioning (Conventional Method)—5th and 6th Iteration.
| Barrier | Reachability Set | Antecedent Set | Intersection Set | Level |
|---|---|---|---|---|
| 1 | 1.2.3. | 1 | 1 | VII |
| 2 | 2.3. | 1.2 | 2 | VI |
| 3 | 3. | 1.2.3 | 3 | V |
Table A9.
Conical Matrix.
| Level | VII | VI | V | IV | IV | IV | IV | III | II | I | I | I | Level |
|---|---|---|---|---|---|---|---|---|---|---|---|---|---|
| Barrier | G1 | G2 | G3 | G4 | T1 | T3 | T4 | S3 | S1 | S2 | T2 | T5 | |
| G1 | 1 | 1 | 1 | 1 | 1 | 1 | 1 | 1 * | 1 * | 1 * | 1 | 1 | VII |
| G2 | 0 | 1 | 1 | 1 * | 1 * | 1 * | 1 * | 1 | 1 | 1 | 1 | 1 * | VI |
| G3 | 0 | 0 | 1 | 1 | 1 | 1 | 1 | 1 * | 1 * | 1 * | 1 | 1 | V |
| G4 | 0 | 0 | 0 | 1 | 1 | 1 | 1 | 1 | 1 * | 1 * | 1 | 1 | IV |
| T1 | 0 | 0 | 0 | 1 * | 1 | 1 * | 1 | 1 * | 1 * | 1 * | 1 | 1 | IV |
| T3 | 0 | 0 | 0 | 1 | 1 | 1 | 1 | 1 | 1 * | 1 * | 1 | 1 | IV |
| T4 | 0 | 0 | 0 | 1 | 1 | 1 * | 1 | 1 * | 1 * | 1 * | 1 | 1 | IV |
| S3 | 0 | 0 | 0 | 0 | 0 | 0 | 0 | 1 | 1 | 1 | 0 | 0 | III |
| S1 | 0 | 0 | 0 | 0 | 0 | 0 | 0 | 0 | 1 | 1 | 0 | 0 | II |
| S2 | 0 | 0 | 0 | 0 | 0 | 0 | 0 | 0 | 0 | 1 | 0 | 0 | I |
| T2 | 0 | 0 | 0 | 0 | 0 | 0 | 0 | 0 | 0 | 0 | 1 | 0 | I |
| T5 | 0 | 0 | 0 | 0 | 0 | 0 | 0 | 0 | 0 | 0 | 0 | 1 | I |
References
- Van Herk, S.; Rijke, J.; Zevenbergen, C.; Ashley, R. Understanding the Transition to Integrated Flood Risk Management in the Netherlands. Environ. Innov. Soc. Transit. 2015, 15, 84–100. [Google Scholar] [CrossRef]
- United Nations International Strategy for Disaster Reduction. UNISDR Terminology on Disaster Risk Reduction; United Nations: Geneva, Switzerland, 2009. [Google Scholar]
- Scott, M.; Kuhlicke, C.; Steinführer, A.; Sultana, P.; Thompson, P.; Minnery, J.; O’Neall, E.; Cooper, J.; Adamson, M.; Russell, E. Living with Flood Risk/The More We Know, the More We Know We Don’t Know: Reflections on a Decade of Planning, Flood Risk Management and False Precision/Searching for Resilience or Building Social Capacities for Flood Risks?/Participatory Floodplain Manage. Plan. Theory Pract. 2013, 14, 114–120. [Google Scholar] [CrossRef]
- Worldwide Fund for Nature, Mega-Stress for Megacities, A Climate Vulnerability Ranking of Major Coastal Cities in Asia. 2009. Available online: https://www.wwf.org.uk/sites/default/files/2009-13/mega_stress_cities_report.pdf (accessed on 15 January 2018).
- Mercado, J.M.R.; Kawamura, A.; Amaguchi, H. Interrelationships of the Barriers to Integrated Flood Risk Management Adaptation in Metro Manila, Philippines. Int. J. Disaster Risk Reduct. 2020, 49, 101683. [Google Scholar] [CrossRef]
- Vinke-de Kruijf, J.; Kuks, S.M.M.; Augustijn, D.C.M. Governance in Support of Integrated Flood Risk Management? The Case of Romania. Environ. Dev. 2015, 16, 104–118. [Google Scholar] [CrossRef]
- Mysiak, J.; Testella, F.; Bonaiuto, M.; Carrus, G.; De Dominicis, S.; Cancellieri, U.G.; Firus, K.; Grifoni, P. Flood Risk Management in Italy: Challenges and Opportunities for the Implementation of the EU Floods Directive (2007/60/EC). Nat. Hazards Earth Syst. Sci. 2013, 13, 2883–2890. [Google Scholar] [CrossRef]
- Samuels, P.; Klijn, F.; Dijkman, J. An Analysis of the Current Practice of Policies on River Flood Risk Management in Different Countries. Irrig. Drain. 2006, 55, S141–S150. [Google Scholar] [CrossRef]
- Xia, C.; Pahl-Wostl, C. Understanding the Development of Flood Management in the Middle Yangtze River. Environ. Innov. Soc. Transit. 2012, 5, 60–75. [Google Scholar] [CrossRef]
- Dieperink, C.; Hegger, D.L.T.; Bakker, M.H.N.; Kundzewicz, Z.W.; Green, C.; Driessen, P.P.J. Recurrent Governance Challenges in the Implementation and Alignment of Flood Risk Management Strategies: A Review. Water Resour. Manag. 2016, 30, 4467–4481. [Google Scholar] [CrossRef] [Green Version]
- Dos Muchangos, L.S.; Tokai, A.; Hanashima, A. Analyzing the Structure of Barriers to Municipal Solid Waste Management Policy Planning in Maputo City, Mozambique. Environ. Dev. 2015, 16, 76–89. [Google Scholar] [CrossRef]
- Barve, A.; Kanda, A.; Shankar, R. Analysis of Interaction among the Barriers of Third Party Logistics. Int. J. Agil. Syst. Manag. 2007, 2, 109–129. [Google Scholar] [CrossRef]
- Yadav, D.K.; Barve, A. International Journal of Disaster Risk Reduction Analysis of Critical Success Factors of Humanitarian Supply Chain: An Application of Interpretive Structural Modeling. Int. J. Disaster Risk Reduct. 2015, 12, 213–225. [Google Scholar] [CrossRef]
- Alora, A.; Barua, M.K. Barrier Analysis of Supply Chain Finance Adoption in Manufacturing Companies. Benchmarking 2019, 26, 2122–2145. [Google Scholar] [CrossRef]
- Bui, T.D.; Tsai, F.M.; Tseng, M.L.; Ali, M.D.H. Identifying Sustainable Solid Waste Management Barriers in Practice Using the Fuzzy Delphi Method. Resour. Conserv. Recycl. 2020, 154, 104625. [Google Scholar] [CrossRef]
- Ertas, A.; Smith, M.W.; Tate, D.; Lawson, W.D.; Baturalp, T.B. Complexity of System Maintainability Analysis Based on the Interpretive Structural Modeling Methodology: Transdisciplinary Approach. J. Syst. Sci. Syst. Eng. 2016, 25, 254–268. [Google Scholar] [CrossRef]
- Chandramowli, S.; Transue, M.; Felder, F.A. Analysis of Barriers to Development in Landfill Communities Using Interpretive Structural Modeling. Habitat Int. 2011, 35, 246–253. [Google Scholar] [CrossRef]
- Beikkhakhian, Y.; Javanmardi, M.; Karbasian, M.; Khayambashi, B. The Application of ISM Model in Evaluating Agile Suppliers Selection Criteria and Ranking Suppliers Using Fuzzy TOPSIS-AHP Methods. Expert Syst. Appl. 2015, 42, 6224–6236. [Google Scholar] [CrossRef]
- Thakkar, J.; Deshmukh, S.G.; Gupta, A.D.; Shankar, R. Selection of Third-Party Logistics (3PL): A Hybrid Approach Using Interpretive Structural Modeling (ISM) and Analytic Network Process (ANP). Supply Chain Forum Int. J. 2018, 6, 32–46. [Google Scholar] [CrossRef]
- Agi, M.A.N.; Nishant, R. Understanding Influential Factors on Implementing Green Supply Chain Management Practices: An Interpretive Structural Modelling Analysis. J. Environ. Manag. 2017, 188, 351–363. [Google Scholar] [CrossRef]
- Mudgal, R.K.; Shankar, R.; Talib, P.; Raj, T. Modelling the Barriers of Green Supply Chain Practices: An Indian Perspective. Int. J. Logist. Syst. Manag. 2010, 7, 81–107. [Google Scholar] [CrossRef]
- Singh, M.D.; Shankar, R.; Narain, R.; Agarwal, A. An Interpretive Structural Modeling of Knowledge Management in Engineering Industries. J. Adv. Manag. Res. 2003, 1, 28–40. [Google Scholar] [CrossRef]
- Sushil. Modified ISM/TISM Process with Simultaneous Transitivity Checks for Reducing Direct Pair Comparisons. Glob. J. Flex. Syst. Manag. 2017, 18, 331–351. [Google Scholar] [CrossRef]
- Sushil. Interpreting the Interpretive Structural Model. Glob. J. Flex. Syst. Manag. 2012, 13, 87–106. [Google Scholar] [CrossRef]
- Warfield, J.N. Binary Matrices in System Modeling. IEEE Trans. Syst. Man. Cybern. 1973, 5, 441–449. [Google Scholar] [CrossRef] [Green Version]
- Warfield, J.N. Societal Systems Planning, Policy, and Complexity. Cybern. Syst. 1978, 8, 113–115. [Google Scholar]
- Farris, D.R.; Sage, A.P. On the Use of Interpretive Structural Modeling for Worth Assessment. Comput. Electr. Eng. 1975, 2, 149–174. [Google Scholar] [CrossRef]
- Watson, R.H. Interpretive Structural Modeling—A Useful Tool for Technology Assessment? Technol. Forecast. Soc. Change 1978, 11, 165–185. [Google Scholar] [CrossRef]
- Attri, R.; Dev, N.; Sharma, V. Interpretive Structural Modelling (ISM) Approach: An Overview. Res. J. Manag. Sci. 2013, 2, 3–8. [Google Scholar] [CrossRef]
- Agarwal, A.; Shankar, R.; Tiwari, M.K. Modeling Agility of Supply Chain. Ind. Mark. Manag. 2007, 36, 443–457. [Google Scholar] [CrossRef]
- Huang, J.; Tzeng, G. Multidimensional Data in Multidimensional Scaling Using the Analytic Network Process. Pattern Recognit. Lett. 2005, 26, 755–767. [Google Scholar] [CrossRef]
- Saxena, J.P.; Sushil; Vrat, P. Impact of Indirect Relationships in Classification of Variables—A Micmac Analysis for Energy Conservation. Syst. Res. 1990, 7, 245–253. [Google Scholar] [CrossRef]
- Evers, M.; Jonoski, A.; Almoradie, A.; Lange, L. Collaborative Decision Making in Sustainable Flood Risk Management: A Socio-Technical Approach and Tools for Participatory Governance. Environ. Sci. Policy 2016, 55, 335–344. [Google Scholar] [CrossRef]
- Van Herk, S.; Zevenbergen, C.; Rijke, J.; Ashley, R.; Van Herk, S.; Zevenbergen, C.; Rijke, J.; Ashley, R. Collaborative Research to Support Transition towards Integrating Flood Risk Management in Urban Development. J. Flood Risk Manag. 2011, 4, 306–317. [Google Scholar] [CrossRef]
- Nye, M.; Tapsell, S.; Twigger-Ross, C. New Social Directions in UK Flood Risk Management: Moving towards Flood Risk Citizenship? J. Flood Risk Manag. 2011, 4, 288–297. [Google Scholar] [CrossRef]
- Faulkner, H.; Parker, D.; Green, C.; Beven, K. Developing a Translational Discourse to Communicate Uncertainty in Flood Risk between Science and the Practitioner. Ambio 2007, 36, 692–703. [Google Scholar] [CrossRef] [PubMed]
- Demeritt, D.; Nobert, S. Models of Best Practice in Flood Risk Communication and Management. Environ. Hazards 2014, 13, 313–328. [Google Scholar] [CrossRef] [Green Version]
- Rollason, E.; Bracken, L.J.; Hardy, R.J.; Large, A.R.G. Rethinking Flood Risk Communication. Nat. Hazards 2018, 92, 1665–1686. [Google Scholar] [CrossRef] [Green Version]
- Gilbuena, R.; Kawamura, A.; Medina, R.; Amaguchi, H.; Nakagawa, N. Gap Analysis of the Flood Management System in Metro Manila, Philippines: A Case Study of the Aftermath of Typhoon Ondoy. IAHS Publ. 2013, 357, 32–40. [Google Scholar]
- Hall, J.W.; Meadowcroft, I.C.; Sayers, P.B.; Bramley, M.E. Integrated Flood Risk Management in England and Wales. Nat. Hazards Rev. 2003, 4, 126–135. [Google Scholar] [CrossRef]
- Hall, J.W. Flood Risk Management: Decision Making under Uncertainty. In Applied Uncertainty Analysis for Flood Risk Management; Imperial College Press: London, UK, 2014; pp. 3–24. [Google Scholar] [CrossRef]
- Kekez, T.; Knezic, S.; Andricevic, R. Incorporating Uncertainty of the System Behavior in Flood Risk Assessment–Sava River Case Study. Water 2020, 12, 2676. [Google Scholar] [CrossRef]
- Mercado, J.M.R.; Kawamura, A.; Amaguchi, H.; Rubio, C.J.P. Fuzzy Based Multi-Criteria M&E of the Integrated Flood Risk Management Performance Using Priority Ranking Methodology: A Case Study in Metro Manila, Philippines. Int. J. Disaster Risk Reduct. 2021, 64, 102498. [Google Scholar] [CrossRef]
Figure 1.
Flow chart of the ISM method with the simplified approach.

Figure 2.
ISM diagram for the (a) direct and (b) indirect influence interrelationships between the barriers to IFRM adaptation in Metro Manila.
Figure 2.
ISM diagram for the (a) direct and (b) indirect influence interrelationships between the barriers to IFRM adaptation in Metro Manila.

Table 1.
Barriers to IFRM adaptation in Metro Manila, Philippines. (See Reference [5] for Details).
Table 1.
Barriers to IFRM adaptation in Metro Manila, Philippines. (See Reference [5] for Details).
| Category | Barrier | Description | |
|---|---|---|---|
| Governance | G1 | Lack of a sole organizing body | Fragmented governance in flood management in Metro Manila because the current institutional framework does not have a clear demarcation of tasks among government agencies |
| G2 | Lack of communication | Weak inter-agency communication and the lack of information exchange and communication on the local level | |
| G3 | Lack of funding | Low funding for flood mitigation and control projects | |
| G4 | Lack of flood control measures | Inadequate existing flood control infrastructures | |
| Social | S1 | Informal settlers | Encroachment of marginalized communities in flood-prone areas where they can live cheaply |
| S2 | Poor solid waste management | Clogged waterways and drainages due to solid wastes | |
| S3 | Poor social planning | Services provided by the government of the Philippines are inadequate to address issues related to the community | |
| Technological Resources | T1 | Lack of technological capabilities | Absence of real-time flood forecasts, water level, and rainfall depth updates |
| T2 | Sparse data and limited access | Available hydro-meteorological information is thinly distributed, is not automated, and is measured on a large time interval only | |
| T3 | Lack of experts | Lack of experts from government agencies and local government units | |
| T4 | Lack of data processing systems | No data processing systems, which resulted in hydro-meteorological information just being stored and not used for analysis | |
| T5 | Deterioration of flood control structures | Deterioration of existing flood control structures (e.g., pumping stations, drainage systems, hydraulic control structures) due to poor maintenance and poor solid waste management |
Table 2.
Expanded Boolean multiplication and addition for Ex-ISM.
| Multiplication | Addition | ||||||
|---|---|---|---|---|---|---|---|
| × | 0 | 1 | −1 | + | 0 | 1 | −1 |
| 0 | 0 | 0 | 0 | 0 | 0 | 1 | −1 |
| 1 | 0 | 1 | B | 1 | 1 | 1 | ±1/∓1 a |
| −1 | 0 | B | −1 | −1 | −1 | ±1/∓1 a | −1 |
B—blank; a—upper sign corresponds to the original relation in RMinit while the bottom sign corresponds to transitive or indirect relation in RMfin.
Table 3.
Refined Structural Self-Interaction Matrix (refined SSIM).
| j | 1 | 2 | 3 | 4 | 5 | 6 | 7 | 8 | 9 | 10 | 11 | 12 | ||
|---|---|---|---|---|---|---|---|---|---|---|---|---|---|---|
| i | Category | Governance | Social | Technological Resources | ||||||||||
| Barrier | G1 | G2 | G3 | G4 | S1 | S2 | S3 | T1 | T2 | T3 | T4 | T5 | ||
| 1 | Governance | G1 | +++ +- | +++ ++ | +++ +0 | +00 00 | ++0 00 | ++0 00 | +++ 00 | +++ ++ | +++ +0 | +++ +± | +++ +± | |
| 2 | G2 | - - - -∓ | +++ +± | ++0 00 | +++ +0 | ++0 0+ | +++ 0± | +00 0± | +++ ±± | -00 00 | -00 00 | +00 00 | ||
| 3 | G3 | - - - - - | --- -∓ | +++ -± | -00 0± | 000 ±± | +00 0± | +++ -± | +++ 0± | +++ 0± | +++ ± ± | +++ ±± | ||
| 4 | G4 | - - - -0 | --0 00 | --- +∓ | +00 0± | +00 00 | +++ 00 | +++ +± | +++ +± | ++± ±± | +0± ±± | +++ ++ | ||
| 5 | Social | S1 | -00 00 | --- -0 | +00 0∓ | -00 0∓ | +++ +± | +-- -± | 000 00 | 000 00 | 000 00 | 000 00 | 000 0± | |
| 6 | S2 | --0 00 | --0 0- | 000 ∓∓ | -00 00 | --- -∓ | --- 00 | -00 00 | 000 00 | -00 00 | 000 00 | 000 0± | ||
| 7 | S3 | --0 00 | --- 0∓ | -00 0∓ | --- 00 | -++ +∓ | +++ 00 | -00 00 | -00 0± | --- 00 | 000 ±± | 000 0± | ||
| 8 | Technological Resources | T1 | --- 00 | -00 0∓ | --- +∓ | --- -∓ | 000 00 | +00 00 | +00 00 | +++ +± | ++- -- | +±± ±± | +++ 0± | |
| 9 | T2 | --- -- | --- ∓∓ | --- 0∓ | --- -∓ | 000 00 | 000 00 | +00 0∓ | --- -∓ | +-- -- | +-- -± | +00 0± | ||
| 10 | T3 | --- -0 | +00 00 | --- 0∓ | --∓ ∓∓ | 000 00 | +00 00 | +++ 00 | --+ ++ | -++ ++ | +++ 00 | +++ 00 | ||
| 11 | T4 | --- -∓ | +00 00 | --- ∓∓ | -0∓ ∓∓ | 000 00 | 000 00 | 000 ∓∓ | -∓∓ ∓∓ | -++ +∓ | --- 00 | 0+0 ++ | ||
| 12 | T5 | --- -∓ | -00 00 | --- ∓∓ | --- -- | 000 0∓ | 000 0∓ | 000 0∓ | --- 0∓ | -00 0∓ | --- ∓∓ | 0-0 -- | ||
Table 4.
Final Structural Self-Interaction Matrix (final SSIM).
| i | j | 1 | 2 | 3 | 4 | 5 | 6 | 7 | 8 | 9 | 10 | 11 | 12 |
|---|---|---|---|---|---|---|---|---|---|---|---|---|---|
| Barrier | G1 | G2 | G3 | G4 | S1 | S2 | S3 | T1 | T2 | T3 | T4 | T5 | |
| 1 | G1 | + | + | + | 0 | 0 | 0 | + | + | + | + | + | |
| 2 | G2 | − | + | 0 | + | + | + | 0 | + | 0 | 0 | 0 | |
| 3 | G3 | − | − | + | 0 | 0 | 0 | + | + | + | + | + | |
| 4 | G4 | − | 0 | − | 0 | 0 | + | + | + | ± | ± | + | |
| 5 | S1 | 0 | − | 0 | 0 | + | − | 0 | 0 | 0 | 0 | 0 | |
| 6 | S2 | 0 | − | 0 | 0 | − | − | 0 | 0 | 0 | 0 | 0 | |
| 7 | S3 | 0 | − | 0 | − | + | + | 0 | 0 | - | 0 | 0 | |
| 8 | T1 | − | 0 | − | − | 0 | 0 | 0 | + | − | ± | + | |
| 9 | T2 | − | − | − | − | 0 | 0 | 0 | − | − | − | 0 | |
| 10 | T3 | − | 0 | − | ∓ | 0 | 0 | + | + | + | + | + | |
| 11 | T4 | − | 0 | − | ∓ | 0 | 0 | 0 | ∓ | + | − | + | |
| 12 | T5 | − | 0 | − | - | 0 | 0 | 0 | − | 0 | − | − |
Table 5.
Initial Reachability Matrix (RMinit).
| i | j | 1 | 2 | 3 | 4 | 5 | 6 | 7 | 8 | 9 | 10 | 11 | 12 |
|---|---|---|---|---|---|---|---|---|---|---|---|---|---|
| Barrier | G1 | G2 | G3 | G4 | S1 | S2 | S3 | T1 | T2 | T3 | T4 | T5 | |
| 1 | G1 | ±1 | 1 | 1 | 1 | 0 | 0 | 0 | 1 | 1 | 1 | 1 | 1 |
| 2 | G2 | −1 | ±1 | 1 | 0 | 1 | 1 | 1 | 0 | 1 | 0 | 0 | 0 |
| 3 | G3 | −1 | −1 | ±1 | 1 | 0 | 0 | 0 | 1 | 1 | 1 | 1 | 1 |
| 4 | G4 | −1 | 0 | −1 | ±1 | 0 | 0 | 1 | 1 | 1 | ±1 | ±1 | 1 |
| 5 | S1 | 0 | −1 | 0 | 0 | ±1 | 1 | −1 | 0 | 0 | 0 | 0 | 0 |
| 6 | S2 | 0 | −1 | 0 | 0 | −1 | ±1 | −1 | 0 | 0 | 0 | 0 | 0 |
| 7 | S3 | 0 | −1 | 0 | −1 | 1 | 1 | ±1 | 0 | 0 | −1 | 0 | 0 |
| 8 | T1 | −1 | 0 | −1 | −1 | 0 | 0 | 0 | ±1 | 1 | −1 | ±1 | 1 |
| 9 | T2 | −1 | −1 | −1 | −1 | 0 | 0 | 0 | −1 | ±1 | −1 | −1 | 0 |
| 10 | T3 | −1 | 0 | −1 | ∓1 | 0 | 0 | 1 | 1 | 1 | ±1 | 1 | 1 |
| 11 | T4 | −1 | 0 | −1 | ∓1 | 0 | 0 | 0 | ∓1 | 1 | −1 | ±1 | 1 |
| 12 | T5 | −1 | 0 | −1 | −1 | 0 | 0 | 0 | −1 | 0 | −1 | −1 | ±1 |
Table 6.
Final Positive Reachability Matrix (+RMfin).
| j | 1 | 2 | 3 | 4 | 5 | 6 | 7 | 8 | 9 | 10 | 11 | 12 | |
|---|---|---|---|---|---|---|---|---|---|---|---|---|---|
| i | Barrier | G1 | G2 | G3 | G4 | S1 | S2 | S3 | T1 | T2 | T3 | T4 | T5 |
| 1 | G1 | 1 | 1 | 1 | 1 | 1 * | 1 * | 1 * | 1 | 1 | 1 | 1 | 1 |
| 2 | G2 | 0 | 1 | 1 | 1 * | 1 | 1 | 1 | 1 * | 1 | 1 * | 1 * | 1 * |
| 3 | G3 | 0 | 0 | 1 | 1 | 1 ** | 1 ** | 1 * | 1 | 1 | 1 | 1 | 1 |
| 4 | G4 | 0 | 0 | 0 | 1 | 1 * | 1 * | 1 | 1 | 1 | 1 | 1 | 1 |
| 5 | S1 | 0 | 0 | 0 | 0 | 1 | 1 | 0 | 0 | 0 | 0 | 0 | 0 |
| 6 | S2 | 0 | 0 | 0 | 0 | 0 | 1 | 0 | 0 | 0 | 0 | 0 | 0 |
| 7 | S3 | 0 | 0 | 0 | 0 | 1 | 1 | 1 | 0 | 0 | 0 | 0 | 0 |
| 8 | T1 | 0 | 0 | 0 | 1 * | 1 *** | 1 *** | 1 ** | 1 | 1 | 1 ** | 1 | 1 |
| 9 | T2 | 0 | 0 | 0 | 0 | 0 | 0 | 0 | 0 | 1 | 0 | 0 | 0 |
| 10 | T3 | 0 | 0 | 0 | 1 | 1 * | 1 * | 1 | 1 | 1 | 1 | 1 | 1 |
| 11 | T4 | 0 | 0 | 0 | 1 | 1 ** | 1 ** | 1 * | 1 | 1 | 1 * | 1 | 1 |
| 12 | T5 | 0 | 0 | 0 | 0 | 0 | 0 | 0 | 0 | 0 | 0 | 0 | 1 |
Table 7.
Final Negative Reachability Matrix (−RMfin).
| j | 1 | 2 | 3 | 4 | 5 | 6 | 7 | 8 | 9 | 10 | 11 | 12 | |
|---|---|---|---|---|---|---|---|---|---|---|---|---|---|
| i | Barrier | G1 | G2 | G3 | G4 | S1 | S2 | S3 | T1 | T2 | T3 | T4 | T5 |
| 1 | G1 | −1 | 0 | 0 | 0 | 0 | 0 | 0 | 0 | 0 | 0 | 0 | 0 |
| 2 | G2 | −1 | −1 | 0 | 0 | 0 | 0 | 0 | 0 | 0 | 0 | 0 | 0 |
| 3 | G3 | −1 | −1 | −1 | 0 | 0 | 0 | 0 | 0 | 0 | 0 | 0 | 0 |
| 4 | G4 | −1 | −1 * | −1 | −1 | 0 | 0 | 0 | −1 * | 0 | −1 | −1 | 0 |
| 5 | S1 | −1 * | −1 | −1 ** | −1 * | −1 | 0 | −1 | −1 *** | 0 | −1 * | −1 ** | 0 |
| 6 | S2 | −1 * | −1 | −1 ** | −1 * | −1 | −1 | −1 | −1 *** | 0 | −1 * | −1 ** | 0 |
| 7 | S3 | −1 * | −1 | −1 * | −1 | 0 | 0 | −1 | −1 ** | 0 | −1 | −1 * | 0 |
| 8 | T1 | −1 | −1 * | −1 | −1 | 0 | 0 | 0 | −1 | 0 | −1 | −1 | 0 |
| 9 | T2 | −1 | −1 | −1 | −1 | 0 | 0 | 0 | −1 | −1 | −1 | −1 | 0 |
| 10 | T3 | −1 | −1 * | −1 | −1 | 0 | 0 | 0 | −1 ** | 0 | −1 | −1 * | 0 |
| 11 | T4 | −1 | −1 * | −1 | −1 | 0 | 0 | 0 | −1 | 0 | −1 | −1 | 0 |
| 12 | T5 | −1 | −1 * | −1 | −1 | 0 | 0 | 0 | −1 | 0 | −1 | −1 | −1 |
Table 8.
Final Reachability Matrix (RMfin) and Levels of each barrier.
| j | 1 | 2 | 3 | 4 | 5 | 6 | 7 | 8 | 9 | 10 | 11 | 12 | Level | |
|---|---|---|---|---|---|---|---|---|---|---|---|---|---|---|
| i | Barrier | G1 | G2 | G3 | G4 | S1 | S2 | S3 | T1 | T2 | T3 | T4 | T5 | |
| 1 | G1 | ±1 | 1 | 1 | 1 | 1 * | 1 * | 1 * | 1 | 1 | 1 | 1 | 1 | 12 |
| 2 | G2 | −1 | ±1 | 1 | 1 * | 1 | 1 | 1 | 1 * | 1 | 1 * | 1 * | 1 * | 11 |
| 3 | G3 | −1 | −1 | ±1 | 1 | 1 ** | 1 ** | 1 * | 1 | 1 | 1 | 1 | 1 | 10 |
| 4 | G4 | −1 | −1 * | −1 | ±1 | 1 * | 1 * | 1 | ±1 * | 1 | ±1 | ±1 | 1 | 9 |
| 5 | S1 | −1 * | −1 | −1 ** | −1 * | ±1 | 1 | −1 | −1 *** | 0 | −1 * | −1 ** | 0 | 2 |
| 6 | S2 | −1 * | −1 | −1 ** | −1 * | −1 | ±1 | −1 | −1 *** | 0 | −1 * | −1 ** | 0 | 1 |
| 7 | S3 | −1 * | −1 | −1 * | −1 | 1 | 1 | ±1 | −1 ** | 0 | −1 | −1 * | 0 | 3 |
| 8 | T1 | −1 | −1 * | −1 | ∓1 * | 1 *** | 1 *** | 1 ** | ±1 | 1 | ∓1 ** | ±1 | 1 | 9 |
| 9 | T2 | −1 | −1 | −1 | −1 | 0 | 0 | 0 | −1 | ±1 | −1 | −1 | 0 | 1 |
| 10 | T3 | −1 | −1 * | −1 | ∓1 | 1 * | 1 * | 1 | ±1 ** | 1 | ±1 | ±1 * | 1 | 9 |
| 11 | T4 | −1 | −1 * | −1 | ∓1 | 1 ** | 1 ** | 1 * | ∓1 | 1 | ∓1 * | ±1 | 1 | 9 |
| 12 | T5 | −1 | −1 * | −1 | −1 | 0 | 0 | 0 | −1 | 0 | −1 | −1 | ±1 | 1 |
Table 9.
Conical matrix (CM).
| Level | 12 | 11 | 10 | 9 | 9 | 9 | 9 | 3 | 2 | 1 | 1 | 1 | |
|---|---|---|---|---|---|---|---|---|---|---|---|---|---|
| Barrier | G1 | G2 | G3 | G4 | T1 | T3 | T4 | S3 | S1 | S2 | T2 | T5 | |
| 12 | G1 | ±1 | 1 | 1 | 1 | 1 | 1 | 1 | 1 * | 1 * | 1 * | 1 | 1 |
| 11 | G2 | −1 | ±1 | 1 | 1 * | 1 * | 1 * | 1 * | 1 | 1 | 1 | 1 | 1 * |
| 10 | G3 | −1 | −1 | ±1 | 1 | 1 | 1 | 1 | 1 * | 1 ** | 1 ** | 1 | 1 |
| 9 | G4 | −1 | −1 * | −1 | ±1 | ±1 * | ±1 | ±1 | 1 | 1 * | 1 * | 1 | 1 |
| 9 | T1 | −1 | −1 * | −1 | ∓1 * | ±1 | ∓1 ** | ±1 | 1 ** | 1 *** | 1 *** | 1 | 1 |
| 9 | T3 | −1 | −1 * | −1 | ∓1 | ±1 | ±1 | ±1 | 1 | 1 * | 1 * | 1 | 1 |
| 9 | T4 | −1 | −1 * | −1 | ∓1 | ∓1 | ∓1 * | ±1 | 1 * | 1 ** | 1 ** | 1 | 1 |
| 3 | S3 | −1 * | −1 | −1 * | −1 | −1 ** | −1 | −1 * | ±1 | 1 | 1 | 0 | 0 |
| 2 | S1 | −1 * | −1 | −1 ** | −1 * | −1 *** | −1 * | −1 ** | −1 | ±1 | 1 | 0 | 0 |
| 1 | S2 | −1 * | −1 | −1 ** | −1 * | −1 *** | −1 * | −1 ** | −1 | −1 | ±1 | 0 | 0 |
| 1 | T2 | −1 | −1 | −1 | −1 | −1 | −1 | −1 | 0 | 0 | 0 | ±1 | 0 |
| 1 | T5 | −1 | −1 * | −1 | −1 | −1 | −1 | −1 | 0 | 0 | 0 | 0 | ±1 |
Disclaimer/Publisher’s Note: The statements, opinions and data contained in all publications are solely those of the individual author(s) and contributor(s) and not of MDPI and/or the editor(s). MDPI and/or the editor(s) disclaim responsibility for any injury to people or property resulting from any ideas, methods, instructions or products referred to in the content. |
© 2023 by the authors. Licensee MDPI, Basel, Switzerland. This article is an open access article distributed under the terms and conditions of the Creative Commons Attribution (CC BY) license (https://creativecommons.org/licenses/by/4.0/).
Share and Cite
MDPI and ACS Style
Mercado, J.M.; Kawamura, A.; Medina, R. An Expanded Interpretive Structural Modeling Analysis of the Barriers to Integrated Flood Risk Management Adaptation in Metro Manila. Water 2023, 15, 1029. https://doi.org/10.3390/w15061029
AMA Style
Mercado JM, Kawamura A, Medina R. An Expanded Interpretive Structural Modeling Analysis of the Barriers to Integrated Flood Risk Management Adaptation in Metro Manila. Water. 2023; 15(6):1029. https://doi.org/10.3390/w15061029
Chicago/Turabian StyleMercado, Jean Margaret, Akira Kawamura, and Reynaldo Medina. 2023. "An Expanded Interpretive Structural Modeling Analysis of the Barriers to Integrated Flood Risk Management Adaptation in Metro Manila" Water 15, no. 6: 1029. https://doi.org/10.3390/w15061029
Note that from the first issue of 2016, this journal uses article numbers instead of page numbers. See further details here.