
A Spreadsheet Tool for Defining Dangerous Flow Ranges of Low-Head Dams

U.S. Bureau of Reclamation, Denver, CO 80225, USA
*
Author to whom correspondence should be addressed.
Water 2023, 15(6), 1032; https://doi.org/10.3390/w15061032
Submission received: 3 February 2023
/
Revised: 24 February 2023
/
Accepted: 7 March 2023
/
Published: 9 March 2023
(This article belongs to the Special Issue Locating and Understanding the Hydraulics of Low-Head Dams)
Abstract
:Low-head dams can be dangerous to recreational river users when a submerged hydraulic jump forms downstream, with recirculating surface flows that repeatedly carry trapped recreationists upstream into the high-velocity jet plunging over the dam crest. The flow endangers those who pass over the dam from upstream and can also entrap those who approach too closely from downstream. A national task force is using a range of methods to identify potentially dangerous structures, but definite determination requires field data and an analysis of the hydraulic conditions for each site’s range of likely flow rates. The spreadsheet tool described here determines the submergence created by site-specific tailwater levels and uses previous research results to estimate the associated magnitude of reverse flow velocities. The spreadsheet also determines the crucial tailwater level at which the jet passing over the dam stops plunging into the tailwater pool and instead flips to the surface, creating safer, downstream-directed velocities. The article describes application to specific sites and provides insight about the dangerous flow range of typical low-head dams.
1. Introduction
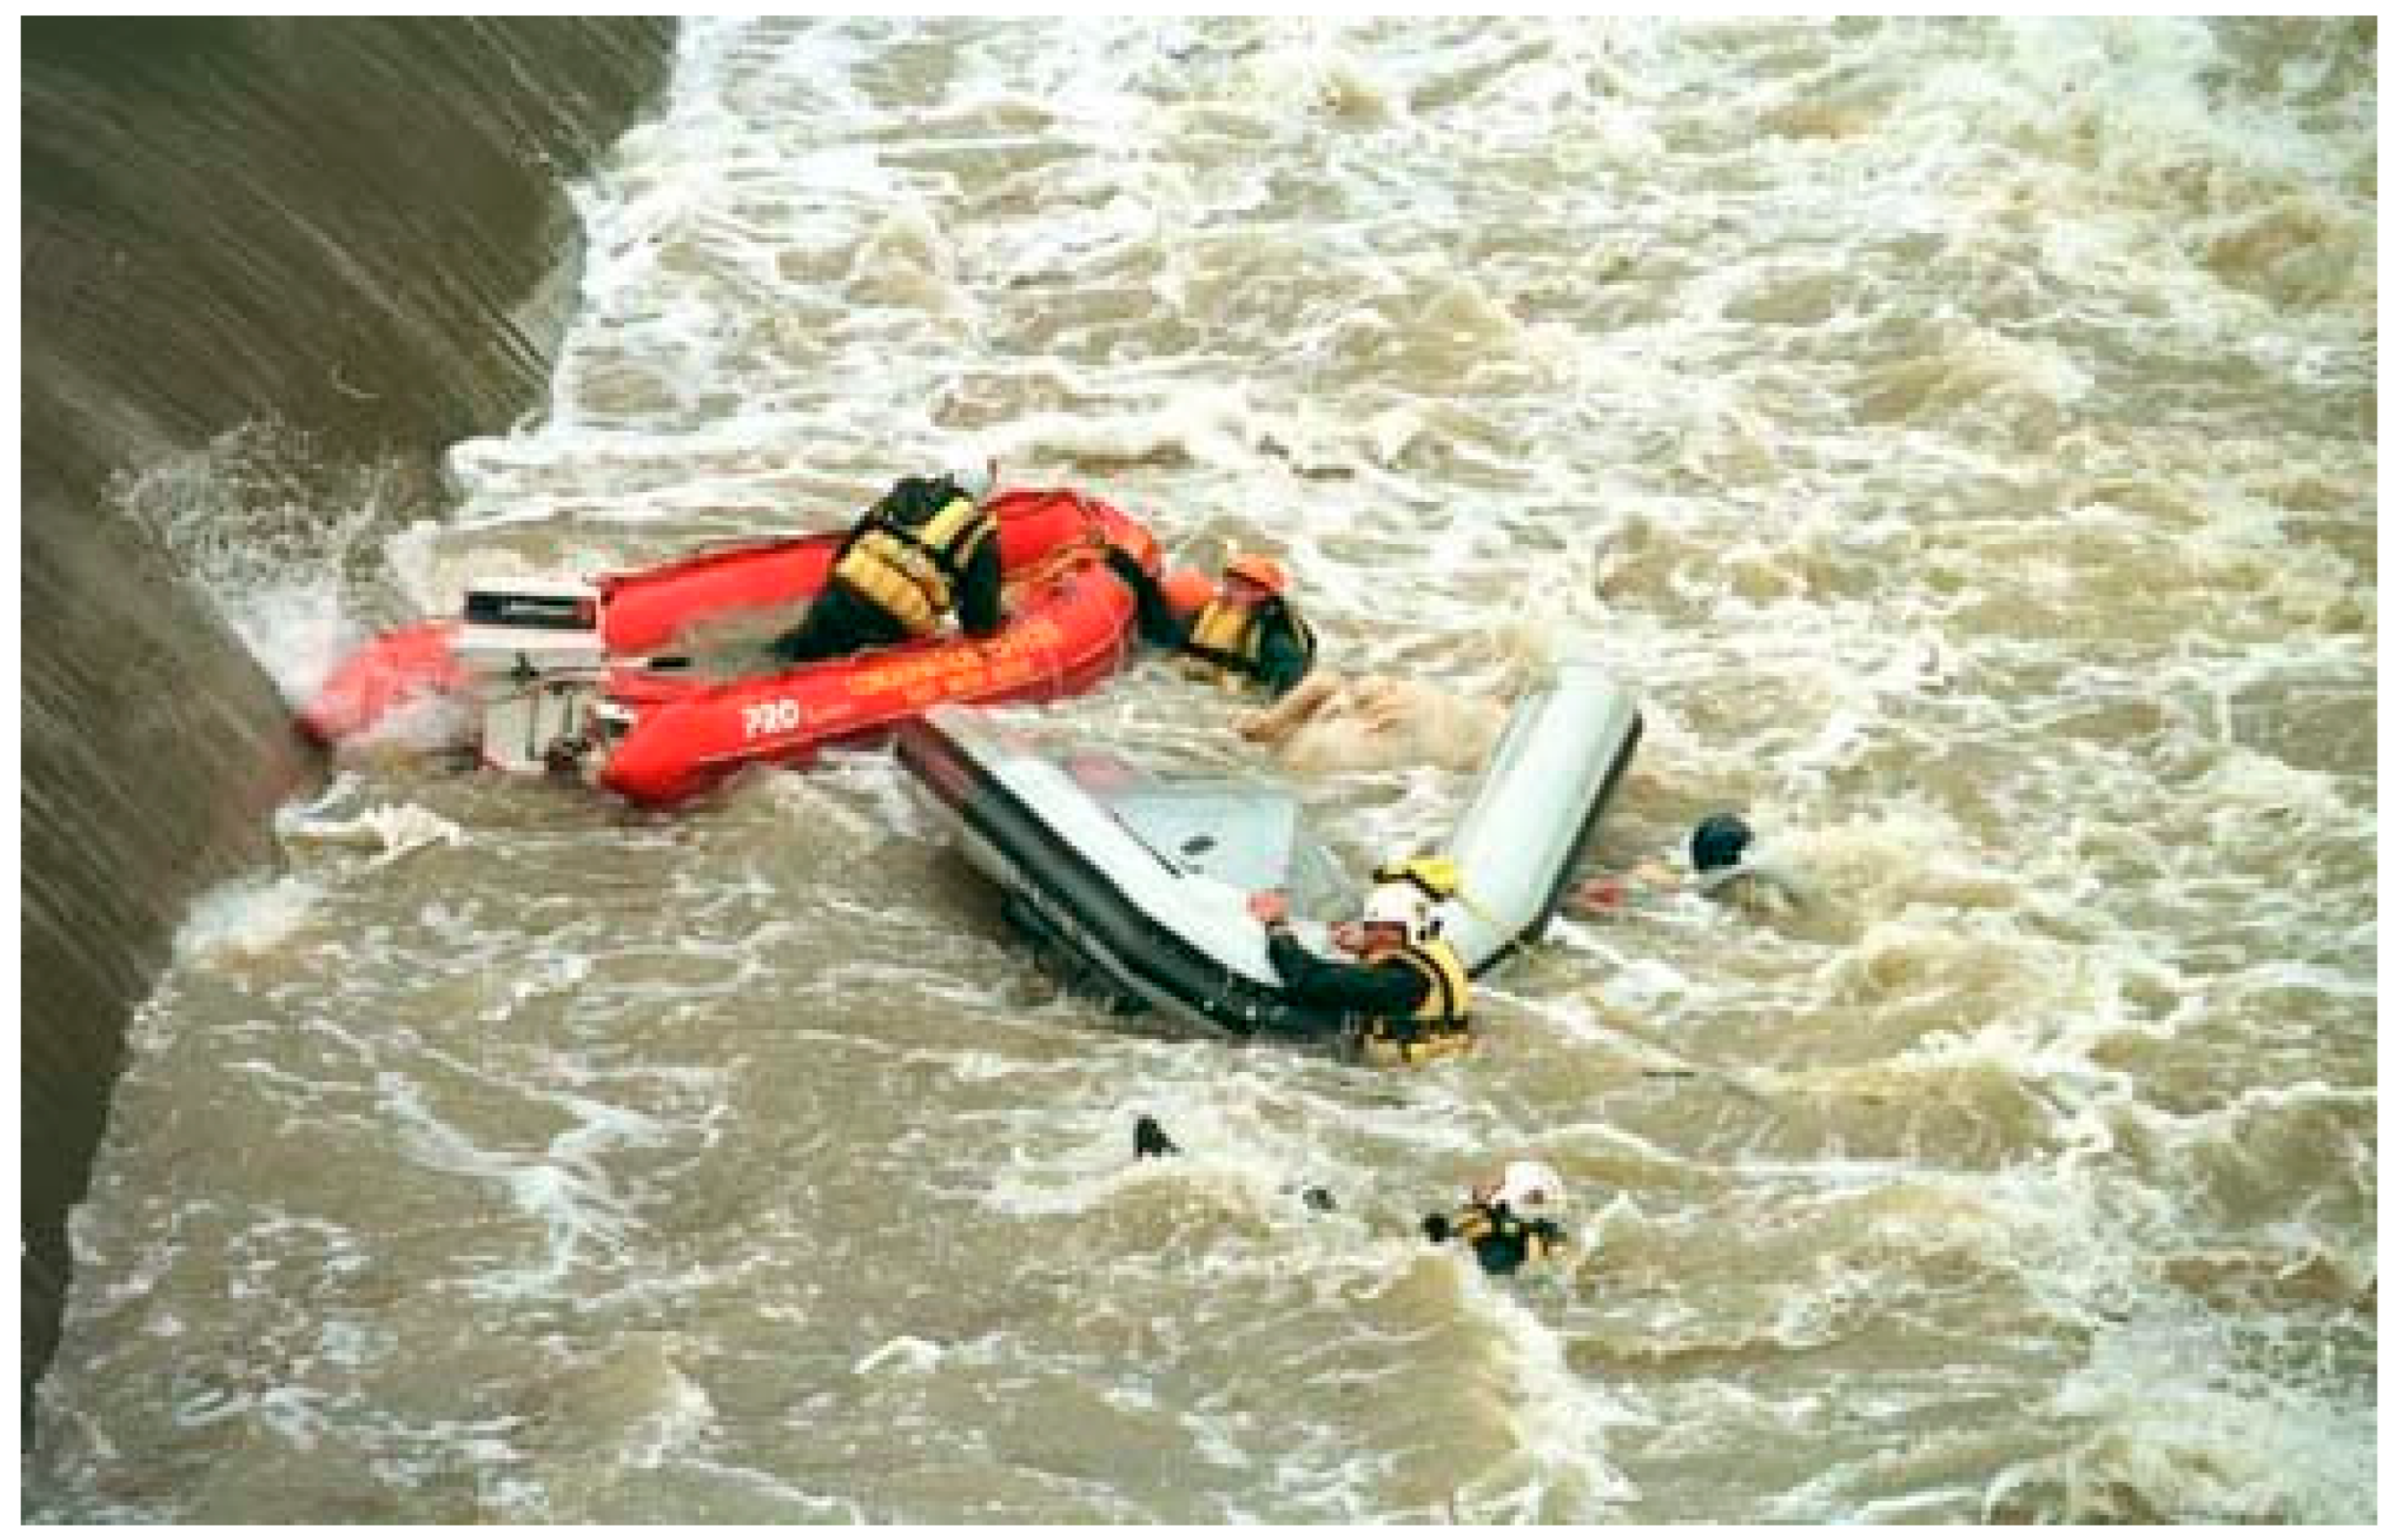
Dam safety programs focus their attention on preventing loss-of-life associated with failure of dams and the related flooding caused by the uncontrolled release of stored water. High dams and large storage reservoirs have the greatest potential to create dangerous flooding. In recent decades, these programs have successfully reduced the number of lives lost to dam failure, but work by Tschantz (2014) [1] shows that the same period has seen a dramatic increase in drowning fatalities in recreational river users such as boaters, anglers, and swimmers who encounter low-head dams. Dam failures are usually associated with performance deficiencies (e.g., excessive seepage, misoperation, and structural deterioration) or extraordinary flow conditions that exceed design conditions (e.g., overtopping due to inadequate spillway capacity), but fatalities at low-head dams often occur while the structure is operating exactly as intended at typical operational flow rates. The reverse-flow conditions that turn these dams into nearly inescapable drowning hazards can appear deceptively docile, even to experienced river users. Family outings turn into tragedies, and emergency responders and good Samaritan rescuers often become additional victims [2] (Figure 1).
In this article, we consider low-head dams with characteristics similar to those described in the U.S. Federal Register in connection with Nationwide Permit 53—Removal of Low-Head Dams [3]:
“…[A] ‘low-head dam’ is generally defined as a dam or weir built across a stream to pass flows from upstream over all, or nearly all, of the width of the dam crest and does not have a separate spillway or spillway gates, but it may have an uncontrolled spillway…A low-head dam may have been built for a range of purposes…, but in all cases, it provides little or no storage function”.
This definition is function-based, focusing on the continuity of flow over the structure in both space and time, as well as the lack of significant water storage. As a practical matter, it is also helpful to know that the low-head dams that typically present the most danger for river users have structural heights below 5 m (about 15 ft). Higher dams typically appear dangerous to river users and are naturally avoided, but small structures can look benign and even invite close approach. According to the definition stated above, dangerous dams also typically have crests that span the full width of the river channel with a continuous overflow section that eliminates points of refuge in the middle of the river channel. Finally, dangerous dams develop submerged hydraulic jumps that create an upstream-directed surface current on the downstream side of the dam that pulls victims repeatedly into the high-velocity flow coming over the dam and prevents escape because the surface velocities exceed the swimming abilities of recreational river users [4,5]. When attempting to identify dangerous structures, visual observations from the river edge or even from aerial photos can suggest structures with the requisite height and continuous overflow characteristics, but distinguishing between unsubmerged, dangerously submerged, and almost fully submerged jumps—which are surprisingly safer—is difficult for all but experienced hydraulic structures specialists. The spreadsheet tool described here bridges that gap.
2. The Submerged Hydraulic Jump
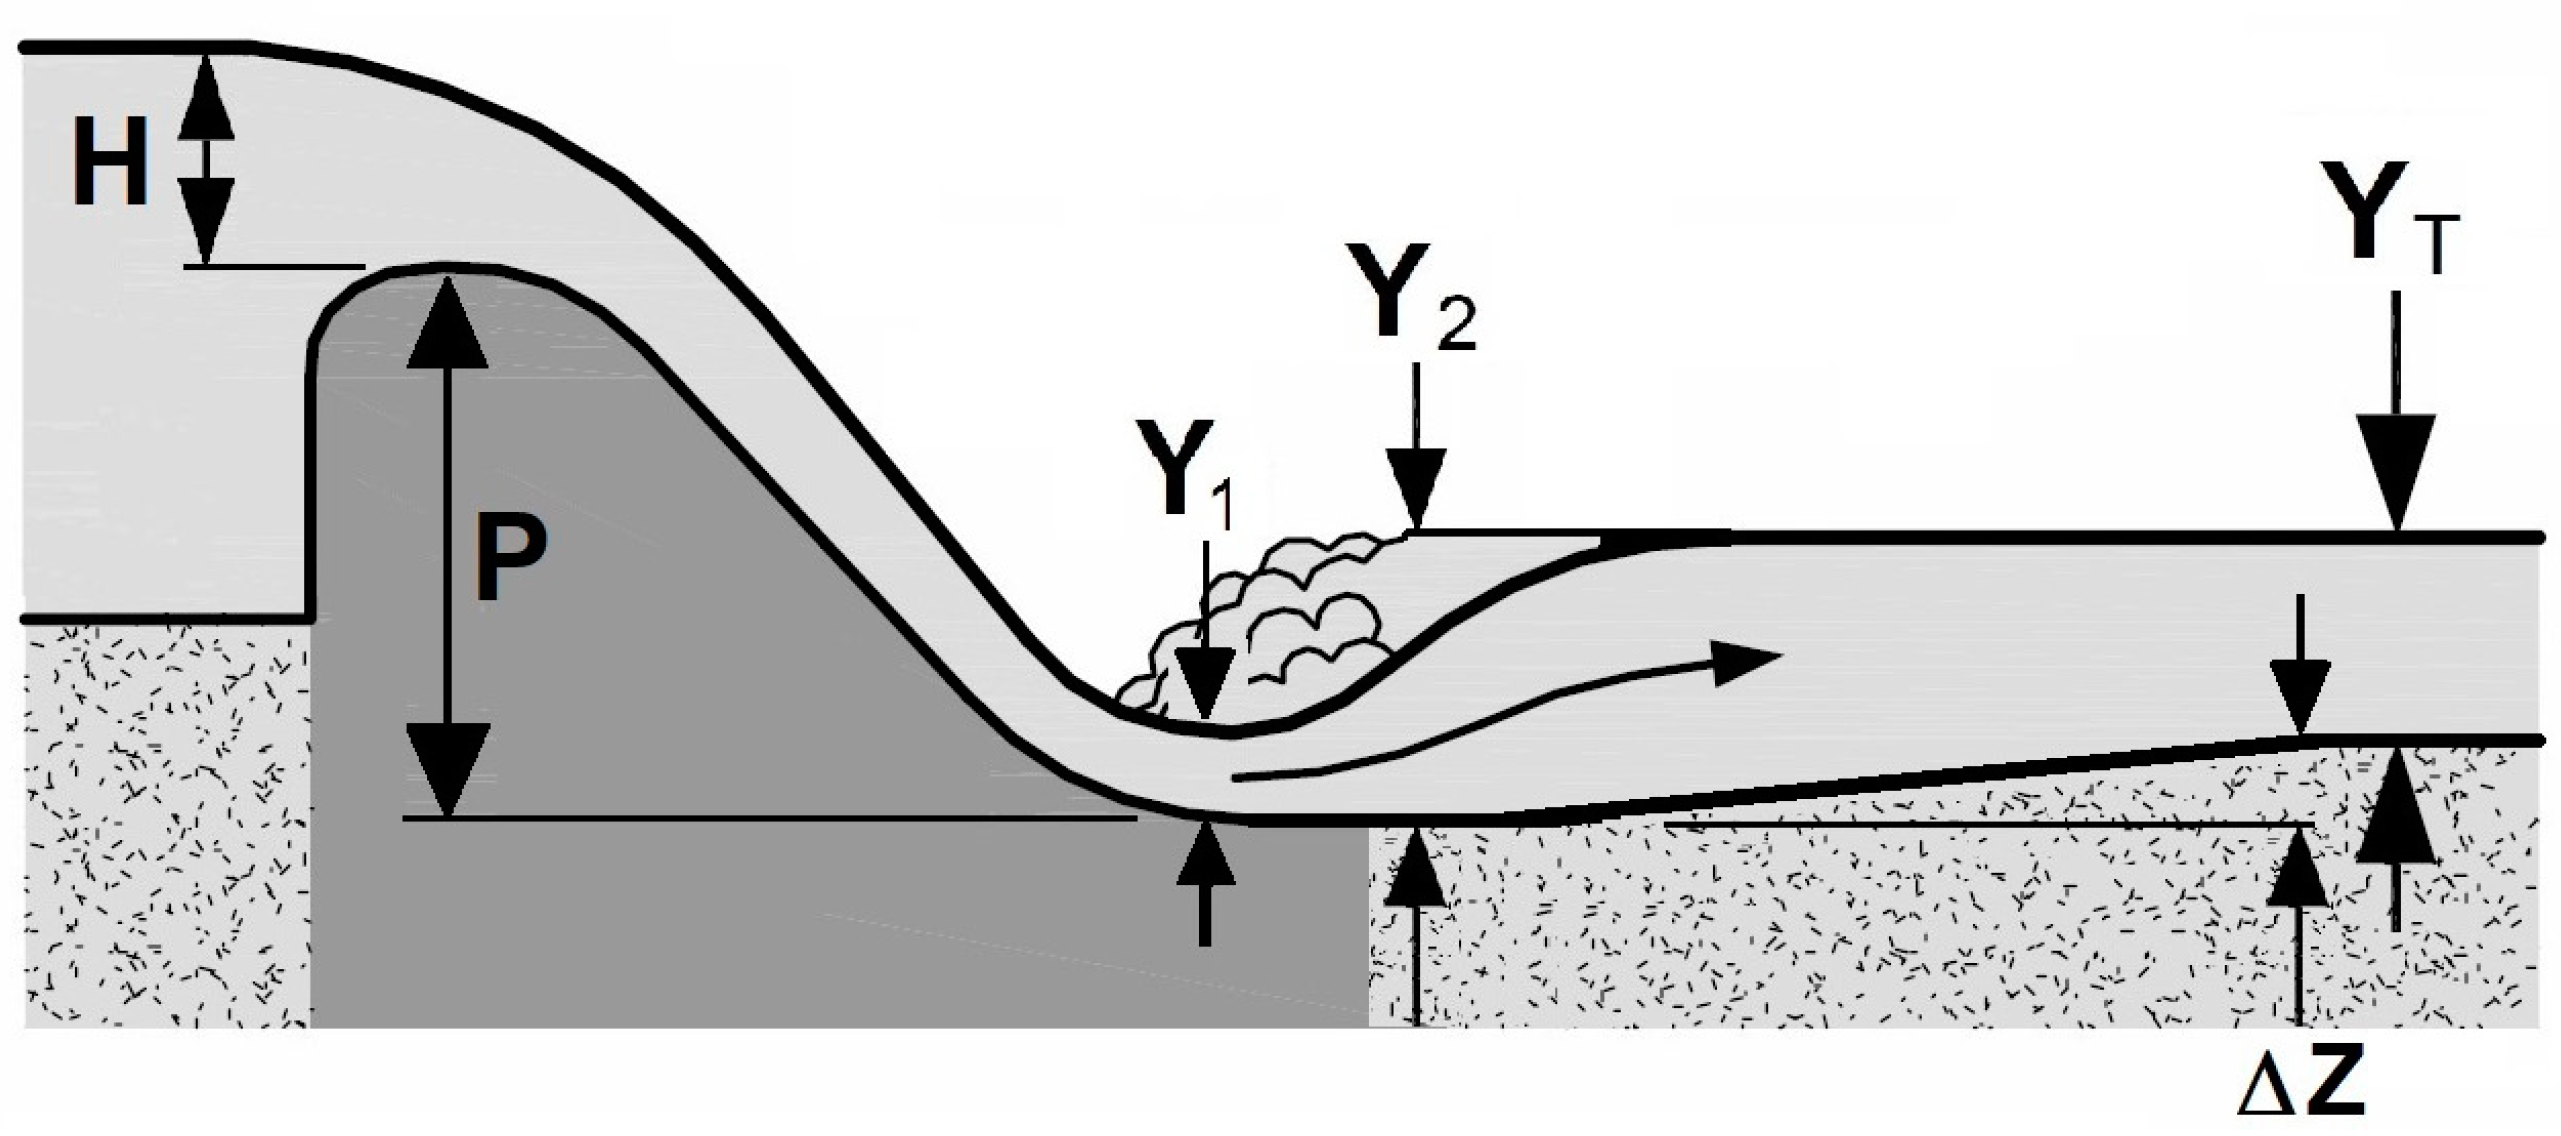
Flow in an open channel (e.g., a river or canal) can exist in three states, defined by the value of the Froude number F = V/(gY)0.5, where V is the flow velocity, g is the acceleration due to gravity, and Y is the hydraulic depth defined as the flow cross-sectional area divided by the channel top width. The flow may be deep and slow (subcritical, with F less than 1.0), shallow, and rapid (supercritical, with F greater than 1.0), or at the transition between the two (critical, F = 1.0). Low-head dams cause a transition from subcritical flow upstream to critical flow near the apex of the dam crest, and then to supercritical flow at the toe of the dam (Figure 2). When the transition occurs in this direction (accelerating flow), the gravitational potential energy of the water in the upstream pool is converted mostly to the kinetic energy of the rapid flow at the toe. The critical flow state at the crest has the minimum energy content for a given flow rate, while the subcritical and supercritical flows have higher and almost equal energy contents (neglecting small fluid friction losses), albeit with different proportions of energy associated with flow depth (pressure) and kinetic energy (velocity).
Downstream from the dam, supercritical flow can only be maintained if the downstream channel is steep, which is unusual in natural waterways; as a result, a hydraulic jump typically occurs to return the flow to a subcritical condition of greater depth and slower velocity in the downstream channel. The jump is characterized by an abrupt rise in the water surface elevation and reverse circulation of flow on the surface. The flow on the surface is directed upstream toward the dam, while the net flow direction is downstream away from the dam. Total momentum of the flow is conserved through the jump, but significant energy is lost through turbulence as the downstream water tries to fill the empty space above the surface of the supercritical flow on the face of the dam.
The hydraulic jump below a low-head dam can take four possible forms depending on the downstream depth relative to the ideal depth required to position the jump exactly at the toe of the dam (i.e., the conjugate depth). The conjugate depth can be calculated uniquely for a known discharge per unit width over the weir, but the actual tailwater depth is established by the downstream channel characteristics (e.g., slope and roughness, constrictions such as bridges, gates, and culverts) and need not match the conjugate depth.
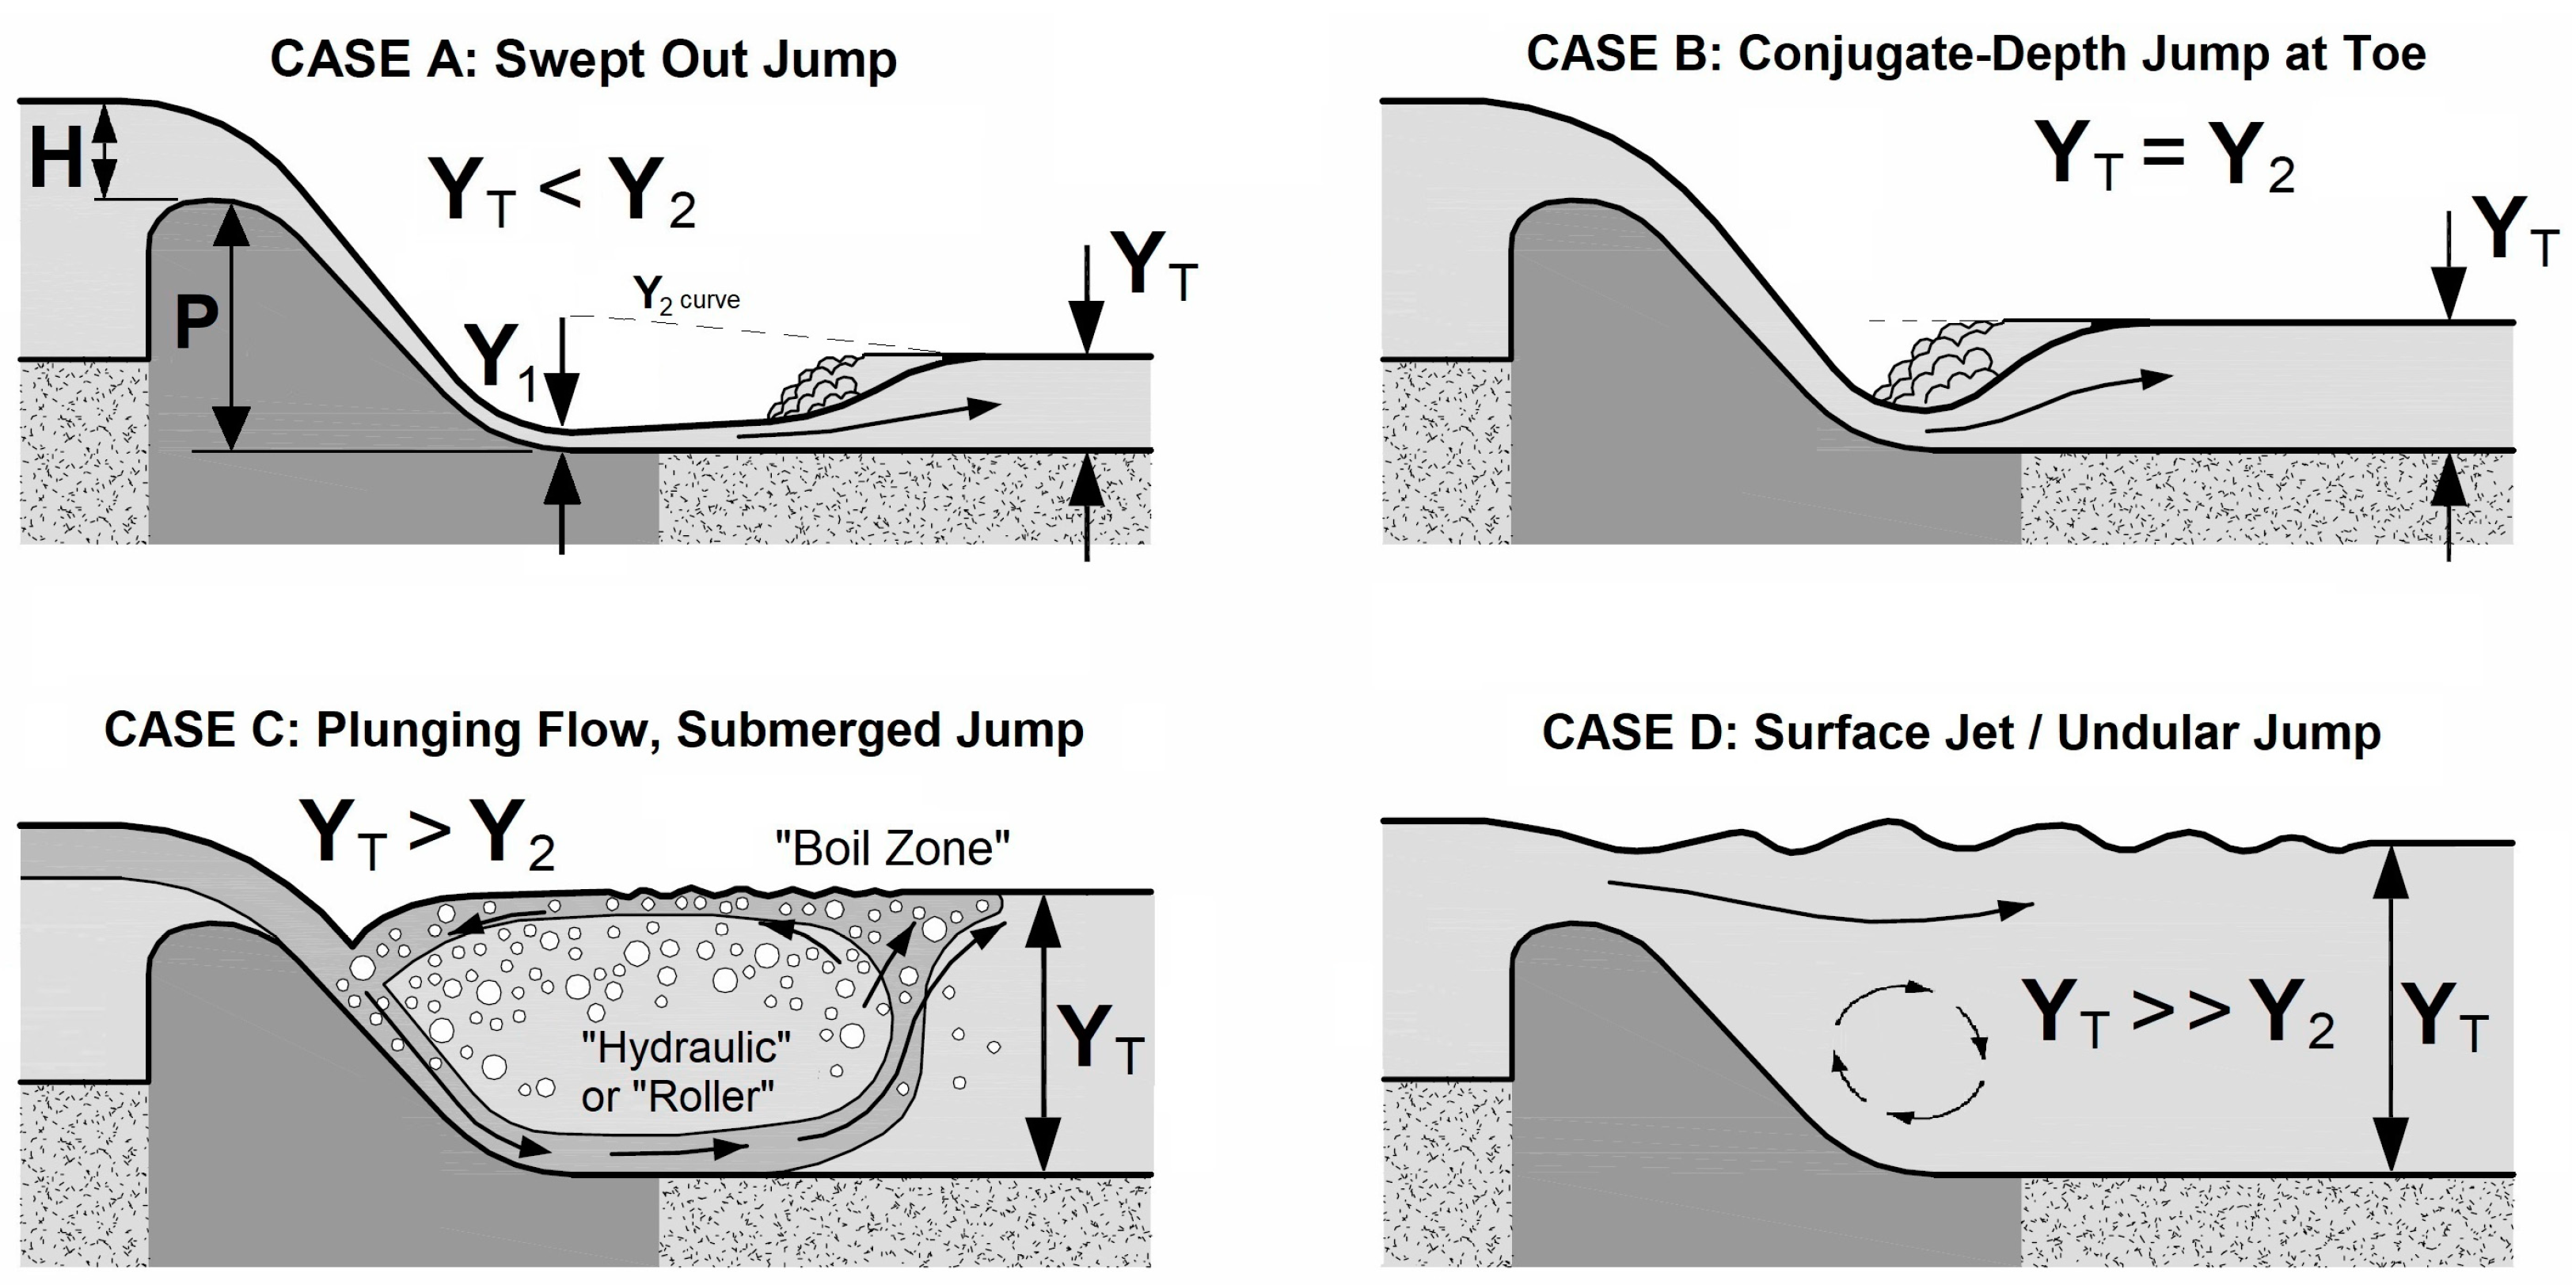
If the tailwater level at the downstream side of the dam is less than the required conjugate depth, the jump will occur further downstream (a “swept out jump”, Case A) at a point where the supercritical flow has slowed enough that the associated conjugate depth matches the actual tailwater level (Figure 3). It should be noted that the conjugate depth is reduced in the downstream direction as friction slows the supercritical flow, so the Y2 depth at the toe of the dam is just the beginning of a Y2 curve, as shown in the figure. If the tailwater level matches the conjugate depth, the jump will be located exactly at the toe (Case B, Figure 3). This is the same condition shown previously in Figure 2. Case A and B hydraulic jumps appear to be powerful and dangerous due to turbulent energy dissipation, so recreationists see them readily and usually avoid them. In addition, these jumps tend to sweep people through the jump instead of returning them continually back upstream.
If the tailwater level is higher than the conjugate depth, the jump will submerge the flow at the toe. In this condition, the overflowing jet plunges deep into the tailwater pool creating a large and dangerous reverse flow, or countercurrent, zone, as shown in Figure 3 (Case C). River recreationists sometimes call this a “roller”, “hydraulic”, or “keeper”. To hydraulic engineers, this flow is known as a forced vortex. Despite the strong surface flow toward the dam face, these jumps have a quieter appearance on the surface than Case A and B jumps, partly due to the characteristic surface boil that divides the upstream- and downstream-directed surface flows but appears relatively calm. This makes low-head dams deceptively dangerous for recreationists. As the submergence or tailwater depth increases through the range of Case C, the countercurrent velocity first increases quickly toward a maximum, then gradually decreases [8]. Finally, if the tailwater is high enough (Figure 3, Case D), the submerged jump will transition to an undular jump with the overflowing jet detaching from the downstream dam face and flipping to the surface of the tailwater pool [9] where it creates quiet, undular surface waves. In this condition, the reverse-flow on the surface is diminished or eliminated and the jump is much less dangerous. This is sometimes described as a “drowned-out” jump.
To summarize, moderately submerged jumps are the most dangerous, with the largest recirculating zones and strongest reverse-flow currents. Most low-head dams will exhibit a significant range of flows with dangerous conditions, and with changing river flows, recreationists can experience dangerous conditions in a location that was safe during previous visits. The previous description focused on changes that occur for increasing tailwater levels and flow rates that might occur during a rising flood. Similar flow conditions occur during decreasing flow and tailwater conditions, except that the point at which the jump transitions from Case D back to Case C is slightly different. This “flop” point occurs at a somewhat lower tailwater level than the previously described “flip” point [9].
3. Previous Hydraulic Modeling
Hans Leutheusser, late professor of mechanical engineering at the University of Toronto, was retained in the late 1980s—probably due to proximity and his familiarity with the mechanics of hydraulic jumps [10]—to assist with a judicial inquest related to a double drowning at a low-head dam near Ajax, Ontario. His involvement led to the first professional paper on the topic in 1988 [4] and a continued interest that led to flume testing and a set of equations published in 2001 [8] for predicting the strength of the reverse flow velocities in a submerged hydraulic jump. These experiments were conducted in a physical hydraulic model of a sharp-crested weir with a ventilated nappe. Although many low-head dams are ogee-shaped weirs with an overflow jet that remains attached to the downstream face of the dam, the flow conditions on the downstream side of the sharp-crested weir model are largely representative of the typical low-head dam situation.
In the experiments, near-surface velocity magnitude and direction are measured in the submerged hydraulic jump for a range of weir heights, headwater levels, and tailwater depths. The reverse-flow velocity rises quickly to a maximum as a jump becomes submerged, then decreases with increasing tailwater depth until the surface velocity drops rapidly to near zero. At this critical degree of submergence, the “flip” of the flow occurs [9], and the overflowing jet detaches from the downstream face of the dam so that surface velocities are directed downstream. If the tailwater elevation is reduced from this condition, a “flop” of the flow occurs, in which the jet overflowing the dam crest suddenly attaches again to the downstream dam face and plunges to the bottom of the downstream channel. This action creates the counter-rotating flow again. Leutheusser and Fan (2001) [8] found that nappe flip occurs when the ratio of the upstream total head (H + P) to tailwater depth at the toe (YT + ΔZ) is about 1.10 and nappe flop occurs at (H + P)/(YT + ΔZ) ≈ 1.19, with the difference attributed to hysteresis caused by changing the nappe ventilation conditions. For ogee-crest structures, nappe ventilation is unlikely, so the flip and flop points may be closer together, although some hysteresis still seems likely as rotational inertia makes either flow condition somewhat self-sustaining. Experiments such as those of Leutheusser and Fan (2001) [8] have not been carried out for ogee-crest dams. Egea (2015) [11] did conduct similar physical experiments and numerical modeling on overflow weirs used as sea lamprey barriers and noted some variation of the flip and flop points as a function of the downstream apron elevation and other factors. These weirs typically have a T-shaped cross-section formed by a narrow vertical wall topped by a flat crest.
Israel-Devadason and Schweiger (2019) [12] used computational fluid dynamics (CFD) modeling to simulate complex hydraulic conditions at low-head dams, predict the presence of submerged hydraulic jumps, and assess potential structural remediation options. They considered the case study of Dock Street Dam in Harrisburg, Pennsylvania, a 1.83 m (6-ft) high run-of-the-river dam that caused 30 drownings and 25 documented rescues from 1935 to 2018, although it is classified as a low-hazard dam [13]. Using the CFD model, the physical motions of a victim were simulated in the hydraulic roller downstream from the dam for one documented near-fatal incident. The range of discharges causing submerged hydraulic jumps was determined, and almost all reported incidents at the dam were found to have occurred in the Case C condition described earlier.
4. Spreadsheet Determination of Dangerous Conditions
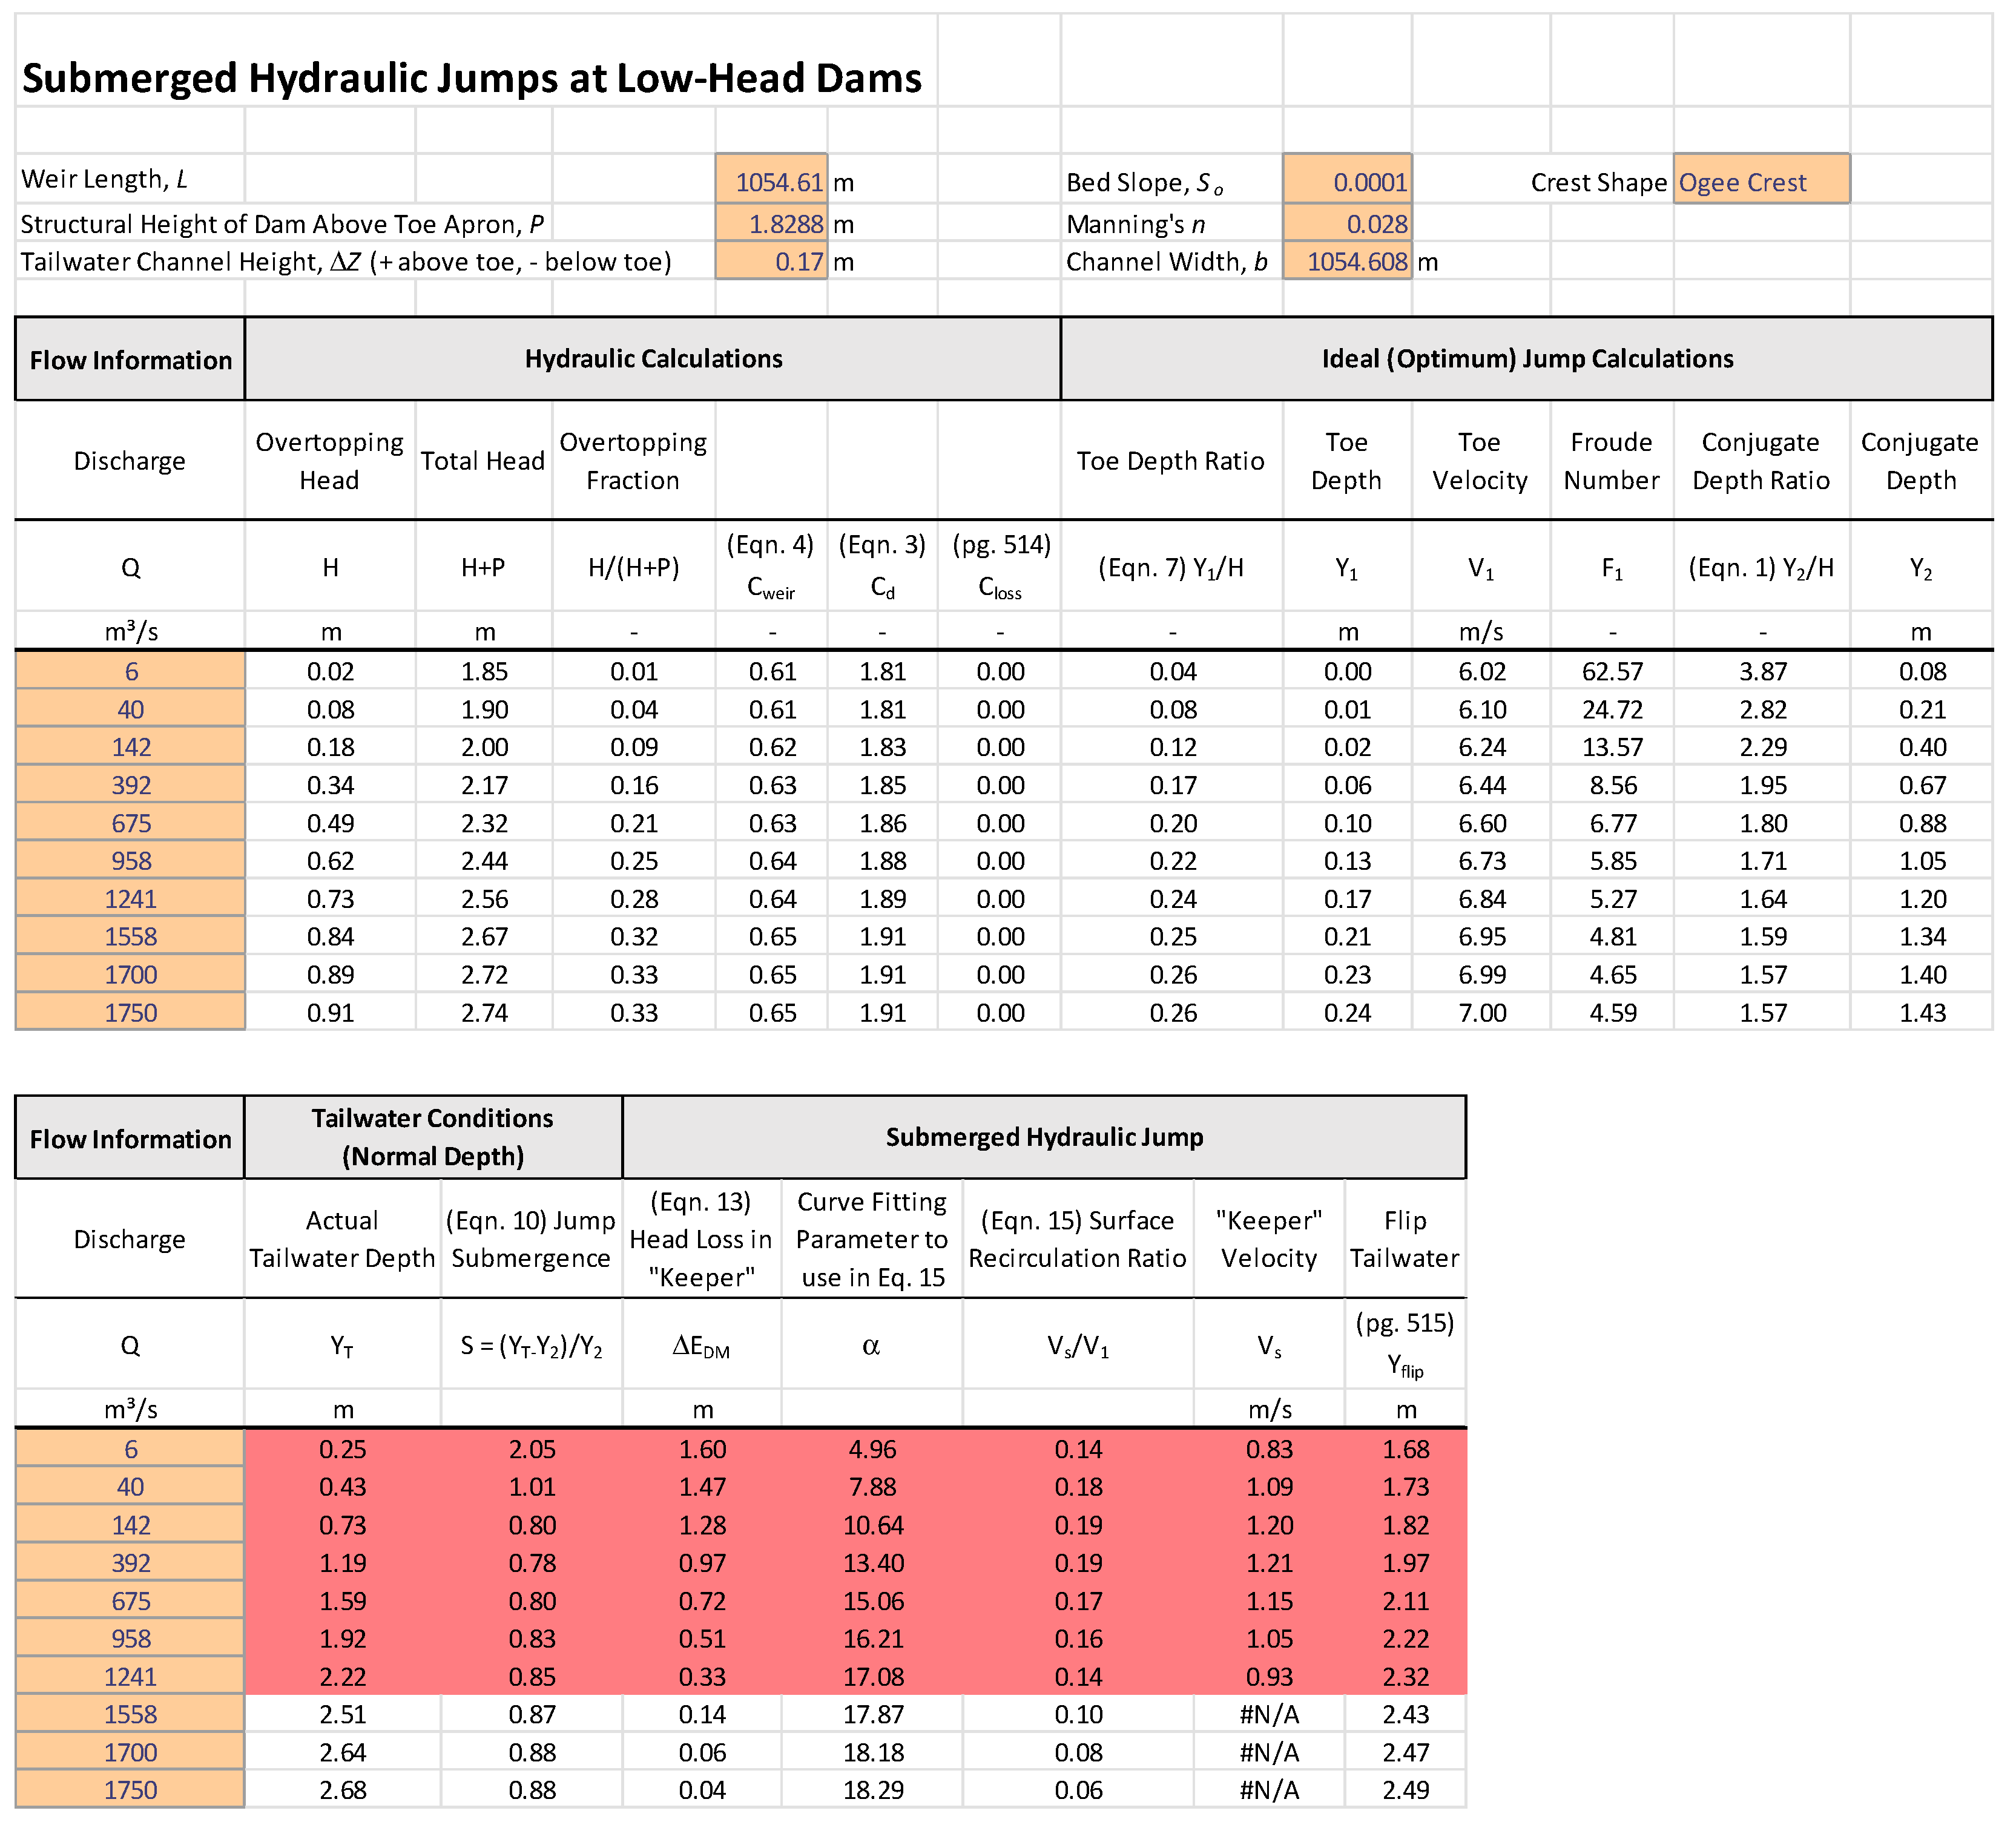
A Microsoft Excel spreadsheet was created to evaluate the site-specific hydraulic conditions at low-head dams for a range of flows. The basic hydraulic conditions at the toe of the dam and the resulting hydraulic jump parameters were calculated along with the existing tailwater conditions for the site, estimated with Manning’s equation for normal depth flow. The tailwater levels were compared to the calculated conjugate depths to identify the range over which a Case C submerged hydraulic jump would occur. For those cases, the sheet went on to calculate the magnitude of the surface velocity directed upstream toward the dam and the tailwater level at which the overflow will flip to the surface to produce Case D. The following input information is provided in the orange cells shown in Figure 4:
- Structure properties—Crest type (sharp crest or ogee crest), flow rates, weir length across channel, and structural height of the dam above downstream toe (P)
- Tailwater properties—Downstream channel bed slope, Manning’s n (roughness factor of the downstream channel), channel width downstream from the dam (may be different from the weir length), and elevation of the tailwater channel invert above the dam toe (ΔZ).
The final input, ΔZ, applies to sites that have an aggraded downstream channel that creates an additional tailwater depth. Such aggradation can shift the danger range to lower discharges and cause higher discharges to produce a Case D drowned-out jump, although one must consider the possibility that the aggraded area might be scoured down during a prolonged high-flow event. If the downstream channel is scoured below the toe of the dam, a negative value of ΔZ can be entered.
An important point should be emphasized regarding the definition of the dam height, P. Illustrations in some previous studies have depicted cases in which the streambed elevations upstream and downstream of the structure are equal. In this case, the illustrations can make it appear that P is the height of the dam relative to the bed of the upstream channel. However, when these elevations are different, P must be defined with respect to the downstream toe of the dam so that the total head drop across the structure is known.
The spreadsheet calculations follow the process presented by Leutheusser and Fan (2001) [8], using theoretical equations and empirical relations developed from their experimental data. Iterative calculations must be enabled in Excel, as some of the equations cannot be solved algebraically and use circular-reference formulas. Calculations begin by determining the head on the dam crest for the specified flow rate:
where H and P are illustrated in Figure 2, and q is the discharge per unit width. As H is unknown and appears on both sides of the equation, a starting value H = 0 is assumed in the right-hand denominator and the solution is found by iteration. It should be noted that Equation (1) incorporates the Rehbock weir coefficient of a sharp-crested weir, 0.611 + 0.075 (H/P). This is also a reasonable approximation for an ogee crest; a more accurate estimate for an ogee crest would require knowledge of the crest profile, which defines its design head—the head for which the ogee shape matches the trajectory of the freely falling jet passing over the dam. Heads greater than the design head achieve a larger discharge coefficient and heads below the design head have a smaller coefficient. Exact crest shape information is often difficult to obtain, so the spreadsheet simply uses the sharp crested weir approximation. For those interested, detailed information on ogee crest discharge coefficients can be found in the Bureau of Reclamation’s Design of Small Dams [14].
Next, the combination of the continuity and energy equations provides a relation that can be solved iteratively for the relative flow depth
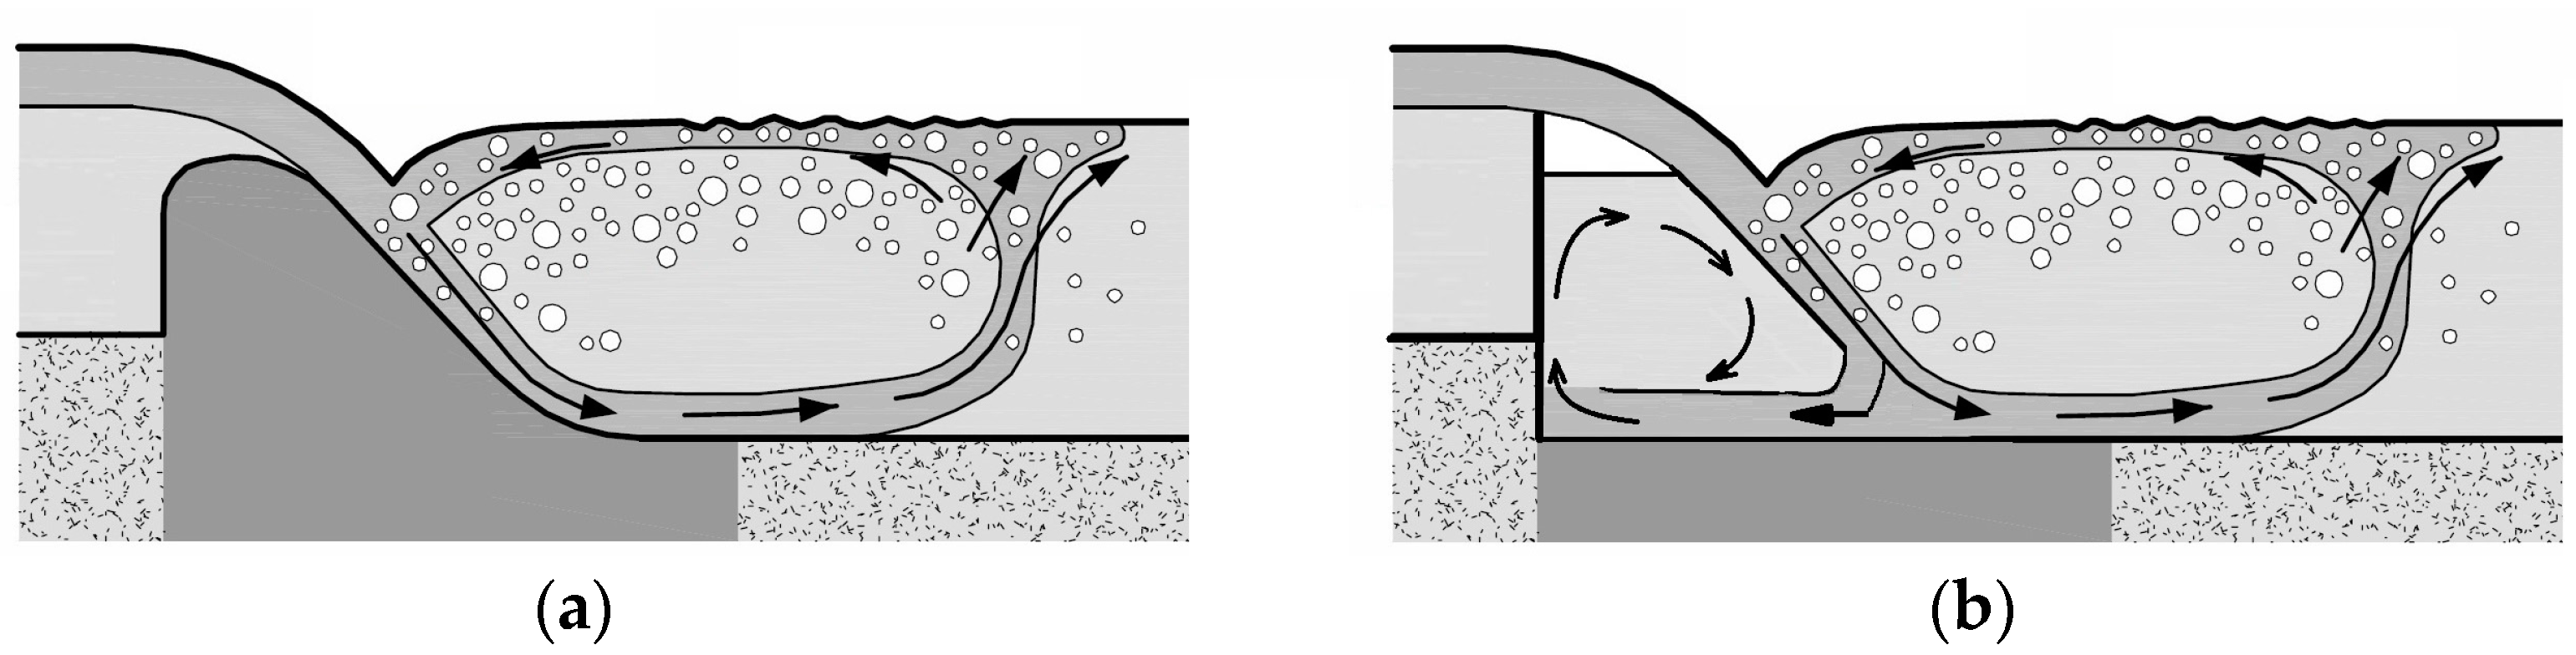
with CL being a loss coefficient CL = 0.1P/H from experiments on sharp-crested weirs by Leutheusser and Fan (2001) [8]. This coefficient accounts for head loss CLV12/(2g) in the forward rotating eddy that forms between the weir and the overflowing nappe (Figure 5). For dams with an ogee crest, the overflowing nappe does not separate from the weir, so this forward rotating eddy does not form and the loss can be neglected. The spreadsheet sets CL = 0 if an ogee crest is selected. With Y1 determined, the velocity at the downstream toe of the dam is V1 = q/Y1 and the Froude number at the toe is F1 = V1/(gY1)0.5.
The conjugate depth (Y2) required to create a hydraulic jump at the toe of the dam can be determined from the Bélanger hydraulic jump equation, which was first correctly presented by Bélanger (1849) [15], with the history of its development detailed by Chanson (2009) [16]:
The existing tailwater depth at the site, YT, is calculated using Manning’s equation, assuming a wide, rectangular channel in which the hydraulic radius is approximately equal to the flow depth.
where n is the Manning roughness coefficient, Sb is the bed slope of the downstream channel, k is a units-dependent coefficient having a value of 1.0 (S.I.) or 1.486 (Imperial), and ΔZ is the elevation difference between the dam toe and the downstream river channel invert, as illustrated in Figure 2. Once YT is determined, the submergence is calculated,
S = (YT − Y2)/Y2
Negative submergence indicates Case A, zero submergence is Case B, and positive submergence creates Case C or Case D.
Leutheusser and Fan’s experiments [8] provided measurements of the relative upstream-oriented surface velocity, Vs/V1, versus the submergence ratio, S. They fit the measurements to an equation that considers the counter-rotating flow at the toe of the dam as a forced vortex with radius αYT, where α is the experimental constant. The relative surface velocity is given by
with ω defined as
and ΔEDM being the head loss caused by the counter-rotating vortex,
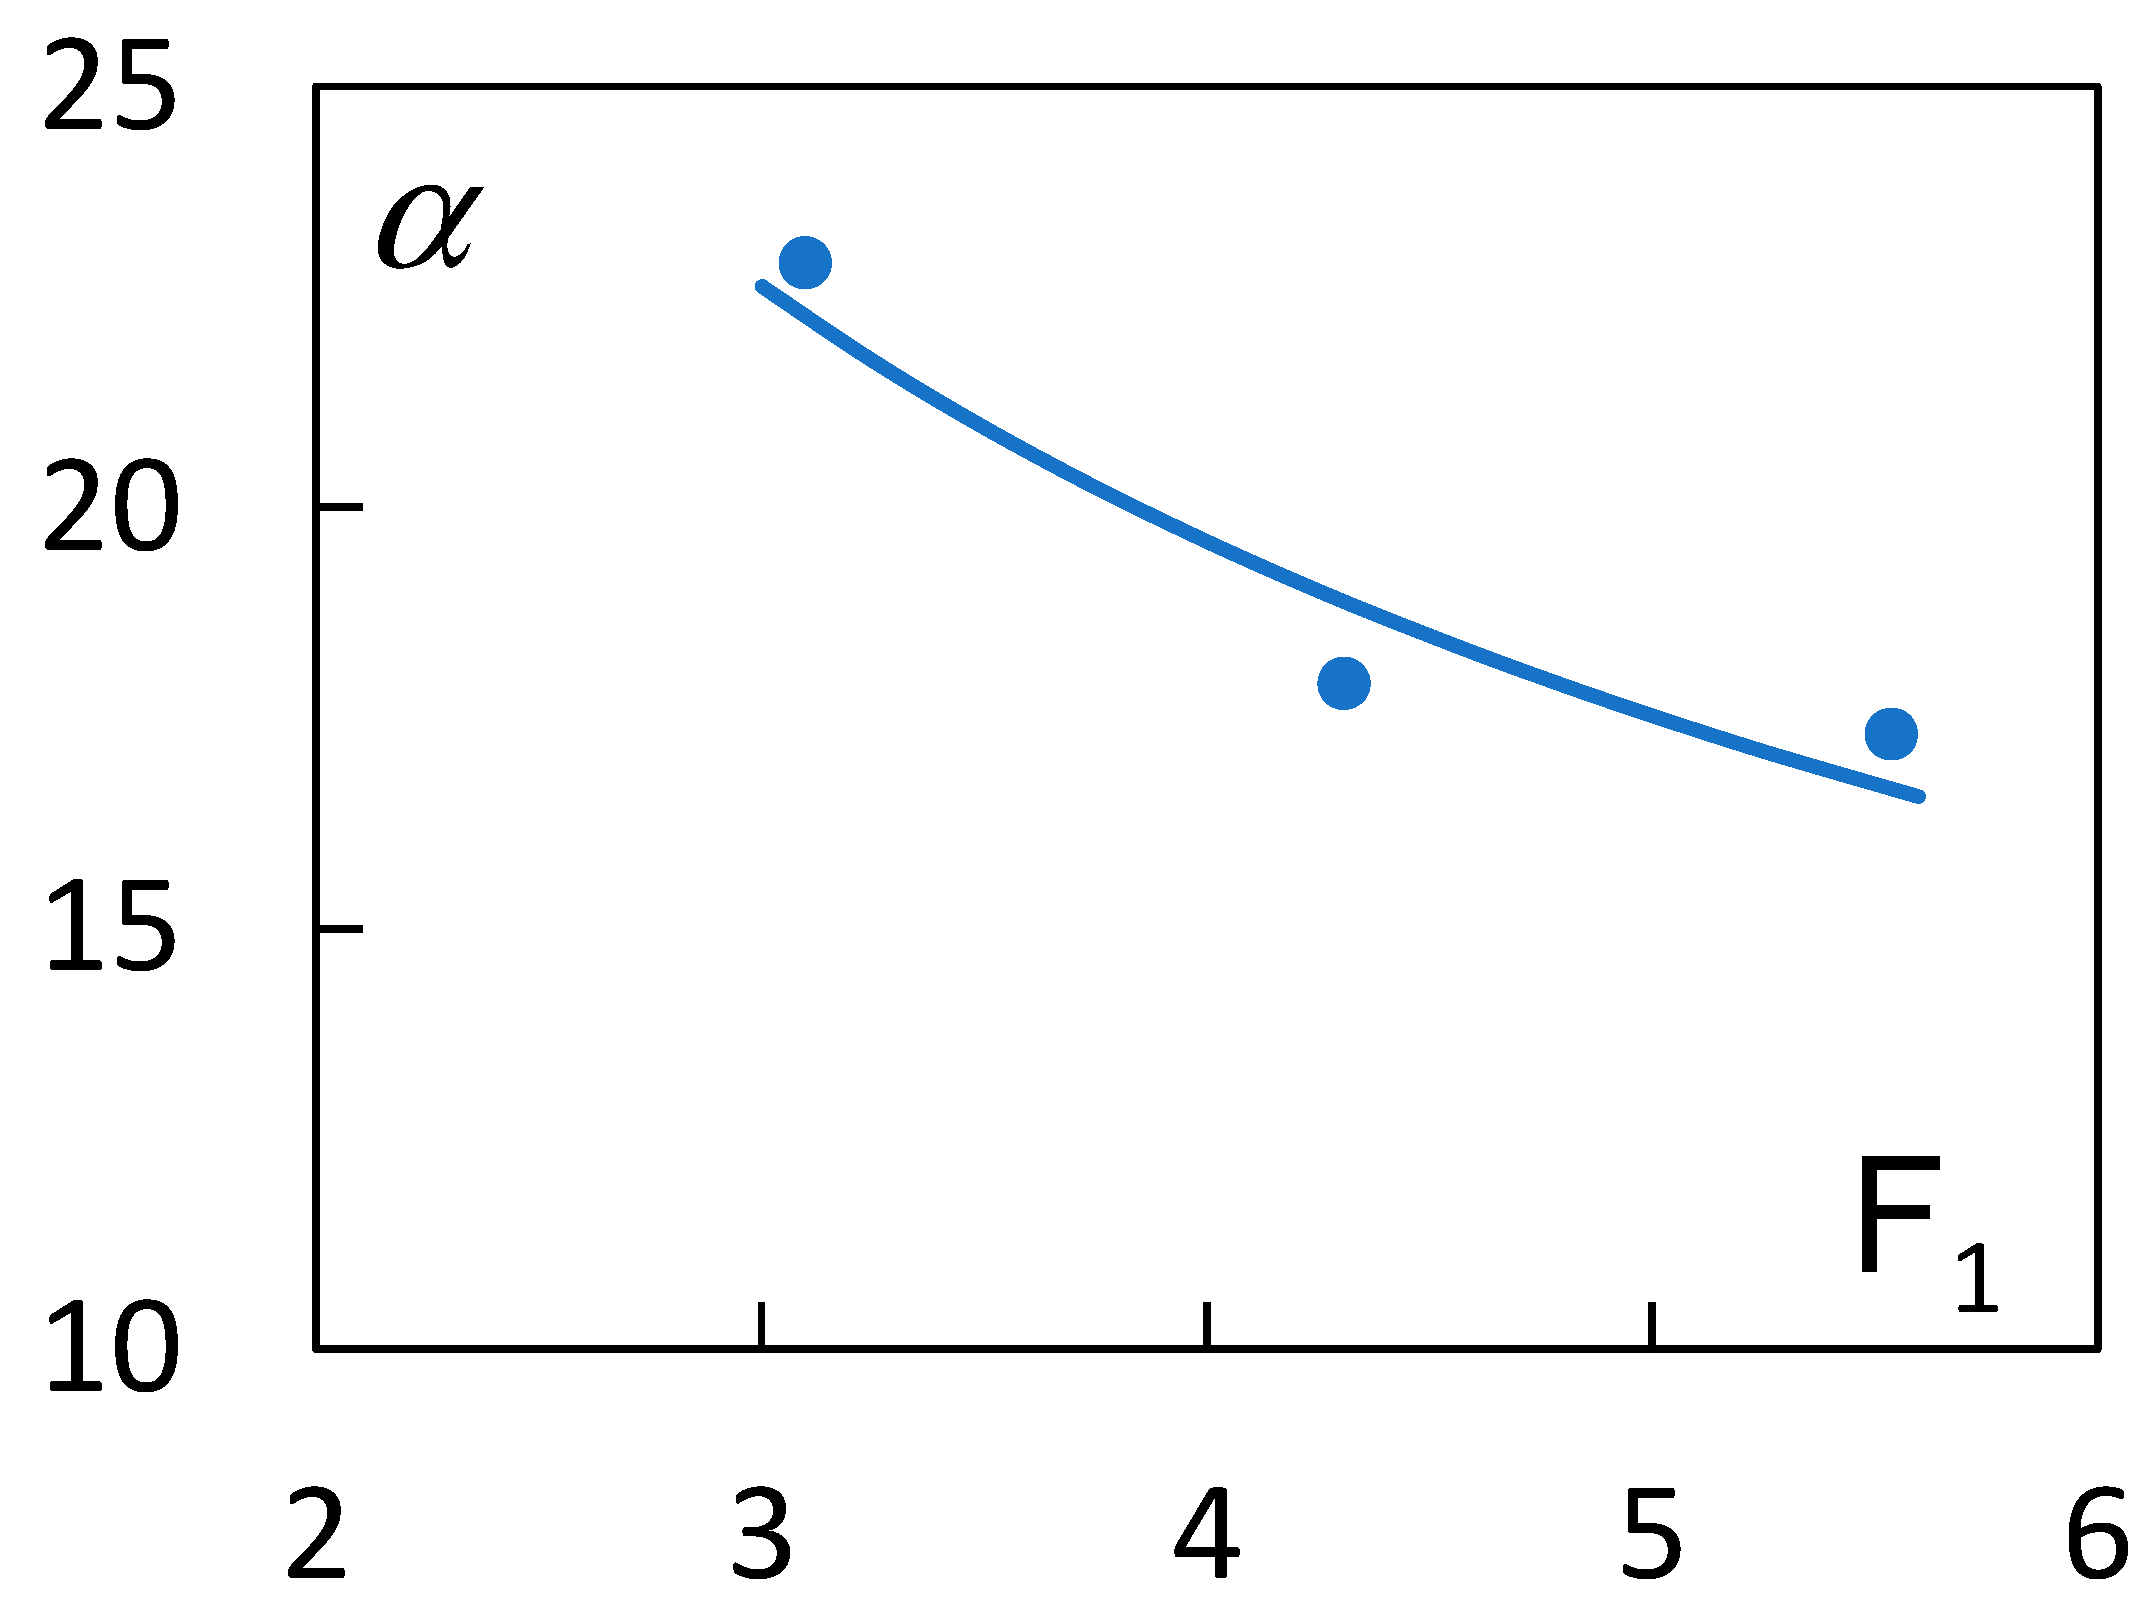
Leutheusser and Fan (2001) [8] determined values of α that provided good agreement between the surface velocity measurements and those predicted by the forced vortex equations for only three tests conducted at F1 = 3.1, 4.3, and 5.5. To enable general application to other flow conditions, Figure 6 shows that the test data fit well to the relation α = 39.2(F1)−0.5.
The value of α may give some indication of the downstream extent of the reverse-flow region, as Leutheusser and Fan (2001) [8] described αYT as the radius of the forced vortex. However, it should be emphasized that values of α were determined primarily to match the measured and predicted surface velocities; their study did not report the location of the boil zone or present measurements of the variation of the surface velocities in the streamwise direction that might define the length of the reverse-flow zone. Still, values of α in the range of 20 suggest significant potential for reverse-flow currents to draw in and trap swimmers, anglers, boaters, and rescuers approaching from downstream, and this is consistent with real-world experience.
The calculated reverse-flow velocities can be compared with the swimming abilities of typical persons to further evaluate the hazard presented by a given dam and flow condition. Trained athletes have maximum swimming speeds of about 1.8 m/s (5.9 ft/s), but the swimming speed of most people is probably half or less of that value, especially in cold conditions and when encumbered by clothing; swimming capabilities of children would be even less, and many people are unable to swim or swim poorly (Leutheusser 1988) [4].
The spreadsheet defines the range of Case C conditions by calculating the tailwater level that will cause the flow to stop plunging into the tailwater pool and instead flip to the surface of the downstream pool, creating Case D. Leutheusser and Fan (2001) [8] reported this to occur at (H + P)/(YT + ΔZ) ≈ 1.10. For a falling tailwater condition, the jet plunges again toward the bottom (returning to Case C) at about (H + P)/(YT + ΔZ) ≈ 1.19.
The calculations in the spreadsheet assume a normal depth downstream from the low-head dam. Normal depth applies when the downstream channel is constant in slope, cross-section, and roughness for a long extent. If normal depth conditions do not exist, the tailwater values calculated in the spreadsheet could be replaced with field measurements of the actual tailwater levels.
5. Example Application
Dock Street Dam, mentioned earlier, is one of the most notorious low-head dams in the U.S. It is a 1.83 m (6-ft) high, 1055 m (2/3-mile) long dam spanning the Susquehanna River on the south side of Harrisburg, PA. It was originally constructed in 1913 to eliminate the shallow mosquito-breeding habitat, reduce odors by submerging sewer outfalls along the river, and provide flat-water recreation opportunities such as boating and fishing. Tragically, at least 30 drownings occurred from 1935 to 2018 [13,17,18] and additional drownings may have occurred in earlier years. The downstream river channel slope and hydraulic roughness have been undocumented in previous studies [12], but cursory investigations suggest the slope is relatively flat and the downstream channel is divided at low flows by several mid-channel bars; to apply the spreadsheet, a slope of 0.0001 and roughness factor n = 0.028 were assumed, and the downstream channel bed was assumed to match the dam toe (ΔZ = 0). With these assumptions, the spreadsheet predicts that Case C hydraulic jumps will occur for discharges ranging from 6 to 1700 m3/s (210 to 60,000 ft3/s). Predicted surface velocities in the reverse-flow zone are between 1.35 and 0.85 m/s (4.4 to 2.8 ft/s), which probably exceeds the swimming abilities of most of the general public. At the very bottom of this flow range, tailwater depths are only about 0.1 m (3 inches), so the truly dangerous zone may not extend this low. However, it should be emphasized that drownings can occur in swift, shallow water when people are swept off their feet and cannot regain stable footing. The tendency for a reverse-flow roller to cause disorientation by spinning trapped persons should also be recognized.
For comparison, CFD modeling by Israel-Devadason and Schweiger (2019) [12] indicated a dangerous flow range of about 225 to 1700 m3/s (8000 to 60,000 ft3/s). The upper ends of this range are the same, and the difference at the lower end of the range may be due to differences in the tailwater assumptions. An accompanying flow exceedance study showed that the danger range encompasses about 83% of the daily flow conditions from 1890 to the present. All 30 documented drowning fatalities occurred in the Case C range, at flows from 155 to 1420 m3/s (5500 to 50,000 ft3/s).
Sensitivity to differences in stream slope and roughness can be quickly evaluated with the spreadsheet. The flip point reduces to 1420 m3/s (50,000 ft3/s) when n is increased from 0.028 to 0.0315, or when the downstream slope is flattened from 0.00010 to 0.00008. Increasing ΔZ from zero to 0.17 m (0.56 ft) has a similar effect.
Figure 7 shows the results graphically. The dash-dotted green line defines the conjugate depth that creates Case B conditions; the area below that line is Case A, while the area between the green line and the dashed gray line has a submerged jump, Case C. Above the dashed gray line, the flow flips to the surface and velocities are directed safely downstream (Case D). The solid blue line indicates the actual tailwater levels as a function of discharge. The red line shows the reverse-flow surface velocity, Vs, in the range of flow rates that produce a submerged jump.
6. Discussion and Conclusions
The spreadsheet tool described here provides a straightforward means for evaluating the potential for dangerous flow conditions at low-head dams due to submerged hydraulic jumps. The sheet computes flow conditions over the dam and the tailwater conditions downstream from the dam to determine the flow rates at which submerged hydraulic jumps occur. In the submerged jump zone, the sheet uses experimentally determined empirical relationships to estimate energy losses, variation in the size and strength of the reverse-flow region, and surface velocities, which can be compared with human swimming capabilities. Although the spreadsheet relies on original experiments carried out with laboratory models of sharp-crested weirs, it incorporates adjustments that allow it to be applied also to ogee-crested dams. Laboratory or CFD testing of dams with ogee crests to verify these adjustments could still be quite valuable, as would testing of a wider range of flow rates to verify the approximate relation presented here for the α parameter, which represents the radius of the reverse-flow forced vortex.
The spreadsheet is meant to be applied to low-head dams with a vertical, ogee-shaped or other steep downstream profile, and should also be applied well to the T-shaped lamprey barrier weirs tested by Egea (2015) [11]. These dam configurations all have the potential to produce plunging flow entering the submerged hydraulic jump, which sets up the dangerous counter-rotating forced vortex. Low-head dams can be successfully modified to prevent reverse flow, with effective structural alternatives outlined by several investigators [6,19,20,21,22,23]. Generally, these modifications flatten the downstream slope of the dam face or subdivide the elevation drop into smaller steps so that the jet entering the tailwater pool for all discharge ranges is more horizontal than vertical, and is prone to maintaining downstream-directed surface velocities.
Author Contributions
Conceptualization, T.L.W. and C.D.S.; methodology, T.L.W. and C.D.S.; software, T.L.W.; resources, C.D.S.; data curation, T.L.W.; writing—original draft preparation, T.L.W. and C.D.S.; writing—review and editing, T.L.W. and C.D.S.; visualization, T.L.W.; supervision, C.D.S.; project administration, C.D.S.; funding acquisition, C.D.S. All authors have read and agreed to the published version of the manuscript.
Funding
This research was funded by the Science and Technology Program administered by the Research Office of the U.S. Bureau of Reclamation, Project Number 21020.
Data Availability Statement
All data are contained within this article.
Acknowledgments
Caleb McCurry and Rollin Hotchkiss provided helpful comments that improved the article.
Conflicts of Interest
The authors declare no conflict of interest.
Correction Statement
This article has been republished with a minor correction to resolve spelling and grammatical errors. This change does not affect the scientific content of the article.
Disclaimer
The information provided in this article is believed to be appropriate and accurate for the purposes described within, but users bear all responsibility for checking results and exercising sound engineering judgment in its application.
References
- Tschantz, B.A. What we know (and don’t know) about low-head dams. J. Dam Safety 2014, 12, 37–45. [Google Scholar]
- Elverum, K.A.; Smalley, T. The Drowning Machine; Tri-fold pamphlet; Minnesota Department of Natural Resources: St. Paul, MN, USA, 2012. [Google Scholar]
- Federal Register (86 FR 73522), Nationwide Permit 53-Removal of Low-Head Dams; Effective Date: 25 February 2022; Expiration Date: 14 March 2026. Available online: https://www.govinfo.gov/content/pkg/FR-2021-12-27/pdf/2021-27441.pdf (accessed on 25 January 2023).
- Leutheusser, H.J. Dam safety yes. But what about safety at dams? In Hydraulic Engineering, Proceedings of the 1988 National Conference of the American Society of Civil Engineers, Hydraulics Division, Colorado Springs, CA, USA, 8–12 August 1988; American Society of Civil Engineers: Reston, VA, USA, 1988; pp. 1091–1096. [Google Scholar]
- Magel, J. Propelling force measured during tethered swimming in the four competitive swimming styles. Res. Q. 1970, 41, 68–74. [Google Scholar] [CrossRef] [PubMed]
- Zhou, R.D.; Hallett, A.; Ainslie, I.; Donnelly, C.R. Improving safety at low head weirs. In Proceedings of the 2004 Canadian Dam Association Conference, Ottawa, ON, Canada, 25–30 September 2004. [Google Scholar]
- Tschantz, B.A.; Wright, K.R. Hidden dangers and public safety at low-head dams. J. Dam Safety 2011, 9, 8–17. [Google Scholar]
- Leutheusser, H.; Fan, J. Backward flow velocities of submerged hydraulic jumps. J. Hydraul. Eng. 2001, 127, 514–517. [Google Scholar] [CrossRef]
- Rao, N.S.; Rajaratnam, N. The submerged hydraulic jump. J. Hyd. Div. ASCE 1963, 89, 139–162. [Google Scholar] [CrossRef]
- Leutheusser, H.J.; Alemu, S. Flow separation under hydraulic jump. J. Hydraul. Res. 1979, 17, 193–206. [Google Scholar] [CrossRef]
- Egea, M.L. Experimental and Numerical Modelling of Submerged Hydraulic Jumps at Low-Head Dams. Master’s Thesis, University of Ottawa, Ottawa, ON, Canada, 2015. [Google Scholar]
- Israel-Devadason, B.; Schweiger, P.G. Decoding the drowning machines: Using CFD modeling to predict and design solutions to remediate the dangerous hydraulic roller at low head dams. J. Dam Safety 2019, 17, 20–31. [Google Scholar]
- Vendel, C. Harrisburg’s “Drowning Machine” Dam Has Killed at Least 29 People; PennLive Patriot-News. 2018. Available online: https://www.pennlive.com/news/erry-2018/06/72b6e927394991/victims_of_the_dock_street_dam.html (accessed on 11 January 2023).
- Bureau of Reclamation. Design of Small Dams, 3rd ed.; Government Printing Office: Washington, DC, USA, 1987; pp. 365–376. [Google Scholar]
- Bélanger, J.B. Notes Sur le Cours D’hydraulique [Notes on a Course in Hydraulics]; session 1849–1850; Mém. Ecole Nat. Ponts et Chaussées: Paris, France, 1849; 222p. (In French) [Google Scholar]
- Chanson, H. Development of the Bélanger equation and backwater equation by Jean-Baptiste Bélanger (1828). J. Hydraul. Eng. 2009, 135, 159–163. [Google Scholar] [CrossRef]
- Vendel, C. Harrisburg Dam Claimed Another Victim in the 1980s, Bringing Death Toll to 30; PennLive Patriot-News. 2018. Available online: https://www.pennlive.com/news/2018/07/dock_street_dam_harrisburg_dro.html (accessed on 20 January 2023).
- Israel-Devadason, B. Case Study: Dock Street Dam (Pennsylvania). Available online: https://damfailures.org/case-study/dock-street-dam-pennsylvania/ (accessed on 22 January 2023).
- Leutheusser, H.J.; Birk, W.M. Drownproofing of low overflow structures. J. Hydraul. Eng. 1991, 117, 205–213. [Google Scholar] [CrossRef]
- McGhin III, R.F.; Hotchkiss, R.H.; Kern, E. Submerged hydraulic jump remediation at low-head dams: Partial width deflector design. J. Hydraul. Eng. 2018, 144, 04018074. [Google Scholar] [CrossRef]
- Olsen, R.J. Hazard Classification and Hydraulic Remediation Options for Flat-Topped and Ogee-Crested Low-Head Dams. Master’s Thesis, Utah State University, Logan, UT, USA, 2013. [Google Scholar]
- Olsen, R.J.; Johnson, M.C.; Barfuss, S.L. Low-head dam reverse roller remediation options. J. Hydraul. Eng. 2014, 140. [Google Scholar] [CrossRef]
- Schweiger, P.G. Saving lives while improving fish passage at “killer dams”. J. Dam Safety 2011, 9, 8–16. [Google Scholar]
Figure 1.
At least five lives in danger below a low-head dam [6]. With permission from C.R. Donnelly.
Figure 1.
At least five lives in danger below a low-head dam [6]. With permission from C.R. Donnelly.

Figure 2.
Schematic diagram of the hydraulic jump at the toe of a low-head dam, showing the initial depth entering the jump, Y1, and the downstream conjugate depth, Y2, provided by the existing tailwater condition (adapted from [7]).
Figure 2.
Schematic diagram of the hydraulic jump at the toe of a low-head dam, showing the initial depth entering the jump, Y1, and the downstream conjugate depth, Y2, provided by the existing tailwater condition (adapted from [7]).

Figure 3.
Four possible flow conditions over a low-head dam: Case A—swept-out hydraulic jump; Case B—optimal hydraulic jump; Case C—submerged hydraulic jump; Case D—drowned-out hydraulic jump (modified from [7]). Each case is illustrated for the default condition of the downstream channel invert matching the toe of the dam, ΔZ = 0.

Figure 4.
Example spreadsheet used to evaluate low-head dams for dangerous flow conditions. Red-shaded cells are in the Case C submerged hydraulic jump range.
Figure 4.
Example spreadsheet used to evaluate low-head dams for dangerous flow conditions. Red-shaded cells are in the Case C submerged hydraulic jump range.

Figure 5.
Differences between (a) ogee crest and (b) sharp crested weirs. The forward rotating eddy between the sharp-crested weir plate and the overflowing nappe introduces additional energy loss that does not occur with an ogee crest.
Figure 5.
Differences between (a) ogee crest and (b) sharp crested weirs. The forward rotating eddy between the sharp-crested weir plate and the overflowing nappe introduces additional energy loss that does not occur with an ogee crest.

Figure 6.
Relation between the forced vortex radius coefficient and the incoming Froude number.

Figure 7.
Predicted submerged hydraulic jump conditions at Dock Street Dam.

Disclaimer/Publisher’s Note: The statements, opinions and data contained in all publications are solely those of the individual author(s) and contributor(s) and not of MDPI and/or the editor(s). MDPI and/or the editor(s) disclaim responsibility for any injury to people or property resulting from any ideas, methods, instructions or products referred to in the content. |
© 2023 by the authors. Licensee MDPI, Basel, Switzerland. This article is an open access article distributed under the terms and conditions of the Creative Commons Attribution (CC BY) license (https://creativecommons.org/licenses/by/4.0/).
Share and Cite
MDPI and ACS Style
Wahl, T.L.; Svoboda, C.D. A Spreadsheet Tool for Defining Dangerous Flow Ranges of Low-Head Dams. Water 2023, 15, 1032. https://doi.org/10.3390/w15061032
AMA Style
Wahl TL, Svoboda CD. A Spreadsheet Tool for Defining Dangerous Flow Ranges of Low-Head Dams. Water. 2023; 15(6):1032. https://doi.org/10.3390/w15061032
Chicago/Turabian StyleWahl, Tony L., and Connie D. Svoboda. 2023. "A Spreadsheet Tool for Defining Dangerous Flow Ranges of Low-Head Dams" Water 15, no. 6: 1032. https://doi.org/10.3390/w15061032
Note that from the first issue of 2016, this journal uses article numbers instead of page numbers. See further details here.